Embed Size (px)
Citation preview
1
Combination Chemo and Hyperoxia Therapy in
Breast Cancer Cells using Nanoemulsion
Delivery Systems
Masters of Science Thesis
By
Hardip Gopani
Advisor: Mansoor M. Amiji, PhD
to
The Bouve’ Graduate School of Health Sciences in Partial
Fulfillment of the Requirement for the Degree of Master of Science
in Pharmaceutical Science with Specialization in Pharmaceutics and
Drug Delivery
Department of Pharmaceutical Sciences
Northeastern University, Boston, MA
August, 2011
2
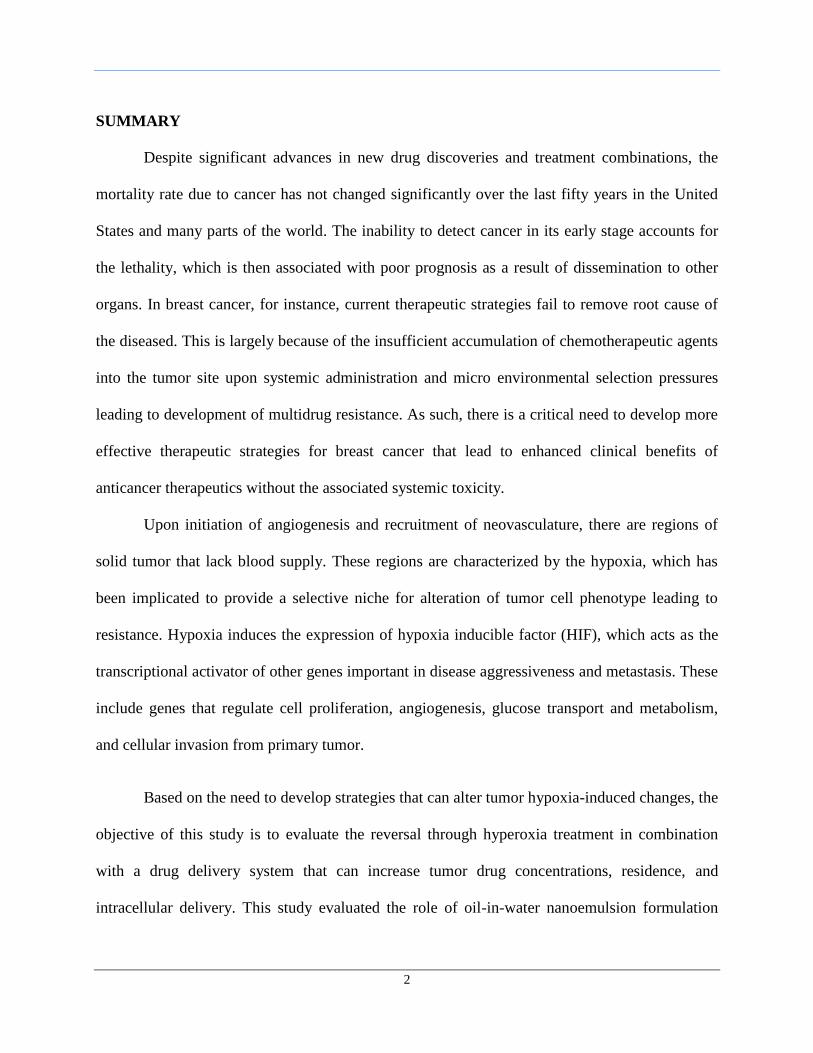
SUMMARY
Despite significant advances in new drug discoveries and treatment combinations, the
mortality rate due to cancer has not changed significantly over the last fifty years in the United
States and many parts of the world. The inability to detect cancer in its early stage accounts for
the lethality, which is then associated with poor prognosis as a result of dissemination to other
organs. In breast cancer, for instance, current therapeutic strategies fail to remove root cause of
the diseased. This is largely because of the insufficient accumulation of chemotherapeutic agents
into the tumor site upon systemic administration and micro environmental selection pressures
leading to development of multidrug resistance. As such, there is a critical need to develop more
effective therapeutic strategies for breast cancer that lead to enhanced clinical benefits of
anticancer therapeutics without the associated systemic toxicity.
Upon initiation of angiogenesis and recruitment of neovasculature, there are regions of
solid tumor that lack blood supply. These regions are characterized by the hypoxia, which has
been implicated to provide a selective niche for alteration of tumor cell phenotype leading to
resistance. Hypoxia induces the expression of hypoxia inducible factor (HIF), which acts as the
transcriptional activator of other genes important in disease aggressiveness and metastasis. These
include genes that regulate cell proliferation, angiogenesis, glucose transport and metabolism,
and cellular invasion from primary tumor.
Based on the need to develop strategies that can alter tumor hypoxia-induced changes, the
objective of this study is to evaluate the reversal through hyperoxia treatment in combination
with a drug delivery system that can increase tumor drug concentrations, residence, and
intracellular delivery. This study evaluated the role of oil-in-water nanoemulsion formulation
3
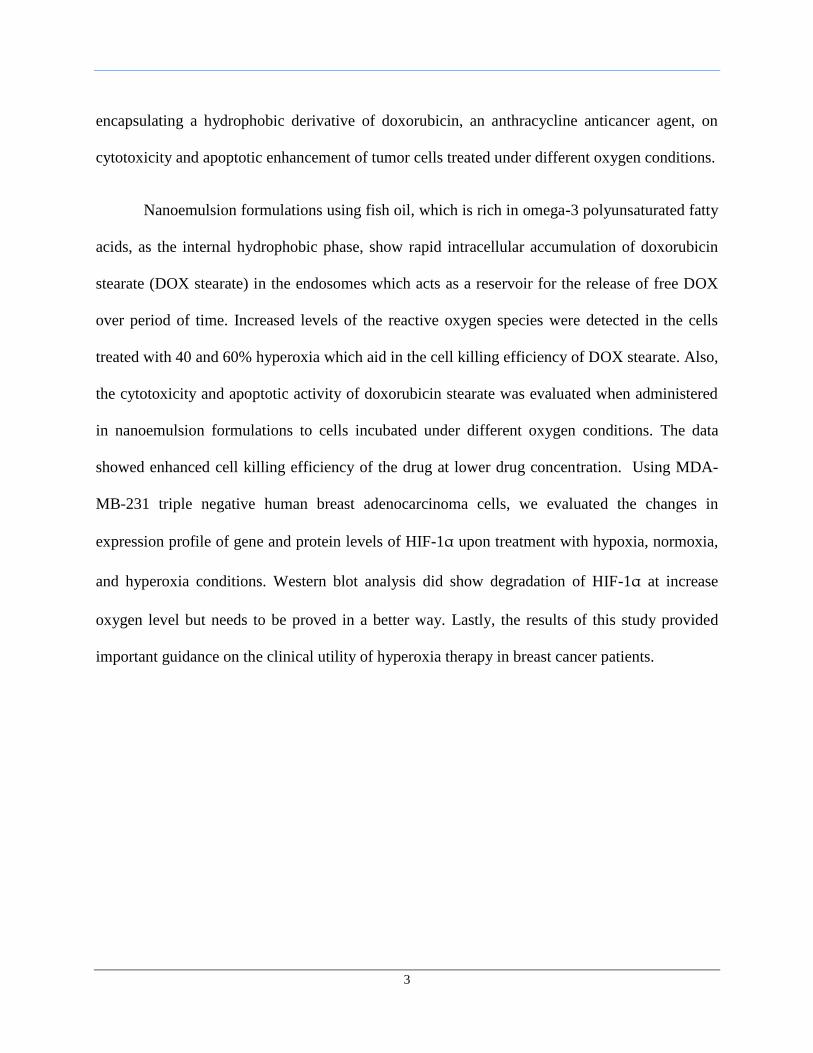
encapsulating a hydrophobic derivative of doxorubicin, an anthracycline anticancer agent, on
cytotoxicity and apoptotic enhancement of tumor cells treated under different oxygen conditions.
Nanoemulsion formulations using fish oil, which is rich in omega-3 polyunsaturated fatty
acids, as the internal hydrophobic phase, show rapid intracellular accumulation of doxorubicin
stearate (DOX stearate) in the endosomes which acts as a reservoir for the release of free DOX
over period of time. Increased levels of the reactive oxygen species were detected in the cells
treated with 40 and 60% hyperoxia which aid in the cell killing efficiency of DOX stearate. Also,
the cytotoxicity and apoptotic activity of doxorubicin stearate was evaluated when administered
in nanoemulsion formulations to cells incubated under different oxygen conditions. The data
showed enhanced cell killing efficiency of the drug at lower drug concentration. Using MDA-
MB-231 triple negative human breast adenocarcinoma cells, we evaluated the changes in
expression profile of gene and protein levels of HIF-1α upon treatment with hypoxia, normoxia,
and hyperoxia conditions. Western blot analysis did show degradation of HIF-1α at increase
oxygen level but needs to be proved in a better way. Lastly, the results of this study provided
important guidance on the clinical utility of hyperoxia therapy in breast cancer patients.

4
DEPARTMENTAL APPROVAL RECORD
NORTHEASTERN UNIVERSITY
Graduate School of Bouvé College of Health Sciences
Thesis Title: Combination Chemo and Hyperoxia Therapy in Breast Cancer Cells using
Nanoemulsion Delivery Systems
Author: Hardip Gopani
Department: Pharmaceutical Sciences
Approved for Thesis Requirements of the Master of Science Degree
in Pharmaceutical Science
Dissertation Committee
____________________________________ __________________
Date
____________________________________ __________________
Date
____________________________________ __________________
(Chairman) Date
____________________________________ __________________
Date
____________________________________ __________________
Director of Graduate Programs Date

5
GRADUATE SCHOOL APPROVAL RECORD
NORTHEASTERN UNIVERSITY
Graduate School of Bouvé College of Health Sciences
Thesis Title: Combination Chemo and Hyperoxia Therapy in Breast Cancer Cells using
Nanoemulsion Delivery Systems
Author: Hardip Gopani
Department: Pharmaceutical Sciences
Approved for Thesis Requirements of the Master of Science Degree
in Pharmaceutical Science
Dissertation Committee
____________________________________ __________________
Date
____________________________________ __________________
Date
____________________________________ __________________
(Chairman) Date
Director of Graduate Programs
____________________________________ __________________
Date
Dean of Bouve College of Health Sciences
____________________________________ __________________
Date
Copy Deposited in the Library
____________________________________ __________________
Date

6
ACKNOWLEDGEMENTS
I would like to extend my earnest gratitude to my advisor Dr. Mansoor Amiji, for his
continuous support and guidance in the research. He is responsible for giving me a wonderful
opportunity to do this project in the first place. He showed me different ways to approach a
research problem and the need to be persistent to accomplish any goal; never accepting less
than my best efforts.
I would like to thank my dissertation committee members, Dr. Heather Clark and Dr.
Shashi Mehta for their valuable time, support, and suggestions throughout the course of this
work. Special thanks to Dr Roger Kautz and Joe Kerimo, for allowing me to use the NMR facility
and helping with the confocal microscopy studies, respectively.
I would like to specially thank Dr. Srinivas Ganta, for helping me with all the
experimental setup and the studies. It was his constant encouragement and guidance that helped
me to learn how to organize my work in an efficient manner. I also thank Dr. Sampath Abeylath
for helping me with the NMR analysis. My deepest thanks to Dr. Arun Iyer, Dipti Deshpande,
Shruti Shah, Jing Xu and Husain Attarwala for their valuable inputs and help which made all
this a lot easier.
Last and most importantly, I want to thank my parents and family for all their love and
sacrifices and for making my dreams come true. My special thanks to all my friends who has
always been with me supporting my dreams and aspirations.
7
TABLE OF CONTENTS
SUMMARY……………………………………………………………………………………....2
ACKNOWLEGEMETS………………………………………………………………………......6
TABLE OF CONTENTS…………………………………..………………………………….….7
List of Tables………………………………………………..…………………………………….8
List of Figures……………………………………………..…..………………………………......9
1. INTRODUCTION…………………………………………………………………………….11
2. OBJECTIVES AND SPECIFIC AIMS……………………………………………..………..35
3. EXPERIMENTAL DESIGN AND METHODS…………………………………………...…39
4. RESULTS AND DISCUSSION…………………………………………………..………….52
5. CONCLUSIONS…………………………………………..…………………………………69
6. REFERENCES…..…………………………………………………………………………... 70
8
LIST OF TABLES
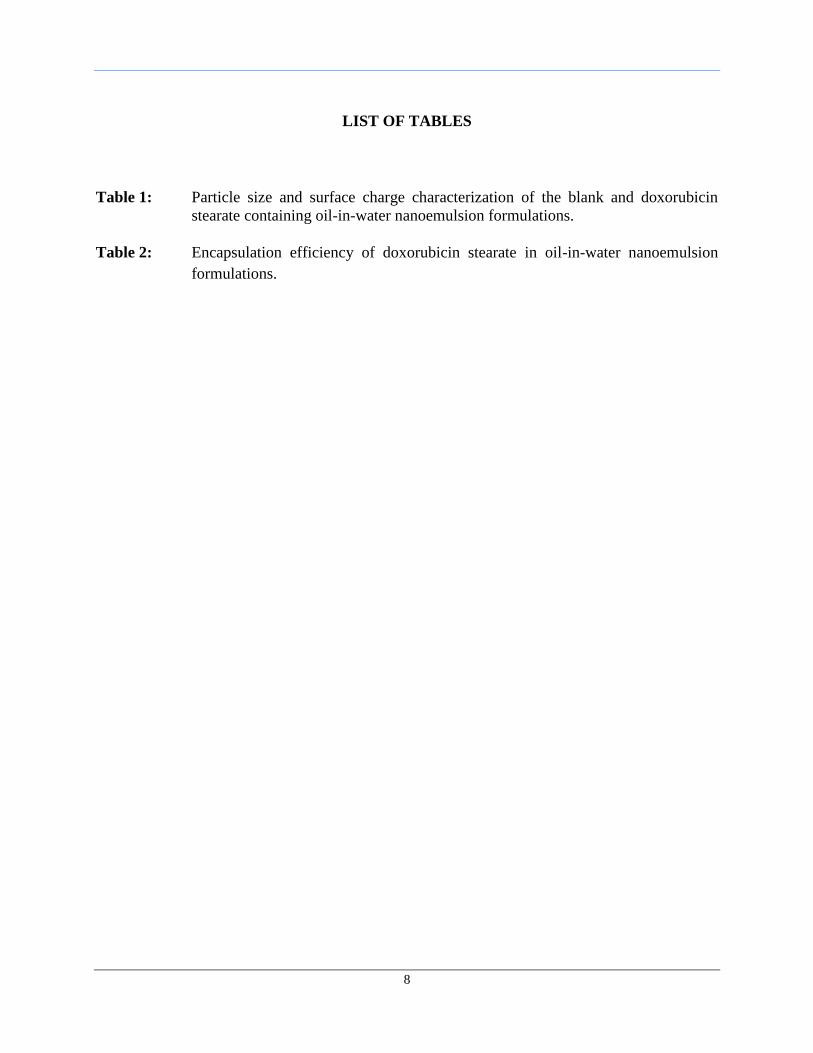
Table 1: Particle size and surface charge characterization of the blank and doxorubicin
stearate containing oil-in-water nanoemulsion formulations.
Table 2: Encapsulation efficiency of doxorubicin stearate in oil-in-water nanoemulsion
formulations.
9
LIST OF FIGURES
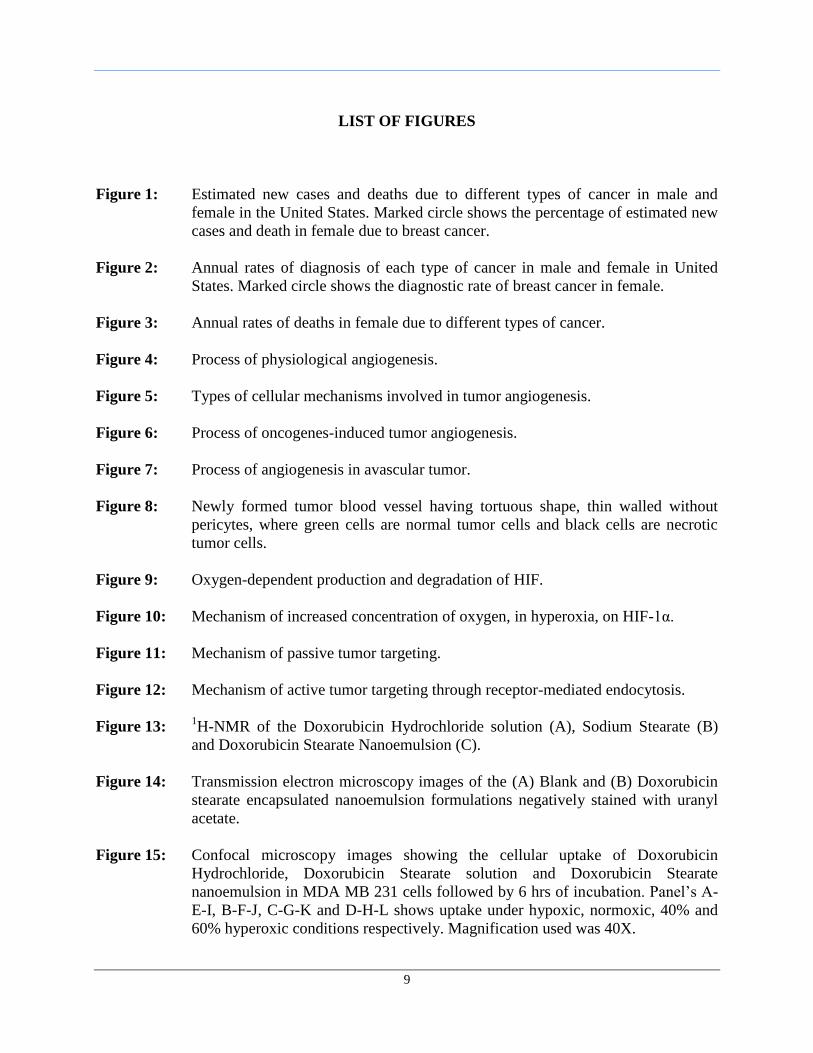
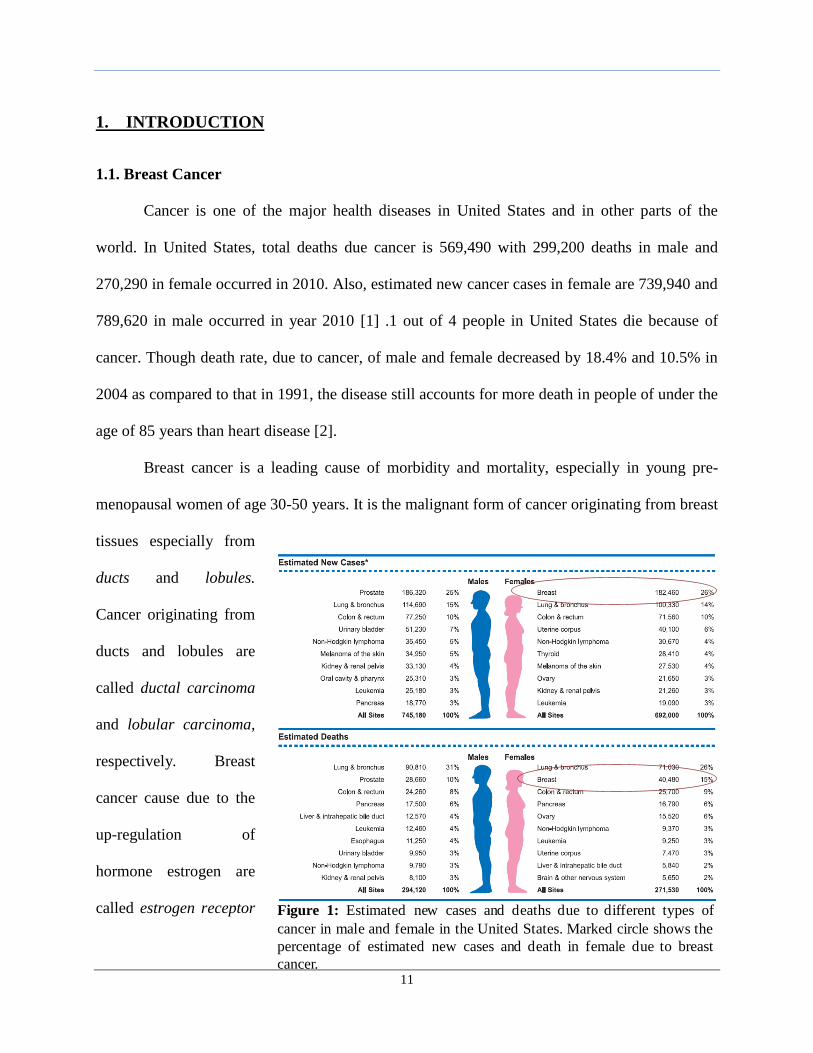
Figure 1: Estimated new cases and deaths due to different types of cancer in male and
female in the United States. Marked circle shows the percentage of estimated new
cases and death in female due to breast cancer.
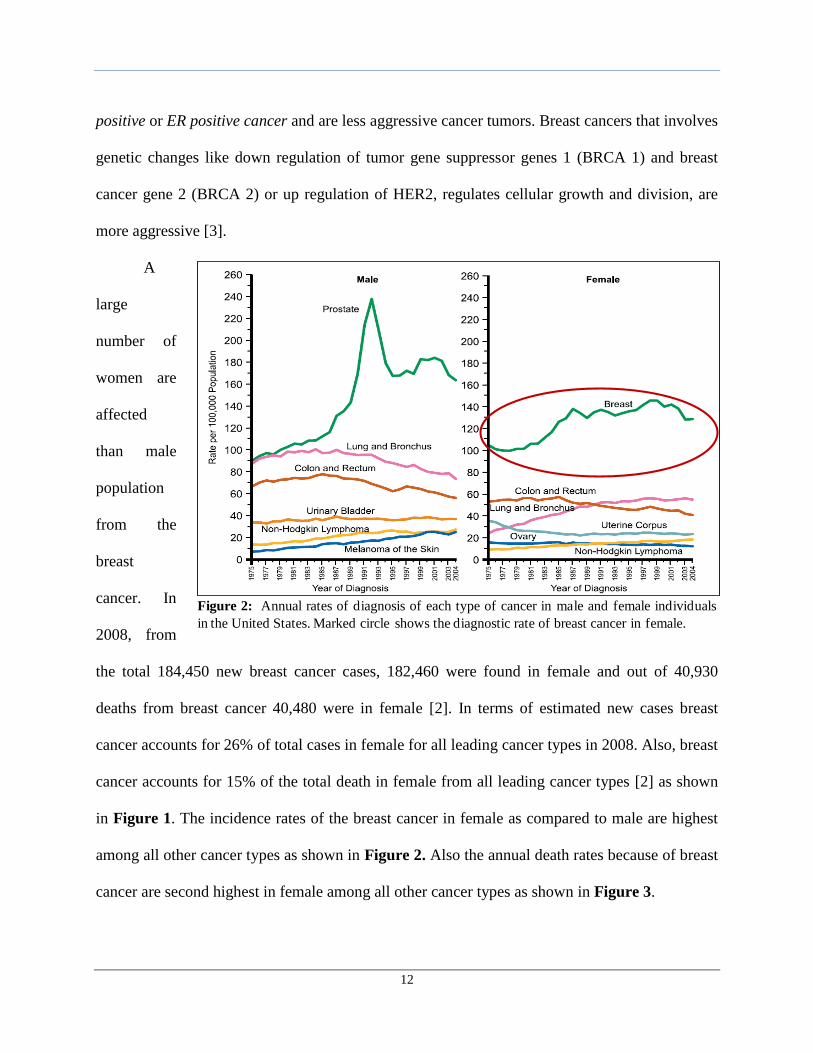
Figure 2: Annual rates of diagnosis of each type of cancer in male and female in United
States. Marked circle shows the diagnostic rate of breast cancer in female.
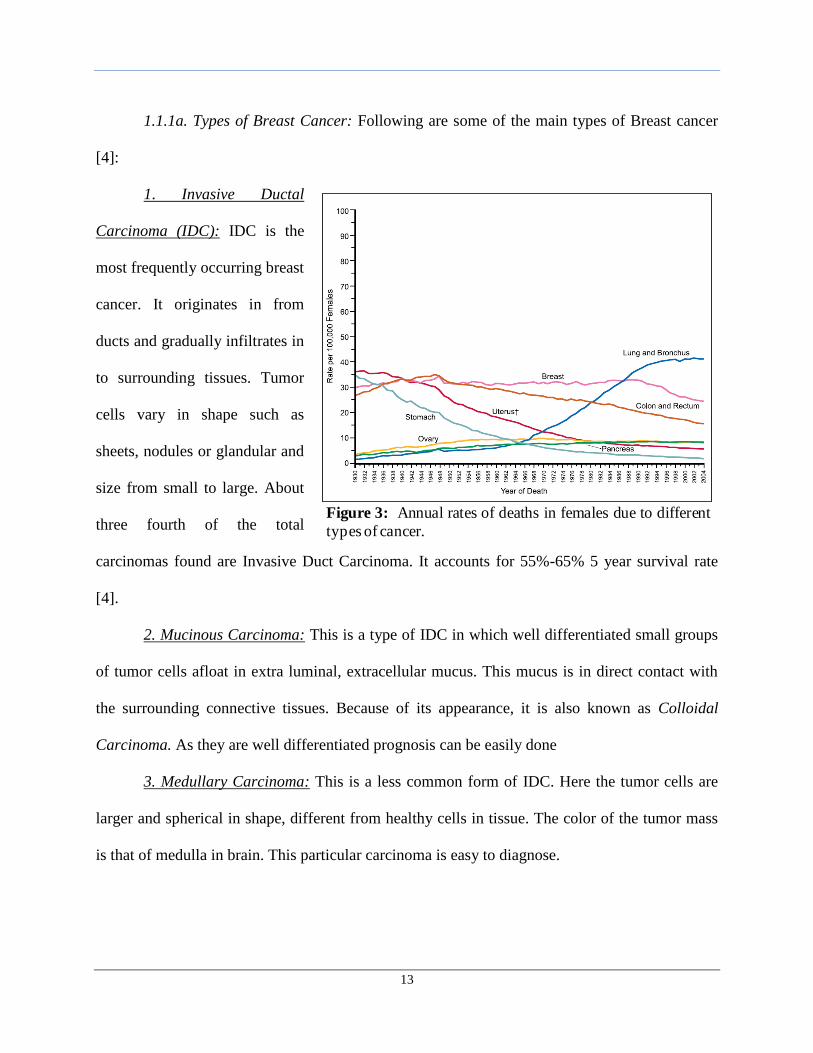
Figure 3: Annual rates of deaths in female due to different types of cancer.
Figure 4: Process of physiological angiogenesis.
Figure 5: Types of cellular mechanisms involved in tumor angiogenesis.
Figure 6: Process of oncogenes-induced tumor angiogenesis.
Figure 7: Process of angiogenesis in avascular tumor.
Figure 8: Newly formed tumor blood vessel having tortuous shape, thin walled without
pericytes, where green cells are normal tumor cells and black cells are necrotic
tumor cells.
Figure 9: Oxygen-dependent production and degradation of HIF.
Figure 10: Mechanism of increased concentration of oxygen, in hyperoxia, on HIF-1α.
Figure 11: Mechanism of passive tumor targeting.
Figure 12: Mechanism of active tumor targeting through receptor-mediated endocytosis.
Figure 13: 1H-NMR of the Doxorubicin Hydrochloride solution (A), Sodium Stearate (B)
and Doxorubicin Stearate Nanoemulsion (C).
Figure 14: Transmission electron microscopy images of the (A) Blank and (B) Doxorubicin
stearate encapsulated nanoemulsion formulations negatively stained with uranyl
acetate.
Figure 15: Confocal microscopy images showing the cellular uptake of Doxorubicin
Hydrochloride, Doxorubicin Stearate solution and Doxorubicin Stearate
nanoemulsion in MDA MB 231 cells followed by 6 hrs of incubation. Panel’s A-
E-I, B-F-J, C-G-K and D-H-L shows uptake under hypoxic, normoxic, 40% and
60% hyperoxic conditions respectively. Magnification used was 40X.
10
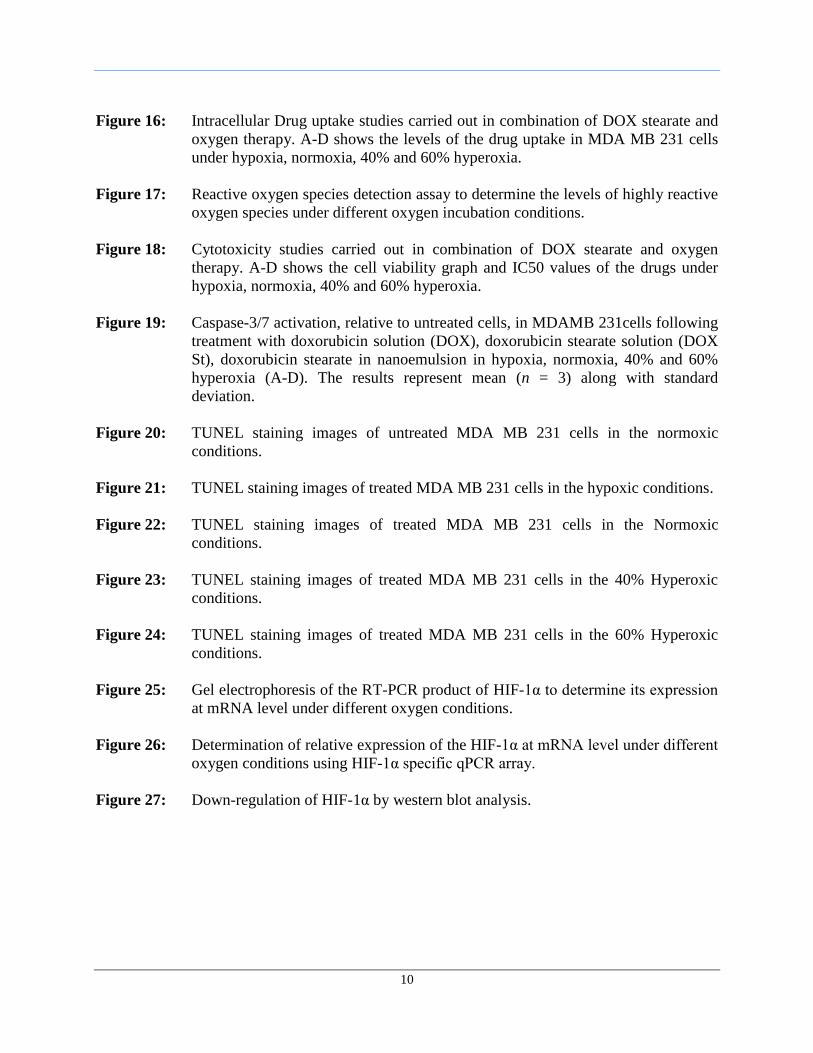
Figure 16: Intracellular Drug uptake studies carried out in combination of DOX stearate and
oxygen therapy. A-D shows the levels of the drug uptake in MDA MB 231 cells
under hypoxia, normoxia, 40% and 60% hyperoxia.
Figure 17: Reactive oxygen species detection assay to determine the levels of highly reactive
oxygen species under different oxygen incubation conditions.
Figure 18: Cytotoxicity studies carried out in combination of DOX stearate and oxygen
therapy. A-D shows the cell viability graph and IC50 values of the drugs under
hypoxia, normoxia, 40% and 60% hyperoxia.
Figure 19: Caspase-3/7 activation, relative to untreated cells, in MDAMB 231cells following
treatment with doxorubicin solution (DOX), doxorubicin stearate solution (DOX
St), doxorubicin stearate in nanoemulsion in hypoxia, normoxia, 40% and 60%
hyperoxia (A-D). The results represent mean (n = 3) along with standard
deviation.
Figure 20: TUNEL staining images of untreated MDA MB 231 cells in the normoxic
conditions.
Figure 21: TUNEL staining images of treated MDA MB 231 cells in the hypoxic conditions.
Figure 22: TUNEL staining images of treated MDA MB 231 cells in the Normoxic
conditions.
Figure 23: TUNEL staining images of treated MDA MB 231 cells in the 40% Hyperoxic
conditions.
Figure 24: TUNEL staining images of treated MDA MB 231 cells in the 60% Hyperoxic
conditions.
Figure 25: Gel electrophoresis of the RT-PCR product of HIF-1α to determine its expression
at mRNA level under different oxygen conditions.
Figure 26: Determination of relative expression of the HIF-1α at mRNA level under different
oxygen conditions using HIF-1α specific qPCR array.
Figure 27: Down-regulation of HIF-1α by western blot analysis.
11
1. INTRODUCTION
1.1. Breast Cancer
Cancer is one of the major health diseases in United States and in other parts of the
world. In United States, total deaths due cancer is 569,490 with 299,200 deaths in male and
270,290 in female occurred in 2010. Also, estimated new cancer cases in female are 739,940 and
789,620 in male occurred in year 2010 [1] .1 out of 4 people in United States die because of
cancer. Though death rate, due to cancer, of male and female decreased by 18.4% and 10.5% in
2004 as compared to that in 1991, the disease still accounts for more death in people of under the
age of 85 years than heart disease [2].
Breast cancer is a leading cause of morbidity and mortality, especially in young pre-
menopausal women of age 30-50 years. It is the malignant form of cancer originating from breast
tissues especially from
ducts and lobules.
Cancer originating from
ducts and lobules are
called ductal carcinoma
and lobular carcinoma,
respectively. Breast
cancer cause due to the
up-regulation of
hormone estrogen are
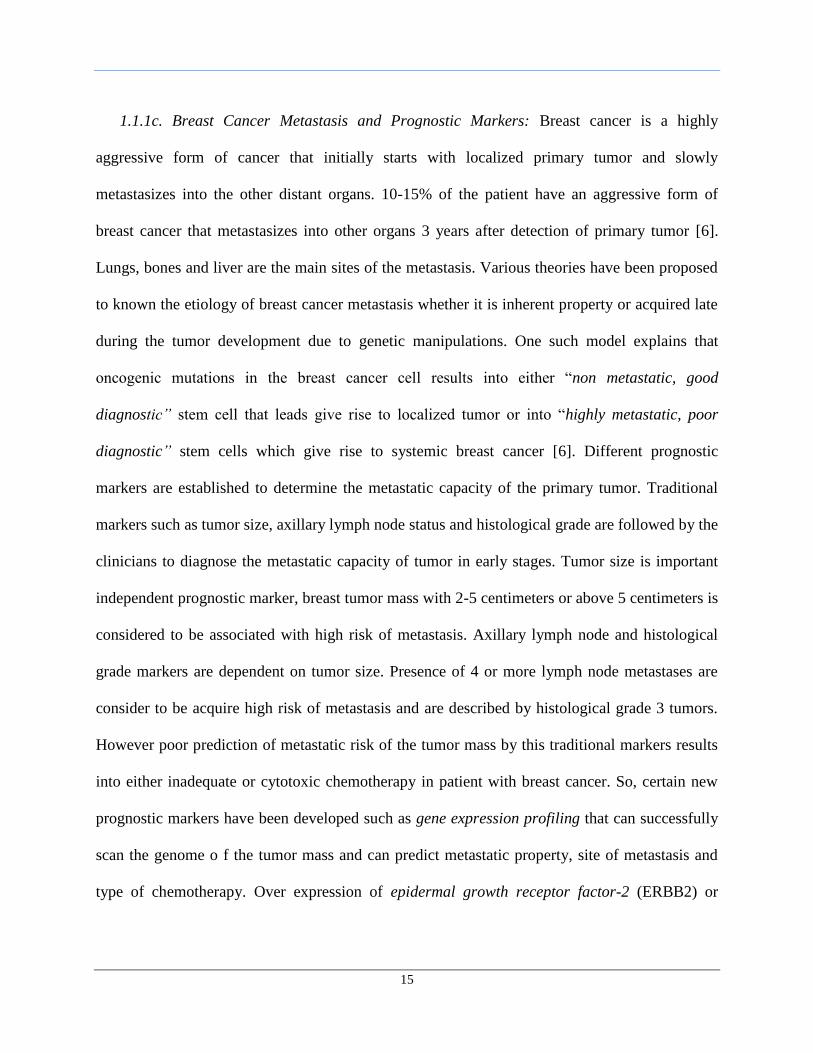
called estrogen receptor Figure 1: Estimated new cases and deaths due to different types of
cancer in male and female in the United States. Marked circle shows the
percentage of estimated new cases and death in female due to breast
cancer.
12
positive or ER positive cancer and are less aggressive cancer tumors. Breast cancers that involves
genetic changes like down regulation of tumor gene suppressor genes 1 (BRCA 1) and breast
cancer gene 2 (BRCA 2) or up regulation of HER2, regulates cellular growth and division, are
more aggressive [3].
A
large
number of
women are
affected
than male
population
from the
breast
cancer. In
2008, from
the total 184,450 new breast cancer cases, 182,460 were found in female and out of 40,930
deaths from breast cancer 40,480 were in female [2]. In terms of estimated new cases breast
cancer accounts for 26% of total cases in female for all leading cancer types in 2008. Also, breast
cancer accounts for 15% of the total death in female from all leading cancer types [2] as shown
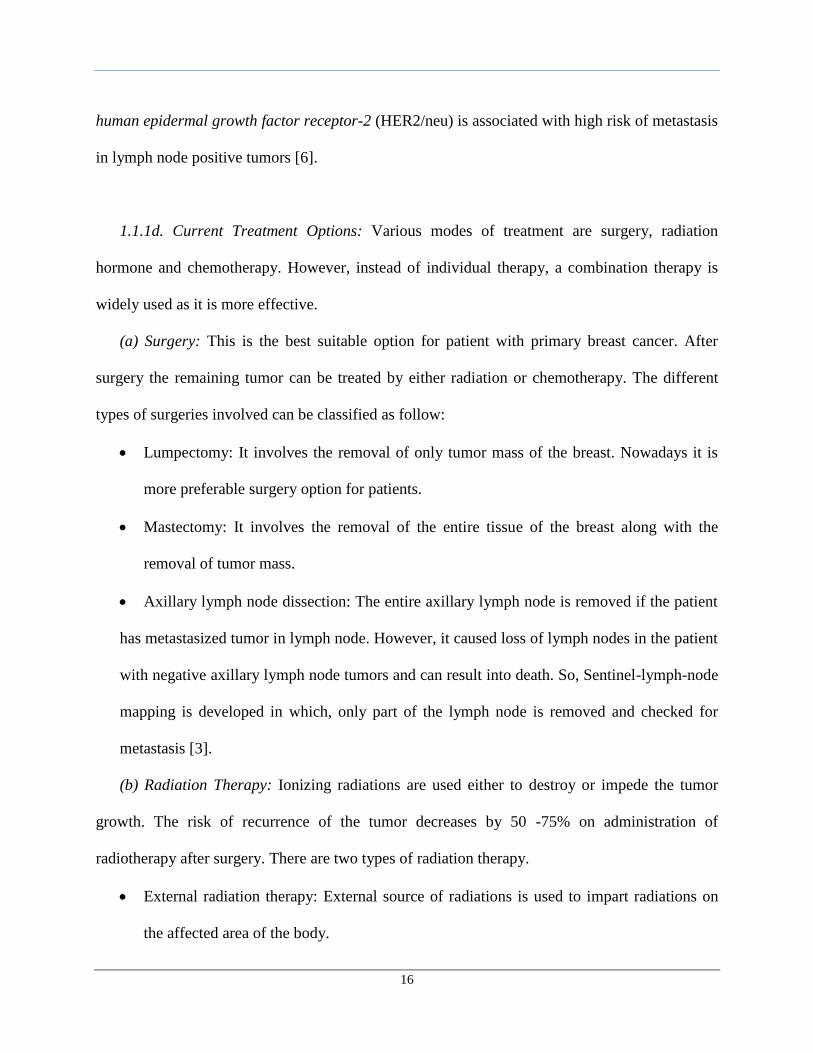
in Figure 1. The incidence rates of the breast cancer in female as compared to male are highest
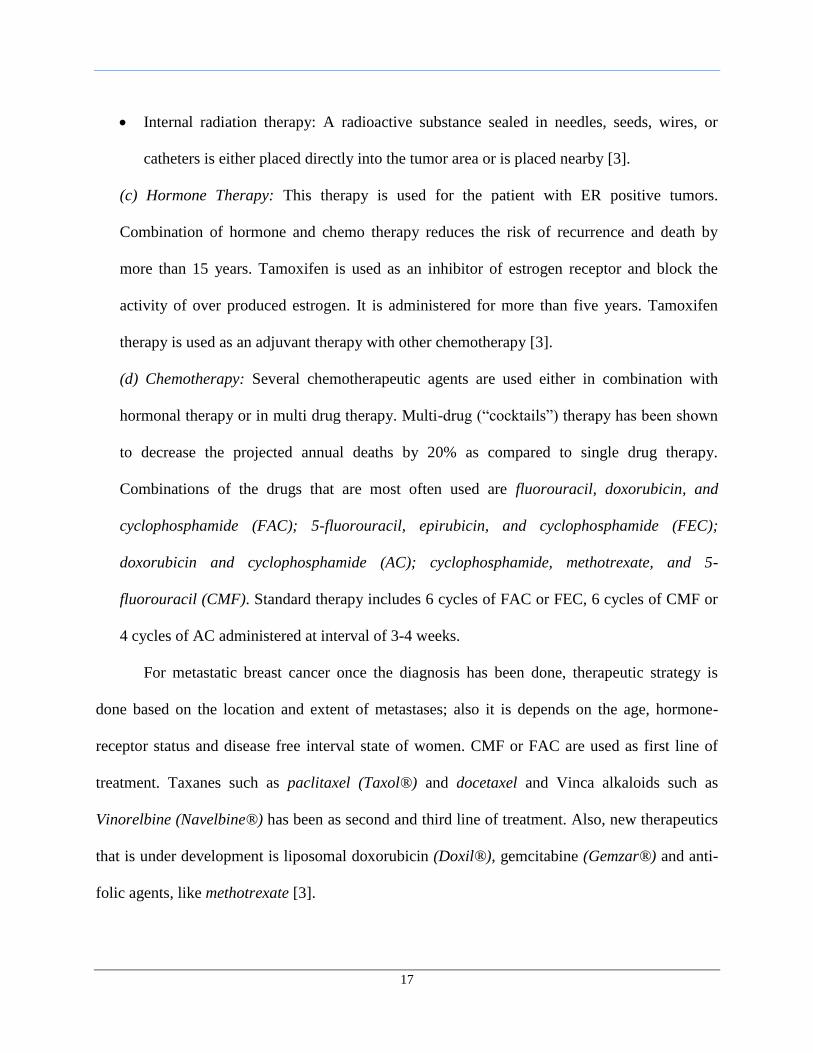
among all other cancer types as shown in Figure 2. Also the annual death rates because of breast
cancer are second highest in female among all other cancer types as shown in Figure 3.
Figure 2: Annual rates of diagnosis of each type of cancer in male and female individuals
in the United States. Marked circle shows the diagnostic rate of breast cancer in female.
13
1.1.1a. Types of Breast Cancer: Following are some of the main types of Breast cancer
[4]:
1. Invasive Ductal
Carcinoma (IDC): IDC is the
most frequently occurring breast
cancer. It originates in from
ducts and gradually infiltrates in
to surrounding tissues. Tumor
cells vary in shape such as
sheets, nodules or glandular and
size from small to large. About
three fourth of the total
carcinomas found are Invasive Duct Carcinoma. It accounts for 55%-65% 5 year survival rate
[4].
2. Mucinous Carcinoma: This is a type of IDC in which well differentiated small groups
of tumor cells afloat in extra luminal, extracellular mucus. This mucus is in direct contact with
the surrounding connective tissues. Because of its appearance, it is also known as Colloidal
Carcinoma. As they are well differentiated prognosis can be easily done
3. Medullary Carcinoma: This is a less common form of IDC. Here the tumor cells are
larger and spherical in shape, different from healthy cells in tissue. The color of the tumor mass
is that of medulla in brain. This particular carcinoma is easy to diagnose.
Figure 3: Annual rates of deaths in females due to different
types of cancer.
14
4. Tubular Carcinoma: This is also a rare type of IDC. It is mark by the presence of
tubules in tumor mass. These tubules are single layer of small tumor cells. These types of tumor
are considered pre mature and are supposed to acquire aggressive nature in later stages.
5. Inflammatory Breast Cancer: It is one of the aggressive carcinoma that leads to
inflammatory response by blocking lymph vessels of the skin in breast. It causes reddening and
swelling of the breast. It is one of the rapidly growing forms of breast carcinoma.
1.1.1b. Stages of Breast Cancer: Breast cancer is divided into five stages for diagnosis
and therapy as follows:
Stage 0: In this stage, cancer cells are localized in either ducts or lobules and not into the
surrounding tissues, also referred to carcinoma insitu stage. This stage is highly treatable and
five year survival rate is 100% [5]. It can be either Ductal or lobular carcinoma insitu.
Stage 1: Here the cancer cells are localized to their respective sites and size of the tumor
is not more than 2 centimeters.
Stage 2: This stage is divided into two types depending upon the size of tumor and
whether it had spread to the surrounding tissues or not. In Stage 2A and 2B size of tumor is
between 2-5 centimeters and greater than 5 centimeters respectively and might be spread till
three auxiliary lymph nodes [5].
Stage 3: This stage is also divided into two types. In stage 3A t tumor spreads till 9
axillary lymph nodes with size ranging from 2-5 centimeters. In stage 3B tumor metastasize to
the nearby tissues like chest, muscles, ribs [5].
Stage 4: In this stage metastasis occurs in major organs of the body such as lung, bones
and liver. The five year survival rate is only 16% in this stage [5].
15
1.1.1c. Breast Cancer Metastasis and Prognostic Markers: Breast cancer is a highly
aggressive form of cancer that initially starts with localized primary tumor and slowly
metastasizes into the other distant organs. 10-15% of the patient have an aggressive form of
breast cancer that metastasizes into other organs 3 years after detection of primary tumor [6].
Lungs, bones and liver are the main sites of the metastasis. Various theories have been proposed
to known the etiology of breast cancer metastasis whether it is inherent property or acquired late
during the tumor development due to genetic manipulations. One such model explains that
oncogenic mutations in the breast cancer cell results into either “non metastatic, good
diagnostic” stem cell that leads give rise to localized tumor or into “highly metastatic, poor
diagnostic” stem cells which give rise to systemic breast cancer [6]. Different prognostic
markers are established to determine the metastatic capacity of the primary tumor. Traditional
markers such as tumor size, axillary lymph node status and histological grade are followed by the
clinicians to diagnose the metastatic capacity of tumor in early stages. Tumor size is important
independent prognostic marker, breast tumor mass with 2-5 centimeters or above 5 centimeters is
considered to be associated with high risk of metastasis. Axillary lymph node and histological
grade markers are dependent on tumor size. Presence of 4 or more lymph node metastases are
consider to be acquire high risk of metastasis and are described by histological grade 3 tumors.
However poor prediction of metastatic risk of the tumor mass by this traditional markers results
into either inadequate or cytotoxic chemotherapy in patient with breast cancer. So, certain new
prognostic markers have been developed such as gene expression profiling that can successfully
scan the genome o f the tumor mass and can predict metastatic property, site of metastasis and
type of chemotherapy. Over expression of epidermal growth receptor factor-2 (ERBB2) or
16
human epidermal growth factor receptor-2 (HER2/neu) is associated with high risk of metastasis
in lymph node positive tumors [6].
1.1.1d. Current Treatment Options: Various modes of treatment are surgery, radiation
hormone and chemotherapy. However, instead of individual therapy, a combination therapy is
widely used as it is more effective.
(a) Surgery: This is the best suitable option for patient with primary breast cancer. After
surgery the remaining tumor can be treated by either radiation or chemotherapy. The different
types of surgeries involved can be classified as follow:
Lumpectomy: It involves the removal of only tumor mass of the breast. Nowadays it is
more preferable surgery option for patients.
Mastectomy: It involves the removal of the entire tissue of the breast along with the
removal of tumor mass.
Axillary lymph node dissection: The entire axillary lymph node is removed if the patient
has metastasized tumor in lymph node. However, it caused loss of lymph nodes in the patient
with negative axillary lymph node tumors and can result into death. So, Sentinel-lymph-node
mapping is developed in which, only part of the lymph node is removed and checked for
metastasis [3].
(b) Radiation Therapy: Ionizing radiations are used either to destroy or impede the tumor
growth. The risk of recurrence of the tumor decreases by 50 -75% on administration of
radiotherapy after surgery. There are two types of radiation therapy.
External radiation therapy: External source of radiations is used to impart radiations on
the affected area of the body.
17
Internal radiation therapy: A radioactive substance sealed in needles, seeds, wires, or
catheters is either placed directly into the tumor area or is placed nearby [3].
(c) Hormone Therapy: This therapy is used for the patient with ER positive tumors.
Combination of hormone and chemo therapy reduces the risk of recurrence and death by
more than 15 years. Tamoxifen is used as an inhibitor of estrogen receptor and block the
activity of over produced estrogen. It is administered for more than five years. Tamoxifen
therapy is used as an adjuvant therapy with other chemotherapy [3].
(d) Chemotherapy: Several chemotherapeutic agents are used either in combination with
hormonal therapy or in multi drug therapy. Multi-drug (“cocktails”) therapy has been shown
to decrease the projected annual deaths by 20% as compared to single drug therapy.
Combinations of the drugs that are most often used are fluorouracil, doxorubicin, and
cyclophosphamide (FAC); 5-fluorouracil, epirubicin, and cyclophosphamide (FEC);
doxorubicin and cyclophosphamide (AC); cyclophosphamide, methotrexate, and 5-
fluorouracil (CMF). Standard therapy includes 6 cycles of FAC or FEC, 6 cycles of CMF or
4 cycles of AC administered at interval of 3-4 weeks.
For metastatic breast cancer once the diagnosis has been done, therapeutic strategy is
done based on the location and extent of metastases; also it is depends on the age, hormone-
receptor status and disease free interval state of women. CMF or FAC are used as first line of
treatment. Taxanes such as paclitaxel (Taxol®) and docetaxel and Vinca alkaloids such as
Vinorelbine (Navelbine®) has been as second and third line of treatment. Also, new therapeutics
that is under development is liposomal doxorubicin (Doxil®), gemcitabine (Gemzar®) and anti-
folic agents, like methotrexate [3].
18
1.2. Tumor Blood Supply and Hypoxia
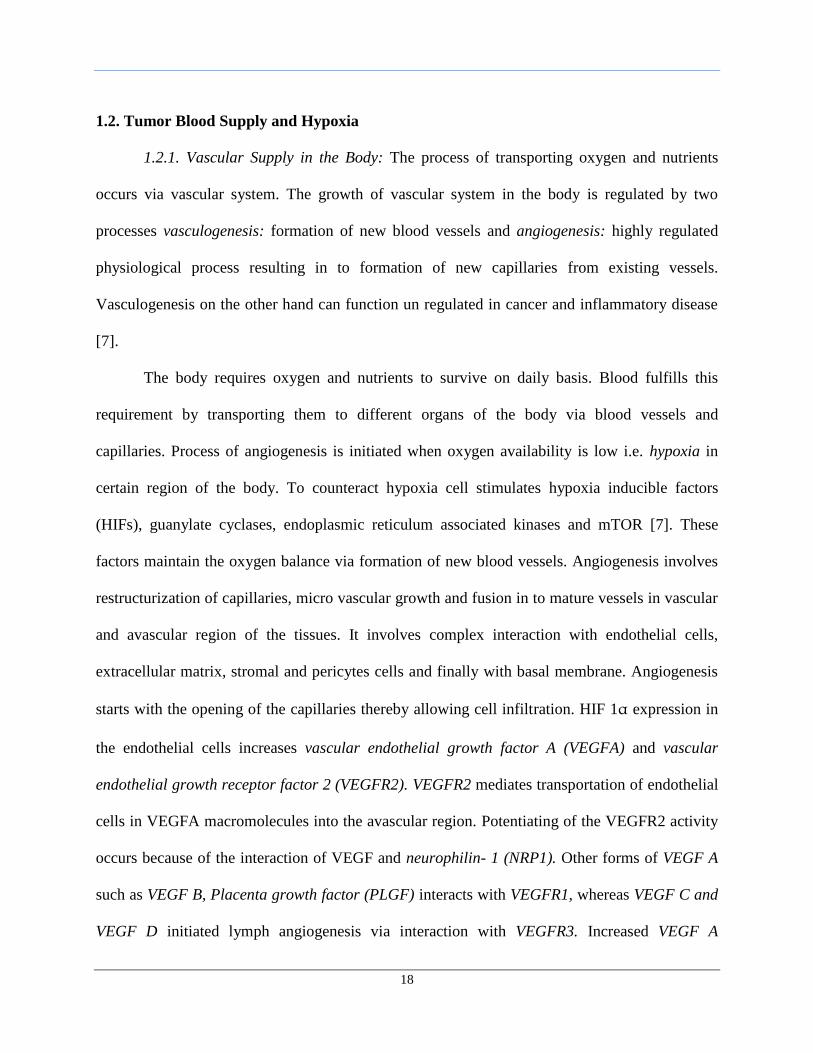
1.2.1. Vascular Supply in the Body: The process of transporting oxygen and nutrients
occurs via vascular system. The growth of vascular system in the body is regulated by two
processes vasculogenesis: formation of new blood vessels and angiogenesis: highly regulated
physiological process resulting in to formation of new capillaries from existing vessels.
Vasculogenesis on the other hand can function un regulated in cancer and inflammatory disease
[7].
The body requires oxygen and nutrients to survive on daily basis. Blood fulfills this
requirement by transporting them to different organs of the body via blood vessels and
capillaries. Process of angiogenesis is initiated when oxygen availability is low i.e. hypoxia in
certain region of the body. To counteract hypoxia cell stimulates hypoxia inducible factors
(HIFs), guanylate cyclases, endoplasmic reticulum associated kinases and mTOR [7]. These
factors maintain the oxygen balance via formation of new blood vessels. Angiogenesis involves
restructurization of capillaries, micro vascular growth and fusion in to mature vessels in vascular
and avascular region of the tissues. It involves complex interaction with endothelial cells,
extracellular matrix, stromal and pericytes cells and finally with basal membrane. Angiogenesis
starts with the opening of the capillaries thereby allowing cell infiltration. HIF 1α expression in
the endothelial cells increases vascular endothelial growth factor A (VEGFA) and vascular
endothelial growth receptor factor 2 (VEGFR2). VEGFR2 mediates transportation of endothelial
cells in VEGFA macromolecules into the avascular region. Potentiating of the VEGFR2 activity
occurs because of the interaction of VEGF and neurophilin- 1 (NRP1). Other forms of VEGF A
such as VEGF B, Placenta growth factor (PLGF) interacts with VEGFR1, whereas VEGF C and
VEGF D initiated lymph angiogenesis via interaction with VEGFR3. Increased VEGF A
19
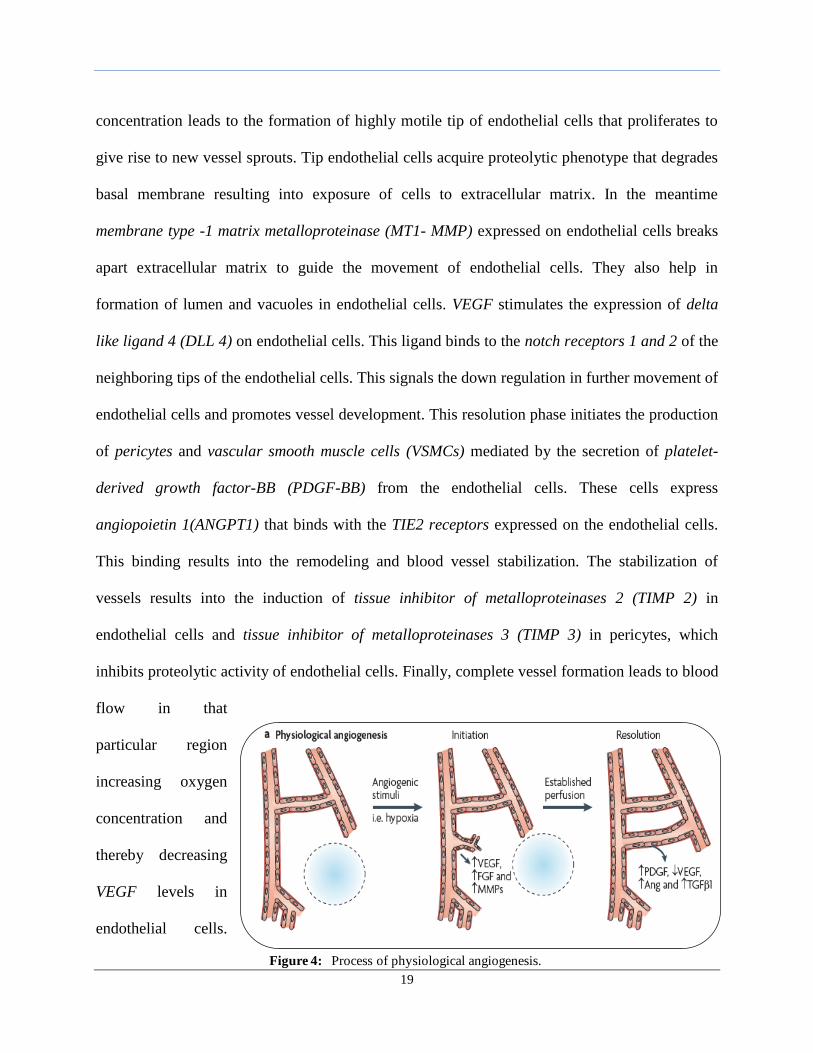
concentration leads to the formation of highly motile tip of endothelial cells that proliferates to
give rise to new vessel sprouts. Tip endothelial cells acquire proteolytic phenotype that degrades
basal membrane resulting into exposure of cells to extracellular matrix. In the meantime
membrane type -1 matrix metalloproteinase (MT1- MMP) expressed on endothelial cells breaks
apart extracellular matrix to guide the movement of endothelial cells. They also help in
formation of lumen and vacuoles in endothelial cells. VEGF stimulates the expression of delta
like ligand 4 (DLL 4) on endothelial cells. This ligand binds to the notch receptors 1 and 2 of the
neighboring tips of the endothelial cells. This signals the down regulation in further movement of
endothelial cells and promotes vessel development. This resolution phase initiates the production
of pericytes and vascular smooth muscle cells (VSMCs) mediated by the secretion of platelet-
derived growth factor-BB (PDGF-BB) from the endothelial cells. These cells express
angiopoietin 1(ANGPT1) that binds with the TIE2 receptors expressed on the endothelial cells.
This binding results into the remodeling and blood vessel stabilization. The stabilization of
vessels results into the induction of tissue inhibitor of metalloproteinases 2 (TIMP 2) in
endothelial cells and tissue inhibitor of metalloproteinases 3 (TIMP 3) in pericytes, which
inhibits proteolytic activity of endothelial cells. Finally, complete vessel formation leads to blood
flow in that
particular region
increasing oxygen
concentration and
thereby decreasing
VEGF levels in
endothelial cells.
Figure 4: Process of physiological angiogenesis.
20
This marks the completion of angiogenesis [7]. Figure 4 describes the process of angiogenesis.
1.2.1b. Tumor Angiogenesis: The main difference between tumor and normal
angiogenesis is that in case of cancer the angiogenic process in continuous and highly unresolved
due to tumor hypoxia and its different secreted factors [7]. The normal process of angiogenesis
occurs in due balance of pro- and anti angiogenetic factors. However, in order to grow further
and metastasize, tumor cells shifts the above balance towards pro angiogenetic factors. This
transition phase of tumor cells towards angiogenesis is known as angiogenic switch [8]. Various
factors that accounts for this switch are proliferating cells, low pO2, inflammatory response,
genetic manipulations like increased expression of oncogenes and decreased expression of tumor
suppression genes. All these factors are secreted from different cells like endothelial cell, cancer
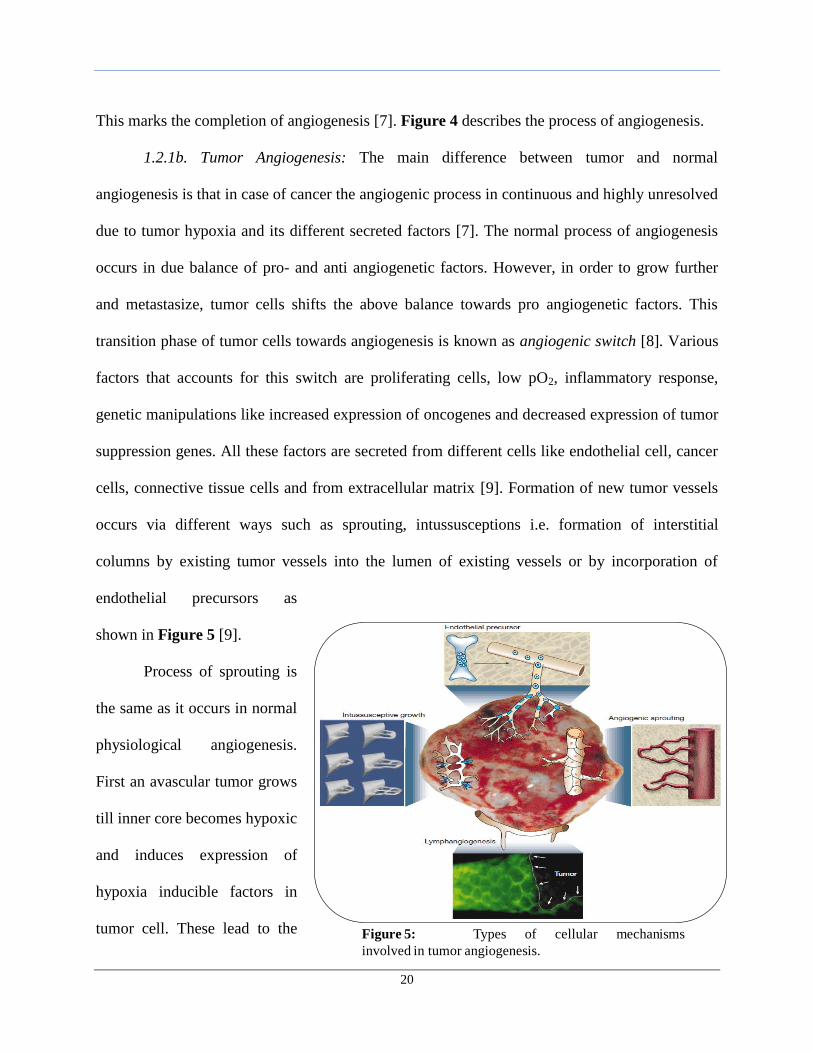
cells, connective tissue cells and from extracellular matrix [9]. Formation of new tumor vessels
occurs via different ways such as sprouting, intussusceptions i.e. formation of interstitial
columns by existing tumor vessels into the lumen of existing vessels or by incorporation of
endothelial precursors as
shown in Figure 5 [9].
Process of sprouting is
the same as it occurs in normal
physiological angiogenesis.
First an avascular tumor grows
till inner core becomes hypoxic
and induces expression of
hypoxia inducible factors in
tumor cell. These lead to the Figure 5: Types of cellular mechanisms
involved in tumor angiogenesis.
21
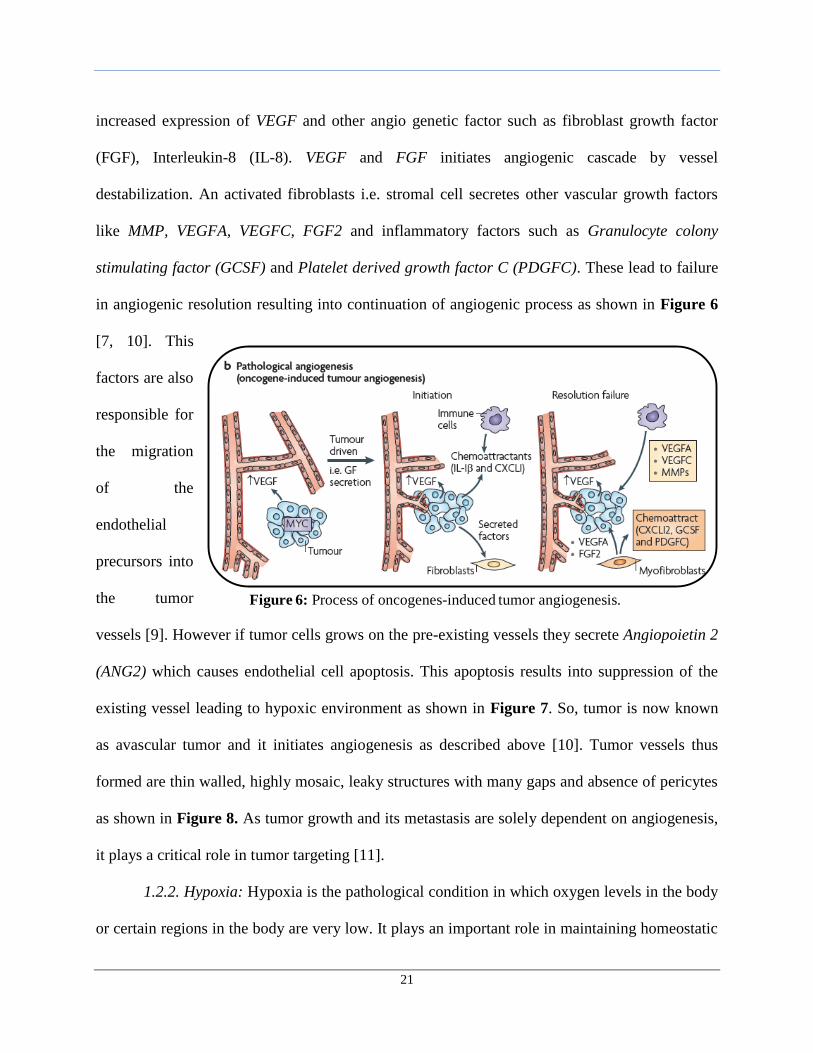
increased expression of VEGF and other angio genetic factor such as fibroblast growth factor
(FGF), Interleukin-8 (IL-8). VEGF and FGF initiates angiogenic cascade by vessel
destabilization. An activated fibroblasts i.e. stromal cell secretes other vascular growth factors
like MMP, VEGFA, VEGFC, FGF2 and inflammatory factors such as Granulocyte colony
stimulating factor (GCSF) and Platelet derived growth factor C (PDGFC). These lead to failure
in angiogenic resolution resulting into continuation of angiogenic process as shown in Figure 6
[7, 10]. This
factors are also
responsible for
the migration
of the
endothelial
precursors into
the tumor
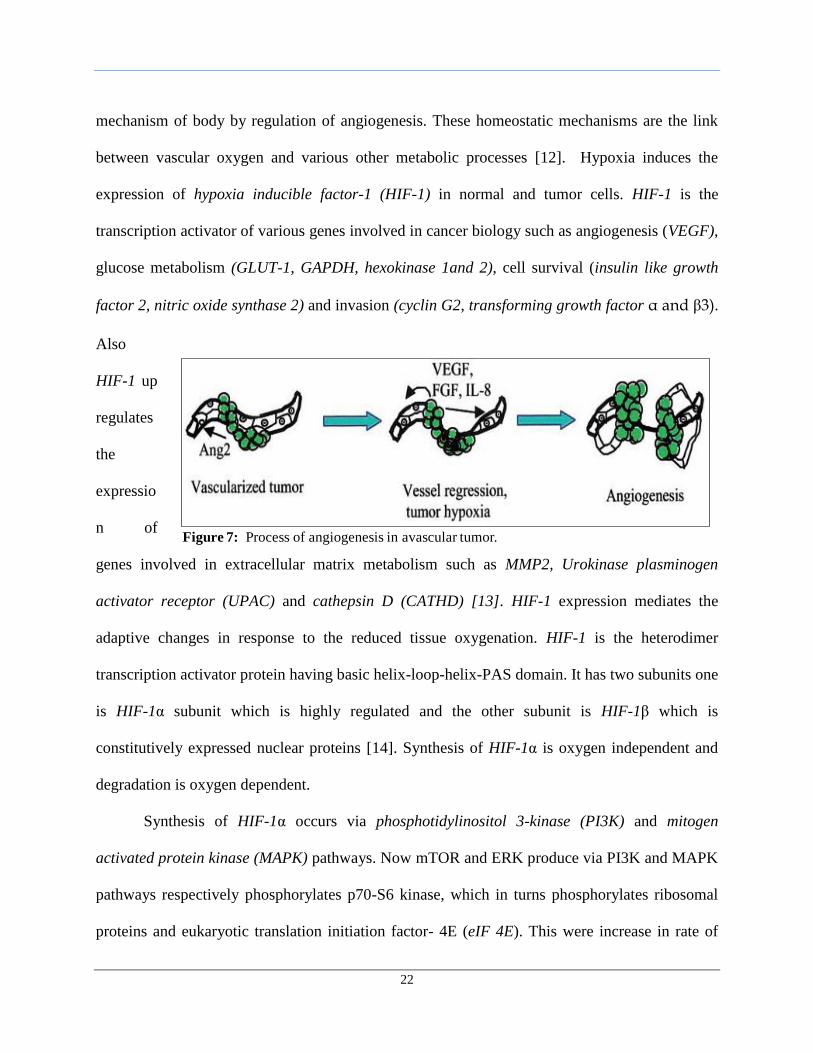
vessels [9]. However if tumor cells grows on the pre-existing vessels they secrete Angiopoietin 2
(ANG2) which causes endothelial cell apoptosis. This apoptosis results into suppression of the
existing vessel leading to hypoxic environment as shown in Figure 7. So, tumor is now known
as avascular tumor and it initiates angiogenesis as described above [10]. Tumor vessels thus
formed are thin walled, highly mosaic, leaky structures with many gaps and absence of pericytes
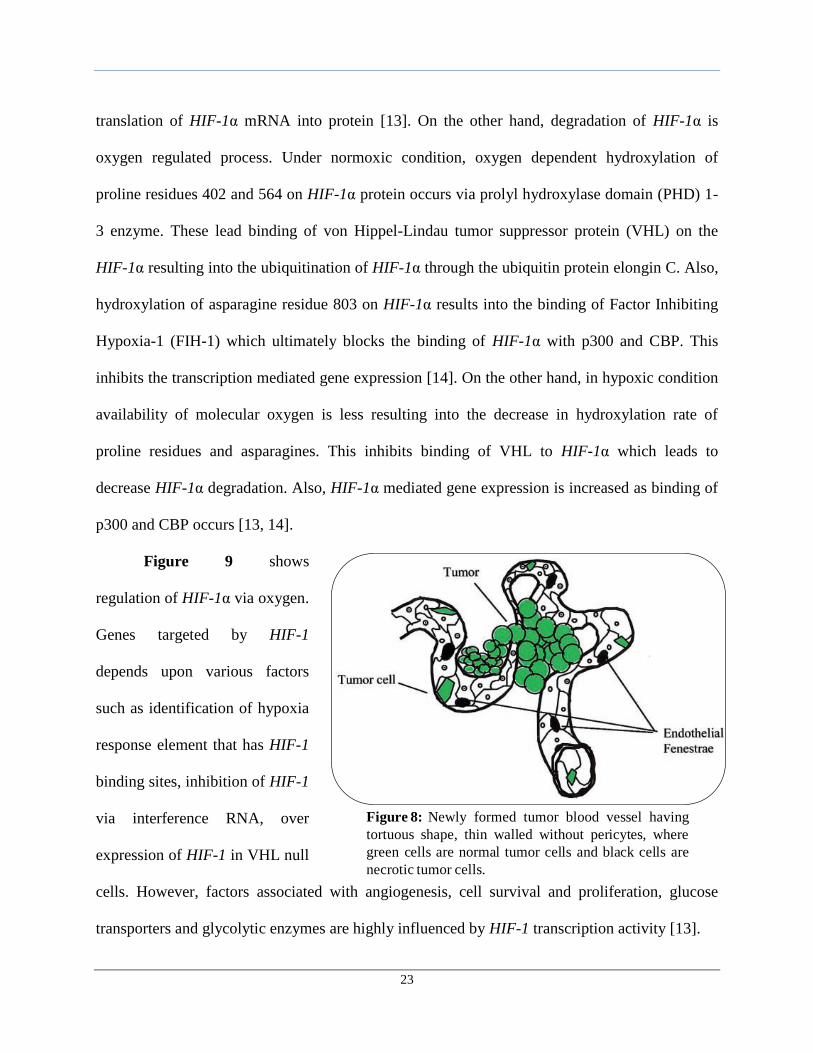
as shown in Figure 8. As tumor growth and its metastasis are solely dependent on angiogenesis,
it plays a critical role in tumor targeting [11].
1.2.2. Hypoxia: Hypoxia is the pathological condition in which oxygen levels in the body
or certain regions in the body are very low. It plays an important role in maintaining homeostatic
Figure 6: Process of oncogenes-induced tumor angiogenesis.
22
mechanism of body by regulation of angiogenesis. These homeostatic mechanisms are the link
between vascular oxygen and various other metabolic processes [12]. Hypoxia induces the
expression of hypoxia inducible factor-1 (HIF-1) in normal and tumor cells. HIF-1 is the
transcription activator of various genes involved in cancer biology such as angiogenesis (VEGF),
glucose metabolism (GLUT-1, GAPDH, hexokinase 1and 2), cell survival (insulin like growth
factor 2, nitric oxide synthase 2) and invasion (cyclin G2, transforming growth factor α and β3).
Also
HIF-1 up
regulates
the
expressio
n of
genes involved in extracellular matrix metabolism such as MMP2, Urokinase plasminogen
activator receptor (UPAC) and cathepsin D (CATHD) [13]. HIF-1 expression mediates the
adaptive changes in response to the reduced tissue oxygenation. HIF-1 is the heterodimer
transcription activator protein having basic helix-loop-helix-PAS domain. It has two subunits one
is HIF-1α subunit which is highly regulated and the other subunit is HIF-1β which is
constitutively expressed nuclear proteins [14]. Synthesis of HIF-1α is oxygen independent and
degradation is oxygen dependent.
Synthesis of HIF-1α occurs via phosphotidylinositol 3-kinase (PI3K) and mitogen
activated protein kinase (MAPK) pathways. Now mTOR and ERK produce via PI3K and MAPK
pathways respectively phosphorylates p70-S6 kinase, which in turns phosphorylates ribosomal
proteins and eukaryotic translation initiation factor- 4E (eIF 4E). This were increase in rate of
Figure 7: Process of angiogenesis in avascular tumor.
23
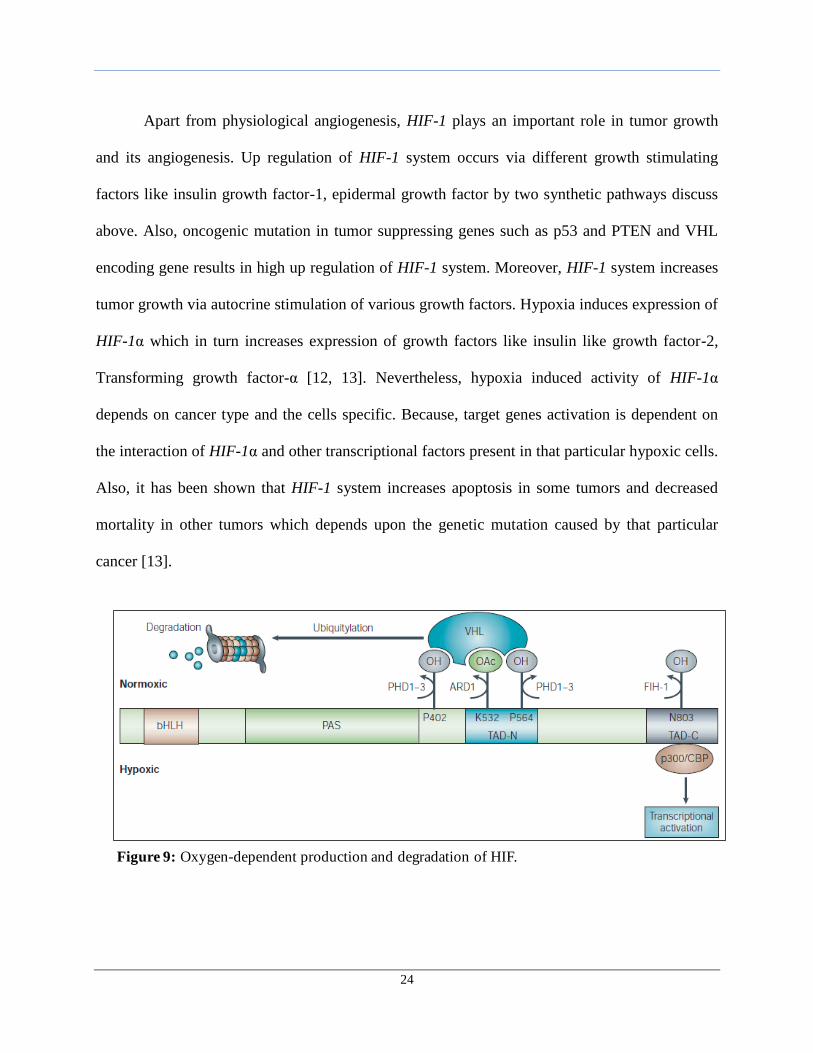
translation of HIF-1α mRNA into protein [13]. On the other hand, degradation of HIF-1α is
oxygen regulated process. Under normoxic condition, oxygen dependent hydroxylation of
proline residues 402 and 564 on HIF-1α protein occurs via prolyl hydroxylase domain (PHD) 1-
3 enzyme. These lead binding of von Hippel-Lindau tumor suppressor protein (VHL) on the
HIF-1α resulting into the ubiquitination of HIF-1α through the ubiquitin protein elongin C. Also,
hydroxylation of asparagine residue 803 on HIF-1α results into the binding of Factor Inhibiting
Hypoxia-1 (FIH-1) which ultimately blocks the binding of HIF-1α with p300 and CBP. This
inhibits the transcription mediated gene expression [14]. On the other hand, in hypoxic condition
availability of molecular oxygen is less resulting into the decrease in hydroxylation rate of
proline residues and asparagines. This inhibits binding of VHL to HIF-1α which leads to
decrease HIF-1α degradation. Also, HIF-1α mediated gene expression is increased as binding of
p300 and CBP occurs [13, 14].
Figure 9 shows
regulation of HIF-1α via oxygen.
Genes targeted by HIF-1
depends upon various factors
such as identification of hypoxia
response element that has HIF-1
binding sites, inhibition of HIF-1
via interference RNA, over
expression of HIF-1 in VHL null
cells. However, factors associated with angiogenesis, cell survival and proliferation, glucose
transporters and glycolytic enzymes are highly influenced by HIF-1 transcription activity [13].
Figure 8: Newly formed tumor blood vessel having
tortuous shape, thin walled without pericytes, where
green cells are normal tumor cells and black cells are
necrotic tumor cells.
24
Apart from physiological angiogenesis, HIF-1 plays an important role in tumor growth
and its angiogenesis. Up regulation of HIF-1 system occurs via different growth stimulating
factors like insulin growth factor-1, epidermal growth factor by two synthetic pathways discuss
above. Also, oncogenic mutation in tumor suppressing genes such as p53 and PTEN and VHL
encoding gene results in high up regulation of HIF-1 system. Moreover, HIF-1 system increases
tumor growth via autocrine stimulation of various growth factors. Hypoxia induces expression of
HIF-1α which in turn increases expression of growth factors like insulin like growth factor-2,
Transforming growth factor-α [12, 13]. Nevertheless, hypoxia induced activity of HIF-1α
depends on cancer type and the cells specific. Because, target genes activation is dependent on
the interaction of HIF-1α and other transcriptional factors present in that particular hypoxic cells.
Also, it has been shown that HIF-1 system increases apoptosis in some tumors and decreased
mortality in other tumors which depends upon the genetic mutation caused by that particular
cancer [13].
Figure 9: Oxygen-dependent production and degradation of HIF.
25
1.3. Role of Hyperoxia in Enhancing Cytotoxic Chemotherapy
Currently, systemic chemotherapy is the only viable approach used widely for the
treatment of cancer. Usually combinations of various anti-cancer therapies are being used to
overcome and treat resistant tumor cells. However, in majority of cases, these drugs are
unsuccessful in the complete eradication of cancer. There are certain biological aspects of cancer
and its growth that are to be understood. One such aspect is the hypoxia and its effect on tumor
cells. To overcome this, research in area of hyperoxia has been initiated and is one of promising
future therapy in way that it affects the core biology of cancer. Hyperoxia is the condition in
which oxygen level or partial pressure of oxygen increases in tissues of the body. This idea is
applied onto the hypoxic tumor cells to counteract the effect of hypoxia inducible factor-1.
Measurement of the tumor oxygenation divided tumor cells into different layers depending on
oxygen level, the center being necrotic and edge being hypoxic [15]. This gradient in oxygen in
tumor cells has varied effect on various cellular processes. One way to overcome this is to supply
more oxygen than ambient oxygen (21%) in to the mammalian tissues. This way, the molecular
oxygen into tumor cells can be increased, which is required for different aerobic metabolism.
1.3.1a. HIFs as an Oxygen Sensor in Cancer: The impact of hypoxia inducible factor-1
(HIF-1α) is highly dependent on the level of molecular oxygen in the tumor cells. Studies carried
out to understand the mechanism of HIFs during the changes in cellular oxygen revealed that
HIF-1α subunit is highly regulated by an oxygen dependent degradation domain consisting of
200 amino acids [15]. Also, it was revealed that the hydroxylation and VHL dependent poly-
ubiquitylation is reduced in hypoxic cells, resulting into the increase expression of HIF-1α and
its target genes. Also, the interaction of HIF-1α with the factor inhibiting hypoxia-1 (FIH-1)
reduces due to decreased hydroxylation of asparagines residue in hypoxia. However, HIF-1α’s
26
ubiquitylation and degradation is increased in oxygen replete cells i.e. hyperoxia via proteosome.
This is because prolyl hydroxylase domain enzyme required for degradation and Factor
inhibiting hypoxia-1 are dependent on oxygen, iron and 2-oxoglutarate [15]. In hyperoxia
increased availability of molecular oxygen leads to tumor oxygenation thereby decreasing
oxygen gradient across the tumor mass [16]. The proposed mechanism of reversal of the hypoxia
induced HIF-1α activity is increased hydroxylation, poly-ubiquitylation and degradation of HIF-
1α. Increased availability of molecular oxygen causes the activation of prolyl hydroxylase
domain (PHD domain) enzyme 1-3 and other hydroxylase. These lead to the hydroxylation of
proline residues and asparagines residue resulting into the binding of Von Hippel-Lindau (VHL)
and Factor Inhibiting Hypoxia-1 (FIH-1) respectively. Binding of VHL and FIH-1 were lead to
the poly- ubiquitylation and inhibit binding of HIF-1α with transcriptional co-factors p300 and
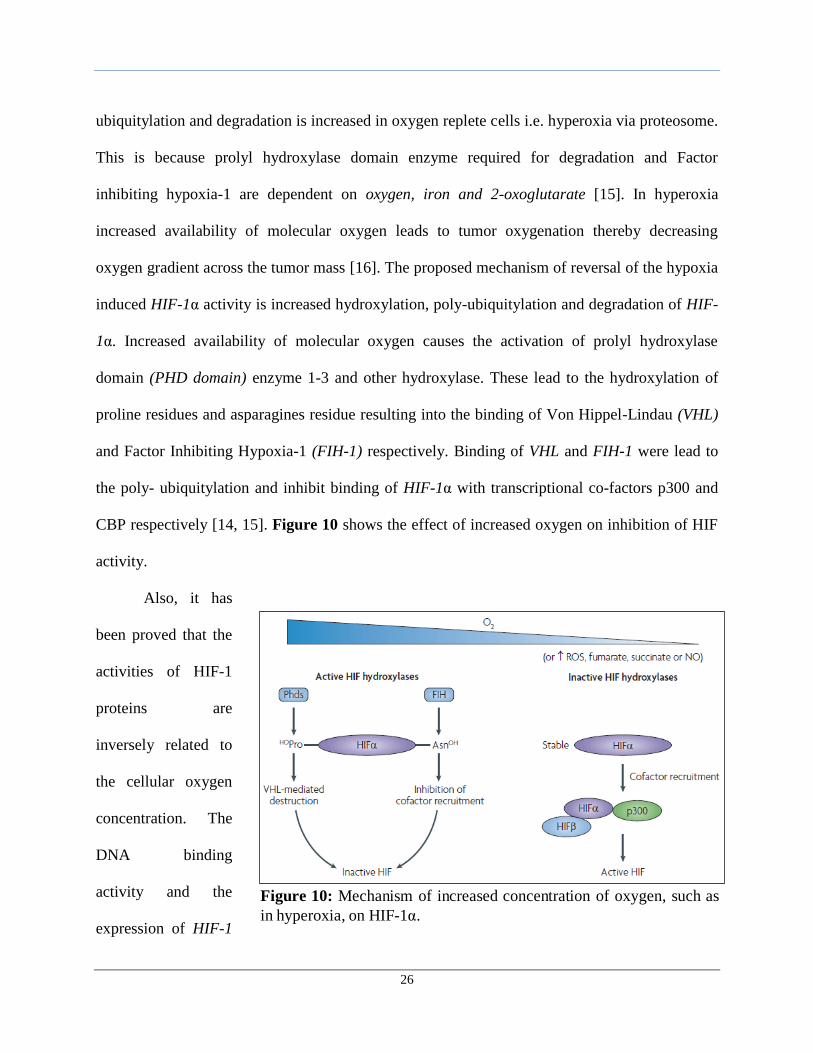
CBP respectively [14, 15]. Figure 10 shows the effect of increased oxygen on inhibition of HIF
activity.
Also, it has
been proved that the
activities of HIF-1
proteins are
inversely related to
the cellular oxygen
concentration. The
DNA binding
activity and the
expression of HIF-1
Figure 10: Mechanism of increased concentration of oxygen, such as
in hyperoxia, on HIF-1α.
27
proteins: HIF-1α and HIF-1β increases exponentially with the decreasing oxygen concentration
[17]. It was shown that the HIF-1α and HIF-1β RNA and proteins level decreases immediately
on exposure of cells to increased oxygen concentration. HIF-1α induced in turn binds to HIF-1
binding sites within the promoter region of the various genes that encodes VEGF, GLUT-,
glycolytic enzyme and nitric oxide synthase, which induces the hypoxia mediated transcription.
However, the functional characterization of HIF-1 as an oxygen sensor in tumors is cell
dependent [17].
1.3.1b. Effect of Hyperoxia on Tumor Cell Growth: There exists the oxygen gradient
across the area of the tumor region resulting in lower HbO2 saturation in this area. Also,
Hypoxia inducible factor - 1α is main regulatory factor responsible for the various changes
induced by hypoxia in tumor cells. This can be overcome by exposing the cells to higher amount
of oxygen. These increase the partial pressure of oxygen in various tissues, enhancing the
solubility of oxygen in the blood. The increase in the solubility of oxygen causes access of
oxygen to previously obstructed physiologically areas leading to the increased Hb02 saturation.
This were cause the retardation in the tumor growth via reduction in the expression of various
glandular secretory proteins [18]. The expression of genes encoding different glandular proteins
such as parotid secretory proteins (Psp), common salivary protein 1 (Csp1) and prolactin
induced gene (Pip) which are involved in the growth of the tumor, is down regulated on
exposing tumor cells to hyperoxia. Also, hyperoxia marks the transition of mesenchymal cells to
epithelial cells in tumor via inducing the expression of makers such as fibroblast growth factor
receptor-1, transforming growth factor α, β1 and β2. Also, the retardation in tumor growth is
being accompanied by the shifting of the glycolytic metabolism to oxidative phosphorylation via
down regulation of enzymes such as hexokinase 2 and lactate dehydrogenase [16]. Reduced
28
expression of these genes resulted into marked decrease in tumor size and tumor morphology
[16, 18].
1.3.1c. Effect of Hyperoxia on Tumor Blood Flow: The decreased in the growth of tumor
is accompanied by the anti-angiogenic effect of the increased amount of oxygen. There has been
contradictory effect of hyperoxia on the normal and tumor cells. It induces the increase in the
vessel development during wound healing in normal tissues. However, it causes reduction in the
vascular density in tumor cells [16, 18]. The increased partial pressure of oxygen in the tumor
tissue causes the degradation of HIF-1α and other vascular growth factors. Also, down regulation
of genes such as VEGFα and VEGFβ, Fibroblast growth factor and platelet derived growth
factor leads to reduction in the angiogenesis [16]. This resulted in the vasodilatation of the
peripheral and central tumor vessel which increases blood flow into the tumor and prevents
starvation by counteracting hypoxia [18].
1.3.1d. Mechanisms of Hyperoxia-Induced Cell Death: All the above effect caused by the
hyperoxia is via proposed mechanism of apoptosis. The tumor suppressor gene p53 is main
regulatory mechanism for induction of apoptosis, which after activation induces expression of
other pro-apoptotic factors like PUMA, BAX, BAK, BIK AND PERP in tumor cells [16]. All these
genes play cell specific role in wt-p53-induced apoptosis. Out of all these genes, Perp that
encodes protein for epithelial integrity shows marked increases after hyperoxia treatment.
Secondly, high levels of oxygen leads to increases free oxygen radicals (Reactive oxygen
species) formation in tumor cells. This ROS causes “oxidative stress” resulting into the cell
death via apoptosis. Oxidative stress occurs only when free oxygen species concentration
exceeds endogenous anti-oxidant cellular concentration. In normal cells, supoxide dismutase
(SOD) concentration that counteracts ROS is more as compared to the tumor cells, thereby
29
affecting tumor cells in high order. Though ROS causes DNA damage in normal cells it induces
apoptic cell death in tumors [18].
1.4. Nanotechnology for Tumor-Targeted and Intracellular Drug Delivery
Although chemotherapy is highly preferred way to treat the cancer, the treatment
approach has several disadvantages in terms of pharmacokinetic profile. The intravenous
administration of the drugs accounts for the poor bio distribution profile, rapid clearance from
the body, inefficient targeting property and toxicity on the healthy cells. These all disadvantages
resulted into the development of targeted nanomedicine. Tumor targeted nanomedicine are the
drug delivery systems that overcome the above disadvantages of the chemotherapeutic drugs.
Main feature of this systems are site specific and site avoidance delivery of the drugs. This can
be achieved either by passive targeting or active targeting of the drug delivery systems. Former
is achieved because of the leaky vasculature and enhanced permeability and retention effect
(EPR) of the tumor cells, while latter by conjugating nano carriers with peptides, polymers,
ligands and antibodies specific to particular tumors [19, 20]. However, thorough understanding
of the basic biological profile is required for the development of the tumor targeted drug delivery
systems.
1.4.1a. Passive and Active Targeted Delivery Systems: Most of the tumors are
characterized by presence of leaky vasculature and poor lymphatic drainage system. Long
circulating nano carries take advantage of this property of tumor by extravasating through leaky
vessels in to interstitial fluid of tumor. In addition, poor lymphatic drainage retains the nano
carriers at tumor site for prolong period for time thereby increasing efficacy of the drug. This
property of the tumor is also known as enhanced permeability and retention effect [19, 21] .
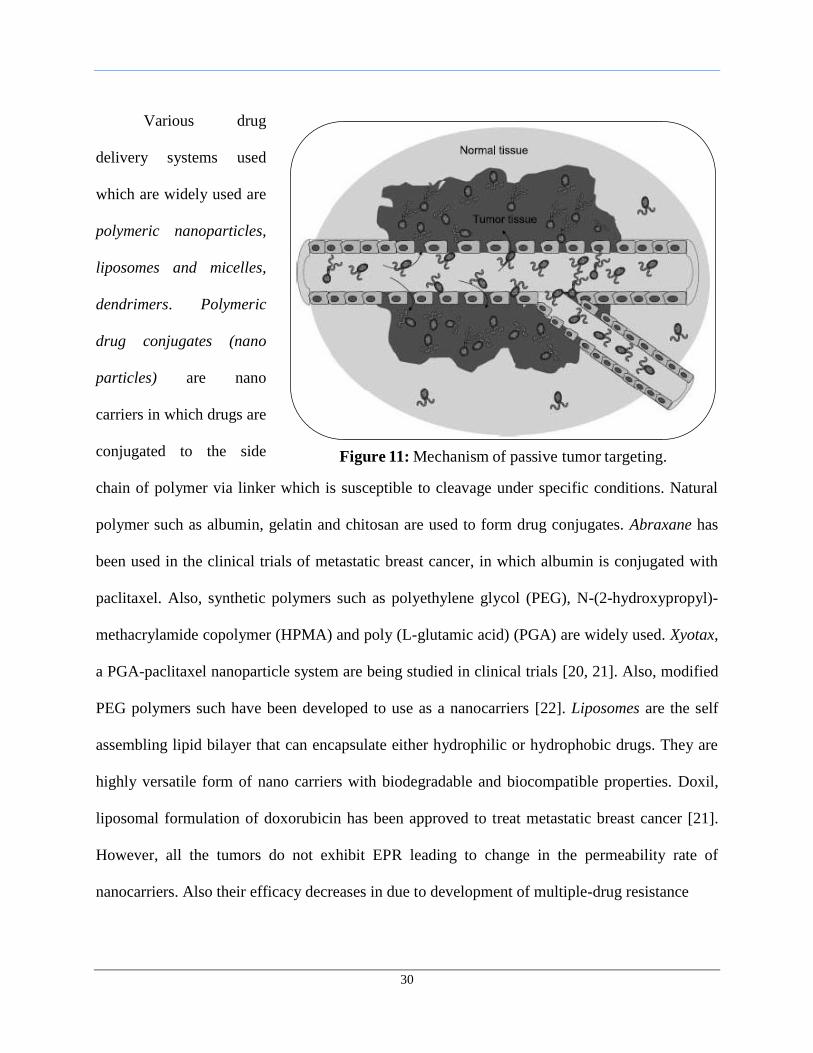
Figure 11 shows the process of passive tumor targeting.
30
Various drug
delivery systems used
which are widely used are
polymeric nanoparticles,
liposomes and micelles,
dendrimers. Polymeric
drug conjugates (nano
particles) are nano
carriers in which drugs are
conjugated to the side
chain of polymer via linker which is susceptible to cleavage under specific conditions. Natural
polymer such as albumin, gelatin and chitosan are used to form drug conjugates. Abraxane has
been used in the clinical trials of metastatic breast cancer, in which albumin is conjugated with
paclitaxel. Also, synthetic polymers such as polyethylene glycol (PEG), N-(2-hydroxypropyl)-
methacrylamide copolymer (HPMA) and poly (L-glutamic acid) (PGA) are widely used. Xyotax,
a PGA-paclitaxel nanoparticle system are being studied in clinical trials [20, 21]. Also, modified
PEG polymers such have been developed to use as a nanocarriers [22]. Liposomes are the self
assembling lipid bilayer that can encapsulate either hydrophilic or hydrophobic drugs. They are
highly versatile form of nano carriers with biodegradable and biocompatible properties. Doxil,
liposomal formulation of doxorubicin has been approved to treat metastatic breast cancer [21].
However, all the tumors do not exhibit EPR leading to change in the permeability rate of
nanocarriers. Also their efficacy decreases in due to development of multiple-drug resistance
Figure 11: Mechanism of passive tumor targeting.
31
To overcome the disadvantages of passive drug targeting, concept of specific drug
targeting was developed. Here specific ligands or antibodies are attached to polymer drug
conjugate systems that bind specifically to receptors or antigens expressed on tumor cells.
Factors such as antigen or receptor expression and internalization are taken into consideration for
the development of active targeted systems. Antigen and receptors must be homogenous and
over expressed only in tumor cells and they must not be present in the blood and must be specific
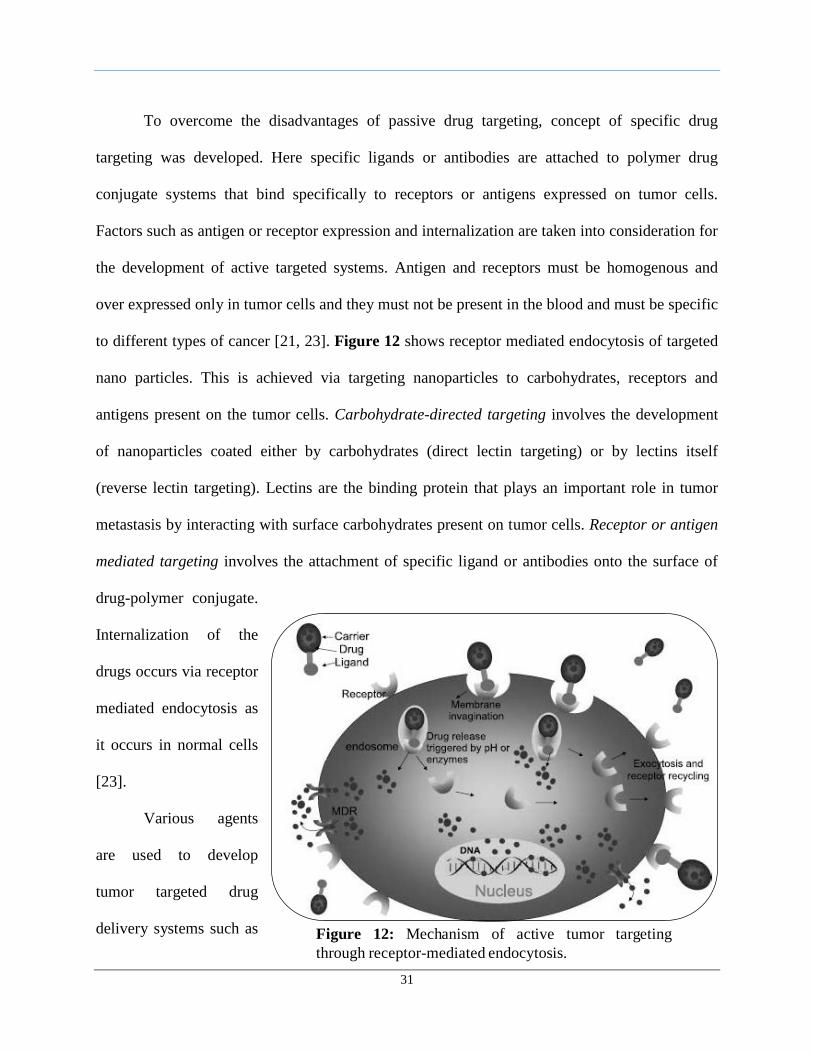
to different types of cancer [21, 23]. Figure 12 shows receptor mediated endocytosis of targeted
nano particles. This is achieved via targeting nanoparticles to carbohydrates, receptors and
antigens present on the tumor cells. Carbohydrate-directed targeting involves the development
of nanoparticles coated either by carbohydrates (direct lectin targeting) or by lectins itself
(reverse lectin targeting). Lectins are the binding protein that plays an important role in tumor
metastasis by interacting with surface carbohydrates present on tumor cells. Receptor or antigen
mediated targeting involves the attachment of specific ligand or antibodies onto the surface of
drug-polymer conjugate.
Internalization of the
drugs occurs via receptor
mediated endocytosis as
it occurs in normal cells
[23].
Various agents
are used to develop
tumor targeted drug
delivery systems such as Figure 12: Mechanism of active tumor targeting
through receptor-mediated endocytosis.
32
antibodies, aptamers, and ligands such as vitamins, peptides or carbohydrates. Antibodies are
either used as a whole or in fragments for targeting purpose. But, complete monoclonal
antibodies are suitable because of high binding due to presence of two binding fragments.
Bevacizumab (Avastin®
) an anti-VEGF monoclonal antibody is used in angiogenesis,
Trastuzumab (Herceptin®) an anti HER-2 monoclonal antibody binds to ErbB2 receptor, used to
treat in breast cancer [23]. Also antibodies can be engineered to increase their binding affinity
towards specific confirmation of target receptor. Aptamers are short single stranded DNA or
RNA that binds to the intracellular, transmembrane proteins, carbohydrates and small molecule
drugs. Docetaxel loaded with aptamers modified nanoparticles are used to target specific antigen
present on the prostate cancer cells [23]. Also, vitamins and other growth factor are attached to
the polymer drug conjugate systems for active tumor targeting.
1.5. Rationale for Combination of Chemo and Hyperoxia Therapy
Despite the increasing advanced in development of targeted nano-therapeutics, some
amount of non-specific drug uptake by the normal cells still persist, which leads to unwanted
side effects and ultimately non-compliance with the treatment. Also, the use of combination of
multiple chemotherapeutic drugs in the treatment of cancer is not effective in completely
removing the root cause in the particular cancer. So, there is a critical need to use another
parallel treatment which can affect the core biology of the cancer and can prevent the relapse of
cancer. Thus, the idea of using hyperoxia, increased levels of oxygen, was introduced along with
the use of chemotherapeutic therapy. The reason behind the use of hyperoxia as a treatment is to
reverse the natural hypoxia-induced effects in tumor cells. Along with this treatment,
chemotherapeutic agent doxorubicin was used as a second line of therapy.
33
Doxorubicin (DOX) is a cytotoxic anthracycline antibiotic isolated from cultures of
Streptomyces peuceutius var. caesius. It consists of a naphthacenequinine nucleus linked through
a glycosidic bond at ring atom 7 to duanosamine sugar. The anthracycline nucleus intercalates
with DNA double helix which inhibits nucleotide replication and action of DNA and RNA
polymerases. Also interaction with topoisomerase II forms a complex which cleaves the DNA
and binding to cell membrane and various plasma proteins leads to activation of apoptosis
cascade. However, enzymatic reduction of doxorubicin generates highly reactive oxygen species
which has been implicated in doxorubicin cardio toxicity. Here, in order to incorporate in to the
hydrophobic core of oil in water nano emulsion, a hydrophobic DOX derivative, DOX stearate,
which was prepared by salt formation between DOX hydrochloride and sodium stearate. Extra
pure grade fish oil was used as an oil phase as it contains omega 3 fatty acids, which can act as
tumor suppressor agents in breast cancer by inducing modification in the biosynthesis of
eicosanoids from n-6 poly unsaturated fatty acids [24, 25]. Egg phosphotidylcholine, if used,
provides integrity and stabilizes the system. Surface modification can be done with PEG as it
will decrease the uptake by RES without affecting the pharmacokinetic profile and temperature
sensitivity of the lipid.
The standard treatment of breast cancer involves surgical removal followed by post-
operative tamoxifen-based chemotherapy. So, use of the hyperoxia reverses the effect of hypoxia
inducible factor-1 (HIF-1) and thereby other factors involved in the proliferation, metastasis and
angiogenesis. Also due to the vasodilatation of the central and peripheral vessel, tumor blood
flow increases leading to the increase in the delivery of doxorubicin stearate at the tumor site.
DOX, therefore, is used which exerts is effect by totally different mechanism. Although no
34
clinical trials exist which evaluate the effect of hyperoxia in breast cancer, several groups have
used combination of hyperoxia and chemotherapy and have got encouraging results [26].
In order to evaluate these hypotheses, in our study, we decided to evaluate the effect of
hyperoxia along with doxorubicin stearate encapsulated in oil-in-water nanoemulsions on MDA-
MB-231 triple negative human breast adenocarcinoma cells.
35
2. OBJECTIVES AND SPECIFIC AIMS
2.1. Statement of the Problem
Cancer is second leading cause of deaths accounting for 12.5% of the total death that
occurs in the world. Also, the worldwide estimated new cancer cases in 2007 were about 12.3
million out of which more than 2.0 million were estimated in the United States [1]. One of the
major problems in cancer therapy is the inefficient systemic delivery of the chemotherapeutic
agents into the tumor area. A conventional chemotherapeutic strategy involves the systemic
administration of the chemotherapeutic agents which gets wide distributed in to the various
regions of the body leading to poor efficacy and systemic toxicity. Moreover, these agents are
not effectively delivered in to the tumor area because of poor perfusion, hence unable to treat
root cause due to lower residence time. Current chemotherapeutic strategies enhances efficacy of
these agents via administration of combination of different chemotherapeutic agents having
different mechanisms to treat cancer cells. Also, the dose of each agent was increased up to a
maximum tolerated dose. Another challenge in the delivery of chemotherapeutic agents to tumor
mass in vivo is poor perfusion into specific regions that lack adequate blood supply and are
hypoxic. The tumor microenvironment around the tumor creates regions of hypoxia due to poor
oxygen perfusion. Combination of poor drug delivery efficiency and micro environmental
selection pressure is known to contribute to tumor drug resistance and aggressiveness.
2.2. Objectives and Experimental Hypotheses
Nanotechnology-based drug delivery systems have shown to enhance the delivery
efficiency in cancer therapy by increasing drug accumulation in the tumor mass, decreasing non-
specific accumulation in other organs of the body, and mitigating the toxicity of
chemotherapeutic agents via passive and active targeting mechanism. However, this
36
conventional nanocarrier system alone are not efficient in delivering chemotherapeutic agents in
to tumor region core because of high degree of irregularity in blood vessels and hypoxic
condition prevailing in the tumor area. Combination of nanocarrier-based drug delivery and
hyperoxia can have a profound impact on enhancing the efficacy of chemotherapeutic agents by
reversing the hypoxia induced activity of HIF systems. Tumor cells have been found to be highly
hypoxic and so hyperoxia were lead to increased oxygen concentration into the tumor core
thereby decreasing HIF activity. Also, increased oxygen were lead to decrease angiogenesis and
improving tumor blood flow which enhances delivery of chemotherapeutic agent into the tumor
mass. Thus, hyperoxia therapy will have a synergistic effect in the treatment of cancer.
To examine the effect of combination hyperoxia and drug delivery in cancer, in this
study, we developed and evaluate oil-in-water (O/W) nanoemulsion formulations that can
encapsulate hydrophobic anticancer drugs. Oil rich in omega 3 poly unsaturated fatty acid was
selected to prepare O/W nanoemulsion based on the previous studies conducted in our lab using
these types of oils with chemotherapeutic agent. The O/W nanoemulsions are versatile delivery
system based on the selection of single or combination therapeutic agents, type of oil used, and
the choice of surfactants for stabilization of the nano-sized oil droplets. In vitro studies were
performed to evaluate the intracellular accumulation of drugs using drug loaded nanoemulsion
and the enhancement in cell-kill efficacy and apoptotic response when drug and hyperoxia are
combined.
Our experimental hypotheses for the studies proposed are as follows: (1) stable
formulation of O/W nanoemulsion formulated to release the encapsulated drug (2) increasing the
oxygen were enhance drug accumulation in tumor cells when administered with nanoemulsion
37
and (3) the combination of drug and hyperoxia therapy were have a synergistic effect in
enhancing killing of tumor cell
2.3. Specific Aims
The specific aims that were evaluated in this MS dissertation project are:
Aim 1: Formulation and Characterization of Doxorubicin Stearate– Encapsulating
Oil-in-Water Nanoemulsion Formulation Systems
a) Synthesis and characterization of doxorubicin stearate (DOX stearate) salt using
doxorubicin hydrochloride and sodium stearate.
b) Preparation of blank and drug-loaded O/W nanoemulsions using omega-3 fatty acid rich
fish oil as the internal oil phase.
c) Encapsulation of DOX stearate in the nanoemulsion and characterization for size, surface
charge, particle morphology (by TEM), and the drug encapsulation efficiency.
Aim 2: Drug Uptake Studies and Reactive Oxygen Species Level Detection under
Different Incubation Conditions:
a) Establishment and maintenance of MDA-MB-231 human breast adenocarcinoma cells in
culture.
b) Qualitative Uptake studies of DOX Stearate in solution or in nanoemulsion by confocal
microscopy in MDA-MB-231 human breast cancer cell line under hypoxia, normoxia and
hyperoxia conditions.
c) Quantitative Uptake studies of DOX Stearate in solution or in nanoemulsion by confocal
microscopy in MDA-MB-231 human breast cancer cell line under hypoxia, normoxia and
hyperoxia conditions.
38
d) Determination of reactive oxygen species levels in MDA-MB-231 human breast cancer
cells under hypoxia, normoxia and hyperoxia.
Aim 3: Evaluation of Cytotoxicity and Apoptotic Activity of DOX Stearate Encapsulated
in Nanoemulsion and Hyperoxia Combination on MDA-MB-231 Human Breast
Adenocarcinoma Cells
a) Evaluation of cytotoxicity of DOX stearate in solution or in nanoemulsion using MTT
(formazan) assay and determination of IC50 values under hypoxia, normoxia, and
hyperoxia.
b) Quantitative evaluation of apoptotic activity of DOX stearate in solution or in
nanoemulsion with caspase 3/7 levels.
c) Qualitative evaluation of apoptotic activity of DOX stearate in solution or in
nanoemulsion using TUNEL (DNA fragmentation) assay.
e) Qualitative and quantitative analysis of the incubation conditions (i.e., hypoxia,
normoxia, and hyperoxia) on expression of hypoxia-inducing factor-alpha (HIF-1α)
mRNA by RT-PCR and qPCR.
f) Qualitative analysis of the incubation conditions (i.e., hypoxia, normoxia, and hyperoxia)
on expression of hypoxia-inducing factor-alpha (HIF-1α) protein by western blot.
39
3. EXPERIMENTAL DESIGN AND METHODS
3.1 Synthesis of Doxorubicin Stearate Complex
Doxorubicin hydrochloride (Axxora LLC, San Diego, CA) is a highly hydrophilic
anticancer drug and so it cannot be encapsulated in the hydrophobic phase of the oil-in-water
nanoemulsion. As such, a hydrophobic complex derivative, doxorubicin stearate (Figure 13C),
was prepared by reacting doxorubicin hydrochloride with sodium stearate. Also, since stearate is
a saturated fatty acid, it know to induce apoptosis in tumor cells via ceramide modulation [27].
Both, doxorubicin hydrochloride and sodium stearate were weighed according to 1:10 molar
ratio and dissolved in pH 8.6 borate buffer [28]. Sodium stearate is only sparingly soluble in cold
water and, therefore, the buffer was warmed and the fatty acid salt was slowly added until it
completely dissolved. Both the solutions were mixed and homogenized for 10 seconds. The
product formed was extracted by liquid-liquid extraction using methylene chloride as the organic
phase and borate buffer as the aqueous phase. Doxorubicin stearate was partitioned into the
organic phase and methylene chloride was evaporated to obtain the dry powder. 1H-NMR
analysis was done to confirm the presence of doxorubicin stearate in the final composition. Also
yield was calculated and powder was stored in a vial at 4oC. Desired stock solution was prepared
using methylene chloride as a solvent.
3.2 Preparation of Blank and Drug-Loaded Nanoemulsion Formulations
In order to develop a delivery vehicle for intracellular administration of doxorubicin
stearate in normoxic, hypoxic, and hyperoxic tumor cells, we formulated an oil-in-water
nanoemulsion system using EPA and DHA containing extra pure fish oil (Jedwards
International, Inc., Quincy, MA) as the inner hydrophobic phase and egg phosphatidylcholine
40
(Lipoid-E80®) as the primary emulsifier. Both blank and drug-loaded nanoemulsions were
prepared using the ultrasound method previously optimized in our lab [29, 30].
3.2.1. Blank Nanoemulsion: The aqueous phase consisted of 4 mL of de-ionized distilled
water, 120 mg of egg phoshotidylcholine (Lipoid® E80), and 15 mg of MPEG2000DSPE in a 20
mL glass scintillation vial. The aqueous phase was stirred for 30 minutes on the magnetic stirrer
for complete dissolution of both the components. In a separate vial, 1 gram of fish oil was
carefully measured. Both the vials are heated in a water bath at 70oC for approximately 10
minutes. Subsequently, the aqueous phase was added gradually into the oil phase and the
resulting mixture was ultrasonicated at 21% amplitude using the Sonics and Materials Vibra-Cell
VC 505® probe ultrasound instrument (Newtown, CT) for 10 minutes. The nanoemulsion formed
was transferred to a new vial and kept in a refrigerator at 4°C until further use.
3.2.2. Drug-Containing Nanoemulsion: Doxorubicin stearate was weighed accordingly to
give 1 mM final concentration and dissolved in methylene chloride. The stock solution was
added into a clean vial containing 1 gram of fish oil and methylene chloride was evaporated by
slowly passing nitrogen gas into the vial. Doxorubicin stearate was mixed thoroughly to insure
complete dissolution in the oil phase of the nanoemulsion. The aqueous phase was the same as
the one used to make blank nanoemulsion. After heating at 70oC, the aqueous phase was slowly
added and stirred with the oil phase and the resulting mixture was ultrasonicated at 21%
amplitude using the Vibra-Cell VC 505® probe ultrasound instrument for 10 minutes. The
nanoemulsions formed were transferred to a new vial covered with aluminum foil and stored in
the dark at 4°C until further use.
41
3.3 Characterization of the Nanoemulsion Formulations
Both blank and doxorubicin stearate-loaded nanoemulsions were characterized for oil
droplet size and size distribution, surface charge (zeta potential), and the morphology was
evaluated using transmission electron microscopy (TEM). For the drug-loaded nanoemulsion
formulation, the encapsulation efficiency of doxorubicin stearate was also determined.
3.3.1. Particle Size Analysis: Particle size and size distribution of the oil droplets in the
blank and drug-containing nanoemulsion formulations were determined using the ZetaSizer
(Malvern Instrument Inc., Westborough, MA). The ZetaSizer measures particle size using the
principle of dynamic light scattering (DLS). About 10 µl of the nanoemulsion sample was
diluted to 10 ml with deionized distilled water and the oil droplet size was determined at 90o
angle and at 25oC temperature. The average count rate was kept below 1 megaCPS. The mean
number diameter of the oil droplets was obtained on log-normal distribution mode. Both the
mean droplet diameter and the polydispersity index was measured and reported.
3.3.2. Zeta Potential: The surface charge values measure the relative stability of a
colloidal dispersion due to electrostatic repulsion. Zeta potential has also been correlated with
cellular uptake and biological performance of nanoparticle-based delivery systems. ZetaSizer
instrument (Malvern Instrument Inc., Westborough, AR) was used for measurement of zeta
potential. About 10 µl of the nanoemulsion sample was diluted to 10 ml with deionized water
and then placed in a specialized cuvette, which was connected to an electrode. The instrument
measures the elctrophoretic mobility of the oil droplets upon application of charge gradient. The
elctrophoretic mobility values were then converted to zeta potential using Henry’s Law equation
using built-in software, which follows, the Smoluchowski’s approximation.
42
3.3.3. TEM Analysis: TEM analysis was carried out in order to evaluate the morphology
of the oil droplet and confirm the size with the DLS measurements. About 50 μL of blank and
doxorubicin stearate-containing nanoemulsion formulations were placed on a Formwar-coated
copper grid (Electron Microscopy Sciences, Hatfield, PA) and were allowed to air-dry after
draining off the excess emulsion using a Whatman filter paper. Negative staining of the samples
was performed using uranyl acetate for 10 minutes at room temperature and the excess reagent
was drained off using a Whatman filter paper. The resulting thin film of the nanoemulsion
sample on the copper grid was observed with a JEOL 100-X transmission electron microscope
(Peabody, MA).
3.3.4. Drug Encapsulation Studies: The encapsulation efficiency of doxorubicin stearate
in the drug-containing nanoemulsion sample was determined by ultra-filtration method using
Amicon® ultra centrifugal filter devices (molecular weight cut-off 3000, Millipore, Bedford,
MA). The nanoemulsion sample (0.5 mL) was placed in the upper donor chamber and the unit
was centrifuged at 11,000 rpm for 30 minutes. A standard curve of the drug was obtained by
measuring the fluorescent intensity of five different concentration of doxorubicin hydrochloride.
Then, the concentration of doxorubicin stearate in the aqueous phase was estimated by
measuring the fluorescence at the excitation wavelength of 525 nm and emission wavelength of
645 nm using the Bio-Tek Instrument’s Synergy® HT (Winooski, VT) microplate reader. The
percentage of doxorubicin stearate remaining in the oil phase was calculated by mass balance
and was used for determine the encapsulation efficiency.
43
3.4 Establishment and Maintenance of MDA-MB 231 Triple Negative Human Breast
Adenocarcinoma Cells in Culture
3.4.1. Cell Culture Conditions: MDA-MB-231 triple negative human breast
adenocarcinoma cells obtained from ATCC (Manassas, VA), were grown in RPMI medium
supplemented with 10% fetal bovine serum and 5% penicillin/streptomycin. Cell cultures were
maintained in an incubator maintained at 5% CO2 and 37°C. Sub culturing was done by
detaching the monolayer from the culture flask by using 0.05% trypsin/EDTA.
3.4.2. Hypoxia and Hyperoxia Treatment. MDA-MB-231 human breast adenocarcinoma
cells were placed in an incubator and exposed to gas mixtures with different ratio of nitrogen,
carbon dioxide, and oxygen to simulate hypoxia, normoxia, and hyperoxia conditions in vitro
[26]. Prefilled gas mixtures in tanks used for this study were supplied by MED-TECH®
Gases
(Medford, MA).
For hypoxia, the gas mixture with 0.5% oxygen, 5% carbon dioxide, and 94.5% nitrogen
was used. For normoxic cell growth, 21% oxygen, 5% carbon dioxide, and 74% nitrogen was
used. Lastly two different oxygen concentrations were used for hyperoxia simulation. As such,
two different gas mixture with 40% and 60% oxygen were used having 5% carbon dioxide and
45% and 35% nitrogen, respectively. The cells were placed in T-25 flasks cultured and were
incubated in Modulator Incubator Chamber (Billups-Rothenberg, Inc., Del Mar, CA) and
chambers were filled with respective gases for hypoxia and hyperoxia treatments. Once the gas
chambers were filled with the gas mixtures, they were placed in the cell culture incubator for
specific time points.
44
3.5 Cellular Uptake Studies using Confocal Fluorescence Microscopy
DOX stearate containing nanoemulsion and solution (1mM) was prepared for cellular
uptake. DOX hydrochloride solution was used as a control. 20 µL of 1mM nanoemulsion or
solutions were diluted to 2 mL with the RPMI growth medium and the cellular uptake studies
were performed under hypoxia, normoxia and hyperoxia incubation conditions.
MDA MB 231 human breast adenocarcinoma cells were incubated in the culture flask,
harvested by trypsinization, and seeded in 6 well- plate with cover slip in place prior to the
seeding. The cell density was kept between 300,000 to 400,000 cells per well and were allowed
to adhere overnight. The media was removed and replaced with 2 mL of the DOX stearate
solution, DOX stearate nanoemulsion, and DOX hydrochloride solution. Plates were incubated
for 6 hours at 37oC under hypoxic, normoxic and hyperoxic (40% and 60%) conditions. After 6
hours of incubation, the wells were washed twice with chilled PBS to ensure complete removal
of the non-internalized emulsion or solutions. Nuclear stain was performed using Hoechst 33342
nucleic acid stain (Invitrogen, CA). Dye was diluted in ratio of 1:10000 in RPMI media and cell
were incubated with 2 ml of dye solution for 5 minutes. Again cells were washed twice with
chilled PBS. Then cells were fixed by adding 2 ml of cold 4% w/v paraformaldehyde (w/v) in
PBS and incubated at room temperature for 25 minutes. After the fixation, cells were washed
twice with cold PBS to ensure complete removal of Para formaldehyde to prevent crystal
formation. Then cover slip was mounted in invert position on slide using Fluor mount-GTM
. Zeiss
LSM 700 scanning confocal microscope was used to obtain images 40X magnification. Texas
Red® filter was used for DOX stearate and DAPI for the nuclear Stain. Media and Blank
nanoemulsion were used as negative control.
45
3.6 Quantitative Intracellular Drug Concentrations
To quantitate the intracellular concentrations, fluorescence spectroscopy and bicinchonic
acid (BCA) protein assay was performed whereby the concentrations of DOX stearate in the cells
were determined relative to the total amount of proteins in the cell. Standard curve for total
protein, DOX hydrochloride and DOX stearate was made.
Intracellular drug uptake studies were performed with DOX hydrochloride, DOX stearate
solution in dimethylsulfoxide (DMSO), and DOX stearate nanoemulsion at DOX concentrations
of 0.1 µM, 1 µM and 10 µM. About 100,000 cells were seeded in the 6-well plate and would be
allowed to adhere by incubating the plate overnight. The media was replaced with 2 ml of DOX
hydrochloride, DOX stearate solution and nanoemulsion in media at above three concentrations.
Plates were incubated for 6 hours at 37oC under hypoxic, normoxic, 40% and 60% hyperoxic
conditions. After 6 hours of incubation, the wells were washed twice with 1% PBS solution to
ensure complete removal of the non-internalized solution or emulsion. Cells were trypsinized
and pellet obtained was subjected to cell lysis buffer (as per cell lysis protocol). The supernatant
obtained was evaluated for the total amount of proteins using the BCA assay. To determine the
amount of doxorubicin stearate, 100 µL of the supernatant was diluted with 100 µL of DMSO
and the fluorescence intensity was measured at an excitation wavelength of 525 nm and emission
wavelength of 645 nm using Bio-Tek Instrument’s Synergy® HT microplate reader. The amount
of total proteins and DOX in DOX hydrochloride, DOX stearate solution and nanoemulsion in
the lysate was determined by extrapolating the readings obtained from the standard curve. The
final DOX stearate concentration was reported as ng of the drug per µg of total cellular protein.
46
3.7 Formation of Reactive Oxygen Species
To detect the reactive oxygen species levels in different incubation conditions hypoxia,
normoxia and hyperoxia, detection kit from Cell Technology was used. The kit is based on
principle of fluorescence spectroscopy. Hydroxyphenyl fluorescein (HPF) is the selective dye for
the detection of highly reactive oxygen species. (hROS). This dye fluorescence when comes in
contact with hROS (hydroxyl radical: OH-, Peroxynitrite: ONOO
-) and exhibit strong dose
dependent fluorescence.
About 7000 cells were seeded per 96 well plates and each plate was incubated for 3 days
under hypoxic, normoxic, 40% and 60% hyperoxic conditions. After 3 days, each plate was
washed with modified HBSS. HPF dye (5 mM) was diluted at ratio of 1:10 with HBSS and 4 µl
of the diluted dye was added per 200 µl of the media in each well. The final concentration of the
dye in the well was 10 µM. After the addition of the dye, plates were incubated for 60 minutes in
dark at room temperature. Fluorescence was measured at excitation wavelength of 488 nm and
emission wavelength of 515 nm using Bio-Tek Instrument’s Synergy® HT microplate reader.
3.8 Cytotoxicity with Combination Drug and Oxygen Therapies
DOX hydrochloride, DOX stearate solution in DMSO, and DOX stearate-loaded
nanoemulsion formulations was used to determine dose-dependent growth inhibitory effect on
MDA-MB-231 human breast cancer cells using MTT (formazan) assay. Various concentrations
ranging from 10 nM to 20 μM doxorubicin equivalent was prepared and the concentration
required to inhibit the cell growth by 50% (IC50) was determined using Graph Pad Prism®
4
software. DOX hydrochloride and DOX stearate were dissolved in DMSO to obtain 1 mM stock
solution and this was used for serial dilutions in the RPMI cell culture media to obtain graded
final concentrations of the drug solution. DOX stearate nanoemulsion was also diluted with
47
RPMI to obtain the graded concentrations. Approximately, 7,000 MDA-MB-231 cells per well
was seeded into a 96-well microplate and was allowed to adhere overnight. After the incubation,
the media was replaced with various concentrations of drug solutions and nanoemulsion
formulations. Treatment with 0.25 mg/mL poly (ethyleneimine) (molecular weight 10 kDa), a
cytotoxic cationic polymer, was used as a positive control. Negative control was treatment with
RPMI growth medium alone. To evaluate the effect of DMSO and emulsion components on cell
viability, the highest concentration of DMSO and blank nanoemulsion was also used as controls.
Eight replicates were made for each test condition and plates were incubated for 3 days under
hypoxia, normoxia, 40% and 60% hyperoxia. After 3 days, plates were washed with media thrice
and then media was replaced with 100 µL of MTT (1.0 mg/mL in RPMI) reagent and the plates
were incubated for 4 hours at 37oC. 150 µL DMSO was added to dissolve the insoluble formazan
crystals and absorbance was measured at 570 nm using Bio-Tek Instrument’s Synergy®
HT
microplate reader. The percentage cell viability values were determined relative to negative
control and IC50 values were calculated using Graph Pad Prism® 4 software.
3.9 Quantitative Apoptosis Studies by Caspase 3/7 Assay
For quantitative apoptotic analysis, MDA-MB 231 cells were seeded in 96-well
microplates at a density of 20,000 cells per well. Apoptosis was induced by treating the cells
with doxorubicin solution or doxorubicin stearate solution or doxorubicin stearate in
nanoemulsion under hypoxic, normoxic, 40% and 60 hyperoxic conditions. The concentrations
used were 0.1 µM, 1 µM and 10 µM. The cells were incubated for 6 hours at 37oC under
different oxygen conditions based on the treatment group, followed by wash with RPMI to
remove any drug that did not enter the cells and further incubation for 24 hours at 37oC. After
this period, 100 µL of the Apo-ONE® Caspase-3/7 substrate solution was added to each well
48
containing 100 µL of RPMI medium. The contents of wells were mixed using a plate shaker at
300-500 rpm for 2 hours at room temperature. Fluorescence of each well was measured at an
excitation wavelength of 490 nm and emission wavelength of 520 nm using a Bio-Tek
Instrument’s Synergy®
HT microplate reader. Caspase-3/7 activity was reported as percent
activation relative to untreated control.
3.10 Qualitative Apoptosis Studies by TUNEL Assay
3.10.1 Principle: Terminal deoxynucleotidyl transferase dUTP nick end labeling, known
as TUNEL assay is the method of detecting DNA fragments generated via apoptotic signal. This
system, end-labels fragmented DNA with biotinylated nucleotide at the 3’OH ends using the
recombinant Terminal Deoxynucleotidyl Transferase (rTdT) enzyme. Horseradish peroxidase-
labeled streptavidin (streptavidin-HRP) are then bound to the biotinylated nucleotide which is
detected using peroxidase substrate, hydrogen peroxide and the chromogen diaminobenzidine
(DAB), which confers the apoptotic nuclei brown color. A DeadEndTM
Colorimetric TUNEL
System kit from Promega Corporation (Madison, WI) was used for this study.
3.10.2. Procedure: About 100,000 cells were seeded on coverslip in the 6-well plate and
would be allowed to adhere by incubating the plate overnight. Cells were then dosed with 2 ml of
DOX hydrochloride solution, DOX stearate solution and nanoemulsion at concentration of 0.1
µM, 1 µM and 10 µM and incubated under hypoxia, normoxia, 40% and 60% hyperoxia for 24
hours. The cells were then washed twice with PBS and fixed by using 10% buffered formalin for
25 minutes at room temperature (RT) followed by washing twice in PBS for 5 minutes at RT.
The cells were then be permeabilized using 0.2% Triton® X-100 solution in PBS for 5 minutes at
RT followed by washing twice in PBS for 5 minutes each at RT. Some cells can be treated with
DNAase I which exposes multiple 3’-OH DNA and can be used as a positive control for detection
49
of DNA fragmentation. Excess liquid would be tapped off the slides, after which cells were
equilibrated for 5-10 minutes with 100 μL of equilibration buffer. 100 μL rTdT reaction mix per
coverslip was prepared using 98 μL of equilibration buffer + 1 μL of biotinylated nucleotide mix
+ 1 μL of rTdT enzyme. 100 μL of the rTdT reaction mix was added to the previously
equilibrated sections on the slide without allowing sections to dry and then covered with plate lid
to ensure even distribution which was incubated at 37oC, 5% CO2 for 60 minutes. The cover slips
were washed in 2X sodium chloride and sodium citrate (SSC) buffer for 15 minutes at RT. The
cells were washed twice in PBS for 5 minutes at RT to remove the unincorporated biotinylated
nucleotides and then immersed in 0.3% hydrogen peroxide solution in PBS at RT for 3-5 minutes
to block endogenous peroxidases. Again, the cells were washed twice in PBS for 5 minutes at
RT. 100 μL of diluted streptavidin-HRP (1:500 in PBS) was added per well followed by 30
minute incubation at RT. The cells were then washed twice by immersing in PBS for 5 minutes
at RT. 100 μL of freshly prepared DAB solution (50 µL DAB Substrate 20X Buffer + 950 µL
deionized water + 50 µL DAB 20X Chromogen + 50 µL Hydrogen Peroxide 20X) was added to
the sections until a light brown color develops. The cells were then be rinsed several times in
deionized water and then cover slips were mounted in permanent mounting medium and
observed under a light microscope.
3.11 HIF- 1α Expression Analysis by RT-PCR
The cells were placed in T-75 flasks cultured and were incubated in Modulator Incubator
Chamber (Billups-Rothenberg, Inc., Del Mar, CA) and chambers were filled with respective
gases for hypoxia and hyperoxia treatments. Once the gas chambers were filled with the gas
mixtures, they were placed in the cell culture incubator for specific time points (3 days).
50
3.11.1. RNA Extraction and Quantification: After exposure of the cells with hypoxia,
normoxia, and hyperoxia treatments, the RNA samples were isolated using High Pure RNA
Isolation Kit (Roche Applied Science, Mannheim, Germany) after 3 day and 5 day for the
respective treatment. All RNAs extracted were quantified using the Nano-Drop 2000 (Thermo
Scientific, Wilmington, DE). The RNA samples were stored in -80oC until further use.
3.11.2. Reverse Transcriptase Polymerase Chain Reaction: RT-PCR was carried out as
per the protocol mentioned in the One Step RT-PCR Kit (QIAGEN, Valencia, CA) using PCR
sprint Temperature Cycling System (Thermo Scientific, Rockford, IL). RT-PCR was performed
separately for the different markers like HIF 1α, VEGF, MMP-2, MMP-9 and GLUT1 each with
45 cycles. Beta-actin, used as a loading control, was run as a control for 35 cycles. The amplified
products were stored at -20 oC for further use.
3.11.3. Agarose Gel Electrophoresis: The amplified products obtained were identified
using 1.2% SYBR Safe®
E-Gels as per the protocol. After 30 minutes run, all gels were analyzed
using the Image J software for semi-quantitative analysis.
3.12 Western Blot Analysis of HIF- 1α Expression
The cells were placed in T-75 flasks cultured and were incubated in Modulator Incubator
Chamber (Billups-Rothenberg, Inc., Del Mar, CA) and chambers were filled with respective
gases for hypoxia and hyperoxia treatments. Once the gas chambers were filled with the gas
mixtures, they were placed in the cell culture incubator for specific time points (3 days). After
exposure of the cells with hypoxia, normoxia, and hyperoxia treatments, protein extraction was
carried out using NE-PER®
Nuclear and Cytoplasmic Extraction Reagents (Thermo Scientific,
IL, USA). Following the protocol in this kit, both nuclear and cytoplasmic protein extraction was
51
carried out. The total protein content was estimated using Pierce’s BCA protein quantitation
assay (Rockford, IL). A standard curve was constructed using bovine serum albumin. Protein
samples were kept in ice bucket, volume equivalent to 15 µg of protein was transfer to the
respective labeled 1.5ml tubes on ice. Equivalent volume of Laemmli sample buffer (Bio-Rad,
CA, USA) was added to each sample. All the samples were heated for 5 min at 90oC in a water
bath. After heating, tubes were transferred to ice bucket and samples were spinned briefly before
loading the gel. The denatured samples were loaded onto pre-cast 4-15% SDS-polyacrylamide
gel electrophoresis (PAGE) gradient gel (Bio-Rad, Hercules, CA). Gel was ran for 30 minutes at
200 V using Tris/Glycine/SDS running buffer and the protein bands were transferred on the
nitrocellulose membrane using the iBLOT device (Invitrogen, Carlsbad, CA). Now the
membrane was blocked with 5% blotto 1X TBS-T for one hour at room temperature. After
blocking, the membrane was washed thrice with 1X TBS-T for 5 minutes by rocking. Primary
antibody Rabbit monoclonal to HIF1 alpha (abcam Inc., Cambridge, MA) was diluted in a ratio
of 1:2000 using 1X TBS-T buffer and added on to the membrane and the membrane was rocked
overnight at 4oC. After incubating membrane overnight, primary antibody was removed and
membrane was washed thrice with 1x TBS-T buffer. Now, anti-rabbit IgG- HRP linked antibody
(Cell signaling Technology, MA, USA) was diluted to ration of 1:10000 using 1x TBS-T buffer
and added on the membrane and rocked at room temperature for 1 hour. Again, the membrane
was washed thrice with 1x TBS-T buffer. Finally, luminata forte western HRP substrate
(Millipore, USA) was added enough to cover the membrane and incubated in dark at room
temperature for 5 minutes. Then, the membrane was covered with plastic and chemiluminescent
bands were visualized using a Kodak imager (Carestream Health, Rochester, NY). Same
procedure was followed for the β-actin (house keeping) antibody.
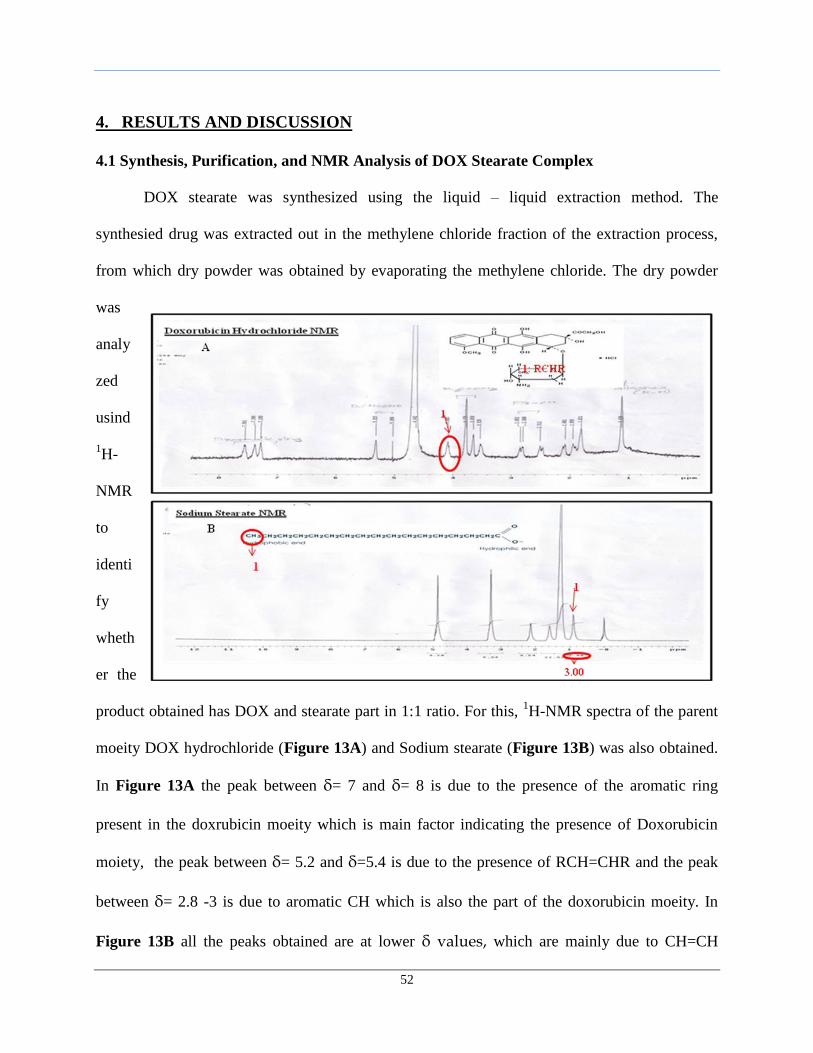
52
4. RESULTS AND DISCUSSION
4.1 Synthesis, Purification, and NMR Analysis of DOX Stearate Complex
DOX stearate was synthesized using the liquid – liquid extraction method. The
synthesied drug was extracted out in the methylene chloride fraction of the extraction process,
from which dry powder was obtained by evaporating the methylene chloride. The dry powder
was
analy
zed
usind
1H-
NMR
to
identi
fy
wheth
er the
product obtained has DOX and stearate part in 1:1 ratio. For this, 1H-NMR spectra of the parent
moeity DOX hydrochloride (Figure 13A) and Sodium stearate (Figure 13B) was also obtained.
In Figure 13A the peak between δ= 7 and δ= 8 is due to the presence of the aromatic ring
present in the doxrubicin moeity which is main factor indicating the presence of Doxorubicin
moiety, the peak between δ= 5.2 and δ=5.4 is due to the presence of RCH=CHR and the peak
between δ= 2.8 -3 is due to aromatic CH which is also the part of the doxorubicin moeity. In
Figure 13B all the peaks obtained are at lower δ values, which are mainly due to CH=CH
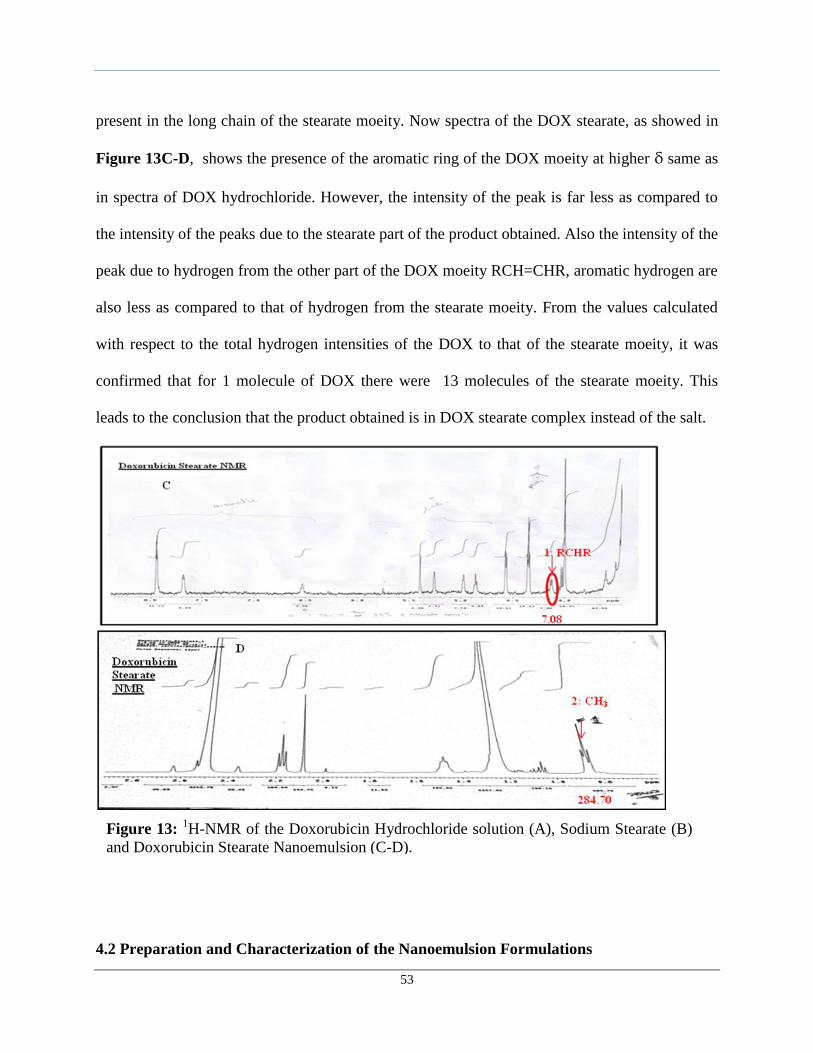
53
present in the long chain of the stearate moeity. Now spectra of the DOX stearate, as showed in
Figure 13C-D, shows the presence of the aromatic ring of the DOX moeity at higher δ same as
in spectra of DOX hydrochloride. However, the intensity of the peak is far less as compared to
the intensity of the peaks due to the stearate part of the product obtained. Also the intensity of the
peak due to hydrogen from the other part of the DOX moeity RCH=CHR, aromatic hydrogen are
also less as compared to that of hydrogen from the stearate moeity. From the values calculated
with respect to the total hydrogen intensities of the DOX to that of the stearate moeity, it was
confirmed that for 1 molecule of DOX there were 13 molecules of the stearate moeity. This
leads to the conclusion that the product obtained is in DOX stearate complex instead of the salt.
4.2 Preparation and Characterization of the Nanoemulsion Formulations
Figure 13: 1H-NMR of the Doxorubicin Hydrochloride solution (A), Sodium Stearate (B)
and Doxorubicin Stearate Nanoemulsion (C-D).
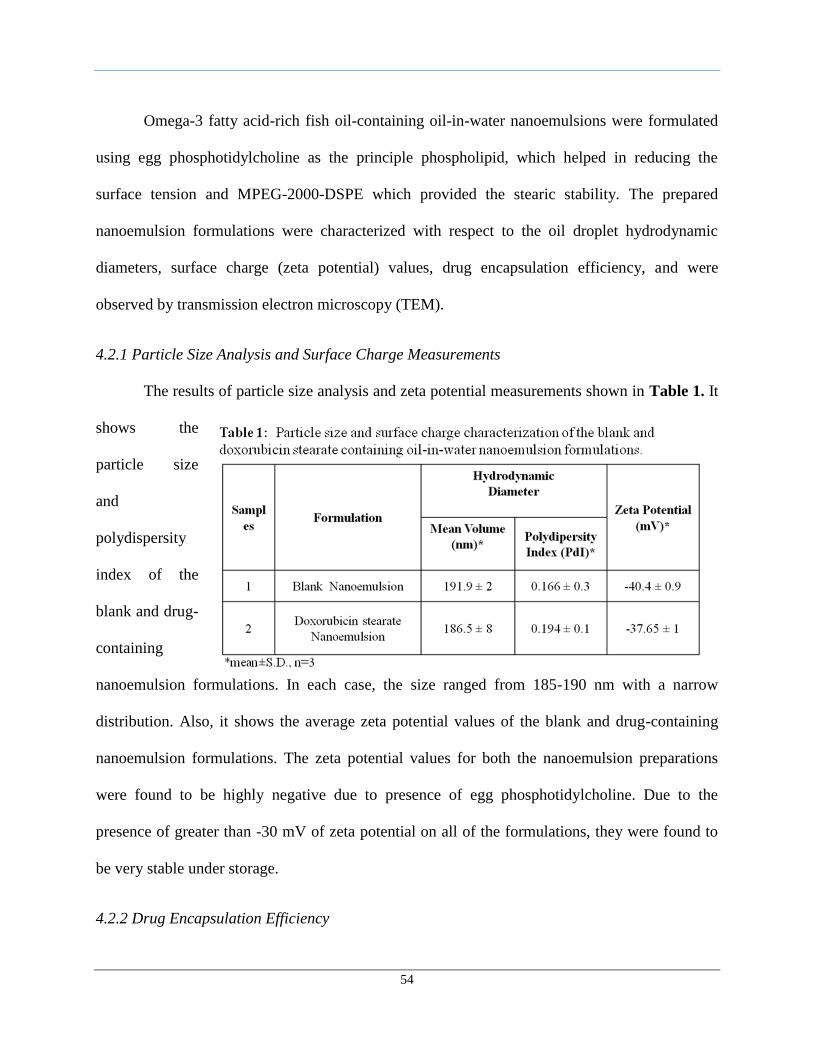
54
Omega-3 fatty acid-rich fish oil-containing oil-in-water nanoemulsions were formulated
using egg phosphotidylcholine as the principle phospholipid, which helped in reducing the
surface tension and MPEG-2000-DSPE which provided the stearic stability. The prepared
nanoemulsion formulations were characterized with respect to the oil droplet hydrodynamic
diameters, surface charge (zeta potential) values, drug encapsulation efficiency, and were
observed by transmission electron microscopy (TEM).
4.2.1 Particle Size Analysis and Surface Charge Measurements
The results of particle size analysis and zeta potential measurements shown in Table 1. It
shows the
particle size
and
polydispersity
index of the
blank and drug-
containing
nanoemulsion formulations. In each case, the size ranged from 185-190 nm with a narrow
distribution. Also, it shows the average zeta potential values of the blank and drug-containing
nanoemulsion formulations. The zeta potential values for both the nanoemulsion preparations
were found to be highly negative due to presence of egg phosphotidylcholine. Due to the
presence of greater than -30 mV of zeta potential on all of the formulations, they were found to
be very stable under storage.
4.2.2 Drug Encapsulation Efficiency
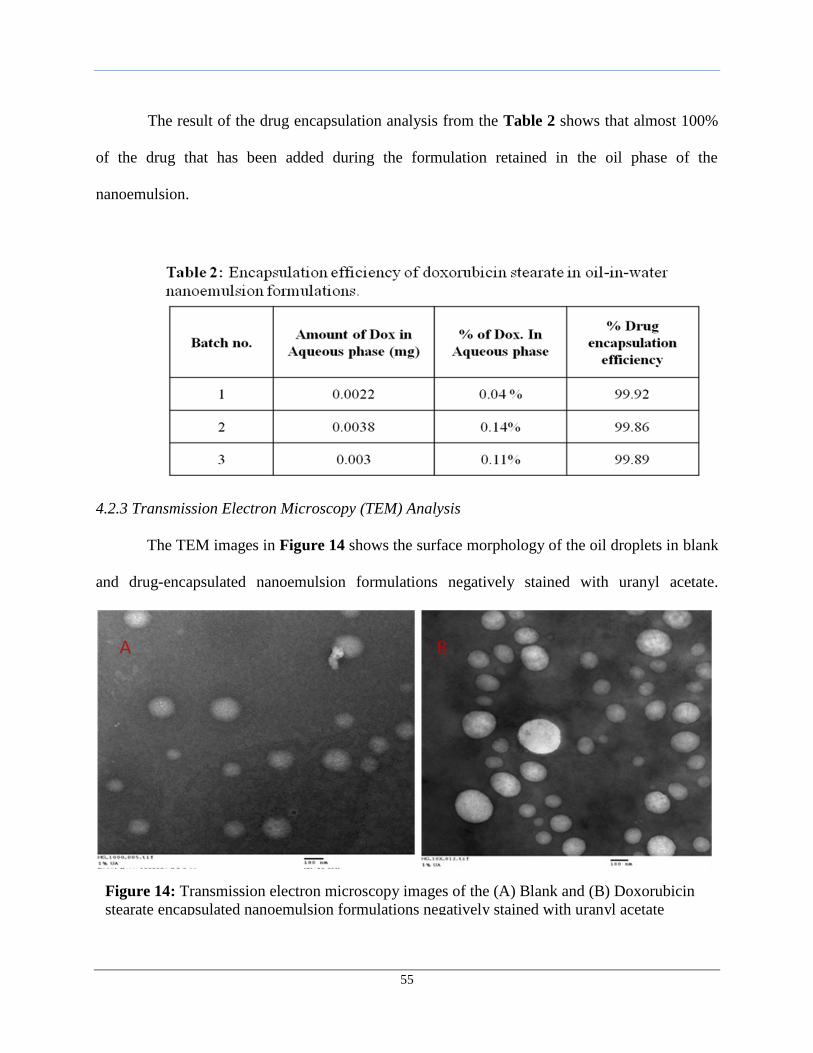
55
The result of the drug encapsulation analysis from the Table 2 shows that almost 100%
of the drug that has been added during the formulation retained in the oil phase of the
nanoemulsion.
4.2.3 Transmission Electron Microscopy (TEM) Analysis
The TEM images in Figure 14 shows the surface morphology of the oil droplets in blank
and drug-encapsulated nanoemulsion formulations negatively stained with uranyl acetate.
Figure 14: Transmission electron microscopy images of the (A) Blank and (B) Doxorubicin
stearate encapsulated nanoemulsion formulations negatively stained with uranyl acetate
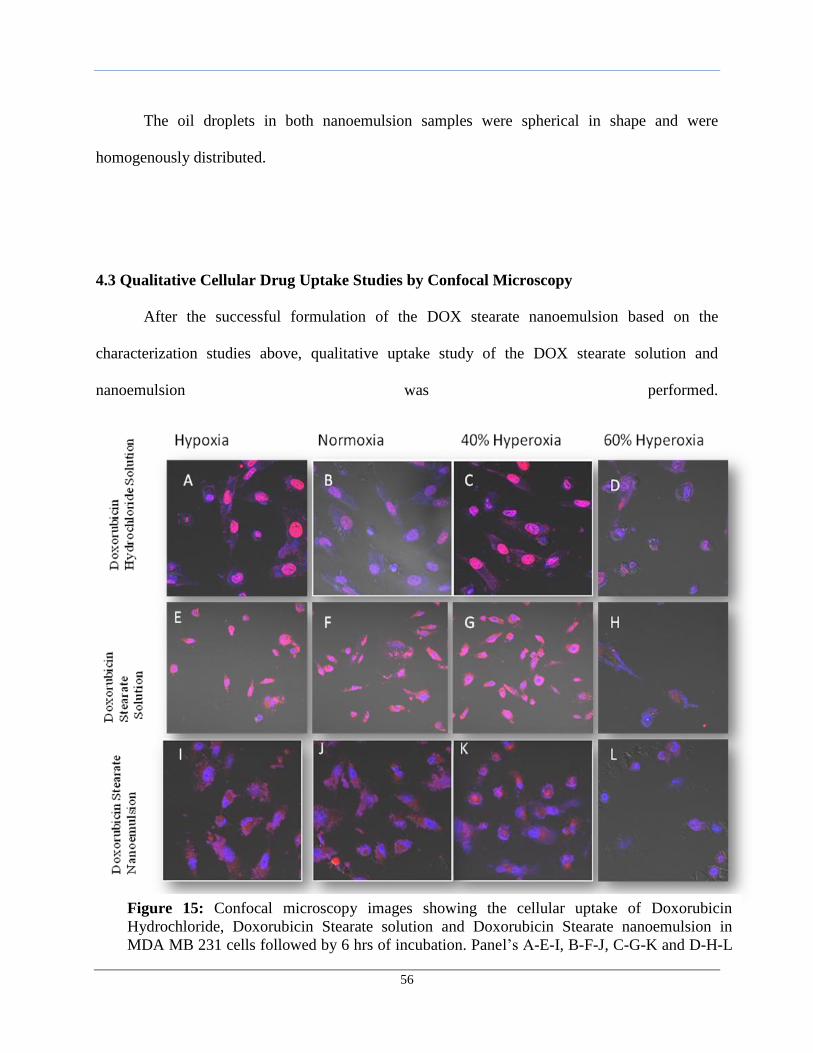
56
The oil droplets in both nanoemulsion samples were spherical in shape and were
homogenously distributed.
4.3 Qualitative Cellular Drug Uptake Studies by Confocal Microscopy
After the successful formulation of the DOX stearate nanoemulsion based on the
characterization studies above, qualitative uptake study of the DOX stearate solution and
nanoemulsion was performed.
Figure 15: Confocal microscopy images showing the cellular uptake of Doxorubicin
Hydrochloride, Doxorubicin Stearate solution and Doxorubicin Stearate nanoemulsion in
MDA MB 231 cells followed by 6 hrs of incubation. Panel’s A-E-I, B-F-J, C-G-K and D-H-L
shows uptake under hypoxic, normoxic, 40% and 60% hyperoxic conditions respectively.
Magnification used was 40X.
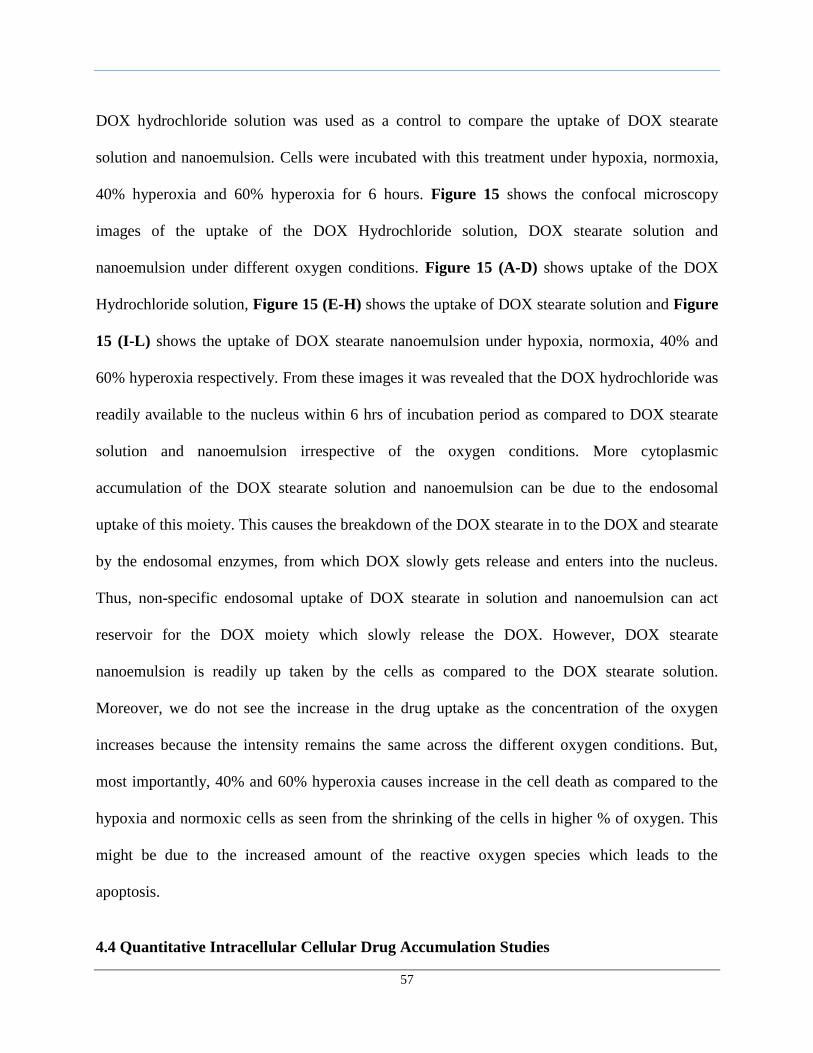
57
DOX hydrochloride solution was used as a control to compare the uptake of DOX stearate
solution and nanoemulsion. Cells were incubated with this treatment under hypoxia, normoxia,
40% hyperoxia and 60% hyperoxia for 6 hours. Figure 15 shows the confocal microscopy
images of the uptake of the DOX Hydrochloride solution, DOX stearate solution and
nanoemulsion under different oxygen conditions. Figure 15 (A-D) shows uptake of the DOX
Hydrochloride solution, Figure 15 (E-H) shows the uptake of DOX stearate solution and Figure
15 (I-L) shows the uptake of DOX stearate nanoemulsion under hypoxia, normoxia, 40% and
60% hyperoxia respectively. From these images it was revealed that the DOX hydrochloride was
readily available to the nucleus within 6 hrs of incubation period as compared to DOX stearate
solution and nanoemulsion irrespective of the oxygen conditions. More cytoplasmic
accumulation of the DOX stearate solution and nanoemulsion can be due to the endosomal
uptake of this moiety. This causes the breakdown of the DOX stearate in to the DOX and stearate
by the endosomal enzymes, from which DOX slowly gets release and enters into the nucleus.
Thus, non-specific endosomal uptake of DOX stearate in solution and nanoemulsion can act
reservoir for the DOX moiety which slowly release the DOX. However, DOX stearate
nanoemulsion is readily up taken by the cells as compared to the DOX stearate solution.
Moreover, we do not see the increase in the drug uptake as the concentration of the oxygen
increases because the intensity remains the same across the different oxygen conditions. But,
most importantly, 40% and 60% hyperoxia causes increase in the cell death as compared to the
hypoxia and normoxic cells as seen from the shrinking of the cells in higher % of oxygen. This
might be due to the increased amount of the reactive oxygen species which leads to the
apoptosis.
4.4 Quantitative Intracellular Cellular Drug Accumulation Studies
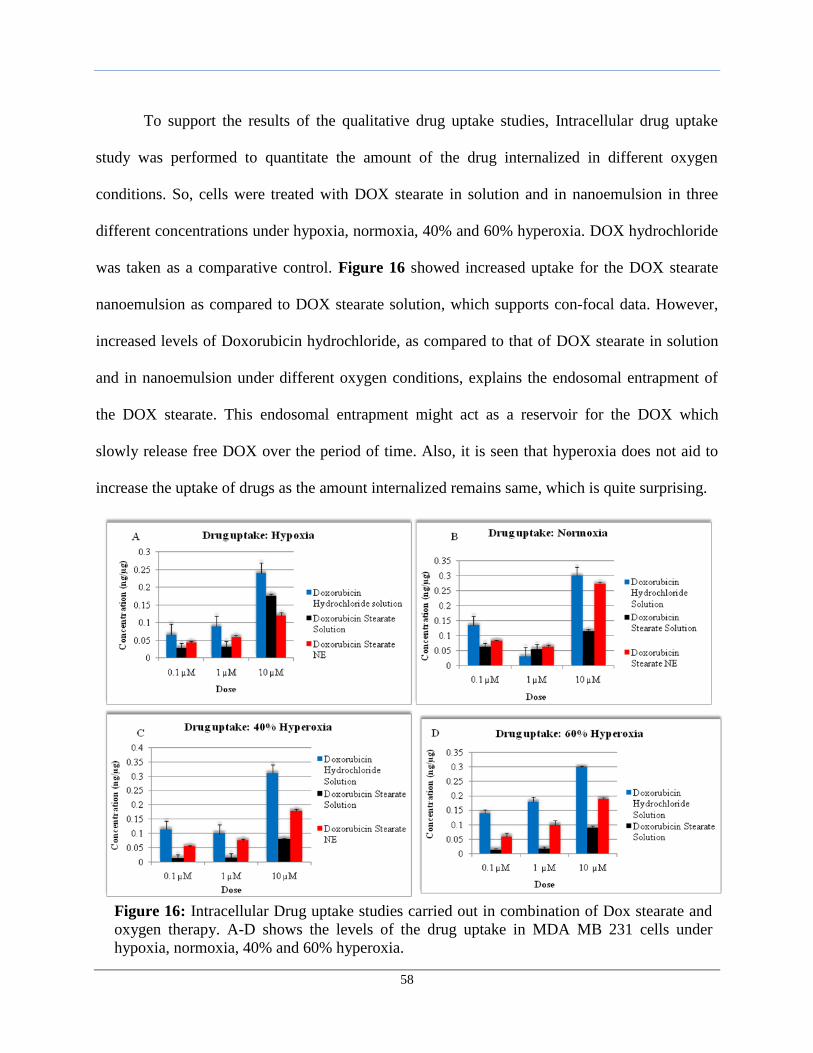
58
To support the results of the qualitative drug uptake studies, Intracellular drug uptake
study was performed to quantitate the amount of the drug internalized in different oxygen
conditions. So, cells were treated with DOX stearate in solution and in nanoemulsion in three
different concentrations under hypoxia, normoxia, 40% and 60% hyperoxia. DOX hydrochloride
was taken as a comparative control. Figure 16 showed increased uptake for the DOX stearate
nanoemulsion as compared to DOX stearate solution, which supports con-focal data. However,
increased levels of Doxorubicin hydrochloride, as compared to that of DOX stearate in solution
and in nanoemulsion under different oxygen conditions, explains the endosomal entrapment of
the DOX stearate. This endosomal entrapment might act as a reservoir for the DOX which
slowly release free DOX over the period of time. Also, it is seen that hyperoxia does not aid to
increase the uptake of drugs as the amount internalized remains same, which is quite surprising.
Figure 16: Intracellular Drug uptake studies carried out in combination of Dox stearate and
oxygen therapy. A-D shows the levels of the drug uptake in MDA MB 231 cells under
hypoxia, normoxia, 40% and 60% hyperoxia.
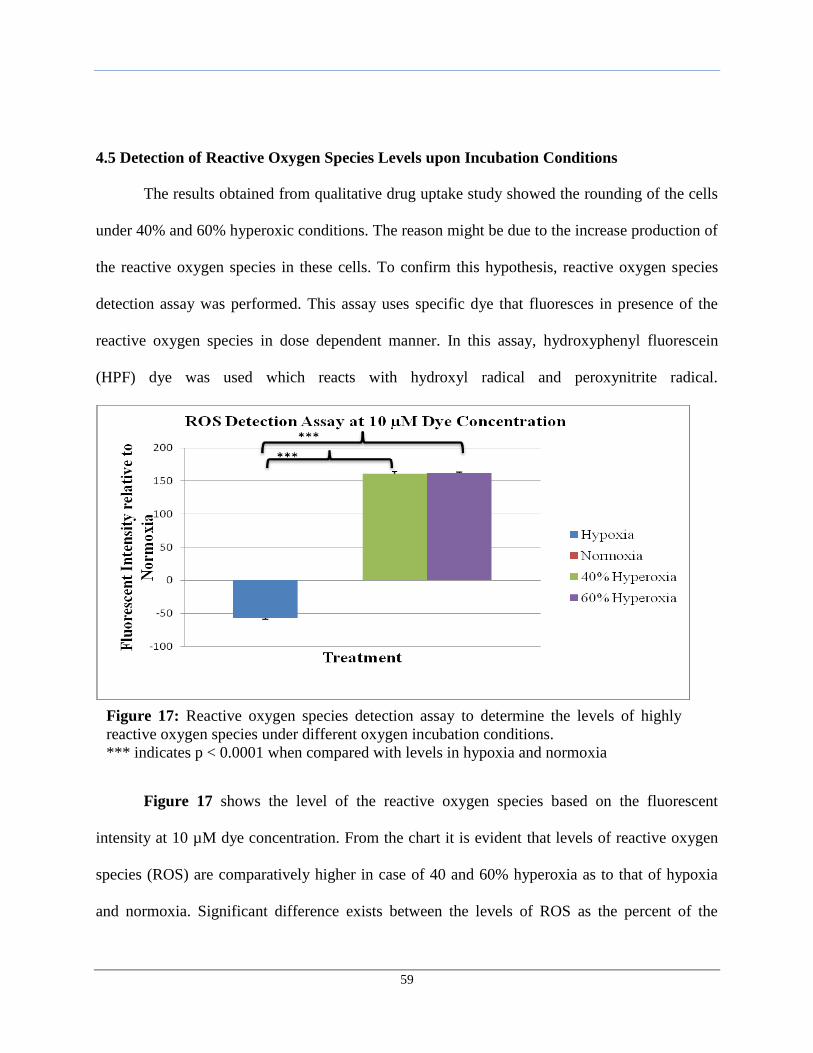
59
4.5 Detection of Reactive Oxygen Species Levels upon Incubation Conditions
The results obtained from qualitative drug uptake study showed the rounding of the cells
under 40% and 60% hyperoxic conditions. The reason might be due to the increase production of
the reactive oxygen species in these cells. To confirm this hypothesis, reactive oxygen species
detection assay was performed. This assay uses specific dye that fluoresces in presence of the
reactive oxygen species in dose dependent manner. In this assay, hydroxyphenyl fluorescein
(HPF) dye was used which reacts with hydroxyl radical and peroxynitrite radical.
Figure 17 shows the level of the reactive oxygen species based on the fluorescent
intensity at 10 µM dye concentration. From the chart it is evident that levels of reactive oxygen
species (ROS) are comparatively higher in case of 40 and 60% hyperoxia as to that of hypoxia
and normoxia. Significant difference exists between the levels of ROS as the percent of the
Figure 17: Reactive oxygen species detection assay to determine the levels of highly
reactive oxygen species under different oxygen incubation conditions.
*** indicates p < 0.0001 when compared with levels in hypoxia and normoxia
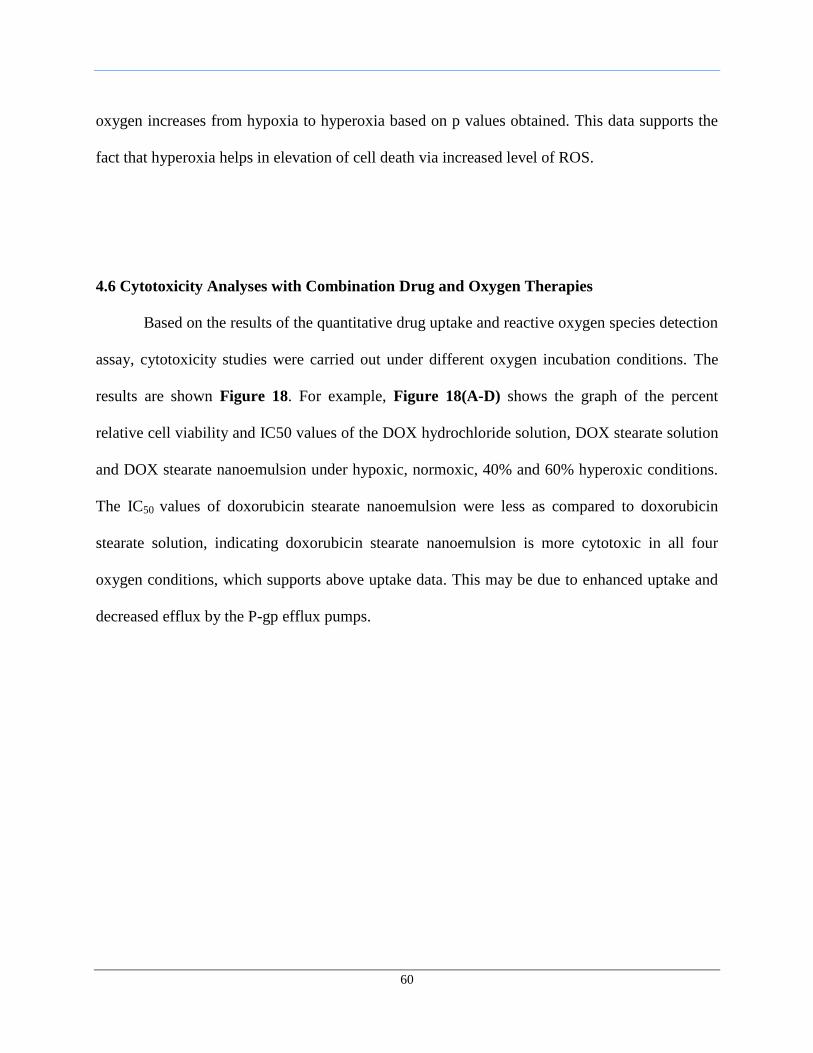
60
oxygen increases from hypoxia to hyperoxia based on p values obtained. This data supports the
fact that hyperoxia helps in elevation of cell death via increased level of ROS.
4.6 Cytotoxicity Analyses with Combination Drug and Oxygen Therapies
Based on the results of the quantitative drug uptake and reactive oxygen species detection
assay, cytotoxicity studies were carried out under different oxygen incubation conditions. The
results are shown Figure 18. For example, Figure 18(A-D) shows the graph of the percent
relative cell viability and IC50 values of the DOX hydrochloride solution, DOX stearate solution
and DOX stearate nanoemulsion under hypoxic, normoxic, 40% and 60% hyperoxic conditions.
The IC50 values of doxorubicin stearate nanoemulsion were less as compared to doxorubicin
stearate solution, indicating doxorubicin stearate nanoemulsion is more cytotoxic in all four
oxygen conditions, which supports above uptake data. This may be due to enhanced uptake and
decreased efflux by the P-gp efflux pumps.
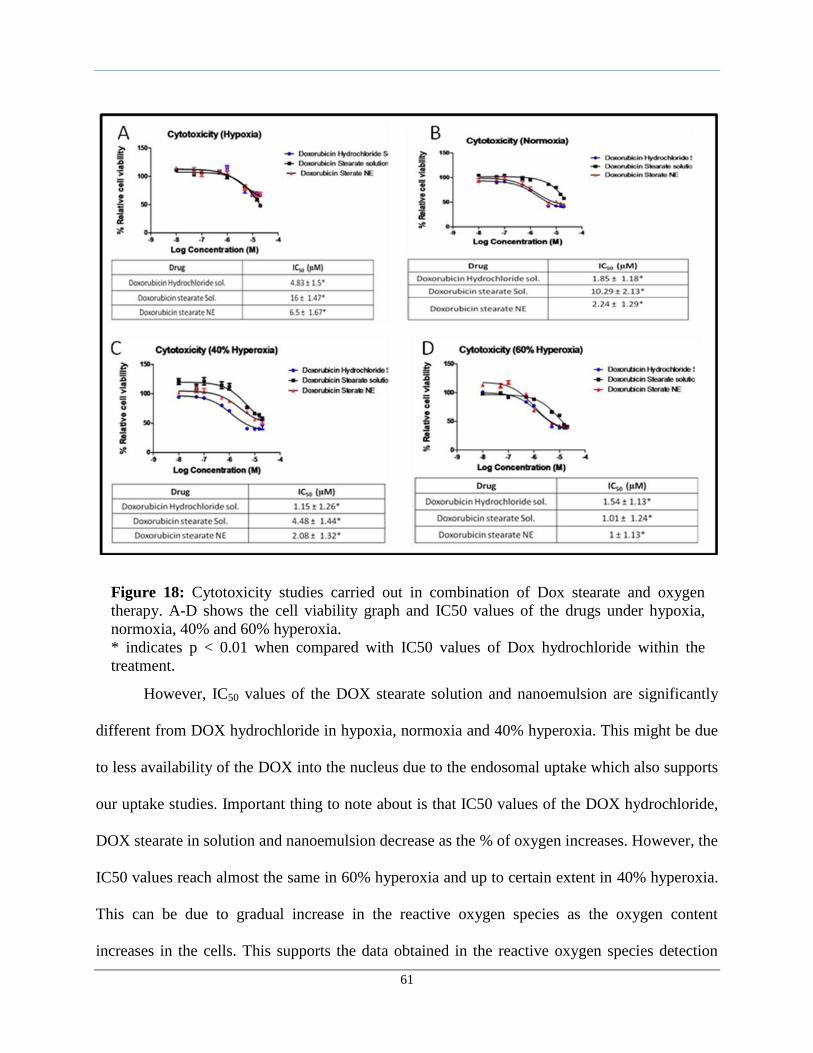
61
However, IC50 values of the DOX stearate solution and nanoemulsion are significantly
different from DOX hydrochloride in hypoxia, normoxia and 40% hyperoxia. This might be due
to less availability of the DOX into the nucleus due to the endosomal uptake which also supports
our uptake studies. Important thing to note about is that IC50 values of the DOX hydrochloride,
DOX stearate in solution and nanoemulsion decrease as the % of oxygen increases. However, the
IC50 values reach almost the same in 60% hyperoxia and up to certain extent in 40% hyperoxia.
This can be due to gradual increase in the reactive oxygen species as the oxygen content
increases in the cells. This supports the data obtained in the reactive oxygen species detection
Figure 18: Cytotoxicity studies carried out in combination of Dox stearate and oxygen
therapy. A-D shows the cell viability graph and IC50 values of the drugs under hypoxia,
normoxia, 40% and 60% hyperoxia.
* indicates p < 0.01 when compared with IC50 values of Dox hydrochloride within the
treatment.
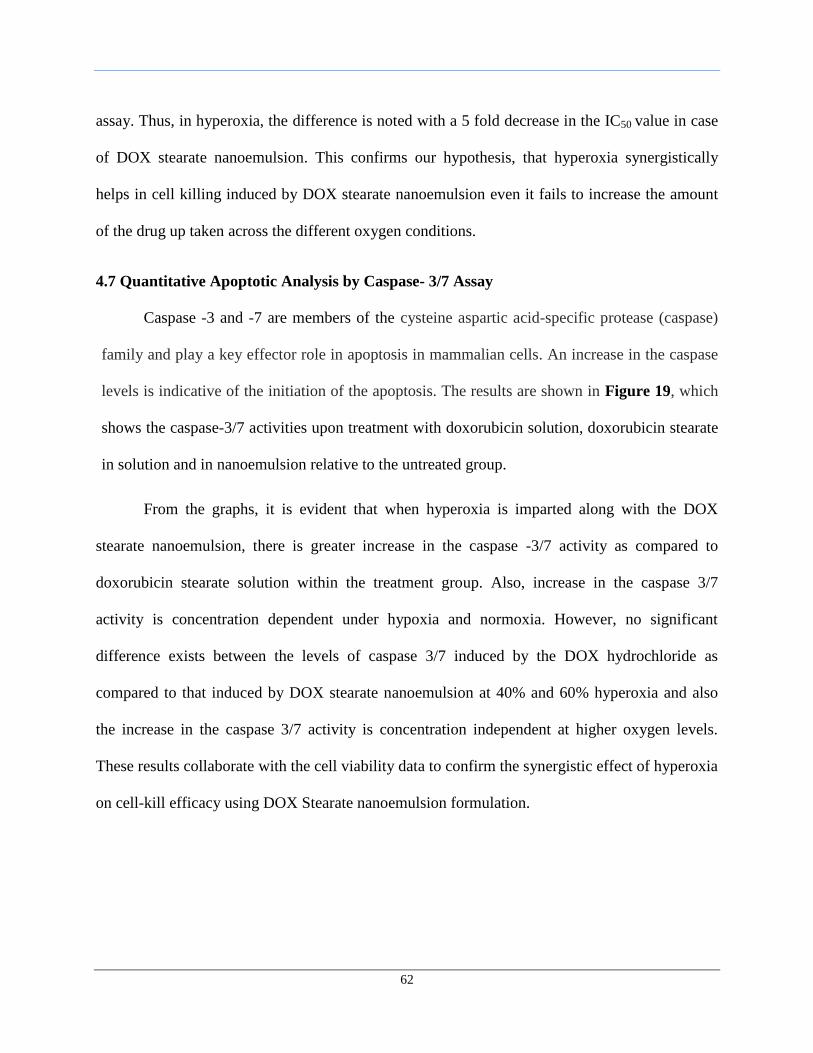
62
assay. Thus, in hyperoxia, the difference is noted with a 5 fold decrease in the IC50 value in case
of DOX stearate nanoemulsion. This confirms our hypothesis, that hyperoxia synergistically
helps in cell killing induced by DOX stearate nanoemulsion even it fails to increase the amount
of the drug up taken across the different oxygen conditions.
4.7 Quantitative Apoptotic Analysis by Caspase- 3/7 Assay
Caspase -3 and -7 are members of the cysteine aspartic acid-specific protease (caspase)
family and play a key effector role in apoptosis in mammalian cells. An increase in the caspase
levels is indicative of the initiation of the apoptosis. The results are shown in Figure 19, which
shows the caspase-3/7 activities upon treatment with doxorubicin solution, doxorubicin stearate
in solution and in nanoemulsion relative to the untreated group.
From the graphs, it is evident that when hyperoxia is imparted along with the DOX
stearate nanoemulsion, there is greater increase in the caspase -3/7 activity as compared to
doxorubicin stearate solution within the treatment group. Also, increase in the caspase 3/7
activity is concentration dependent under hypoxia and normoxia. However, no significant
difference exists between the levels of caspase 3/7 induced by the DOX hydrochloride as
compared to that induced by DOX stearate nanoemulsion at 40% and 60% hyperoxia and also
the increase in the caspase 3/7 activity is concentration independent at higher oxygen levels.
These results collaborate with the cell viability data to confirm the synergistic effect of hyperoxia
on cell-kill efficacy using DOX Stearate nanoemulsion formulation.
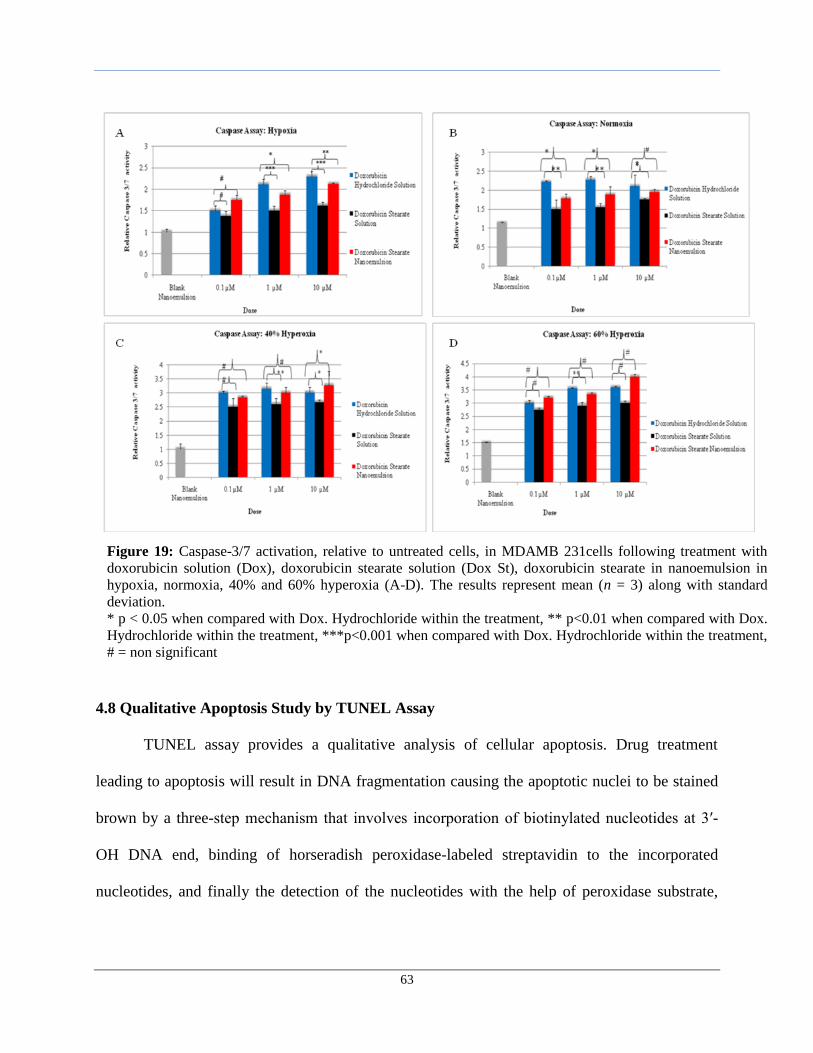
63
4.8 Qualitative Apoptosis Study by TUNEL Assay
TUNEL assay provides a qualitative analysis of cellular apoptosis. Drug treatment
leading to apoptosis will result in DNA fragmentation causing the apoptotic nuclei to be stained
brown by a three-step mechanism that involves incorporation of biotinylated nucleotides at 3′-
OH DNA end, binding of horseradish peroxidase-labeled streptavidin to the incorporated
nucleotides, and finally the detection of the nucleotides with the help of peroxidase substrate,
Figure 19: Caspase-3/7 activation, relative to untreated cells, in MDAMB 231cells following treatment with
doxorubicin solution (Dox), doxorubicin stearate solution (Dox St), doxorubicin stearate in nanoemulsion in
hypoxia, normoxia, 40% and 60% hyperoxia (A-D). The results represent mean (n = 3) along with standard
deviation.
* p < 0.05 when compared with Dox. Hydrochloride within the treatment, ** p<0.01 when compared with Dox.
Hydrochloride within the treatment, ***p<0.001 when compared with Dox. Hydrochloride within the treatment,
# = non significant
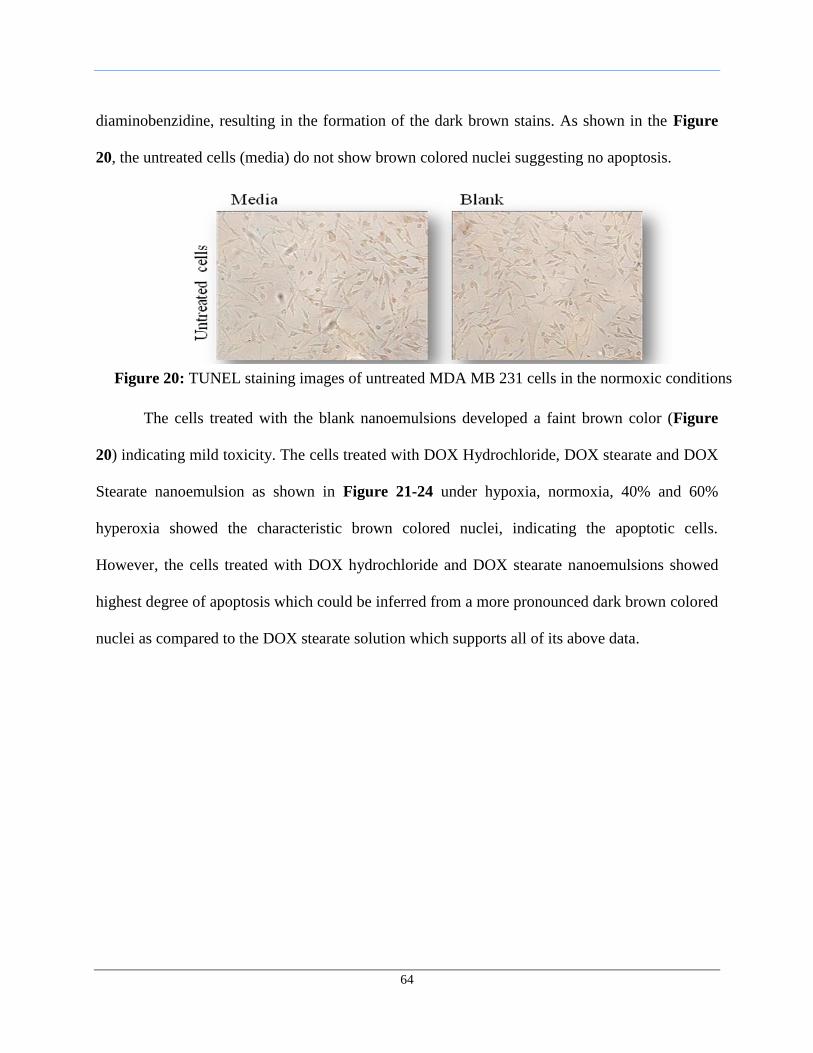
64
diaminobenzidine, resulting in the formation of the dark brown stains. As shown in the Figure
20, the untreated cells (media) do not show brown colored nuclei suggesting no apoptosis.
The cells treated with the blank nanoemulsions developed a faint brown color (Figure
20) indicating mild toxicity. The cells treated with DOX Hydrochloride, DOX stearate and DOX
Stearate nanoemulsion as shown in Figure 21-24 under hypoxia, normoxia, 40% and 60%
hyperoxia showed the characteristic brown colored nuclei, indicating the apoptotic cells.
However, the cells treated with DOX hydrochloride and DOX stearate nanoemulsions showed
highest degree of apoptosis which could be inferred from a more pronounced dark brown colored
nuclei as compared to the DOX stearate solution which supports all of its above data.
Figure 20: TUNEL staining images of untreated MDA MB 231 cells in the normoxic conditions
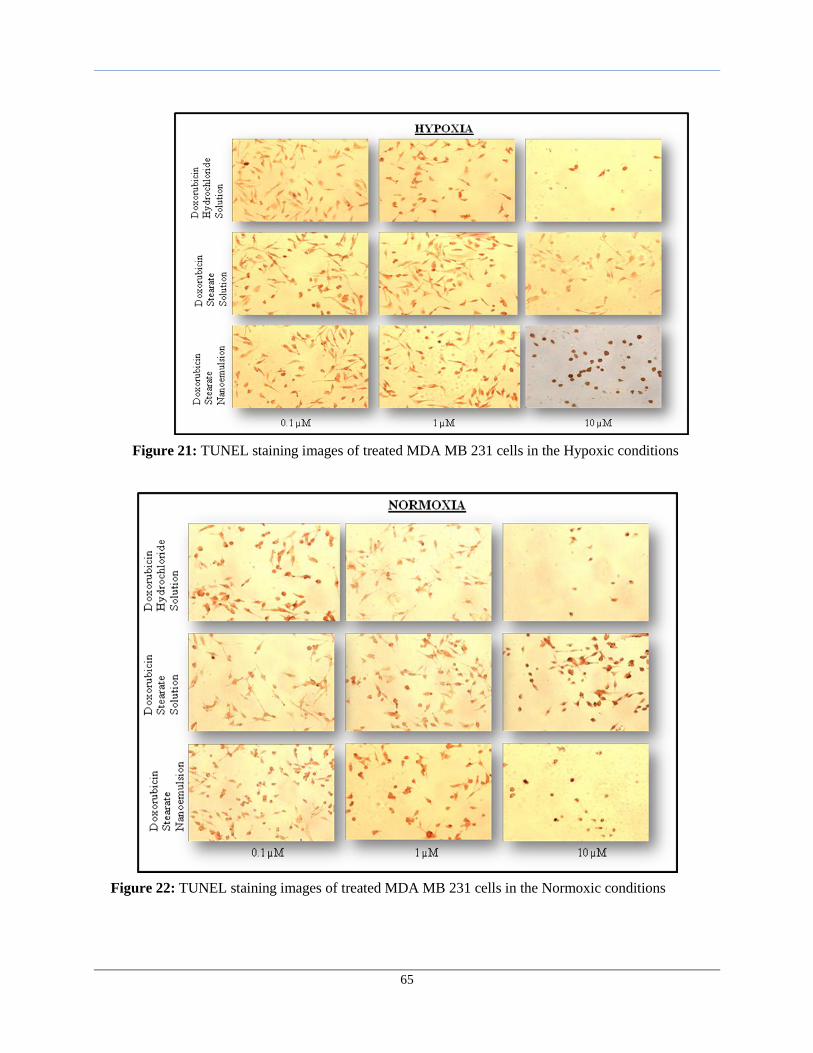
65
Figure 21: TUNEL staining images of treated MDA MB 231 cells in the Hypoxic conditions
Figure 22: TUNEL staining images of treated MDA MB 231 cells in the Normoxic conditions
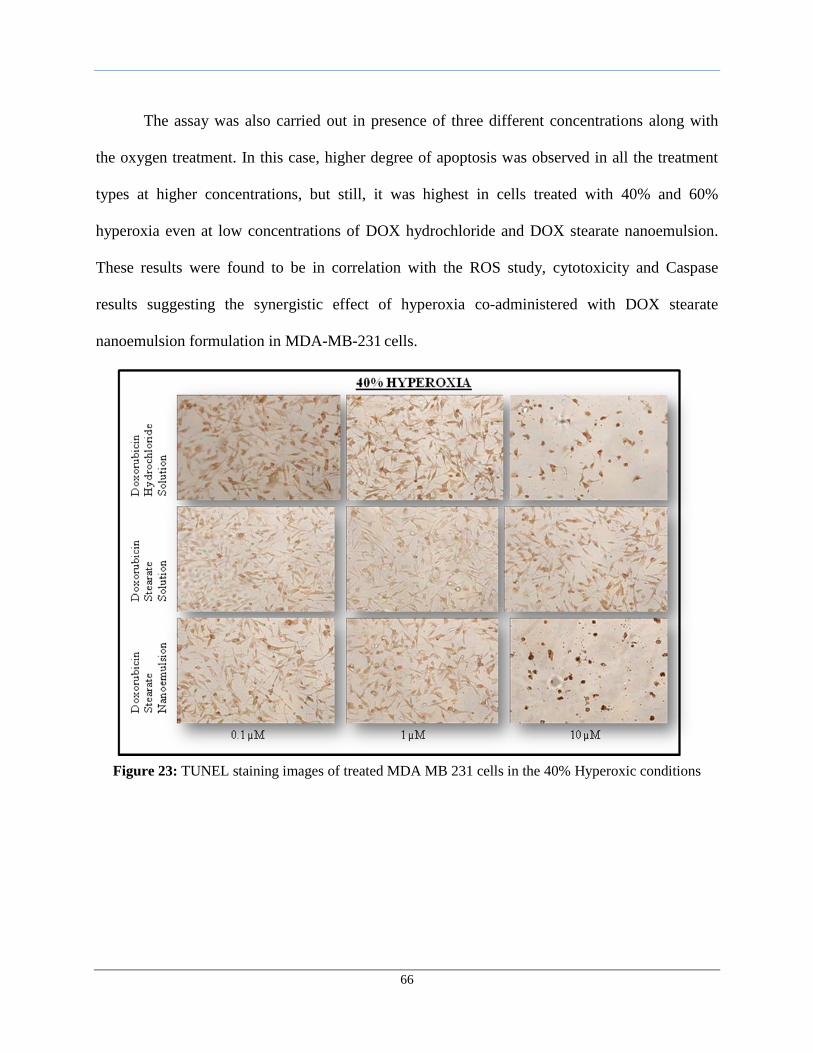
66
The assay was also carried out in presence of three different concentrations along with
the oxygen treatment. In this case, higher degree of apoptosis was observed in all the treatment
types at higher concentrations, but still, it was highest in cells treated with 40% and 60%
hyperoxia even at low concentrations of DOX hydrochloride and DOX stearate nanoemulsion.
These results were found to be in correlation with the ROS study, cytotoxicity and Caspase
results suggesting the synergistic effect of hyperoxia co-administered with DOX stearate
nanoemulsion formulation in MDA-MB-231 cells.
Figure 23: TUNEL staining images of treated MDA MB 231 cells in the 40% Hyperoxic conditions
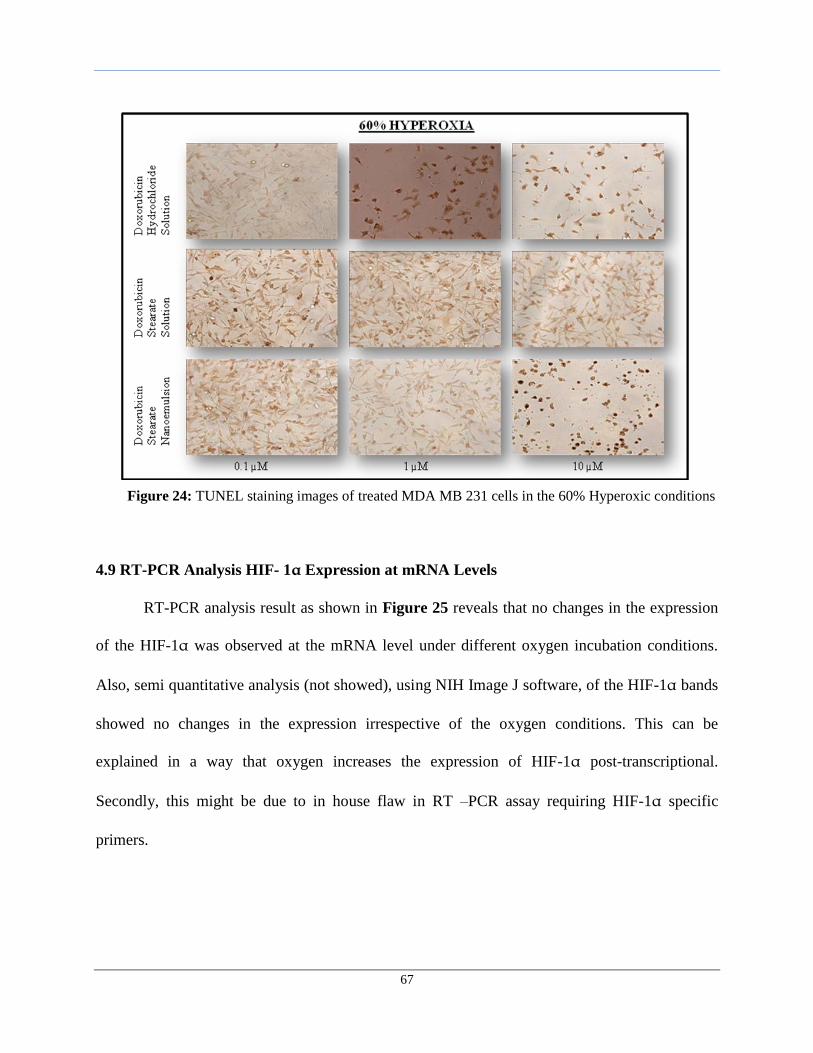
67
4.9 RT-PCR Analysis HIF- 1α Expression at mRNA Levels
RT-PCR analysis result as shown in Figure 25 reveals that no changes in the expression
of the HIF-1α was observed at the mRNA level under different oxygen incubation conditions.
Also, semi quantitative analysis (not showed), using NIH Image J software, of the HIF-1α bands
showed no changes in the expression irrespective of the oxygen conditions. This can be
explained in a way that oxygen increases the expression of HIF-1α post-transcriptional.
Secondly, this might be due to in house flaw in RT –PCR assay requiring HIF-1α specific
primers.
Figure 24: TUNEL staining images of treated MDA MB 231 cells in the 60% Hyperoxic conditions
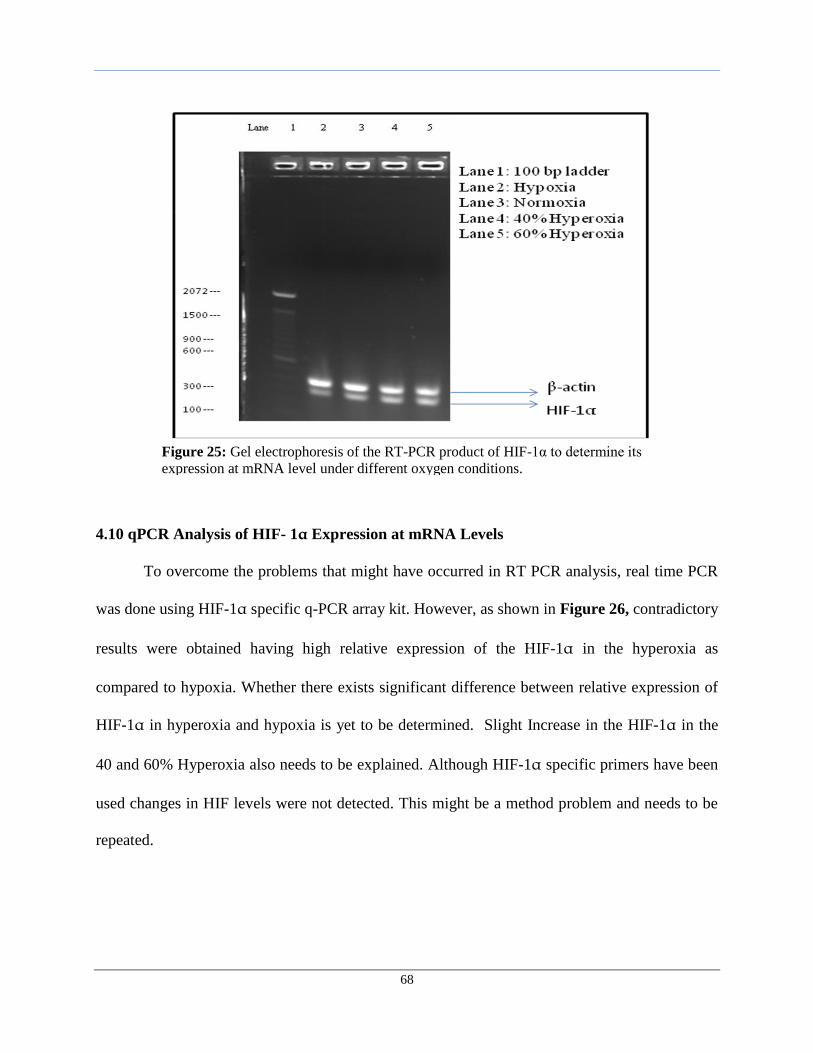
68
4.10 qPCR Analysis of HIF- 1α Expression at mRNA Levels
To overcome the problems that might have occurred in RT PCR analysis, real time PCR
was done using HIF-1α specific q-PCR array kit. However, as shown in Figure 26, contradictory
results were obtained having high relative expression of the HIF-1α in the hyperoxia as
compared to hypoxia. Whether there exists significant difference between relative expression of
HIF-1α in hyperoxia and hypoxia is yet to be determined. Slight Increase in the HIF-1α in the
40 and 60% Hyperoxia also needs to be explained. Although HIF-1α specific primers have been
used changes in HIF levels were not detected. This might be a method problem and needs to be
repeated.
Figure 25: Gel electrophoresis of the RT-PCR product of HIF-1α to determine its
expression at mRNA level under different oxygen conditions.
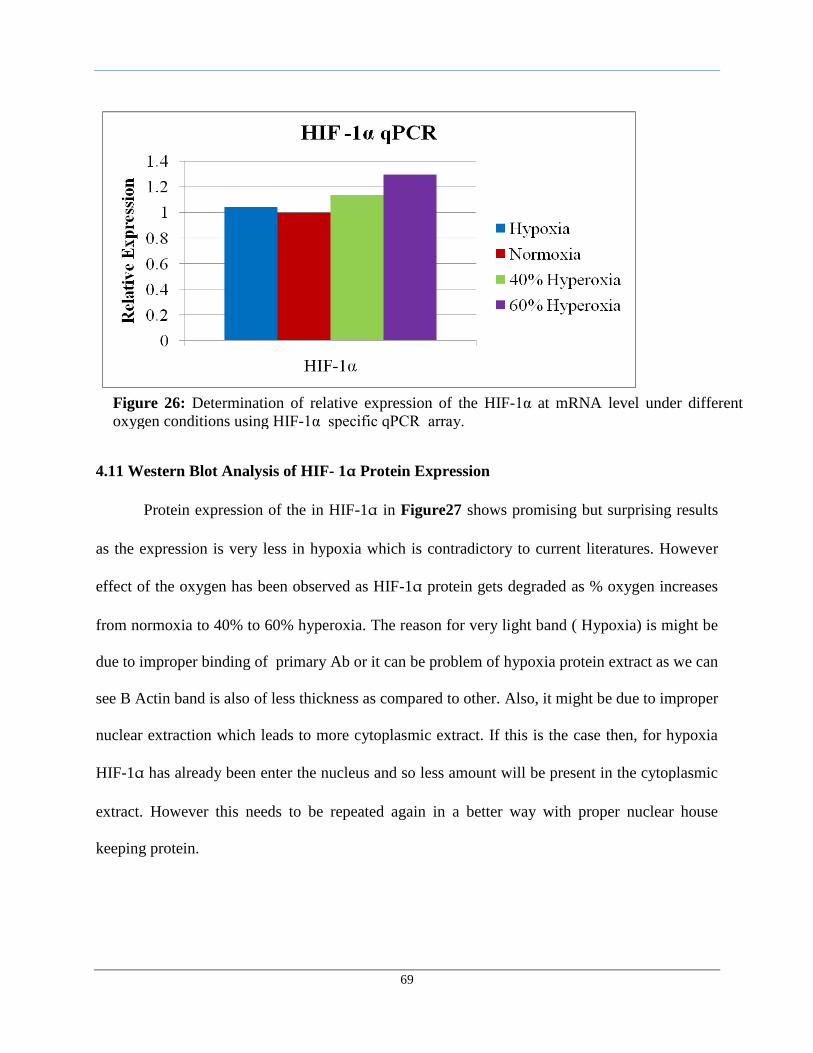
69
4.11 Western Blot Analysis of HIF- 1α Protein Expression
Protein expression of the in HIF-1α in Figure27 shows promising but surprising results
as the expression is very less in hypoxia which is contradictory to current literatures. However
effect of the oxygen has been observed as HIF-1α protein gets degraded as % oxygen increases
from normoxia to 40% to 60% hyperoxia. The reason for very light band ( Hypoxia) is might be
due to improper binding of primary Ab or it can be problem of hypoxia protein extract as we can
see B Actin band is also of less thickness as compared to other. Also, it might be due to improper
nuclear extraction which leads to more cytoplasmic extract. If this is the case then, for hypoxia
HIF-1α has already been enter the nucleus and so less amount will be present in the cytoplasmic
extract. However this needs to be repeated again in a better way with proper nuclear house
keeping protein.
Figure 26: Determination of relative expression of the HIF-1α at mRNA level under different
oxygen conditions using HIF-1α specific qPCR array.
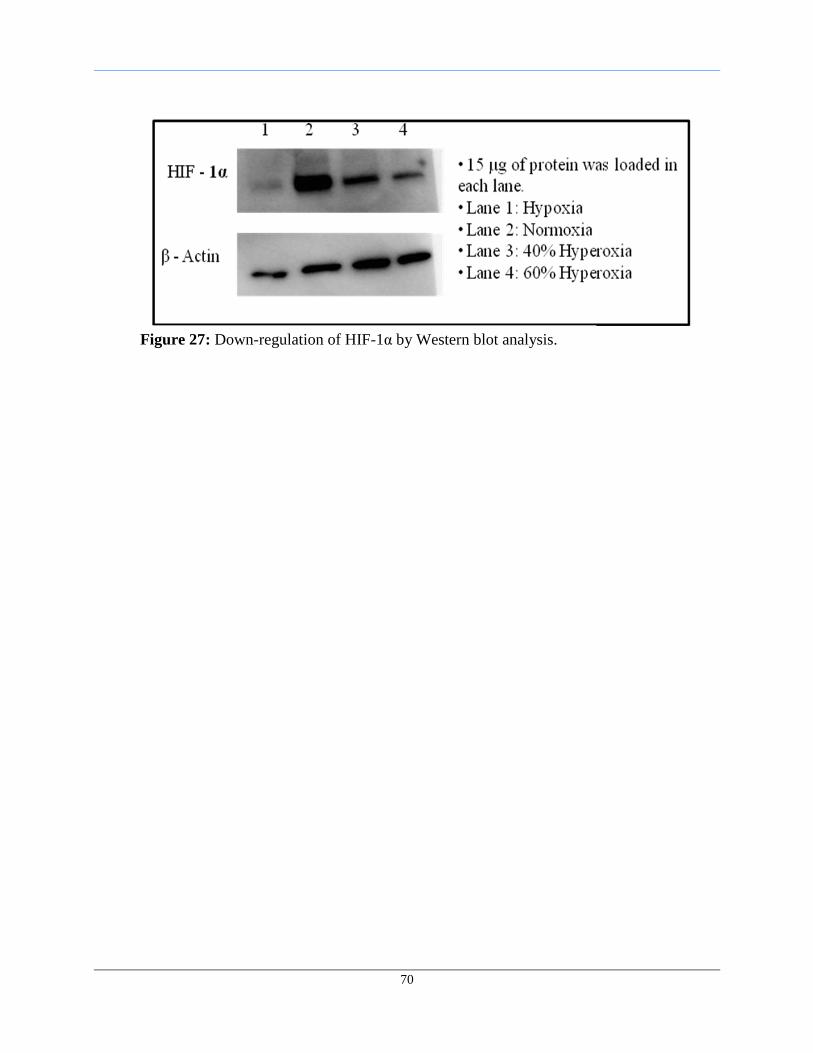
70
Figure 27: Down-regulation of HIF-1α by Western blot analysis.

71
5. CONCLUSIONS
The result of this study has shown that combination of chemo- and hyperoxia therapies
has significant potential for the treatment of cancer, even multidrug resistant form.
Nanoemulsions prepared using ultrasound method and fish oil, rich in omega-3 PUFA, could
efficiently encapsulate the hydrophobic form of the drug and thus was found to be a suitable
carrier. The qualitative microscopy study showed rapid uptake of the DOX stearate
nanoemulsion but gets entrap in the endosomes which acts as a reservoir for the release of free
DOX over period of time. This finding was supported by the quantitative intracellular drug
accumulation data. Cellular uptake and distribution studies reveal that the nanoemulsions were
internalized by the cells indicating their possible role as an effective delivery system. Moreover,
microscopy study showed increase cell killing in hyperoxia treatment which was proved from the
increased levels of reactive oxygen species. The cytotoxicity results demonstrate that the drug
encapsulated in nanoemulsions had lower IC50 value as compared to free drug in solution
indicating their higher efficiency in killing cells. Synergistic effect was observed even in the
resistant cell line when chemotherapy was combined with hyperoxia as a treatment modality.
The combination therapy resulted in the high degree of apoptosis which is evident from the
qualitative TUNEL assay and quantitative caspase-3/7. The results of western blot analysis have
shown promising results of the effect of hyperoxia on the degradation of the HIF-1α; however
more in-depth and proper molecular biology studies needs to be done to prove this. Alone,
hyperoxia has shown promising results in decreasing the aggressiveness of cancer as evident
from cytotoxicity, caspase 3/7 and TUNEL assay. Thus, the combinational therapy of chemo and
hyperoxia has significant potential in clinical management of breast cancer. Further in vivo
studies are required in order to validate these findings.
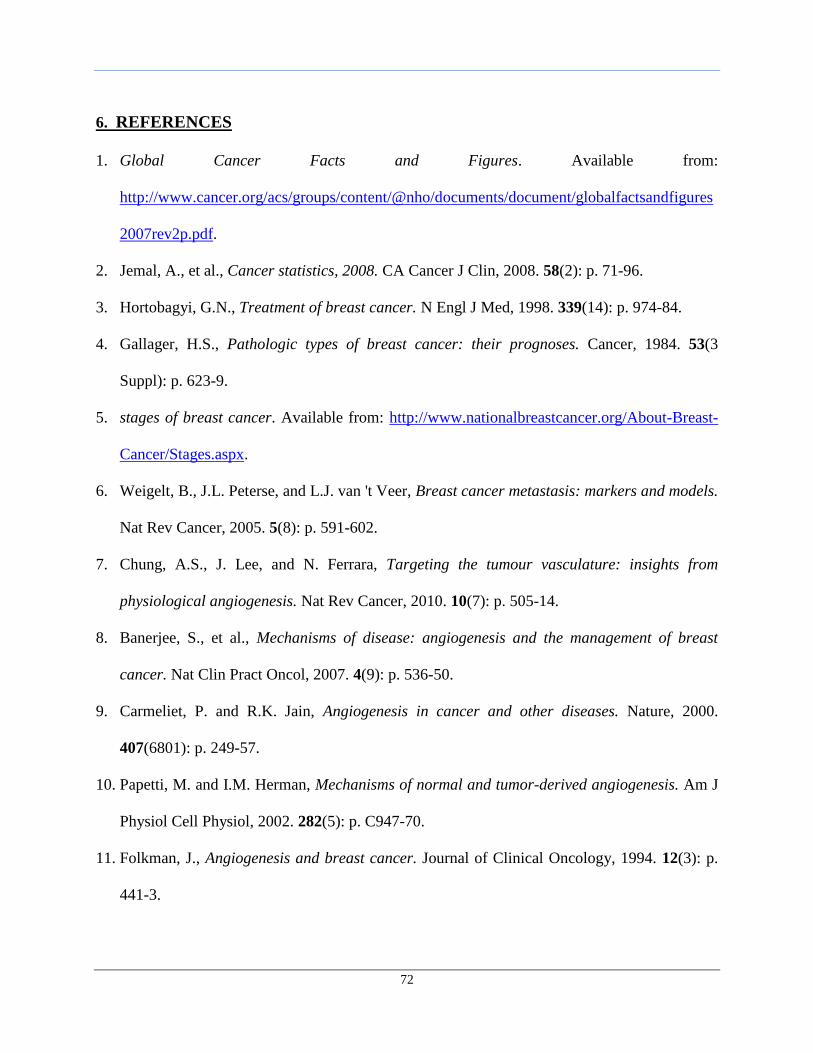
72
6. REFERENCES
1. Global Cancer Facts and Figures. Available from:
http://www.cancer.org/acs/groups/content/@nho/documents/document/globalfactsandfigures
2007rev2p.pdf.
2. Jemal, A., et al., Cancer statistics, 2008. CA Cancer J Clin, 2008. 58(2): p. 71-96.
3. Hortobagyi, G.N., Treatment of breast cancer. N Engl J Med, 1998. 339(14): p. 974-84.
4. Gallager, H.S., Pathologic types of breast cancer: their prognoses. Cancer, 1984. 53(3
Suppl): p. 623-9.
5. stages of breast cancer. Available from: http://www.nationalbreastcancer.org/About-Breast-
Cancer/Stages.aspx.
6. Weigelt, B., J.L. Peterse, and L.J. van 't Veer, Breast cancer metastasis: markers and models.
Nat Rev Cancer, 2005. 5(8): p. 591-602.
7. Chung, A.S., J. Lee, and N. Ferrara, Targeting the tumour vasculature: insights from
physiological angiogenesis. Nat Rev Cancer, 2010. 10(7): p. 505-14.
8. Banerjee, S., et al., Mechanisms of disease: angiogenesis and the management of breast
cancer. Nat Clin Pract Oncol, 2007. 4(9): p. 536-50.
9. Carmeliet, P. and R.K. Jain, Angiogenesis in cancer and other diseases. Nature, 2000.
407(6801): p. 249-57.
10. Papetti, M. and I.M. Herman, Mechanisms of normal and tumor-derived angiogenesis. Am J
Physiol Cell Physiol, 2002. 282(5): p. C947-70.
11. Folkman, J., Angiogenesis and breast cancer. Journal of Clinical Oncology, 1994. 12(3): p.
441-3.
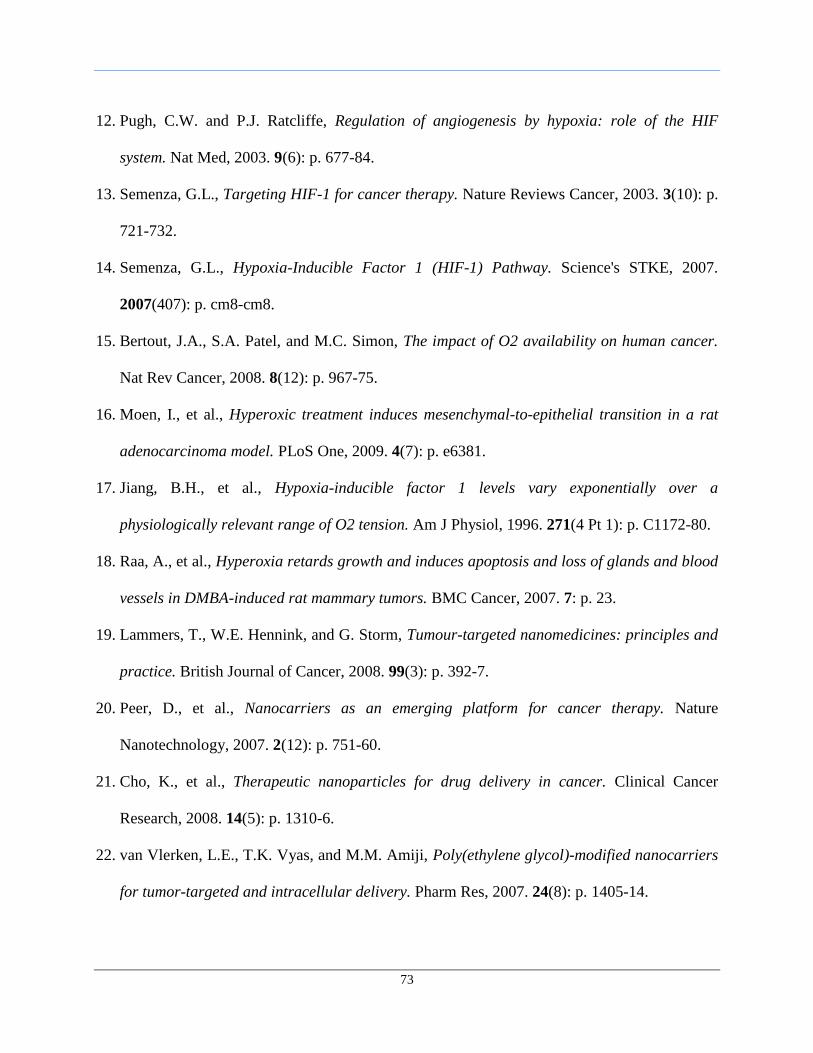
73
12. Pugh, C.W. and P.J. Ratcliffe, Regulation of angiogenesis by hypoxia: role of the HIF
system. Nat Med, 2003. 9(6): p. 677-84.
13. Semenza, G.L., Targeting HIF-1 for cancer therapy. Nature Reviews Cancer, 2003. 3(10): p.
721-732.
14. Semenza, G.L., Hypoxia-Inducible Factor 1 (HIF-1) Pathway. Science's STKE, 2007.
2007(407): p. cm8-cm8.
15. Bertout, J.A., S.A. Patel, and M.C. Simon, The impact of O2 availability on human cancer.
Nat Rev Cancer, 2008. 8(12): p. 967-75.
16. Moen, I., et al., Hyperoxic treatment induces mesenchymal-to-epithelial transition in a rat
adenocarcinoma model. PLoS One, 2009. 4(7): p. e6381.
17. Jiang, B.H., et al., Hypoxia-inducible factor 1 levels vary exponentially over a
physiologically relevant range of O2 tension. Am J Physiol, 1996. 271(4 Pt 1): p. C1172-80.
18. Raa, A., et al., Hyperoxia retards growth and induces apoptosis and loss of glands and blood
vessels in DMBA-induced rat mammary tumors. BMC Cancer, 2007. 7: p. 23.
19. Lammers, T., W.E. Hennink, and G. Storm, Tumour-targeted nanomedicines: principles and
practice. British Journal of Cancer, 2008. 99(3): p. 392-7.
20. Peer, D., et al., Nanocarriers as an emerging platform for cancer therapy. Nature
Nanotechnology, 2007. 2(12): p. 751-60.
21. Cho, K., et al., Therapeutic nanoparticles for drug delivery in cancer. Clinical Cancer
Research, 2008. 14(5): p. 1310-6.
22. van Vlerken, L.E., T.K. Vyas, and M.M. Amiji, Poly(ethylene glycol)-modified nanocarriers
for tumor-targeted and intracellular delivery. Pharm Res, 2007. 24(8): p. 1405-14.
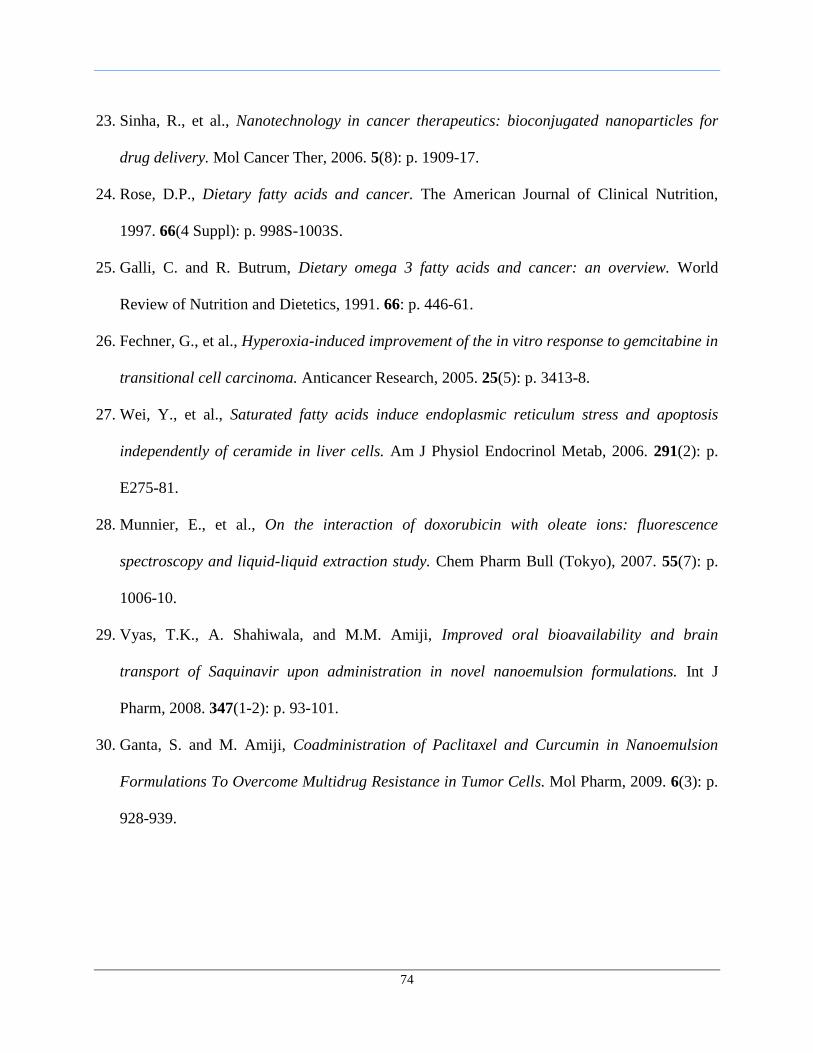
74
23. Sinha, R., et al., Nanotechnology in cancer therapeutics: bioconjugated nanoparticles for
drug delivery. Mol Cancer Ther, 2006. 5(8): p. 1909-17.
24. Rose, D.P., Dietary fatty acids and cancer. The American Journal of Clinical Nutrition,
1997. 66(4 Suppl): p. 998S-1003S.
25. Galli, C. and R. Butrum, Dietary omega 3 fatty acids and cancer: an overview. World
Review of Nutrition and Dietetics, 1991. 66: p. 446-61.
26. Fechner, G., et al., Hyperoxia-induced improvement of the in vitro response to gemcitabine in
transitional cell carcinoma. Anticancer Research, 2005. 25(5): p. 3413-8.
27. Wei, Y., et al., Saturated fatty acids induce endoplasmic reticulum stress and apoptosis
independently of ceramide in liver cells. Am J Physiol Endocrinol Metab, 2006. 291(2): p.
E275-81.
28. Munnier, E., et al., On the interaction of doxorubicin with oleate ions: fluorescence
spectroscopy and liquid-liquid extraction study. Chem Pharm Bull (Tokyo), 2007. 55(7): p.
1006-10.
29. Vyas, T.K., A. Shahiwala, and M.M. Amiji, Improved oral bioavailability and brain
transport of Saquinavir upon administration in novel nanoemulsion formulations. Int J
Pharm, 2008. 347(1-2): p. 93-101.
30. Ganta, S. and M. Amiji, Coadministration of Paclitaxel and Curcumin in Nanoemulsion
Formulations To Overcome Multidrug Resistance in Tumor Cells. Mol Pharm, 2009. 6(3): p.
928-939.