Embed Size (px)
Citation preview

1
Chihiro Watanabe
23rd JyvaskylaSummer School
7-9 Aug.. 2013, University of Jyvaskyla, Jyvaskyla
COM8Techno-economic SystemsInstitutional Innovation
(3)
Professor, Department of Industrial Management, Tokyo Seitoku UniversityProfessor Emeritus, Tokyo Institute of Technology
Visiting Professor, National University of SingaporeVisiting Professor, University of Jyvaskyla, Finland
Research Scholar, International Institute for Applied Systems Analysis (IIASA)
COM8 (3)

1. 7 Aug (W) AM2. PM
3. 8 Aug (T) AM4. PM
5. 9 Aug (F) AM6. PM
Technological innovation, growth, diffusion and consumptionProductivity, technological progress, competitiveness
Diffusion of technology, Effects of learningTechnology spillover, Rate of return to R&D investment
Basic concept of institutional innovationNew Stream for institutional innovation
2
COM8: Techno-economic Systems, Institutional Innovation
Chihiro Watanabe ([email protected])
AM: 10-12 am PM: 13-15pm
Identity: SEARCH Systems approach, Empirical approach, Analytical approach, challenge to Rationale, Comprehensive approach, with Historical perspective

3
3. Diffusion of Technology
3.1 Epidemic Function
3.2 Application of Epidemic Function
3.3 Variation of Diffusion Function
3.4 Functionality Development
3.5 Integration of Production Function and Diffusion Function - Innofusion
3.6 Sustainable Functionality Development in Open Innovation

Fig. 1. Comparison between Logistic Function and Epidemic Function.
3. Diffusion of Technology3.1 Epidemic FunctionDiffusion trajectory of innovation, innovative goods and also new products resemble to diffusion process of an epidemic disease which can be depicted by the epidemic function (Verhulst, 1845).
Y(t)
Y(t) : Diffusion level at time t: Upper limit of diffusion (Carrying capacity)
a : Diffusion velocityb : Diffusion level at initial period
N
N
atbeNtY
1
)(Epidemic function :
Logistic function
Epidemic function
t
2N
abln
Pierre Francois Verhulst (1804-1849) Mathematician in BelgiumMathematical Researches into the Law of Population Growth Increase (1845).
bN1 Changed notations
NN
tYtN
)()(
4

(1) Development of Epidemic Function
5
YN N
Y
Level of disseminationof epidemic
disease
Upper limit of dissemination(carrying capacity)
Potential capacityof dissemination
Fig. 2. Diffusion Process of Epidemic Disease.
1. Epidemic disease diffuses proportional to potential capacity of dissemination
2. Increase of epidemic disease N during the unit period dt
3. Develop this balance
4. Solving this differential equation leads to the followinglogistic growth function (epidemic function) illustratinga sigmoid curve:
)(' YNa where a’: coefficient
dtYYNadY )]('[
)1(NYaY
dtdY
Naa 'where
atbeNY
1
where b: coefficient
(21)
(22)
')'(
)'(
2
11,1),'()''(ln,'1
'1,',')(',,)(),('),('
batbat
bat ebbeN
eNY
YN
YYNeXbatbNtaXdtNadX
X
NadtdX
XNa
XXX
NYYXaYNa
YY
YYNX
YYNXYNa
YYYNYaY
dtdY

6
(2)疫学関数
係数を書き直して整理(a’, b’→ a b, a”→ a’)すると、
0dt/)t(dN)NN(bNdt/dN の時、 )t(NN0))t(NN(
(3)
FFlnabt
1
(3)フィッシャ・プライ変換(Fisher-Pry transform)
(4)普及天井の決定
(1)式より、
abteNNF
1
1
btabt eaN
eNN
)NN(bN
dtdN
11
1
N
2/N
aeN
1 t
b: 普及速度 a: 初期時点の普及状況 t -a/b : 逓増 t = -a/b : 転換点
t > -a/b : 逓減
-a/b
累積普及量 N
普及量 dN/dt
4/Na
(2) Structure of Epidemic Function
Fig. 3. Diffusion Trajectories of Epidemic Disease by Increase and Cumulative Stock.
Cumulative stock Y
abln
atbeNtY
1
)(
bN1
)1(NYaY
dtdY
(3) Fisher-Pry Transform
atbeNYF
11
FFbe at
1F
Fbat
1
lnln
(4) Identification of Carrying Capacity
0# dtdY 0))(1)((
##
# NtYtaY
dtdY
time when#t NtY )( #
N
2N
4aN
dtdY

7.
6 0 0 .
5 0 0 .
4 0 0 .
3 0 0 .
2 0 0 .
1 0 0 .
0
1 7 9 6 1 7 7 0 1 7 8 0 1 7 9 0 1 8 0 0 ・ ・ ・ ・ ・ . . . . . . . . . . . . . . . . . . . . . . . . . . . . . . . . . . . . . . . . . . . . . . . . . . . . . . . . .
D I e a t h
B o r n
C u m u la t iv e n u m b e r o f c o m p o s it io n s p u b li s h e d
W o lfg a n g A m a d e u s M o z a r t (1 7 5 6 - 1 7 9 1 )
T h e b e s t- f i t t i n g S -c u r v e im p lie s 1 8 c o m p o s i to n s “ m is s in g “ b e - tw e e n 1 7 5 6 a n d 1 7 6 2 . T h e n o m in a l b e g in n in g o f th e c u r v e - - - th e 1 % le v e l -p o in t s a t M o z a r t ‘ s b i r th d a y. T h e n o m in a l e n d th e 9 9 % le v e l in d ic a t e s a p o te n t ia l o f 6 4 4 w o r k s .
1 6 0 .
1 4 0 .
1 2 0 .
1 0 0 .
8 0 .
6 0 .
4 0 .
2 0 .
1 8 2 0 1 8 3 0 1 8 4 0 1 8 5 0 1 8 6 0 1 8 7 0 ・ ・ ・ ・ ・ ・
. . . . . . . . . . . . . . . . .
C u m u la t iv e n u m b e r o f c o m p o s i t io n s p u b li s h e d
R o b e r t S c h u m a n n ( 1 8 1 0 -1 8 5 6 )
D e a lt h
A t le m p t e d s u ic id e
N e r v o u s b r e a k d o w n
1 %
T h e p u b l ic a t io n o f S c h u m a n n ‘s c o m p o s i t io n s . T h e f i t t e d c u r v e b e g in s a r o u n d1 8 2 6 a n d a im s a t a c e i l i n g o f 1 7 3 . S c h u m a n n ‘s p u b l ic a t io n s r e a c h e d 1 7 0 , s ix te e n y e a r s a f te r h is d e a th .
・・・・・・・・・・・・・・・
2 8 0
2 4 0
2 0 0
1 6 0
1 2 0
8 0
4 0
0
C u m u la t iv e n u m b e r o f p u b lic a l io n s
A lb e r t E in s te in ( 1 8 7 9 -1 9 5 5 )
. . . . . . . . . . . . . . . . . 1 8 8 0 1 8 9 0 1 9 1 0 1 9 2 0 1 9 3 0 1 9 4 0 1 9 5 0 1 9 6 0
E in s te in ‘ s c u m u la t iv e p u b l ic a t io n s a n d th e b e s t - f i t t in g S -c u r v e . T h e f i t in d ic a te s 1 3 p u b l ic a t io n s “ m is s in g “ b e tw e e n th e b e g in n in g o f t h e c u r v e , 1 8 9 4 , a n d E in s tc in ‘ s f i r s t p u b l ic a t io n in 1 9 0 0 . T h e c e i l in g i s e s t im a te d a s 2 7 9 .
モ ー ツ ア ル ト 、 シ ュ ー マ ン 、 ア イ ン シ ュ タ イ ン の 「 伝 染 過 程 」
資 料 T h e o d o r e M o d is , P re d ic t io n (S im o n & S c h u s te r, N e w Y o r k ,1 9 9 2 ) .
D I E D
B o r n 1 %
Fig. 4. Epidemic Process of Mozart, Schumann and Einstein.Source: Theodore Modis, Prediction (Simon & Schuster, New York, 1992).
The social and economic operation of our society can be decomposed in a very large number of sub-diffusionprocesses summing up into an almost inextricable whole (Cesare Marchetti,1996).
3.2 Application of Epidemic Function

8Source: Theodore Modis, Prediction (Simon & Schuster, New York,1992).
Fig. 5. Einstein’s Epidemic Trajectory by Cumulative Number of Papers (1879-1955).
Cumulative number of papers Death (1955)
1880 1890 1910 1920 1930 1940 1950 1960 t
(Carrying capacity)
1%
-
280 -
240 -
200 -
160 -
120 -
80 -
40 -
0
Birth(1879)
YN
atbeNY
1 1894: Published 1% of whole papers in his life at the age of 15 years
old1905: Special relativity
1915: General relativity

3.3 Variation of Diffusion Function(1) Simple Logistic Growth Function (SLF)
9
))(1)(()(N
tYtaYdt
tdY (23)
Y(t): Diffusion level of innovative goods at time t; N: Upper limit of diffusion level (carrying capacity); a: Coefficient.
atbeNtY
1
)( (24)
))(1()()(
)(
)(
NtYa
tYtY
tYdt
tdY
a governs diffusion velocity.
Diffusion level at the initial timing.
bNY
1
)0( 1)0(
YNb
b indicates initial level of diffusion.
)2(
)1(1
)1(1()1(
)1
11(1
)1(
1
1)
atbeat
atb
atat
at
at
atat
beaN
ebeaN
bebe
beaN
bebeaN
NYaY
dtdY
at
dtdY
atat
dtdY
bexaNyx
xy
bebeaN
,12
12

Bi-polarization Diffusion Trajectory
10
1
2
xy 2
xy 1
xxy 12
atebx
dtdY
aNy
abt ln

India
Philippines
Indonesia
ChinaThailand
MalaysiaMexico
Brazil
Russia
Turkey
PolandSlovak Republic
TaiwanKorea
Czech RepublicPortugal
New ZealandGreece
SpainItaly United KingdomIcelandJapanCanadaGermanyFranceSweden BelgiumFinlandAustriaUnited StatesNetherlandsIreland
Denmark
Switzerland
Norway
Luxembourg
Case 1: GDP per capita vs Marginal productivity of investment per capita
11
1 GDP per capita increase
MPi
incr
ease
Fig. 6. Development Trajectory of Investment induced by GDP of 37 Countries (2009).
Xex
MPiy
lnX
Group A: vicious cycle
Group B & C: virtuous cycle

12
Sweden (5.65)**Singapore (5.64)
**
*
*
*
*
*
**
*
*
*
*
*
**
**
Denmark (5.54)Switzerland (5.48)USA (5.46)Finland (5.44)Canada (5.36)Netherlands (5.32)Norway (5.22)Iceland, Taiwan (5.20)
Germany (5.16)
Luxemburg (5.02)
Austria, New Zealand (4.94)France (4.99)
Japan (4.89)
Ireland (4.82)
Korea (5.14)
Belgium (4.86)
Malaysia (4.65)
Spain (4.81)
Portugal (4.41)
****
****India (4.09)
Czech (4.35)China (04.31)
**Hungary (3.98)
Brazil (3.80)*
*
*
Slovak (3.86)
Indonesia (3.72)Turkey (3.68)
*
**
**
Mexico (3.61)Russia (3.58)
Philippines (3.51)
Poland (3.74)
)746.0060.1( exp Iu
MPIYav
Australia (5.06)
Italy (4.77)
Greece (4.64)Thailand (3.97)
UK (5.17)
MPI Increase
ICT Increase704.0I1
),( IXFV
Y
VV
IYFD
IVVV
IYFD
Growing economies
YI
IY
XX
XV
VI
IV
XX
XV
VV
)11()1(FD
aYYYaY
IY
Advanced economies
Fig. 7. ICT Driven Growth Trajectory in 40 Countries (2009).
Global co-evolution with emerging economiesMOP (Middle of the pyramid), BOP (Bottom of the pyramid)
Frugal engineering
Marginal Productivity of IC
T
Advancement of ICT
Case 2: Advancement of ICT vs Marginal Productivity of ICT

13
1. National strategy and socio ‐ economic system
2.1 Strategy and Business model2.1.1 Vision and Business strategy
2.1.2 Business model and Market policy
2.1.3 R&D and ICT
2.2 Employment, Promotion and Training2.2.1 Appointment
2.2.2 Promotion
2.2.3 Training
1.1 National strategy
1.1.1 Democracy
1.1.2 Constitution, Law, Regulation, Standard, Manner
1.1.3 Separation of the three powers of Administration, Legislation, and Judicature
1.2 Social system1. 2.1 Education system
1.2.2 Employment system
1.2.3 Infrastructure investment
1.3 Economic system1.3.1 GDP and GDP per capita
1.3.2 Trade‐ based nation, Export and Import
1.3.3 Tech‐ based nation, ICT and Government ICT
2.3 Structure2.3.1 Entrepreneurial organization
2.3.2Affiliated firms
2.3.3 Foreign capital
2.4 Doctrine, Philosophy and Ethics
2.4.1 Business doctrine and Culture
2.4.2 Philosophy and Ethics
2.4.3 Corporate governance
2.1 Strategy and Business model2.1.1 Vision and Business strategy
2.1.2 Business model and Market policy
2.1.3 R&D and ICT
2.2 Employment, Promotion and Training2.2.1 Appointment
2.2.2 Promotion
2.2.3 Training
3. Historical perspectives
2. Entrepreneurial organization and culture
3.1 Geographical structure3.1.1 Geopolitical environment
3.1.2 Population
3.1.3 Homogeneous/Heterogeneous, Gini index
3.2 Culture and Tradition3.2.1 Culture, Custom and Common idea
3.2.2 National spirit, Moral ethic, Manners and Customs
3.2.3 Religion
3.3 State of development3.3.1 Rapid economic growth
3.3.2 Mature economy
3.3.3 Diminishing population and Aging trend
3.4 Paradigm and phase of industrial society3.4.1 Indust . society, Inform. society, Post‐inform. society
3.4.2 Heavy and chemical industrial structure
3.4.3 Knowledge‐ intensified industr ial structure
3.1 Geographical structure3.1.1 Geopolitical environment
3.1.2 Population
3.1.3 Homogeneous/Heterogeneous,
3.2 Culture and Tradition3.2.1 Culture, Custom and Common idea
3.2.2 National spirit, Moral ethic, Manners and Customs
3.2.3 Religion
3.3 State of development3.3.1 Rapid economic growth
3.3.2 Mature economy
3.3.3 Diminishing population and Aging trend
3.4 Paradigm and phase of industrial society3.4.1 Indust . society, Inform. society, Post‐inform. society
3.4.2 Heavy and chemical industrial structure
3.4.3 Knowledge‐ intensified industr ial structure
1.1 National strategy
1.1.1 Democracy
1.1.2 Constitution, Law, Regulation, Standard, Manner
1.1.3 Separation of the three powers of Administration, Legislation, and Judicature
1.2 Social system1. 2.1 Education system
1.2.2 Employment system
1.2.3 Infrastructure investment
1.3 Economic system1.3.1 GDP and GDP per capita
1.3.2 Trade‐ based nation, Export and Import
1.3.3 Tech‐ based nation, ICT and Government ICT
2.3 Structure2.3.1 Entrepreneurial organization
2.3.2Affiliated firms
2.3.3 Foreign capital
2.4 Doctrine, Philosophy and Ethics
2.4.1 Business doctrine and Culture
2.4.2 Philosophy and Ethics
2.4.3 Corporate governance
3 Dimensions of InstitutionsHistorical perspectives
National strategy and socio‐ economic system
Entrepreneurial organization andculture
1. National strategy and socio ‐ economic system
2.1 Strategy and Business model2.1.1 Vision and Business strategy
2.1.2 Business model and Market policy
2.1.3 R&D and ICT
2.2 Employment, Promotion and Training2.2.1 Appointment
2.2.2 Promotion
2.2.3 Training
1.1 National strategy
1.1.1 Democracy
1.1.2 Constitution, Law, Regulation, Standard, Manner
1.1.3 Separation of the three powers of Administration, Legislation, and Judicature
1.2 Social system1. 2.1 Education system
1.2.2 Employment system
1.2.3 Infrastructure investment
1.3 Economic system1.3.1 GDP and GDP per capita
1.3.2 Trade‐ based nation, Export and Import
1.3.3 Tech‐ based nation, ICT and Government ICT
2.3 Structure2.3.1 Entrepreneurial organization
2.3.2Affiliated firms
2.3.3 Foreign capital
2.4 Doctrine, Philosophy and Ethics
2.4.1 Business doctrine and Culture
2.4.2 Philosophy and Ethics
2.4.3 Corporate governance
2.1 Strategy and Business model2.1.1 Vision and Business strategy
2.1.2 Business model and Market policy
2.1.3 R&D and ICT
2.2 Employment, Promotion and Training2.2.1 Appointment
2.2.2 Promotion
2.2.3 Training
3. Historical perspectives
2. Entrepreneurial organization and culture
3.1 Geographical structure3.1.1 Geopolitical environment
3.1.2 Population
3.1.3 Homogeneous/Heterogeneous, Gini index
3.2 Culture and Tradition3.2.1 Culture, Custom and Common idea
3.2.2 National spirit, Moral ethic, Manners and Customs
3.2.3 Religion
3.3 State of development3.3.1 Rapid economic growth
3.3.2 Mature economy
3.3.3 Diminishing population and Aging trend
3.4 Paradigm and phase of industrial society3.4.1 Indust . society, Inform. society, Post‐inform. society
3.4.2 Heavy and chemical industrial structure
3.4.3 Knowledge‐ intensified industr ial structure
3.1 Geographical structure3.1.1 Geopolitical environment
3.1.2 Population
3.1.3 Homogeneous/Heterogeneous,
3.2 Culture and Tradition3.2.1 Culture, Custom and Common idea
3.2.2 National spirit, Moral ethic, Manners and Customs
3.2.3 Religion
3.3 State of development3.3.1 Rapid economic growth
3.3.2 Mature economy
3.3.3 Diminishing population and Aging trend
3.4 Paradigm and phase of industrial society3.4.1 Indust . society, Inform. society, Post‐inform. society
3.4.2 Heavy and chemical industrial structure
3.4.3 Knowledge‐ intensified industr ial structure
3.1 Geographical structure3.1.1 Geopolitical environment
3.1.2 Population
3.1.3 Homogeneous/Heterogeneous, Gini index
3.2 Culture and Tradition3.2.1 Culture, Custom and Common idea
3.2.2 National spirit, Moral ethic, Manners and Customs
3.2.3 Religion
3.3 State of development3.3.1 Rapid economic growth
3.3.2 Mature economy
3.3.3 Diminishing population and Aging trend
3.4 Paradigm and phase of industrial society3.4.1 Indust . society, Inform. society, Post‐inform. society
3.4.2 Heavy and chemical industrial structure
3.4.3 Knowledge‐ intensified industr ial structure
3.1 Geographical structure3.1.1 Geopolitical environment
3.1.2 Population
3.1.3 Homogeneous/Heterogeneous,
3.2 Culture and Tradition3.2.1 Culture, Custom and Common idea
3.2.2 National spirit, Moral ethic, Manners and Customs
3.2.3 Religion
3.3 State of development3.3.1 Rapid economic growth
3.3.2 Mature economy
3.3.3 Diminishing population and Aging trend
3.4 Paradigm and phase of industrial society3.4.1 Indust . society, Inform. society, Post‐inform. society
3.4.2 Heavy and chemical industrial structure
3.4.3 Knowledge‐ intensified industr ial structure
1.1 National strategy
1.1.1 Democracy
1.1.2 Constitution, Law, Regulation, Standard, Manner
1.1.3 Separation of the three powers of Administration, Legislation, and Judicature
1.2 Social system1. 2.1 Education system
1.2.2 Employment system
1.2.3 Infrastructure investment
1.3 Economic system1.3.1 GDP and GDP per capita
1.3.2 Trade‐ based nation, Export and Import
1.3.3 Tech‐ based nation, ICT and Government ICT
2.3 Structure2.3.1 Entrepreneurial organization
2.3.2Affiliated firms
2.3.3 Foreign capital
2.4 Doctrine, Philosophy and Ethics
2.4.1 Business doctrine and Culture
2.4.2 Philosophy and Ethics
2.4.3 Corporate governance
3 Dimensions of InstitutionsHistorical perspectives
National strategy and socio‐ economic system
Entrepreneurial organization andculture
Historical perspectives
National strategy and socio‐ economic system
Entrepreneurial organization andculture
World level
National level
Regional level
Industry/Sector level
Firm/Acad./Rese. Inst level
Specific Tech. level Coevolution between hieralchy
ConsumersInnovatorsInventors
Invention becomes innovation when the invention becomes a commercial product, which in turn becomes a successful product when consumers by it.
1. Each respective level of institutions incorporate threedimensional structure.
2. In order for the property emerge,three dimensional components atthe lower level should interact with those at the higher level.
Three Dimensional Constitution and Hierarchical Structure of Institutional Systems
Sources leading to bi-polarization- Institutional innovation
(2) Bass Model (F.M. Bass, 1969) – Diffusion with innovator (leader) and imitator (follower) dynamism
14
)()()( tQtPdt
tdY where P(t): innovator, and Q(t): imitator.
))(1())(()(NtYpNtYNptP
))(1)(()(N
tYtqYtQ
where p: innovation coefficient.
where q: imitation coefficient
))(1))((()()()(N
tYtqYpNtQtPdt
tdY (25)
tqppq
tqp
eeNtY )(
)(
1]1[)(
(26)
taat ebNb
beN
''1'
1
(26’)
a = p + q, a’ = -(p + q), b =q/p, b’ = p/q
Diffusion in open innovation
1) Model Structure4.1 (1)1. Epidemic disease diffuses
proportional to potential capacity of dissemination
3. Develop this balance
)(' YNa
)1(NYaY
dtdY
tqp
tqp
e
epq
)(
)(
1
1
tqp
tqp
epq
eNY
)(
)(
1
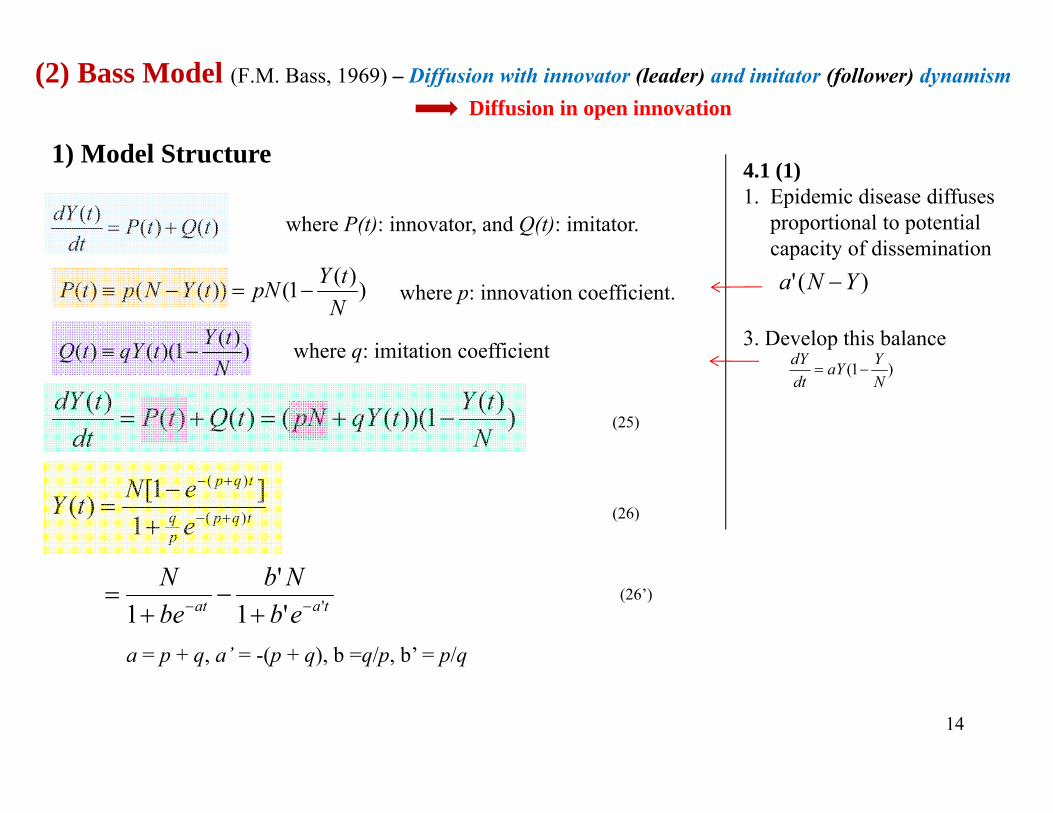
)1(FD 0
/
pdqdFD q/p increase FD increase
yxyFD
11q/p x and e-(p+q)t y
(Open innovation)
2
2
2 1
1
11
1
y
yydxdyx
ydxdyxy
y
xydxdy
dxdFD
ytxx
dxdpp
yy
dxdFD 111
1 2
ytx
dxdptxp
yy 2
2 1111
tttqp xpqpey ]11[]1[][ txp 11Since e-(p+q) = y-t and p+q 1,
011
2
2
dxdpt
yxy
dxdFD
0dxdp
p: Innovafor (leader)q: Immitator (follower)
2) Self-propagating Dynamism
15Fig. 8. Declining Nature of FD and Its Sustaining Efforts.
FDthrough
Innofusionby means of
Effective utilization of external resourcesbased on
Coopetition ( q/p increase)
Earlier emergence of FD
Y: production of innovative products, N: carrying capacity
3) Sustainable FD
when
pq increase FD increase
1
FD
T
11 q,p22 q,p
2211 // pqpq
1
FD
T
11 q,p22 q,p
2211 // pqpq
FD: Functionality development (Ability to improve performance of production processes, goods and services by means of innovation)
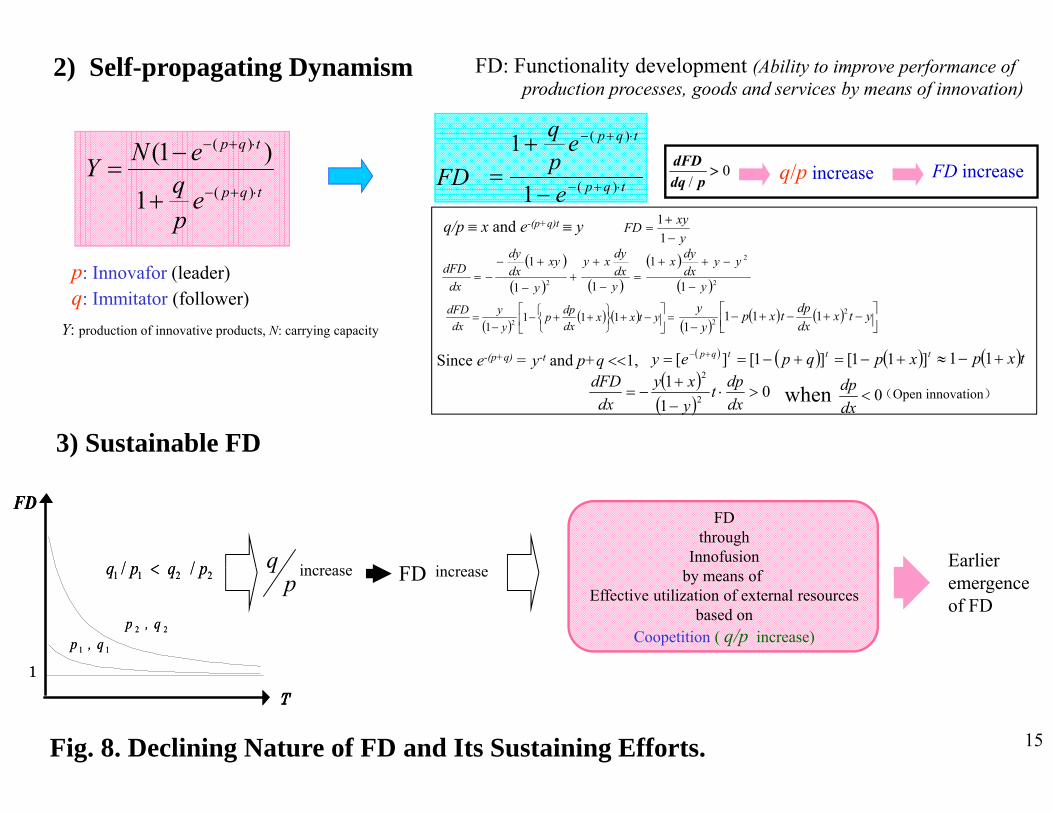
Home PC 1982-1988 Cellular telephone 1986-1996
Black & White TV Colour TV Video Cassette Recorder 1981-1994
CD player 1986-1996
Speed of technology introduction: The Bass model of technology diffusion
"Diffusion models: Managerial applications and software" (1999), G. Lilien and C. Van den Bulte, Institute for the Study of Business Markets (University of Pennsylvania), ISBN Report 7-1999. Introduction to the Bass Model and its extensions together with several examples of innovation and imitation factors for particular technologies.
http://isbm.smeal.psu.edu/library/working-paper-articles/1999-working-papers/07-1999-diffusion-models.pdf 16

Application of BLF1. Monthly diffusion trajectory of Japan’s mobile phones (MP) over the last decade can be traced by
the bi-logistic growth model.2. This suggests that Japan’s MP diffusion in the last decade was initiated by two waves Y1 and Y2 .
Table 1 Estimation of Japan’s Mobile Phones Diffusion by the Bi-logistic Growth Model
(January 1996-December 2006)
N1 a1 b1 N2 a2 b2 adj. R2
Parameter 35.147 0.074 5.198 65.418 0.036 14.028 0.999
t-value 2.25 4.59 3.26 3.81 6.74 1.33
tata ebN
ebNYYY
212
2
1
121 11
Y(t): cumulative number of MP diffusion at time t;N1, N2: carrying capacities; a1, a2: velocity of diffusion;b1, b2: initial stage of diffusion; and t: time trend by month (Dec. 95 =0, Jan. 96 =1).
IP: Internet Protocol Service
tata ebN
ebNtYtYtY
212
2
1
121 11
)()()(
(27)
(3) Bi-Logistic Growth Function (BLF) – Diffusion of two co-existing innovation (eg. carriage and car)
17

Table 2 Diffusion Parameters in Major Innovative Goods and ServicesN p q adj. R2
Printer aLLBP
(1975-1994)1581
(19.33)5.4310-3
(15.13)5.810-2
(9.94)0.999
LBP/BJ(1987-2005)
97205(166.57)
1.4710-3
(2.27)2.910-2
(37.96)0.999
MP(1990-2006)
MP 138216
(149.45)0.1210-1
(5358.9)0.5810-1
(2616.7)
MP 265741
(170.24)0.2210-2
(1270.1)0.3510-1
(438.3)
LCD(2000-2008)
LCD 1 2.4103
(1654.3)0.310-2
(1654.3)0.210-1
(1654.3)0.999
LCD 2 2.4103
(656.1)0.410-4
(1654.3)0.810-1
(1654.3)
Web(1993-2006)
Web 1.0 2.42105
(145.87)1.3810-5
(8.35)1.0810-1
(58.33)0.999
Web 2.0 2.49105
(75.66)0.2510-5
(2.60)0.5510-1
(22.74)
a Since the period of co-existence of LLDP and LBP/BJ was limited, simple Bas model was used for respective innovation.b Figures in parentheses indicate t-value. All demonstrates statically significant at the 5% level.c LLBP: Large-scale Laser Beam Printer; LBP: Laser Beam Printer; BJ: Bubble Jet Printer; LCD: Liquid Crystal Display; MP: Mobile phone; and Web: Internet dependency
based on the number of co.jp domains.d Sky Walker: Triggered e-mail transmission by mobile phone; RSS 2.0 (Really Simple Syndication): Triggered publishing updated works in a standardized form as blog and video;
NGPVs (Next Generation PV System): Triggered acceleration of customers initiative in PV development and introduction by means of highly advanced next generation technology.
(4) Bi-Bass Model
PV(1976-2007)
PV 1 0.50105
(8.81)19.3610-5
(3.87)2.6610-1
(45.22)0.999
PV 2 12.71105
(8.82)0.0410-5
(5.72)4.1110-1
(47.89)
x =q/p
10.7
19.3
5.0
15.6
2.59
-0.24
0.60
xdpd
lnln
7.3
7.8103
0.1104
105.4104
-0.87
-0.83
-0.92
1.9103
22.0103 -0.89
-0.83
-0.35
0.03
Sky Walker(1997/10)
RSS 2.0(2003/7)
NGPVs(2006)
0.999
0.999
Trigger of new innovation
tqp
tqp
tqp
tqp
epq
eN
epq
eNtY)(
2
2
)(2
)(
1
1
)(1
22
22
11
11
1
)1(
1
)1()(
– Diffusion of successive innovation with leader and follower dynamism
(28)
18

(5) Logistic Growth Function within a Dynamic Carrying Capacity (LGFDCC)- Diffusion with dynamically developing carrying capacity
19
atbetNtY
1
)()( (24’)
tak
kkeb
NtN
1)( where Nk : ultimate carrying capacity (29)
tabatk
taaabaat
kk
aka
kk
k
k ebeN
ebeNtY
1
11)( (30)

20
Application of LGFDCC1) Features Differences between Manufacturing Technology and IT
1980s 1990sParadigm Industrial society Information society
Core technology Manufacturing technology (MT) IT1. Optimization Within firms/Organizations In the market2. Key features formation process Provided by suppliers Formed through the interacting with institutions3. Fundamental nature As given Self-propagating
4. Actors forming features Individual firms/organizations Institutions as a whole5. Objectives Productivity Functionality 6. Development trajectory Growth oriented trajectory Functionality development initiated trajectory
Table 3 Comparison of Features between Manufacturing Technology and IT
Fig. 10. Diffusion Trajectories in Japan’s Fixed and Mobile Phones.
Num
ber o
f sub
scrib
ers
10000
12000
(in 1
0 th
ousa
nd)
Mobile phone
Fixed phone
19961998
1991
93.8 mil.
60.0 mil.6000
8000
2000
4000
(IT)
(MT)

21Fig. 11. Self-propagating Dynamism in Functionality Development of Japan’s Mobile Phones.
ta
k
kat
k
keaa
bbe
NY
/11
Ultimate carrying capacity 9380
0
1000
2000
3000
4000
5000
6000
7000
8000
9000
10000
(year)
(in 1
0 t
housa
nd)
Mobile phone estimates
Mobile phone observations
Carrying capacity
In mobile driven innovation, new functionality emerged in a self-propagating way in a process of diffusion, not at development stage, as from talk to see, see & talk, take a picture, pay and watch.
2) Self-propagating Functionality Development through Innofusion
Parameter Estimate t-value adj. R2
a 1.4810-1 8.94 0.998b 1.44102 9.85ak 3.4310-2 7.63bk 4.21100 8.65Nk 9.38103 10.89
)1(1
)1(k
kat NNNa
dtdN
beNY
NYaY
dtdY
Message exchange
Communication
IP
GPS
Music distribution
1968 1980 1999 2001 2005
Camera
TV phone
Network externality
Diffusion
One-seg
Message exchange
Communication
IP
GPS
Music distribution
1968 1980 1999 2001 2005
Camera
TV phone
Network externality
Interaction
Diffusion
Functionalitydevelopment
One-seg
Network externality
Self-propagating mechanismDiffusion of IT
Interaction withinstitutional
system
Network externality
Functionality development
Enhancement of carrying capacity)
Acceleration and advancement of IT diffusion
Talk See See & talk Take a picture Pay Watch
2003

3) Contrasting Diffusion Trajectories
)(NYaY
dtdY
1
NK a b aK bK adj. R2
9.38103
(10.89)1.4810-1
(8.94)1.44102
(9.85)3.4310-2
(7.63)4.21100
(8.65)0.998
N dynamic
SLG
LGDCC
I T
M T atbeNY
1
N fixed
N a b adj. R2
6.00103
(5.07)1.7410-1
(28.20)0.64102
(22.96)0.952
Y: Production of innovative goodsN: Carrying capacity (Upper ceiling)a: Velocity of diffusion
MT: Manufacturing technologyIT: Information technology
SLG: Simple logistic growthLGDCC: Logistic growth within dynamic carrying capacity
KNNaN
dtdN 1
0
2000
4000
6000
8000
(in 1
0 th
ousa
nd)
Fixed phoneN
1996
Y(t)
N
Y
t
0
1000
2000
3000
4000
5000
6000
7000
8000
9000
10000
(in 1
0 th
ousa
nd)
Mobile phone estimatesCarrying capacity
KN
tN tY
Y
t
ta
k
kat
k
kea/a
bbe
NY
11
10000
12000
(in 1
0 th
ousa
nd)
Mobile phone
Fixed phone1996
1998
1991
93.8 mil.
60.0 mil.6000
8000
2000
4000
10000
12000
1953 1956
1959
1962
1965
1968 1971 1974
1977
1980
1983 1986
1989 1992
1995 1998 2001
2004
2007 2010 2013
(in 1
0 th
ousa
nd)
Mobile phone
Fixed phone1996
1998
1991
93.8 mil.
60.0 mil.6000
8000
2000
4000
10000
12000
1953 1956
1959
1962
1965
1968 1971 1974
1977
1980
1983 1986
1989 1992
1995 1998 2001
2004
2007 2010 2013
(in 1
0 th
ousa
nd)
Mobile phone
Fixed phone1996
1998
1991
93.8 mil.
60.0 mil.6000
8000
2000
4000
Fig. 12. Self-propagating FD Dynamics.22

Efforts to prolong higher level of FD Sustainable FD Self-propagating FD
atbe 1
23
1. Diffusion trajectory can be depicted by an epidemic function
2. Functionality development (FD)
3. Measurement of FD
4. Functionality development strategy
where Y: Production of innovative goods; N: Carrying capacity; and a: Velocity of diffusion.
3.4 Functionality Development (1) Functionality Development Concept
Y continues to diffuse as far as it incorporates
“Ability to improve performance of production processes, goods and services by means of innovation” = FD
Y terminates to diffuse when it reaches N
(i) Y N (obsolescent stage of FD)0dtdY
(ii) FD can be defined as “Potential capacity before reaching obsolescent stage”
(iii) Degree of FD = N/Y
Functionality development can be depicted by the following diffusion trajectory
Declining nature
atbeNY
1
)NY(aY
dtdY
1

24Fig. 13. Scheme of the Breeding Stage of New Ventures.
Basic research Development Market growthInitial marketing
IPO
Death valley
The sea of Darwin
Start-up
10090
70
50
30
(%)
Later stage
Initial stage
Diffusion ratio 16% line
Emergence of FD
Frequency distribution curve
Accumulative distribution curve
CHASM
Innovator, Early minority (16%)
Early majority (34%) Late majority (34%) Latest (16%)
10
Takeoff period
IPOCHASM: Deep trench
compelling newventures start-up(Moore, 1991).
Timing of FD emergence corresponds to that ofCHASM.
Emergence of FD Overcoming CHASM Take off leading to IPO
FD emergence contributes to overcome CHASM thereby enables IPO (Initial Public Offering) accomplishment.
(2) Timing of Functionality Development Emergence
1) Timing in Overcoming CHASM

25Fig. 14. Level and Timing of Inflection in Diffusion Trajectory.
2) Timing of Functionality Development Emergence by Logistic Growth Function
atbeNY
1
Diffusion model ,
0 t1 t# tt2
Increase in diffusion velocity Decrease in diffusion velocity
accelerate decelerate accelerate decelerate
where t1: inflection point of diffusion velocity in its increasing period; t# : inflection point of diffusion; and t2: inflection point of diffusion velocity in its decreasing period.
Timing of FD emergence
]1
13332[]
1[][ 11
1
000 bN
beNYdS
dtdYS t
attt
Given the initial level of diffusion 1/(1+b) = 0.05, 16.0
NS
CHASM
1. Following Rogers, Mahajan and Moore, timing of FD emergence can be identified as follows:
atbeYNFD 1
2. This time corresponds to CHASM.
2t#t0
a
b32ln abln
dtdY
2
2
dtYd
a
b32ln
t
t
Y)33/( N
2/N
N
)1/(1 b
S
Emergence of FD
t1
Timing of FD emergence
)33/( N
FD
33
233
t
Emergence of FD
t
16% 16%34%34%
Timing of FD emergence corresponds to the timing that maximizes the secondary derivative of the diffusion trajectory, and its level is
(Rogers, Mahajan, Moore)33

26
3) Timing of Functionality Development Emergence by Bass Model
t1t2
3
3
dtYd
t
t
t
t
FD
])32(1[
33
qp
t
qp
qpt 32ln11
qp
qpt
321ln1
2
2
2
dtYd
dtdY
Y
tqp
tqp
e
epq
)(
)(
1
1
tqp
tqp
epq
eNY
)(
)(
1
)1(
FD
Emergence of FD
Shifting to the successive FD
Emergence of FDFig. 15. Timing of the Emergence of Functionality Development.
FD
1t t1
Earlier Emergence of FD
1t FD

27
3.5 Integration of Production Function and Diffusion Function - Innofusion(1) Production Diffusion Integration
As paradigm shifts to an information society, spot where innovation takes place shifts from production site to diffusion processleading to the significance of production diffusion integration: innofusion function.
(i) Production Function
(ii) Diffusion Function (Cumulative Y diffuses as a function of T in high-tech. firms)
(iii) Production Diffusion Integration - Innofusion Function in which Functionality Development is only an option.
),( TXFY YR
TY
XX
YX
XY
YY
FDaY
NYaY
TY 111
Traditional production factors TFP
MPT R&D intensity
Functionality development
Growth rate
Growth
Traditional production factors(Labor, Capital)
TFP Marginal productivity of technology (MPT)
R&D intensity
Functionality development
Diffusion velocityGDP
Growth
Traditional production factors(Labor, Capital)
TFP Marginal productivity of technology (MPT)
R&D intensity
Functionality development
Diffusion velocityGDP
Fig. 16. Integration of Production and Diffusion Functions.
YR
TY
XX
YX
XY
YY
Ability to improve performance of production processes, goods and services by means of innovation
FD
TY aY (1 )1
YNFD
27
increase rate
(R/Y)Production (Y)
(a)
(FD)
Y: Prod. of innovative goodsX: L(Labor), K(Capital),
M(Material), E(Energy)T: TechnologyR: R&D investmentFD: Functionality developmentN: Carrying capacity a: Diffusion velocityb: Diffusion at the initial stage
YN
(31) In high-tech. firms, T is proportional to tand (see next page)
TY
dTdY
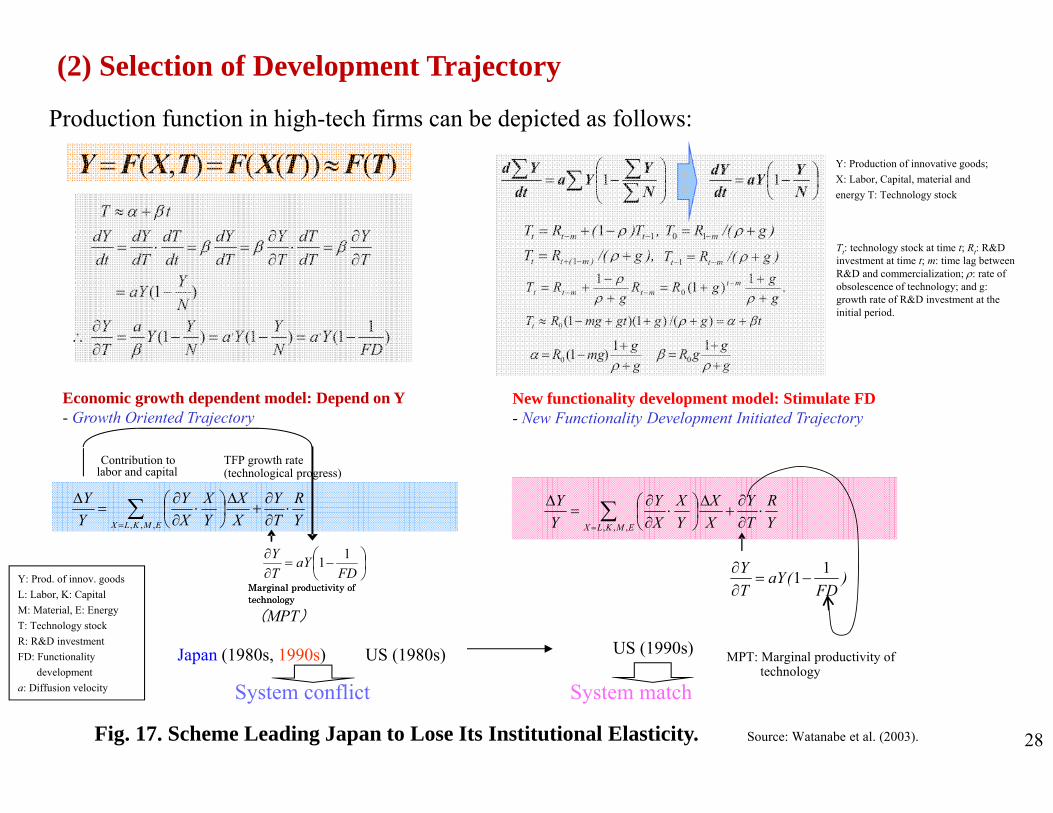
(2) Selection of Development Trajectory
)11()1()1(
)1(
,,
FDYa
NYYa
NYYa
TY
NYaY
TY
dTdT
TY
dTdY
dtdT
dTdY
dtdY
tT
Source: Watanabe et al. (2003).Fig. 17. Scheme Leading Japan to Lose Its Institutional Elasticity.
Economic growth dependent model: Depend on Y- Growth Oriented Trajectory
New functionality development model: Stimulate FD - New Functionality Development Initiated Trajectory
Japan (1980s, 1990s) US (1980s) US (1990s)
System conflict System match
MPT: Marginal productivity of technology
Y: Prod. of innov. goods L: Labor, K: CapitalM: Material, E: EnergyT: Technology stockR: R&D investmentFD: Functionality
developmenta: Diffusion velocity
(MPT)
Contribution to labor and capital
Marginal productivity of technology
TFP growth rate (technological progress)
Marginal productivity of technology
EMKLX YR
TY
XX
YX
XY
YY
,,,
FDaY
TY 11
EMKLX YR
TY
XX
YX
XY
YY
,,,
)FD
(aYTY 11
Y: Production of innovative goods;X: Labor, Capital, material and energy T: Technology stock
28
,T)(RT tmtt 11 )g/(RT m 10
),g/(RT )m(tt 1 )g/(RT mtt 1
.1)1(10 g
ggRRg
RT mtmtmtt
tgggtmgRTt )/()1)(1(0
ggmgR
1)1(0 gggR
1
0
Tt: technology stock at time t; Rt: R&D investment at time t; m: time lag between R&D and commercialization; : rate of obsolescence of technology; and g: growth rate of R&D investment at the initial period.
)())((),( TFTXFTXFY
NY
Yadt
Yd1
NYaY
dtdY 1
Production function in high-tech firms can be depicted as follows:

(3) US Locomotive Leveraging Transformation to FD Initiated Trajectory
Fig. 18. Trends in the US Policy for Enhancement of Competitiveness (1980-2004).
Young Report (1985) Global Competition: The New Reality
New Young Report (1987) America’s Competitive Crisis:Confronting the New Reality
29
InformationHighway (93)

1. System conflict led to an institutional less-elasticity in an information society resulting in a dramatic decrease in MPT.2. MPT decrease led to TFP decrease resulting in a decrease in innovation contribution to growth.3. Thus, co-evolution changed to disengagement in an information society. MPT: Marginal Productivity of Technology
(i) Dramatic Decrease in Marginal Productivity of Technology TFP: Total Factor Productivity
Inst
itutio
nal e
last
icity
(ii) Consequent Decrease in Innovation
USA System match
Fig. 6-2. Marginal Productivity of Manufacturing Technology(1975-1999) - Index: 1990 =1.
V = F (L, K, T)
L: labor, K: capital, T: technology stock
V/
MPT
( ∂∂
T)
0.65
0.75
0.85
0.95
1.05
1.15
1.25
1.35
1.45
1975 1977 1979 1981 1983 1985 1987 1989 1991 1993 1995 1997 1999
USA
Japan0.65
0.75
0.85
0.95
1.05
1.15
1.25
1.35
1.45
1975 1977 1979 1981 1983 1985 1987 1989 1991 1993 1995 1997 1999
1990
MPT
Fig. 6-1. Institutional Elasticity of Manufacturing Technology - Elasticity of the Shift to an Information Society to Marginal Productivity
of Technology (1980-1999) - Index:1990=100.
19901980 1999
∂ln
MPT
/∂
lnD
x
Industrial society Information society
Japan System conflict
GDP
Fig. 6-5. Marginal Productivity of Technology(1960-2001).
Fig. 6-3. TFP Growth Rate (1960-2001). Fig. 6-4. R&D Intensity (1975-2001).
TFP change rate (TFP/TFP) = R&D intensity (R/V) × Marginal productivity of technology (MPT)Innovation to GDP growth
-0.2
0.0
0.2
0.4
0.6
0.8
1.0
1.2
1975-1985 1985-1990 1990-1995 1995-2001
Mar
gina
l pro
duct
ivity
of t
echn
olog
y-1.0
0.0
1.0
2.0
3.0
4.0
5.0
6.0
7.0
1960-1975 1975-1985 1985-1990 1990-1995 1995-2001
Gro
wth
rate(%
p.a.)
2.0
2.2
2.4
2.6
2.8
3.0
3.2
1975-1985 1985-1990 1990-1995 1995-2001
Rat
io %
JP US JP US
JP US6.2
1.5 1.41.0
2.8
0.9-0.3
0.9 0.2
1.5
(4) System Conflict in an Information Society
30

31
(5) Swell of Japan’s Institutional MOT toward a Post-information SocietyAs a consequence of hybrid management fusing “East” and “West”, Japan’s indigenous MOT is again responding to a co-evolutionary dynamism between innovation and institutional systems corresponds to a ubiquitous economy.
Fig.19 . Swell of Japan’s New Innovation.
Industrial society(Materialization economy)
Information society(Digital economy)
Post-information society(Ubiquitous economy)
Manufacturing technologybased growth oriented trajectory
IT driven new functionalitydevelopment initiated trajectory
Service oriented manufacturing
Product oriented Function oriented Solution oriented
a. Seamless,(1) Increasing digitalization of manufacturing process,
(2) Advanced digital infrastructure or alliance, and
(3) Timely correspondence to the customer’s potential desire in the digital economy
1 Just in time cell production(synchronization of JIT and cell production system),
2 Super-flexible manufacturing system,
3 Full automation manufacturing ,
4 Co-evolutionary development between suppliers and customers,
5 Broad integrated consortia business,
6 On-demand manufacturing(full variety of on-demand products production), and
7 “J-sense” (sense of Japan) goods and system.
b. All actors participation and cooperation, and
c. On demand
d. Open-sourcing
e. Long tail

32
(6) Governing Factors to Functionality DevelopmentUnder the competitive circumstance where firms aim at maximizing their profits, equation (31) should be equivalent to relative prices as follows:
Y
TP
PPTY
(32)
P TP YPwhere : relative prices of technology; : technology prices of innovative goods; and : prices of innov. goods.
Equation (31) can be developed as follows:
PN
YaaYNYaY
TY
TY
2
)1( (33)
where dtdYY .
Differentiate equation (32) by time t,
)21()21(2FD
TaPNYYa
NYYaYaP
)FD
(TaPP 21
(35)
where a: diffusion velocity; and : price elasticity to technology (PET).
aTTP
aTTTPP
aTPP
Ta
FD 11
2
lnln11
211
211
2
Functionality development (FD) can be depicted as follows:
(34)
TP
PT
PT
lnln
FDaY
NYaY
TY 111 (31)

33
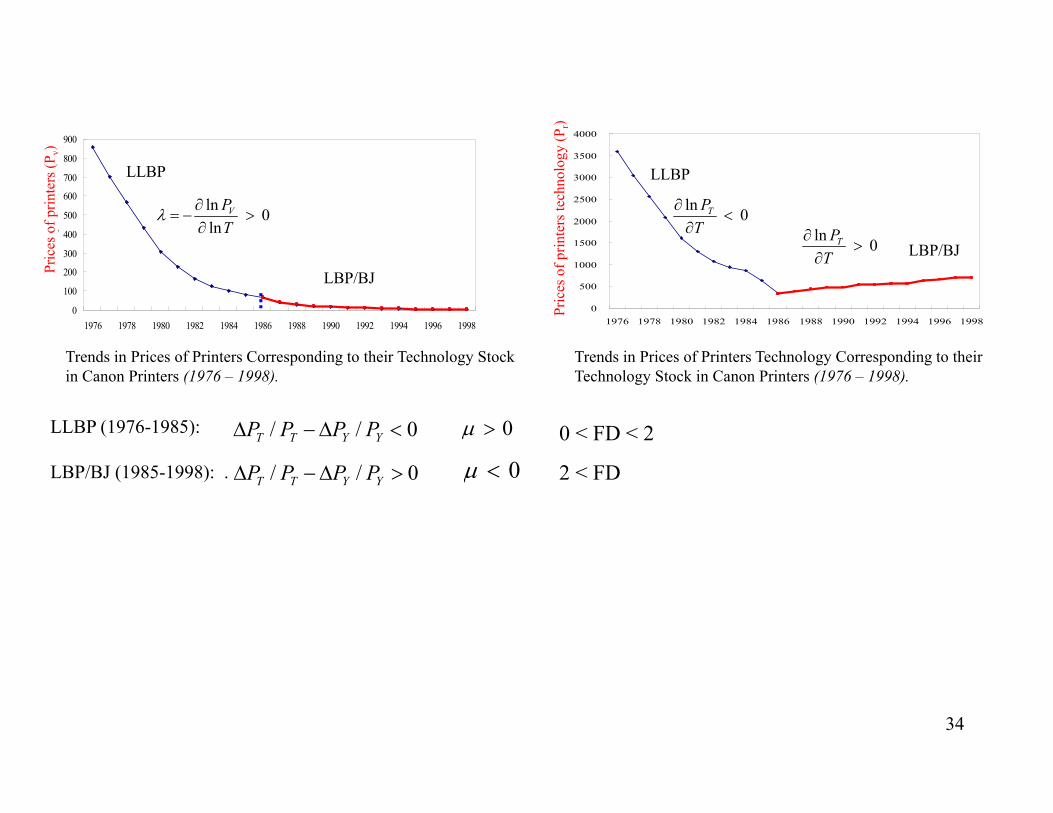
(7) Prices of Technology and Functionality Development
.
(35)
: price elasticity to technology (PET).
aTTP
aTTTPP
aTPP
Ta
FD 11
2
lnln11
211
211
2
TP
PT
PT
lnln
2 0 21 FDFD
T
YT PP
0 0
)0 ( )0 (
Pric
es
Technology
Products
Functionality-seeking
Mass-production
Technology stock
YYTT PPPPTT
PPTT
PT
///
//
lnln
0 when YYTT PPPP //
34
0
100
200
300
400
500
600
700
800
900
1976 1978 1980 1982 1984 1986 1988 1990 1992 1994 1996 1998
Pric
es o
f prin
ters
(PV
)
0
500
1000
1500
2000
2500
3000
3500
4000
1976 1978 1980 1982 1984 1986 1988 1990 1992 1994 1996 1998
Pric
es o
f prin
ters
tech
nolo
gy (P
T)
Trends in Prices of Printers Corresponding to their Technology Stock in Canon Printers (1976 – 1998).
Trends in Prices of Printers Technology Corresponding to their Technology Stock in Canon Printers (1976 – 1998).
LLBP (1976-1985):
LBP/BJ (1985-1998): .
0 lnln
TPV 0 ln
TPT
0 ln
TPT
LLBP
LBP/BJ
Pric
es o
f prin
ters
(Pv)
Pric
es o
f prin
ters
tech
nolo
gy (P
r)
LLBP
LBP/BJ
0// YYTT PPPP
0// YYTT PPPP
0
00 < FD < 2
2 < FD

35
4.6 Sustainable FD in Open Innovation (1) Timing of the Functionality Development
t1t2
3
3
dtYd
t
t
t
t
FD
])32(1[
33
qp
t
qp
qpt 32ln11
qp
qpt
321ln1
2
2
2
dtYd
dtdY
Y
tqp
tqp
e
epq
)(
)(
1
1
tqp
tqp
epq
eNY
)(
)(
1
)1(
FD
Emergence of FD
Shifting to the successive FD
Emergence of FDFig. 15. Timing of the Emergence of Functionality Development.
FD
1t t1
Earlier Emergence of FD
1t FD
Earlier FD emergenceSustainable FD

36
(2) Requirement for Earlier Functionality Development Emergence
03
3
dt
Yd ]32
ln[32
1ln11
xy
qp
qpt
xyx
dxdy
dxdt
pdqdt
]32
ln[/
11
where .2)]1([
])1[(,
)1(1,
)1(1
xp
pdxdpx
dxdy
xxpxy
xpy
Therefore, can be developed as follows:
)1(
])32(ln[])1[(1
)1(1
)1(1]
)32(ln[
)]1([
])1[(
/ 21
xp
xx
pdxdpx
xpxxpxx
xp
pdxdpx
pdqdt
where and .yqp
xpq
1/
pdqdt
/1
In case when ,1)1(
])32(ln[])1[()(
xp
xx
pdxdpx
xW 0/1 pdq
dt Necessary condition for earlier functionality development emergence
q/p increase induces earlier FD emergence leading to sustainable FD
p: innovatorq: imitator

(3) Boundary Satisfying Earlier FD Emergence
1)1(
])32(ln[])1[(0
/1
xp
xx
pdxdpx
pdqdt
1)1(
])32(ln[
)1(
])32(ln[)1(
xp
xx
p
xp
xxdx
dpx
1)1(
])32(ln[])32(ln[
x
xx
p
xxdx
dp
Aiming at identifying the boundary condition satisfying earlier FD emergence in the Bass model, the following analysis is attempted:
Table 4 Conditions of Boundary Function by Areas
321 x
)1(])32(ln[
1
)1(1
])32(ln[
110/1
xx
xpx
dxdp
xx
xpdx
dppdq
dt
32 x
)1(])32(ln[
1
)1(1
])32(ln[
110/1
xx
xpx
dxdp
xx
xpdx
dppdq
dt
If , then , and so
where : x elasticity to p.
If , then , and we get
0])32(ln[ x
0])32(ln[ x
Area x
I + +
II + -
III - -
IV - -
V - +
dxdp
dxdt1
321 x
32 x
1.11x
321 x
32 x
0
0
01
0
0
-4
-3
-2
-1
0
1
2
3
4
1 4 7 10 13 16 19 22 25 28 31 34 37 40
x (q/p)32
Ⅰ Ⅱ
Ⅲ
ⅣⅤ
x# = 11.1
)(px
dxdp
010
B(x)
B(x)
)1(])32(ln[
1)(x
x
x
xB
32,1 xxwhere
Fig. 20. Areas Satisfying Earlier FD Emergence.
(the crossing point of boundary function)
37

Table 5 Diffusion Parameters in Major Innovative Goods and ServicesN p q adj. R2
Printer aLLBP
(1975-1994)1581
(19.33)5.4310-3
(15.13)5.810-2
(9.94)0.999
LBP/BJ(1987-2005)
97205(166.57)
1.4710-3
(2.27)2.910-2
(37.96)0.999
MP(1990-2006)
MP 138216
(149.45)0.1210-1
(5358.9)0.5810-1
(2616.7)
MP 265741
(170.24)0.2210-2
(1270.1)0.3510-1
(438.3)
LCD(2000-2008)
LCD 1 2.4103
(1654.3)0.310-2
(1654.3)0.210-1
(1654.3)0.999
LCD 2 2.4103
(656.1)0.410-4
(1654.3)0.810-1
(1654.3)
Web(1993-2006)
Web 1.0 2.42105
(145.87)1.3810-5
(8.35)1.0810-1
(58.33)0.999
Web 2.0 2.49105
(75.66)0.2510-5
(2.60)0.5510-1
(22.74)
a Since the period of co-existence of LLDP and LBP/BJ was limited, simple Bas model was used for respective innovation.b Figures in parentheses indicate t-value. All demonstrates statically significant at the 5% level.c LLBP: Large-scale Laser Beam Printer; LBP: Laser Beam Printer; BJ: Bubble Jet Printer; LCD: Liquid Crystal Display; MP: Mobile phone; and Web: Internet dependency
based on the number of co.jp domains.d Sky Walker: Triggered e-mail transmission by mobile phone; RSS 2.0 (Really Simple Syndication): Triggered publishing updated works in a standardized form as blog and video;
NGPVs (Next Generation PV System): Triggered acceleration of customers initiative in PV development and introduction by means of highly advanced next generation technology.
(4) Diffusion Dynamics in Major Innovation
PV(1976-2007)
PV 1 0.50105
(8.81)19.3610-5
(3.87)2.6610-1
(45.22)0.999
PV 2 12.71105
(8.82)0.0410-5
(5.72)4.1110-1
(47.89)
x =q/p
10.7
19.3
5.0
15.6
2.59
-0.24
0.60
xdpd
lnln
7.3
7.8103
0.1104
105.4104
-0.87
-0.83
-0.92
1.9103
22.0103 -0.89
-0.83
-0.35
0.03
Sky Walker(1997/10)
RSS 2.0(2003/7)
NGPVs(2006)
0.999
0.999
Trigger of new innovation
tqp
tqp
tqp
tqp
epq
eN
epq
eNtY)(
2
2
)(2
)(
1
1
)(1
22
22
11
11
1
)1(
1
)1()(
(28)
38

Fig. 21. Sustainable Functionality Development Condition.
1. While latest high-technology products as LBP/BJ, MP 2, LCD 2, Web 1.0, Web 2.0, PV 1 and PV 2 satisfy conditions for sustainable functionality development, LLBP (1976), MP 1 (1996) and LCD 1 () do not satisfy these conditions resulting in being substituted by LBP, BJ, MP 2 and LCD 2.
2. This can be considered as substitution from ‘resistance to innovation’ in the early introduction to market,to supra-functionality with customers own initiative.
(5) Sustainable FD by Major Innovation
-1
-0.5
0
0.5
1
1.5
2
5 10 50 100 500 1000 5000 10000 15000 20000 2500032 x (q/p)
px
dxdp
LLBPx# = 11.1
)1(])32(ln[
1)(x
x
x
xB
MP 1
LCD 1
Supr
a-fu
nctio
nalit
yR
esis
tanc
e to
inno
vatio
n
Sky Walker
LBP/BJ
Web 1.0 Web 2.0
q substitutes for pMP 2
LCD 2
RSS 2.0 NGPVs
PV 2PV 1
)(lnln0 xB
xdpd
px
dxdp
(x = q/p)
p, q dynamism forEarlier emergence of FD
0/1 pdq
dt
39

(6) New FD Frontier
Fig. 22. New Functionality Development Frontier Leading to Supra-functionality.
Explore new FD frontier
Instills customers“exciting story with their initiative as heroes/heroines” and thrills them gratification
Incorporates innovation new social,cultural and aspirational value beyond economic value
Printers
Print office
Mobile phone
Communication Watch
LCD WebPassive
information
PV
Electric power company
Home print Internet IPTV Blog Clean energy
Depend on
only dependent
Purchase from
-1
-0.5
0
0.5
1
1.5
2
5 10 50 100 500 1000 5000 10000 15000 20000 2500032 x (q/p)
px
dxdp
LLBPx# = 11.1
)1(])32(ln[
1)(x
x
x
xB
MP 1
LCD 1
Sup
ra-f
unct
iona
lity
Res
ista
nce
to in
nova
tion
Sky Walker
LBP/BJ
Web 1.0 Web 2.0
q substitutes for pMP 2
LCD 2
RSS 2.0 NGPVs
PV 2PV 1
)(lnln0 xB
xdpd
px
dxdp
(x = q/p)
p, q dynamism for Earlier emergence of FD
0/1 pdq
dt
-1
-0.5
0
0.5
1
1.5
2
5 10 50 100 500 1000 5000 10000 15000 20000 2500032 x (q/p)
px
dxdp
LLBPx# = 11.1
)1(])32(ln[
1)(x
x
x
xB
MP 1
LCD 1
Sup
ra-f
unct
iona
lity
Res
ista
nce
to in
nova
tion
Sky Walker
LBP/BJ
Web 1.0 Web 2.0
q substitutes for pMP 2
LCD 2
RSS 2.0 NGPVs
PV 2PV 1
)(lnln0 xB
xdpd
px
dxdp
)(lnln0 xB
xdpd
px
dxdp
(x = q/p)
p, q dynamism for Earlier emergence of FD
0/1 pdq
dt
by own design
Explore new world
with as preferred as hero/heroines by own interior design
only
multimedia services
interactivity
40

a RSS: Really Simple Syndication; and NGPVS: New Generation Photovoltaic System.
MP[Sky Walker]
Web[RSS 2.0]
PV[NGPVS]
E-mailtransmission
Blog, video, news headline
User orientedPV systems
New FD frontier which instills in users an “exciting story on their own initiatives as heroes/heroines” thrills them with gratification beyond economic value
Only communication
E-mailtransmission
New communication
community
Onlyvisit and watch RSS a
Embraced by Web publisher
Expensive,inconvenient NGPVS a
House designinterior
curtain, wall
41

42
(7) Strategy for Substitution
Table 6 Concept of Imitator Substitutes for Innovator
Customer substitutes for supplier
Open innovation
Coopetiotion (Cooperation and competition)
Co-evolutionary domestication
q (imitator) substitutes for p (innovator) Assimilation of spillover technology
Hybrid management of technology
Knowledge transfer
Sustainable FD
Innovator ImitatorLeader FollowerSupplier CustomerProducer ConsumerFear to new products Gratification of consumption

43
4. Effects of Learning4.1 Learning by Doing
4.2 Theory of Learning by Doing
4.3 Learning Curve
4.4 Market Learning
4.5 Hybrid Management of Technology
4.6 Necessity for Effective Learning

44
),,( TKLFY 1KATL
1KLAe t
,iijj qwpvXY
jj
jjj
ii
iii Xp
Xpv
YqYqw ,
))(,( TKLFY
/)]1([ kf
LKkLYf /,/
)/(/ kkgff
nbccK
LaKY nn
1/],)1(1[ 1/11
nbKKL )(
Solow (1956)
Denison (1962)
Solow/Johansen (1960)
SMAC (1961)
Kaldor (1962)
Arrow (1962)
Solow residuals → Technological
progress
TFP
Technology embody into capital
CES (Constant elasticity of substitution)
Technological progress function
Learning by doing
(1) Chronology to Endogenous Technological Improvement
4. Effects of Learning4.1 Learning by Doing
Fig. 23. Chronology to the Initial Efforts to Endogenous Technological Improvement.
Kenneth J. ArrowAug. 23, 1921 (age 91)United StatesStanford UniversityMacroeconomicsGeneral equilibrium theorySocial choice theory
1972 Novel prize in Economics
Solow, Minhas, Arrow, Chenery
Technical change was assumed to change
exogenously
Why firms innovate?
Endogenous growth theoryInnovation and
technical change are determined endogenously

45
David (1975)
Kaldor (1962)
Arrow (1962)
US technology is more Capital intensive
than UK’s
Habbakuk’s postulate (1962)
Learning
Hicks (1932)
Kennedy (1964) Weisaecker (1966) Phelps (1966)
Induced invensions
Labor saving ← Labor saving bias
Unbalance of tech.
Improve quality
Induce Smaller labor
Diffuse
Growth Resources dependency
Capitalto industry
Laborto agriculture
[Plausible]
1. Unbalance of tehcnology
2. Labor saving bias
3. Resources scarcity inducement
Rosenberg (1976) Binswanger (1978)
[Inplausible]
Technological learning Induced innovation
(2) Learning, Diffusion and Induced Innovation
Fig. 24. Technological Learning, Diffusion and Induced Innovation.

46
(3) Dynamism between Innovation, Diffusion, Learning and Spillover
Innovation
Diffusion
Embed to prod. facts. Disseminate into socio-economy
Labor Capital Economy Society Transfer of labor/capital
Reflect to prod. process Technol. spillover
Productivity improvement
Production increase/growth
Utilizat. of prod. growth
Further innovation investment
Effects of learning
Fig. 26. Innovation, Diffusion, Learning and Spillover Dynamism.
Assimila. of spillover tech.
Effects of learning 1962 Kaldor △(Y/L)/(Y/L) = F(△(K/L)/(K/L)) Technical Progress Function 1962 Arrow L =λ(K) = b K a Learning by doing
Embed to production factors 1964 Nelson (Capital) Vintage Model 1967 Denison (Labor) Quality of Labor
Technology spillover 1979 Griliches Technology Distance 1982 Scherer 1986 Jaffe Proximity
25

47
(4) Contribution of Learning to TFP Growth
Own efforts R&D Technology investment knowledge stock
Dependent Spillover Assimilation technology
Learning effectsEconomies of scaleLabor quality improvement Maturity of capital stockIndustrial structural changeImprovement of managementExternal economy, policy effects
Direct effects
Indirect effects
Technologicalimprovement
Productivity increase
Technological progress
TFP
25 Aug Accumulation of technology knowledge1 Sep Diffusion of technology
15 Sep Effects of learning6 Oct Technology spillover
47

3.0
1.3
-0.6-0.9
Gro
wth
rat
e of
GD
P(%
p.a
.)
1960-1975 1975-1985 1985-1990 1990-1995 1995-2001
Industrial society Information society
Energy crises
High-tech. miracle
Lost decade
9.7
2.23.4
2.0 1.8
6.2
1.42.8
-0.3 0.2
(Rapid economic growth)
48
Fig. 26. Trend in Contribution of Learning to TFP and Consequent GDP Growth Rate in Japan (1960‐2001) - % p.a.
1960‐1973 1975‐1985 1985‐1990 1990‐1995 1995‐2001
GDP (TFP) 9.7 (6.2) 2.2 (1.4) 3.4 (2.8) 2.0 (-0.3) 1.8 (0.2)
Direct effect of R&D investment
1.0 0.2 0.5 0.2 0.3
Indirect effect of R&D investment
2.2 0.4 1.0 0.4 0.5
Learning and spillover effects
3.0 0.8 1.3 - 0.9 - 0.6
Japa
n’s T
FP c
ompo
sitio
n
Source: Watanabe (2005). Japan 0.6 1.1 U S 0.4 0.3
REG
0.8
9.7
2.23.4
2.0 1.8
3.8 3.4 3.22.4
3.9
6.2
1.5 1.4 1.02.8
0.9 -0.30.9 0.2
1.5
Industrial society Information society
JP US
Con
trib
utio
n of
le
arni
ng to
TFP
Con
trib
utio
n of
in
nova
tion
Japan US comparison (growth rate-% p.a.)
GDP
TFP
1960-1975 1975-1985 1985-1990 1990-1995 1995-2001
(5) Japan’s Unique X Efficiency Depending on Learning
MPT
1. Japan accomplished conspicuous X-efficiency during the period of industrial society.
2. Which contributed to increase MPT.3. This can be attributed to Japan’s intensive
learning efforts.
Learning led to high MPT

4.2 Theory of Learning by Doing(1) Learning Incorporated Production Function
Arrow considered requirement of labor decreases as capital (K) increases with a following function:
Based on this analysis Arrow developed the following production function:
(2) Increasing Returns to Scale BehaviorAbove production function demonstrates increasing returns to scale.
e.g., in case n=1 (same as the case ),
While in general production function,(when △K/K > △L/L)
nbKKL )(
)(1111
1
11
bL
n
neaK
cKLaKV
)1( n
bL
eaK 1 )1( n
01
n
bc
(35)
(36)
(37)
1n
)1( /bLeaKV bLeKaV /lnlnln KKebLKKVV bL /)/(// / (when△L > 0 )
KKKKKKKKKKLLVV //)(/////
b: Coefficient > 0, n: Leaning coefficient > 0
a: Production capacity corresponding to K > 0
)()( )/()(,lnlnln,1 bLbL eLLbLKK
VVeKaVnofcaseIn
0)1(
111
nn
)1(
}{1
1
))(1())(1(
}){(1
,)(
)(
))(1(
))(1(
1
11111
1
11
11
111
bL
nbL
bL
n
nn
eaK
eaKV
ecK
LbLn
bLn
Lb
ncK
LbLK
n
n
nnbLn
n
KK
49

50
)1(ln
)1(011
)()(
)0()()(
0,0)()0()(
})({)(
)(,)()(
)()()()(
)()(
)()(
:)(,)(
:)(,)()(
)(),,(
0
0 0
0 0
0
0
11
0
1
100
0
0
nKbdKKb
nn
bccKKn
bdKbKKK
KaKadKKK
nbbKKaaK
LKKV
LKKLKK
KKVKKL
dKKK
dKKK
KdKKV
KdKKKLL
KLLKLFV
K
K
nnK
K
K
K
n
K
K
K
K
n
K
K
K
K
nnnn
cLcK
cLKLKLK
cLKK
cK n
1
111
11
11
}{})({})({,)(}))(({,)(1
1
)1(}1{1}{1})({}{ 11
1
11
11
11
11
111
ncK
LaKcK
LaKaKcK
LcKKaaKc
LcKaaKV nn
n
nnnn
nnn
)1(
,})({,)()(,)(ln
1
)()(
)()(
bL
bL
bL
bK
bLK
bLK
bLK
bK
eaKeaeaKeaeaKaeaKY
eLKLKeKe
bKb
12
3
4
5
6789
Number of labor
Production capacity
From 6
Substitute 8 for 7Provided that 10
11
12
13
14
From 13
Substitute 15 for 9
When n = 1, from 14,
Substitute 17 for 9
15
16
1718
Appendix: Mathematical Development of Arrow’s Learning Incorporated Production Function
0,)(),(
nbbKKL
KLFVn
)1(1
01
)1()1(1 11
1
neaK
nbcn
cKLaKV
bL
nn
KK
VV
Increasing returns to scale
Learning effects
KforLKsubstitutetheninKforcKSubstitute
functionreverse
n
)(13)/(
:
11
1

51
(1) Learning CoefficientIncorporation of the effects of learning in production function can be examined bylearning curve (or experience curve) that illustrates correlation betweencumulative production and prices.
Asuume that prices of product P and cumulative production Y* (=ΣY), learning curve can be depicted by the following equation: P = A・Y*-λ
where A: scale factor, λ: learning coefficient.
Given that P = P(Y*),
LR = - [P(2Y*) - P(Y*)]/P(Y*) Price declines by LR % for each doubling of cumulative production
PR = P(2Y*)/P(Y*) = 2 -λ = 1 - LR Speed of learning
P(2Y*)/P(Y*) = A2Y*-λ/AY*-λ= 2-λ= 1-LR
(3) Progress Ratio (PR)
(2) Learning Rate (LR)
4.3 Learning Curve
(38)
(39)
(40)

52
― 日本の産業の太陽電池開発における学習効果(1980-1995)
0 10 20 30 40 50 60 70 80
-20 80 180 280 380
1980
851990 95 98
79
99
累積太陽電池生産量(CMSCP)
太陽電池生産価格(PSC
)
0
1
2
3
4
5
-
2
0 2 4 6
198
0 8
5199
0 99
79 log (PSC) = 3.65 - 0.34 log (CMSCP) adj.R2
DW (-38.39) 0.987 1.18
累積太陽電池生産量(CMSCP)
太陽電池生産価格(PSC
)
Fig. 27. Learning Effects of PV Development in Japan’s Firms (1979-1999).
ln PSC = 3.65 – 0.34 ln CSCP 0.987 DW 1.18(-38.39)
(4) Measurement of Learning Effects
2.Radj
CumulativeCumulative solar cell production (CSCP)
(-38.39)
Cumulative solar cell production ( ln CSCP)
Pric
es o
f sol
ar c
ell (
PSC
)Pr
ices
of s
olar
cel
l (ln
PSC
)
1980
1990
2

53
表 1 日本の太陽電池生産代表企業の学習効果係数 (1976-1990)
Model: PSC = A*CMSCP (t 値) 2. R adj DW 産業全体 -0.35 (-22.80) 0.981 1.42 1976-1990
[ -0.37 (-73.88) 0.997 1.60 1976-1995 ]
PV 企業 A -0.12 (-28.31) 0.988 2.09 1976-1990
B -0.25 (-25.92) 0.988 2.63 1976-1990
C -0.29 (-7.47) 0.871 1.49 1976-1990
D -0.69 (-18.99) 0.978 2.53 1981-1990
E -0.41 (-9.34) 0.911 1.77 1976-1990
F -0.31 (-14.46) 0.962 1.52 1976-1990
PSC: 太陽電池生産価格(実質価格),CMSCP: 累積太陽電池生産量 A~F には次の太陽電池生産リーディング企業を含む.三洋電機,京セラ,シャープ,鐘淵化学,富士電機,日立
Table 7 Learning Coefficients in Japan’s Leading PV Producing Firms (1976-1990)
CSCPAPSC t-value
PV firms
Whole industry
PSC: Prices of solar cell (fixed prices), CSCP: Cumulative solar cell production.A-F: leading PV firms including Sanyo, Kyocella, Sharp, Kanegafuchi chemicals,
Fuji electrics and Hitachi.

54
PSC: Prices of solar cell
SCP: Production of solar cell
PVR: PV R&D by industry
Decline in solar cell production prices
Increase in solar cell production
Inducement of industry R&D
PV development initiated by MITI’s Sunshine Project
Increase in PV technology stock
*4 *5
*3
*6
*2
*1
SSPV: R&D budget in the Sunshine Project
TPV: Technology stock of PV
adj.R2 DW
*1 log(PVR) = 1.37 + 0.77 log(SSPV -1) 0.979 1.31 (29.35) *2 TPVt = PVRt-m + (1-ρ)TPVt-1 m = 2.8 年, ρ= 20.3% *3 log(SCP) = -8.26 + 2.19 log(TPV) + 5.94 log(Pey) 0.985 1.75 (35.48) (13.60) *4 log (PSC) = 11.97 - 0.97 log(TPV) - 1.04 log(Pey) 0.988 1.53 (-39.51) (-5.59)
Effects of technology stock and energy prices log (PSC) = 130.87 - 0.06 Year - 0.31 log(SCP) 0.995 1.38 (-9.32) (-18.87)
Effects of learning and economies of scale *5 log(SCP) = 16.97 - 2.02 log(PSC -1) + 2.98 log(Pey -1) 0.995 1.25 (-58.73) (13.61) *6 log(PVR) = 3.59 + 0.43 log(SCP) 0.973 1.03 (25.96)
Fig. 28. Virtuous Cycle of Japan’s PV Development (1976-1995).
Pey: Relative energy prices

(39)
4.4 Market Learning(1) Dynamic Learning Coefficient
Learning function according to diffusion of innovative good Y YAP (38’)
P: fixed prices of PCs; A: scale coefficient; Y : cumulative production; : learning coefficient.
These dynamic learning coefficients 1, 2, … n are learning results regarding as effects of “marketing learning” during a serial process of production, distribution and usage.
Learning coefficients in the market learning are a series of continual coefficients during production, distribution and usage phases when they are diffused, these coefficients are expressed as function of t as:
in
iin tattttt
0
321 ))(,),(),(),(()( (39)
bi is the ith coefficient of column t.
YtaAP in
ii lnlnln
0
is disturbance column which is independent from (t) .(t) can be computed by taking differentiation of equation (38’-2) by lnY.
(38’-2)
n
i
iita
YP
0lnln
55

56
(2) Dynamic Learning Coefficient of PCs: An Empirical AnalysisDynamic learning coefficient of China’s PC is measured by the following equation with the usage of fixed prices of PCs:
lnA a0 a1 a2 a3 a4 a5 d adj. R2 DW AIC
n = 3
11.79 (3.37)
0.37 (3.63)
-0.029 (-1.70)
3.2*10-3
(2.79) -8.7*10-5
(3.35) 0.30
(3.37)0.996 1.38 -51.79
n = 4
12.01 (122.99)
0.84 (5.35)
-0.17 (-3.98)
0.020 (4.07)
-9.3*10-4
(-3.82) 1.5*10-5
(3.47) 0.27
(3.93)0.997 2.03 -62.76
n = 5
11.89 (85.61)
-0.50 (1.48)
0.033 (0.26)
-3.3*10-3
(0.15) -9.5*10-4
(-0.56) 5.7*10-5
(0.88) 1.0*10-6
(1.12) 0.26
(3.85)0.997 1.29 -62.65
Table 8 Comparison of Dynamic Learning Coefficient of China’s PCs (1982-2002)
0.2
0.3
0.4
0.5
0.6
0.7
0.8
1982 1984 1986 1988 1990 1992 1994 1996 1998 2000 2002
Dyn
amic
lear
ning
coe
ffic
ient
(λ)
Import parts dependence period
Market expansion period
Real Competitive Market Period
45342 10*5.110*3.9020.017.084.0)( ttttt
Fig. 29. Trend in Dynamic Learning Coefficient of China’s PCs (1982-2002).
n
iT
iiT dDPCtaAdDPCtAP
08181 lnlnln)(lnln

57
n
iT
iiT dDPCtaAdDPCtAP
08282 lnlnln)(lnln
a2 a3 a4 d adj. R2 DW AIC
n = 2 1.91(1.04)
0.08(0.20)
-0.018(-1.08)
2.2*10-4
(0.52)0.27
(1.04)0.923 0.56 -1.73
n = 3 7.66(5.90)
-1.40(-4.53)
0.11(5.13)
-8.5*10-3
(-6.34)2.1*10-4
(6.60)0.68
(4.74)0.979 1.38 -28.30
n = 4 5.63(2.35)
-0.84(-1.33)
0.039(0.52)
-6.8*10-5
(-0.01)-2.5*10-4
(-0.55)8.9*10-6
(1.01)0.47
(1.88)0.979 1.29 -27.81
0.6
0.8
1.0
1.2
1.4
1982 1984 1986 1988 1990 1992 1994 1996 1998 2000 2002
3423 10*1.210*5.811.040.1)( tttt
Fig. 30. Trend in Dynamic Learning Coefficient of Japan’s PCs (1982-2002).
Table 9 Comparison of Dynamic Learning Coefficient of Japan’s PCs (1982-2002)

58
(i) Japan’s Dynamic Learning Coefficients of PCsThe value of Japan’s coefficient is higher than that of China’s, but it decreases continually.
0.2
0.3
0.4
0.5
0.6
0.7
0.8
1982 1984 1986 1988 1990 1992 1994 1996 1998 2000 2002
Dyn
amic
lear
ning
coe
ffic
ient
(λ)
Import parts dependence period
Market expansion period
Real Competitive Market Period
45342 10*5.110*3.9020.017.084.0)( ttttt
Fig. 31. Trends in Dynamic Learning Coefficient of China’s PCs(1982-2002).
(ii) China’s Dynamic Learning Coefficients of PCsa. The value of coefficient was in the bottom in 1980s, and it increased in 1990s near to the value of
Japan’s;
b. It increases when the effect of technology spillover began to decrease at the beginning of 1990s;
c. That is, “Technology of China’s PCs was accelerated by marketing learning effects after full enjoyment of spillover technology during market expansion period .”
0.6
0.8
1.0
1.2
1.4
1982 1984 1986 1988 1990 1992 1994 1996 1998 2000 2002
3423 10*1.210*5.811.040.1)( tttt
Fig. 32. Trends of Dynamic Learning Coefficient of Japan’s PCs (1982-2002).

59
Interpretation by the Empirical Analysis
(1) PCs prices decreased rapidly when entering into market expansion period;
(2) China’s government reduced tariff, abolished the system of import permission, theprotection ordinance of computer software was executed, and joint-production waspermitted ( it was restricted to foreign sale by themselves in domestic market)during 1991, 1992. Foreign producers reduced their prices to expand their salesshare in the market.
(3) China’s producers reduced prices to opposite foreign producers because of poorfunctionality. However, it is limited to only depend on the effect of technologyspillover, it should expand range of learning including setting up new factories,production and distribution.
(4) Lenovo’s PCs had No.1 share of China’s domestic market through the marketinglearning in 1996.

60
2.2
1980 1983 1986 1989 1992 1995 1998 2001 2004 2007 20100.8
1.0
1.2
1.4
1.6
1.8
2.01997 Sharp
1992 Canon 1999 Matsushita (Panasonic)
2000 Hitachi
(1) Learning Efforts of Leading High-Technology Firms1. While learning coefficient has declined in Japan’s leading firms due to puffing-up of the success in the1980s
(Not Invented Here: NIH syndrome), certain high technology firms have maintained intensive learning.2. Canon can be one of the typical example which learned system LSI, SCM and cell production system from
external market.
Inflection year
Learning coefficient(2004/1990)
Canon 1992 1.25
Sharp 1997 1.01
Panasonic 1999 0.97
Hitachi 2000 0.94
Fig. 33. Learning Coefficients in 4 Electrical Machinery Firms (1980-2003).
4.5 Hybrid Management of Technology: Learning vs NIHL
earn
ing
coef
ficie
nt

61
0.00
0.10
0.20
0.30
0.40
0.50
0.60
KEY
FAN
RO
M
MU
R
CA
N
TOK
KY
C
TDK
RIC
SHA
SEI
MTE
MA
I
FLT
TOS
HLT
NEC
SAY
SON
Fig. 34. Technoprenurial Positions of 19 Electrical Machinery Firms (2001-2004).
1 CAN Canon
2 SHA Sharp
3 RIC Ricoh
4 FAN Fanuc
5 SEI Seiko Epson
6 SAY Sanyo
7 SON Sony
8 MUR Murata
9 ROM Rohm
10 KYC Kyocera
11 KEY Keyence
12 HLT Hitachi
13 MAI Matsushita (Panasonic)
14 NEC NEC
15 TOS Toshiba
16 FLT Fujitsu
17 MTE Mitsubishi
18 TDK TDK
19 TOK Tokyo Electron
(2) Bi-polarization of Technopreneurial Trajectory
Firms technology progress W depends on the ratios of (i) R&D and operating income X and (ii) operating income and sales Y.
W = F (X, Y) Taylor expansion to the secondary term, lnW = a + b lnX + c lnY + d lnX ・ lnY (a, b, c, d: coefficients)
lnW, lnX, lnY → growth rate of TFP ,R/OI (R&D expenditure to OI),OI/S (operating income to sales)
SRd
SR
ROIc
ROIba
SOI
OIRd
SOIc
OIRba
TFPTFP
1
SOI
SOITS
Mar
gina
l Pro
duct
ivity
of T
ech.
Operating Income to Sales(OIS)
Group B Group A
y
yz
z
yy
z
160.0
0.047
FAN
CAN
SHA
MAIHLITOSMTEFLTNEC
xxx
x
xx
xxx
x
x
RIC
xSON
x
TS
( )
- 0.017
xTDK
x TOK
KEYx
xROMMURx
xKYC
yz
SEISAY
Group A
Group B
OIS (2004-2007) in 19 firms
1. Japan’s leading electrical machinery firms demonstrate bi-polarization in their technopreneurial trajectories.
2. Virtuous cycle in Group A between OIS and MPT, while vicious in GroupB..

62
Organizational Inertia by Firm Size
SRSDSRTDI /ln)(/lnln 21 (i) Differences of the endeavor to technological diversification challenge due to organizational inertia by firm size
(ii) D(S) can be depicted by a logistic growth function.
TDI : Technological diversification index,R/S : R&D intensity.
0.0
0.5
1.0
1.0 1.5 2.0 2.5 3.0 3.5 4.0 4.5 5.0 5.5 6.0
売上高 (1995年実質: 兆円)
組織の慣性
24.1807.5
1ln1
1ln
11
1
1
01
0
01
S
SSSS
SS
e
e
SD
1995-1998
S0: 2.7, S1: 5.1, ε: 0.9, η: 0.0005
24.1807.511
Se
SD
Sa
PanasonicHitachiNEC
Toshiba
Fujitsu
Mitsubishi
Sharp
Sony
Canon
Sanyo
Fig. 35. Organizational Inertia Corresponding to Firm Size in Japan’s Leading 10 Electrical Machinery Firms (1995-1998).
Sales S (1995 fixed prices: trillion Yen)
Organizational inertia
index D(S)
Organizational Inertia Index

63
(3) Hybrid Management -Fusing East and West (i) Japan is emerging from years of sluggish growth (Group A firms).
(ii) Its firms appear to have produced something.(iii) Management method that incorporates lessons from US firms (West)
while preserving the practices that once made Japanese firms famous (East).
Fig. 43. Scheme of Fusion.
Close Merge Fuse

64
4.6 Necessity for Effective Learning1. Success in Hybrid Management of Technology can be attributed to learning effects (West) based on
indigenous strength (East) thereby “fusing East and West” was realized.
2. Fundamental ability distinguishing between(1) To be learned and not to be learned, and(2) To be able to learn and not able to learn.
3. For that following abilities are required:(1) Curious to know new/exotic experience,(2) Willing to be actively involved in the experience,(3) Able to distinguish harm/good, and can/cannot,(4) Able to reflect on the experience,(5) Possessing analytical skills to conceptualize,(6) Possessing decision making and problem solving skills,(7) Envisioning fusion between East and West.
Absorptive capacityAssimilation capacity
Effective utilization of spillover technology