Embed Size (px)
Citation preview

Graduate Theses, Dissertations, and Problem Reports
2013
Column Flotation of Subbituminous Coal Using the Blend of Column Flotation of Subbituminous Coal Using the Blend of
Trimethyl Pentanediol Derivatives and Pico-Nano Bubbles Trimethyl Pentanediol Derivatives and Pico-Nano Bubbles
Jinxiang Chen West Virginia University
Follow this and additional works at: https://researchrepository.wvu.edu/etd
Recommended Citation Recommended Citation Chen, Jinxiang, "Column Flotation of Subbituminous Coal Using the Blend of Trimethyl Pentanediol Derivatives and Pico-Nano Bubbles" (2013). Graduate Theses, Dissertations, and Problem Reports. 3384. https://researchrepository.wvu.edu/etd/3384
This Thesis is protected by copyright and/or related rights. It has been brought to you by the The Research Repository @ WVU with permission from the rights-holder(s). You are free to use this Thesis in any way that is permitted by the copyright and related rights legislation that applies to your use. For other uses you must obtain permission from the rights-holder(s) directly, unless additional rights are indicated by a Creative Commons license in the record and/ or on the work itself. This Thesis has been accepted for inclusion in WVU Graduate Theses, Dissertations, and Problem Reports collection by an authorized administrator of The Research Repository @ WVU. For more information, please contact [email protected].

Column Flotation of Subbituminous Coal Using the Blend of Trimethyl
Pentanediol Derivatives and Pico-Nano Bubbles
Jinxiang Chen
Thesis submitted to
the Benjamin M. Statler College of Engineering and Mineral Resources at
West Virginia University
in Partial Fulfillment of the Requirements for the Degree of
Master of Science
in
Mining Engineering
Felicia F. Peng, Ph.D., Chair
Yi Luo, Ph.D.
Roger Chen, Ph.D.
Department of Mining Engineering
Morgantown, West Virginia
2013
Keywords: Subbituminous Coal, Low Rank Coal, Semi-batch Cell Flotation,
Column Flotation, Pico and Nano Bubbles, Trimethyl Pentanediol Derivatives

ABSTRACT
Column Flotation of Subbituminous Coal Using the Blend of Trimethyl
Pentanediol Derivatives and Pico-Nano Bubbles
Jinxiang Chen
Subbituminous coal, a low rank of coal, is difficult-to-float using the conventional
flotation process by a single frother such as MIBC and a single collector such as kerosene
or fuel oil. The froth flotation of the fine coal separation process is based on the
differences of wettability between coal and mineral particles. The formation of
oxygenated functional groups on coal surface can reduce its hydrophobicity. This result
makes the coal more difficult to float by oily collector alone. Previous work shows that
the surfactant can be used to activate the oxygenated surface, by selecting the group of
such as fatty acids, trimethyl pentanediol derivatives, hydroxylated ether amine, etc. In
the present study, the blend of trimethyl pentanediol derivatives as frother and kerosene as
collector are used in column flotation of subbituminous coal. The frother made of
trimethyl pentanediol derivatives provides better spreading of oily collector, froth stability,
and selectivity.
The flotation column used is equipped with a static-mixer and a venturi cavitation
tube for pico and nano bubble generation, and a double funnel tailings separator. Three
stages of statistical design of experiment of column flotation are conducted to optimize
operation conditions. The results show that 96.87% of combustible material recovery and
13.13% of clean coal ash content are obtained. The effect of pico and nano bubbles is to
increase the recovery of low rank coal. Furthermore, clean coal with the combustible
material recovery of 81.2% and ash content of 9.1%, by desliming minus 45 μm size
fraction particles of feed coal before column flotation are also achieved.

iii
ACKNOWLEDGEMENT
I would like to express my great thankfulness to my graduate advisor Dr. Felicia F.
Peng for her guidance, advice and encouragement during my study in West Virginia
University. Her propositions for my research activities act an important role for my
academic development. Her attitude and diligence toward work has greatly influenced
me and directly lead to the success of my academic and my personal development. I
also would like to express my gratitude to Dr. Yi Luo from the Department of Mining
Engineering and Dr. Roger Chen from the Department from Civil and Environmental
Engineering of West Virginia University for their advice and recommendations for my
research.
I also would like to give my deepest appreciation to all the graduate students in
Mining Engineering for their friendship. This work is performed under a project
sponsored by the West Virginia State Energy and Coal Research Bureau. Their
financial support is gratefully acknowledged.
Finally, I would like to express my greatest appreciation to my family whose love,
encouragement and support help me achieve my final success.

iv
TABLE OF CONTENTS
Page
ABSTRACT .................................................................................................................. II
ACKNOWLEDGEMENT .............................................................................................. III
TABLE OF CONTENTS ................................................................................................IV
LIST OF TABLES ..........................................................................................................VI
LIST OF FIGURES .....................................................................................................VIII
CHAPTER 1 .............................................................................................................. 1
INTRODUCTION ..................................................................................................... 1
CHAPTER 2 .............................................................................................................. 3
BACKGROUND ....................................................................................................... 3
2.1 Flotation Basics ................................................................................... 3
2.2 Operating Parameters of Flotation ..................................................... 6
2.3 Chemical Reagents for Flotation ........................................................ 9
2.4 Properties of Oxidized Coal .............................................................. 10
2.5 Reagents for Flotation of Difficult-to-Float Coal/Oxidized Coal ....... 11
2.6 Use of Polyglycol Ether as Frother .................................................... 13
2.7 Foamability of Frothers .................................................................... 15
2.8 Methods to Improve the Flotation of Difficult-to-Float Coal ........... 16
2.9 Pico and Nano Bubble Venturi Cavitation Tube for Column Flotation
....................................................................................................................... 18
2.10 Cyclo-Microbubble Flotation .......................................................... 20
v
CHAPTER 3 ............................................................................................................ 22
EXPERIMENTS ..................................................................................................... 22
3.1 Material ............................................................................................ 22
3.2 Experiment Procedures .................................................................... 24
3.2.2 Release Analysis Experiment ......................................................... 25
3.2.3 Column Flotation Experiments ...................................................... 27
CHAPTER 4 ............................................................................................................ 33
RESULTS AND DISCUSSIONS ............................................................................ 33
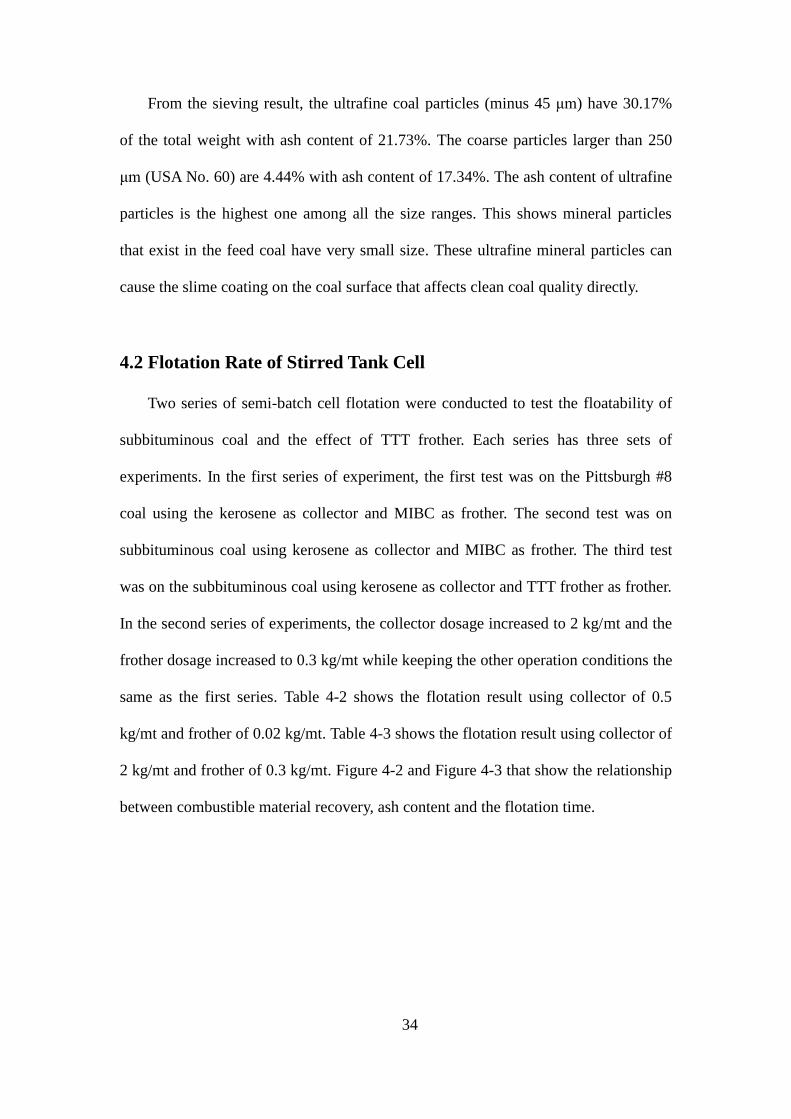
4.1 Particle Size Distribution .................................................................. 33
4.2 Flotation Rate of Stirred Tank Cell .................................................... 34
4.3 Frother and Collector Effects for Stirred Tank Cell Flotation ............ 39
4.4 Column Flotation Using Pico and Nano Bubbles .............................. 46
4.5 Effect of Ultrafine Mineral Particles on Flotation ............................. 73
CHAPTER 5 ............................................................................................................ 75
CONCLUSIONS ..................................................................................................... 75
RECOMMENDATIONS ......................................................................................... 78
REFERENCES ........................................................................................................ 79
APPENDICES ......................................................................................................... 84

vi
LIST OF TABLES
Page Table 3-1 Proximate analysis of the fine feed .............................................................. 23
Table 3-2 Operation conditions of stirred tank cell flotation ....................................... 25
Table 3-3 Results of release experiments ..................................................................... 27
Table 3-4 Operation conditions of flotation column .................................................... 30
Table 4-1 Particle size distribution and ash content of ultrafine feed coal. ................. 33
Table 4-2 Flotation rate results using collector of 0.5 kg/mt and frother of 0.02 kg/mt
...................................................................................................................................... 35
Table 4-3 Flotation rate results using collector of 2 kg/mt and frother of 0.3 kg/mt ... 36
Table 4-4 Results of stirred tank cell flotation using various MIBC dosages at 0.5
kg/mt kerosene ............................................................................................................. 40
Table 4-5 Results of stirred tank cell flotation using various TTT frother dosages at
0.5 kg/mt kerosene ....................................................................................................... 42
Table 4-6 Results of stirred tank cell flotation using kerosene as variable .................. 45
Table 4-7 Fractional factorial design of experiment for column flotation tests using 6
factors ........................................................................................................................... 50
Table 4-8 Ranges of three levels for the first stage design of experiment using 6
factors ........................................................................................................................... 51
Table 4-9 Analysis of Variance table for the first stage design of experiment ............. 52
Table 4-10 Effect Tests table for the first stage design of experiment ......................... 52
Table 4-11 Effect Tests table of the combinations of each two factors for the first stage
design of experiment .................................................................................................... 59
Table 4-12 Explanations for the factors in interaction ................................................. 59
Table 4-13 Second stage of design of experiments using 3 factors ............................. 60
vii
Table 4-14 Ranges of three levels for the second stage design of experiment using
three factors .................................................................................................................. 60
Table 4-15 Analysis of Variance table for the second stage of design of experiment .. 62
Table 4-16 Effect Tests table of the second stage of design of experiment ................. 62
Table 4-17 Third stage design of experiments ............................................................. 68
Table 4-18 Column Flotation Test on Feed Coal after Desliming minus 45 μm
particles. ....................................................................................................................... 74
Table A-1 Results of first stage of experiments ........................................................... 85
Table A-2 Results of the second stage design of experiments ..................................... 87
Table A-3 Results of the third stage of experiments .................................................... 88
viii
LIST OF FIGURES
Page
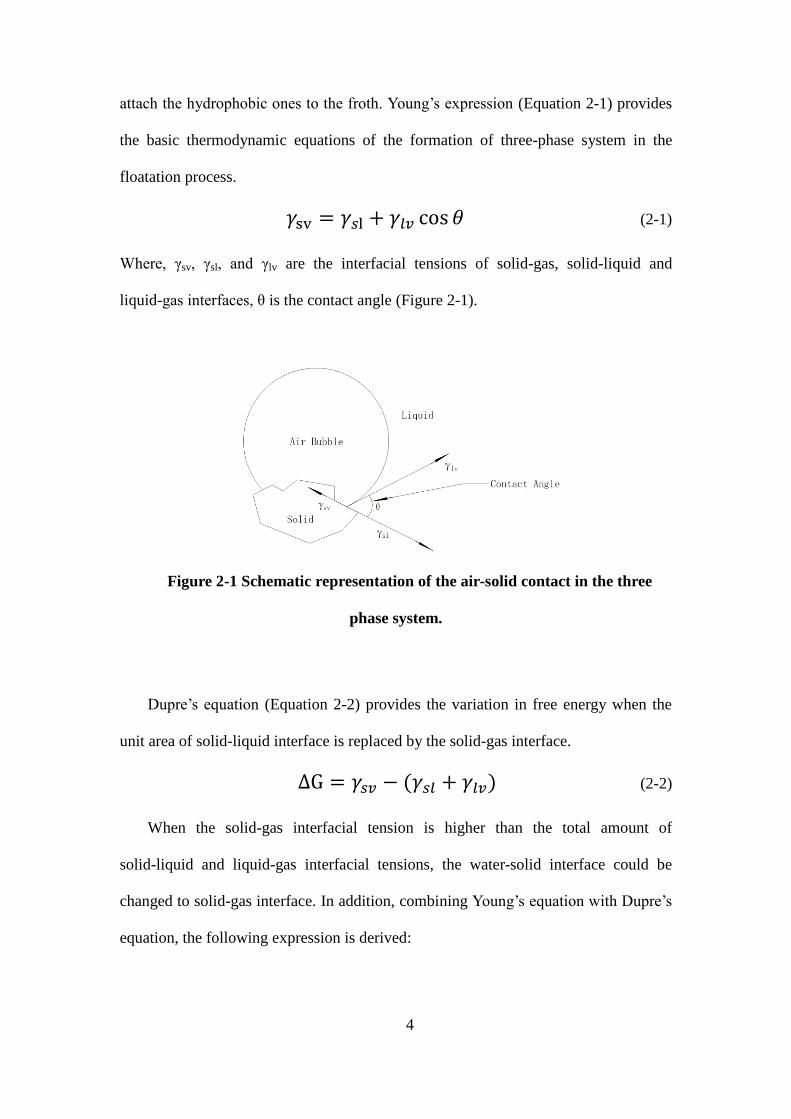
Figure 2-1 Schematic representation of the air-solid contact in the three phase system.
........................................................................................................................................ 4
Figure 2-2 Schematic diagram of a stirred tank flotation flotation cell (Koh and
Schwarz, 2007). ............................................................................................................. 7
Figure 2-3 Schematic diagram of the microbubble flotation cell (Cowburn et al.,
2006). ............................................................................................................................. 8
Figure 2-4 Schematic diagram of the Jameson flotation cell (Lahey et al., 1998). ....... 8
Figure 2-5 Structure of THF series (Jia et al., 2000). .................................................. 12
Figure 3-1 Schematic diagram of the crushing treatment for the raw coal. ................. 23
Figure 3-2 Schematic diagram of the release experiments. ......................................... 26
Figure 3-3 Schematic diagram of flotation column system. ........................................ 31
Figure 4-1 Weight and ash percent of the feed coal. .................................................... 33
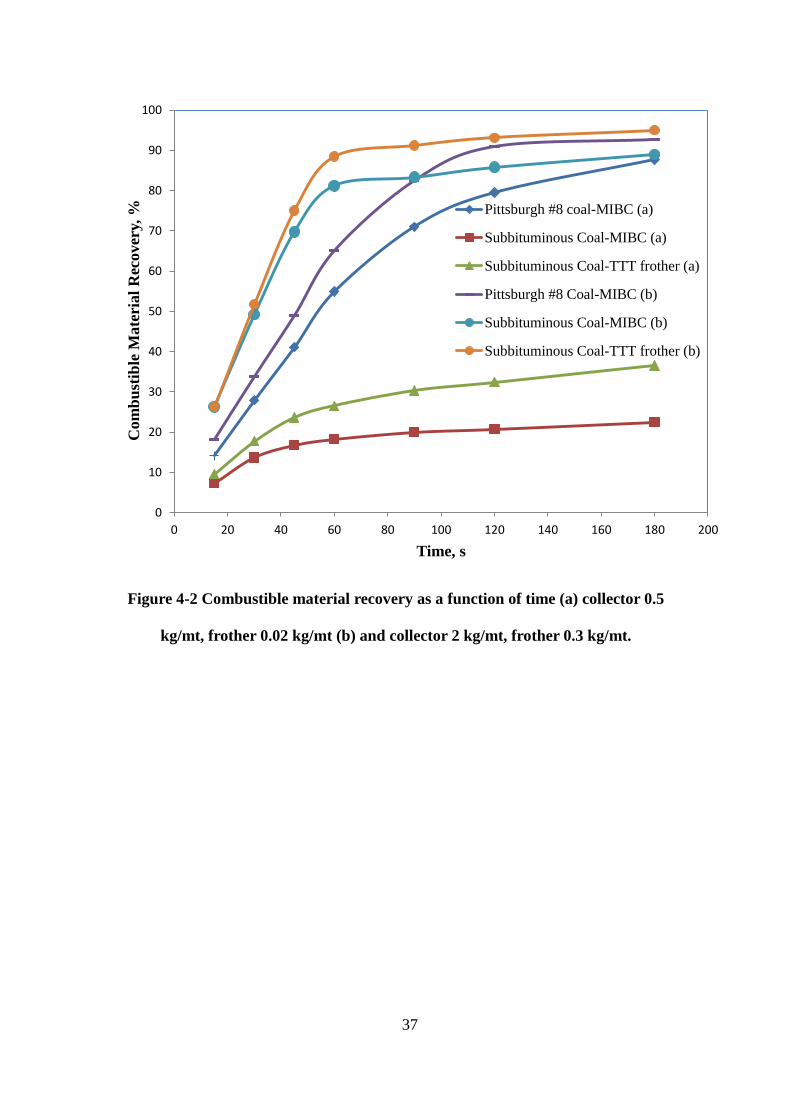
Figure 4-2 Combustible material recovery as a function of time (a) collector 0.5 kg/mt,
frother 0.02 kg/mt (b) and collector 2 kg/mt, frother 0.3 kg/mt. ................................. 37
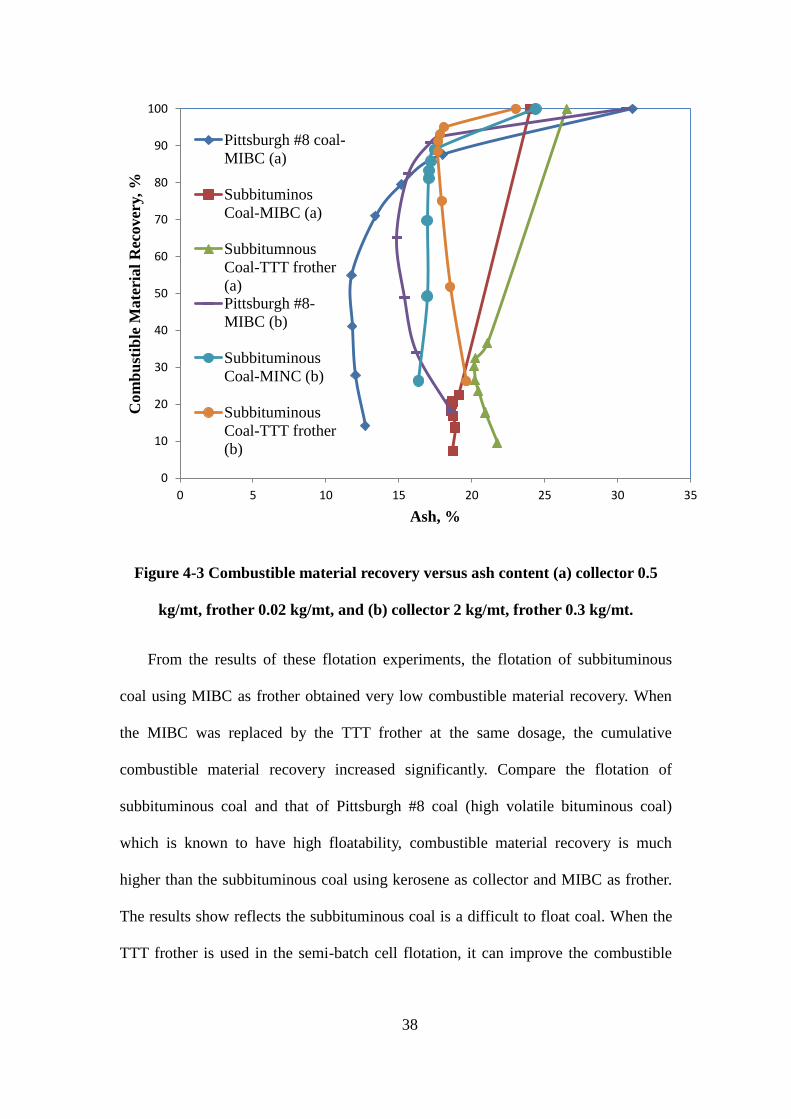
Figure 4-3 Combustible material recovery versus ash content (a) collector 0.5 kg/mt,
frother 0.02 kg/mt, and (b) collector 2 kg/mt, frother 0.3 kg/mt. ................................ 38
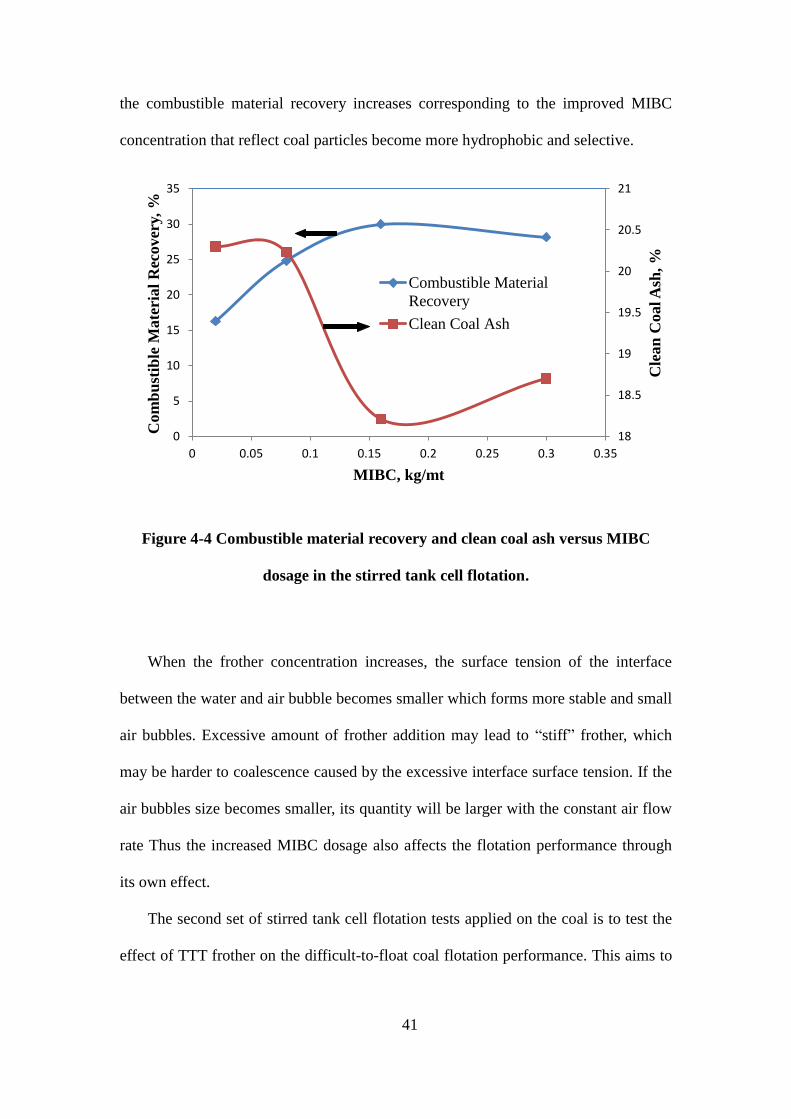
Figure 4-4 Combustible material recovery and clean coal ash versus MIBC dosage in
the stirred tank cell flotation. ....................................................................................... 41
Figure 4-5 Combustible material recovery and clean coal ash versus the TTT frother
dosage in stirred tank cell flotation. ............................................................................. 43
Figure 4-6 Combustible material recovery and clean coal ash versus kerosene dosage
ix
in stirred tank cell flotation. ......................................................................................... 45
Figure 4-7 Effect of feed solid concentration and collector dosage on (a) the
combustible material recovery and (b) clean coal ash. ................................................ 54
Figure 4-8 Effect of collector dosage and feed rate on (a) the combustible material
recovery and (b) clean coal ash. ................................................................................... 55
Figure 4-9 Effect of feed rate and feed solid concentration on (a) the combustible
material recovery and (b) clean coal ash ...................................................................... 56
Figure 4-10 Effect of feed solid concentration and collector dosage on (a) combustible
material recovery and (b) clean coal ash content ......................................................... 64
Figure 4-11 Effect of feed rate and feed solid concentration on the clean coal product
ash for subbituminous coal .......................................................................................... 65
Figure 4-12 Effect of collector dosage and feed rate on the clean coal product ash for
subbituminous coal ...................................................................................................... 66
Figure 4-13 Correlation between the collector dosage and combustible material
recovery and clean coal ash for subbituminous coal flotation. .................................... 68
Figure 4-14 Flotation results of release experiments and the three stage of design of
experiments .................................................................................................................. 70
1
CHAPTER 1
INTRODUCTION
Fine coal flotation makes use of the natural hydrophobicity of the carbonaceous
matter in coal. To enhance the hydrophobicity of the coal particles, oily collectors,
such as diesel fuel oil and kerosene are usually added. For higher-rank coals, the
reagent consumption in flotation is low because of the natural hydrophobicity of the
coal. However, the oxidized coals or low rank coals are difficult to float with
commonly used fuel oil or kerosene and large amounts of collectors are required to
achieve satisfactory yields. The low floatability is due to the presence of greater
amounts of oxygen content and abundance of hydrophilic surface functional groups
on fine coal surface. It was reported that sub-bituminous coals have an average
oxygen content of 18%, with carboxylic groups constituting about one third of this
amount. Therefore, the amount of adhesion of oil droplets on low rank coals is very
small, and the use of oil alone cannot improve fine coal flotation performance.
Oxidation alters both physical and chemical properties of the coal surface and
reduces the floatability. The surface oxidation of coal is reflected by decrease in pH of
the coal fine slurry. In fine coal, oxidation by weathering, or coals kept for a long
period of time at mine site or during storage and transportation results in the
formation of oxygenated functional groups. Carboxyl (RCOOH), phenolic (C6H5OH)
and carbonyl (-C6H5) are the most commonly found functionalities on the coal surface
and their concentration can be determined. This reduces the hydrophobicity of the
coal surface by increasing the number of site that forms hydrogen bonds with water
molecules. The most susceptible linkages to oxidation were found to be the α-CH2
groups to polyaromatics. Mitchell et al., (1995), revealed an interesting point on

2
oxidation that blue-light irradiation is also a strong agent to oxidize the vitrinite
surfaces. Sarikaya et al., (1995), reported that upon oxidation the flotation yield
reduces from 95% to 24% for a bituminous coal using alcohol type frother only. The
oxidation of the surface makes the coal more difficult to float with oily collectors
alone. An oily collector cannot spread on the surface of the coal, adsorption behavior
of surfactants on oxidized or low rank coal.
There are two objectives for this study: (1) to select the appropriate surfactant
made of trimethyl pentanediol derivatives that can enhance the floatability of
subbituminous coal. This is to activate oxidized surface of subbituminous to coal
become more hydrophobic. (2) To improve the flotation performance of
subbituminous coal for maximizing combustible material recovery with acceptable
clean coal quality. To achieve this goal, an improved flotation column with the pico
and nano bubble generation system and double funnel tailings separator are used to
improve the selective flotation of subbituminous coal.

3
CHAPTER 2
BACKGROUND
2.1 Flotation Basics
Froth flotation is a processing technique that separates materials with surface
property of hydrophilicity from the material that has hydrophobic surface. In this
process, air bubbles come into the feed slurry in the flotation cell, and make contact
with the feed. The fine particles with hydrophobicity will be attached to the surface of
air bubbles and brought to the froth. The hydrophilic particles will detach from the air
bubbles after collision and finally remain in the bottom of the cell. Mining industry
first used froth flotation in the early 19th century. Many minerals and coal can be
beneficiated using the froth flotation with less cost and good efficiency. The first
flotation process that was successfully used in the United States was the film flotation
in 1911 by Butte and Superior Copper Company. In Europe, froth flotation was first
used in coal cleaning in 1920, and the froth flotation plants for coal preparation were
established in Spain and in France and in same year (Lynch et al., 2007). Until 1930,
coal preparation plants in United States began to use the froth flotation. From that
time, the technique of froth flotation in coal was developed, and now the froth
flotation is the most widely used processing method for treating fine coal.
The most effective technique to beneficiate fine coal particles (-250μm) is the
froth flotation, which uses air bubbles to float hydrophobic particles. Air bubbles can
attach to the hydrophobic particles after collision and attachment and bring them to
the froth while the hydrophilic particles are left in the slurry. In this system, the
formation three-phase system, air-water-solid system, is the basic requirement for
froth flotation. In this system, air bubbles make contact with fine particles and then
4
attach the hydrophobic ones to the froth. Young’s expression (Equation 2-1) provides
the basic thermodynamic equations of the formation of three-phase system in the
floatation process.
𝛾sv = 𝛾𝑠l + 𝛾𝑙𝑣 cos 𝜃 (2-1)
Where, γsv, γsl, and γlv are the interfacial tensions of solid-gas, solid-liquid and
liquid-gas interfaces, θ is the contact angle (Figure 2-1).
Figure 2-1 Schematic representation of the air-solid contact in the three
phase system.
Dupre’s equation (Equation 2-2) provides the variation in free energy when the
unit area of solid-liquid interface is replaced by the solid-gas interface.
ΔG = 𝛾𝑠𝑣 − (𝛾𝑠𝑙 + 𝛾𝑙𝑣) (2-2)
When the solid-gas interfacial tension is higher than the total amount of
solid-liquid and liquid-gas interfacial tensions, the water-solid interface could be
changed to solid-gas interface. In addition, combining Young’s equation with Dupre’s
equation, the following expression is derived:

5
Δ𝐺 = 𝛾lv( cos 𝜃 − 1) (2-3)
When the surface property of particles is hydrophobic, its free energy of
solid-water-air system can be changed. The principle of contact angle is based on it. If
a particle is perfectly hydrophobic, it will have the contact angle of 90°and its free
energy will have the highest negative change.
The kinetic models which treat the flotation procedure as the reaction between air
bubbles and particles have attracted the most attention ( Polat, M., Chander, S., 2000).
These models have been widely applied for the control strategies in the industry. The
general rate expression (Equation 4) for the flotation procedure is given below:
𝑑𝐶𝑝(𝑡)
𝑑𝑡= −𝑘(𝑡)𝐶𝑝
𝑚(𝑡)𝐶𝑏𝑛(𝑡) (2-4)
Where Cp(t) and Cb(t) are the concentrations of particles and air bubbles at time t. The
exponents, m and n are the respective orders for particles and air bubbles, and d(t) is a
pseudo rate constant which may vary with time depending on various parameters
governing the flotation process. Froth flotation can reach its highest efficiency when
the coal particles are in the size range between 10-100 μm (Tao, 2005). The reason for
the poor recovery for the coarse particles is because of the high probability of
detachment while the low efficiency for the recovery of fine coal is due to the low
probability of bubble-particle collision. The expression for the combustible material
recovery is given below:
R =𝑌𝐶(100−𝐴𝐶)
(100−𝐴𝑟)% (2-5)
Where R is the combustible material recovery, Yc is the yield of clean coal, Ac is the
ash of clean coal, and Ar is the ash of raw coal
6
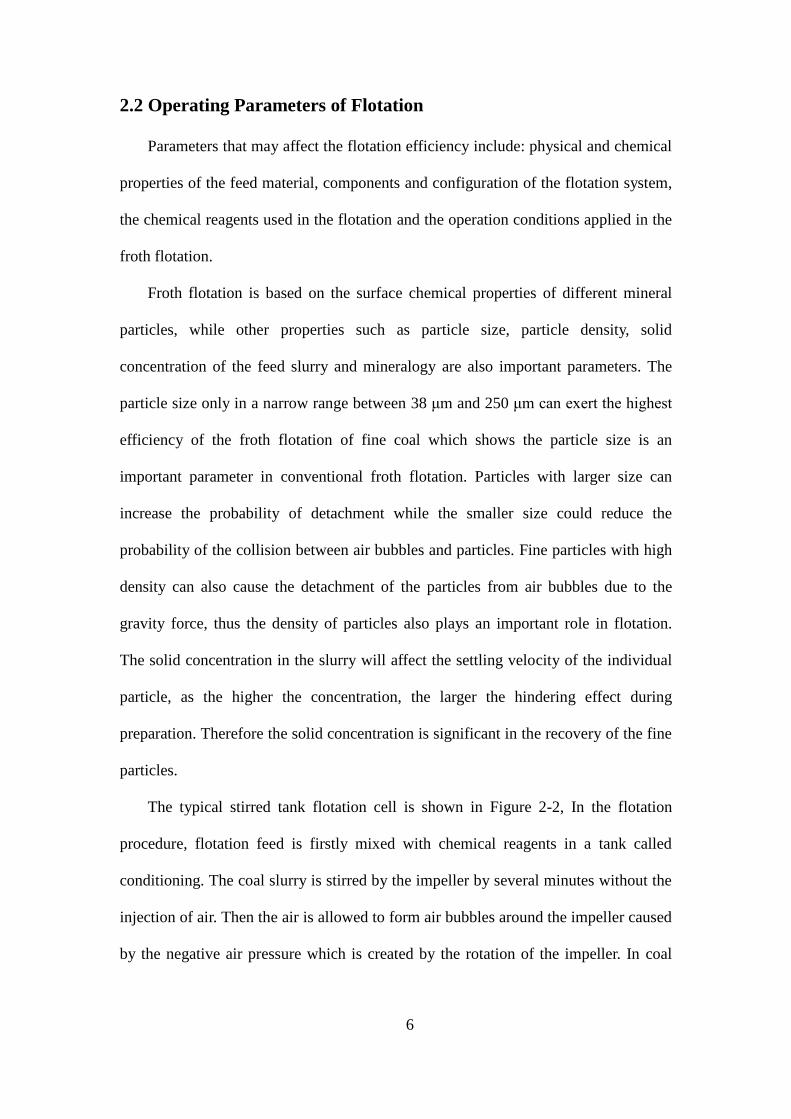
2.2 Operating Parameters of Flotation
Parameters that may affect the flotation efficiency include: physical and chemical
properties of the feed material, components and configuration of the flotation system,
the chemical reagents used in the flotation and the operation conditions applied in the
froth flotation.
Froth flotation is based on the surface chemical properties of different mineral
particles, while other properties such as particle size, particle density, solid
concentration of the feed slurry and mineralogy are also important parameters. The
particle size only in a narrow range between 38 μm and 250 μm can exert the highest
efficiency of the froth flotation of fine coal which shows the particle size is an
important parameter in conventional froth flotation. Particles with larger size can
increase the probability of detachment while the smaller size could reduce the
probability of the collision between air bubbles and particles. Fine particles with high
density can also cause the detachment of the particles from air bubbles due to the
gravity force, thus the density of particles also plays an important role in flotation.
The solid concentration in the slurry will affect the settling velocity of the individual
particle, as the higher the concentration, the larger the hindering effect during
preparation. Therefore the solid concentration is significant in the recovery of the fine
particles.
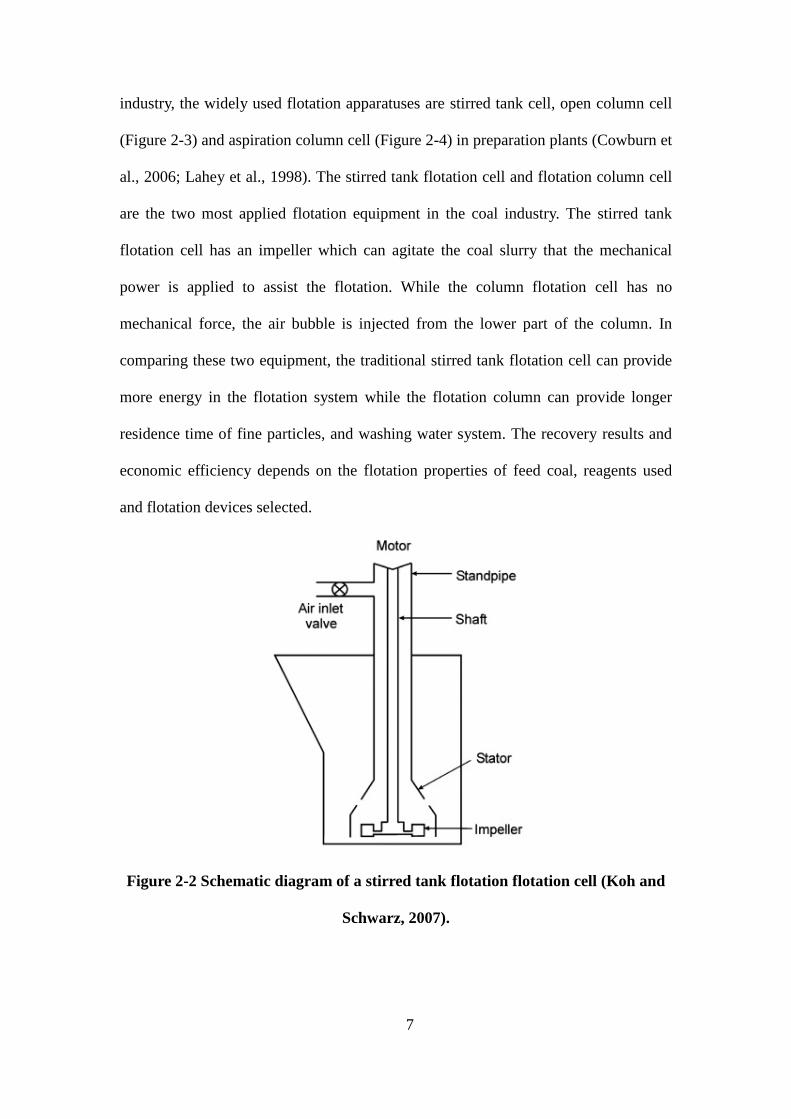
The typical stirred tank flotation cell is shown in Figure 2-2, In the flotation
procedure, flotation feed is firstly mixed with chemical reagents in a tank called
conditioning. The coal slurry is stirred by the impeller by several minutes without the
injection of air. Then the air is allowed to form air bubbles around the impeller caused
by the negative air pressure which is created by the rotation of the impeller. In coal
7
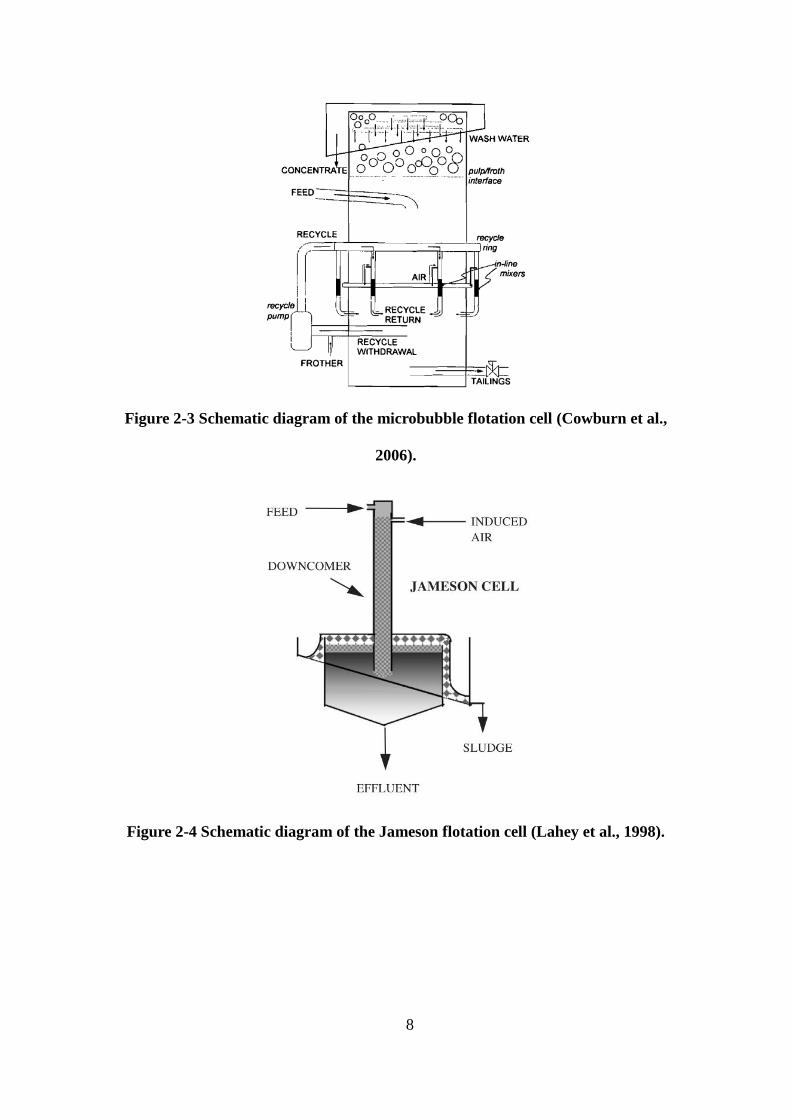
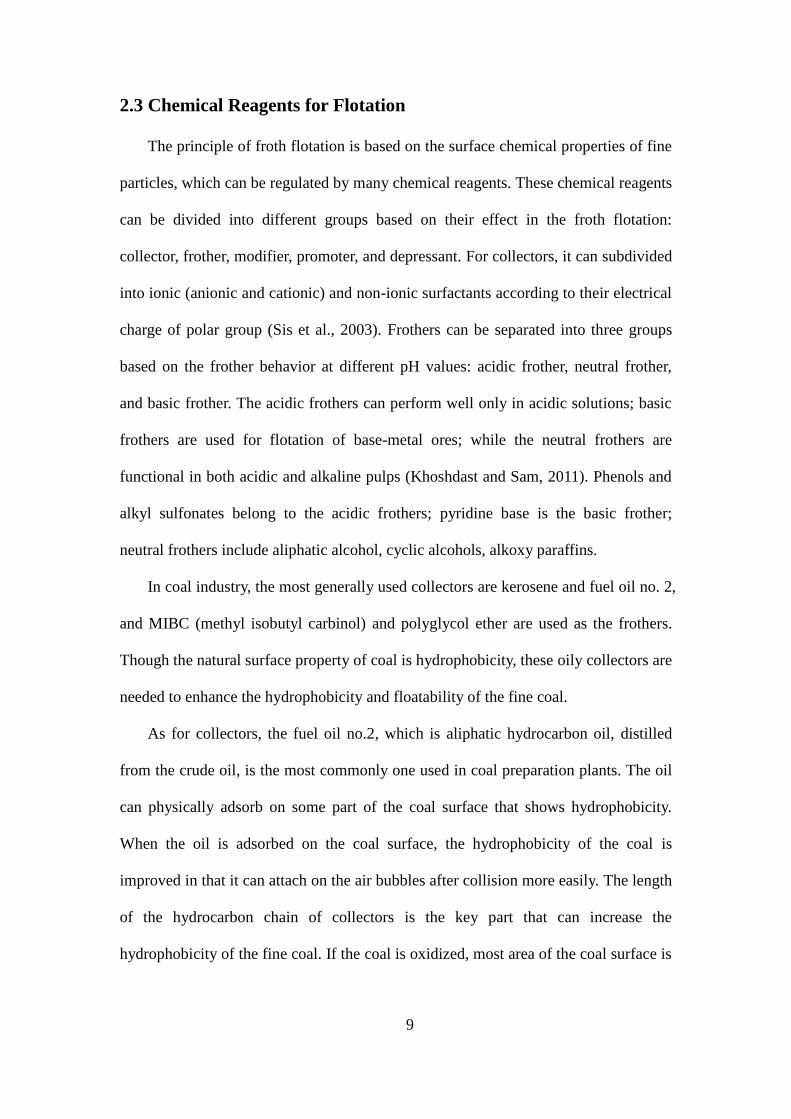
industry, the widely used flotation apparatuses are stirred tank cell, open column cell
(Figure 2-3) and aspiration column cell (Figure 2-4) in preparation plants (Cowburn et
al., 2006; Lahey et al., 1998). The stirred tank flotation cell and flotation column cell
are the two most applied flotation equipment in the coal industry. The stirred tank
flotation cell has an impeller which can agitate the coal slurry that the mechanical
power is applied to assist the flotation. While the column flotation cell has no
mechanical force, the air bubble is injected from the lower part of the column. In
comparing these two equipment, the traditional stirred tank flotation cell can provide
more energy in the flotation system while the flotation column can provide longer
residence time of fine particles, and washing water system. The recovery results and
economic efficiency depends on the flotation properties of feed coal, reagents used
and flotation devices selected.
Figure 2-2 Schematic diagram of a stirred tank flotation flotation cell (Koh and
Schwarz, 2007).
8
Figure 2-3 Schematic diagram of the microbubble flotation cell (Cowburn et al.,
2006).
Figure 2-4 Schematic diagram of the Jameson flotation cell (Lahey et al., 1998).
9
2.3 Chemical Reagents for Flotation
The principle of froth flotation is based on the surface chemical properties of fine
particles, which can be regulated by many chemical reagents. These chemical reagents
can be divided into different groups based on their effect in the froth flotation:
collector, frother, modifier, promoter, and depressant. For collectors, it can subdivided
into ionic (anionic and cationic) and non-ionic surfactants according to their electrical
charge of polar group (Sis et al., 2003). Frothers can be separated into three groups
based on the frother behavior at different pH values: acidic frother, neutral frother,
and basic frother. The acidic frothers can perform well only in acidic solutions; basic
frothers are used for flotation of base-metal ores; while the neutral frothers are
functional in both acidic and alkaline pulps (Khoshdast and Sam, 2011). Phenols and
alkyl sulfonates belong to the acidic frothers; pyridine base is the basic frother;
neutral frothers include aliphatic alcohol, cyclic alcohols, alkoxy paraffins.
In coal industry, the most generally used collectors are kerosene and fuel oil no. 2,
and MIBC (methyl isobutyl carbinol) and polyglycol ether are used as the frothers.
Though the natural surface property of coal is hydrophobicity, these oily collectors are
needed to enhance the hydrophobicity and floatability of the fine coal.
As for collectors, the fuel oil no.2, which is aliphatic hydrocarbon oil, distilled
from the crude oil, is the most commonly one used in coal preparation plants. The oil
can physically adsorb on some part of the coal surface that shows hydrophobicity.
When the oil is adsorbed on the coal surface, the hydrophobicity of the coal is
improved in that it can attach on the air bubbles after collision more easily. The length
of the hydrocarbon chain of collectors is the key part that can increase the
hydrophobicity of the fine coal. If the coal is oxidized, most area of the coal surface is
10
hydrophilic, that the collectors can only exert a limited enhancement on the
combustible material recovery of flotation.
The frothers have several mechanisms to affect the flotation efficiency when
added with collectors (Dey, 2012). If they are to act as emulsifiers, it can assist in
dispersing the big oil droplets into small ones, which contributes to the flotation
kinetics by increasing the particle-oil droplet collision because of the larger amount of
fine oil droplets. Frothers also can reduce the energy requirement when the collector
oil is spreading the coal surface by adsorption in the solid-water interface and
solid-air interface. When the frother is in low concentrations, it can act as a promoter
to make the coal hydrophobic, which leads to a high probability of attachment of coal
particles to the air bubbles. When the frother is in high concentration, it can make the
coal surface hydrophilic through wetting the coal by water, that the frother finally
reduces the recovery of coal. The frother itself is a surfactant that can reduce the
surface tension at the liquid-vapor interface. In this condition, the big air bubbles can
be separated into many tiny bubbles and become stable until they reach the froth.
2.4 Properties of Oxidized Coal
One important factor that makes the coal difficult to float is the oxidation of the
coal surface. The oxidized coal has poor natural floatability, and high dosages of
collectors are needed to float it (Tao et al., 2001), with some limitation. The surface of
oxidized coal can be covered by oxygenated hydrophilic groups. Oxidization of coal
has the content of oxygen functional groups such as carbonyl, carboxyl, and phenol.
Its balance of hydrophobic and hydrophilic has been changed which reduces the
natural hydrophobicity of the coal. These functional groups have an effect on the
11
flotation of coal both in thermodynamics and kinetics. The phenolic and carboxylic
groups belong to the ionic group which can affect the surface charge of coal and then
change the film-thinning process and flotation kinetics. The polyvalent cations such as
ferrous ion, ferric ion and aluminum ion can reduce or reverse the surface charge of
oxidized coal. The oxidized coal often cannot be resurfaced by a single oily collector
alone, even when using of high dosages of collector due to their porous surface, and
high concentration of oxygenated hydrophilic group.
2.5 Reagents for Flotation of Difficult-to-Float Coal/Oxidized Coal
The flotation performance of oxidized coal can be enhanced when the hydrophilic
parts of its surface are modified through the interaction between the coal particle and
chemical reagents. The pine oil and MIBC have proved to be useful for the flotation
of oxidized coal. The use of special flotation procedure of direct contact flotation,
which only mixes the fine particles and chemical reagents without the addition of
water in the conditioning process, and the application of microemulsion has been
found to provide high selective flotation on the difficult-to-float coal (Ahmed, 2012).
The series of Tetrahydrofurfuryl esters (THF esters) were found to be effective as
collectors for the flotation of oxidized coal (Jia et al., 2000), compared with the
dodecane as collectors. THF collectors can have the same combustible matter
recovery of flotation of oxidized coal with much lower dosage. This show the THF
esters are able to restore the floatability of oxidized coal. However, if the collector
concentration is too high, it can form a bilayer film over the surface of oxidized coal,
which can reversely reduce the floatability of the coal. The structure of THF series
can be shown in Figure 2-5.

12
Figure 2-5 Structure of THF series (Jia et al., 2000).
Glycol-based frother P948 from Ciba Specialty Chemistry, Switzerland, and the
collector SPP from CYTEC, New Jersey, were found to enhance the flotation of
oxidized coal efficiency (Tao et al., 2002). The frother of 0.5 kg/mt P947 and the
frother of 1.5 kg/mt SPP can lead to double flotation yield, combustible recovery and
lower product ash compared to the traditional reagents such as MIBC and fuel oil at 1
kg/mt and 15 kg/mt respectively. In addition, the lower usage of P948 frother and SPP
collector also can have much lower flotation cost. The petroleum sulfonate contained
in SPP collector performs as an emulsifier, and can help the fuel oil separate into
small droplets through agitation, which made it more efficiently adsorb on the surface
of oxidized coal.
Cationic reagents such as amine were also found to improve the separation results
of the oxidized coal (Sarikaya and Ozbayoglu, 1995). The combustible material
recovery of oxidized coal can reach 70 percent. The floatability of the oxidized coal
using cationic collectors drops when increasing the pH values. The cationic collector
can shift the IEP (iso-electric point) of oxidized coal to pH values between 9.3 and
10.9 that are based on the type and concentration of collector. Because the oxidized
coal has negative charged surfaces, and the hydrophobic sites on the surface was
small due to the oxidization. The contact angle also improved to 75° by using the

13
cationic collector compared to 7° as the natural oxidized coal contact angle.
Xanthate was also used as a pyrite depressant in the coal flotation (Fuerstenau et
al., 1990). The addition of xanthate shows improvement of flotation efficiency at pH
6-8. When the solution pH is at 6, the xanthate can reduce the product ash content and
improve the rejection ash with concentration of 0.2 kg/mt. It can improve the quality
of clean coal.
Fatty acid has been used as a promoter and collector for oxidized coal (Dube,
2012). Fatty acids are commonly synthesized from vegetable fat and animal fat,
especially the vegetable oil which is comprised of varieties of fatty acids. Olive oil
mixed with soybean oil has been provided to increase the combustible recovery for
low rank coals. These oil droplets can agglomerate fine coal particles at low
concentrations so that they interact with fatty acids through hydrogen bonding. When
all the fatty acids act as collectors in coal flotation, it can enhance the combustible
material recovery. The tall oil can aid in reducing the surface tension of coal slurry
then further increase the surface area of air bubbles. The use of fatty acids in
combination with the kerosene can promote the flotation efficiency of oxidized coal.
The mixture of fatty acids with kerosene is better than the use of a single fatty acid
which can aid in forming different adsorption capabilities. Thus the fatty acid
mixtures can get a much higher recovery of coal flotation by the adsorption of oil
droplets on different oxygen groups on the coal surface. However, the ash content of
the clean coal can be as high as 12%
2.6 Use of Polyglycol Ether as Frother
Polyglycol ether has been used as a synthetic frother in the coal industry. It has
14
good performance in preventing bubble coalescence and creates more stable and
viscous foams in comparison with frothers of alcohol family such as MIBC and
Alpha-terpineol (Gupta et al., 2007). Because the effect of frothers on the bubble size
comes from its ability that prevents bubble coalescence, the degree of bubble
coalescence will reduce when the concentration of frother is enhanced. There also
exists a concentration point which is called the critical coalescence concentration, and
when the concentration of frother reaches it, a non-coalescence environment is formed.
If the concentration of frother is higher than the critical coalescence concentration, the
bubble size will be independent of the frother concentration.
In terms of the surface tension, it decreases as the frother concentration increases.
The polyglycol ether can reduce more surface tension than the alcohol frothers, which
means the polyglycol frother is more active on the surface (Gupta et al., 2007). In
addition, the polyglycol ether has lower adsorption loading than the alcohol family
frothers. Because of this, the alcohol family frothers need smaller area per mole when
adsorb on the air-water interface than the polyglycol ether. Polyglycol ether has higher
molecular weight than MIBC which may cause higher viscosity and more stable froth
film. MIBC has only one hydroxyl group to interact water and form a monolayer at
the surface. While the polyglycol ether has many oxygenated groups which can
interact with water through hydrogen bonding that leads to the frother molecules lying
at the surface, which enhances the viscosity and stability of the froth.
Polyglycol ether frother is more efficient in producing clean coal with
comparative higher ash (12%) (Gupta et al., 2007). While alcohol frothers are good at
separating clean coal with lower ash (8.5%-10%). In addition, the polyglycol ether
frother leads to a higher rate of recovery compared to the alcohol frothers. The
15
polyglycol ether frother can separate oversize particles (-1+0.5mm) and intermediate
size (-0.05+0.075) in recovery and grade. The alcohol frothers are good at recovering
ultrafine coal particles and producing clean coal with lower ash content. Additionally,
due to polyglycol ether frother can produce more stable froth film. This might cause
the downstream filtration for dewatering problem.
2.7 Foamability of Frothers
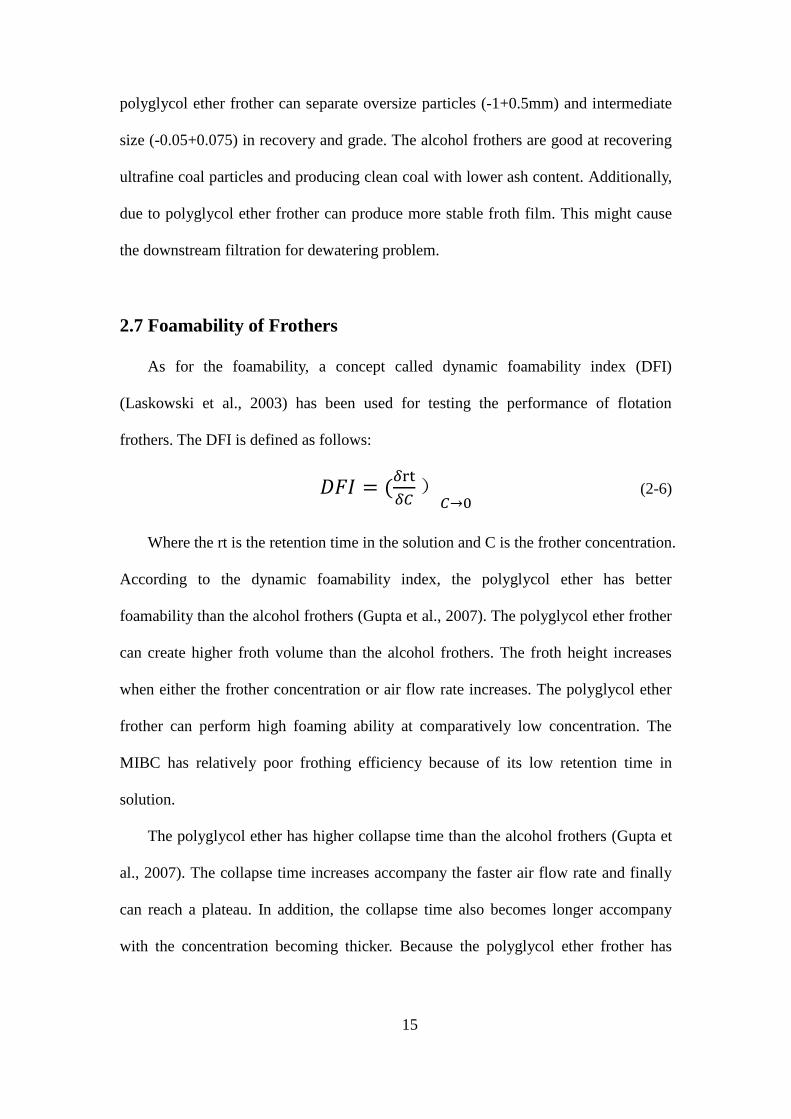
As for the foamability, a concept called dynamic foamability index (DFI)
(Laskowski et al., 2003) has been used for testing the performance of flotation
frothers. The DFI is defined as follows:
𝐷𝐹𝐼 = (𝛿rt
𝛿𝐶)𝐶→0
(2-6)
Where the rt is the retention time in the solution and C is the frother concentration.
According to the dynamic foamability index, the polyglycol ether has better
foamability than the alcohol frothers (Gupta et al., 2007). The polyglycol ether frother
can create higher froth volume than the alcohol frothers. The froth height increases
when either the frother concentration or air flow rate increases. The polyglycol ether
frother can perform high foaming ability at comparatively low concentration. The
MIBC has relatively poor frothing efficiency because of its low retention time in
solution.
The polyglycol ether has higher collapse time than the alcohol frothers (Gupta et
al., 2007). The collapse time increases accompany the faster air flow rate and finally
can reach a plateau. In addition, the collapse time also becomes longer accompany
with the concentration becoming thicker. Because the polyglycol ether frother has
16
higher collapse time, it can form more stable air bubbles. The foam stability of all
frothers enhances with the increasing concentration at low levels, and this trend will
change to a plateau region when the concentration is in high level. Therefore the foam
stability is associated with the types of frother, the concentration of frother and the
bubble generating system.
In the slurry, the air bubble size will decrease with the increase of frother
concentration, and when it reaches a particular concentration, the bubble size becomes
stable (Gupta et al., 2007). Bubble size is controlled through reducing bubble
coalescence in the solution by frothers. When the concentration exceeds the critical
coalescence value, the coalescence can be entirely eliminated in a dynamic system. If
the frother condition exceeds this critical value, the slurry environment can be defined
as non-coalescing. Since different types of frother have different critical coalescence
concentration, the polyglycol ether frother can provide this environment at lower
concentration than the alcohol frothers. MIBC can produce smaller and more
homogeneous distributed size air bubbles and it is a more effective frother in terms of
bubble size reduction than the polyglycol ether frother. These characteristics show
that the frother can hinder coalescence and influence the bubble break-up mechanism.
2.8 Methods to Improve the Flotation of Difficult-to-Float Coal
Some investigators treat the difficult-to-float coal during the grinding process
with the addition of pitch (Atesok and Celik, 2000). In their research, the addition of
pitch during the grinding process in the presence of collectors can significantly
increase the recovery of clean coal. The penetration and adsorption of the pitch on the
hydrophobic part of coal surface maybe the main reason for the improved flotation

17
performance. If the viscosity of the pitch used in the grinding process, the recovery of
product will be damaged to a great extent. The investigators also test the effect of heat
during the pretreatment of the raw coal. The combustible material recovery decreases
when the moisture content varies from 18% to 0% infers the addition of pitch brings
the some water to the coal. The use of heat treatment to the coal at 400℃ just gives a
limited improvement to the recovery, while above 500℃, it achieves a great
enhancement. Thus the heat treatment may leads to a better balance of
hydrophilic/hydrophobic content on the coal surface.
The ultrasonic and high-intensity conditioning has been studied by some
investigators to improve the flotation of oxidized coal (Xia et al., 2013). The
ultrasonic and high-intensity conditioning is used in the agitated vessel to remove the
thin clay layer and oxidized layer on the oxidized coal surface. They both increase the
flotation efficiency and combustible material recovery. In addition, more stable
smaller bubbles can be created during flotation when ultrasonic or high-intensity
conditioning is applied. The ultrasonic treatment proved to aid in the distribution of
chemical reagents that assist their adsorption on the coal surface. However, the
ultrasound technique is not economic for large scale process.
Microwave irradiation is studied to treat the difficult-to-float coal to improve its
flotation performance (Xia et al., 2013). After the treatment of microwave irradiation,
the moisture content decreases and accompanied with the increased combustible
material recovery. After microwave treatment, the hydrophobicity of coal enhanced
that maybe caused by the elimination of pore water, hydration water and some
hydroxyl function group. In addition, the diffusion of volatile matter and the
reorientation of function group on the coal surface may also occur after the
18
microwave irradiation treatment.
Direct contact flotation is investigated to improve the distribution of the chemical
reagents on the coal surface (Ahmed and Drzymala., 2012). The direct contact process
is a new mechanism that mixes the fine particles with the chemical reagents without
addition of water in the conditioning process. This technique can promote the
dispersion and adsorption of the reagents on fine particles. Using this flotation
procedure, a better selectivity can be achieved. In their experiments, the anhydrous
flotation reagents in the form of microemulsions also employed provide very good
flotation results. The oxidized coal using the direct contact of microemulsions can
achieve 88% yield in clean coal with the consumption of reagents at 10 kg/mt.
2.9 Pico and Nano Bubble Venturi Cavitation Tube for Column
Flotation
In coal preparation, the generation of nanobubbles can be achieved by applying
the venturi cavitation tube that proved to enhance the recovery of coarse particles and
fine particles with lower reagents consumption. The better flotation of the coal
particles might be caused by the bridging of bubbles between the hydrophobic
surfaces (Zhou et al, 1997).
The study of the mechanisms of nanobubble that enhances the froth flotation of
coal particles has been reported (Fan et al., 2010). They reported that the hydrophobic
particles with larger contact angle are preferred as nucleate by nanobubbles. The
increasing of the frother dosage can reduce the nanobubble size. The increase of
dissolved oxygen gas and the carbon dioxide gas concentration can also leads to the
increase of nanobubble size. The number of hydrophobic nanoparticles (<50 nm)
19
suspended in water can obviously increase the nanobubble size by acting as the nuclei.
The increase of the pressure drop within the cavitation tube can increase the median
size of the nanobubbles. The increase of the nanobubble volume is accompanied by
the enhancement of frother concentration. The Zeta potential of the nanobubbles
generated by cavitation tube will decrease with the increase of the pH value. The
enhancement of the stability of the nanobubbles can be achieved at lower frother
concentration. The existence of nanobubbles can significantly reduce the bubble
raising velocity. The air holdup is severely affected by the nanobubbles in the water.
In addition, the same research group also applied the nanobubbles in the flotation
of coal and phosphate. They found that the when the pH varies from 8 to 12, the zeta
potentials of phosphate and nanobubbles is stable. The hydrophobic phosphate and
coal particle surface is easier to be adsorbed by nanobubbles rather than the
hydrophilic quartz particle surface. The enhancement of the contact angles of the coal
and phosphate also achieved by the induction of nanobubbles to the surfactant
solutions. The reduction of detachment is observed with the existence of nanobubbles
which favors the froth flotation. The modified monobubble Hallimond tube flotation
proved to have significant better effect on the collection efficiency especially on fine
particles collection efficiency with the presence of nanobubbles. The specially
designed nanobubble column flotation tests show the increment of the phosphate and
coal particles flotation efficiency with the employment of nanobubbles.
Hart et al., 2002, designed to use a device including a cavitation unit in flotation
feed. Various designs of the cavitation were tested in their research. Several feed
samples were tested to choose the most responsive feed based on the cavitation. They
also established the cavitation device on mechanical flotation cell, Jameson cell and

20
Column flotation cell to test its performance. Their research shows the cavitation unit
can induce the nucleation of picobubbles on the coal surface that can both enhance the
flotation product yield and reduce the collector dosage used in flotation. The
application of cavitation unit on the flotation feed can improve the combustible
material recovery by 6%-12%. The collector amount can also be reduced by 50% with
the same combustible material recovery as no cavitation unit used. This shows
cavitation unit can enhance the effect of collector in the flotation process. The
cavitation unit can benefit flotation performance of mechanical flotation cell and
column flotation cell, but does not improve the efficiency of Jameson cell
significantly.
Tao et al., (2007) applied the picobubbles to float the finest coal which shows
better flotation performance than normal flotation method. Their study shows the
picobubbles can significantly enhance the efficiency of the froth flotation with higher
recovery and low product ash. The recovery the fine coal can be improved by 10 to 30
percent according to the operation conditions, using the normal flotation method. The
collector dosage can be reduced about one half by applying the pico and nano bubbles.
The frother dosage can also be reduced up to one half. The improved flotation
efficiency is due to the increased probabilities of collision and attachment and reduced
probability of detachment.
2.10 Cyclo-Microbubble Flotation
The cyclo-microbubble flotation column (CMFC) to recover the fine coal from
discarded waste ponds was studied by Li et al. (2006). They reported that the CMFC
was excellent in the preparation of nominally fine coal (<0.5 mm). Their industrial
21
testing proved that the commercial CMFC could produce 90% of combustible
material recovery and 57% of separation efficiency with the coal of 0.25-0.074 mm
and <0.045 mm fractions. CMFC also shows good efficiency in cleaning fine coal
waste. 9.66-10.93% ash of clean coal was produced from the raw coal contains 47.11%
ash with yield of 45.71-47.41%. In addition, they also use the CMFC to produce
ultraclean coal with the clean coal ash of 1.5-1.8% for Taixi coal.
The double funnel tailings separator applied in the flotation column can improve
the flotation performance. Its working principles and working parameters have been
studied by Yang et al. (2007) and Zhang et al. (2006). The application of this separator
in the flotation of camp rock has been studied (Zhou et al., 2003; Zhou, et al., 2005;
Chen, et al., 2008). The application of this separator in coal preparation was also
studied to improve the coal recovery and quality (Wang, 2008; Liu, 2006)
22
CHAPTER 3
EXPERIMENTS
3.1 Material
The coal sample used in the series of experiments is subbituminous coal and it
was employed to study the effect of pico and nano bubble and the blend of Trimethyl
Pentanediol Derivatives as frother on the difficult-to-float coal flotation performance.
The blend of trimethyl pentanediol derivatives consists of trimethyl pentanediol
monoisobutyrate, trimethyl pentanediol diisobutyrate and trimethyl pentanediol. Since
the major components of this frother have long chemical names, TTT frother will be
used throughout this study. TTT frother is obtained from Zinkan Enterprises Inc. The
raw coal sample used in the experiment is subbituminous coal that has 23-26% of ash
content. Approximately 300 lbs of the subbituminous coal was received, spread and
air dried for four days, then using Cone and Quarter Technique to divide the coal
sample into several small homogeneous portions.
The coal particles larger than 2-inches were broken by the hammer. Each portion
of the coal sample was passed through the jaw crusher and double roll crusher that
producing coal particle size to about 1/4 inches size range. Then Quaker mill and
Holmes mill were used further to reduce the coal particle sizes to minus 250 μm
(USA No. 60). The size reduction process is shown below:
23
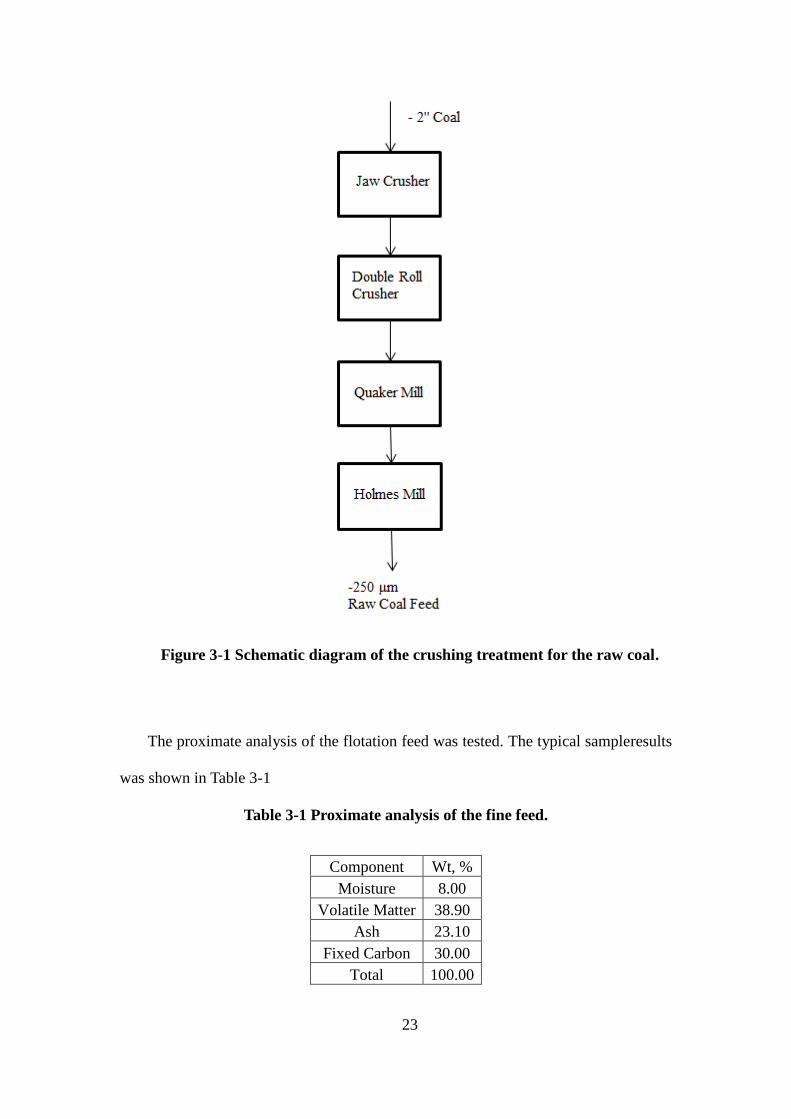
Figure 3-1 Schematic diagram of the crushing treatment for the raw coal.
The proximate analysis of the flotation feed was tested. The typical sampleresults
was shown in Table 3-1
Table 3-1 Proximate analysis of the fine feed.
Component Wt, %
Moisture 8.00
Volatile Matter 38.90
Ash 23.10
Fixed Carbon 30.00
Total 100.00

24
The proximate analysis shows that the volatile matter has 38.9% of the total raw
coal weight while the fixed carbon only account for 30% of the total weight. This may
be due to high ash content in the feed.
The coal particle larger than 1 inch can be used for the contact angle
measurement. Coal particle was polished smooth on the top and bottom surfaces using
the sand paper. Both sides of the surfaces have the area about 4 cm2 and its thickness
is about 1 cm. When conducting the contact angle measurement, the polished coal
sample was placed on the platform of the rame-hart Goniometer 100. About 1/10 ml
of the distilled/deionized water was dispelled by the syringe on the coal surface. The
contact angle of the coal sample should be read immediately after the water drop was
placed on the coal surface. The contact angle of the coal surface was read based on the
tangent line of the liquid/air interface. The contact angle of the coal sample is 38±2
degrees. The low value of contact angle reflects the low degree of hydrophobicity of
coal particles. This result suggests that the coal surface should be modified before
flotation process.
3.2 Experiment Procedures
3.2.1Stirred Tank Cell Flotation Denver Model D-12 laboratory automated flotation machine was employed to
conduct the froth flotation of fine coal sample. The semi-batch flotation as a function
of time was obtained for the flotation of fine coal. The fine coal sample of 200 g was
mixed with 500 ml distilled/deionized water and conditioned in a 4 liter flotation tank
for 10 min. The well wetted coal slurry was poured into a 2 liter flotation cell. The
slurry volume was adjusted by additional distilled/deionized water to about 2 liter.

25
Impeller was turned on and frother was added for 5 minute conditioning. Collector
was then added for another 5 minute conditioning. The operating parameters for
semi-batch cell flotation are given in Table 3-2
Table 3-2 Operation conditions of stirred tank cell flotation.
Coal 200 g Conditioning time 10 min
Solid concentration 9.10% Impeller speed (Conditioning) 1200 rpm
Impeller speed (Flotation) 1100 rpm Collector conditioning time 5 min
Frother conditioning time 5 min Flotation cell volume 2 liter
Air flow rate 2.67 cm/s Frother dosage 0.06 kg/mt
Collector dosage 1 kg/mt
When test the flotation rate of the stirred tank cell flotation, the clean coal was
collected at the intervals: 0 s, 15 s, 30 s, 45 s, 60 s, 90 s, 120 s, and 180 s. The tailings
were collected in the bottom of the cell.
3.2.2 Release Analysis Experiment
The release analysis experiments use one time roughing, and following a series of
cleaning to determine the floatability and flotation performance of the feed coal. It
determined the ideal flotation conditions to achieve the maximum recovery and
minimum clean coal product ash content. The detailed flotation procedure for the
release analysis is given by Randolph (1997). This procedure has similar function of
density washability analysis which is used for the coarse particles sample. In the first
roughing stage, the coal was floated following the pre-wetting conditions, and reagent
conditioning. For cleaning stage, the clean coal obtained from the previous step was
diluted to total 2 liter coal slurry and then apply the flotation. Repeat this process for 4
times for the concentration stage. Finally one clean coal and five tailings can be
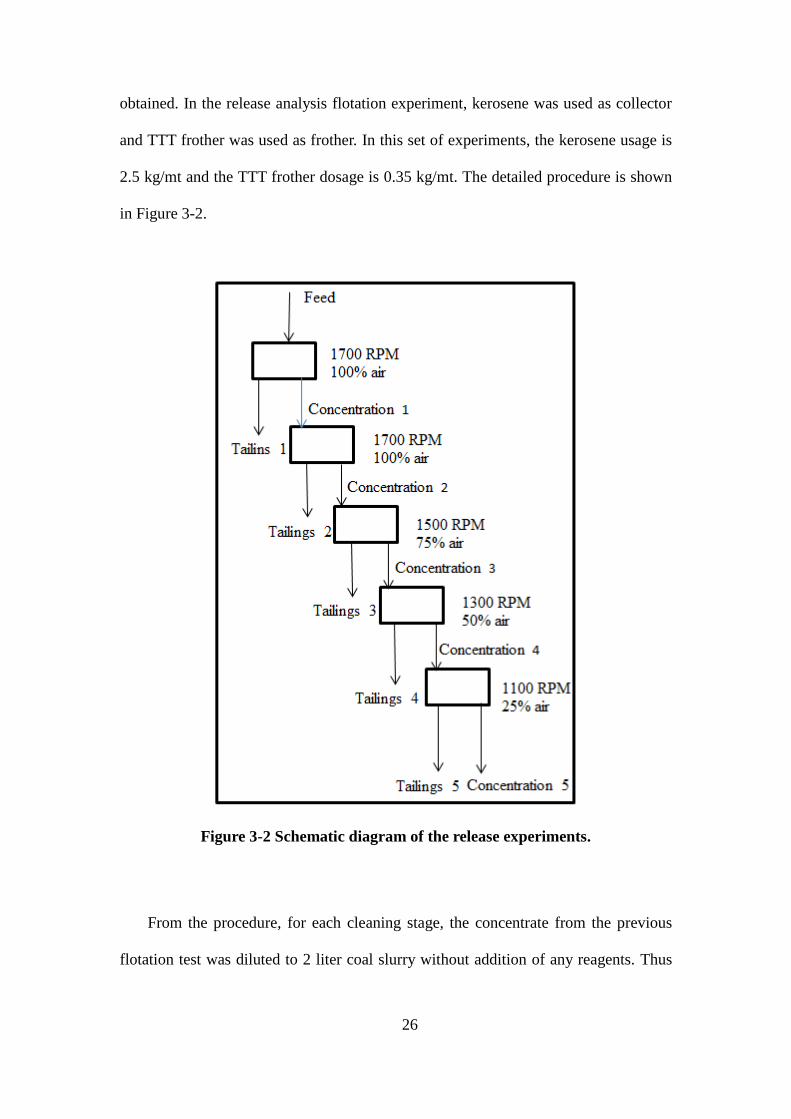
26
obtained. In the release analysis flotation experiment, kerosene was used as collector
and TTT frother was used as frother. In this set of experiments, the kerosene usage is
2.5 kg/mt and the TTT frother dosage is 0.35 kg/mt. The detailed procedure is shown
in Figure 3-2.
Figure 3-2 Schematic diagram of the release experiments.
From the procedure, for each cleaning stage, the concentrate from the previous
flotation test was diluted to 2 liter coal slurry without addition of any reagents. Thus

27
only the coal particles with better floatability can be floated. The release flotation
experiments results is presented in Table 3-3.
Table 3-3 Results of release experiments.
Wt, % Ash, %
Wt, % Ash, %
Concentration 1 84.97 18.27 Tailings 1 29.56 60.09
Concentration 2 79.32 15.32 Tailings 2 14.53 51.39
Concentration 3 76.16 13.64 Tailings 3 8.87 46.10
Concentration 4 73.25 12.48 Tailings 4 5.71 40.80
Concentration 5 70.44 11.44 Tailings 5 2.81 38.48
From the release analysis, the cleanest concentrate can be obtained with
combustible material recovery of 84.1% and clean coal ash content of 10.44%. These
results show a good floatability of the subbituminous coal sample obtained by using
the kerosene as collector and TTT frother as frother, which leads to high combustible
material recovery and low ash content of the cleanest coal. It is possible to obtain the
clean coal of lower ash content with lower dosage of kerosene. However, it produces
lower combustible material recovery.
3.2.3 Column Flotation Experiments
Column flotation provides an efficient way to wash froth compared to the stirred
tank cell flotation. However the conventional open column flotation usually consumes
chemical reagents much less than that of the stirred tank cell flotation. The flotation
column has a long flotation region which allows coal particles stay much longer in the
flotation column than the stirred tank cell flotation, which highly improves the
probabilities of collision and attachment between the coal particles and the air bubbles.
During the column flotation, it can form a froth region at the top of the column. In
28
addition, a wash water system also set on the upper portion of the column which
provides continuous spreading of wash water. In the froth region, the mineral particles
which are hydrophilic but brought to the upper portion of the column due to the
hydraulic entrainment effect can be eliminated by the wash water.
The laboratory flotation column used in these experiments has the height of 250
cm including the height of double funnel separator and the inner diameter of 5 cm,
which has the ratio of length to diameter of 50:1. The flotation column used in this
study has equipped with a new set of bubble generation system and a double funnel
tailings separator. In the conventional flotation column, the air bubbles are generated
either by a static mixer for micro bubbles or a sparger with numerous micro-pores for
small bubble generation. In the new bubble generating system, a static mixer
connected to a venturi cavitation tube is used to generate the pico and nano bubbles.
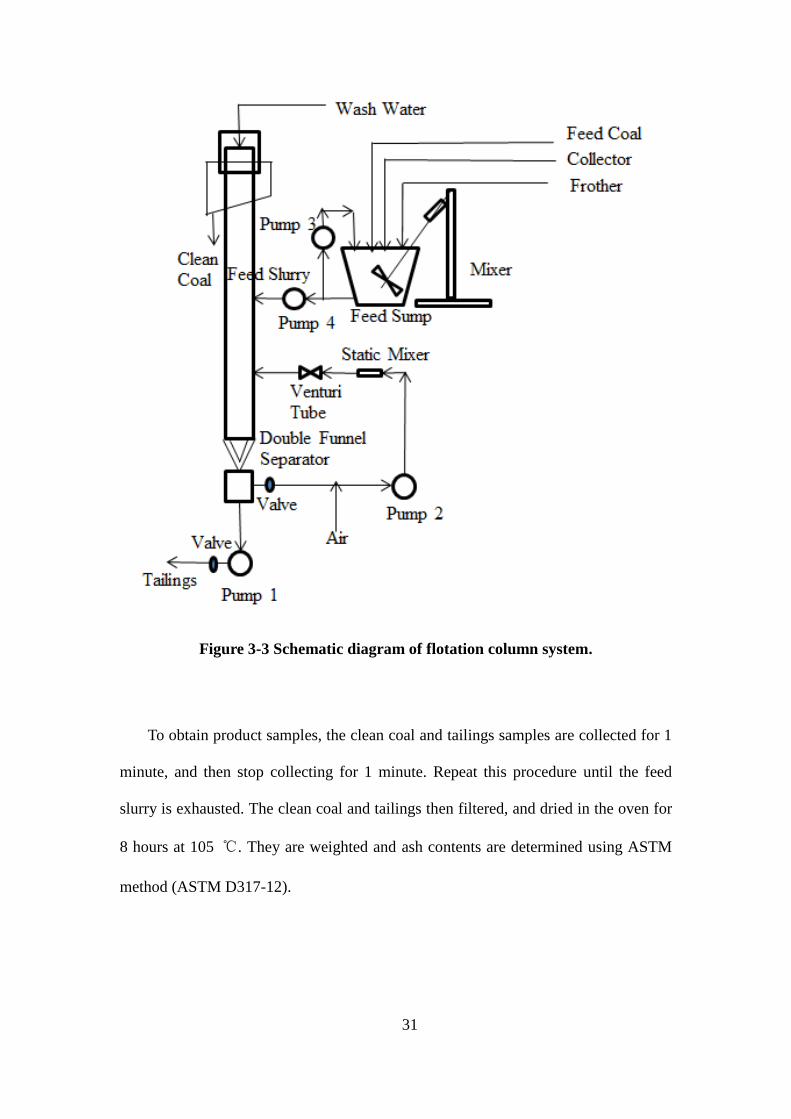
The schematic diagram of the flotation column used in this study is given in Figure
3-3. One pump (pump 1, peristaltic pump, cole-parmer) is employed to pump the
tailings slurry from the bottom of column which contains most of the coal tailings
contained frother in the slurry through the inner funnel double funnel tailings
separator. The air was injected into the tailings slurry stream from the outer funnel
before entering peristaltic the pump (pump 2, peristaltic pump, cole-parmer). The
mixture of air and coal tailings then passes through the static mixer for homogenous
air-coal tailings stream and generation of micro bubbles. The micro bubbles and coal
tailings pass through venturi cavitation tube to generate the pico and nano bubbles and
further injected into the flotation column. This special designed flotation column
equipped with tailings recirculating and pico and nano bubble generation system
enhances the separation of coal and mineral particles.
29
In this new designed flotation column, a cyclonic double funnel tailings separator
system is applied to improve the separation and circulation efficiency. In this
separator, a small funnel is in the inner part of the big funnel that they form a
concentric conical shape. During the froth flotation process, a water cyclone can be
formed above the separator similar to the inversed hydrocyclone and the can exert a
cyclonic effect on the particles for its separation. Heavy particles will fall into the
small funnel, while the light particles fall into the area between these two funnels. In
this case, the tailings discharged from the small funnel (inner funnel) will contain
more gangue particles due to the cyclonic effect. Thus the tailings slurry discharged
from the small funnel will be pumped out as tailings, while the tailings slurry
discharged between the two funnels will be recycled into the bubble generation
system.
For the feed coal slurry preparation, coal sample was mixed with water, frother
and collector by a stirrer in the feed tank and recirculation loop was used to achieve
the chemical reagents coating on coal surface and uniform coal slurry. One pump
(pump 3, peristaltic pump, cole-parmer) was used to circulate the coal slurry form the
bottom of the sump to the top to achieve homogeneous coal slurry. In this procedure,
the coal firstly mixed with water for 10 minutes, then frother is added for 5 minutes
and then collector is added for another 5 minutes. After conditioning, the feed coal
slurry was pumped into the flotation column by a peristaltic pump (pump 3, peristaltic
pump, cole-parmer). When the feed coal slurry has reached about half the column
height, bubble generation system was operated to generate the air bubbles. When the
feed coal slurry reached the upper portion of the column, the wash water and the
tailings recirculation were started. The water level must be kept stable in the column,
30
and the top portion of the column must form a stable froth area during the flotation
process. The wash water and air injection volume were monitored by the flow meter.
When the flotation reaches steady state for more than 20 minutes, the clean coal and
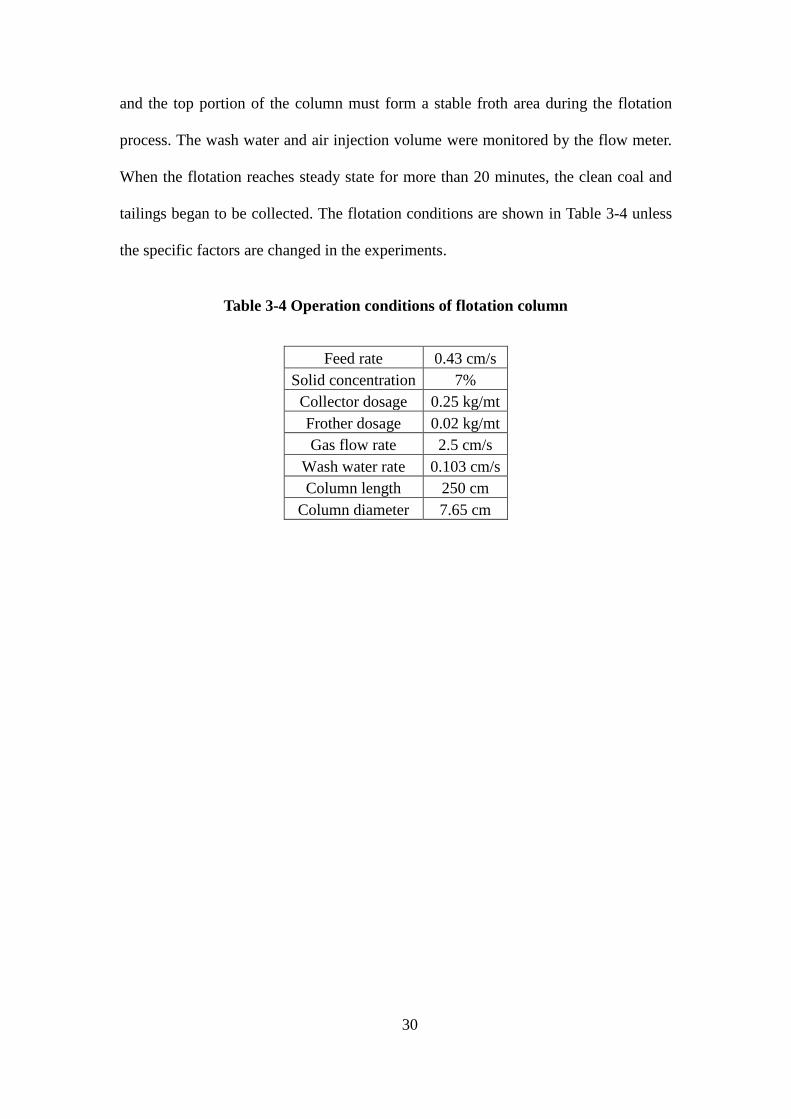
tailings began to be collected. The flotation conditions are shown in Table 3-4 unless
the specific factors are changed in the experiments.
Table 3-4 Operation conditions of flotation column
Feed rate 0.43 cm/s
Solid concentration 7%
Collector dosage 0.25 kg/mt
Frother dosage 0.02 kg/mt
Gas flow rate 2.5 cm/s
Wash water rate 0.103 cm/s
Column length 250 cm
Column diameter 7.65 cm
31
Figure 3-3 Schematic diagram of flotation column system.
To obtain product samples, the clean coal and tailings samples are collected for 1
minute, and then stop collecting for 1 minute. Repeat this procedure until the feed
slurry is exhausted. The clean coal and tailings then filtered, and dried in the oven for
8 hours at 105 ℃. They are weighted and ash contents are determined using ASTM
method (ASTM D317-12).
32
The calculation of the combustible material recovery is shown in eq.(3-1):
CMR% = 𝑌𝑐(100 − 𝐴𝑐)/(100 − 𝐴𝑓) (3-1)
Where the Yc is the clean coal yield, Ac is the clean coal ash content, and Af is the
feed coal ash content.
In the conventional open flotation column, using conventional spargers or
static-mixers, it is important to keep the depth of froth layer during column flotation.
A stable sufficient deep particles coated froth layer provides enough time for the wash
water to eliminate the entrained hydrophilic mineral particles trapped between air
bubbles. The depth of the froth layer should contain more than 10 cm which can be
controlled by balance of the tailings discharge rate, wash water rate and feed coal rate.
The froth layer can also be used to judge the stability of the column flotation. Usually
it takes about 15 minutes to obtain the stable froth layer and steady state in the
flotation column. On the contrary, by utilizing pico and nano bubbles in the flotation
column, the froth depth adjustment problem can be ignored. This is due to the high
density distribution of pico and nano bubbles inside of column. This contributes to
high probability of collision and attachment between coal particles and air bubbles.
33
CHAPTER 4
RESULTS AND DISCUSSIONS
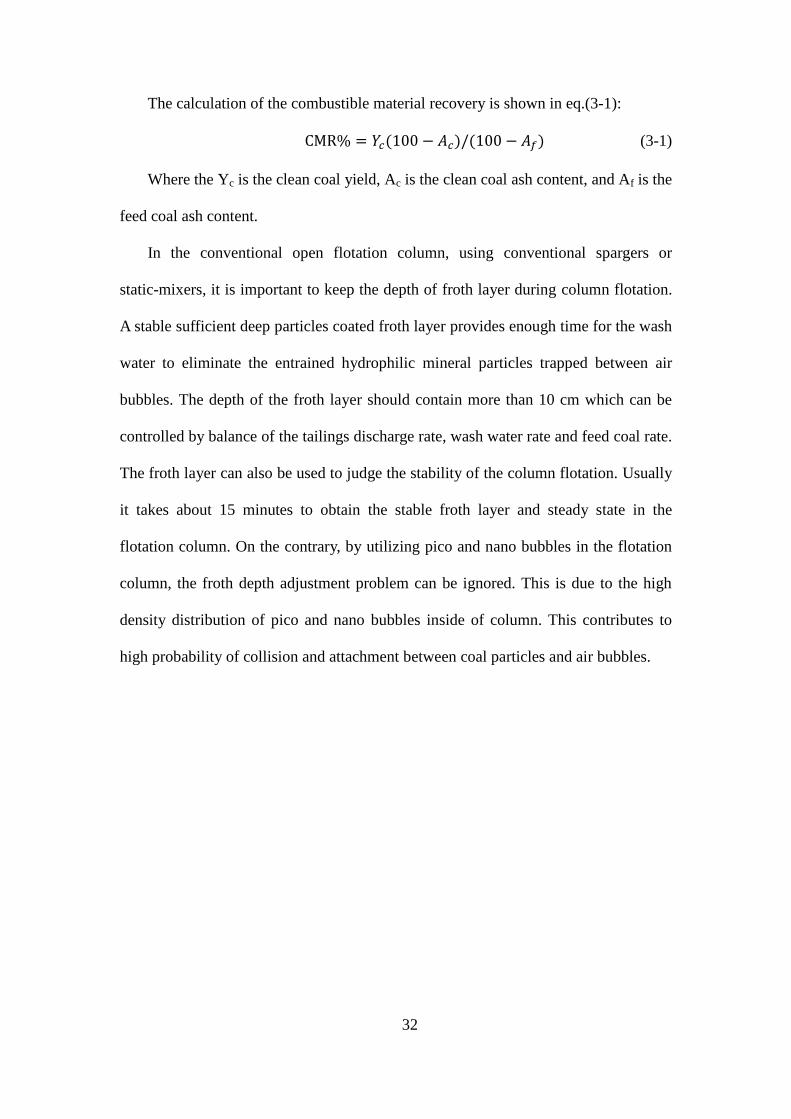
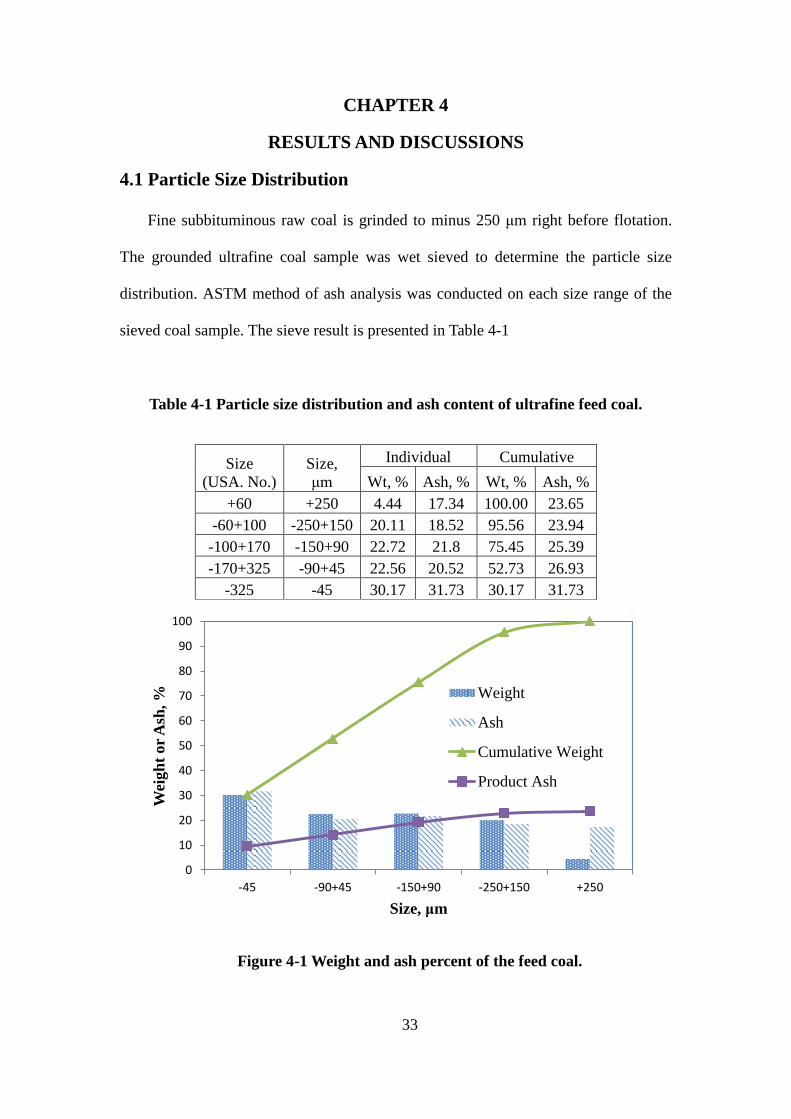
4.1 Particle Size Distribution
Fine subbituminous raw coal is grinded to minus 250 μm right before flotation.
The grounded ultrafine coal sample was wet sieved to determine the particle size
distribution. ASTM method of ash analysis was conducted on each size range of the
sieved coal sample. The sieve result is presented in Table 4-1
Table 4-1 Particle size distribution and ash content of ultrafine feed coal.
Size
(USA. No.)
Size,
μm
Individual Cumulative
Wt, % Ash, % Wt, % Ash, %
+60 +250 4.44 17.34 100.00 23.65
-60+100 -250+150 20.11 18.52 95.56 23.94
-100+170 -150+90 22.72 21.8 75.45 25.39
-170+325 -90+45 22.56 20.52 52.73 26.93
-325 -45 30.17 31.73 30.17 31.73
Figure 4-1 Weight and ash percent of the feed coal.
0
10
20
30
40
50
60
70
80
90
100
-45 -90+45 -150+90 -250+150 +250
Wei
gh
t or
Ash
, %
Size, μm
Weight
Ash
Cumulative Weight
Product Ash
34
From the sieving result, the ultrafine coal particles (minus 45 μm) have 30.17%
of the total weight with ash content of 21.73%. The coarse particles larger than 250
μm (USA No. 60) are 4.44% with ash content of 17.34%. The ash content of ultrafine
particles is the highest one among all the size ranges. This shows mineral particles
that exist in the feed coal have very small size. These ultrafine mineral particles can
cause the slime coating on the coal surface that affects clean coal quality directly.
4.2 Flotation Rate of Stirred Tank Cell
Two series of semi-batch cell flotation were conducted to test the floatability of
subbituminous coal and the effect of TTT frother. Each series has three sets of
experiments. In the first series of experiment, the first test was on the Pittsburgh #8
coal using the kerosene as collector and MIBC as frother. The second test was on
subbituminous coal using kerosene as collector and MIBC as frother. The third test
was on the subbituminous coal using kerosene as collector and TTT frother as frother.
In the second series of experiments, the collector dosage increased to 2 kg/mt and the
frother dosage increased to 0.3 kg/mt while keeping the other operation conditions the
same as the first series. Table 4-2 shows the flotation result using collector of 0.5
kg/mt and frother of 0.02 kg/mt. Table 4-3 shows the flotation result using collector of
2 kg/mt and frother of 0.3 kg/mt. Figure 4-2 and Figure 4-3 that show the relationship
between combustible material recovery, ash content and the flotation time.

35
Table 4-2 Flotation rate results using collector of 0.5 kg/mt and frother of 0.02 kg/mt.
Pittsburgh #8-MIBC Subbituminous-MIBC
Subbituminous Coal-TTT
frother
Time, s
Weight,
g Weight, % Ash, %
Weight,
g Weight, % Ash, %
Weight,
g Weight, % Ash, %
15 20.94 11.15 12.70 11.98 6.88 18.70 15.64 8.97 21.74
30 20.14 10.72 11.35 10.39 5.97 19.03 13.16 7.55 19.98
45 19.30 10.27 11.35 4.88 2.80 18.04 9.22 5.29 18.94
60 20.32 10.82 11.62 2.39 1.37 17.41 4.53 2.60 18.28
90 25.49 13.57 18.54 2.88 1.65 18.79 6.09 3.49 19.73
120 15.22 8.10 27.52 1.21 0.69 20.40 3.47 1.99 21.42
180 17.09 9.10 38.27 3.05 1.75 23.80 7.14 4.10 27.09
Tailings 49.35 26.27 67.56 137.36 78.88 25.33 115.04 66.00 29.33

36
Table 4-3 Flotation rate results using collector of 2 kg/mt and frother of 0.3 kg/mt.
Pittsburgh #8 coal-MIBC Subbituminous coal-MIBC
Subbituminous Coal-TTT
frother
Time, s
Weight,
g Weight, % Ash, %
Weight,
g Weight, % Ash, %
Weight,
g Weight, % Ash, %
15 29.1603 15.41 18.59 41.80 23.79 16.35 44.20 25.14 19.62
30 23.9376 12.65 13.26 36.96 21.03 17.64 41.77 23.76 17.34
45 22.9347 12.12 13.58 32.78 18.66 16.87 37.81 21.51 16.69
60 24.4296 12.91 13.21 18.56 10.56 17.74 21.66 12.32 16.08
90 29.8983 14.80 18.43 3.45 1.96 17.93 4.59 2.61 18.54
120 15.5736 8.23 29.56 4.14 2.36 21.33 3.32 1.89 23.65
180 3.99275 2.11 41.86 5.54 3.15 24.05 3.67 2.09 28.91
Tailings 41.1954 21.77 76.53 32.48 18.49 54.89 18.78 10.68 64.31
37
Figure 4-2 Combustible material recovery as a function of time (a) collector 0.5
kg/mt, frother 0.02 kg/mt (b) and collector 2 kg/mt, frother 0.3 kg/mt.
0
10
20
30
40
50
60
70
80
90
100
0 20 40 60 80 100 120 140 160 180 200
Com
bu
stib
le M
ate
rial
Rec
over
y,
%
Time, s
Pittsburgh #8 coal-MIBC (a)
Subbituminous Coal-MIBC (a)
Subbituminous Coal-TTT frother (a)
Pittsburgh #8 Coal-MIBC (b)
Subbituminous Coal-MIBC (b)
Subbituminous Coal-TTT frother (b)
38
Figure 4-3 Combustible material recovery versus ash content (a) collector 0.5
kg/mt, frother 0.02 kg/mt, and (b) collector 2 kg/mt, frother 0.3 kg/mt.
From the results of these flotation experiments, the flotation of subbituminous
coal using MIBC as frother obtained very low combustible material recovery. When
the MIBC was replaced by the TTT frother at the same dosage, the cumulative
combustible material recovery increased significantly. Compare the flotation of
subbituminous coal and that of Pittsburgh #8 coal (high volatile bituminous coal)
which is known to have high floatability, combustible material recovery is much
higher than the subbituminous coal using kerosene as collector and MIBC as frother.
The results show reflects the subbituminous coal is a difficult to float coal. When the
TTT frother is used in the semi-batch cell flotation, it can improve the combustible
0
10
20
30
40
50
60
70
80
90
100
0 5 10 15 20 25 30 35
Com
bu
stib
le M
ate
rial
Rec
over
y,
%
Ash, %
Pittsburgh #8 coal-
MIBC (a)
Subbituminos
Coal-MIBC (a)
Subbitumnous
Coal-TTT frother
(a)Pittsburgh #8-
MIBC (b)
Subbituminous
Coal-MINC (b)
Subbituminous
Coal-TTT frother
(b)
39
material recovery of subbituminous coal. It shows the TTT frother has better effect in
recovering subbituminous coal.
In the second series of experiments, when the collector dosage is increased to 2
kg/mt and frother is increased to 0.3 kg/mt, the combustible material recovery of these
three experiments are above 85% with about 17.5% of clean coal ash content. These
experiments prove that the use of high chemical reagents dosage can recover most of
the coal particles from feed coal, however with higher clean coal ash content.
4.3 Frother and Collector Effects for Stirred Tank Cell Flotation
The chemical reagents used are kerosene as collector and MIBC as frother for
subbituminous coal flotation. The overall low combustible material recovery and high
ash content of clean coal shows the conventional flotation method cannot achieve
satisfactory flotation results due to the nature oxidation of the subbituminous coal.
Several stirred tank cell flotation tests were conducted on the coal sample (minus 250
μm) by varying chemical reagent dosage. The subbituminous coal has naturally
oxidized surface where the oxygenated functional groups have occupied many parts
of coal surface. The chemical reagent must be increased to spread the collector and
adsorb on the coal surface that improves its hydrophobicity. The experiment based on
the variation of MIBC dosages from 0.02 kg/mt to 0.3 kg/mt while keeping the
kerosene dosage constant at 0.5 kg/mt. In this experiment, the MIBC dosage was
increased to float the difficult-to-float coal in order to enhance the hydrophobicity of
coal fines. The flotation results of this series of stirred tank cell flotation are given in
Table 4-4.

40
Table 4-4 Results of stirred tank cell flotation using various MIBC dosages at 0.5
kg/mt kerosene.
MIBC,
kg/mt
Clean
Coal, g
Tailings,
g
Clean
Coal, %
Tailings,
%
Clean Coal
Ash, %
Tailings
Ash, %
CMR,
%
0.02 33.53 130.77 20.41 79.59 20.30 24.50 16.27
0.08 51.65 114.47 31.09 68.91 20.23 24.40 24.80
0.16 62.22 107.41 36.68 63.32 18.21 26.00 30.00
0.3 58.88 111.13 34.63 65.37 18.70 25.00 28.16
To present the changing trend of the combustible material recovery and clean coal
ash content with the variation of the MIBC dosage, their relationship is plotted in
Figure 4-4.
From the flotation results, the increasing of MIBC dosage can certainly improve
the combustible material recovery and reduce the clean coal ash content. The increase
of the combustible material recovery with increasing amount of MIBC dosage may be
attributed to the positive effect of MIBC on the dispersion of kerosene over the coal
surface especially those hydrophilic sites (Naik et al., 2005). In addition, the MIBC
can also interact with the coal particles on the polar site of the coal surface through
hydrogen bonding that increases the selectivity (Polat et al., 2003). Thus the
hydrophobicity of the coal particles is enhanced. However, the MIBC on the
combustible material recovery of this batch of subbituminous coal sample is limited.
When the MIBC dosage was used more than 0.16 kg/mt, there exists the maximum
value of combustible material recovery that was obtained. When the MIBC dosage
was continuing increased, it reduced the recovery of clean coal particles. This
phenomenon may be caused by the overdose of MIBC that coated on the coal surface
that decreased the hydrophobicity of the coal particles (Naik et al., 2005). This means
41
the combustible material recovery increases corresponding to the improved MIBC
concentration that reflect coal particles become more hydrophobic and selective.
Figure 4-4 Combustible material recovery and clean coal ash versus MIBC
dosage in the stirred tank cell flotation.
When the frother concentration increases, the surface tension of the interface
between the water and air bubble becomes smaller which forms more stable and small
air bubbles. Excessive amount of frother addition may lead to “stiff” frother, which
may be harder to coalescence caused by the excessive interface surface tension. If the
air bubbles size becomes smaller, its quantity will be larger with the constant air flow
rate Thus the increased MIBC dosage also affects the flotation performance through
its own effect.
The second set of stirred tank cell flotation tests applied on the coal is to test the
effect of TTT frother on the difficult-to-float coal flotation performance. This aims to
18
18.5
19
19.5
20
20.5
21
0
5
10
15
20
25
30
35
0 0.05 0.1 0.15 0.2 0.25 0.3 0.35
Cle
an
Coal A
sh,
%
Com
bu
stib
le M
ate
rial
Rec
over
y,
%
MIBC, kg/mt
Combustible Material
Recovery
Clean Coal Ash

42
test whether the selected frother has the ability to activate the naturally oxidized
subbituminous coal surface to become more hydrophobic and have better separation.
The design of this set of stirred tank cell flotation test varies the TTT frother dosage
from 0.02 kg/mt to 0.3 kg/mt. The kerosene dosage in this series of experiments is
constant at 0.5 kg/mt. The flotation results are shown in Table 4-5:
Table 4-5 Results of stirred tank cell flotation using various TTT frother dosages
at 0.5 kg/mt kerosene.
TTT frother,
kg/mt
Clean
Coal, g
Tailings,
g
Clean
Coal, %
Tailings,
%
Clean Coal
Ash, %
Tailings
Ash, %
CMR,
%
0.02 53.96 110.96 32.72 67.28 21.02 24.49 34.22
0.08 92.09 72.06 56.10 43.90 16.75 31.46 68.14
0.16 107 58.4 64.69 35.31 15.80 35.96 85.06
0.3 118.21 49.77 70.37 29.63 15.40 37.83 95.76
From the flotation results, the clean coal yield and combustible material are much
higher than that produced by MIBC at the same dosage. In addition, the clean coal ash
content decreases from 21% to 15.4%, while combustible material recovery increases
from 34.2% to 95.8% by increasing TTT frother dosage from 0.02 kg/mt to 0.3 kg/mt,
at 0.5 kg/mt kerosene dosage. The significant effects on enhancing combustible
material recovery and reduction of clean coal ash content are remarkable. Additionally,
the blended frother with multiple key ingredients as surfactants can activate naturally
oxidized surface of difficult to float coal. The combustible material recovery and
clean coal ash content versus the TTT frother dosages is presented in Figure 4-5:
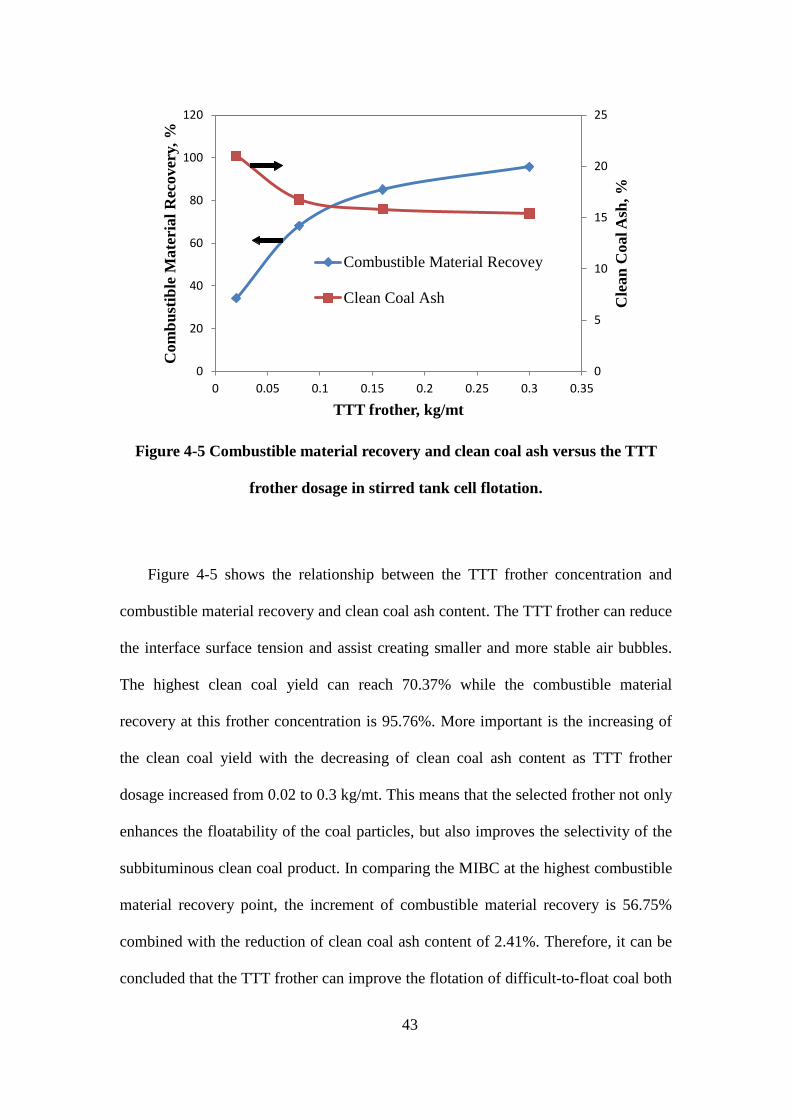
43
Figure 4-5 Combustible material recovery and clean coal ash versus the TTT
frother dosage in stirred tank cell flotation.
Figure 4-5 shows the relationship between the TTT frother concentration and
combustible material recovery and clean coal ash content. The TTT frother can reduce
the interface surface tension and assist creating smaller and more stable air bubbles.
The highest clean coal yield can reach 70.37% while the combustible material
recovery at this frother concentration is 95.76%. More important is the increasing of
the clean coal yield with the decreasing of clean coal ash content as TTT frother
dosage increased from 0.02 to 0.3 kg/mt. This means that the selected frother not only
enhances the floatability of the coal particles, but also improves the selectivity of the
subbituminous clean coal product. In comparing the MIBC at the highest combustible
material recovery point, the increment of combustible material recovery is 56.75%
combined with the reduction of clean coal ash content of 2.41%. Therefore, it can be
concluded that the TTT frother can improve the flotation of difficult-to-float coal both
0
5
10
15
20
25
0
20
40
60
80
100
120
0 0.05 0.1 0.15 0.2 0.25 0.3 0.35
Cle
an
Coal A
sh,
%
Com
bu
stib
le M
ate
rial
Rec
over
y,
%
TTT frother, kg/mt
Combustible Material Recovey
Clean Coal Ash
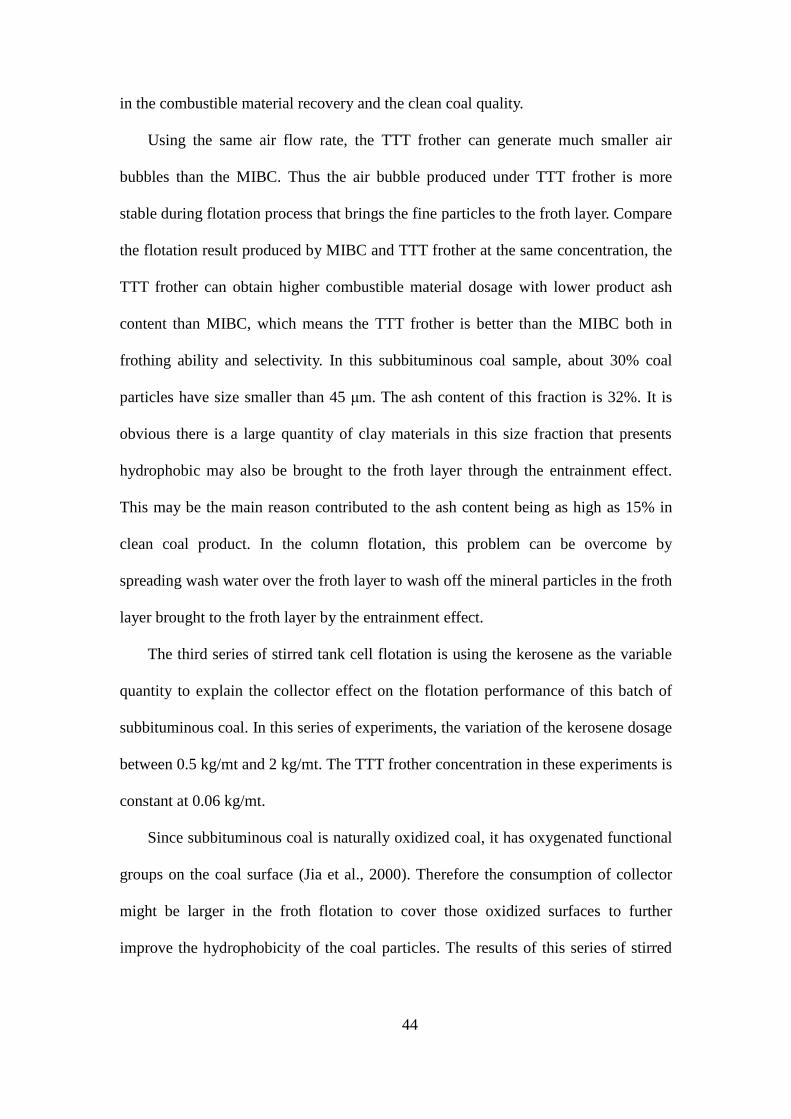
44
in the combustible material recovery and the clean coal quality.
Using the same air flow rate, the TTT frother can generate much smaller air
bubbles than the MIBC. Thus the air bubble produced under TTT frother is more
stable during flotation process that brings the fine particles to the froth layer. Compare
the flotation result produced by MIBC and TTT frother at the same concentration, the
TTT frother can obtain higher combustible material dosage with lower product ash
content than MIBC, which means the TTT frother is better than the MIBC both in
frothing ability and selectivity. In this subbituminous coal sample, about 30% coal
particles have size smaller than 45 μm. The ash content of this fraction is 32%. It is
obvious there is a large quantity of clay materials in this size fraction that presents
hydrophobic may also be brought to the froth layer through the entrainment effect.
This may be the main reason contributed to the ash content being as high as 15% in
clean coal product. In the column flotation, this problem can be overcome by
spreading wash water over the froth layer to wash off the mineral particles in the froth
layer brought to the froth layer by the entrainment effect.
The third series of stirred tank cell flotation is using the kerosene as the variable
quantity to explain the collector effect on the flotation performance of this batch of
subbituminous coal. In this series of experiments, the variation of the kerosene dosage
between 0.5 kg/mt and 2 kg/mt. The TTT frother concentration in these experiments is
constant at 0.06 kg/mt.
Since subbituminous coal is naturally oxidized coal, it has oxygenated functional
groups on the coal surface (Jia et al., 2000). Therefore the consumption of collector
might be larger in the froth flotation to cover those oxidized surfaces to further
improve the hydrophobicity of the coal particles. The results of this series of stirred
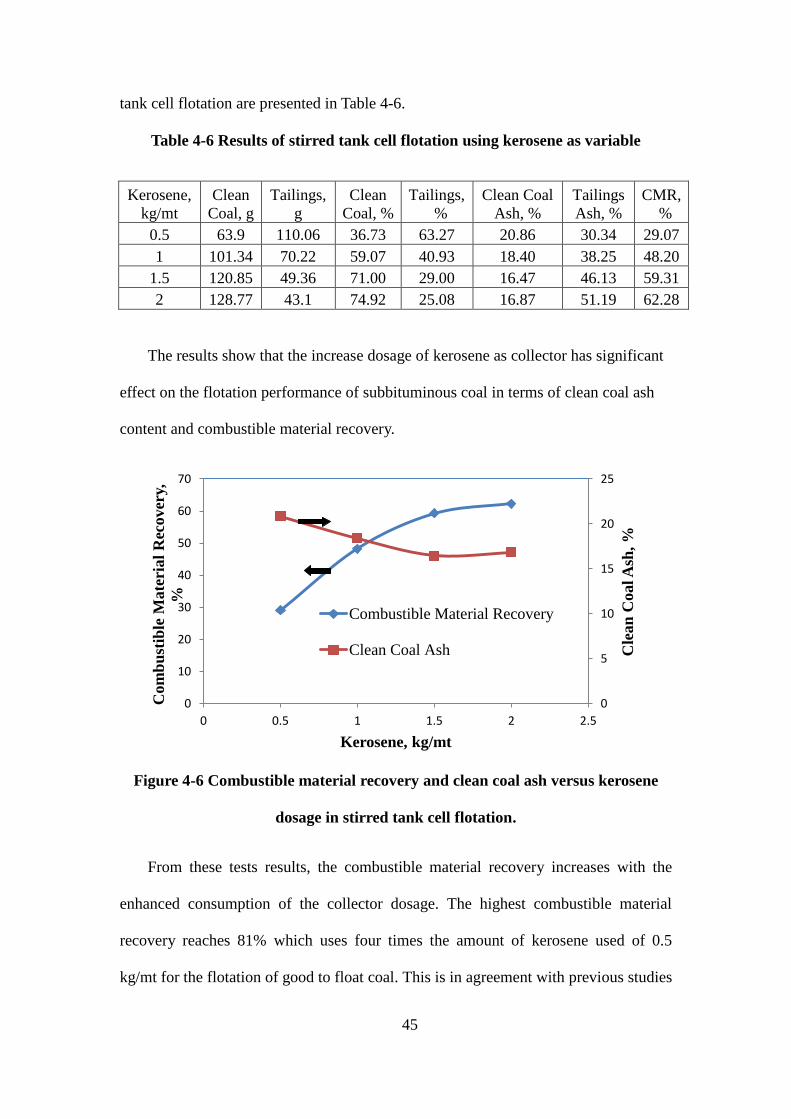
45
tank cell flotation are presented in Table 4-6.
Table 4-6 Results of stirred tank cell flotation using kerosene as variable
Kerosene,
kg/mt
Clean
Coal, g
Tailings,
g
Clean
Coal, %
Tailings,
%
Clean Coal
Ash, %
Tailings
Ash, %
CMR,
%
0.5 63.9 110.06 36.73 63.27 20.86 30.34 29.07
1 101.34 70.22 59.07 40.93 18.40 38.25 48.20
1.5 120.85 49.36 71.00 29.00 16.47 46.13 59.31
2 128.77 43.1 74.92 25.08 16.87 51.19 62.28
The results show that the increase dosage of kerosene as collector has significant
effect on the flotation performance of subbituminous coal in terms of clean coal ash
content and combustible material recovery.
Figure 4-6 Combustible material recovery and clean coal ash versus kerosene
dosage in stirred tank cell flotation.
From these tests results, the combustible material recovery increases with the
enhanced consumption of the collector dosage. The highest combustible material
recovery reaches 81% which uses four times the amount of kerosene used of 0.5
kg/mt for the flotation of good to float coal. This is in agreement with previous studies
0
5
10
15
20
25
0
10
20
30
40
50
60
70
0 0.5 1 1.5 2 2.5
Cle
an
Coal A
sh,
%
Com
bu
stib
le M
ate
rial
Rec
over
y,
%
Kerosene, kg/mt
Combustible Material Recovery
Clean Coal Ash
46
of the effect of kerosene. This shows the collector has dramatically increased the
hydrophobicity of coal particles that improves the combustible material recovery.
However, it can create tendency of overly used oily collector. When the amount of
kerosene is 2 kg/mt, the clean coal product ash is higher than the kerosene dosage of
1.5 kg/mt. From this, the kerosene is inferred to be overused at 2 kg/mt. Though oil
collector improved the hydrophobicity of coal particles, it might also modify the
surface property of other mineral particles that made them easier to float. This may be
the main reason that caused the clean coal ash content becomes higher when kerosene
used at 2 kg/mt. Therefore the amount of kerosene used should be controlled to not be
overused for the production of high quality clean coal.
4.4 Column Flotation Using Pico and Nano Bubbles
The flotation column can use its advantages to further improve the flotation
efficiency of difficult-to-float coal. Though the open flotation column does not have
any mechanical part applied during the flotation process, it has long flotation region
and wash water system which improve the clean coal quality. Especially the newly
developed pico and nano bubble generation system designed for the revised open
flotation column. These tiny air bubbles are retained in the flotation column much
longer and dramatically enhance the probabilities of collision and attachment between
air bubble and coal particles.
To operate the flotation column, six factors are considered that affect the flotation
result most significantly. They are:
47
(1) Feed Solid Concentration
(2) Collector Dosage
(3) Frother Dosage
(4) Air Flow Rate
(5) Feed Rate
(6) Wash Water Rate
The feed rate and feed solid concentration affect the processing capacity per unit
time. If the dry coal processing amount exceeds the processing capacity of the column,
more clean coal will be disposed through the tailings stream. If this amount processed
becomes too low, it not only increases the time cost and energy cost, but also reduces
the clean coal quality. The collector dosage and frother dosage are the chemical
reagent factors that related to the flotation results. The effects of properties, dosage,
and interaction characteristics of chemical reagents on the surface of coal particles
related to the flotation performance. If the amount of reagents used is too low, it
cannot improve the coal surface property to the extent that improves the flotation
results. If the reagent dosage is too high, it will exert reverse effect on the coal surface
that makes it become hydrophilic and modify the surface of mineral particles to
become hydrophobic. At the same time this will make hydrophilic mineral particles
become hydrophobic particles due to the excessive amount of reagents. In present
study, TTT frother is employed instead of conventional frother such as MIBC to study
its effect on the subbituminous coal, a difficult-to-float coal, which shows high degree
of hydrophilicity.
The wash water rate determines how effective it can remove the entrained
48
ultrafine mineral particles in the froth layer (Finch, 1995). This efficiency related with
the froth layer height, air bubble property and the adsorption conditions between the
solid particles and air bubbles. Varying the wash water rate in the design of
experiment can find out the best wash water flowing rate according to the property of
froth layer and coal sample.
The air flow rate affects the bubble generation. As the schematic of the air bubble
generation system described in Chapter 3, the air is fed into the tailings stream from
the inner funnel before entering the peristaltic pump. The air-slurry ratio is determined
by the tailings slurry volume drawn out per unit time and the air flow rate. The
mixture of tailings slurry and air passes through a static mixer and then a venturi
cavitation tube. The air volume percent in the air-slurry mixture controls the pico and
nano bubble size distributions. If the air volume is too high, it causes too little slurry
passing through the venturi cavitation tube that cannot provide enough water to break
the air flow into tiny air bubbles and maintain their tiny size before entering the
flotation column. If the air flow rate is too low, when the mixture passes through the
venturi cavitation tube, it does not have enough air to be disparaged. Only a small
quantity of tiny bubbles can be produced. The air bubble generation system affected
by the tailings stream solid concentration, air percentage and volume flow rate, as
well as the dimensions of venture cavitation tube. The peristaltic pump speed has been
adjusted to the rate that can create the appropriate percentages of pico and nano
bubbles distributions, when using the water, air and 0.02 kg/mt MIBC in the initial
test. The detailed optimal of venture cavitation tube for generating pico and nano
bubbles and measurement of bubble distributions will be reported by peng and xiong
(2014). For the column flotation initial test, the tailings recirculating stream has solid

49
particles. Therefore the air flow rate is varied to optimize it according to the
experiment conditions.
Based on the semi-batch cell flotation results for subbituminous coal, the column
flotation test based on six factors is designed, which is exhibited in Table 4-7. The
ranges of three levels for each factor are given in Talbe 4-8. In this design of
experiment, the custom design in JMP software tool (SAS Institution) is employed
which using the I-optimal design. Trials in the I-optimal design are well spread out
from each other. In comparing with the classic designs, the I-optimal design spread
the points out to provide the minimum average variance of predictions rather than
spread the points out in space. This design is most cost-effective, and it can minimize
the average variance of prediction over the factor space. The variance is the square of
the standard deviation of the prediction from the fitted model (Kappele, 1998).
The first stage design of experiment can be used to analyze the effect of each
factor on the flotation performance. By analyzing the flotation results, it can provide
which factors are more significant in the froth flotation process. Additionally, the
coefficient among these factors can also be analyzed. The flotation results of this set
of column flotation experiments are shown in Table A-1.
Combustible material recovery is an important standard to check the efficient the
froth flotation performance. High combustible material recovery represents the coal
particles in the raw coal can be recovered efficiently, while low combustible material
recovery means many of the coal particles are lost to the tailings stream. Therefore,
high combustible material recovery is the major purpose in conducting the froth
flotation. Despite the achievement on the combustible material recovery, the clean
coal, product, quality must be considered. Because the lower the ash content of the
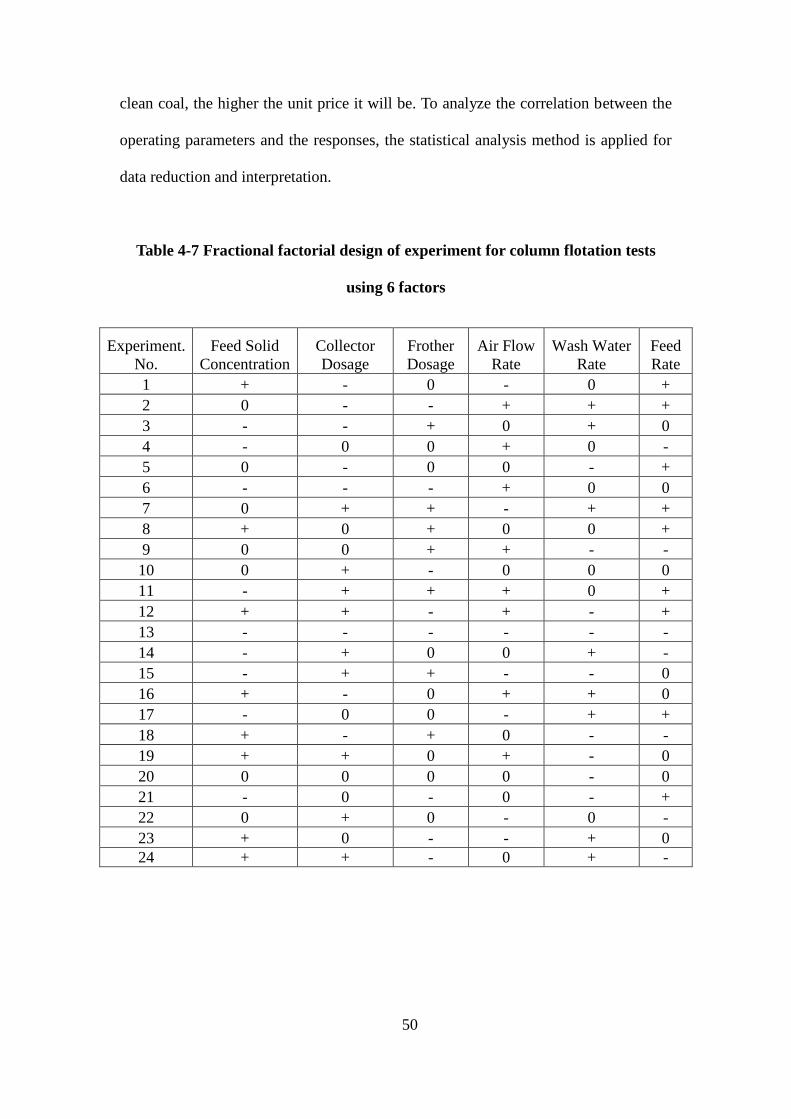
50
clean coal, the higher the unit price it will be. To analyze the correlation between the
operating parameters and the responses, the statistical analysis method is applied for
data reduction and interpretation.
Table 4-7 Fractional factorial design of experiment for column flotation tests
using 6 factors
Experiment.
No.
Feed Solid
Concentration
Collector
Dosage
Frother
Dosage
Air Flow
Rate
Wash Water
Rate
Feed
Rate
1 + - 0 - 0 +
2 0 - - + + +
3 - - + 0 + 0
4 - 0 0 + 0 -
5 0 - 0 0 - +
6 - - - + 0 0
7 0 + + - + +
8 + 0 + 0 0 +
9 0 0 + + - -
10 0 + - 0 0 0
11 - + + + 0 +
12 + + - + - +
13 - - - - - -
14 - + 0 0 + -
15 - + + - - 0
16 + - 0 + + 0
17 - 0 0 - + +
18 + - + 0 - -
19 + + 0 + - 0
20 0 0 0 0 - 0
21 - 0 - 0 - +
22 0 + 0 - 0 -
23 + 0 - - + 0
24 + + - 0 + -
51
Table 4-8 Ranges of three levels for the first stage design of experiment using 6
factors
Feed Solid
Concentration, %
Collector
Dosage,
kg/mt
Frother
Dosage,
kg/mt
Air Flow
Rate,cm/s
Wash
Water Rate,
cm/s
Feed
Rate,
cm/s
+ 10 1 0.12 1.125 cm/s 0.138 0.53
0 6 0.6 0.08 0.75 cm/s 0.092 0.43
- 3 0.3 0.05 0.375 cm/s 0.046 0.33
The combustible material recovery and the clean coal ash content are chosen as
the responses respectively. The ANOVA Table and the Effect Tests Table of the factors
on the flotation performance are shown in Table 4-9 and Table 4-10:
The ANOVA table shows the model composed of those six factors has the F ratio
of 21.07 and its P-value is smaller than 0.0001. The results show these six factors
have significant correlation with the response of combustible material recovery from
the column flotation performance results.
The data of ash content in the ANOVA table shows the model composed of these
six factors cannot predict the clean coal product ash as precisely as they predict the
combustible material recovery. From the effect tests result, the feed solid
concentration has the lowest P value, this strongly means the feed solid concentration
affect the combustible material recovery most. The P value of collector dosage and the
frother dosage are 0.1046 and 0.0248 respectively. Those three factors have much
lower P values than the other three factors. Therefore it can be inferred that Feed Solid
Concentration, Collector Dosage and Frother Dosage are comparatively significant
factors on the combustible material recovery for the flotation of subbituminous coal.

52
Table 4-9 Analysis of Variance table for the first stage design of experiment.
Combustible material recovery
Source DF Sum of Squares Mean Square F Ratio
Model 6 7220 1203.4 21.07
Error 17 970.8 57.11 Prob>F
C. Total 23 8191
<0.0001
Ash Content
Source DF Sum of Squares Mean of Square F Ratio
Model 6 28.85 4.81 0.84
Errer 17 97.74 5.75 Prob>F
C. Total 23 126.59
0.5587
Table 4-10 Effect Tests table for the first stage design of experiment.
Combustible Material Recovery
Source Nparm DF Sum of Squares F Ratio Prob>F
Feed Solid Concentration 1 1 6392.3 111.9 <0.0001
Collector Dosage 1 1 167.8 2.94 0.1046
Frother Dosage 1 1 345.9 6.06 0.0248
Air Flow Rate 1 1 6.35 0.11 0.743
Wash Water Rate 1 1 4.6 0.08 0.78
Feed Rate 1 1 27.4 0.48 0.498
Ash Content
Source Nparm DF Sum of Squares F Ratio Prob>F
Feed Solid Concentration 1 1 6.69 1.164 0.296
Collector Dosage 1 1 10.08 1.753 0.203
Frother Dosage 1 1 0.05 0.009 0.925
Air Flow Rate 1 1 0.0003 0.0001 0.994
Wash Water Rate 1 1 0.389 0.0676 0.798
Feed Rate 1 1 11.26 1.958 0.18
53
Based on this series of column flotation experiments, the effect of operating
factors on the clean coal ash content can also be analyzed. When the ash content of
clean coal is chosen as the response, the solid concentration, collector dosage and feed
rate are the comparatively significant parameters. In the operation ranges of these
three factors, they affect the clean coal ash content more dramatically than the other
three parameters on their operation ranges during the column flotation
The purpose of this study is to obtain the best quality clean coal with the
combustible material recovery as high as possible. Therefore the three factors that
affect the clean coal ash content more significantly will be chosen in further studies.
To present the effect of solid concentration, collector dosage and feed rate on the
clean coal ash and the combustible material recovery, response surface plot and
contour plot based on the combination of every two factors of these three factors are
given in Figure 4-7, Figure 4-8 and Figure 4-9 respectively.

54
(a)
(b)
Figure 4-7 Effect of feed solid concentration and collector dosage on (a) the
combustible material recovery and (b) clean coal ash.
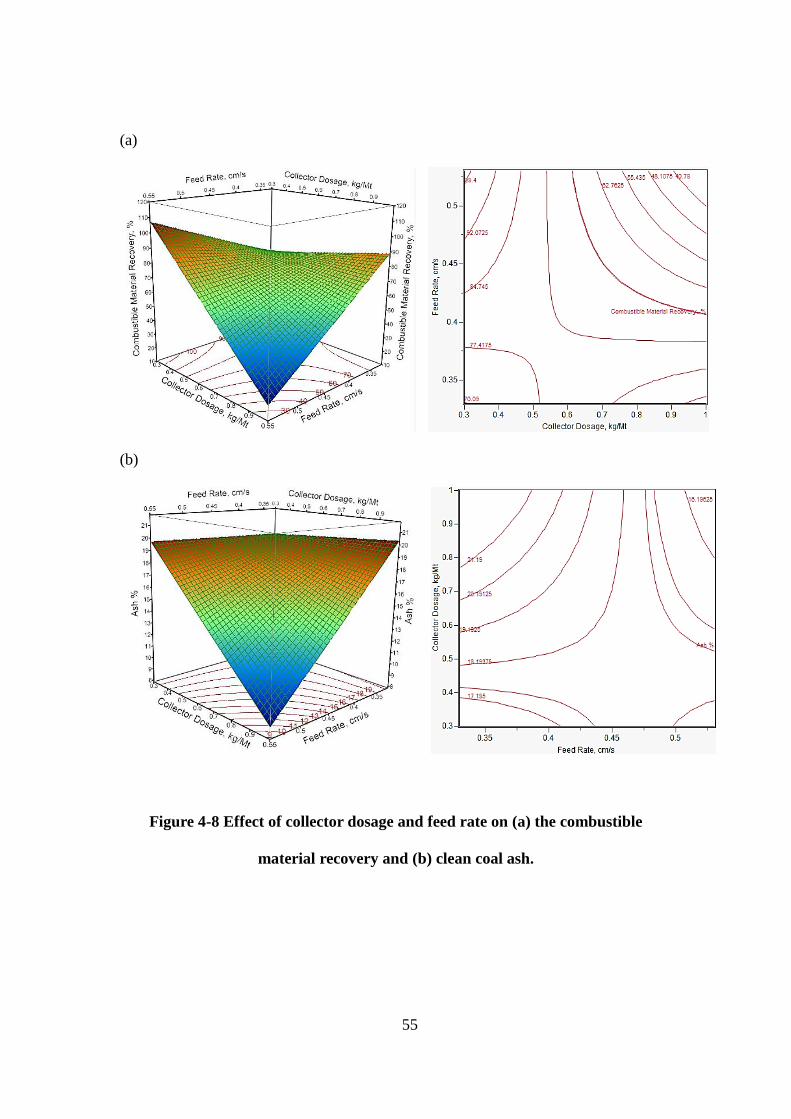
55
(a)
(b)
Figure 4-8 Effect of collector dosage and feed rate on (a) the combustible
material recovery and (b) clean coal ash.

56
(a)
(b)
Figure 4-9 Effect of feed rate and feed solid concentration on (a) the combustible
material recovery and (b) clean coal ash.
57
Based on these 3D response surface plots, it can be inferred that the combustible
material recovery can be in a high level when the feed solid concentration is
comparatively low, feed rate is in low level and the collector dosage is in the middle
level in its range. Additionally the clean coal ash content tends toward lower level
when the collector dosage is high, while the feed solid concentration stays in the
medium level and the feed rate keeps at a comparatively low level. For these three
operating paramteres, the clean coal ash content is superior to the combustible
material recovery to achieve the high quality coal. Therefore according to the clean
coal ash content variation trend, a second stage of design of experiments is designed
by varying those three significant factors in affecting the clean coal ash content
around their best levels to obtain lower ash content of clean coal product. The purpose
is to obtain high quality of clean coal product combined with the combustible material
recovery as high as possible.
In addition to the effect of a single factor, the interactions between two of those
six combinations on combustible material recovery and clean coal ash content are also
considered. The effect test results for those factors combinations are shown in Table
4-11. The explanation for three factors in interaction is given in Table 4-12.
From the effect test results, the combinations of feed solid concentration × feed
rate, collector dosage × air flow rate and collector dosage × wash water rate are
comparatively significant than the other combinations effect on the clean coal ash
content since these three combinations have P value smaller than 0.5. While the
interactions of feed solid concentration × feed rate, collector dosage × air flow
rate, collector dosage × wash water rate, collector dosage × feed rate, and frother
dosage × air flow rate are significant for the combustible material recovery. Thus,

58
these interactions are incorporated into the prediction of combustible material
recovery and clean coal ash content models as shown in Eq (4-1) and Eq (4-2)
respectively.
Combustible material recovery % = 93.76 − 580.2 − 5.6 + 0.22
C + 0.11 − 0.05 + 0.01 + [( − 0.062) ( − 3.92) .8] +
[( − 1.3) ( − 0.83) 0. 1] + [( − 3.92) ( − 3.92) .1 ] +
[( − 1.3) ( − 58.33) (−0.08)] + [(C − 81.67) ( − 0.83)
(−0.009 )] (4-1)
Clean Coal sh % = 11.6 + 15.88 + 1.09 + 0.003 C − 0.007 +
0.13 + 0.007 + [( − 0.06) ( − 58.33) 0.02] + [( − 1.3)
( − 0.83) 0.03] − [( − 1.3) ( − 3.92) 0.33] (4-2)
Where A is Feed Solid Concentration; B is Collector Dosage; C is Frother Dosage;
D is Air Flow Rate; E is Wash Water Rate; and F is Feed Rate

59
Table 4-11 Effect Tests table of the combinations of each two factors for the first
stage design of experiment.
Combustible Material Recovery Clean Coal Ash Content
Source Sum of Squares F Ratio Prob>F Sum of Squares F Ratio Prob>F
A × B 44.65 0.83 0.51 1.22 0.26 0.66
A × C 79.25 1.11 0.4 1.62 0.34 0.62
A × D 31.13 0.44 0.58 0.24 0.05 0.84
A × E 96.16 1.35 0.37 1.34 0.28 0.65
A × F 1.38 0.019 0.9 5.45 1.15 0.4
B × C 59.04 0.83 0.44 0.05 0.01 0.93
B × D 129.81 1.82 0.31 4.56 0.96 0.43
B × E 87.78 1.23 0.38 6.1 1.28 0.38
B × F 106.75 1.49 0.35 1.34 0.28 0.65
C × D 96.11 1.34 0.37 2.85 0.6 0.52
C × E 2.83 0.04 0.86 0.2 0.04 0.86
C × F 15.43 0.22 0.69 0.78 0.16 0.72
D × E 58.66 0.82 0.46 1.47 0.31 0.63
D × F 72.59 1.02 0.42 1.96 0.41 0.59
E × F 49.89 0.98 0.43 0.04 0.008 0.94
Table 4-12 Explanations for the factors in interaction.
Feed Solid Concentration A Collector Dosage B
Frother Dosage C Air Flow Rate D
Wash Water Rate E Feed Rate F
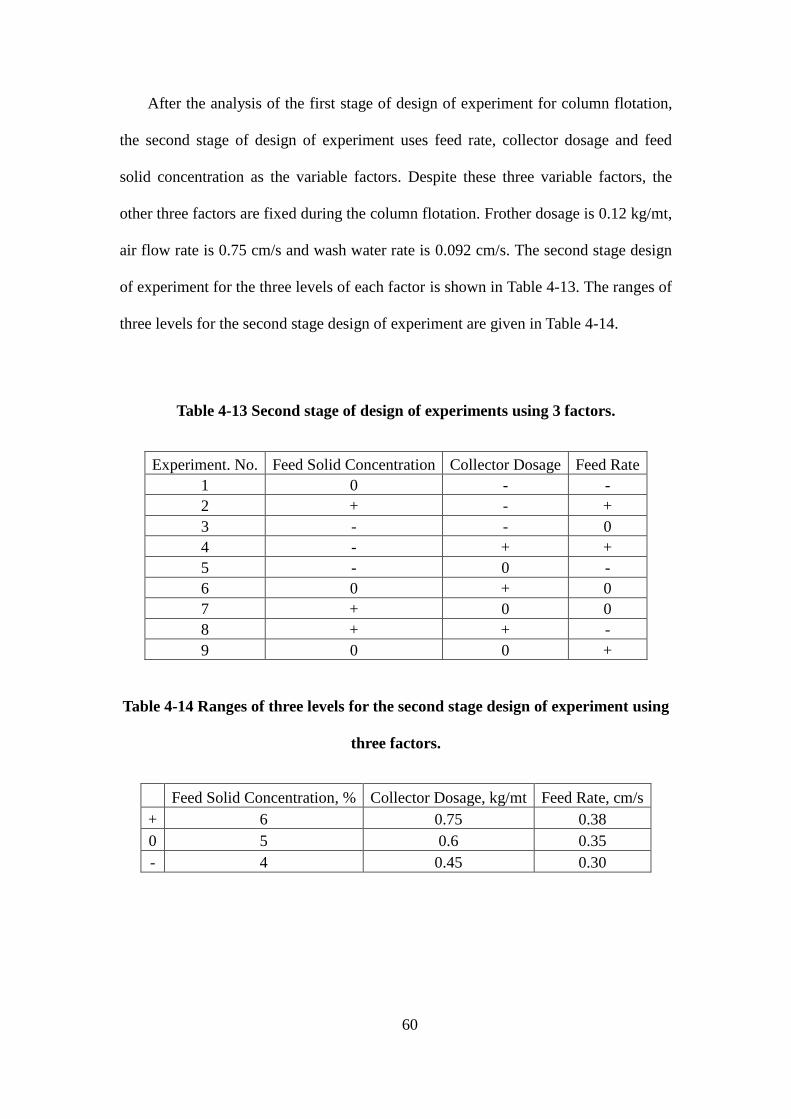
60
After the analysis of the first stage of design of experiment for column flotation,
the second stage of design of experiment uses feed rate, collector dosage and feed
solid concentration as the variable factors. Despite these three variable factors, the
other three factors are fixed during the column flotation. Frother dosage is 0.12 kg/mt,
air flow rate is 0.75 cm/s and wash water rate is 0.092 cm/s. The second stage design
of experiment for the three levels of each factor is shown in Table 4-13. The ranges of
three levels for the second stage design of experiment are given in Table 4-14.
Table 4-13 Second stage of design of experiments using 3 factors.
Experiment. No. Feed Solid Concentration Collector Dosage Feed Rate
1 0 - -
2 + - +
3 - - 0
4 - + +
5 - 0 -
6 0 + 0
7 + 0 0
8 + + -
9 0 0 +
Table 4-14 Ranges of three levels for the second stage design of experiment using
three factors.
Feed Solid Concentration, % Collector Dosage, kg/mt Feed Rate, cm/s
+ 6 0.75 0.38
0 5 0.6 0.35
- 4 0.45 0.30
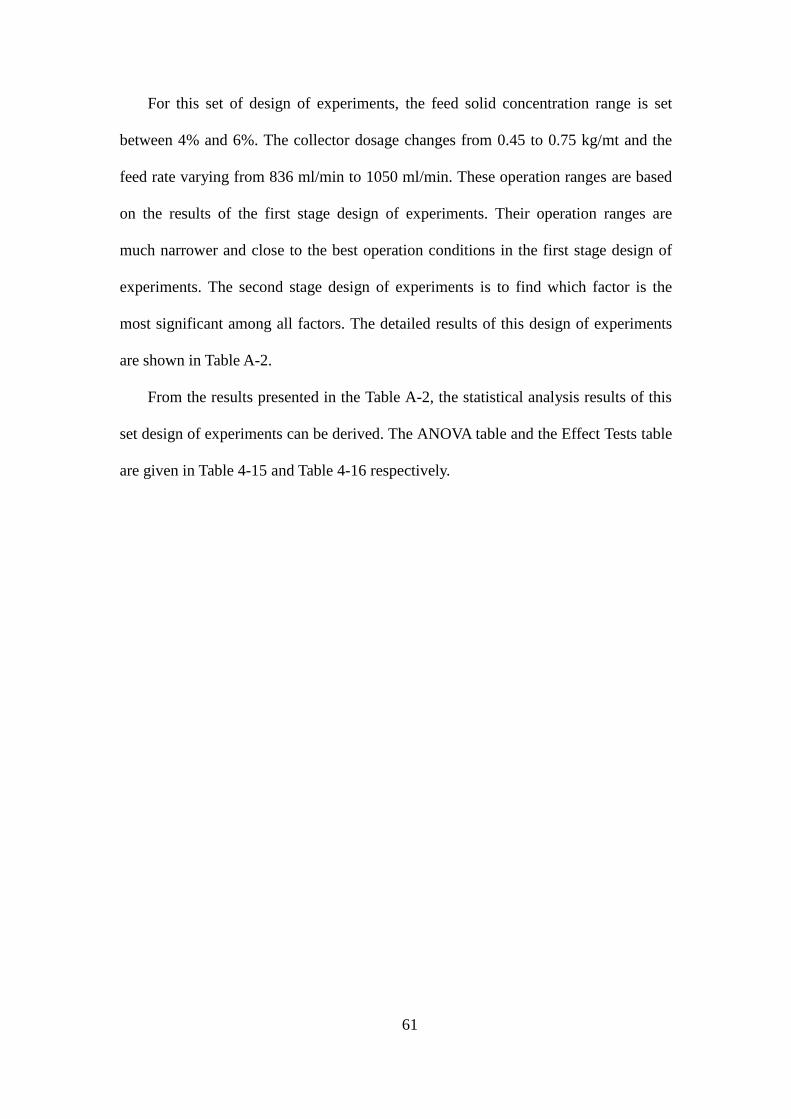
61
For this set of design of experiments, the feed solid concentration range is set
between 4% and 6%. The collector dosage changes from 0.45 to 0.75 kg/mt and the
feed rate varying from 836 ml/min to 1050 ml/min. These operation ranges are based
on the results of the first stage design of experiments. Their operation ranges are
much narrower and close to the best operation conditions in the first stage design of
experiments. The second stage design of experiments is to find which factor is the
most significant among all factors. The detailed results of this design of experiments
are shown in Table A-2.
From the results presented in the Table A-2, the statistical analysis results of this
set design of experiments can be derived. The ANOVA table and the Effect Tests table
are given in Table 4-15 and Table 4-16 respectively.

62
Table 4-15 Analysis of Variance table for the second stage of design of
experiment.
Combustible material recovery
Source DF Sum of Squares Mean Square F Ratio
Model 3 1481 493.6 3.5
Error 5 706 141.2 Prob>F
C. Total 8 2187
0.106
Ash Content
Source DF Sum of Squares Mean Square F Ratio
Model 3 5.35 1.78 1.22
Error 5 7.29 1.46 Prob>F
C. Total 8 12.64
0.39
Table 4-16 Effect Tests table of the second stage of design of experiment.
Combustible Material Recovery
Source Nparm DF Sum of Squares F Ratio Prob>F
Feed Solid Concentration 1 1 1235.5 8.75 0.0316
Collector Dosage 1 1 96.6 0.68 0.4457
Feed Rate 1 1 148.6 1.05 0.352
Ash Content
Source Nparm DF Sum of Squares F Ratio Prob>F
Feed Solid Concentration 1 1 0.67 0.47 0.53
Collector Dosage 1 1 3.97 2.78 0.16
Feed Rate 1 1 0.705 0.484 0.518
From Table 15 and 16, if only these three operating parameters are used, the
product ash of clean coal cannot be predicted precisely. This may be the effect of
other factors also needed to be considered to achieve a better prediction. However,
when these three factors themselves are compared, it is also meaningful to choose the
most significant one. The effect tests results show that the collector dosage has the
smallest P value of 0.16, which is much smaller than the P values of the other two
factors. This means the change in the range of collector dosage will cause the greatest

63
variance in the clean coal ash content. Thus the collector dosage should be most
strictly controlled in order to obtain the highest clean coal quality. The response
surface plots and contour plots to present the trend of combustible material recovery
and clean coal ash content with the change of these three operating parameters of
including feed solid concentration-collector dosage, feed rate-feed solid concentration,
and feed rate-collector dosage are given in Figure 4-10, Figure 4-11 and Figure 4-12,
respectively.
From the variation tendency of clean coal ash combined with these three factors,
in order to obtain the clean coal with better quality, the feed solid concentration
should be kept in lower level, while the feed rate stays in the middle level of its
operation range. As to the collector dosage, this series of experiments indicates using
more collectors because it is accompanied with lower product ash. However, from the
first set of column flotation experiments, if the collector dosage reaches 1 kg/mt, it
does not lead to the lowest clean coal ash. It means the 1 kg/mt of collector
concentration is overdose. The average of clean coal ash at collector dosage of 0.75
kg/mt is only 0.13% lower than the average clean coal ash when the collector
concentration is 0.6 kg/mt. This value is much lower than the difference of average
clean coal ash when the collector dosage is between 0.6 and 0.45 kg/mt. Thus it can
be inferred that the collector dosage at 0.75 kg/mt may have reached its effect limit in
improving the clean coal ash. Thus in order to obtain the optimum operation
conditions for this difficult-to-float subbituminous coal in the column flotation, the
most significant factor, collector dosage, is chosen as the variable in the third stage of
design experiments. The other two factors are fixed at the favorable level that can
produce best quality of clean coal.
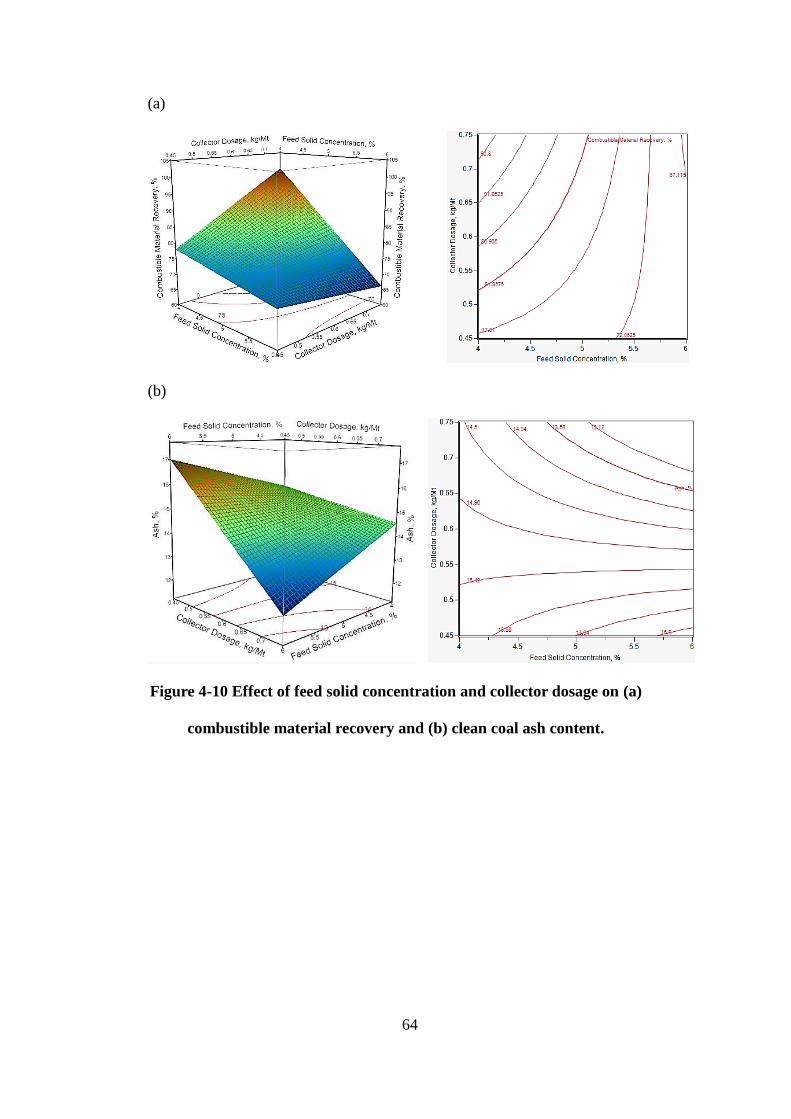
64
(a)
(b)
Figure 4-10 Effect of feed solid concentration and collector dosage on (a)
combustible material recovery and (b) clean coal ash content.
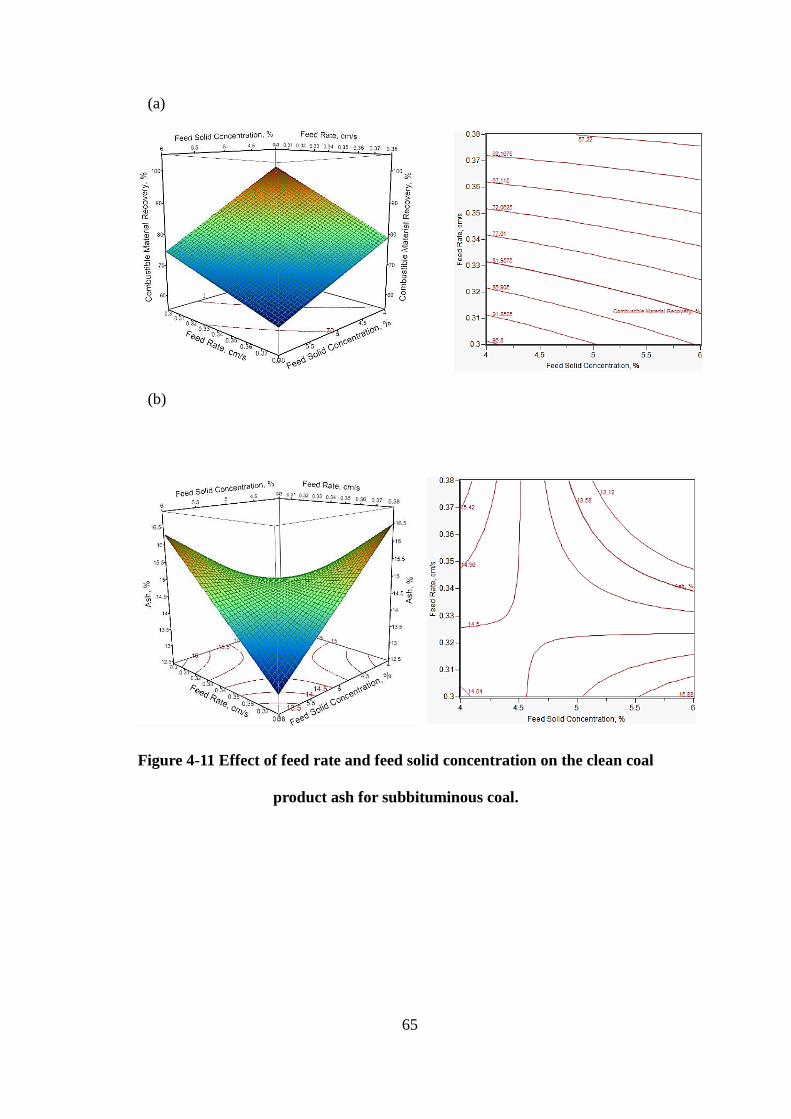
65
(a)
(b)
Figure 4-11 Effect of feed rate and feed solid concentration on the clean coal
product ash for subbituminous coal.
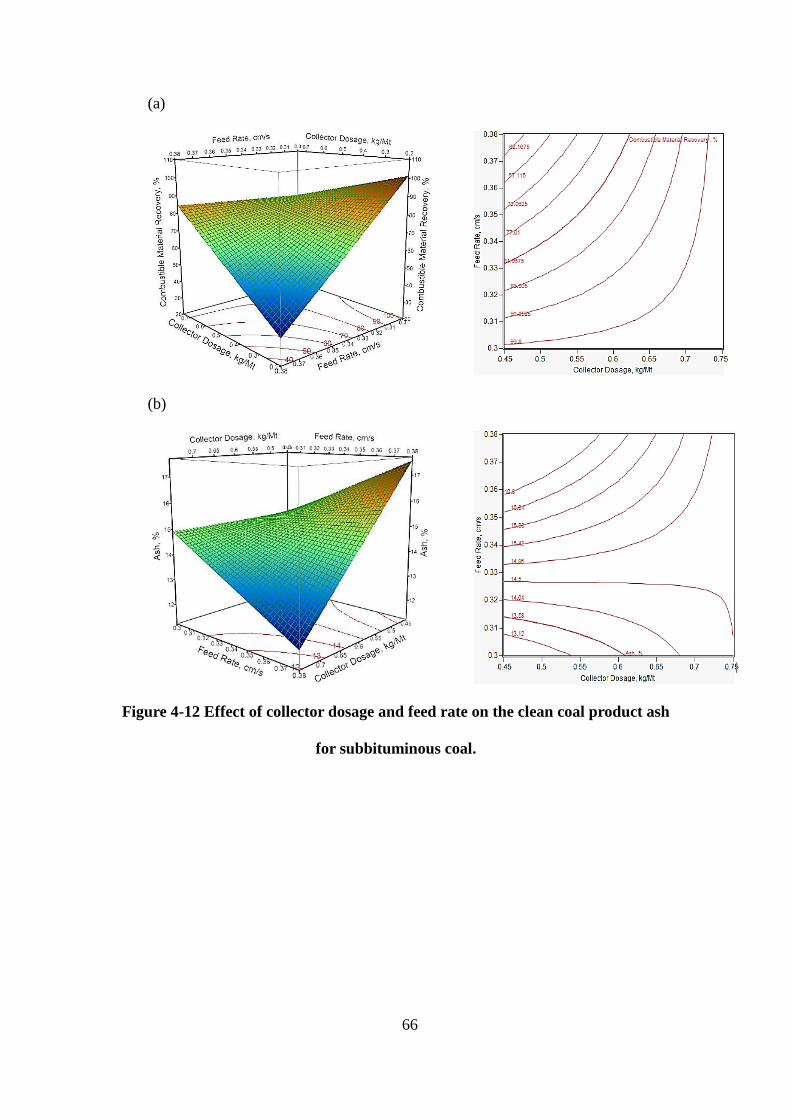
66
(a)
(b)
Figure 4-12 Effect of collector dosage and feed rate on the clean coal product ash
for subbituminous coal.
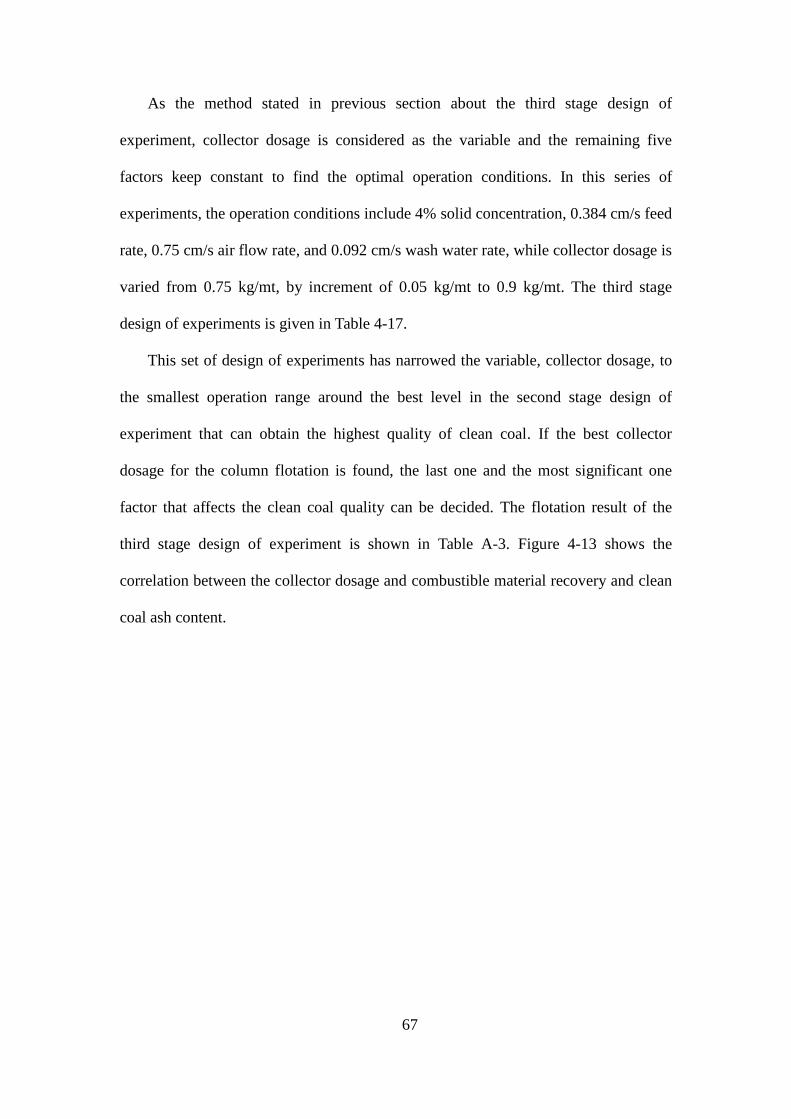
67
As the method stated in previous section about the third stage design of
experiment, collector dosage is considered as the variable and the remaining five
factors keep constant to find the optimal operation conditions. In this series of
experiments, the operation conditions include 4% solid concentration, 0.384 cm/s feed
rate, 0.75 cm/s air flow rate, and 0.092 cm/s wash water rate, while collector dosage is
varied from 0.75 kg/mt, by increment of 0.05 kg/mt to 0.9 kg/mt. The third stage
design of experiments is given in Table 4-17.
This set of design of experiments has narrowed the variable, collector dosage, to
the smallest operation range around the best level in the second stage design of
experiment that can obtain the highest quality of clean coal. If the best collector
dosage for the column flotation is found, the last one and the most significant one
factor that affects the clean coal quality can be decided. The flotation result of the
third stage design of experiment is shown in Table A-3. Figure 4-13 shows the
correlation between the collector dosage and combustible material recovery and clean
coal ash content.
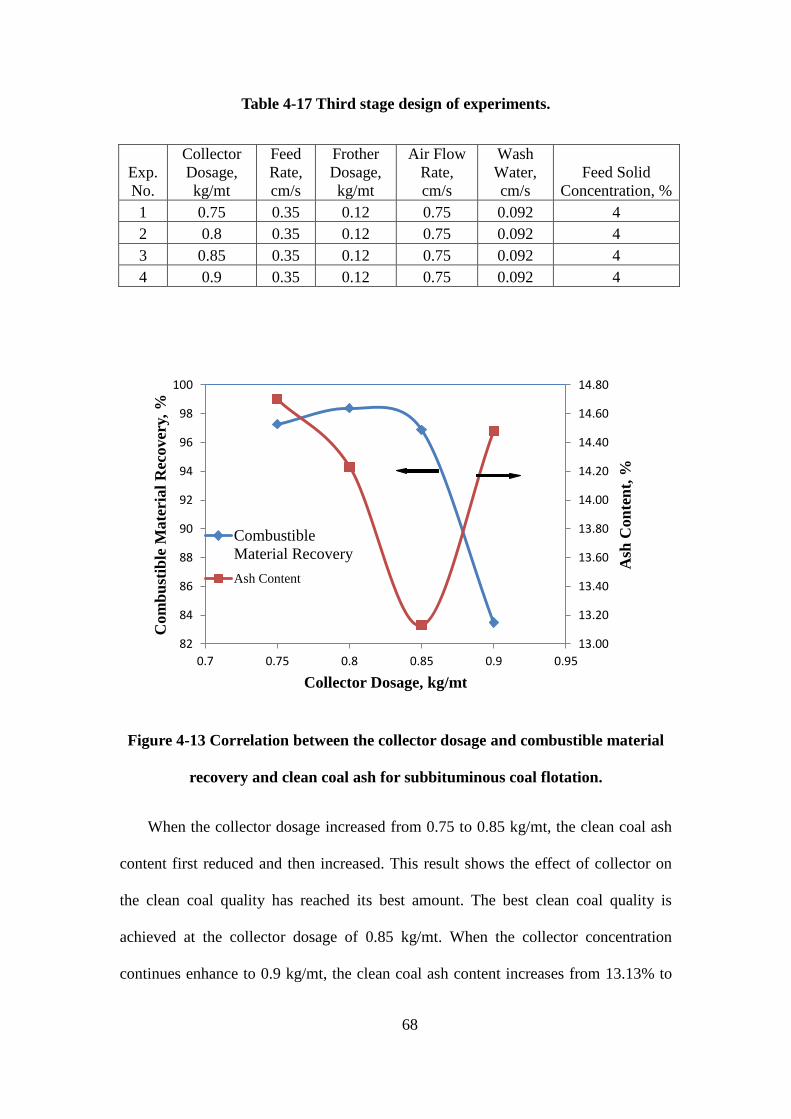
68
Table 4-17 Third stage design of experiments.
Exp.
No.
Collector
Dosage,
kg/mt
Feed
Rate,
cm/s
Frother
Dosage,
kg/mt
Air Flow
Rate,
cm/s
Wash
Water,
cm/s
Feed Solid
Concentration, %
1 0.75 0.35 0.12 0.75 0.092 4
2 0.8 0.35 0.12 0.75 0.092 4
3 0.85 0.35 0.12 0.75 0.092 4
4 0.9 0.35 0.12 0.75 0.092 4
Figure 4-13 Correlation between the collector dosage and combustible material
recovery and clean coal ash for subbituminous coal flotation.
When the collector dosage increased from 0.75 to 0.85 kg/mt, the clean coal ash
content first reduced and then increased. This result shows the effect of collector on
the clean coal quality has reached its best amount. The best clean coal quality is
achieved at the collector dosage of 0.85 kg/mt. When the collector concentration
continues enhance to 0.9 kg/mt, the clean coal ash content increases from 13.13% to
13.00
13.20
13.40
13.60
13.80
14.00
14.20
14.40
14.60
14.80
82
84
86
88
90
92
94
96
98
100
0.7 0.75 0.8 0.85 0.9 0.95
Ash
Con
ten
t, %
Com
bu
stib
le M
ate
rial
Rec
over
y,
%
Collector Dosage, kg/mt
Combustible
Material Recovery
Ash Content

69
14.48%. This result is consistent with the previous studies that the overuse of
collector will reduce the selectivity of coal flotation. The excess amount of collector
can absorb on the mineral particles that become hydrophobic to float instead of sink.
For these reasons, the collector dosage should be controlled more strictly to get the
best quality of clean coal such as ash content.
As to the combustible material recovery, when the collector dosage increased
from 0.75 kg/mt to 0.85 kg/mt, the combustible material reduces from 97.27% to
96.87%. This result proves that most of the coal particles in the feed coal can be
recovered. Though the combustible material is reduced with the increased collector
dosage, this result is acceptable accompanied with the clean coal quality.
When the flotation performances of these three stages design of experiment are
compared with the flotation results of the release analysis of feed coal, their relations
expressed as combustible material recovery as a function of clean coal ash content are
given in Figure 4-14. From this figure, most of the data points of the design of
experiments fall into thearea below the release analysis line. Compared to the data
points of the first stage, data points of the second stage are in a more compact area in
the left part area of first stage. The data points of the third stage are mostly in a small
area above the release analysis line, this means the column flotation experiments
achieved the result that are better than the ideal results of stirred tank cell flotation on
subbituminous coal. This proves that the pico and nano bubble used in the column
flotation is more effective in the flotation of the difficult-to-float coal.

70
Figure 4-14 Flotation results of release experiments and the three stage of design
of experiments.
Some of the coal particles might be misplaced to the tailings stream. In the other
aspect, ultrafine mineral particles particularly clay mineral particles can be floated to
the froth layer by the effect of entrapment or even be brought to the froth layer by the
upward water stream. In flotation column, wash water system is installed for washing
off the entrained mineral particles to minimize the clean coal ash content.
Compared with the semi-batch cell flotation results, the separation efficiency of
0
10
20
30
40
50
60
70
80
90
100
10 15 20
Com
bu
stib
le M
ate
rial
Rec
over
y,
%
Clean Coal Ash, %
Stage 1 DOE
Stage 2 DOE
Stage 3 DOE
Release Analysis

71
column flotation is much higher than the stirred tank cell flotation both in combustible
material recover and clean coal quality. In the stirred tank cell flotation, the clean coal
obtained is always with more than 15% of ash content when MIBC or TTT frother
was used as frother. That ash content is higher than the ash content of clean coal
produced by column flotation. It shows the column flotation is more favorable in
floating low rank coal. The combustible material recovery achieved from column
flotation is generally higher than it is obtained from the stirred tank cell flotation.
Therefore considering both clean coal recovery and clean coal quality, the column
flotation using pico and nano bubbles is superior to the semi-batch flotation.
Additionally, the chemical reagent dosages used in the column flotation is much
lower than the semi-batch cell flotation. The TTT frother dosage for the best column
flotation condition is 0.12 kg/mt, this is half amount of frother dosage used in the
semi-batch cell flotation, at highest combustible material recovery and lowest clean
coal ash content. The collector dosage used for the column flotation is 0.85 kg/mt. It
is also less than a half of the amount of collector dosage used during semi-batch cell
flotation with the best flotation performance at 1.5 kg/mt. It clearly shows that the
column flotation can use the flotation reagents much more efficiently and
economically.
In comparing the column flotation results with the release analysis test results,
which is regarded as the ideal separation of stirred tank cell flotation, the column
flotation result can produce clean coal higher combustible material recovery with
clean coal ash content around 13%. The recovery-grade curve of the release analysis
reflects that if ash content of clean coal lower than 13.6% is required, the combustible
material recovery will not exceed 89%. However, the column flotation result shows
72
the best clean coal ash of 13.13% with the combustible material recovery of 96.87%.
In this case, the column flotation performance has broken through the so called “ideal
separation”. This result must be caused by the effect of pico and nano bubbles used in
the column flotation. One significant effect of the pico and nano bubble is its huge
quantity existing in the column cell. The size of the air bubbles generated by the
venturi cavitation tube is much smaller than the size of air bubble generated by the
conventional sparger (Fan et al., 2010), including microbubble generator-static mixer.
Under the same amount of air injection rate, the smaller size of single air bubbles
means larger quantity of air bubble produced. When the venturi cavitation tube bubble
generation system is applied, the pico and nano bubbles can occupy almost every
corner of the flotation column cell and maintain its tiny size for a long time. This
means the probability of collision and attachment between the coal particles and the
air bubbles becomes much higher. When dealing with difficult-to-float coal, the
advantages of pico and nano bubbles becomes more obviously. Because the
subbituminous coal has naturally oxidized surface, it is hard for the attachment of the
oxidized coal particle on the air bubbles (Jena et al., 2008). The using of the pico and
nano bubbles in the column flotation increases the probability of collision between
coal particles and the air bubbles, and also reduces the probability of their detachment.
The pico and nano bubbles can be adsorbed on the hydrophobic part of the coal
surface readily because of the attraction between hydrophobic coal and hydrophobic
bubble surfaces, and small size of air bubbles.
73
4.5 Effect of Ultrafine Mineral Particles on Flotation
As for the best clean coal obtained from the third stage design of experiment, the
ash content is 13.31%. From the wet sieving result, it shows the ash content of the
ultrafine particles (minus 45 μm) of the clean coal product is 18.32%. The high ash
content of the ultrafine particles shows it contains many mineral particles in it. In
addition, the clay particles present floatability and have very small size, which is a
main component of the ultrafine particles of coal sample. In this case, if we cut off the
ultrafine particles under 45 μm from the clean coal product is removed, its ash content
can reach 10.4% and total combustible material recovery reduces to 65.3%. This
shows the clean coal quality can be improved further after removable of the ultrafine
particles from clean coal product.
In this experiment, the ultrafine particles (minus 45 μm) were deslimed from the
feed coal before column flotation. The feed coal ash content reduced to 20.6%. This
can test whether the flotation performance result can be improved after desliming the
feed coal. The operation parameters and experiment results are shown in Table 4-18.
The column flotation results show the clean coal ash reduces to 9.1% with the
combustible material recovery of 81.15%, when desliming the feed coal before
column flotation. The negative effect of clay particles is reduced on the flotation of
subbituminous coal. Therefore, it provides another way to improve the clean coal
quality, while the feed coal has high content of ultrafines with high content of clay
minerals.

74
Table 4-18 Column Flotation Test on Feed Coal after Desliming minus 45 μm
particles.
Kerosene,
kg/mt
TTT Frother,
kg/mt
Feed Solid
Concentration, %
Clean Coal
Ash, %
Tailings
Ash, %
CMR
, %
0.85 0.12 4% 9.1 48.6 81.15
Air Flow
Rate, cm/s
Feed Rate,
cm/s
Wash Water,
cm/s
Clean Coal
Yield, %
Tailings
Yield, %
0.75 0.35 0.092 70.89 29.11

75
CHAPTER 5
CONCLUSIONS
From the series of experiments results, based on the column flotation of
hard-to-float coal, using pico and nano bubbles, the following conclusions can be
drawn.
1. In the semi-batch cell flotation, three chemical reagents, kerosene-MIBC, and
kerosene-trimethyl pentanediol derivatives frother (TTT frother), were used
separately, to evaluate initial reagents requirements and the effects on flotation of
subbituminous coal. The use of combination of kerosene and TTT frother gives
higher combustible material recovery and lower clean coal ash content than using
the combination of kerosene and MIBC.
2. Flotation rate in a 2 liter stirred tank cell flotation experiments show the
subbituminous coal is difficult to float compared with the Pittsburgh #8 coal
(high volatile bituminous coal). This is because of the naturally oxidized property
of subbituminous coal. The TTT frother can improve the combustible material
recovery of subbituminous coal in comparing with the conventional frother of
MIBC.
3. The release analysis experiment and stirred tank cell flotation shows the
floatability of low rank of coal, subbituminous coal. The best clean coal obtained
from the release analysis experiment has combustible material recovery of 84.1 %
and ash content of 11.44%. This result proves the use of kerosene and TTT
frother can achieve good selective floatation of the lower rank coal.
4. From the first stage statistical design of experiment, the feed solid concentration,
76
collector dosage and feed rate are the three comparably significant factors that
affect the clean coal ash content. The purpose is to achieve the highest quality of
clean coal in accompany with combustible material recovery as high as possible.
The ranges of feed solid concentration, frother dosage, and feed rate have been
narrowed as the variable factors in the second stage design of experiment to
pursue the lower clean coal ash content. The other three factors are set at the
level that can obtain highest combustible material recovery.
5. From the second stage statistical design of experiments, the collector dosage is
proved to be the most significant factor that influences the clean coal quality.
Thus the collector dosage should be controlled most strictly to achieve the
highest quality of clean coal product. The insufficient use of collector does not
lead to the best selective flotation of the feed coal. While the overdose of the
collector can cause the mineral surface become hydrophobic.
6. The third stage statistical design of experiment shows the best collector dosage
required in the column flotation is 0.85 kg/mt. Therefore in these series of design
of experiment, the optimum operation conditions for the difficult-to-float
subbituminous coal are determined are, 0.85 kg/mt kerosene, 0.12 kg/mt TTT
frother, 4% feed solid concentration, 0.75 cm/s air flow rate, 0.35 cm/s feed rate,
and 0.092 kg/mt wash water rate. In these conditions, the clean coal product can
achieve the combustible material recovery of 96.87% and ash content of 13.13%.
These results show a very good selective flotation of subbituminous coal.
7. The high separation performance of subbituminous coal using column flotation
not only attributed to the use of TTT frother, but also the pico and nano bubbles.
The application of the pico and nano bubbles greatly enhances the probabilities

77
of collision and attachment, and lowers the probability of detachment between
the air bubbles and the coal particles, that enhances its recovery.
8. When the ultrafine coal smaller than 45 μm is deslimed from clean coal, the ash
content reduces to 10.4% and the total combustible material recovery lowered to
65.3%. When the ultrafine coal is deslimed from the feed coal before column
flotation, the clean coal product can have combustible material recovery of 81.15%
and ash content of 9.1%.
78
RECOMMENDATIONS
According to the results conducted, further study in the following parts is
recommended:
1. The TTT frother has been proved to be a good frother for the flotation of
lower rank coal. Some other types of frothers that have been produced for the
oxidized coal flotation should be tested. In addition, the compositions of
frother should also be studied for their co-effect on the flotation of
difficult-to-float coal.
2. The detailed study on the effect of the blend of TTT components on the
surface tension reduction, or the interaction between the TTT frother and the
coal particles should be studied. Since the increased dosage of TTT frother
can not only increase the combustible material recovery, but also reduce the
clean coal ash content. This enhanced selectivity might come from the frother.
3. The column flotation on the coarse particles of the subbituminous coal
should be studied further to increase the feed coal size range of the flotation.
The method that may achieve this purpose includes using a better collector or
frother for the flotation difficult-to-float coal. Use some promoter or activator
to instigate the adsorption of collectors on the coal particles that improves the
hydrophobicity of the coal surfaces thus obtained recovery.
79
REFERENCES
Ahmed, H. A. M., and Drzymala, J., 2012, “Upgrading difficult-to-float coal
using microemulsion”, Minerals& Metallurgical Processing, Vol. 29, pp. 88-96
Atesok, G., Celik, and M. S., 2000, “A new flotation scheme for a
difficult-to-float coal using pitch additive in drying grinding”, Fuel, Vol. 79, pp.
1509-1513
Atesok, G., Boylu, F., and Celik, M. S., 2001, “Carrier flotation for
desulfurization and deashing of difficulty-to-float coals”, Minerals Engineering, Vol.
14, pp. 661-670
Atesok, G., and Celik, M. S., 2000, “A new flotation scheme for a
difficult-to-float coal using pitch additive in dry grinding”, Fuel, Vol. 79, pp.
1509-1513
Arun, B. M., Ron, Z., Prosun, B., Kenneth, S. S., and Ryunosuk, K., 2008,
“Mercury flow via coal and coal utilization by-products: A global perspective,
Resources”, Conservation and Recycling, Vol. 52, pp. 571-591
Banford, A. W., and Aktas, Z., 2004, “The effect of reagent addition strategy on
the performance of coal flotation”, Minerals Engineering, Vol. 17, pp. 745-760
Bolat, E., Saglam, S., and Piskin, S., 1998, “The effect of oxidation on the
flotation properties of a Turkish bituminous coal”, Fuel Processing Technology, Vol.
55, pp. 101-105
Chen, W. S., Liu, J. T., Li, X. B., Cao, Y. J., and Wang, Y. T., 2008, “Analysis of
factors influencing fluorite flotation by cyclonic static micro-bubble flotation column”,
Metal Mine, Vol. 5, pp. 101-102
Cowburn, J., Harbort, G., Manlapig, E., and Pokrajcic, Z., 2006, “Improving the
Revovery of Coarse Coal Particles in a Jameson Cell”, Minerals Engineering, Vol. 19,
pp. 609-618
Dey, S., 2012, “Enhancement in hydrophobicity of low rank coal by surfactants-
A critical overview”, Fuel Processing Technology, Vol. 94, pp. 151-158
Dube, R. M., 2012, “Collectors for Enabling Flotation of Oxidized Coal”,
Master’s Thesis, University of Kentucky, Lexington, KY
Fan, M. M., Tao, D., Rick, H., and Luo, Z. F., 2010, “Nanobubble generation and
its application in froth flotation (partI): nanobubble generation and its effects on
properties of microbubble and millimeter scale bubble solutions”, Mining Science and
Technology, Vol. 20, pp. 1-19
Fan, M. M., Tao, D., Rick, H., and Luo, Z. F., 2010, “Nanobubble generation and
80
its application in froth flotation (partII): fundamental study and theoretical analysis”,
Mining Science and Technology, Vol. 20, pp: 159-177
Fan, M. M., Tao, D., Rick, H., and Luo, Z. F., 2010, “Nanobubble generation and
its application in froth flotation (part III): specially designed laboratory scale column
flotation of phosphate”, Mining Science and Technology, Vol. 20, pp. 317-338
Fan, M. M., Tao, D., Rick, H., and Luo, Z. F., 2010, “Nanobubble generation and
its application in froth flotation (part IV): mechanical cells and specially designed
column flotation of coal”, Mining Science and Technology, Vol. 20, pp: 641-671
Finch, J. A., 1995, “Column flotation: A selected review-part IV: Novel flotation
devices”, Minerals Engineering, Vol. 8, pp. 587-602
Fuerstenau, D. W. et al., 1990, “Coal Surface Control for Advanced Fine Coal
Flotation”, Quarterly Report, Utah University, Salt Lake City, UT
Gupta, A. K., Banerjee, P. K., Mishra, A., Satish, P., and Pradip, 2007, “Effect of
alcohol and polyglycol ether frothers on foam stability, bubble size and coal flotation”,
International Journal of Mineral Process, Vol. 82, pp. 126-137
Hart, G., Morgan, S., Bramall, N., and Nicol, S. K., 2002, “Enhanced coal
flotation using picobubbles”, Final Report, Australian Coal Association Research
Program
Jena, M. S., Biswal, S. K., and Rudramuniyappa, M. V., 2008, “Study on flotation
characteristics of oxidized Indian high ash subbituminous coal”, International Journal
of Mineral Processing, Vol. 87, pp. 42-50
Jia, R., Guy, H. H., and Douglas, W. G., 2000, “An improved class of universal
collectors for the flotation of oxidized and/or low-rank coal”, International Journal of
Miner. Process, Vol. 58, pp. 99-118
Kappele, W. D., 1998, “Using I-Optimal Designs for Narrower Confidence
Limits”, IASI conference
Khoshdast, H., and Sam, A., 2011, “Flotation Frothers: Review of Their
Classifications, Properties and Preparation”, The Open Mineral Processing Journal,
Vol. 4, pp. 25-44
Koh P. T. L., and Schwarz, M. P., 2007, “CFD model of a self-aerating flotation
cell”, International Journal of Mineral Processing, Vol. 85, pp. 16-24
Lahey, A. E., Clarkson, C. J., and Brake, I., 1998, “MicrocelTM
Flotation Column
Modelling”, Coal Preparation, Vol. 19, pp. 83-113
Li, B., Tao, D., Ou, Z., and Liu, J., 2003, “Cyclo-microbubble column flotation of
fine coal”, Separation Science and Technology, Vol. 38, pp. 1125-1140

81
Liu, C. C., Xie, G. Y., and Wu, L., 2006, “The application of FCMC type cyclonic
microbubble flotation column in small or middle coal preparation”, Coal Engineering,
Vol. 3, pp. 54-56
Liu, J. T., 2006, “Preparation of ultra clean coal using cyclonic-static microbubble
flotation column”, China Association for Science and Technology, Vol. 2, pp. 60-67
Lynch, A. J., Watt, J. S., Finch J. A., and Harbort, G. E., 2007, “Hystory of
Flotation Technology”, Froth Flotation: A Cenruty of Innovation, pp. 65-132
Marek P., and Janusz, S. L., 2003, “Coal Reverse Flotation. Part I. Adsorption of
Dodecyltrimethyl Ammonium Bromide and Humic Acid onto Coal and Silica”, Coal
Preparation, Vol. 23, pp. 91-112
Marek P., and Janusz, S. L., 2003, “Coal Reverse Flotation. Part 2. Batch
Flotation Tests”, Coal Preparation, Vol. 23, pp 113-127
Mitchell, G., Polat, H, Davis, A, and Chander, S., 1995, “Surface properties of
photo-oxidized bituminous coals”, Technical Progress Report, July-September,
Pennsylvania State University, PA
Murat, E., Cigdem, C., and Zeki, A., 2003, “The effect of reagents and reagent
mixtures on froth flotation of coal fines”, Int, J. Miner. Process, Vol. 71, pp. 131-145
Naik, P. K., Reddy, S. R., and Misra, V. N., 2005, “Interpretation of interaction
effects and optimization of reagent dosages for fine coal flotation”, International
Journal of miner. Process, Vol. 75, pp. 83-90
Polat, M., and Chander, S., 2000, “First-order Flotation Kinetics Models and
Methods for Estimation of the True Distribution of Flotation Rate Constants”,
International Journal of Mineral Processing, Vol 58, pp. 145-166
Polat, M., Polat, H., and Chander, S., 2003, “Physical and chemical interactions
in coal flotation”, International Journal of Mineral Processing, Vol. 72, pp. 199-213
Randolph, J. M., 1997, “Characterizing flotation response: a theoretical and
experimental comparison of techniques”, Master Thesis, Virginia Polytechnic Institute
and State University, VA
Safak, G. O., and Halit, Z. K., 2006, “Investigation of mechanism of ultrasound
on coal flotation”, Int. J. Miner. Process. Vol. 81, pp. 201-203
Safak, and G. O., 2012, “Effects of simultaneous ultrasonic treatment on flotation
of hard coal slimes”, Fuel, Vol. 93, pp. 576-580
Sarikaya, M., and Ozbayoglu, G., 1995, “Flotation characteristics of oxidized
82
coal”, Minerals Engineering, Vol. 14, pp. 231-234
Sis, H., Ozbayoglu, G., and Sarikaya, M., 2003, “Comparison of Non-ionic and
Ionic Collectors in the Flotation of Coal Fines”, Minerals Engineering, Vol. 16, pp.
399-401
Somasundaran, P., Roberts, C. E., and Ramesh, R., 1991, “Effects of oxidizing
methods on the flotation of coal”, Minerals Engineering, Vol. 4, pp. 43-48
Tao, D, 2005, “Role of Bubble Size in Flotation of Coarse and fine Particles-A
Review”, Separation Science and Technology, Vol. 39, pp. 741-760
Tao, D., Li, B., Johnson, B., and Parekh, B. K., 2002, “A flotation study of refuse
pond coal slurry”, Fuel Processing Technology, Vol. 76, pp. 201-210
Tao, X. X., Cao, Y. J., Liu, J., Shi, K. Y., Liu, J. Y., and Fan, M. M, 2009, “Studies
on characteristics and flotation of a hard-to-float high-ash fine coal”, Procedia Earth
and Planetary Science, Vol. 1, pp. 799-806
Tao, Y. J., Liu, J. T., Yu, S., and Tao, D., 2007, “Picobubble enhanced fine coal
flotation”, Separation Science and Technology, Vol. 41, pp: 3597-3607
Vamvuka, D., and Agridiotis, V., 2001, “The effect of chemical reagents on lignite
flotation”, Int. J. Miner. Process, Vol. 61, pp. 209-224
Wang, H., Dlugogorski, B. Z., and Kennedy, E. M., 2003, “Analysis of the
mechanism of the low-temperature oxidation of coal”, Combustion and Flame, Vol.
134, pp. 107-117
Wang, H., Dlugogorski, B. Z., and Kennedy, E. M., 1999, “Theoretical analysis of
reaction regimes in low-temperature oxidation of coal”, Fuel, Vol. 8, pp. 1073-1081
Wang, H, Dlugogorski, B. Z., and Kennedy, E. M., 2003, “Coal oxidation at low
temperatures: oxygen consumption, oxidation products, reaction mechanism and
kinetic modeling”, Progress in Energy and Combustion Science, Vol. 29, pp. 487-513
Xia, W. C., Yang, J. G., and Zhu, B., 2012, “Flotation of oxidized coal dry-ground
with collector”, Powder Technology, Vol. 228, pp. 324-326
Xia, W. C., Yang, J. G., and L, C., 2013, “A short review of improvement in
flotation of low rank/oxidized coals by pretreatments”, Powder Technology, Vol. 237,
pp. 1-8
Xie, G. Y., Wu, L, Ou., Z. S., and Yu., H. S., 2009, “Research on fine coal
classified flotation process and key technology”, Procedia Earth and Planetary
Science, Vol. 1, pp. 701-705
Xia, Y. K., and Li, J. G., 2007, “Fine coal circuitry considerations in treatment of
83
soft coal with difficult washabilities”, Fuel Processing Technology, Vol. 88, pp.
759-769
Xu, Z. H., Liu, J. J., Choung, J. W., and Zhou, Z. A., 2003, “Electrokinetic study
of clay interactions with coal in flotation”, International Journal of Mineral
Processing, Vol. 68, pp. 183-196
Yang, T., Huo X. L., and Yu, H. S., 2008, “The Analysis of Factors Affecting
Cyclonicmicro-bubble Column Flotation”, Clean Coal Technology, Vol. 14, pp. 12-14
Zhang, H. J., Liu, J. T., and Wang, Y. T., 2006, “Separating Principle and
Parameter Controlling for Cyclonic-Static Microbubble Flotation Column”, China
Mining Magazine, Vol. 15, pp. 70-72
Zhou, X. H., Liu, J. T., Wang, Y. T., Zhang, M. Q., and Zhang, M., 2011,
“Experimental Study on Beneficiation of Fluorite Ore by Cyclonic-static
Micro-bubble Flotation Column”, Metal Mine, Vol. 26, pp. 48-49
Zhou, X. H., Song, X. J., Liu, J. T., Cao, Y. J., Zhang, M. Q., and Zhang, M.,
2005, “Experimental study on fluorite mine by cyclonic-static micro-bubble flotation
column”, Mining and Metallurgy, Vol. 14, pp. 21-24
Zhou, Z. A., Xu, Z. H., Finch, J. A., Hu. H., and Rao, S. R., 1997, “Role of
hydrodynamic cavitation in fine particle flotation”, International Journal of Mineral
Processing, Vol. 51, pp. 139-149

84
APPENDICES
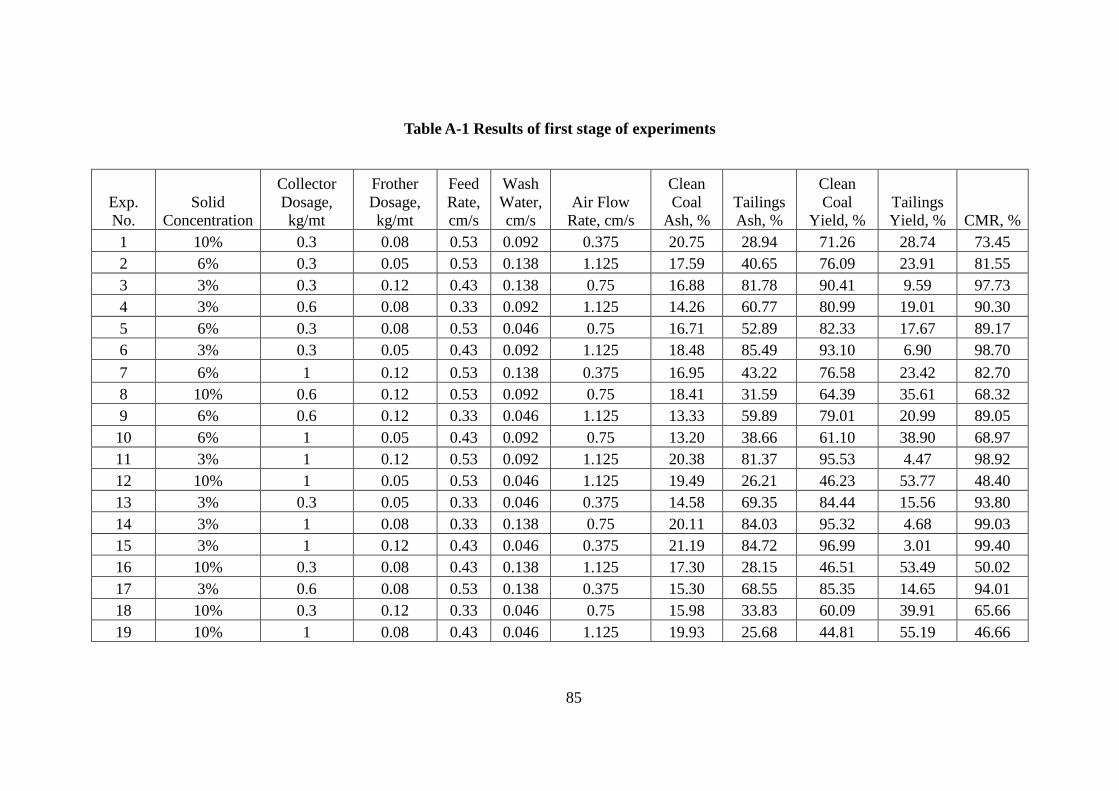
85
Table A-1 Results of first stage of experiments
Exp.
No.
Solid
Concentration
Collector
Dosage,
kg/mt
Frother
Dosage,
kg/mt
Feed
Rate,
cm/s
Wash
Water,
cm/s
Air Flow
Rate, cm/s
Clean
Coal
Ash, %
Tailings
Ash, %
Clean
Coal
Yield, %
Tailings
Yield, % CMR, %
1 10% 0.3 0.08 0.53 0.092 0.375 20.75 28.94 71.26 28.74 73.45
2 6% 0.3 0.05 0.53 0.138 1.125 17.59 40.65 76.09 23.91 81.55
3 3% 0.3 0.12 0.43 0.138 0.75 16.88 81.78 90.41 9.59 97.73
4 3% 0.6 0.08 0.33 0.092 1.125 14.26 60.77 80.99 19.01 90.30
5 6% 0.3 0.08 0.53 0.046 0.75 16.71 52.89 82.33 17.67 89.17
6 3% 0.3 0.05 0.43 0.092 1.125 18.48 85.49 93.10 6.90 98.70
7 6% 1 0.12 0.53 0.138 0.375 16.95 43.22 76.58 23.42 82.70
8 10% 0.6 0.12 0.53 0.092 0.75 18.41 31.59 64.39 35.61 68.32
9 6% 0.6 0.12 0.33 0.046 1.125 13.33 59.89 79.01 20.99 89.05
10 6% 1 0.05 0.43 0.092 0.75 13.20 38.66 61.10 38.90 68.97
11 3% 1 0.12 0.53 0.092 1.125 20.38 81.37 95.53 4.47 98.92
12 10% 1 0.05 0.53 0.046 1.125 19.49 26.21 46.23 53.77 48.40
13 3% 0.3 0.05 0.33 0.046 0.375 14.58 69.35 84.44 15.56 93.80
14 3% 1 0.08 0.33 0.138 0.75 20.11 84.03 95.32 4.68 99.03
15 3% 1 0.12 0.43 0.046 0.375 21.19 84.72 96.99 3.01 99.40
16 10% 0.3 0.08 0.43 0.138 1.125 17.30 28.15 46.51 53.49 50.02
17 3% 0.6 0.08 0.53 0.138 0.375 15.30 68.55 85.35 14.65 94.01
18 10% 0.3 0.12 0.33 0.046 0.75 15.98 33.83 60.09 39.91 65.66
19 10% 1 0.08 0.43 0.046 1.125 19.93 25.68 44.81 55.19 46.66
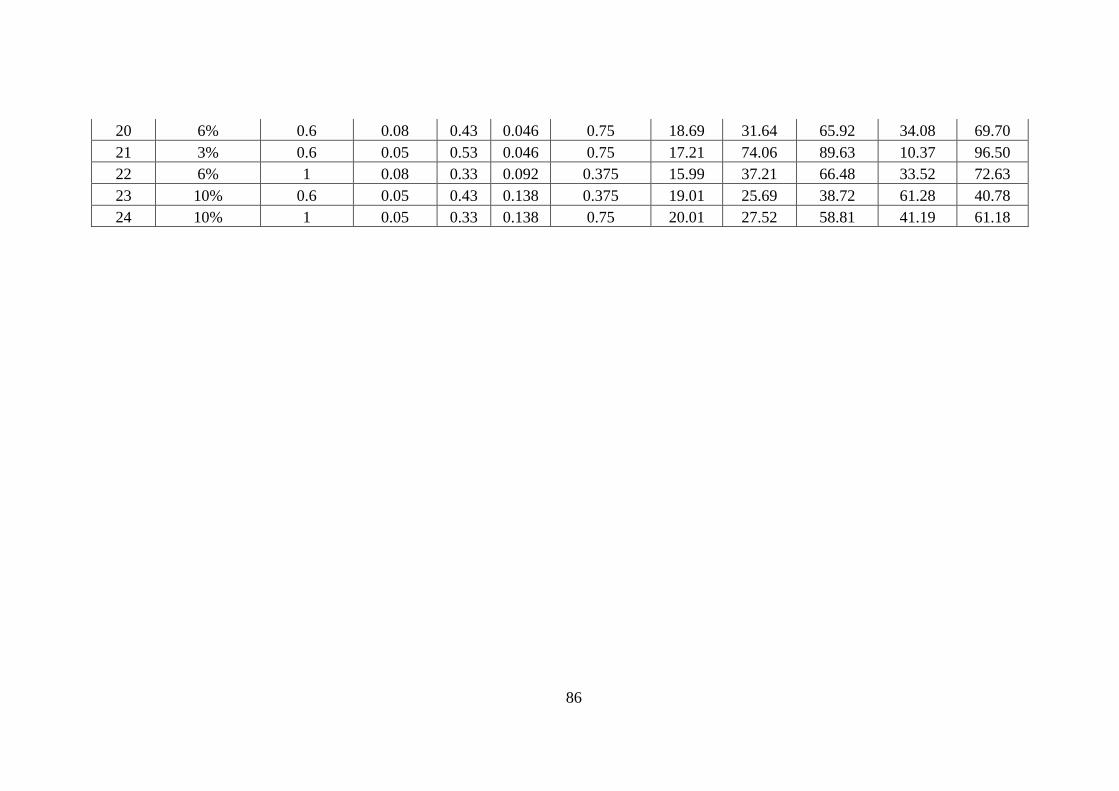
86
20 6% 0.6 0.08 0.43 0.046 0.75 18.69 31.64 65.92 34.08 69.70
21 3% 0.6 0.05 0.53 0.046 0.75 17.21 74.06 89.63 10.37 96.50
22 6% 1 0.08 0.33 0.092 0.375 15.99 37.21 66.48 33.52 72.63
23 10% 0.6 0.05 0.43 0.138 0.375 19.01 25.69 38.72 61.28 40.78
24 10% 1 0.05 0.33 0.138 0.75 20.01 27.52 58.81 41.19 61.18
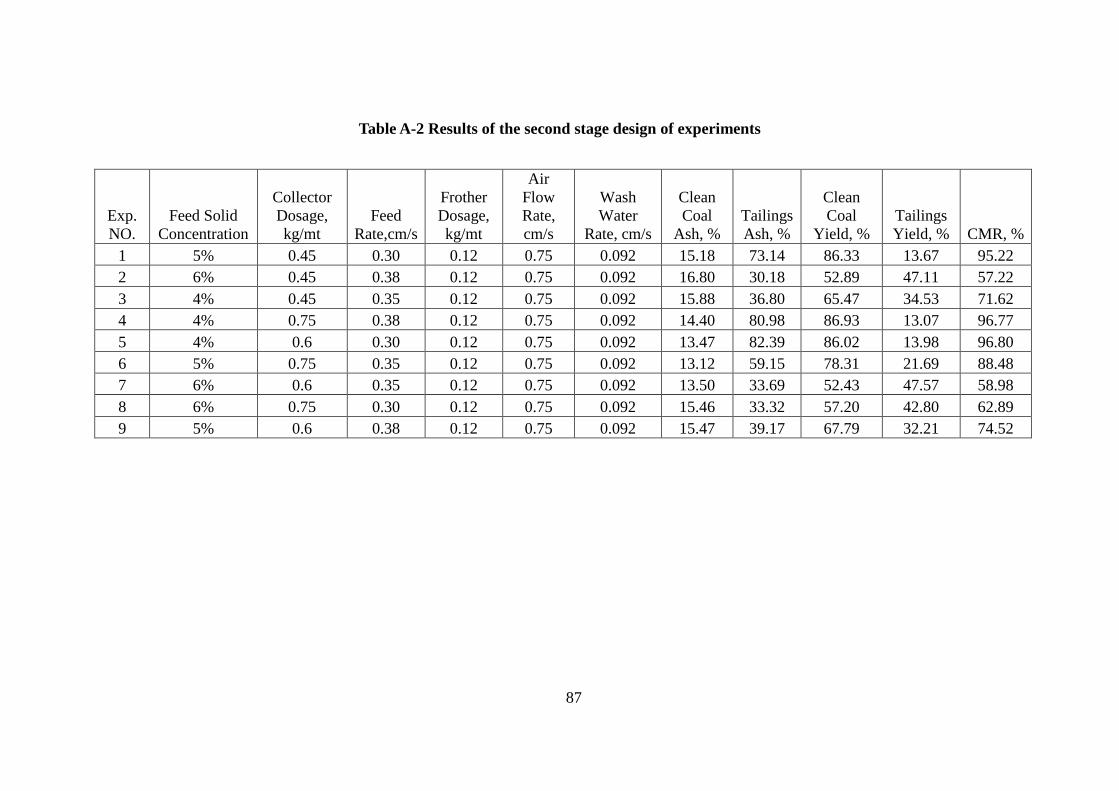
87
Table A-2 Results of the second stage design of experiments
Exp.
NO.
Feed Solid
Concentration
Collector
Dosage,
kg/mt
Feed
Rate,cm/s
Frother
Dosage,
kg/mt
Air
Flow
Rate,
cm/s
Wash
Water
Rate, cm/s
Clean
Coal
Ash, %
Tailings
Ash, %
Clean
Coal
Yield, %
Tailings
Yield, % CMR, %
1 5% 0.45 0.30 0.12 0.75 0.092 15.18 73.14 86.33 13.67 95.22
2 6% 0.45 0.38 0.12 0.75 0.092 16.80 30.18 52.89 47.11 57.22
3 4% 0.45 0.35 0.12 0.75 0.092 15.88 36.80 65.47 34.53 71.62
4 4% 0.75 0.38 0.12 0.75 0.092 14.40 80.98 86.93 13.07 96.77
5 4% 0.6 0.30 0.12 0.75 0.092 13.47 82.39 86.02 13.98 96.80
6 5% 0.75 0.35 0.12 0.75 0.092 13.12 59.15 78.31 21.69 88.48
7 6% 0.6 0.35 0.12 0.75 0.092 13.50 33.69 52.43 47.57 58.98
8 6% 0.75 0.30 0.12 0.75 0.092 15.46 33.32 57.20 42.80 62.89
9 5% 0.6 0.38 0.12 0.75 0.092 15.47 39.17 67.79 32.21 74.52
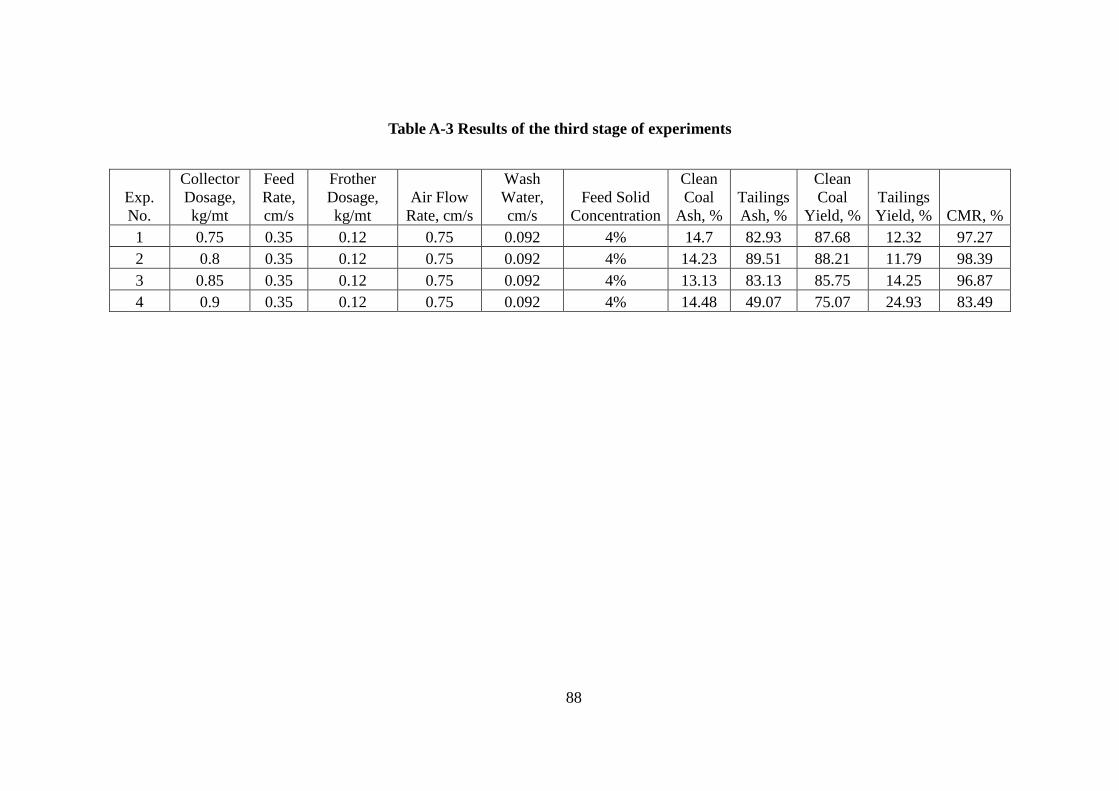
88
Table A-3 Results of the third stage of experiments
Exp.
No.
Collector
Dosage,
kg/mt
Feed
Rate,
cm/s
Frother
Dosage,
kg/mt
Air Flow
Rate, cm/s
Wash
Water,
cm/s
Feed Solid
Concentration
Clean
Coal
Ash, %
Tailings
Ash, %
Clean
Coal
Yield, %
Tailings
Yield, % CMR, %
1 0.75 0.35 0.12 0.75 0.092 4% 14.7 82.93 87.68 12.32 97.27
2 0.8 0.35 0.12 0.75 0.092 4% 14.23 89.51 88.21 11.79 98.39
3 0.85 0.35 0.12 0.75 0.092 4% 13.13 83.13 85.75 14.25 96.87
4 0.9 0.35 0.12 0.75 0.092 4% 14.48 49.07 75.07 24.93 83.49
89
Column Flotation of Subbituminous Coal Using the Blend of Trimethyl
Pentanediol Derivatives and Pico-Nano Bubbles
Jinxiang Chen
Thesis submitted to
the Benjamin M. Statler College of Engineering and Mineral Resources at
West Virginia University
in Partial Fulfillment of the Requirements for the Degree of
Master of Science
In
Mining Engineering
Department of Mining Engineering
APPROVAL OF THE EXAMING COMMITTEE
Roger Chen, Ph.D.
Yi. Luo, Ph.D.
Date Felicia F. Peng, Ph.D., Chair
90
VITA
Jinxiang Chen was born in October 21, 1988 in Chenzhou City, Hunan Province,
People’s Republic of China He graduated from Chenzhou No.2 High School in July
2007 and obtained his Bachelor’s degree in Mineral Processing Engineering from
China University of Mining and Technology (Beijing) in July 2011.
He joined the program of Master of Science in Mining Engineering Department
of West Virginia University, U.S.A. in the fall of 2011. Now he is the candidate of
M.S. degree in Mining Engineering.
Jinxiang Chen