Embed Size (px)
Citation preview

ColumbusPM10 Monitoring Special Study
August 22, 2000To
August 31, 2001
Prepared byAmbient Monitoring SectionOffice of Air Management
IDEM
May 2002

2
PM-10 Special Purpose Monitoring SiteColumbus, IN
Introduction
Over the years, the Indiana Department of Environmental Management (IDEM has receivednumerous complaints from citizens and businesses in the vicinity of the Golden Casting Corp.Foundry in Columbus, Indiana, regarding particulate matter pollution. IDEM operated a TotalSuspended Particulate (TSP) monitor downwind of the foundry from 1985 to 1987 resulting inno exceedances of the original health standard for TSP, known as the “National Ambient AirQuality Standard.” In 1990 and 1991, a special purpose monitor was sited approximately 2blocks north/northeast of the foundry and sampled for TSP again. The filters from this studywere also analyzed for 14 trace metals. The maximum 24-hour TSP reading during this studywas 133ug/m3 as compared to the then existing standard of 150ug/m3. Although there are nostandards for the trace metals that were measured, the values recorded during this study were lowand not of concern to the public health. In August 2000, in an effort to determine if theconcentrations of respirable particulate matter in the area downwind of the foundry posed ahealth concern to the residents and business neighbors, IDEM established a state-of-the-artcontinuous particulate monitor to measure only the respirable portion of the particulate(particulate matter less than 10 microns in size) (PM10) in the area. Continuous meteorologicalparameters were also collected during this study.
This report summarizes the results of the recent monitoring study. It should be noted that duringthe timeframe of this study, IDEM’s Office of Air Compliance worked with Golden Castings asthe company implemented dust control measures designed to reduce emissions from variouslocations within the facility.
Project Plan
In order to determine if a health problem or threat from respirable particulate matter existed inthe area around Golden Casting, a PM10 (particulate matter less than 10 microns in size) monitorwas located near the facility. The data retrieved from the monitor were compared to the NAAQSfor PM10. A meteorological station to measure wind speed (WS) and wind direction (WD) wasalso located at the site. The monitoring period established at the beginning of the study was oneyear. This time period would allow for the collection of air quality data through all seasonalvariations.
National Ambient Air Quality Standards
The USEPA has established NAAQS for six criteria pollutants. For each pollutant a primary anda secondary standard is set. The primary NAAQS are set to protect the public health of thepopulation, including the health of sensitive populations such as asthmatics, children, and the

3
elderly. The secondary NAAQS are established to protect the public welfare, includingprotection against decreased visibility, damage to animals, crops, vegetation, and buildings. Thelevel of the primary and secondary NAAQS for PM10 are set to the same value. Both a shortterm (24 hour average) and a long term (annual average) time period is set for both NAAQS.The level of the short term NAAQS is 150 micrograms per cubic meter of air (ug/m3) and thelevel of the long term NAAQS is 50 ug/m3.
The short term standard is met when the yearly average number of exceedances for a three-yearperiod is less than or equal to one. The long term standard is met when the average of the three-year averages is less than or equal to 50 ug/m3. For the purposes of this study, the number ofexceedances allowed would be 1 and the average over the sampling period should be less than orequal to 50.
Particulate Sources
Attachment 1 is a list of the sources reporting emissions of PM10 for 2000 in BartholomewCounty. The largest emitter of PM10 is Golden Casting Corp. with estimated emission of 85tons/year.
Site Location
A mobile sampling trailer was installed in a parking lot north of the General Office Building ofArvin North American Automotive to house the air quality monitor and equipment. The sampleinlet was approximately 600 feet north of the property line of the Golden Casting Corp. Foundry.The Golden Casting building was located between 155o to 200o from the monitoring trailer. Theproperty of the facility spanned was located between 145o to 220o. Attachment 2 shows thelocation of the monitoring site in the city of Columbus. Attachment 3 shows the location of themonitoring site with respect to Golden Casting and the surrounding buildings. The UTMs of thesite are 595.330E and 4340.750N. The site is identified using the AIRS (Aerometric InformationRetrieval System) site number 18-005-0006.
The PM10 monitor met all siting criteria for PM10 monitoring as set forth in 40 CFR Part 58 andthe Indiana Ambient Air Monitoring Quality Assurance Manual.
Sampling Period
The PM10 monitor began collecting data on August 22, 2000 and continued until August 31,2001. The meteorological monitor collected WS and WD data from September 21, 2000 untilAugust 31, 2001.
Equipment
A Rupprecht and Patashnick (R&P) TEOM 1400a was used to collect PM10 valuescontinuously. The 1400a incorporates a tapered element oscillating micro-balance to measure

4
particulate loading. Ambient air is drawn from atop the shelter into the unit through a sizeselective inlet which allows only particulate matter less than 10 microns in size to pass through.A down-tube delivers the air with the particulate in it to the monitor inside the shelter. A filter isplaced atop a tapered glass rod, which oscillates between 150 and 400 megahertz. As moreparticulate is deposited on the filter, the oscillation frequency of the rod changes proportionatelyto the amount of particulate load. The electronics of the monitor measures the difference inoscillation and calculates the PM10 concentration.
The WS and WD data were collected using a RM Young Model 05305/AQ meteorologicalsystem.
Data from the PM10 monitor and meteorological sensors were stored in hourly average readingsusing an Environmental Systems Corp. (ESC) Model 8816 data logger.
All electronic monitoring and data gathering instrumentation was housed inside an 8x12 footmobile monitoring trailer environmentally controlled at 72 degrees F (plus/minus 3 degree F).
Data Collection
Every hour the central data system of the Air Monitoring Branch, located in Indianapolis, polledthe Columbus site and retrieved the data recorded for the previous hour. The hourly values werereviewed each day to determine monitor operation and the concentrations being collected. Thedata were compiled in a monthly summary and reviewed by Branch staff for validity,completeness, and compliance with the NAAQS for PM10 concentrations.
Data Quality
All monitors and recording devices were operated according to the standards and procedures setforth in Indiana State Quality Assurance Manual, the applicable sections of 40 CFR Parts 50, 53,and 58, and the individual instrumentation manuals. Periodic calibrations and audits wereperformed on the instrumentation. All calibration and audit results for the sampling period werewithin the acceptable limits. Attachment 4 lists the individual results for the TEOM andAttachment 5 lists the results for the meteorological units.
Data Return
For the PM10 sampling period from August 22, 2000 until August 31, 2001 a total of 8990 hoursof data were possible. 8486 hours of valid data were collected for a valid data return of 94.4%.
Most invalid data readings consisted of one to three hours every few weeks as staff performedsite checks, filter changes, or quality assurance activities. One large block of invalid data, 357hours, occurred in June. A new filter was improperly seated in the instrument. Once thisproblem was discovered, an attempt to correct it failed and more data were lost until the filterwas properly seated and the instrument began collecting valid data again.In August, data were lost for 87 hours due to the same problem of an improperly seated filter.This time the problem was detected more quickly and less data were invalidated.
5
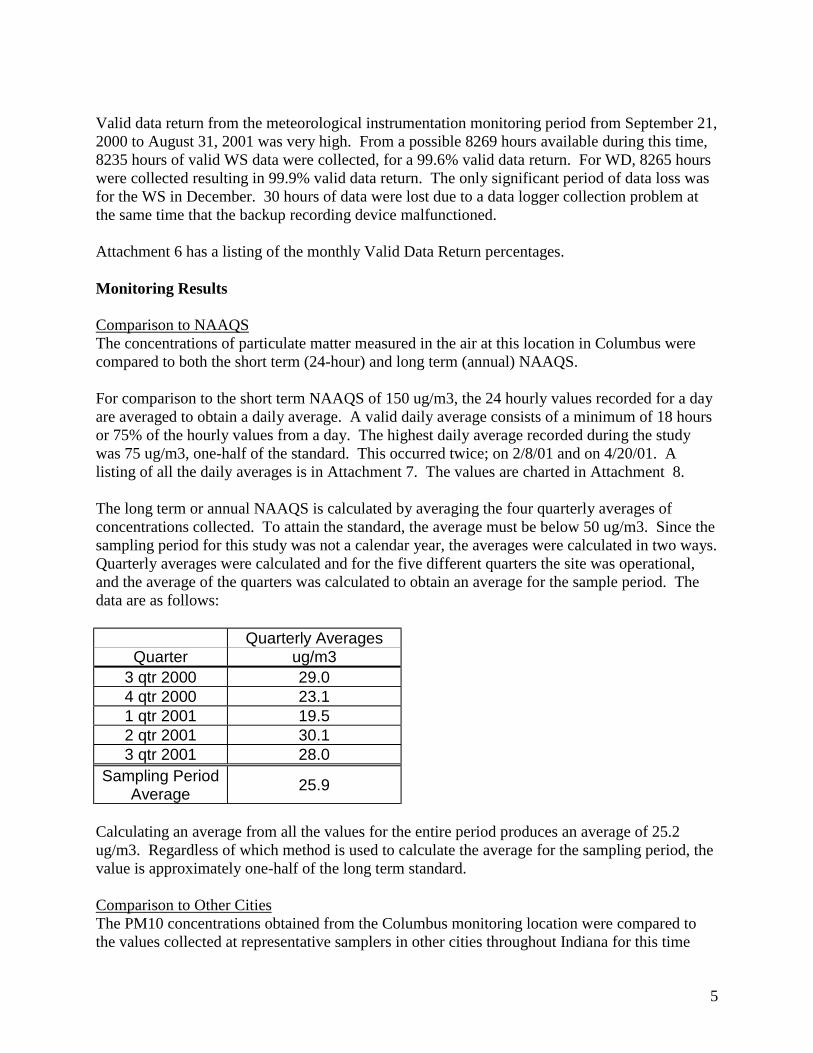
Valid data return from the meteorological instrumentation monitoring period from September 21,2000 to August 31, 2001 was very high. From a possible 8269 hours available during this time,8235 hours of valid WS data were collected, for a 99.6% valid data return. For WD, 8265 hourswere collected resulting in 99.9% valid data return. The only significant period of data loss wasfor the WS in December. 30 hours of data were lost due to a data logger collection problem atthe same time that the backup recording device malfunctioned.
Attachment 6 has a listing of the monthly Valid Data Return percentages.
Monitoring Results
Comparison to NAAQSThe concentrations of particulate matter measured in the air at this location in Columbus werecompared to both the short term (24-hour) and long term (annual) NAAQS.
For comparison to the short term NAAQS of 150 ug/m3, the 24 hourly values recorded for a dayare averaged to obtain a daily average. A valid daily average consists of a minimum of 18 hoursor 75% of the hourly values from a day. The highest daily average recorded during the studywas 75 ug/m3, one-half of the standard. This occurred twice; on 2/8/01 and on 4/20/01. Alisting of all the daily averages is in Attachment 7. The values are charted in Attachment 8.
The long term or annual NAAQS is calculated by averaging the four quarterly averages ofconcentrations collected. To attain the standard, the average must be below 50 ug/m3. Since thesampling period for this study was not a calendar year, the averages were calculated in two ways.Quarterly averages were calculated and for the five different quarters the site was operational,and the average of the quarters was calculated to obtain an average for the sample period. Thedata are as follows:
Quarterly AveragesQuarter ug/m3
3 qtr 2000 29.04 qtr 2000 23.11 qtr 2001 19.52 qtr 2001 30.13 qtr 2001 28.0
Sampling PeriodAverage 25.9
Calculating an average from all the values for the entire period produces an average of 25.2ug/m3. Regardless of which method is used to calculate the average for the sampling period, thevalue is approximately one-half of the long term standard.
Comparison to Other CitiesThe PM10 concentrations obtained from the Columbus monitoring location were compared tothe values collected at representative samplers in other cities throughout Indiana for this time

6
period. Most PM10 monitors are located in populated or downtown business areas. Two of thesites are located in industrial settings; one site in Gary and one site in Indianapolis. The annualaverages obtained for 2000 and 2001 range from 18ug/m3 to 33 ug/m3. All are well below theannual NAAQS. The average of 26 ug/m3 reported from Columbus is less than theindustrialized Gary site and the business district sites in Jeffersonville and Evansville and thesame as the industrialized area site in Indianapolis. The remainder of the sites range between 18ug/m3 and 23 ug/m3. The comparison of the annual averages is in Attachment 9.
A comparison of the maximum 24-hour values obtained in 2000 and 2001 from these same sitesindicates that the Gary industrialized site exceeded the 24-hour NAAQS of 150 ug/m3 with areported value of 207 ug/m3. The maximum of 75 ug/m3 reported at the Columbus site was lessthan the maximums reported at the South Bend and Evansville sites also. The remainder of thesites reported 24-hour maximum concentrations ranged between 47 ug/m3 to 66 ug/m3.Attachment 10 shows the comparison between the cities for the 24-hour maximums.
Comparison to Wind DirectionOne advantage of collecting PM10 data continuously as opposed to collecting a filter-based 24hour integrated sample is the ability to track the particulate concentrations as they rise and fallduring the day as a result of the wind direction at the site and the differing activities around thesite. A table of WD compared to the different concentrations of PM10 is shown in Attachment11 and the pollution rose of this data is in Attachment 12. The predominant wind directions forthe sampling period were between south and northwest accounting for 56.3% of the time with thesouthwest direction accounting for largest portion at 9.76%.
The highest hourly concentration of PM10 monitored at the Columbus site during the samplingperiod was 204 ug/m3. A listing of the highest hourly PM10 concentrations is in Attachment 13.
The number of hours for which both PM10 and WD were collected was 7768. As indicated bythe pollution rose, the majority of the higher PM10 concentrations occurred when the winds werefrom a southerly direction. PM10 hourly averages of 50 ug/m3 or greater were reported during789 hours or 10.04% of the monitoring period. Of these hours, 660 (83.7%) were recorded whenthe WD was between 147o (SSE) and 236o (SW). All concentrations of PM10 greater than orequal to 100 ug/m3 were recorded when the WD was between 147o (SSE) and 213o (SSW).There appeared to be no seasonal distribution as the high values with the southerly windsoccurred throughout the entire study.
Attachment 14 lists the daily average concentrations that are 50 ug/m3 or greater. The numberof hours that the WD was from each direction is also listed. For the two highest days, February8, 2001, and April 20, 2001, the WD was almost exclusively between 147o (SSE) and 213o
(SSW). A review of these days indicate that almost all of these days had the wind blowing fromthese directions for varying amounts of hours.
The average concentration of PM10 was calculated for all of the hours when the WD wasbetween 147o (SSE) and 213o (SSW), the arc of the direction of the Golden Casting. This valuewas 37.6 ug/m3. The average concentration calculated for all the hours which had only a south

7
wind direction (169o - 191o) was 45.7 ug/m3. Both values are below the long term or annualNAAQS.
Conclusions
Neither the short term (24-hour) health standard nor the long term (annual) health standard wasexceeded during the sampling period. These are the levels that have been established by USEPAas protective of the public health over these time periods. Both daily and annual average andmaximum values were well within the federal standards.
With the exception of a site in Gary which is located in a highly industrialized area, the annualaverage and the maximum 24-hour concentrations reported from the Columbus site are amongthe higher values obtained from different sites across Indiana. The values are comparable tothose monitored at other industrial locations. The highest PM10 concentrations were recordedwhen the wind came from the directions between 147o (SSE) and 213o (SSW). Since the GoldenCasting facility is the largest source of PM10 in the area and is located approximately 600 feetfrom the monitoring location between 155o and 220o, the high concentrations of PM10 recordedat the monitoring site are probably due to emissions from this facility.
On the days when the wind was from the direction of Golden Casting for the entire day, the dailyaverage concentration was one-half of the short term NAAQS or less. However, the data clearlyshow that PM10 levels were higher when the wind blew from the direction of the foundry.These higher levels would likely be discernable to downwind neighbors.

CNTY CODE PLANT_ID NAME STREET CITY POLLUTANT
EST EMISSIONS
(tons/yr)UTM
NORTHINGUTM
EASTING005 00048 RIGHTWAY FASTENERS INC 7945 S INTERNATIONAL DR COLUMBUS PM10 0.031275 4452.007 635.508005 00053 CUMMINS ENGINE CO. INC. 1460 NATIONAL RD. COLUMBUS PM10 0.548 4341.000 596.400005 00069 CUMMINS, INC. - METC FACILITY 1532 E. 14TH STREET COLUMBUS PM10 0.66725 4348.405 587.453005 00015 CUMMINS ENGINE CO INC 1000 5TH ST COLUMBUS PM10 1.22085 4339.400 594.200005 00066 NTN DRIVESHAFT, INC. 8251 INTERNATIONAL DR. COLUMBUS PM10 1.663959 4300.000 680.000005 00068 VENTRA CORPORATION 1804 22ND STREET COLUMBUS PM10 0.09713 4341.700 594.600005 00002 CUMMINS ENGINE CO #5 1900 MCKINLEY AVE COLUMBUS PM10 5.637 4340.700 594.200005 00086 BARTHOLOMEW CO. LANDFILL 720 SOUTH MAPLETON COLUMBUS PM10 5.79 4331.300 593.400005 00040 TOYOTA IEM, INC. 5555 INWOOD DR. COLUMBUS PM10 2.041934 4379.000 641.400005 00047 CUMMINS MIDRANGE ENGINE PLANT - COLUMBUS I-65 AT C.R. 450 S. M/C 71327 COLUMBUS PM10 0.552572 4299.986 680.000005 00080 ARVIN EXHAUST, TECH. CENTER 950 W. ROAD 450 SOUTH COLUMBUS PM10 0.408354 4317.200 601.000005 00008 ARVIN EXHAUST 17TH STREET PLANT 2020 15TH STREET COLUMBUS PM10 0.612375 4341.000 594.200005 00042 ENKEI AMERICA, INC. 2900 WEST INWOOD DRIVE COLUMBUS PM10 20.30286 4332.400 590.400005 00006 GOLDEN CASTING CORPORATION 1616 TENTH STREET COLUMBUS PM10 85.40543 4300.000 680.000005 00067 DSE, INC. DBA SCREEN TECH DESIGNS, INC. LOT 118,MIDDLE ROAD,CLMBS ARPT COLUMBUS PM10 0.639912 4345.300 595.300005 05164 MILESTONE CONTRACTORS, L.P. 3415 SOUTH CR 650 EAST COLUMBUS PM10 0.320178 4336.039 604.873
Columbus - Arvin Special StudyPM10 Emissions Bartholmew County
Attachment 1

Attachment 2
Columbus – Arvin Special StudyMonitoring Site in Columbus
Columbus – Arvin Monitoring Site

Attachment 3
Columbus- Arvin Special StudyMonitoring Site Location


High Flow Low FlowDate Audit/Cal Limit = +/- 10% Limit = +/- 0.2 LPM
8/22/00 Cal -2.2% 0.089/13/00 Audit -2.9% -0.079/29/00 Audit -8.0% 0.1010/23/00 Audit -1.6% -0.1011/14/00 Pre Cal Audit -5.5% 0.16
Cal 1.2% 0.1611/20/00 Audit -3.1% -0.1412/18/00 Audit -4.1% -0.201/4/01 Audit -4.3% -0.161/29/01 Audit 0.9% -0.052/26/01 Audit -0.9% -0.053/5/01 Pre Cal Audit 2.2% 0.14
Cal 2.1% 0.123/30/01 Audit 2.5% 0.034/23/01 Audit 8.2% 0.095/21/01 Audit 1.8% 0.016/20/01 Audit 2.3% 0.207/17/01 Audit 2.2% 0.048/8/01 Audit 5.6% 0.109/6/01 Audit 5.6% -0.07
Columbus - Arvin Special StudyPM10 Calibration and Audit Results
Atttachment 4

Date Cal / Audit Range (mph) Result (mph) Limit (mph) Result (degrees) Limit (degrees) Result (degrees) Limit (degrees)9/21/00 Cal 0-35.0 (4 speeds) -0.1 to 0.2 +/- .5 1.1 +/- 5 5.0 deg 10 1/1/01 Audit 0-54.8 (4 speeds) 0.1 to 0.2 +/- .5 0.4 +/- 5 5.6 10 3/9/01 Cal 0-43.8 (4 speeds) 0.1 to 0.4 +/- .5 4.4 +/- 5 8.7 10 9/6/01 Audit 0-54.8 (4 speeds) 0.1 to 0.3 +/- .5 -0.6 +/- 5 4.9 10
Attachment 5
Columbus - Arvin Special StudyMeteorological Monitors Calibrations and Audits
Linearity of Vane ResponseComparison of Vane Response to
Reference PointComparison of Anemometer to WS Standard
WS WD

WS/WD
2000
Total Hours
PossibleValid Hours VDR
Valid Days*
Total Hours
PossibleValid Hours VDR
Valid Hours VDR
August 230 230 100.0% 9September 720 712 98.9% 30 229 229 100.0% 229 100.0%October 744 734 98.7% 31 744 744 100.0% 744 100.0%November 720 711 98.8% 30 720 720 100.0% 720 100.0%December 744 741 99.6% 31 744 714 96.0% 744 100.0%
2001January 744 738 99.2% 31 744 743 99.9% 743 99.9%February 672 669 99.6% 28 672 672 100.0% 672 100.0%March 744 739 99.3% 31 744 742 99.7% 742 99.7%April 720 717 99.6% 30 720 720 100.0% 720 100.0%May 744 741 99.6% 31 744 743 99.9% 743 99.9%June 720 362 50.3% 14 720 720 100.0% 720 100.0%July 744 737 99.1% 31 744 744 100.0% 744 100.0%August 744 655 88.0% 26 744 744 100.0% 744 100.0%Total 8990 8486 94.4% 353 8269 8235 99.6% 8265 100.0%
* Days with >75% VDR (18 hr+)
Attachment 6
Columbus - Arvin Special Study
PM10 data collection began on August 22, 2000
WS/WD data collection began on September 21,2000
Valid Data Return (VDR)
PM10 WS WD
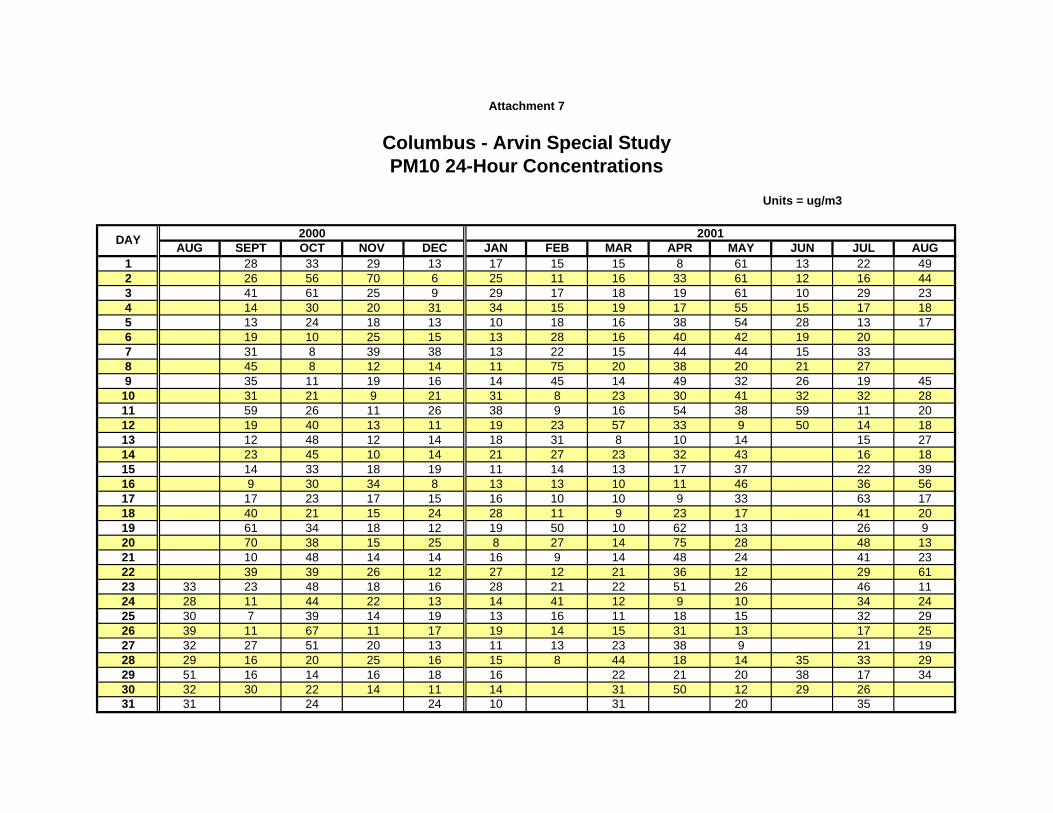
Units = ug/m3
AUG SEPT OCT NOV DEC JAN FEB MAR APR MAY JUN JUL AUG1 28 33 29 13 17 15 15 8 61 13 22 492 26 56 70 6 25 11 16 33 61 12 16 443 41 61 25 9 29 17 18 19 61 10 29 234 14 30 20 31 34 15 19 17 55 15 17 185 13 24 18 13 10 18 16 38 54 28 13 176 19 10 25 15 13 28 16 40 42 19 207 31 8 39 38 13 22 15 44 44 15 338 45 8 12 14 11 75 20 38 20 21 279 35 11 19 16 14 45 14 49 32 26 19 45
10 31 21 9 21 31 8 23 30 41 32 32 2811 59 26 11 26 38 9 16 54 38 59 11 2012 19 40 13 11 19 23 57 33 9 50 14 1813 12 48 12 14 18 31 8 10 14 15 2714 23 45 10 14 21 27 23 32 43 16 1815 14 33 18 19 11 14 13 17 37 22 3916 9 30 34 8 13 13 10 11 46 36 5617 17 23 17 15 16 10 10 9 33 63 1718 40 21 15 24 28 11 9 23 17 41 2019 61 34 18 12 19 50 10 62 13 26 920 70 38 15 25 8 27 14 75 28 48 1321 10 48 14 14 16 9 14 48 24 41 2322 39 39 26 12 27 12 21 36 12 29 6123 33 23 48 18 16 28 21 22 51 26 46 1124 28 11 44 22 13 14 41 12 9 10 34 2425 30 7 39 14 19 13 16 11 18 15 32 2926 39 11 67 11 17 19 14 15 31 13 17 2527 32 27 51 20 13 11 13 23 38 9 21 1928 29 16 20 25 16 15 8 44 18 14 35 33 2929 51 16 14 16 18 16 22 21 20 38 17 3430 32 30 22 14 11 14 31 50 12 29 2631 31 24 24 10 31 20 35
DAY 2000 2001
Attachment 7
Columbus - Arvin Special StudyPM10 24-Hour Concentrations

Attachment 8
Columbus-Arvin Special StudyPM10 24-hour Average Concentrations
0
20
40
60
80
100
120
140
160
8/23/0
0
9/22/0
0
10/22
/00
11/21
/00
12/21
/00
1/20/0
1
2/19/0
1
3/21/0
1
4/20/0
1
5/20/0
1
6/19/0
1
7/19/0
1
8/18/0
1
Date
ug
/cu
bic
met
er
24hr Health Standard

Attachment 9
Columbus - Arvin Special StudyComparison of Annual Values : Columbus Vs Other Cities
0
10
20
30
40
50
60
Columbu
s (I,P
)
Fort W
ayne
(P)
Jeffe
rsonv
ille (B
)
East C
hicag
o (P,B)
Gary (I)
Gary (P
,B)
Hammon
d (P)
Indian
apoli
s (I)
Indian
apoli
s (P)
Anders
on (B
)
South
Bend (
P)
Evans
ville (
B)
Terre H
aute
(P)
City
Co
nc.
(u
g/m
3)
Annual Average : 2000Annual Average : 2001Annual Average : 2 yr ave
Annual NAAQS
Site Location CharacteristicP - Population AreaI - Industrial AreaB - Business or Commercial Area

Attachment 10
Columbus - Arvin Special Study Comparison of 24-Hour Maxs : Columbus Vs Other Cities
0
50
100
150
200
250
Columbu
s (I,P
)
Fort W
ayne
(P)
Jeffe
rsonv
ille (B
)
East C
hicag
o (P,B)
Gary (I)
Gary (P
,B)
Hammon
d (P)
Indian
apoli
s (I)
Indian
apoli
s (P)
Anders
on (B
)
South
Bend (
P)
Evans
ville (
B)
Terre H
aute
(P)
City
Co
nc.
(u
g/m
3)
24 hour max : 200024 hour max : 200124 hour max : 2 yr max
Site Location CharacteristicP - Population AreaI - Industrial AreaB - Business or Commercial Area
24-Hour NAAQS

Calm N NNE NE ENE E ESE SE SSE S SSW SW WSW W WNW NW NNW
349-11 12-33 34-56 57-78 79-101 102-123 124-146 147-168 169-191 192-213 214-236 237-258 259-281 282-303 304-326 327-348
0-9 0.28 1 1.01 1.01 0.48 0.34 0.25 0.18 0.11 0.16 0.3 0.85 1.22 1.92 1.95 2.29 1.19 14.54
10-19 0.8 2.98 2.65 1.57 1.17 1.71 1.58 1.01 0.66 1.28 1.28 3.03 3.15 4.38 3.48 3.54 3.56 37.83
20-29 1.35 1.43 1.21 0.59 0.7 1.06 1.12 1.35 1.08 1.54 1.56 2.13 0.84 0.97 1.16 1.1 1.18 20.37
30-39 0.46 0.36 0.24 0.15 0.14 0.39 0.74 0.62 1.03 1.69 1.41 1.72 0.58 0.55 0.37 0.29 0.3 11.04
40-49 0.37 0.04 0.05 0.07 0.05 0.19 0.25 0.3 0.57 0.97 1.43 0.97 0.35 0.2 0.12 0.09 0.05 6.07
50-99 0.41 0.01 0.05 0.03 0.05 0.17 0.38 0.41 1.1 2.75 2.45 1.06 0.22 0.16 0.1 0.05 0.02 9.42
100-149 0 0 0 0 0 0 0 0 0.05 0.47 0.16 0 0 0 0 0 0 0.68>=150 0 0 0 0 0 0 0 0 0.04 0.01 0 0 0 0 0 0 0 0.05
Percentage of Time per Direction
3.67 5.82 5.21 3.42 2.59 3.86 4.32 3.87 4.64 8.87 8.59 9.76 6.36 8.18 7.18 7.36 6.3 100
Calm N NNE NE ENE E ESE SE SSE S SSW SW WSW W WNW NW NNW
349-11 12-33 34-56 57-78 79-101 102-123 124-146 147-168 169-191 192-213 214-236 237-258 259-281 282-303 304-326 327-348
0-9 22 78 78 78 37 26 19 14 9 12 23 66 95 149 151 178 92 112910-19 62 231 206 122 91 133 123 78 51 99 99 235 245 340 270 275 277 293920-29 105 111 94 46 54 82 87 105 84 120 121 165 65 75 90 85 92 158230-39 36 28 19 12 11 30 57 48 80 131 110 134 45 43 29 23 23 85840-49 29 3 4 5 4 15 19 23 44 75 111 75 27 16 9 7 4 47250-99 32 1 4 2 4 13 30 32 85 214 190 82 17 12 8 4 2 732
100-149 0 0 0 0 0 0 0 0 4 37 12 0 0 0 0 0 0 53>=150 0 0 0 0 0 0 0 0 3 1 0 0 0 0 0 0 0 4
# of Hours per Direction 285 452 405 266 201 300 336 301 360 689 667 758 494 635 558 572 489 7768
Number of hours for each concentration category vs wind direction
Concentration Category (ug/m3)
Wind Direction (Degrees) # of Hours per Conc Category
Attachment 11
Columbus - Arvin Special StudyFrequency Distribution (Concentrations Vs Wind Direction)
Freq per Conc
Category
Wind Direction (Degrees)Concentration Category (ug/m3)
Percentage of total period for each concentration category vs wind direction
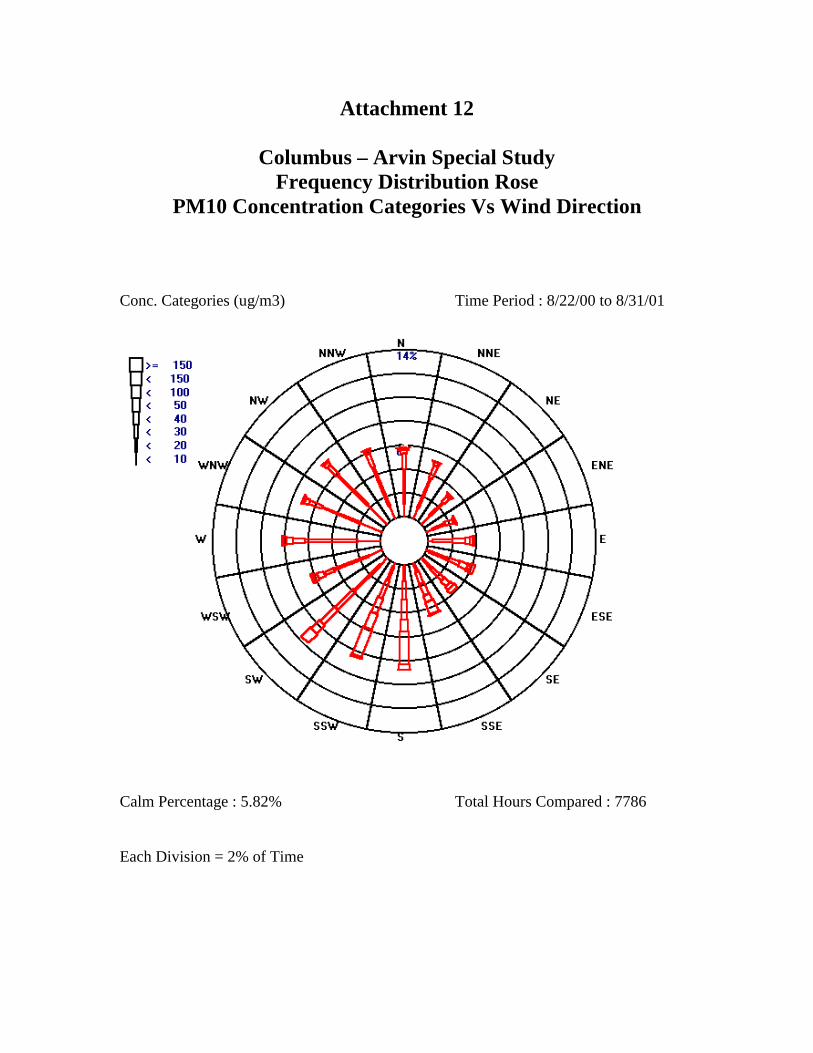
Attachment 12
Columbus – Arvin Special StudyFrequency Distribution Rose
PM10 Concentration Categories Vs Wind Direction
Conc. Categories (ug/m3) Time Period : 8/22/00 to 8/31/01
Calm Percentage : 5.82% Total Hours Compared : 7786
Each Division = 2% of Time
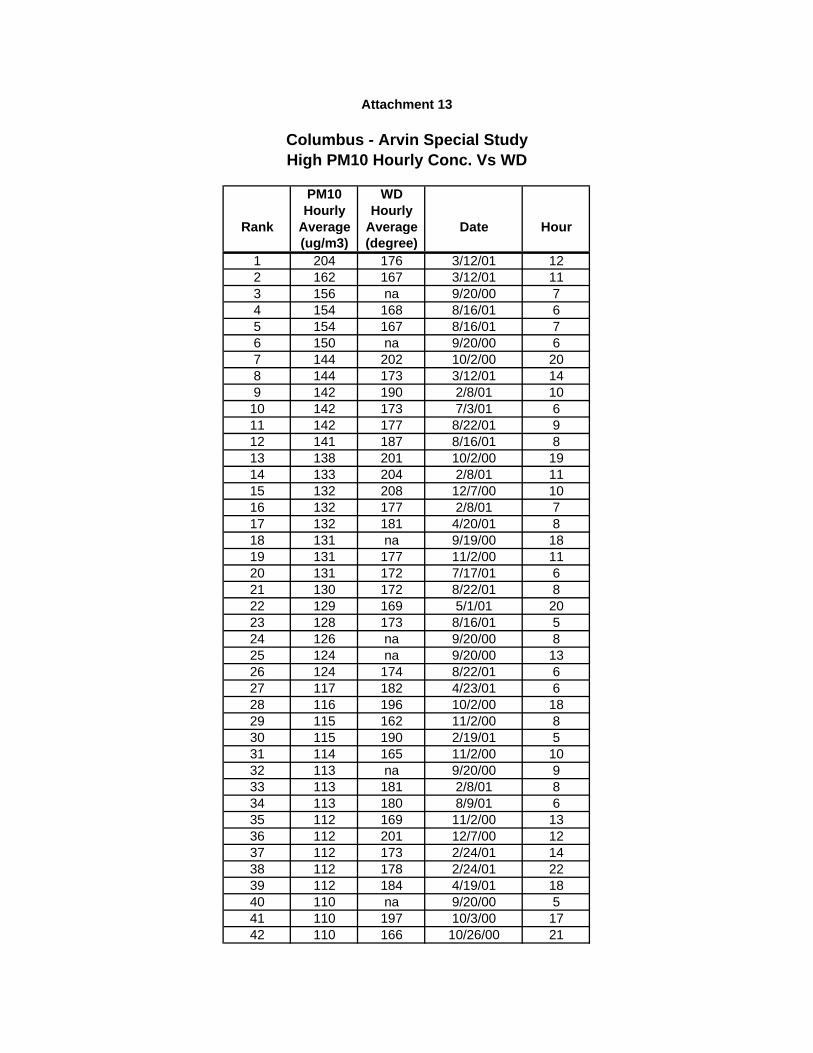
PM10 WDHourly Hourly
Rank Average Average Date Hour(ug/m3) (degree)
1 204 176 3/12/01 122 162 167 3/12/01 113 156 na 9/20/00 74 154 168 8/16/01 65 154 167 8/16/01 76 150 na 9/20/00 67 144 202 10/2/00 208 144 173 3/12/01 149 142 190 2/8/01 1010 142 173 7/3/01 611 142 177 8/22/01 912 141 187 8/16/01 813 138 201 10/2/00 1914 133 204 2/8/01 1115 132 208 12/7/00 1016 132 177 2/8/01 717 132 181 4/20/01 818 131 na 9/19/00 1819 131 177 11/2/00 1120 131 172 7/17/01 621 130 172 8/22/01 822 129 169 5/1/01 2023 128 173 8/16/01 524 126 na 9/20/00 825 124 na 9/20/00 1326 124 174 8/22/01 627 117 182 4/23/01 628 116 196 10/2/00 1829 115 162 11/2/00 830 115 190 2/19/01 531 114 165 11/2/00 1032 113 na 9/20/00 933 113 181 2/8/01 834 113 180 8/9/01 635 112 169 11/2/00 1336 112 201 12/7/00 1237 112 173 2/24/01 1438 112 178 2/24/01 2239 112 184 4/19/01 1840 110 na 9/20/00 541 110 197 10/3/00 1742 110 166 10/26/00 21
Attachment 13
Columbus - Arvin Special StudyHigh PM10 Hourly Conc. Vs WD

PM10 WDHourly Hourly
Rank Average Average Date Hour(ug/m3) (degree)
43 109 na 8/23/00 044 109 159 11/2/00 945 108 192 11/2/00 1246 108 165 11/16/00 1047 108 186 5/1/01 2148 107 190 2/9/01 849 107 172 4/11/01 1650 106 188 2/8/01 951 106 188 3/12/01 1552 105 na 9/20/00 1453 105 189 10/3/00 1654 105 206 10/3/00 1855 105 206 12/7/00 1356 105 170 4/11/01 2057 105 173 4/11/01 2158 104 na 8/22/00 2359 104 174 2/8/01 1860 104 189 2/24/01 2361 104 171 4/20/01 762 104 191 4/20/01 1863 101 201 12/7/00 1164 100 170 2/8/01 665 100 181 2/20/01 666 100 181 4/19/01 867 100 192 5/2/01 1468 99 190 2/19/01 869 99 171 8/22/01 570 98 179 4/19/01 2171 98 184 5/2/01 1572 97 na 9/20/00 1673 97 204 10/26/00 1774 97 170 3/12/01 1375 97 203 7/17/01 776 96 172 4/20/01 2077 95 170 4/20/01 678 95 189 8/22/01 1079 95 203 8/30/01 680 94 na 8/22/00 2281 94 na 9/19/00 2182 94 164 10/26/00 2083 94 135 11/2/00 1584 94 182 4/19/01 1985 94 177 4/19/01 2086 94 199 4/23/01 1387 94 178 5/16/01 2088 93 179 10/26/00 2289 93 180 5/3/01 890 93 175 7/18/01 1

PM10 WDHourly Hourly
Rank Average Average Date Hour(ug/m3) (degree)
91 92 174 9/22/00 1692 92 173 5/1/01 593 92 197 8/9/01 794 92 199 8/16/01 995 91 na 9/1/00 1896 91 169 4/11/01 1897 91 191 4/23/01 798 91 189 5/1/01 799 91 189 7/17/01 4100 91 197 8/8/01 14

Calm N NNE NE ENE E ESE SE SSE S SSW SW WSW W WNW NW WNW349-11 12-33 34-56 57-78 79-101 102-123 124-146 147-168 169-191 192-213 214-236 237-258 259-281 282-303 304-326 327-348
1 75 2/8/01 2 1 4 12 52 75 4/20/01 11 12 13 70 9/20/004 70 11/2/00 8 1 2 4 3 1 2 1 25 67 10/26/00 6 1 4 5 3 2 1 1 16 63 7/17/01 1 1 3 9 107 62 4/19/01 1 1 3 8 9 28 61 9/19/009 61 10/3/00 4 8 6 4 210 61 5/1/01 8 10 611 61 5/2/01 1 8 3 7 412 61 5/3/01 7 1 2 2 3 7 1 113 61 8/22/01 1 1 4 12 5 114 59 9/11/0015 59 6/11/01 2 1 11 9 116 57 3/12/01 3 5 1 4 8 317 56 10/2/00 2 8 5 918 56 8/16/01 1 6 2 4 3 1 4 319 55 5/4/01 3 1 1 1 6 10 120 54 4/11/01 1 1 3 3 1 12 321 54 5/5/01 1 2 2 4 6 2 2 2 2 122 51 8/29/0023 51 10/27/00 1 2 4 4 2 7 1 2 124 51 4/23/01 5 14 1 2 225 50 2/19/01 7 7 526 50 4/30/01 4 1 2 2 6 5 1 2 127 50 6/12/01 2 1 3 2 9 6 1
Attachment 14
Columbus - Arvin Special StudyMaximum 24-Hour Concentrations Vs Number of Hours per Wind Direction
Rank24-hr Conc.
(ug/m3)Date
Wind Direction (Degrees)
Not Available
Not Available
Not Available
Not Available