Embed Size (px)
Citation preview
Columbus High School Freshman
Summer Math Packet
Name: __________________________ Math Teacher’s Name: __________________________
THIS PACKET IS DUE THURSDAY, AUGUST 9th
.
2
TABLE OF CONTENTS
Packet Instructions 3 Packet Checklist 4 GPS Standards 5 Classzone Instructions 6 Basic Skills Review 7-8 GPS Review 9-21 GPS Performance Task 22-26 Math Tools Appendix 27 Summer Packet Answer Sheets 28-31

3
Dear Columbus High School Student,
The teachers in the Mathematics Department are looking forward to working with you next year. In preparation for a successful year in math, you must review the objectives by completing the problems included in this packet. The packet is divided into three sections: a basic skills review, a review of 8th grade
Georgia performance standards (GPS), and a performance task. The objectives covered in the packet are those you should have mastered in your previous math classes, so you should take this packet very seriously. If you have difficulty with the problems or need to review the objectives, you can utilize Georgia’s middle or high school math textbook resources at www.classzone.com (see page 6 for more information).
The summer math packet should be completed using the following guidelines:
Complete the packet using a pencil.
You should work all problems for the basic skills and GPS review sections. Each page contains a blank Student Work Area in which to show your computations. Work should be shown for reference and legitimacy of individual attempt.
When you have finished all problems for each objective, transfer your final answers to the Summer Packet Answer Sheets, which can be found on pages 28-31.
Complete the performance task according to the given directions.
The packet will be graded for accuracy as well as effort. This will be the first grade in your math class, and it is important to get off to a great start. Grade deductions will occur for incomplete work. In addition, your first test grade will be the summer math packet test, which is typically given the second week of your math class. Quite often, students who do not complete the summer math packet on their own or who use a calculator when not allowed score poorly on this test. It is in your BEST interest to complete the packet on your own, researching topics for which you need reviewing and completing computations to the best of your ability.
All summer math packets are due on Thursday, August 9th, during New Student Orientation. If you cannot attend the orientation, you must make arrangements to turn the packet in to Mrs. Atkins on or before August 9th. Failure to do so may result in a serious penalty to your grade. Once you obtain your class schedule, use a pen or marker to NEATLY complete the information on the front cover of the packet.
If you purchase a Texas Instrument graphing calculator, you should affix the rewards seal in the designated area on the back cover of this packet. Please do not attach a Proof of Purchase or receipt.
Should you have other questions or if we can be of any assistance, please call the school at 706-748-2534 or email the department chairpersons, Storie Atkins at [email protected] or Paul Hampton at [email protected] .
Sincerely,
Storie Atkins & Paul Hampton Math Department Co-Chairpersons

4
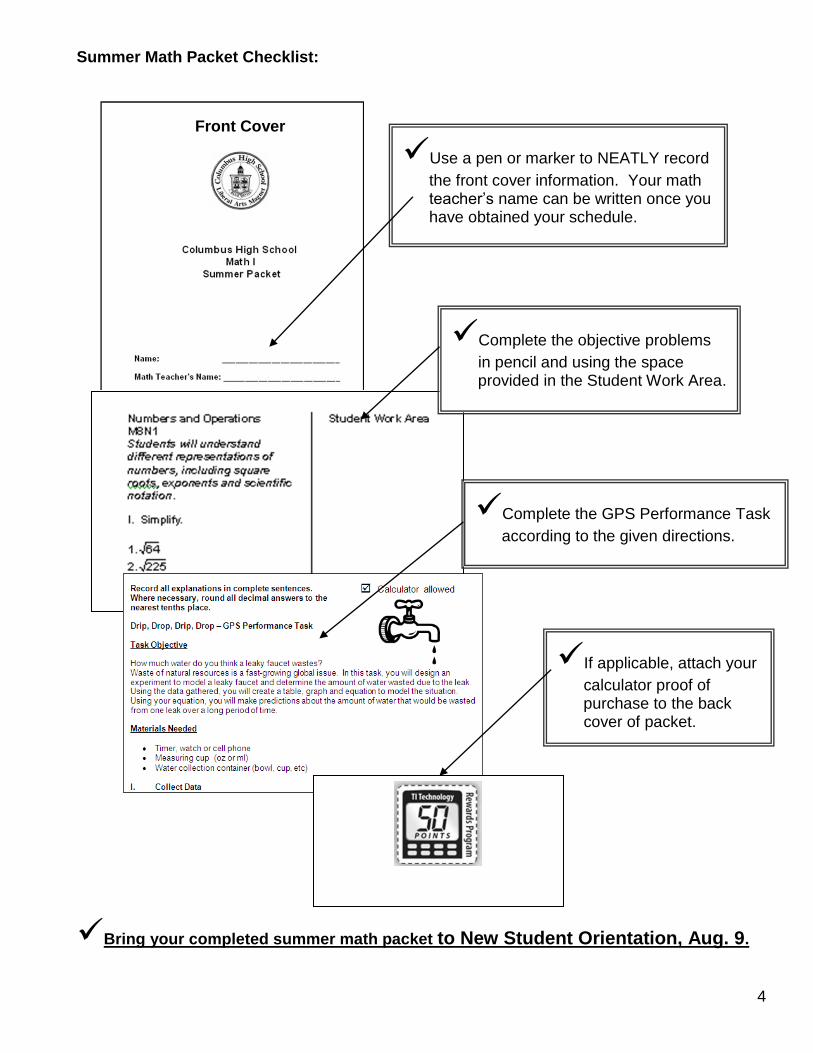
Summer Math Packet Checklist:
Bring your completed summer math packet to New Student Orientation, Aug. 9.
Use a pen or marker to NEATLY record
the front cover information. Your math teacher’s name can be written once you have obtained your schedule.
Front Cover
Complete the objective problems
in pencil and using the space provided in the Student Work Area.
If applicable, attach your
calculator proof of purchase to the back cover of packet.
Complete the GPS Performance Task
according to the given directions.
Back Cover

5
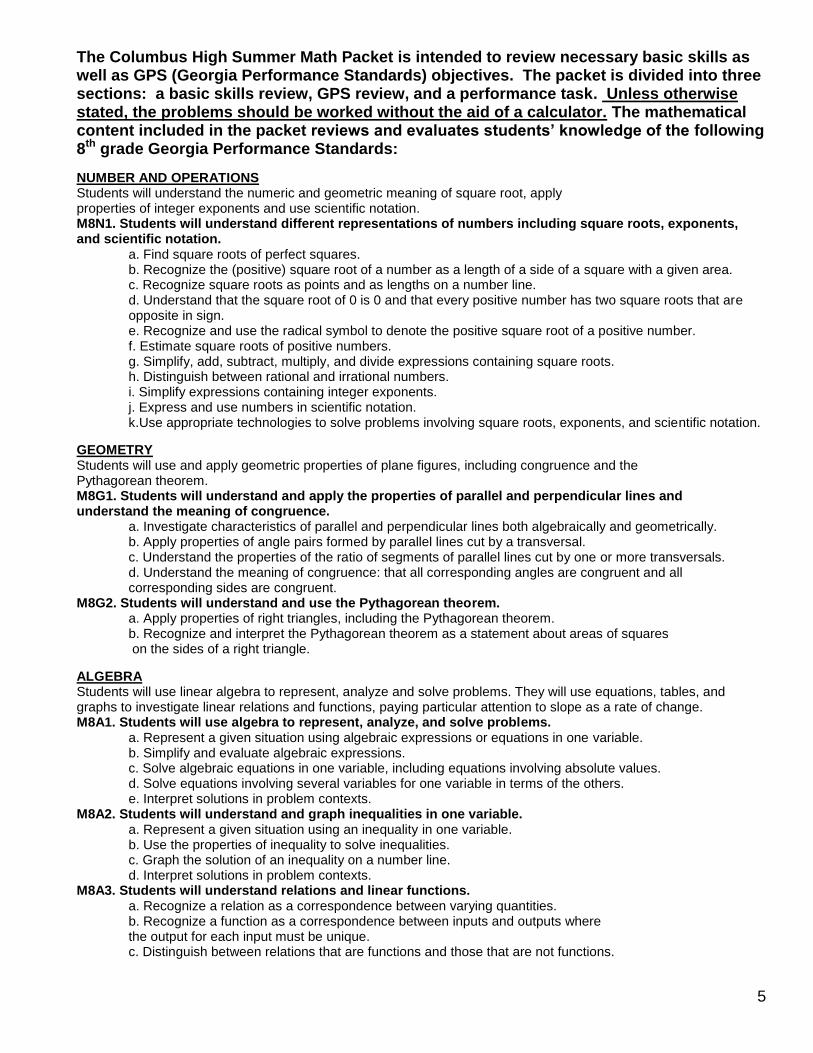
The Columbus High Summer Math Packet is intended to review necessary basic skills as well as GPS (Georgia Performance Standards) objectives. The packet is divided into three sections: a basic skills review, GPS review, and a performance task. Unless otherwise stated, the problems should be worked without the aid of a calculator. The mathematical content included in the packet reviews and evaluates students’ knowledge of the following 8th grade Georgia Performance Standards:
NUMBER AND OPERATIONS Students will understand the numeric and geometric meaning of square root, apply properties of integer exponents and use scientific notation. M8N1. Students will understand different representations of numbers including square roots, exponents, and scientific notation.
a. Find square roots of perfect squares. b. Recognize the (positive) square root of a number as a length of a side of a square with a given area. c. Recognize square roots as points and as lengths on a number line. d. Understand that the square root of 0 is 0 and that every positive number has two square roots that are opposite in sign. e. Recognize and use the radical symbol to denote the positive square root of a positive number. f. Estimate square roots of positive numbers. g. Simplify, add, subtract, multiply, and divide expressions containing square roots. h. Distinguish between rational and irrational numbers. i. Simplify expressions containing integer exponents. j. Express and use numbers in scientific notation. k.Use appropriate technologies to solve problems involving square roots, exponents, and scientific notation.
GEOMETRY Students will use and apply geometric properties of plane figures, including congruence and the Pythagorean theorem. M8G1. Students will understand and apply the properties of parallel and perpendicular lines and understand the meaning of congruence.
a. Investigate characteristics of parallel and perpendicular lines both algebraically and geometrically. b. Apply properties of angle pairs formed by parallel lines cut by a transversal. c. Understand the properties of the ratio of segments of parallel lines cut by one or more transversals. d. Understand the meaning of congruence: that all corresponding angles are congruent and all corresponding sides are congruent.
M8G2. Students will understand and use the Pythagorean theorem. a. Apply properties of right triangles, including the Pythagorean theorem. b. Recognize and interpret the Pythagorean theorem as a statement about areas of squares on the sides of a right triangle.
ALGEBRA Students will use linear algebra to represent, analyze and solve problems. They will use equations, tables, and graphs to investigate linear relations and functions, paying particular attention to slope as a rate of change. M8A1. Students will use algebra to represent, analyze, and solve problems.
a. Represent a given situation using algebraic expressions or equations in one variable. b. Simplify and evaluate algebraic expressions. c. Solve algebraic equations in one variable, including equations involving absolute values. d. Solve equations involving several variables for one variable in terms of the others. e. Interpret solutions in problem contexts.
M8A2. Students will understand and graph inequalities in one variable. a. Represent a given situation using an inequality in one variable. b. Use the properties of inequality to solve inequalities. c. Graph the solution of an inequality on a number line. d. Interpret solutions in problem contexts.
M8A3. Students will understand relations and linear functions. a. Recognize a relation as a correspondence between varying quantities. b. Recognize a function as a correspondence between inputs and outputs where the output for each input must be unique. c. Distinguish between relations that are functions and those that are not functions.
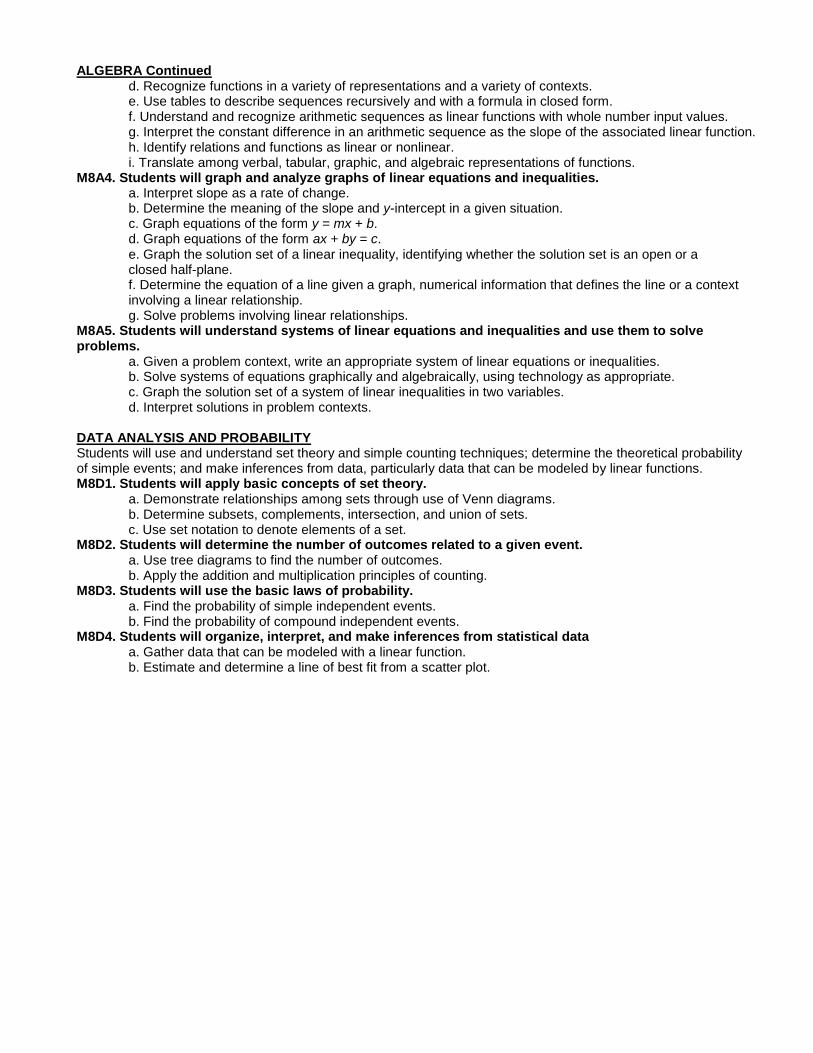
ALGEBRA Continued
d. Recognize functions in a variety of representations and a variety of contexts. e. Use tables to describe sequences recursively and with a formula in closed form. f. Understand and recognize arithmetic sequences as linear functions with whole number input values. g. Interpret the constant difference in an arithmetic sequence as the slope of the associated linear function. h. Identify relations and functions as linear or nonlinear. i. Translate among verbal, tabular, graphic, and algebraic representations of functions.
M8A4. Students will graph and analyze graphs of linear equations and inequalities. a. Interpret slope as a rate of change. b. Determine the meaning of the slope and y-intercept in a given situation. c. Graph equations of the form y = mx + b. d. Graph equations of the form ax + by = c. e. Graph the solution set of a linear inequality, identifying whether the solution set is an open or a closed half-plane. f. Determine the equation of a line given a graph, numerical information that defines the line or a context involving a linear relationship. g. Solve problems involving linear relationships.
M8A5. Students will understand systems of linear equations and inequalities and use them to solve problems.
a. Given a problem context, write an appropriate system of linear equations or inequalities. b. Solve systems of equations graphically and algebraically, using technology as appropriate. c. Graph the solution set of a system of linear inequalities in two variables. d. Interpret solutions in problem contexts.
DATA ANALYSIS AND PROBABILITY Students will use and understand set theory and simple counting techniques; determine the theoretical probability of simple events; and make inferences from data, particularly data that can be modeled by linear functions. M8D1. Students will apply basic concepts of set theory.
a. Demonstrate relationships among sets through use of Venn diagrams. b. Determine subsets, complements, intersection, and union of sets. c. Use set notation to denote elements of a set.
M8D2. Students will determine the number of outcomes related to a given event. a. Use tree diagrams to find the number of outcomes. b. Apply the addition and multiplication principles of counting.
M8D3. Students will use the basic laws of probability. a. Find the probability of simple independent events. b. Find the probability of compound independent events.
M8D4. Students will organize, interpret, and make inferences from statistical data a. Gather data that can be modeled with a linear function. b. Estimate and determine a line of best fit from a scatter plot.
6
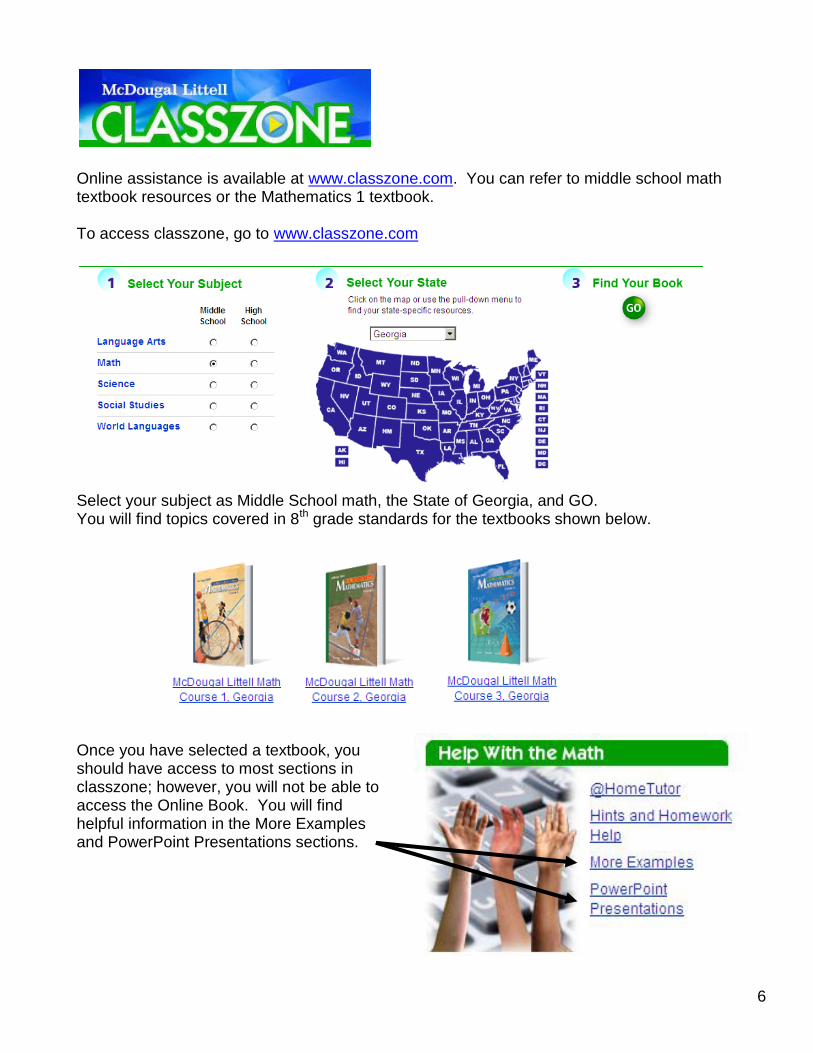
Online assistance is available at www.classzone.com. You can refer to middle school math textbook resources or the Mathematics 1 textbook. To access classzone, go to www.classzone.com
Select your subject as Middle School math, the State of Georgia, and GO. You will find topics covered in 8th grade standards for the textbooks shown below.
Once you have selected a textbook, you should have access to most sections in classzone; however, you will not be able to access the Online Book. You will find helpful information in the More Examples and PowerPoint Presentations sections.
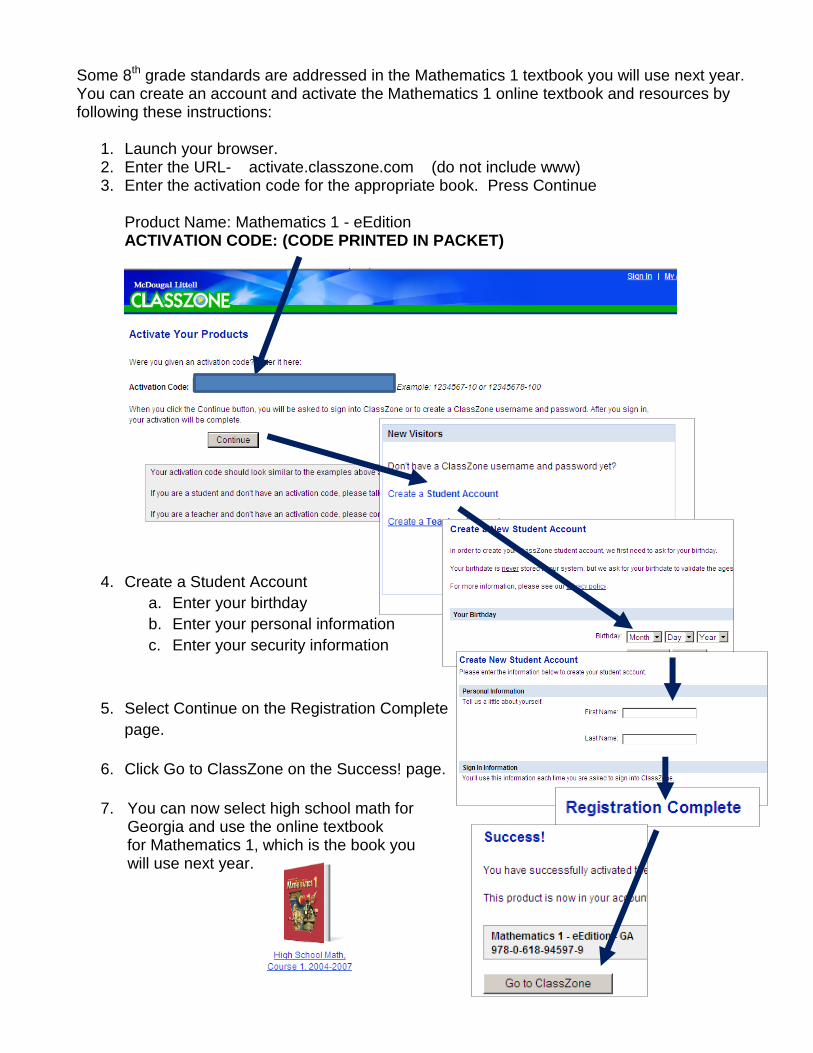
Some 8th grade standards are addressed in the Mathematics 1 textbook you will use next year. You can create an account and activate the Mathematics 1 online textbook and resources by following these instructions:
1. Launch your browser. 2. Enter the URL- activate.classzone.com (do not include www) 3. Enter the activation code for the appropriate book. Press Continue
Product Name: Mathematics 1 - eEdition ACTIVATION CODE: (CODE PRINTED IN PACKET)
4. Create a Student Account
a. Enter your birthday
b. Enter your personal information
c. Enter your security information
5. Select Continue on the Registration Complete
page.
6. Click Go to ClassZone on the Success! page.
7. You can now select high school math for Georgia and use the online textbook for Mathematics 1, which is the book you will use next year.
7
Basic Skills Review

8
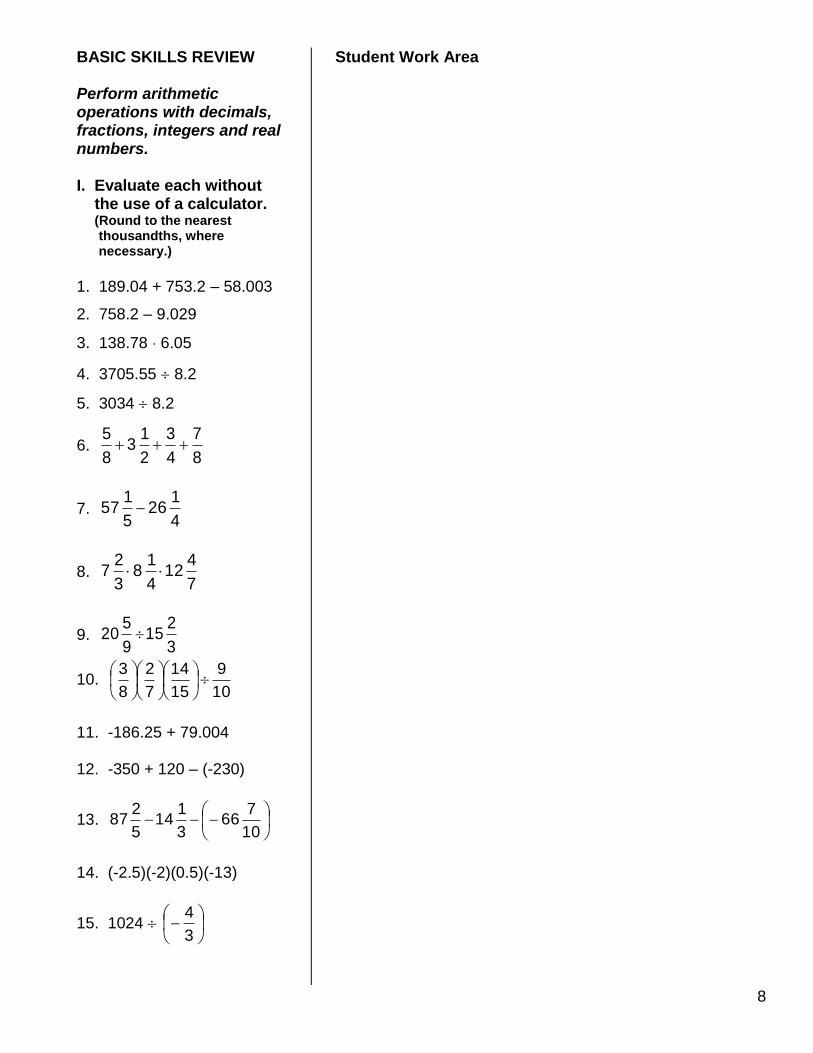
BASIC SKILLS REVIEW Perform arithmetic operations with decimals, fractions, integers and real numbers. I. Evaluate each without the use of a calculator. (Round to the nearest thousandths, where necessary.)
1. 189.04 + 753.2 – 58.003
2. 758.2 – 9.029
3. 138.78 6.05
4. 3705.55 8.2
5. 3034 8.2
6. 8
7
4
3
2
13
8
5
7. 4
126
5
157
8. 7
412
4
18
3
27
9. 3
215
9
520
10. 10
9
15
14
7
2
8
3
11. -186.25 + 79.004 12. -350 + 120 – (-230)
13.
10
766
3
114
5
287
14. (-2.5)(-2)(0.5)(-13)
15. 1024
3
4
Student Work Area

9
GPS Review

10
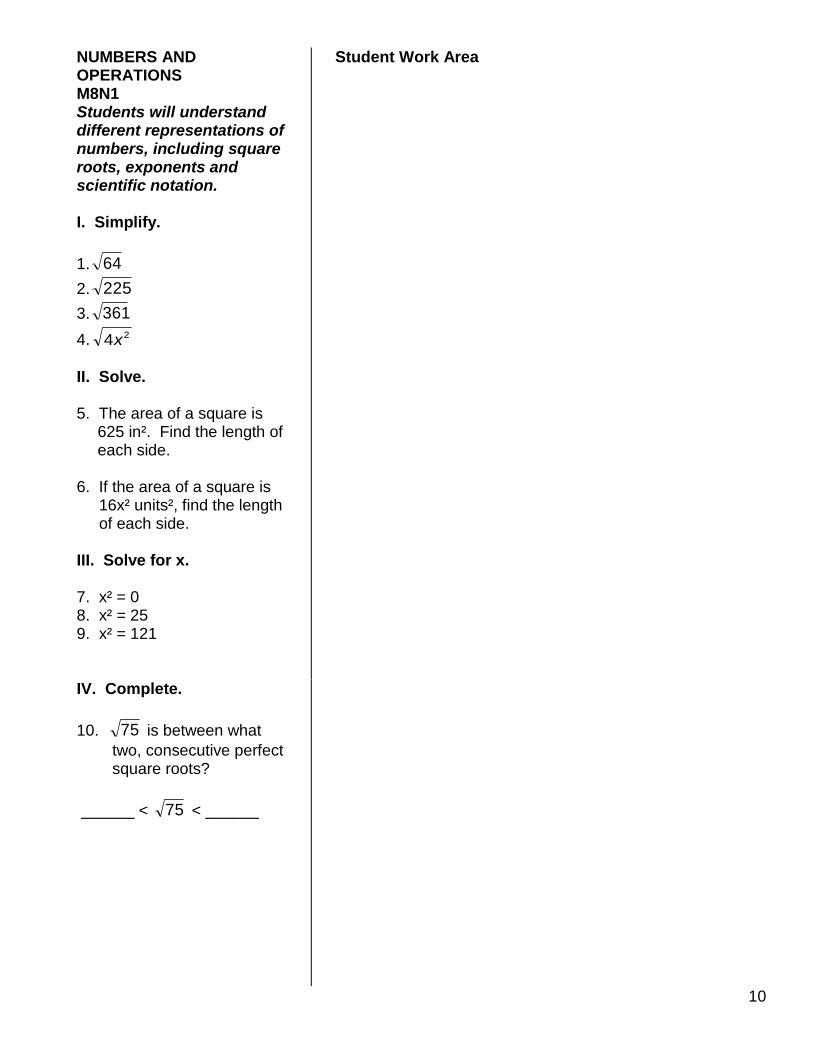
NUMBERS AND OPERATIONS M8N1 Students will understand different representations of numbers, including square roots, exponents and scientific notation. I. Simplify.
1. 64
2. 225
3. 361
4. 24x
II. Solve. 5. The area of a square is
625 in². Find the length of each side.
6. If the area of a square is 16x² units², find the length of each side. III. Solve for x. 7. x² = 0 8. x² = 25 9. x² = 121
Student Work Area
IV. Complete.
10. 75 is between what
two, consecutive perfect square roots?
______ < 75 < ______
11
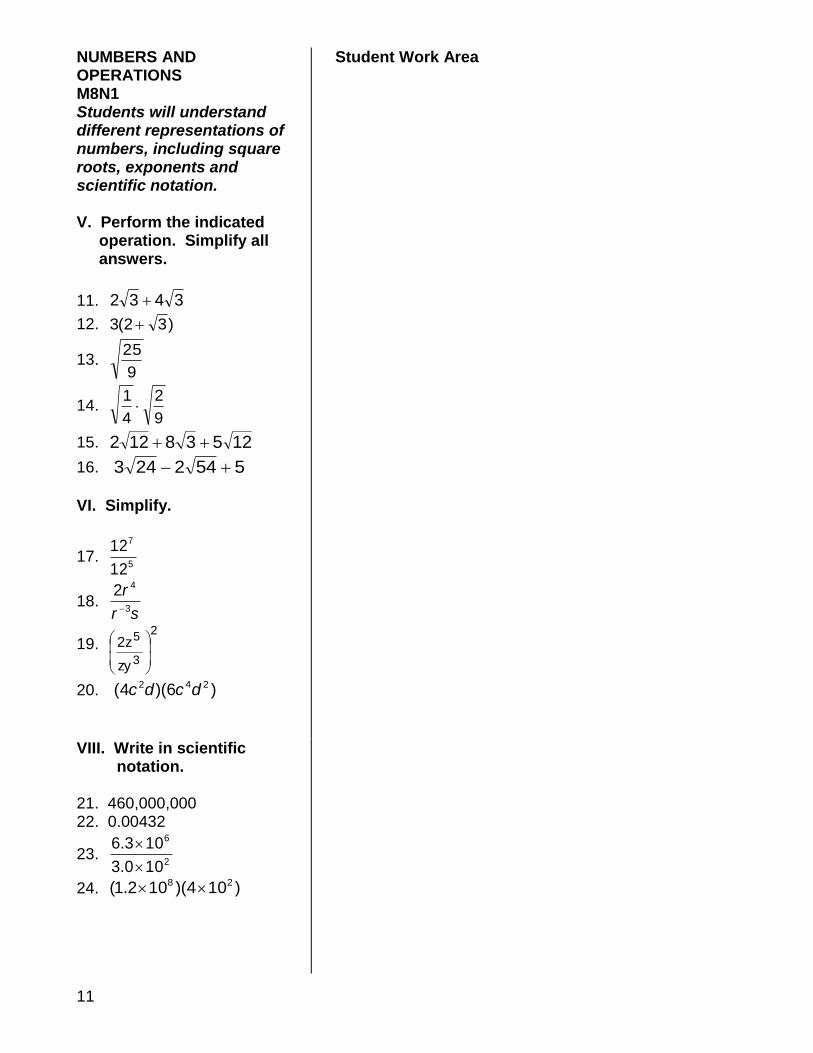
NUMBERS AND OPERATIONS M8N1 Students will understand different representations of numbers, including square roots, exponents and scientific notation. V. Perform the indicated operation. Simplify all answers.
11. 3432
12. )32(3
13. 9
25
14. 9
2
4
1
15. 12538122
16. 5542243
VI. Simplify.
17. 5
7
12
12
18. sr
r3
42
19. 2
3
5
zy
z2
20. )6)(4( 242 dcdc
Student Work Area
VIII. Write in scientific notation. 21. 460,000,000 22. 0.00432
23. 2
6
100.3
103.6
24. )104)(102.1( 28
12
m1
m2
(2x + 4)o
(3x – 9)o
m1
m2
(2x + 4)o
(3x – 9)o
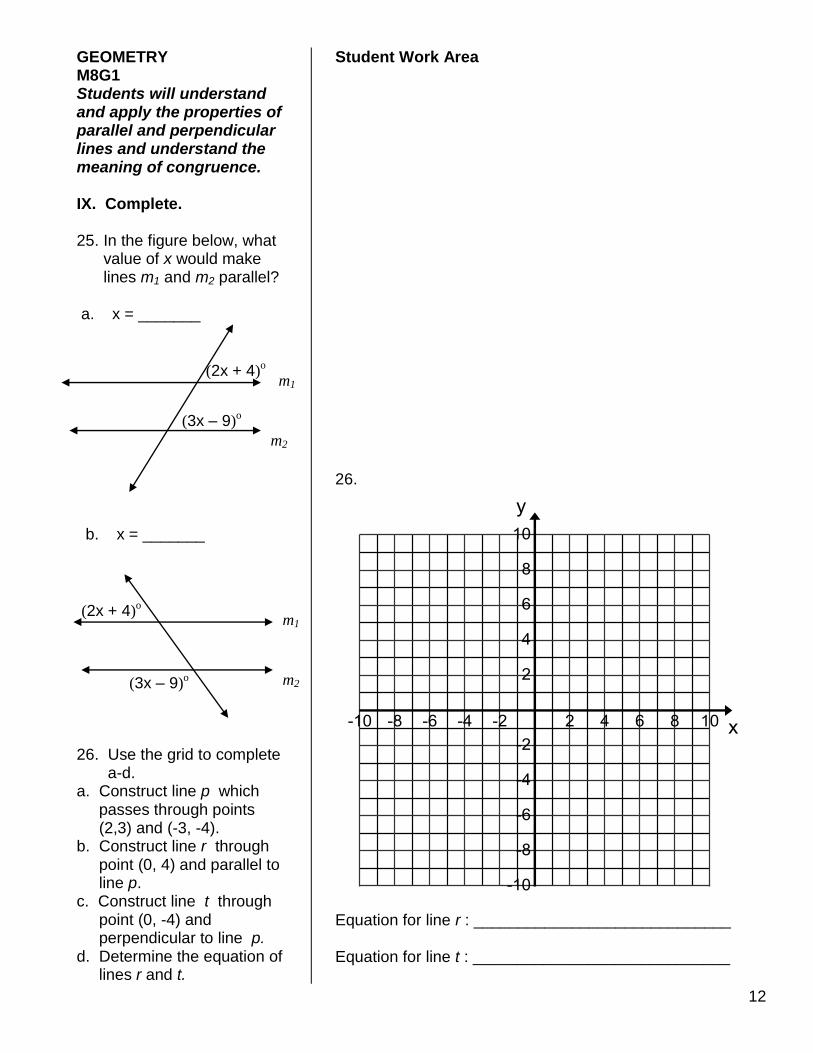
GEOMETRY M8G1 Students will understand and apply the properties of parallel and perpendicular lines and understand the meaning of congruence. IX. Complete. 25. In the figure below, what value of x would make lines m1 and m2 parallel? a. x = _______ b. x = _______ 26. Use the grid to complete a-d. a. Construct line p which passes through points (2,3) and (-3, -4). b. Construct line r through point (0, 4) and parallel to line p. c. Construct line t through point (0, -4) and perpendicular to line p. d. Determine the equation of lines r and t.
Student Work Area 26.
Equation for line r : _____________________________ Equation for line t : _____________________________
13
n p
8
20
x 15
m
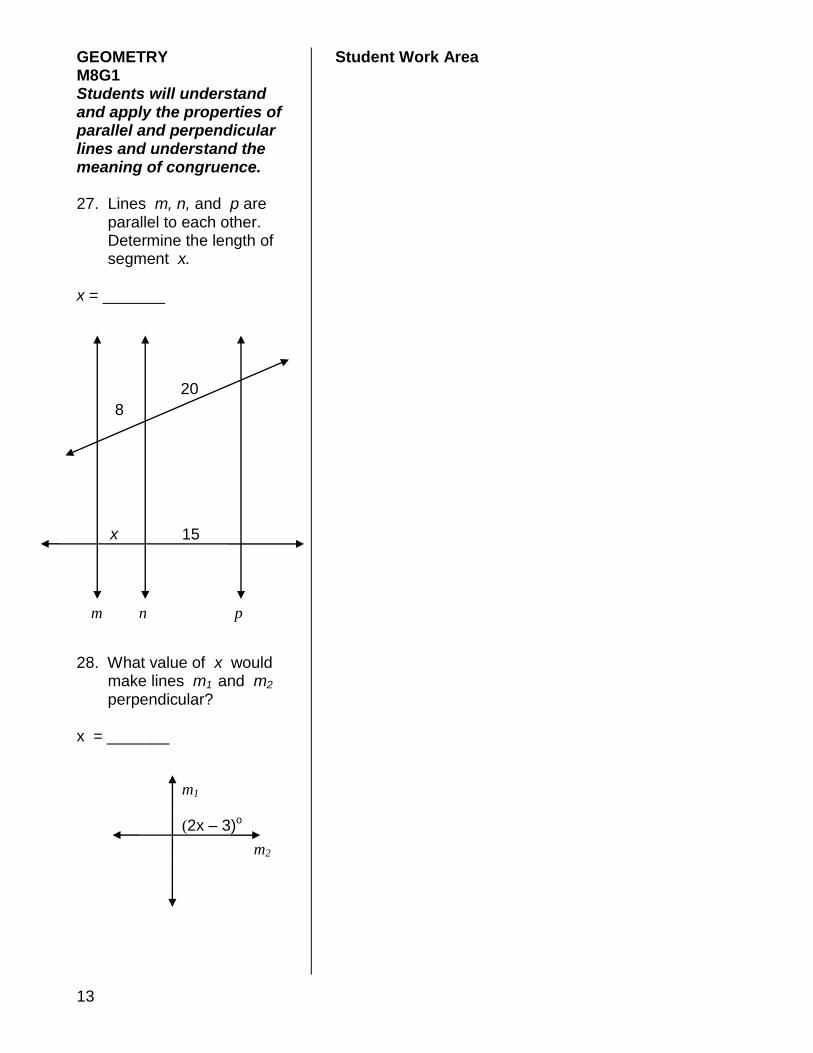
GEOMETRY M8G1 Students will understand and apply the properties of parallel and perpendicular lines and understand the meaning of congruence. 27. Lines m, n, and p are parallel to each other. Determine the length of segment x. x = _______
28. What value of x would make lines m1 and m2 perpendicular?
x = _______
Student Work Area
(2x – 3)o
m1
m2
14
m1 m2
1 2
3 4
5 6
8 7
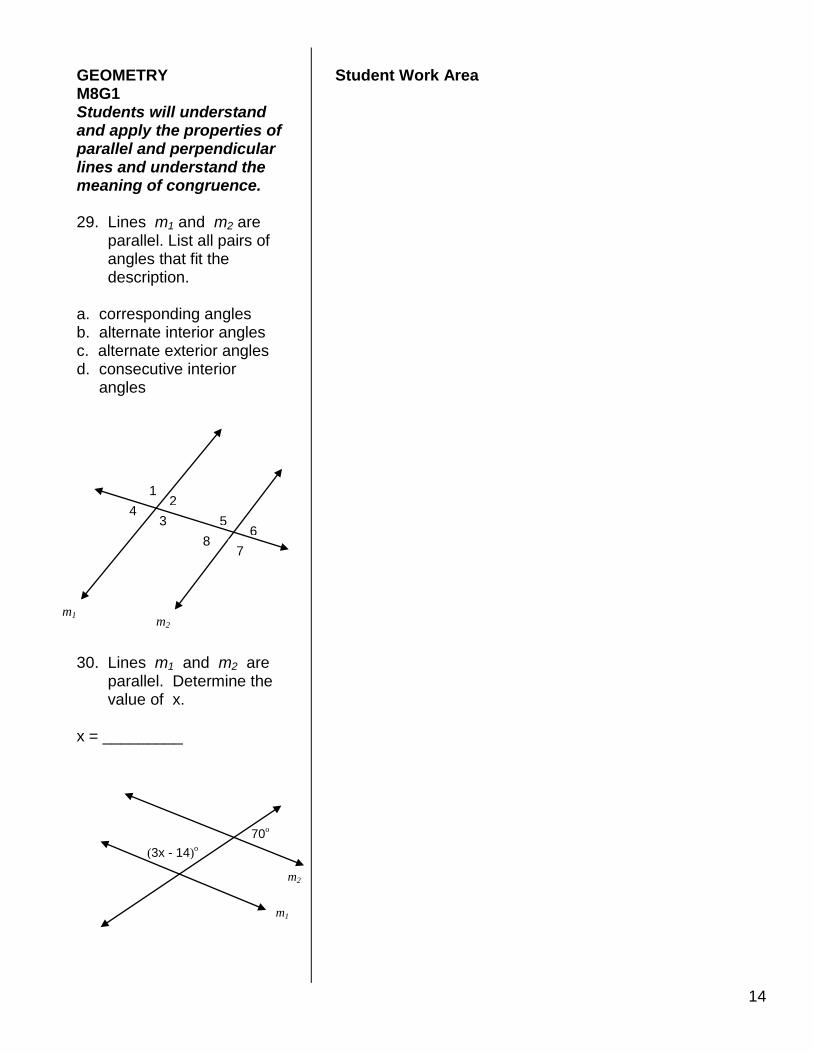
GEOMETRY M8G1 Students will understand and apply the properties of parallel and perpendicular lines and understand the meaning of congruence. 29. Lines m1 and m2 are parallel. List all pairs of angles that fit the description.
a. corresponding angles b. alternate interior angles c. alternate exterior angles d. consecutive interior angles
30. Lines m1 and m2 are parallel. Determine the value of x. x = _________
Student Work Area
m1
m2
(3x - 14)o
70o
15
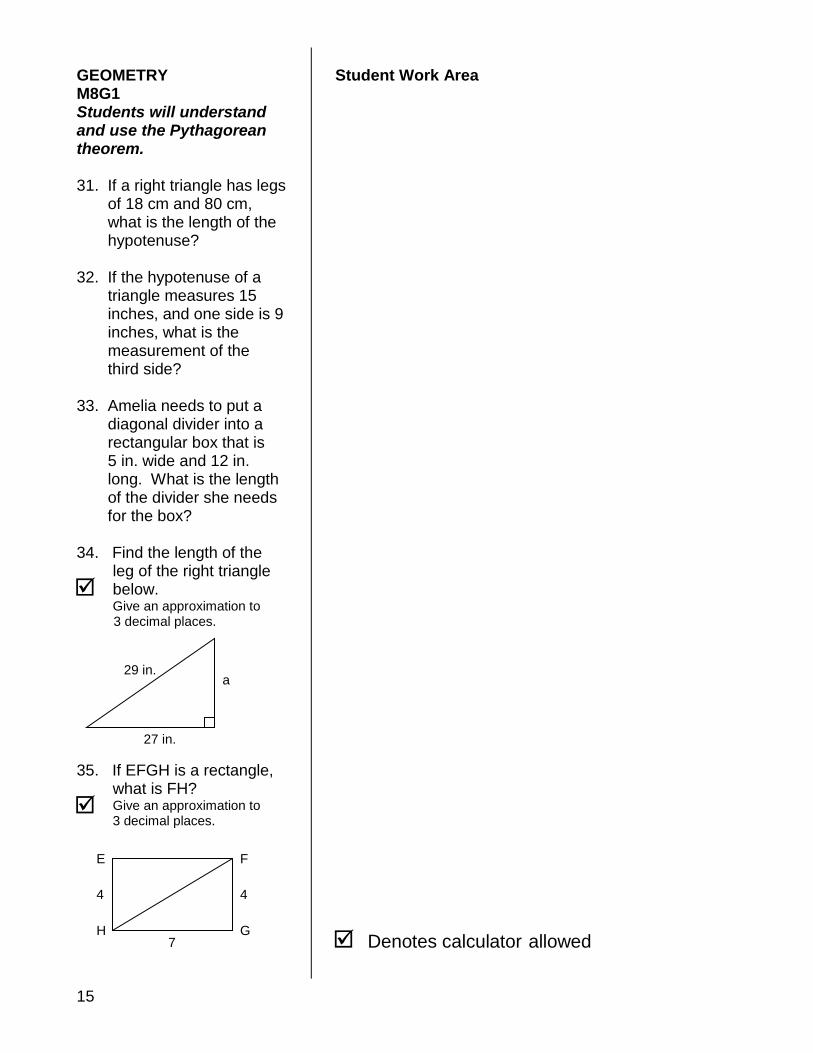
GEOMETRY M8G1 Students will understand and use the Pythagorean theorem. 31. If a right triangle has legs of 18 cm and 80 cm, what is the length of the hypotenuse? 32. If the hypotenuse of a triangle measures 15 inches, and one side is 9 inches, what is the measurement of the third side? 33. Amelia needs to put a diagonal divider into a rectangular box that is 5 in. wide and 12 in. long. What is the length of the divider she needs for the box? 34. Find the length of the
leg of the right triangle below. Give an approximation to
3 decimal places.
35. If EFGH is a rectangle,
what is FH? Give an approximation to 3 decimal places.
Student Work Area
29 in. a
27 in.
4
F
7
E
G H
4
Denotes calculator allowed
16
ALGEBRA M8A1 Students will use algebra to represent, analyze, and solve problems.
36. Judy bought p pencils at 14 cents each and n notebooks at $1.25 each. Write an equation for the total dollar amount, A, that Judy spent.
37. Write an expression to show how many fish are left if 20 are caught out of a school that started with f fish.
38. Simplify: (2x + 3y) – (5x – y) + 8x
39. Evaluate 5a – 2b if a = 4 and b = -1.
40. Solve: 3v + 9 = 2(4 - v) + 12v
41. Solve: | 2x + 6 | = 10
42. Rewrite the equation to isolate m: y = mx + b
43. The formula for the area of a trapezoid is: A = 0.5(b1 + b2) ∙ h If the area is 20 and the height is 2, what is the sum of the bases?
44. A taxi charges $1.00 for the first mile and $0.50 for each additional quarter mile. If the total fare was $6.00, how many miles were driven?
45. Find 3 weight combinations of peanuts and raisins that would total exactly 500 calories if peanuts have 6 calories per gram and raisins have 4 calories per gram.
Student Work Area
17
ALGEBRA M8A2 Students will understand and graph inequalities in one variable.
46. Solve: 3x + 2 -2x + 7
47. Solve: 7
x 2
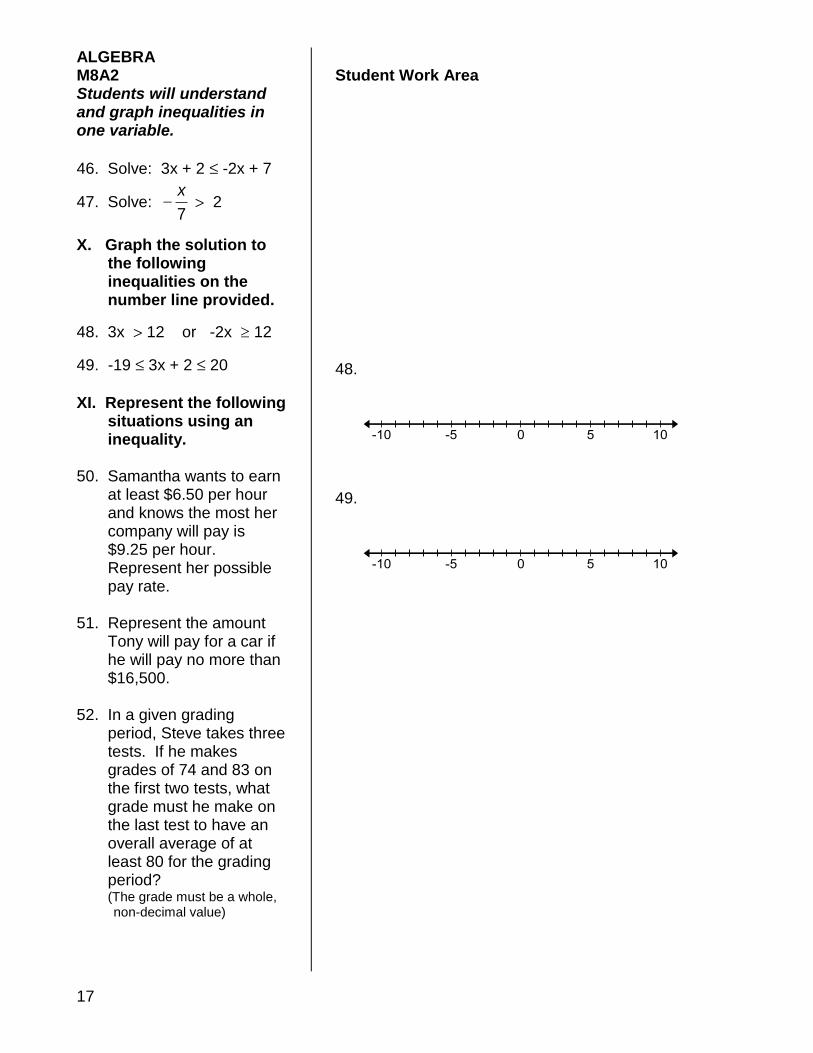
X. Graph the solution to the following inequalities on the number line provided.
48. 3x 12 or -2x 12
49. -19 3x + 2 20
XI. Represent the following situations using an inequality. 50. Samantha wants to earn at least $6.50 per hour and knows the most her company will pay is $9.25 per hour. Represent her possible pay rate. 51. Represent the amount Tony will pay for a car if he will pay no more than $16,500. 52. In a given grading period, Steve takes three tests. If he makes grades of 74 and 83 on the first two tests, what grade must he make on the last test to have an overall average of at least 80 for the grading period? (The grade must be a whole, non-decimal value)
Student Work Area 48.
49.
18
ALGEBRA M8A3 – M8A4 Students will understand relations and linear functions. Students will graph and analyze graphs of linear equations.
XII. Complete.
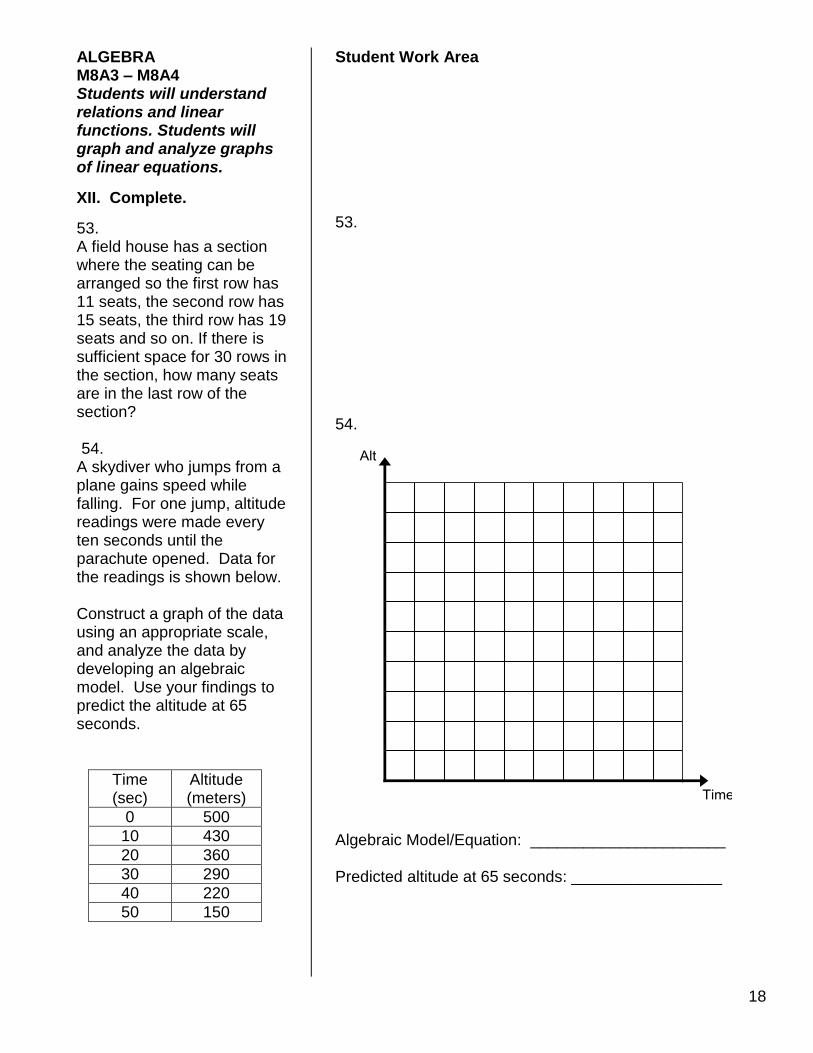
53. A field house has a section where the seating can be arranged so the first row has 11 seats, the second row has 15 seats, the third row has 19 seats and so on. If there is sufficient space for 30 rows in the section, how many seats are in the last row of the section? 54.
A skydiver who jumps from a plane gains speed while falling. For one jump, altitude readings were made every ten seconds until the parachute opened. Data for the readings is shown below. Construct a graph of the data using an appropriate scale, and analyze the data by developing an algebraic model. Use your findings to predict the altitude at 65 seconds.
Time (sec)
Altitude (meters)
0 500
10 430
20 360
30 290
40 220
50 150
Student Work Area 53. 54.
Algebraic Model/Equation: ______________________ Predicted altitude at 65 seconds: _________________
19
ALGEBRA M8A3 – M8A4 Students will understand relations and linear functions. Students will graph and analyze graphs of linear equations. 55. Find the slope of the line passing through the points (1, -3) and (0, -5). 56. Find the slope and y-intercept of the line y = -2x – 1 57. Find the x-intercept and y-intercept of the line 2x + 6y = 18. 58. Change -2x + 7y = -8 into the slope-intercept form of a line. XIII. Graph each of the following on the coordinate grid provided. 59. Graph a line that passes through the point (3, 5) and has a slope of zero. 60. Graph a line that passes through the point (-4, 0) and has an undefined slope. 61. Graph: y = 2x – 1 62. Graph: x – 4y = 12 63. Graph: x = 3
64. Graph: x + y = -1
Student Work Area 59. 60.
61. 62.
63. 64.
20
ALGEBRA M8A5 Students will understand systems of linear equations and inequalities and use them to solve problems. XIV. Solve the following systems of equations. 65. x + 2y = 11 x – 2y = -1 66. 7x – 4y = 17 3x + 5y = 14 67. x + y = 5 3x – 2y = 20 68.
You are planning a birthday party for your younger brother at a skating rink. The cost of admission is $4.00 per adult and $2.00 per child, and there is a limit of 25 people. You have $60 to spend for the tickets. Determine how many adults and how many children you can invite. Choose the most appropriate algebraic method to solve this problem. Variables should be chosen and labeled. Be sure to put your solutions in written form and include a graph in your solution response.
Student Work Area 68. Assigned variables: Algebraic analysis and solution:
Graphic analysis and solution:
Solution summary:
21
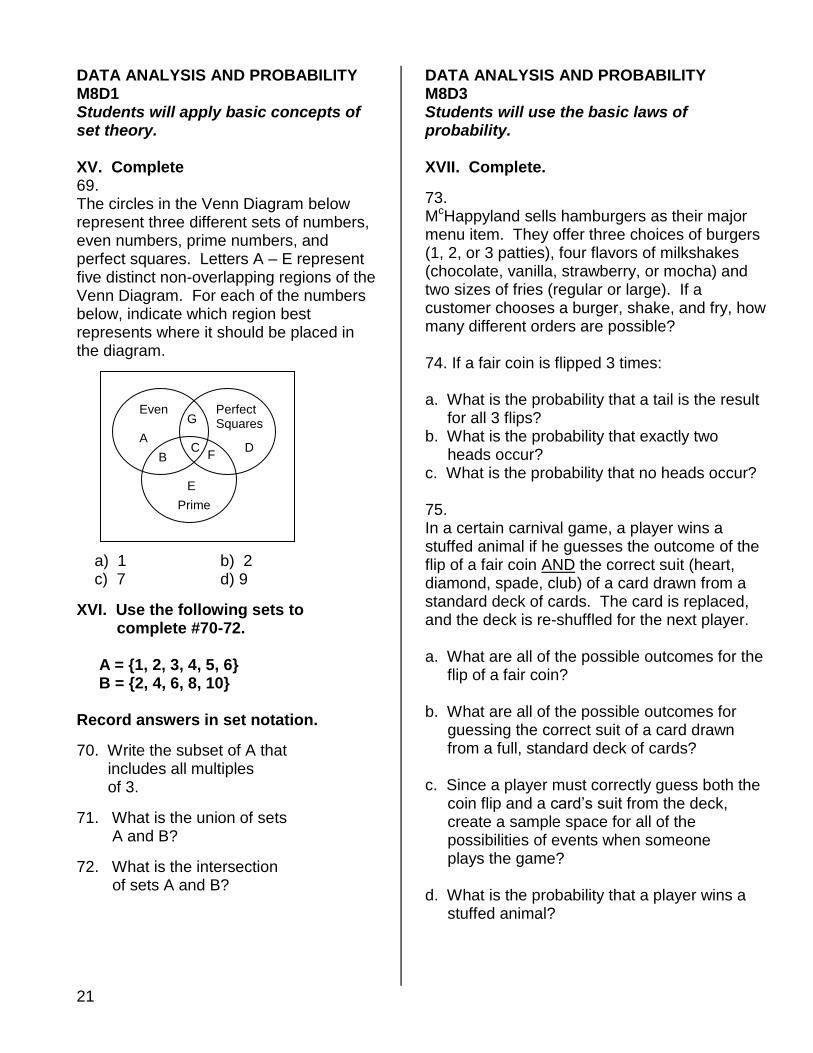
DATA ANALYSIS AND PROBABILITY M8D1 Students will apply basic concepts of set theory. XV. Complete 69. The circles in the Venn Diagram below represent three different sets of numbers, even numbers, prime numbers, and perfect squares. Letters A – E represent five distinct non-overlapping regions of the Venn Diagram. For each of the numbers below, indicate which region best represents where it should be placed in the diagram.
a) 1 b) 2 c) 7 d) 9
XVI. Use the following sets to complete #70-72. A = {1, 2, 3, 4, 5, 6} B = {2, 4, 6, 8, 10} Record answers in set notation.
70. Write the subset of A that includes all multiples of 3.
71. What is the union of sets A and B?
72. What is the intersection of sets A and B?
DATA ANALYSIS AND PROBABILITY M8D3 Students will use the basic laws of probability. XVII. Complete.
73. McHappyland sells hamburgers as their major menu item. They offer three choices of burgers (1, 2, or 3 patties), four flavors of milkshakes (chocolate, vanilla, strawberry, or mocha) and two sizes of fries (regular or large). If a customer chooses a burger, shake, and fry, how many different orders are possible? 74. If a fair coin is flipped 3 times: a. What is the probability that a tail is the result for all 3 flips? b. What is the probability that exactly two heads occur? c. What is the probability that no heads occur? 75. In a certain carnival game, a player wins a stuffed animal if he guesses the outcome of the flip of a fair coin AND the correct suit (heart, diamond, spade, club) of a card drawn from a standard deck of cards. The card is replaced, and the deck is re-shuffled for the next player. a. What are all of the possible outcomes for the flip of a fair coin? b. What are all of the possible outcomes for guessing the correct suit of a card drawn from a full, standard deck of cards? c. Since a player must correctly guess both the coin flip and a card’s suit from the deck, create a sample space for all of the possibilities of events when someone plays the game? d. What is the probability that a player wins a stuffed animal?
Even Perfect Squares
Prime
A
B C D
E
G
F
22
GPS Performance Task
Name: __________________________

23
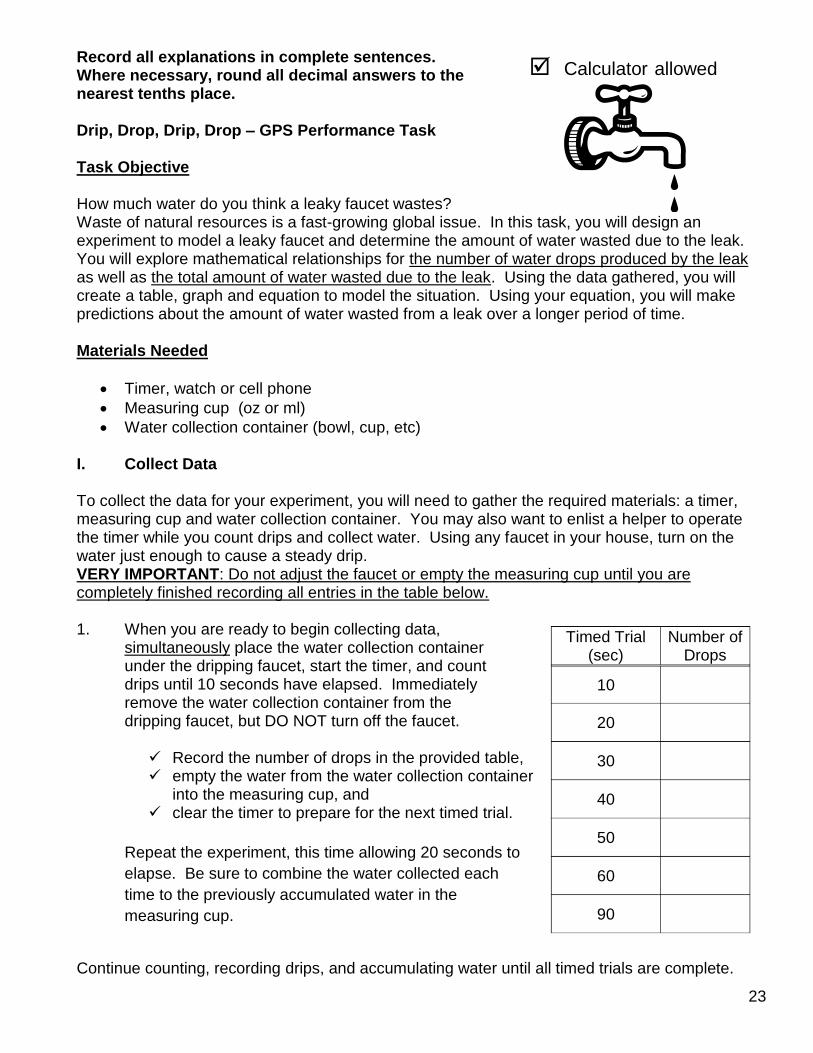
Record all explanations in complete sentences. Where necessary, round all decimal answers to the nearest tenths place. Drip, Drop, Drip, Drop – GPS Performance Task Task Objective How much water do you think a leaky faucet wastes? Waste of natural resources is a fast-growing global issue. In this task, you will design an experiment to model a leaky faucet and determine the amount of water wasted due to the leak. You will explore mathematical relationships for the number of water drops produced by the leak as well as the total amount of water wasted due to the leak. Using the data gathered, you will create a table, graph and equation to model the situation. Using your equation, you will make predictions about the amount of water wasted from a leak over a longer period of time. Materials Needed
Timer, watch or cell phone
Measuring cup (oz or ml)
Water collection container (bowl, cup, etc) I. Collect Data To collect the data for your experiment, you will need to gather the required materials: a timer, measuring cup and water collection container. You may also want to enlist a helper to operate the timer while you count drips and collect water. Using any faucet in your house, turn on the water just enough to cause a steady drip. VERY IMPORTANT: Do not adjust the faucet or empty the measuring cup until you are completely finished recording all entries in the table below. 1. When you are ready to begin collecting data,
simultaneously place the water collection container under the dripping faucet, start the timer, and count drips until 10 seconds have elapsed. Immediately remove the water collection container from the dripping faucet, but DO NOT turn off the faucet.
Record the number of drops in the provided table, empty the water from the water collection container
into the measuring cup, and clear the timer to prepare for the next timed trial.
Repeat the experiment, this time allowing 20 seconds to
elapse. Be sure to combine the water collected each
time to the previously accumulated water in the
measuring cup.
Continue counting, recording drips, and accumulating water until all timed trials are complete.
Calculator allowed
Timed Trial (sec)
Number of Drops
10
20
30
40
50
60
90
24
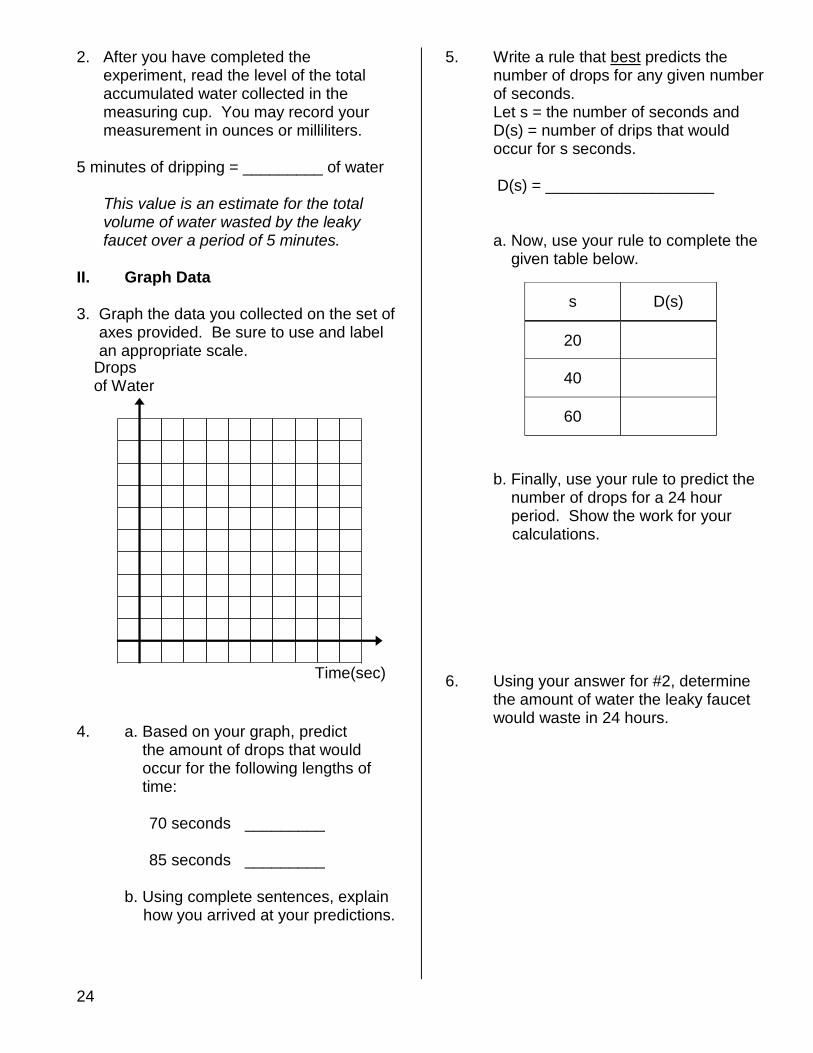
2. After you have completed the experiment, read the level of the total accumulated water collected in the measuring cup. You may record your measurement in ounces or milliliters. 5 minutes of dripping = _________ of water This value is an estimate for the total volume of water wasted by the leaky faucet over a period of 5 minutes.
II. Graph Data 3. Graph the data you collected on the set of axes provided. Be sure to use and label an appropriate scale.
4. a. Based on your graph, predict the amount of drops that would occur for the following lengths of
time:
70 seconds _________
85 seconds _________ b. Using complete sentences, explain how you arrived at your predictions.
5. Write a rule that best predicts the number of drops for any given number of seconds. Let s = the number of seconds and D(s) = number of drips that would occur for s seconds.
D(s) = ___________________
a. Now, use your rule to complete the given table below.
b. Finally, use your rule to predict the number of drops for a 24 hour period. Show the work for your
calculations. 6. Using your answer for #2, determine
the amount of water the leaky faucet would waste in 24 hours.
Time(sec)
Drops of Water
s D(s)
20
40
60
25
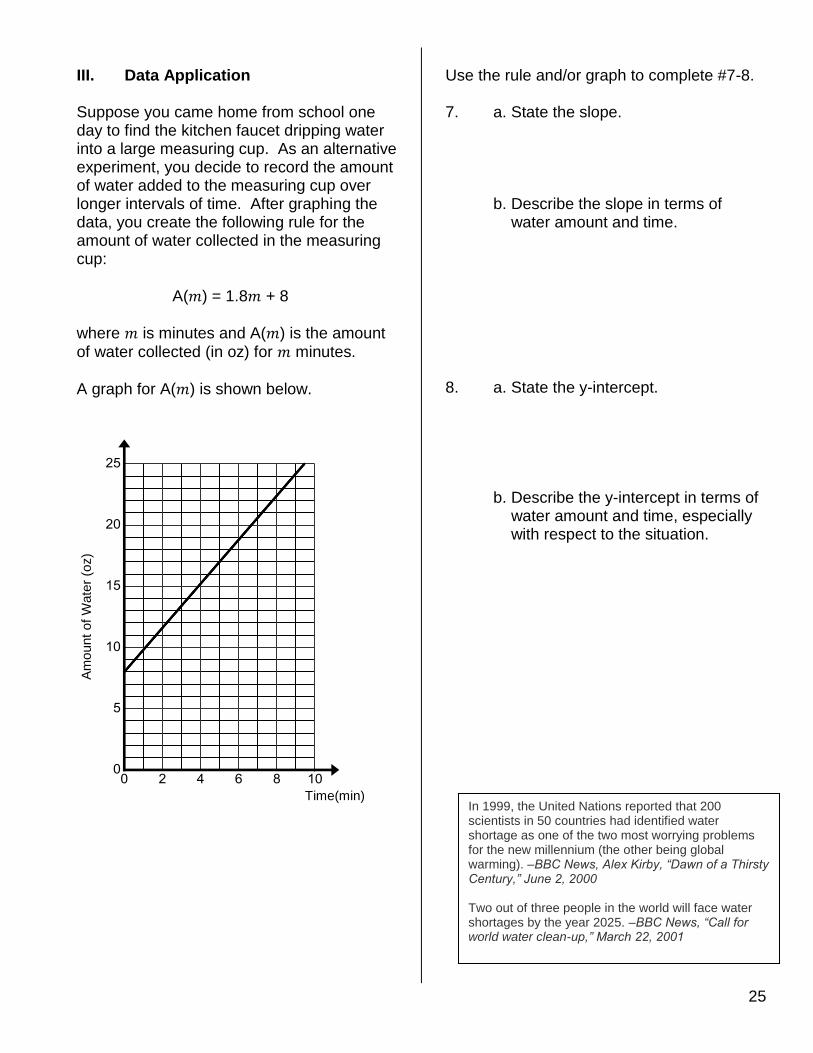
III. Data Application Suppose you came home from school one day to find the kitchen faucet dripping water into a large measuring cup. As an alternative experiment, you decide to record the amount of water added to the measuring cup over longer intervals of time. After graphing the data, you create the following rule for the amount of water collected in the measuring cup:
A( ) = 1.8 + 8
where is minutes and A( ) is the amount
of water collected (in oz) for minutes.
A graph for A( ) is shown below.
Use the rule and/or graph to complete #7-8. 7. a. State the slope.
b. Describe the slope in terms of water amount and time.
8. a. State the y-intercept. b. Describe the y-intercept in terms of water amount and time, especially
with respect to the situation.
In 1999, the United Nations reported that 200 scientists in 50 countries had identified water shortage as one of the two most worrying problems for the new millennium (the other being global warming). –BBC News, Alex Kirby, “Dawn of a Thirsty Century,” June 2, 2000 Two out of three people in the world will face water shortages by the year 2025. –BBC News, “Call for world water clean-up,” March 22, 2001
If all the world's water were fit into a
gallon jug, the fresh water available
for us to use would equal only about
one tablespoon.
Over 90% of the world's supply of
fresh water is located in Antarctica.
Time(min)
Am
ount
of
Wate
r (o
z)
26
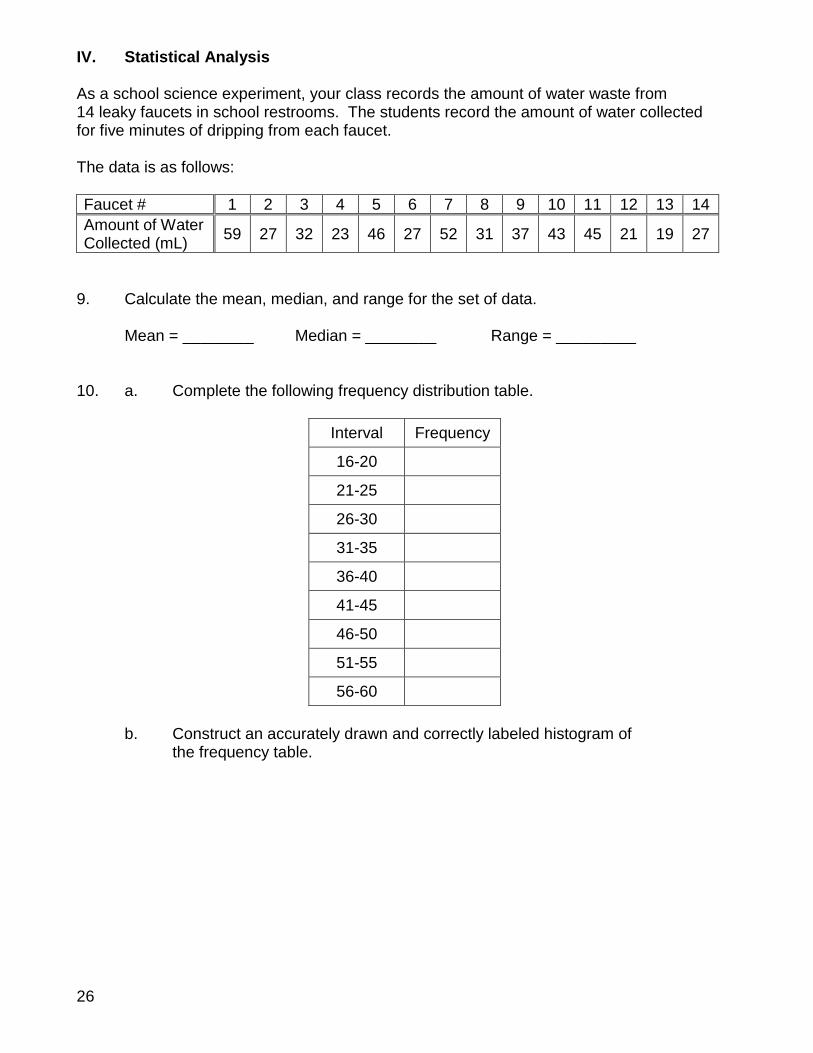
IV. Statistical Analysis As a school science experiment, your class records the amount of water waste from 14 leaky faucets in school restrooms. The students record the amount of water collected for five minutes of dripping from each faucet. The data is as follows:
Faucet # 1 2 3 4 5 6 7 8 9 10 11 12 13 14
Amount of Water Collected (mL)
59 27 32 23 46 27 52 31 37 43 45 21 19 27
9. Calculate the mean, median, and range for the set of data. Mean = ________ Median = ________ Range = _________ 10. a. Complete the following frequency distribution table.
Interval Frequency
16-20
21-25
26-30
31-35
36-40
41-45
46-50
51-55
56-60
b. Construct an accurately drawn and correctly labeled histogram of the frequency table.
27
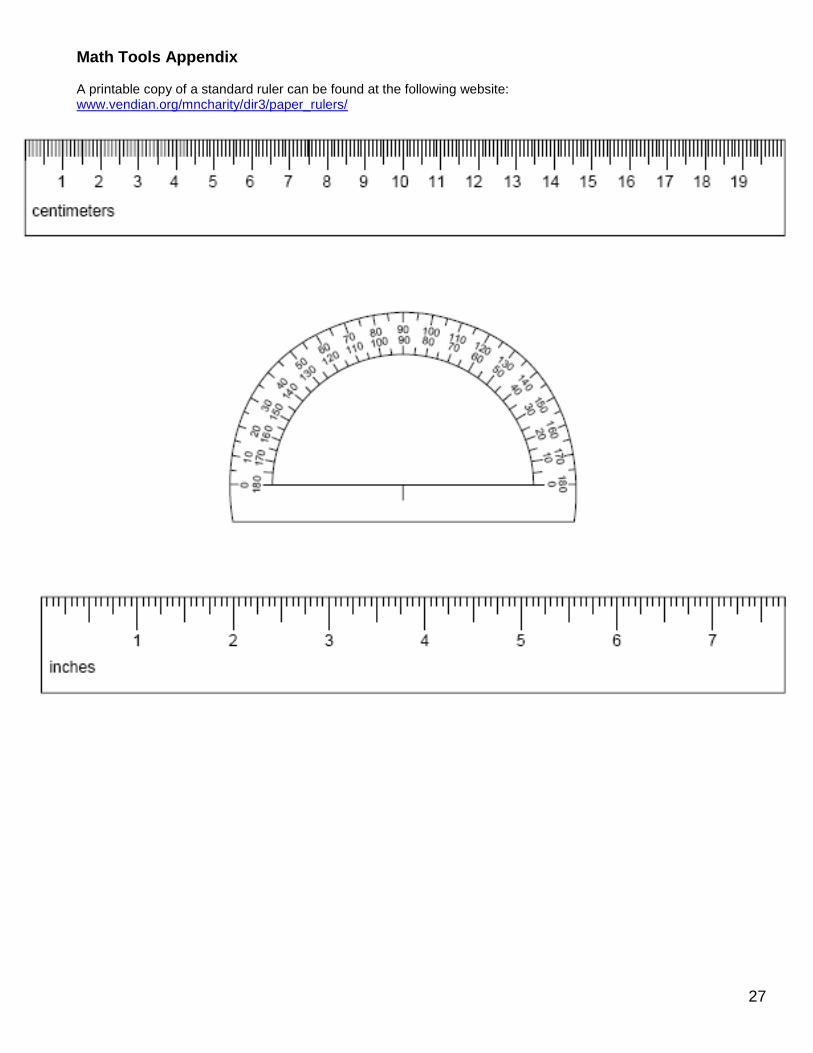
Math Tools Appendix A printable copy of a standard ruler can be found at the following website: www.vendian.org/mncharity/dir3/paper_rulers/

28
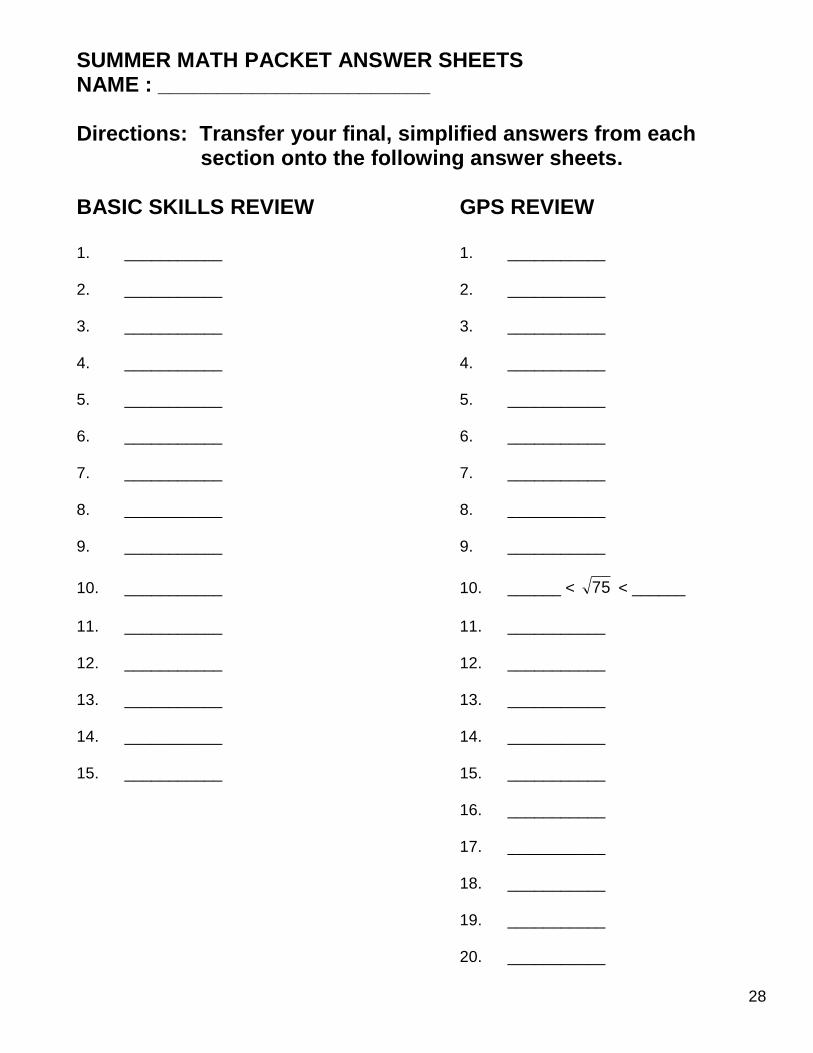
SUMMER MATH PACKET ANSWER SHEETS NAME : _______________________ Directions: Transfer your final, simplified answers from each section onto the following answer sheets. BASIC SKILLS REVIEW GPS REVIEW 1. ___________ 1. ___________
2. ___________ 2. ___________
3. ___________ 3. ___________
4. ___________ 4. ___________
5. ___________ 5. ___________
6. ___________ 6. ___________
7. ___________ 7. ___________
8. ___________ 8. ___________
9. ___________ 9. ___________
10. ___________ 10. ______ < 75 < ______
11. ___________ 11. ___________
12. ___________ 12. ___________
13. ___________ 13. ___________
14. ___________ 14. ___________
15. ___________ 15. ___________
16. ___________
17. ___________
18. ___________ 19. ___________ 20. ___________
29
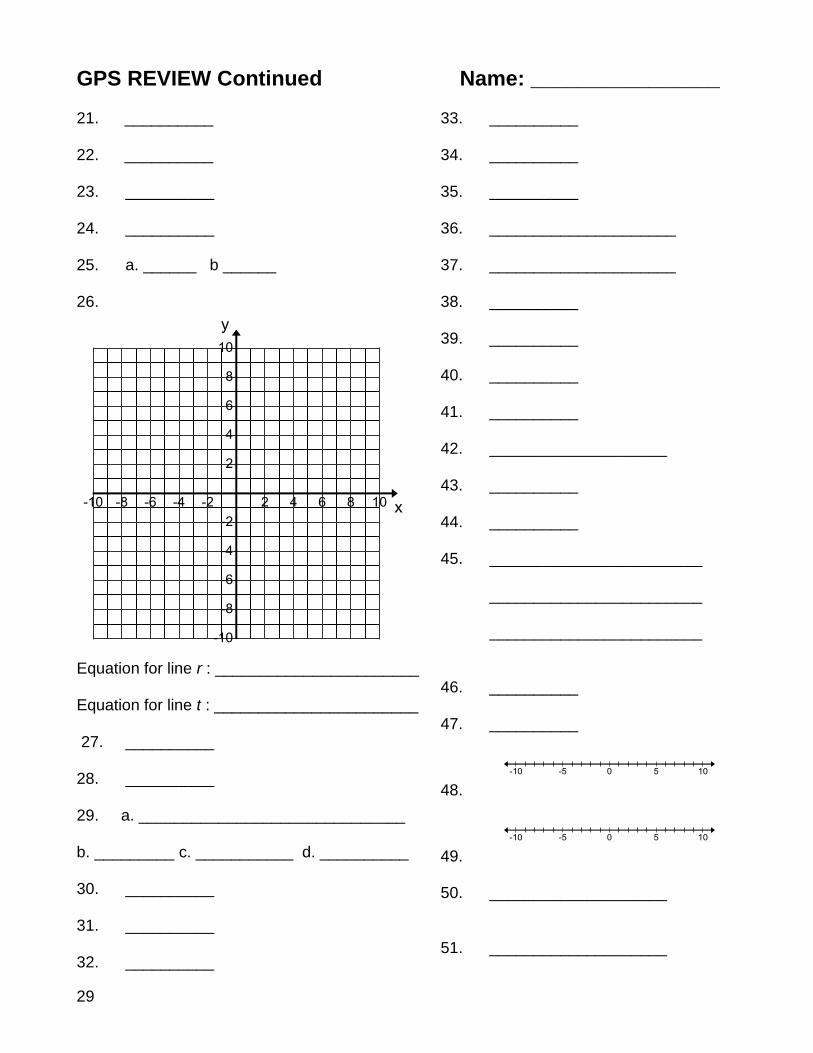
GPS REVIEW Continued Name: ________________ 21. __________ 22. __________ 23. __________ 24. __________ 25. a. ______ b ______ 26.
Equation for line r : _______________________ Equation for line t : _______________________ 27. __________ 28. __________ 29. a. ______________________________ b. _________ c. ___________ d. __________ 30. __________ 31. __________ 32. __________
33. __________ 34. __________ 35. __________ 36. _____________________ 37. _____________________ 38. __________ 39. __________ 40. __________ 41. __________ 42. ____________________ 43. __________ 44. __________ 45. ________________________ ________________________ ________________________ 46. __________ 47. __________
48.
49. 50. ____________________ 51. ____________________
30
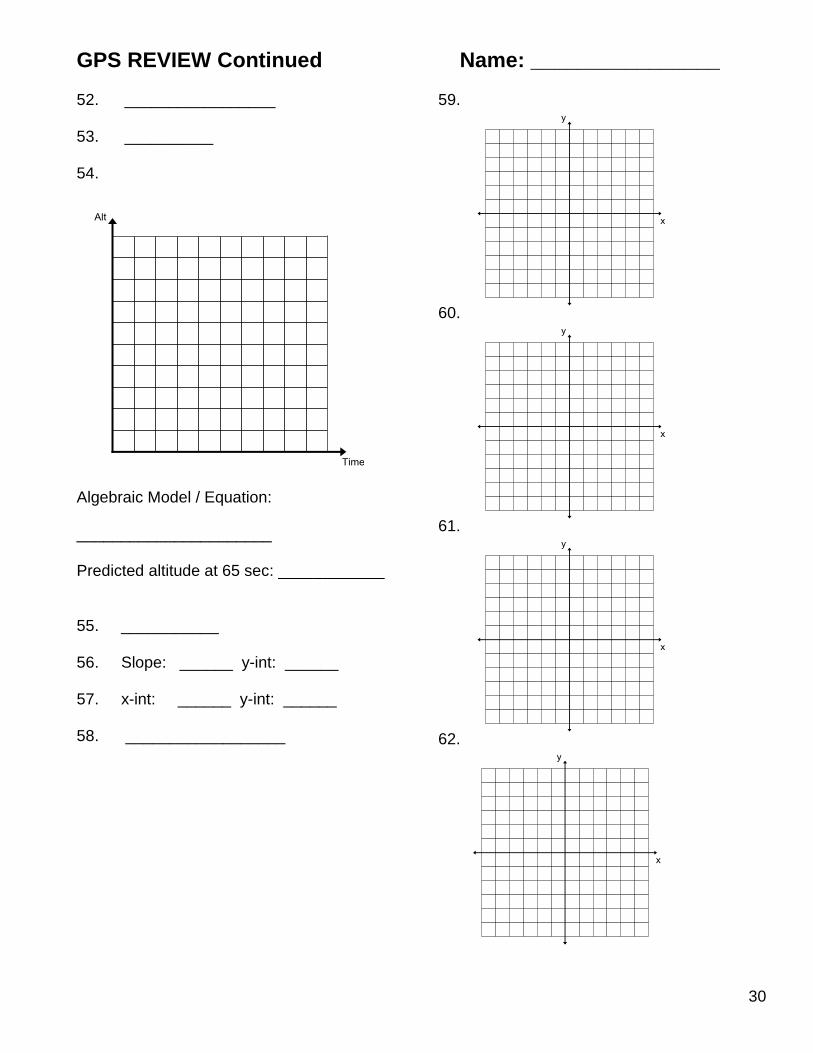
GPS REVIEW Continued Name: ________________ 52. _________________ 53. __________ 54.
Algebraic Model / Equation: ______________________ Predicted altitude at 65 sec: ____________ 55. ___________ 56. Slope: ______ y-int: ______ 57. x-int: ______ y-int: ______ 58. __________________
59.
60.
61.
62.
31
GPS REVIEW Continued Name: ________________ 63.
64.
65. x = _______ y = ______ 66. x = _______ y = ______ 67. x = _______ y = ______ 68. Assigned variables: Algebraic analysis and solution:
Graphic analysis and solution:
Solution summary: 69. a. ______ b. ______ c. ______ d. ______ 70. ___________________________ 71. ___________________________ 72. ___________________________ 73. ___________________________ 74. a. ________ 75. a. ________________ b. ________ b. ________________ c. ________ c. d. _________
If applicable,attach your TI Calculator Rewards
HERE
(Write your first initial and last
name on the back, in pencil)
Sampl