Embed Size (px)
Citation preview
New Zealand Health Technology Assessment (NZHTA)THE CLEARING HOUSE FOR HEALTH OUTCOMES AND HEALTH TECHNOLOGY ASSESSMENT
Department of Public Health and General PracticeChristchurch School of MedicineChristchurch, N.Z.
Colour vision screening
A critical appraisal of the literature
NZHTA REPORT 7October 1998

1998 New Zealand Health Technology Assessment Clearing House (NZHTA)
ISBN 0-9583742-8-7ISSN 1174-5142
COLOUR VISION SCREENING
i
ACKNOWLEDGEMENTS
This report was developed by the staff of NZHTA. It was prepared by Dr Robert Weir (Researcher)and supported by Dr Ray Kirk (Director), Mrs Susan Bidwell (Information Specialist), Dr Phil Hider(Researcher), Dr Lynley Cook (Researcher) and Ms Cecilia Tolan (Administrator). Additionaladministrative assistance was provided by Mrs Joan Downey and Miss Becky Mogridge.
We are grateful for the editorial review by Dr Mark Elder (Senior Lecturer, Ophthalmologist,Christchurch Hospital) and Mrs Sue Allison (Journalist, Christchurch).
Ms Lorraine MacLeod (Co-ordinator, Vision and Hearing Testing, Burwood Hospital, Christchurch)reviewed and provided helpful comments on the report.
The Canterbury Medical Library provided invaluable assistance with the retrieval of articles used inthis report.
NZHTA is a Research Unit of the University of Otago and funded under contract by the HealthFunding Authority and the Ministry of Health.
DISCLAIMER
NZHTA takes great care to ensure the information supplied within the project timeframe is accurate,but neither NZHTA nor the University of Otago can accept responsibility for any errors or omissions.The reader should always consult the original database from which each abstract is derived along withthe original articles before making decisions based on a document or abstract. All responsibility foraction based on any information in this report rests with the reader. NZHTA and the University ofOtago accept no liability for any loss of whatever kind, or damage, arising from reliance in whole orpart, by any person, corporate or natural, on the contents of this report. This document is not intendedto be used as personal health advice. People seeking individual medical advice are referred to theirphysician. The views expressed in this report are those of NZHTA and do not necessarily representthose of the University of Otago, New Zealand Ministry of Health or the Health Funding Authority.
CONTACT DETAILS
New Zealand Health Technology AssessmentThe Clearing House for Health Outcomes and Health Technology AssessmentDepartment of Public Health and General PracticeChristchurch School of MedicineP O Box 4345ChristchurchNew ZealandTel: +64 3 364 1152 Fax: +64 3 364 1152
E-mail: [email protected]
Web Site: http://nzhta.chmeds.ac.nz/
COLOUR VISION SCREENING
ii
EXECUTIVE SUMMARY
Objectives
A literature review and critical appraisal was performed to provide an evidence-based reviewevaluating colour vision screening through the use of recognised screening criteria.
Data sources
The search was restricted to English and European languages. There was no restriction by the date ofpublication of the retrieved studies or the study design used.
Study selection
Studies were selected and articles were appraised if they examined data relating to the natural history,treatment, or prevalence of colour vision deficiencies or if they examined disabilities resulting fromimpaired colour vision, the validity of colour vision screening tests or colour vision screeningprogrammes.
Criteria for exclusion from appraisal were:
� participation rate <50%� sample size <25� significant difference in the baseline characteristics of cases and controls� lack of demographic details about the study participants� updated results published� papers for debate or editorials� abstract only
A single reviewer applied these criteria.
Sixty-one of 431 identified articles were eligible for selection after applying these exclusion criteria.
Data extraction
Critical appraisal forms standardised by study design were used to extract and appraise the literature.These forms were designed for use at Puget Sound, Seattle, USA (Group Health Cooperative of PugetSound, 1996) and adopted by the New Zealand Guidelines Group.
A single reviewer conducted the appraisal of studies.
The level of evidence was evaluated using the U.S. Preventive Services Task Force protocol (U.S.Preventive Services Task Force, 1989), (See p. 6).
Data synthesis
There were 20 studies identified that measured the prevalence of colour vision deficiencies. Pooleddata (weighted by sample size) suggested the prevalence of impaired colour vision in males was 7.3%.Two studies measured the prevalence in New Zealand males. Pooling this data and adjusting the ethnicmix to 1996 census data suggested a prevalence of 6%.
Six studies were identified that compared the rate of motor vehicle crashes in the impaired colourvision group with the normal colour vision group. In one of these six there was a significantly higherrate of accidents in the impaired colour vision group.
Five studies were identified that compared the performance between those with impaired and normalcolour vision for occupational performance. Those with impaired colour vision had inferiorperformance in air traffic control and sea search and rescue operations.

COLOUR VISION SCREENING
iii
Three studies evaluated educational performance and all three found no significant difference inperformance between those with impaired or normal colour vision.
There were 17 studies identified that evaluated the validity of various colour vision screening tests.Ishihara’s pseudoisochromatic test was not demonstrated to be inferior to any other screening test. Ithad 96% sensitivity and 98.5% specificity, on average, after excluding studies that included preschoolchildren. All screening tests evaluated appeared to have inferior performance in preschool childrenalthough this was not tested in a direct comparison.
There were three studies identified that evaluated aspects of colour vision screening programmes.These studies were insufficiently rigorous in design to allow an estimation of the effectiveness of theprogrammes surveyed.
Conclusions
The studies identified for critical appraisal had limitations that should be considered when interpretingthe following conclusions:
� There were no adequate treatment options for the correction of impaired colour vision on currentevidence.
� Of the approximately 7% of the male population with congenitally impaired colour visionapproximately 40% of that population appears to be unaware of the defect prior to leavingsecondary school.
� It was not possible to identify the impact colour vision screening has on reducing educational andoccupational difficulties or motor vehicle crash rates.
� There was insufficient evidence to either agree or disagree with the hypothesis that those withimpaired colour vision have more road traffic crashes.
� Further research was required to assess the role impaired colour vision has on educationalattainment.
� Those involved in air traffic control and sea search and rescue operations should have normalcolour vision. Research on other occupations, which normally restrict those with impaired colourvision, was not identified in this report but it should not be assumed that such restrictions areunnecessary.
� There was insufficient evidence for the use of colour vision screening as a method of firstdetection of an adverse health outcome other than impaired colour vision.
� There was currently insufficient evidence to recommend a change in the colour vision screeningtest currently in use within New Zealand (Ishihara’s pseudoisochromatic test) on the basis of itsvalidity. Cost-effectiveness information is needed to compare the costs of the various screeningtests against sensitivity and specificity criteria.
� There was insufficient evidence to recommend a change in the age at which colour visionscreening should occur in New Zealand.
� It was not possible to evaluate the effectiveness of a colour vision screening programme on thebasis of current research. This was identified as an area requiring further research, incorporating arandomised controlled trial as the most appropriate research design for this purpose.
� The cost-effectiveness of colour vision screening could not be estimated due to the lack of researchin this area. This is an area requiring further research attention.

COLOUR VISION SCREENING
iv
Mesh Headings
Color vision defects, color perception, vision screening, mass screening, color perception tests, preva-lence, career choice.

COLOUR VISION SCREENING
v
LIST OF ABBREVIATIONS
AO-HRR — American Optical Hardy Rand Rittler pseudoisochromatic test
APT-5 — Anomaloscope Plate Test
CUCVT — City University Colour Vision Test
ESI — Electrical Supply Industry test
F-M 100-hue — Farnsworth Munsell 100-hue test
HbA1c — Glycosylated haemoglobin
PACT — Pease Allen Colour Test
RAF — Royal Air Force
SPP-A — Standard pseudoisochromatic Plates – Acquired deficiencies
SPP-C — Standard pseudoisochromatic Plates – Congenital deficiencies
χ2 — Chi squared test

COLOUR VISION SCREENING
vi
GLOSSARY
Anomaloscope ~ An instrument used in testing abnormalities of colour vision by having thesubject match mixed spectral lines.
Anomalous trichromat ~ Defective colour vision in which the patient has all three conepigments, one of which is deficient or anomalous, but not absent.
Before and after study ~ A situation in which the investigator compares outcomes before andafter the introduction of a new intervention.
Bias ~ Deviation of results or inferences from the truth, or processes leading to such deviation.
Case control study ~ The observational epidemiologic study of persons with the disease (or otheroutcome variable) of interest and a suitable control group of persons without the disease. Therelationship of an attribute to the disease is examined by the diseased and the non-diseased with regardto how frequently the attribute is present.
Cohort study ~ The analytic method of epidemiologic study in which subsets of a definedpopulation can be identified who are, have been, or in the future may be exposed or not exposed, orexposed in different degrees, to a factor or factors hypothesised to influence the probability ofoccurrence of a given disease or outcome.
Cone ~ A visual cell that serves light and colour vision and visual acuity.
Cross-sectional study~ A study that examines the relationship between diseases (or other healthrelated characteristics) and other variables of interest as they exist in a defined population at oneparticular time.
Descriptive study ~ A study concerned with and designed only to describe the existing distributionof variables, without regard to causal or other hypotheses.
Deutan ~ Pertaining to decreased sensitivity of green sensitive cones.
Dichromat ~ A person with a defect in colour vision in which one of the three cone pigments ismissing.
Generalisability ~ Applicability of the results to other populations.
Meta-analysis ~ Any systematic method that uses statistical analysis to integrate the data from anumber of independent studies.
Misclassification ~ The erroneous classification of an individual, a value, or an attribute into acategory other than that to which it should be assigned.
Multiple regression ~ Any analysis of data that takes into account a number of variablessimultaneously.
COLOUR VISION SCREENING
vii
Negative predictive value ~ The probability a person does not have the disease when thescreening test is negative.
Positive predictive value ~ The probability a person actually has the disease when the screeningtest is positive.
Prevalence ~ The number of events in a given population at a designated time.
Protan ~ Pertaining to decreased sensitivity of red sensitive cones.
Randomised controlled trial ~ An epidemiologic experiment in which subjects in a populationare randomly allocated into groups to receive or not receive an experimental preventive or therapeuticprocedure, manoeuvre, or intervention. Randomised controlled trials are generally regarded as the mostscientifically rigorous method of hypothesis testing available in epidemiology.
Selection bias ~ Error due to systematic differences in characteristics between those who areselected for study and those who are not.
Sensitivity ~ The proportion of truly diseased persons in the screened population who are identifiedas diseased by the screening test.
Sensitivity analysis ~ A method to determine the robustness of an assessment by examining theextent to which results are affected by changes in methods, values of variables, or assumptions.
Specificity ~ The proportion of truly non-diseased persons who are so identified by the screeningtest.
Tritan ~ Pertaining to decreased sensitive of blue sensitive cones.
Variance ~ A measure of the variation shown by a set of observations, defined by the sum of thesquares of deviation from the mean, divided by the number of degrees of freedom in the set ofobservations.

COLOUR VISION SCREENING
viii
TABLE OF CONTENTS
ACKNOWLEDGEMENTS......................................................................................................................... iDISCLAIMER ........................................................................................................................................ iCONTACT DETAILS .............................................................................................................................. iEXECUTIVE SUMMARY ........................................................................................................................ iiLIST OF ABBREVIATIONS...................................................................................................................... vGLOSSARY ...................................................................................................................................... viTABLE OF CONTENTS....................................................................................................................... viiiLIST OF TABLES.................................................................................................................................. x
INTRODUCTION 1
WHAT IS THE OBJECTIVE OF THIS REPORT? ........................................................................................... 1WHAT CRITERIA ARE NORMALLY REQUIRED FOR THE DEVELOPMENT OF A SCREENING PROGRAMME? ..... 1WHAT QUESTIONS SHOULD BE ASKED TO EVALUATE THE ADVISABILITY OF PURCHASING FOR
COLOUR VISION SCREENING? ............................................................................................................... 1WHAT IS KNOWN ABOUT THE NATURAL HISTORY OF COLOUR VISION DEFICIENCIES?.............................. 1WHAT OPTIONS EXIST FOR THE TREATMENT OF COLOUR VISION DEFICIENCIES? ..................................... 2WHAT IS THE PHYSIOLOGY OF COLOUR VISION?.................................................................................... 2HOW IS IMPAIRED COLOUR VISION CLASSIFIED?.................................................................................... 2WHAT POPULATIONS HAVE ALTERED COLOUR VISION? ......................................................................... 3
METHODOLOGY 5
LITERATURE SEARCH.......................................................................................................................... 5SOURCES SEARCHED........................................................................................................................... 5INCLUSION AND EXCLUSION CRITERIA................................................................................................. 5APPRAISAL METHODOLOGY................................................................................................................. 5CONSULTANT REVIEW......................................................................................................................... 6LIMITATIONS OF THE REPORT.............................................................................................................. 6
PREVALENCE 7
INTRODUCTION................................................................................................................................... 7WHAT IS THE PREVALENCE OF IMPAIRED COLOUR VISION?.................................................................... 7WERE THERE OTHER STUDIES INVESTIGATING THE PREVALENCE OF IMPAIRED COLOUR VISION? ........... 16WHAT PROPORTION OF PEOPLE ARE UNAWARE THEY ARE COLOUR VISION IMPAIRED? .......................... 16SUMMARY ..................................................................................................................................... 18
DISABILITY 19
INTRODUCTION................................................................................................................................. 19WHAT EFFECT DOES IMPAIRED COLOUR VISION HAVE ON DAILY HOUSEHOLD ACTIVITIES?.................... 19WHAT EFFECT DOES IMPAIRED COLOUR VISION HAVE ON EDUCATION?................................................ 19WHAT EFFECT DOES IMPAIRED COLOUR VISION HAVE ON OCCUPATIONAL PERFORMANCE?................... 22WHAT EFFECT DOES IMPAIRED COLOUR VISION HAVE ON MOTOR VEHICLE CRASH RATES?.................... 26WHAT SPECIFIC CONDITIONS ARE ASSOCIATED WITH A DISTURBANCE OF COLOUR VISION? .................. 26SUMMARY ..................................................................................................................................... 27
SCREENING TESTS 29
INTRODUCTION................................................................................................................................. 29WHAT IS THE SENSITIVITY AND SPECIFICITY OF CURRENTLY USED SCREENING TESTS FOR
COLOUR VISION IMPAIRMENT? ........................................................................................................... 29WHAT IS THE SENSITIVITY OF CURRENTLY USED COLOUR VISION SCREENING TESTS? ........................... 34WHAT WAS THE REPEATABILITY OF COMMONLY USED COLOUR VISION SCREENING TESTS?................... 37WERE OTHER METHODS OF ASSESSING THE VALIDITY OF COLOUR VISION SCREENING TESTS USED?....... 37HOW DO YOUNG CHILDREN PERFORM ON COLOUR VISION TESTING? .................................................... 40SUMMARY ..................................................................................................................................... 41

COLOUR VISION SCREENING
ix
SCREENING PROGRAMMES 43
ARE SCREENING PROGRAMMES FOR COLOUR VISION ABNORMALITIES EFFECTIVE? ...............................43SUMMARY ......................................................................................................................................44
CONCLUSIONS 47
REFERENCES 55
APPENDICES
SEARCH STRATEGIES...........................................................................................................APPENDIX 1STUDY DESIGNS USED IN THIS REVIEW..................................................................................APPENDIX 2REFERENCES NOT CONSIDERED FOR APPRAISAL....................................................................APPENDIX 3FORMULAE FOR SUMMARY MEASURES OF EFFECT.................................................................APPENDIX 4CONSULTANT REPORT.........................................................................................................APPENDIX 5
COLOUR VISION SCREENING
x
LIST OF TABLES
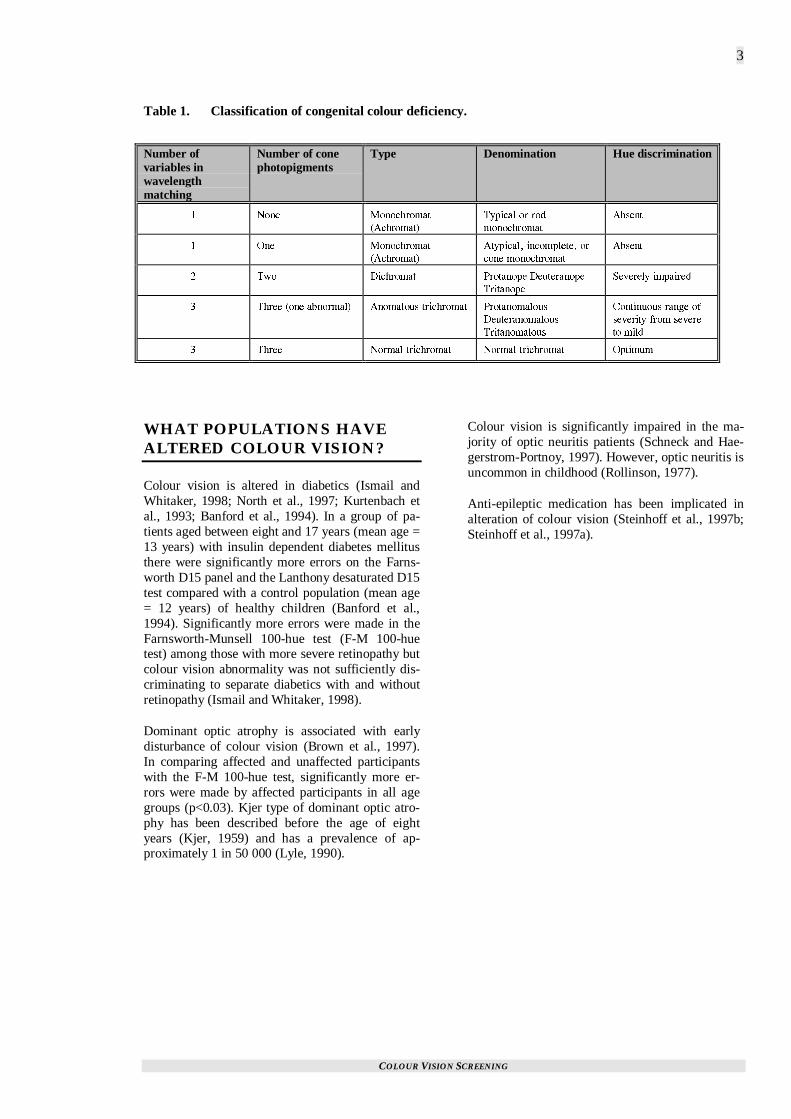
Table 1. Classification of congenital colour deficiency. ............................................................... 3
Table 2. Summary of studies examining the prevalence of colour vision impairment.................. 12
Table 3. Prevalence of impaired colour vision in studies that were not available for criticalappraisal......................................................................................................................16
Table 4. Summary of studies evaluating the rate of people unaware they are colour visionimpaired...................................................................................................................... 17
Table 5. Disability associated with colour vision impairment..................................................... 21
Table 6. Implications of colour vision impairment on occupational choice ................................. 24
Table 7. Validity of four pseudoisochromatic tests in a group of four to 11 year old boys........... 31
Table 8. Summary of studies evaluating the sensitivity and specificity of colour visionscreening tests ............................................................................................................. 32
Table 9. Sensitivity of the transformational and vanishing designs of Ishihara test plates............ 34
Table 10. Summary of studies investigating the sensitivity of colour vision screening tests .......... 36
Table 11. Summary of studies evaluating the validity of colour vision screening tests withother outcome mesasures ............................................................................................. 39
Table 12. Proportion of children who understood and correctly interpreted different colourvision tests in different age groups. .............................................................................. 40
Table 13. Proportion of children who were unable to interpret the Ishihara test plates, byage group. ................................................................................................................... 40
Table 14. Summary of studies that evaluated colour vision screening programmes....................... 45
Table 15. Sensitivity analysis of the effect varying sensitivity, specificity and prevalencevalues have on the positive and negative predictive values for colour visionscreening..................................................................................................................... 51
Table 16. Summary evidence table examining screening for impaired colour vision..................... 53

COLOUR VISION SCREENING
1
Introduction
WHAT IS THE OBJECTIVE OFTHIS REPORT?
The objective of this report was to inform theHealth Funding Authority (HFA) on the currentevidence evaluating colour vision screeningthrough the application of validated screening crite-ria.
WHAT CRITERIA ARENORMALLY REQUIRED FORTHE DEVELOPMENT OF ASCREENING PROGRAMME?
Criteria for assessing the validity of screening pro-grammes have been described by a number ofauthors (Cuckle and Wald, 1984, Gray, 1997).However, Wilson and Jungner’s (Wilson and Jung-ner, 1968) criteria remain the benchmark forevaluation. These have been summarised by Snow-don and Stewart-Brown (Snowdon and Stewart-Brown, 1997) and were used in this report.
These criteria were:
� The condition should be common and dis-abling.
� The natural history of the condition should beknown.
� There is a recognisable latent or pre-symptomatic phase of the condition.
� There should be a reliable, valid and repeatablescreening test.
� The screening test should be acceptable, safeand easy to perform.
� The screening test should have a high positivepredictive value.
� The screening test should be sensitive and spe-cific.
� The cost of the screening programme shouldbe commensurate with the benefits of earlydetection.
� There should be effective and available treat-ment.
� The service provision should be adequate totreat the children identified by the screeningprogramme.
� There should be an agreed policy on who willbe treated.
It is argued that a screening programme’s failure tofulfil any one of these criteria calls into question itsvalidity.
WHAT QUESTIONS SHOULD BEASKED TO EVALUATE THEADVISABILITY OFPURCHASING FOR COLOURVISION SCREENING?
Bearing in mind the objective of this report and thescreening criteria listed, the following researchquestions were formulated for this report:
� What is the prevalence of impaired colour vi-sion? There was a specific requirement to de-termine ethnic differences in prevalence.
� What is the natural history of impaired colourvision?
� What are the consequences of impaired colourvision? These consequences were to includehealth and other fields. Therefore conse-quences of impaired colour vision were con-sidered in occupation, education and healthspheres.
� Is there any treatment for impaired colour vi-sion?
� Is there a suitable screening test for impairedcolour vision?
� Is colour vision screening cost-effective?� Are these screening criteria suitable for the
evaluation of colour vision screening? Otherpotential benefits from colour vision screeningexist suggesting screening criteria developedfor the health arena alone might not be valid.Other potential health benefits from screeningmight exist if colour vision screening detectsdisease earlier than any diagnosis by othermethods. Normally screening programmes arespecific for one disease.
Colour vision screening is currently performed in11-year-old boys within New Zealand but the scopeof this report was to include an evaluation ofscreening in other age groups.
WHAT IS KNOWN ABOUT THENATURAL HISTORY OFCOLOUR VISIONDEFICIENCIES?
In answer to the question regarding natural history,it is recognised that most colour vision defects areconstant throughout life in type and severity (Lyle,1990). Therefore, there is an understanding of thenatural history of impaired colour vision.
COLOUR VISION SCREENING
2
WHAT OPTIONS EXIST FORTHE TREATMENT OF COLOURVISION DEFICIENCIES?
One study was identified that investigated the op-tions for treatment of impaired colour vision. Thisstudy investigated long wavelength pass filters(Hovis, 1997). Participants with red-green colourvision deficiencies were recruited by advertisementin this descriptive study (Grade III evidence).There were 29 participants with a median age of30. The effectiveness of the filters was assessedthrough response on colour vision tests. There wasa significant improvement in the tests requiringjudgements between large colour differences andpseudoisochromatic plate tests which used red andgreen for the figure and background colours butperformance was reduced in the blue-yellow spec-trum. Overall effectiveness was rated as “not veryeffective” in 44% and only 17% were interested inpurchasing the lenses after a one-week trial.
This uncontrolled trial is a poor method of evalu-ating therapeutic options so the results of this studyshould be treated with caution. There was not aclear method of identifying the group of peoplewho thought they would benefit from purchase ofthe filters.
It was concluded that:
There were no adequate treatment options forthe correction of impaired colour vision on cur-rent evidence.
WHAT IS THE PHYSIOLOGY OFCOLOUR VISION?
Cones mediate colour vision. One cone pigment isprimarily responsible for sensing blue light, one forgreen and one for red. Protanopia describes the lackof any red sensitive pigment in the retina, deutera-nopia lacks green sensitive pigment and tritanopiablue sensitive pigment. The latter is rare with aprevalence between one and five per 10,000 Cau-casian live births (Buyse, 1990).
Colour vision begins with this three colour, threereceptor system. Single cells deal with two sets ofcones with overlapping spectral sensitivities. It isthis structure that permits nerve cells to code dif-ferent colours in an unambiguous manner (Michael,1973). Genes for long and middle wavelength sen-sitive visual pigments (red-green spectrum) areencoded on the X chromosome (Neitz and Neitz,1995).
HOW IS IMPAIRED COLOURVISION CLASSIFIED?
Congenital colour deficiency can be classified asshown in Table 1 (p. 3), (Birch, 1993).
The protan and deutan deficiencies are inheritedthrough an X linked recessive mechanism whereasthe tritan deficiencies are autosomal dominant. Rodmonochromatism is autosomal recessive and atypi-cal monochromatic is X linked recessive.
COLOUR VISION SCREENING
3
Table 1. Classification of congenital colour deficiency.
Number ofvariables inwavelengthmatching
Number of conephotopigments
Type Denomination Hue discrimination
� 0QPG /QPQEJTQOCV
#EJTQOCV�
6[RKECN QT TQF
OQPQEJTQOCV
#DUGPV
� 1PG /QPQEJTQOCV
#EJTQOCV�
#V[RKECN� KPEQORNGVG� QT
EQPG OQPQEJTQOCV
#DUGPV
� 6YQ &KEJTQOCV 2TQVCPQRG &GWVGTCPQRG
6TKVCPQRG
5GXGTGN[ KORCKTGF
� 6JTGG QPG CDPQTOCN� #PQOCNQWU VTKEJTQOCV 2TQVCPQOCNQWU
&GWVGTCPQOCNQWU
6TKVCPQOCNQWU
%QPVKPWQWU TCPIG QH
UGXGTKV[ HTQO UGXGTG
VQ OKNF
� 6JTGG 0QTOCN VTKEJTQOCV 0QTOCN VTKEJTQOCV 1RVKOWO
WHAT POPULATIONS HAVEALTERED COLOUR VISION?
Colour vision is altered in diabetics (Ismail andWhitaker, 1998; North et al., 1997; Kurtenbach etal., 1993; Banford et al., 1994). In a group of pa-tients aged between eight and 17 years (mean age =13 years) with insulin dependent diabetes mellitusthere were significantly more errors on the Farns-worth D15 panel and the Lanthony desaturated D15test compared with a control population (mean age= 12 years) of healthy children (Banford et al.,1994). Significantly more errors were made in theFarnsworth-Munsell 100-hue test (F-M 100-huetest) among those with more severe retinopathy butcolour vision abnormality was not sufficiently dis-criminating to separate diabetics with and withoutretinopathy (Ismail and Whitaker, 1998).
Dominant optic atrophy is associated with earlydisturbance of colour vision (Brown et al., 1997).In comparing affected and unaffected participantswith the F-M 100-hue test, significantly more er-rors were made by affected participants in all agegroups (p<0.03). Kjer type of dominant optic atro-phy has been described before the age of eightyears (Kjer, 1959) and has a prevalence of ap-proximately 1 in 50 000 (Lyle, 1990).
Colour vision is significantly impaired in the ma-jority of optic neuritis patients (Schneck and Hae-gerstrom-Portnoy, 1997). However, optic neuritis isuncommon in childhood (Rollinson, 1977).
Anti-epileptic medication has been implicated inalteration of colour vision (Steinhoff et al., 1997b;Steinhoff et al., 1997a).
COLOUR VISION SCREENING
5
Methodology
LITERATURE SEARCH
The literature search was divided into the followingsections:
� prevalence of colour vision disorders, naturalhistory, disability
� treatment� screening programmes
Because of the difficulty in locating adequate in-formation on the prevalence of colour vision disor-ders in European populations the search was takenback as far as possible on Medline and continuedwith a hand search of Index Medicus under theheadings "color blindness" and "color perception".The years 1924-1934 and 1955-1960 were selectedfor the hand search owing to an apparent interest inthe prevalence of colour vision defects during theseyears which had been identified in references fromarticles obtained during the course of the project.
Other sections of the literature search were re-stricted to the last 10 years.
Searches were carried out during late June andearly July 1998.
The search strategies used for Medline/Healthstarand Embase are given in Appendix 1. The Health-star search was limited to non-Medline references.
The other databases were searched using the the-saurus heading color vision where available, or ifthere was no controlled vocabulary, the keywordscolour vision/color vision.
A particular effort was made to obtain articles thatappeared relevant whether or not they were avail-able in New Zealand. However, articles in lan-guages other than English, French, and Germanwere excluded.
SOURCES SEARCHED
The sources searched included:
� Medline/Index Medicus� Healthstar� Current Contents (combined files)� Cinahl� Cochrane Library� Best Evidence CD-ROM� Embase
� ERIC (Educational Resources InformationCentre) database
� Psychlit� Sociofile� Social Science Index� Science Citation Index� Social Science Citation Index� Database of Abstracts of Reviews of Effec-
tiveness (DARE)� NHS Economic Evaluation Database� TRIP (Turning Research into Practice) data-
base - Gwent Health Authority� publications and current projects of the Inter-
national Network of Agencies for HealthTechnology Assessment (INAHTA)
� New Zealand Health Information Service sta-tistics
� reference lists of documents obtained duringthe course of the project
INCLUSION AND EXCLUSIONCRITERIA
Studies were considered for this report if they usedone of the following designs:
� meta-analysis� randomised controlled trial (RCT)� cohort study� case-control study� before and after study� descriptive study
Details of these study designs are found inAppendix 2. Economic analyses were alsoconsidered.
Exclusion criteria
The following criteria were used to exclude studiesfrom appraisal:
� participation rate <50%� sample size <25� significant difference in the baseline charac-
teristics of cases and controls� lack of demographic details about the study
participants� updated results published� papers for debate or editorials� abstract only
The studies that were excluded are identified inAppendix 3.
APPRAISAL METHODOLOGY
Articles were formally appraised using the sched-ule developed by the Group Health Cooperative ofPuget Sound (Group Health Cooperative of Puget

COLOUR VISION SCREENING
6
Sound, 1996) and adapted by the New ZealandGuidelines Group of the National Health Commit-tee (New Zealand Guidelines Group, 1997).
Summaries of appraisal results have usually beenpresented in tabular form and conclusions havebeen drawn that were dependent on the study de-sign and findings and the specific problems associ-ated with the individual studies.
The sensitivity and specificity were the favouredmethods of presenting results in the evaluation ofthe validity of screening tests for impaired colourvision. Formulae for these parameters are presentedin Appendix 4.
The grade of evidence (which evaluates quality)was assigned using the U.S. Preventive ServicesTask Force protocol (U.S. Preventive ServicesTask Force, 1989). Thus, levels of evidence were:
I Evidence obtained from at least one prop-erly designed randomised-controlled trial.
II-1 Evidence obtained from well-designedcontrolled trials without randomisation.
II-2 Evidence obtained from well-designedcohort or case-control analytic studies,preferably from more than one centre orresearch group.
II-3 Evidence obtained from multiple timeseries with or without intervention.
III Opinions of respected authorities, basedon clinical experience, descriptive studies,or reports of expert committees.
Epi-info version 6.04 (Dean et al., 1995) was usedto determine χ2 values and level of significancewhen the author of this report evaluated categoricaldata.
CONSULTANT REVIEW
Dr Mark Elder peer reviewed a draft of this reportand his comments are included in Appendix 5.
LIMITATIONS OF THE REPORT
Although, in general, randomised-controlled trialsare usually best able to reduce the effects of biasand confounding, the most important determinantof the validity of the study is the rigour applied toits design and analysis and not necessarily the typeof study design used. In addition, certain study de-signs are more appropriate for particular issues.
For example, randomised-controlled trials are bestfor comparisons between different therapeutic op-tions, cohort studies are best for assessing progno-sis and cross-sectional studies are best for describ-ing the prevalence of a condition at one point intime.
Although this report has greatly benefited fromadvice provided by consultants, it has not beenexposed to wide peer review. In addition, the reporthas been limited to the published academic litera-ture and has not appraised unpublished work.
The report was conducted over a limited period oftime (July – October, 1998).
COLOUR VISION SCREENING
7
Prevalence
INTRODUCTION
In this report the term prevalence refers to the pointprevalence and can be defined as “the number ofevents in a given population at a designated time.”
Screening programmes are increasingly valuable asthe prevalence of the condition under study in-creases. There are two main reasons for this:
1. There can be a greater reduction in the impactof a condition if that condition has a highprevalence (other things being equal).
2. The screening tests have a higher positive pre-dictive value in conditions of high prevalence.This results in less utilisation of unnecessaryresources (through unnecessary confirmatorytesting) resulting in a better cost-benefit pro-file.
A third issue to be considered concerns the propor-tion of the potential screening population that areunaware they are colour vision impaired. Thehigher this proportion is, the more favourable ascreening programme would be.
WHAT IS THE PREVALENCE OFIMPAIRED COLOUR VISION?
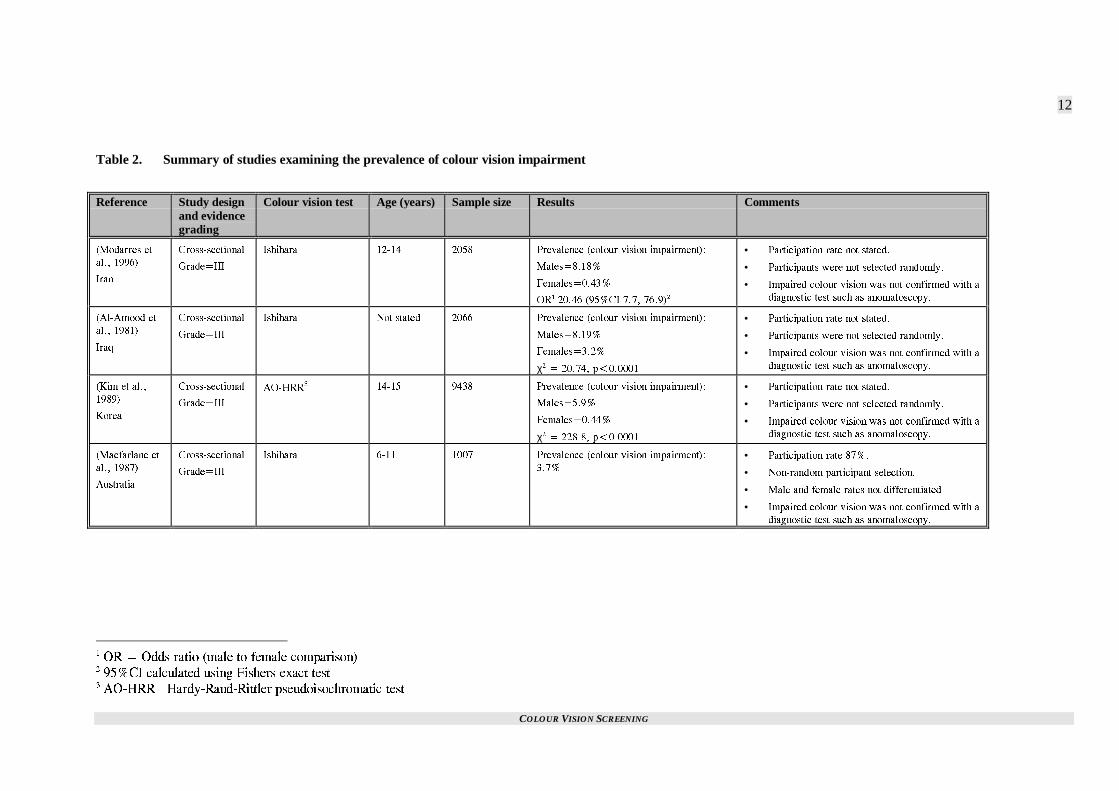
Twenty studies were identified that examined theprevalence of colour vision impairment. Thesestudies are summarised in Table 2 (p. 12). The χ2
tests included in this table were calculated by theauthor of this report.
Modarres et al., 1996
The prevalence of congenital colour vision im-pairment was assessed in 12 to 14-year-olds (meanage not stated) in Iran. There were 1136 males and922 females in the survey. Ishihara pseudoiso-chromatic plates were used for testing. The studywas cross-sectional (Grade III evidence) in design.
Colour vision impairment was identified in 8.18%of males and 0.43% of females.
Limitations of the study included:
� The participation rate was not stated.� Impaired colour vision was not confirmed with
a diagnostic test such as anomaloscopy.
� The study participants were not randomly se-lected and selection was based on class ratherthan individual students.
� The generalisability should be treated withcaution since the study was set in Iran.
Al-Amood et al., 1981
The prevalence of impaired colour vision in IraqiArabs was assessed in 1221 males and 845 femalespresenting for premedical admission screening (agerange and mean age not stated). The Ishihara pseu-doisochromatic plates were used for testing. Thestudy was cross-sectional (Grade III evidence) indesign.
Impaired colour vision was present in 8.19% ofmales and 3.2% of females.
Limitations of the study included:
� The participation rate was not stated.� Impaired colour vision was not confirmed with
a diagnostic test such as anomaloscopy.� It was unclear whether the level of colour vi-
sion impairment in this population of premedi-cal admissions would be similar to the generalIraqi population.
� The generalisability of these results should betreated with caution.
Kim et al., 1989
The prevalence of congenital colour impairmentwas assessed in Koreans attending school. Therewere 4678 males and 4760 females in the studyaged 14-15 years. The Hardy-Rand-Rittlerpseudoiso-chromatic plates (AO-HRR) were usedfor testing. The study was cross-sectional (GradeIII evidence) in design.
Colour impairment was detected in 5.9% of menand 0.44% of women.
Limitations included:
� It was unclear whether the participants wererandomly selected.
� Impaired colour vision was not confirmed witha diagnostic test such as anomaloscopy.
� The participation rate was not stated.� Generalisability should be treated with caution.
Macfarlane et al., 1987
The prevalence of ocular disorders was describedin 1007 Queensland children aged between six and11 years (mean age not stated). Colour perceptionwas tested with the Ishihara pseudoisochromaticplates. The study was cross-sectional (Grade IIIevidence) in design.
COLOUR VISION SCREENING
8
Abnormalities of colour perception were detectedin 3.7% of those tested.
Limitations of the study included:
� Male and female results were not differenti-ated.
� Impaired colour vision was not confirmed witha diagnostic test such as anomaloscopy.
� Participants were not randomly selected.� The participation rate was 87%.
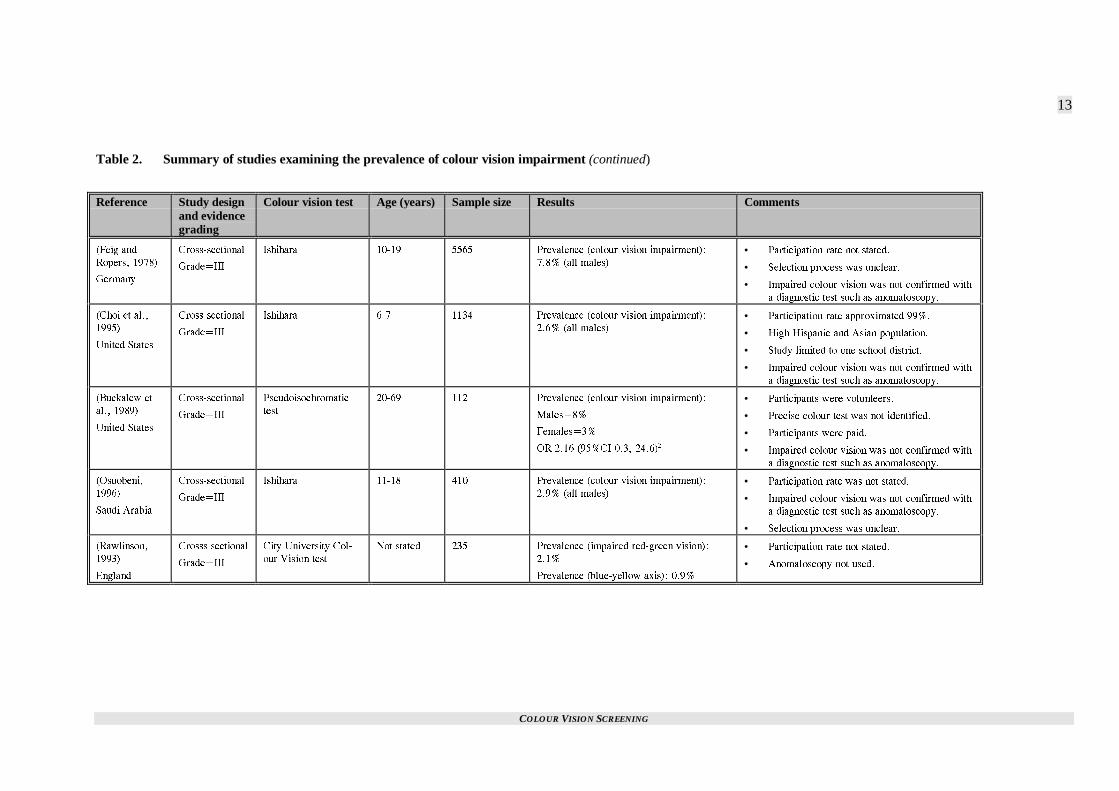
Feig and Ropers, 1978
A cross-sectional study (Grade III evidence) of5565 German schoolboys aged 10 to 19 years(mean age not stated) used Ishihara pseudoiso-chromatic plates to identify colour vision impair-ment. Two or more mistakes were taken as evi-dence of defective colour vision.
There was a discernible defect in 7.8% of the sam-ple.
Limitations of the study included:
� The participation rate was not stated.� Impaired colour vision was not confirmed with
a diagnostic test such as anomaloscopy.� There was an unclear selection process.� There was a possible misclassification bias due
to the stringent requirements used to pass theIshihara testing.
� The generalisability is uncertain.
Choi et al., 1995
A study of eye disease was conducted in Los An-geles in six and seven year old children. Colourvision impairment was assessed with the Ishiharapseudoisochromatic test and colour deficiency wasdefined as missing six or more plates. The resultspresented were restricted to 1,134 boys. The studywas cross-sectional (Grade III evidence) in design.
Red/green colour deficiency was observed in 2.6%of participants with a further 0.5% making betweenone and five errors on the plates.
Limitations of the study included:
� The participation rate for colour testing wasnot stated although 99% of the eligible popu-lation participated in the other eye tests (thispopulation included all the female populationin the study group).
� Impaired colour vision was not confirmed witha diagnostic test such as anomaloscopy.
� The study was limited to all eligible pupils inone school district in Los Angeles, providing apossible selection bias.
� The overall study population included 58%Hispanics and 17% Asians which may havebeen responsible for the comparatively lowrate of disorder in this population.
� The generalisability to the New Zealandpopulation is limited.
Buckalew et al., 1989
The prevalence of colour vision impairment wasassessed in 112 volunteers in the United States. Theparticipants ranged in age between 20 and 69 years(mean age = 40 years). An unnamed pseudoiso-chromatic test was used in the evaluation. Thestudy was cross-sectional (Grade III evidence) indesign.
Of the 112 persons tested, 8% of men and 3% ofwomen were colour deficient.
Limitations of the study included:
� Using volunteers potentially biases the sample.Those who had impaired colour vision mighthave been more likely to participate resultingin a higher prevalence in the study populationthan that in the population from which the par-ticipants were drawn.
� Impaired colour vision was not confirmed witha diagnostic test such as anomaloscopy.
� Using an unnamed pseudoisochromatic testdoes not allow an estimation of the likely accu-racy of the test, resulting in the possibility ofmisclassification errors. The direction of effectof any such errors is unclear.
� Participants were paid, which also provides apotential selection bias.
� Given these limitations the generalisability ofthe study requires considerable caution.
Osuobeni, 1996
The prevalence of colour deficiency was also stud-ied in Saudi Arabian boys aged 11 to 18 years(mean age not stated). There were 410 participants.The Ishihara pseudoisochromatic test and Farns-worth’s Dichotomous Panel D15 were used toevaluate colour impairment. More than five typicalred-green errors on Ishihara or two or more cross-ings in the same direction on Farnsworth weredeemed as failures. The study was cross-sectional(Grade III evidence) in design.
The prevalence of disorder was found to be 2.92%.
Limitations included:
� The participation rate was not stated� Impaired colour vision was not confirmed with
a diagnostic test such as anomaloscopy.� The method of participant selection was not
stated.

COLOUR VISION SCREENING
9
� The generalisability should be considered lim-ited given the location of the study.
Rawlinson, 1993
The prevalence of impaired colour vision wasevaluated in a population of dental undergraduates(age range and mean age not stated). A cross-sectional study (Grade III evidence) with 235 par-ticipants was used.
There were 2.1% with impaired red green colourvision and 0.9% with impaired blue yellow colourvision.
Limitations included:
� The participation rate was not stated.� The study used the City University Colour
Vision Test (CUCVT) and red green impair-ment might have been more accurately diag-nosed with anomaloscopy since this test had asensitivity of 67% in another study (Birch,1997b).
� The study was conducted in England so hasunclear generalisability.
Perez-Carpinell et al., 1994
The prevalence of impaired colour vision in sub-jects with trisomy 21 has been assessed. Therewere 72 participants aged between seven and 22years (mean age not stated). Testing was done withIshihara’s plates and with anomaloscopy. The studywas cross-sectional (Grade III evidence) in design.
There was evidence of impaired colour vision in atleast one eye in 23% of participants. However, ofthose able to be assessed by anomaloscopy, 12.5%had impaired binocular colour vision.
Limitations of the study included:
� 67% of participants were able to understandanomaloscopy and 79% could interpret Ishi-hara’s plates.
� It was not possible to calculate the prevalenceof impaired colour vision by gender.
� The participants were selected from one schooland it was not clear whether they were repre-sentative of the population with trisomy 21.
� The study was set in Spain so has unclear gen-eralisability to New Zealand.
Morton, 1975
The results of colour vision screening pre-inductionto the armed forces (age range 17-26 years, meanage 21 years) were reported for the period 1939 to1941 in Oregon and Colorado (Morton, 1975). Re-sults were abstracted from the personal files (GradeIII evidence). The majority of colour vision tests
were performed with the AO-HRR test but occa-sionally Ishihara or Dvorine tests were used. Thesensitivity of AO-HRR was 79% and specificitywas 85% in a study conducted elsewhere (Hill etal., 1982).
Of the 1226 male participants, 4.2% were diag-nosed with impaired colour vision.
Limitations of the study included:
� There was a possible selection bias since thearmed forces rejected those with severe colourvision deficiencies. Therefore, those withknown colour vision impairment were lesslikely to apply resulting in an underestimationof the true prevalence for the population.
� Impaired colour vision was not confirmed witha diagnostic test such as anomaloscopy.
� The retrieval rate of personal files was notstated.
� There was no account of possible misclassifi-cation through either the colour vision testsused or through coding errors.
� The study was conducted in the United Statesso the generalisability was unclear.
Littlewood and Hyde, 1993
The prevalence of impaired colour vision was as-sessed as part of a controlled trial without randomi-sation (Grade II-1 evidence) evaluating the validityof screening tests. There were 414 participantsaged less than 90 years (mean age not stated).Those who failed Ishihara’s test and anomaloscopywere considered to have impaired colour vision.The participation rate was 97%.
Ten percent of males and 0.5% of females werediagnosed with colour vision deficiencies.
Limitations of the study included:
� Only those who failed Ishihara’s test had thediagnosis confirmed with anomaloscopy.
� Participants were selected through consecutiveattendance at an ophthalmology practice whichmight have resulted in a selection bias.
� The generalisability to New Zealand was un-clear.
Mann and Turner, 1956
A cross-sectional study design (Grade III evidence)was used to examine the prevalence of impairedcolour vision in Australia. There were 503 malesand 307 females tested with Ishihara’s test (agerange and mean age not stated).
Overall, 7.4% of males and 0.7% of females hadimpaired colour vision.

COLOUR VISION SCREENING
10
Limitations of this study were:
� The study was conducted in two specific geo-graphical regions of Australia associated withgoldfields and other industry. This might haveresulted in a selection bias.
� The participation rate was not stated.� The results were not confirmed with anomalo-
scopy so misclassification of some participantswas likely.
� The generalisability was unclear.
Geddes, 1946
The prevalence of impaired colour vision was de-scribed in a group of Fijians, Fijian Indians andNew Zealanders in a cross-sectional study (GradeIII evidence). Ishihara’s test was used.
There were 608 Fijian males between six and 35years of age (mean age not stated), 148 Fijian In-dian males between six and 14 years (mean age notstated) and 2000 New Zealand males (age notstated).
Overall, 0.8% of the Fijians, 8.1% of the FijianIndians and 6% of the New Zealanders had im-paired colour vision.
Limitations of the study included:
� The participation rates were not stated.� Selected groups (army and selected schools)
were used for the Fijian arm of the study pro-viding a potential selection bias. For the NewZealand study, visitors to a Centennial Exhibi-tion were recruited.
� Anomaloscopy was not used for confirmationproviding a potential misclassification bias.
Grieve, 1946
The results of colour vision testing on 16,180 can-didates (age range 18-30, mean age not stated) foraircrew in the Royal Air Force (RAF) were pre-sented in a descriptive study (Grade III evidence).Ishihara’s test was used for screening purposes andthe results of this test are used in this report.
There were 1068 participants (6.63%) with im-paired colour vision.
Limitations of the study included:
� Those with impaired colour vision were lesslikely to reply given the restrictions on accep-tance for that group. Therefore, this rate islikely to be the lower limit of normal.
� There was a possible misclassification biassince the results were not based on anomalo-scopy.
� The generalisability was unclear.
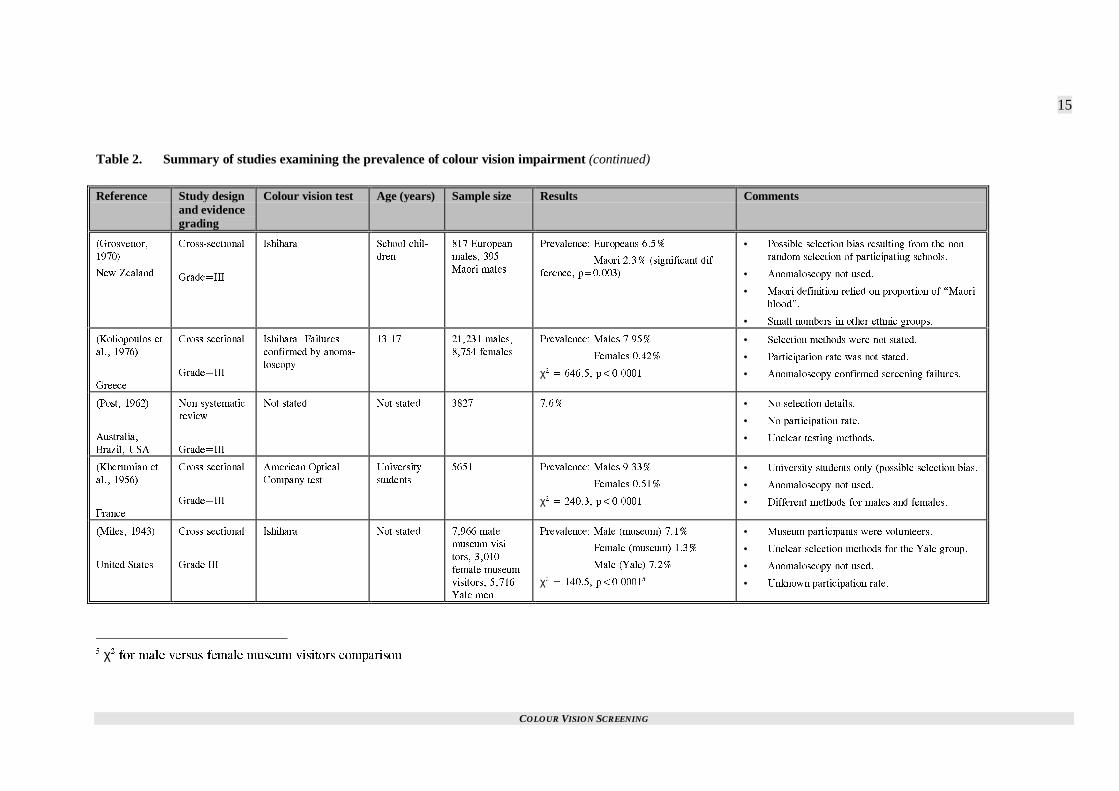
Grosvenor, 1970
The prevalence of impaired colour vision in NewZealand Maori and New Zealand Europeans hasbeen reported. A cross-sectional study design wasused (Grade III evidence) and participants wereenrolled from schools (age range and mean age notstated). Ishihara’s test was used to examine colourvision.
There were 817 European boys, 53 of whom failedthe test (6.5%). There were 395 Maori males withnine failures (2.3%). These results were not sub-jected to statistical analysis in a manner that wouldbe considered acceptable today. Therefore, the χ2
test was used by the author of this report to com-pare these results. There was a statistically signifi-cant difference in the rate of impaired colour visionbetween the Maori and European groups (p=0.003).
Limitations of the study included:
� There was possible selection bias resultingfrom the non-random selection of participatingschools.
� There was possible misclassification bias sinceanomaloscopy was not used.
� The definition for Maori was taken from theschool records and required “an individualwith one half or more blood” rather than self-identification.
� Sample sizes for other ethnic groups were toosmall to estimate prevalence data.
� The participation rate was not stated.
Koliopoulos et al., 1976
A study of the prevalence of colour vision defi-ciencies in 29,985 Greeks aged between 13 and 17years (mean age not stated) was conducted. Across-sectional design was used (Grade III evi-dence). Colour vision deficiencies were detectedusing Ishihara’s test.
There were 21,231 males, 7.95% of whom hadimpaired colour vision. Only 0.42% of the 8754female participants had impaired colour vision.
Limitations of the study included:
� The participation rate was not stated.� Methods of selection were not stated.� Anomaloscopy (the gold standard diagnostic
test) was used to confirm the diagnosis in thosewho failed the screening test. Those whopassed the screening test were not confirmed.
� The generalisability was unclear.
Post, 1962
A non-systematic review (Grade III evidence) ofthe prevalence of impaired colour vision included a

COLOUR VISION SCREENING
11
category titled “white groups, immigrants over-seas” and included studies based in Australia, Bra-zil and the United States. The studies were con-ducted between 1922 and 1957 and the results werefor males with red-green colour deficiency.
There were 3827 participants and 7.6% had im-paired colour vision.
Limitations of this review included:
� A lack of details concerning the testing meth-ods used in the different studies.
� The methods of participant or study selectionwere not stated.
� No participation rate was stated.� Uncertain generalisability.
Kherumian et al., 1956
The prevalence of impaired colour vision was as-sessed in 5651 students (age range and mean agenot stated) of the University of Paris. The Ameri-can Optical Company test (a pseudoisochromatictest) was used for screening and was confirmedwith a range of other pseudoisochromatic tests. Thestudy was cross-sectional (Grade III evidence) indesign.
Of the 2721 men, 9.33% were considered to haveimpaired colour vision. After exclusion of variousacquired defects, 0.51% of women were identifiedwith impaired colour vision.
Limitations of this study included:
� A screening test was used rather than anoma-loscopy in the diagnosis.
� University students could represent a biasedgroup of the population.
� Different methods were used between maleand female participants (relating to exclusionof acquired defects in women).
� The study has uncertain generalisability.
Miles, 1943
A study conducted in the New York Museum ofScience and Industry evaluated the rate of colourvision impairment in visitors (age range and meanage not stated) using a cross-sectional design(Grade III evidence). The Ishihara pseudoisochro-matic test was used.
Of the 7966 men, 7.1% had impaired colour visionand 1.3% of the 3010 women had impaired colourvision. The author of this study also presented theresults of colour vision testing in 5716 men at-tending Yale. There were 7.2% with impaired col-our vision in this group.
Limitations of this study included:
� Using volunteers in the museum study pro-vides a potential selection bias. The method ofselecting participants from Yale was notstated.
� The participation rate was unknown.� Anomaloscopy was not used in the diagnosis
of impaired colour vision.� The generalisability of these results was un-
clear.
COLOUR VISION SCREENING
12
Table 2. Summary of studies examining the prevalence of colour vision impairment
Reference Study designand evidencegrading
Colour vision test Age (years) Sample size Results Comments
/QFCTTGU GV
CN�� �����
+TCP
%TQUU�UGEVKQPCN
)TCFG�+++
+UJKJCTC ����� ���� 2TGXCNGPEG EQNQWT XKUKQP KORCKTOGPV��
/CNGU������
(GOCNGU������
14� ����� ���%+ ���� ������
• 2CTVKEKRCVKQP TCVG PQV UVCVGF�
• 2CTVKEKRCPVU YGTG PQV UGNGEVGF TCPFQON[�
• +ORCKTGF EQNQWT XKUKQP YCU PQV EQPHKTOGF YKVJ C
FKCIPQUVKE VGUV UWEJ CU CPQOCNQUEQR[�
#N�#OQQF GV
CN�� �����
+TCS
%TQUU�UGEVKQPCN
)TCFG�+++
+UJKJCTC 0QV UVCVGF ���� 2TGXCNGPEG EQNQWT XKUKQP KORCKTOGPV��
/CNGU������
(GOCNGU�����
χ� � ������ R�������
• 2CTVKEKRCVKQP TCVG PQV UVCVGF�
• 2CTVKEKRCPVU YGTG PQV UGNGEVGF TCPFQON[�
• +ORCKTGF EQNQWT XKUKQP YCU PQV EQPHKTOGF YKVJ C
FKCIPQUVKE VGUV UWEJ CU CPQOCNQUEQR[�
-KO GV CN��
�����
-QTGC
%TQUU�UGEVKQPCN
)TCFG�+++
#1�*44� ����� ���� 2TGXCNGPEG EQNQWT XKUKQP KORCKTOGPV��
/CNGU�����
(GOCNGU������
χ� � ������ R�������
• 2CTVKEKRCVKQP TCVG PQV UVCVGF�
• 2CTVKEKRCPVU YGTG PQV UGNGEVGF TCPFQON[�
• +ORCKTGF EQNQWT XKUKQP YCU PQV EQPHKTOGF YKVJ C
FKCIPQUVKE VGUV UWEJ CU CPQOCNQUEQR[�
/CEHCTNCPG GV
CN�� �����
#WUVTCNKC
%TQUU�UGEVKQPCN
)TCFG�+++
+UJKJCTC ���� ���� 2TGXCNGPEG EQNQWT XKUKQP KORCKTOGPV��
����
• 2CTVKEKRCVKQP TCVG ����
• 0QP�TCPFQO RCTVKEKRCPV UGNGEVKQP�
• /CNG CPF HGOCNG TCVGU PQV FKHHGTGPVKCVGF�
• +ORCKTGF EQNQWT XKUKQP YCU PQV EQPHKTOGF YKVJ C
FKCIPQUVKE VGUV UWEJ CU CPQOCNQUEQR[�
� 14 � 1FFU TCVKQ OCNG VQ HGOCNG EQORCTKUQP�� ���%+ ECNEWNCVGF WUKPI (KUJGTU GZCEV VGUV� #1�*44�*CTF[�4CPF�4KVVNGT RUGWFQKUQEJTQOCVKE VGUV
COLOUR VISION SCREENING
13
Table 2. Summary of studies examining the prevalence of colour vision impairment (continued)
Reference Study designand evidencegrading
Colour vision test Age (years) Sample size Results Comments
(GKI CPF
4QRGTU� �����
)GTOCP[
%TQUU�UGEVKQPCN
)TCFG�+++
+UJKJCTC ����� ���� 2TGXCNGPEG EQNQWT XKUKQP KORCKTOGPV��
���� CNN OCNGU�
• 2CTVKEKRCVKQP TCVG PQV UVCVGF�
• 5GNGEVKQP RTQEGUU YCU WPENGCT�
• +ORCKTGF EQNQWT XKUKQP YCU PQV EQPHKTOGF YKVJ
C FKCIPQUVKE VGUV UWEJ CU CPQOCNQUEQR[�
%JQK GV CN��
�����
7PKVGF 5VCVGU
%TQUU�UGEVKQPCN
)TCFG�+++
+UJKJCTC ��� ���� 2TGXCNGPEG EQNQWT XKUKQP KORCKTOGPV��
���� CNN OCNGU�• 2CTVKEKRCVKQP TCVG CRRTQZKOCVGF ����
• *KIJ *KURCPKE CPF #UKCP RQRWNCVKQP�
• 5VWF[ NKOKVGF VQ QPG UEJQQN FKUVTKEV�
• +ORCKTGF EQNQWT XKUKQP YCU PQV EQPHKTOGF YKVJ
C FKCIPQUVKE VGUV UWEJ CU CPQOCNQUEQR[�
$WEMCNGY GV
CN�� �����
7PKVGF 5VCVGU
%TQUU�UGEVKQPCN
)TCFG�+++
2UGWFQKUQEJTQOCVKE
VGUV
����� ��� 2TGXCNGPEG EQNQWT XKUKQP KORCKTOGPV��
/CNGU���
(GOCNGU���
14 ���� ���%+ ���� ������
• 2CTVKEKRCPVU YGTG XQNWPVGGTU�
• 2TGEKUG EQNQWT VGUV YCU PQV KFGPVKHKGF�
• 2CTVKEKRCPVU YGTG RCKF�
• +ORCKTGF EQNQWT XKUKQP YCU PQV EQPHKTOGF YKVJ
C FKCIPQUVKE VGUV UWEJ CU CPQOCNQUEQR[�
1UWQDGPK�
�����
5CWFK #TCDKC
%TQUU�UGEVKQPCN
)TCFG�+++
+UJKJCTC ����� ��� 2TGXCNGPEG EQNQWT XKUKQP KORCKTOGPV��
���� CNN OCNGU�• 2CTVKEKRCVKQP TCVG YCU PQV UVCVGF�
• +ORCKTGF EQNQWT XKUKQP YCU PQV EQPHKTOGF YKVJ
C FKCIPQUVKE VGUV UWEJ CU CPQOCNQUEQR[�
• 5GNGEVKQP RTQEGUU YCU WPENGCT�
4CYNKPUQP�
�����
'PINCPF
%TQUUU UGEVKQPCN
)TCFG�+++
%KV[ 7PKXGTUKV[ %QN�
QWT 8KUKQP VGUV
0QV UVCVGF ��� 2TGXCNGPEG KORCKTGF TGF�ITGGP XKUKQP��
����
2TGXCNGPEG DNWG�[GNNQY CZKU�� ����
• 2CTVKEKRCVKQP TCVG PQV UVCVGF�
• #PQOCNQUEQR[ PQV WUGF�

COLOUR VISION SCREENING
14
Table 2. Summary of studies examining the prevalence of colour vision impairment (continued)
Reference Study designand evidencegrading
Colour vision test Age (years) Sample size Results Comments
2GTG\�
%CTRKPGNN GV
CN�� �����
5RCKP
%TQUU�UGEVKQPCN
)TCFG�+++
+UJKJCTC
#PQOCNQUEQR[
���� �� 2TGXCNGPEG D[ CPQOCNQUEQR[�� ����� • 2CTVKEKRCPVU YKVJ VTKUQO[ ���
• 2CTVKEKRCVKQP TCVG ����
• 7PEGTVCKP YJGVJGT RCTVKEKRCPVU YGTG TGRTGUGPVC�
VKXG QH VJG VTKUQO[ �� RQRWNCVKQP�
/QTVQP� �����
7PKVGF 5VCVGU
&GUETKRVKXG
)TCFG�+++
#1�*44
+UJKJCTC
&XQTKPG
/GCP��� ���� 2TGXCNGPEG CNN OCNGU�� ���� • 2QUUKDNG UGNGEVKQP DKCU UKPEG VJG UVWF[ YCU EQP�
FWEVGF KP 75 CTOGF HQTEGU�
• 2QUUKDNG OKUENCUUKHKECVKQP VJTQWIJ EQFKPI CPF
VGUV TGUWNVU�
.KVVNGYQQF
CPF *[FG�
�����
#WUVTCNKC
%TQUU�UGEVKQPCN
)TCFG �+++
1JMWOC�
+UJKJCTC� #PQOCNQ�
UEQR[
#RRTQZ ���� ��� 2TGXCNGPEG� /CNGU ���
(GOCNGU ����
14 ���� ���%+ ���� �������
• 2CTVKEKRCVKQP TCVG ����
• #PQOCNQUEQR[ QPN[ WUGF HQT EQPHKTOCVKQP QH
UETGGP RQUKVKXG RCTVKEKRCPVU�
/CPP CPF
6WTPGT� �����
#WUVTCNKC
%TQUU�UGEVKQPCN
)TCFG�+++
+UJKJCTC 0QV UVCVGF ��� OCNGU� ���
HGOCNGU
2TGXCNGPEG� /CNGU ����
(GOCNGU ����
14 ���� ���%+ ���� �������
• 2QVGPVKCN UGNGEVKQP DKCU�
• 2CTVKEKRCVKQP TCVG PQV UVCVGF�
• 2QVGPVKCN OKUENCUUKHKECVKQP�
)GFFGU� �����
(KLK CPF 0GY
<GCNCPF
%TQUU�UGEVKQPCN
)TCFG�+++
+UJKJCTC ���� KP (KLK�
0QV UVCVGF KP
0<
��� (KLKCP
OCNGU� ���
(KLKCP +PFKCP
OCNGU� ���� 0<
OCNGU
2TGXCNGPEG� (KLKCPU ����
(KLKCP +PFKCPU ����
0GY <GCNCPFGTU ��
χ� � ����� R�������
• 2QVGPVKCN UGNGEVKQP DKCU�
• #PQOCNQUEQR[ YCU PQV WUGF�
• 2CTVKEKRCVKQP TCVG PQV UVCVGF�
)TKGXG� �����
'PINCPF
%TQUU�UGEVKQPCN
)TCFG�+++
+UJKJCTC ����� ��� ��� OCNGU 2TGXCNGPEG� ����� • 2QUUKDNG UGNGEVKQP DKCU 4#(� ECPFKFCVGU��
• #PQOCNQUEQR[ YCU PQV WUGF�
� 4#( � 4Q[CN #KT (QTEG
COLOUR VISION SCREENING
15
Table 2. Summary of studies examining the prevalence of colour vision impairment (continued)
Reference Study designand evidencegrading
Colour vision test Age (years) Sample size Results Comments
)TQUXGPQT�
�����
0GY <GCNCPF
%TQUU�UGEVKQPCN
)TCFG�+++
+UJKJCTC 5EJQQN EJKN�
FTGP
��� 'WTQRGCP
OCNGU� ���
/CQTK OCNGU
2TGXCNGPEG� 'WTQRGCPU ����
/CQTK ���� UKIPKHKECPV FKH�
HGTGPEG� R�������
• 2QUUKDNG UGNGEVKQP DKCU TGUWNVKPI HTQO VJG PQP�
TCPFQO UGNGEVKQP QH RCTVKEKRCVKPI UEJQQNU�
• #PQOCNQUEQR[ PQV WUGF�
• /CQTK FGHKPKVKQP TGNKGF QP RTQRQTVKQP QH K/CQTK
DNQQFL�
• 5OCNN PWODGTU KP QVJGT GVJPKE ITQWRU�
-QNKQRQWNQU GV
CN�� �����
)TGGEG
%TQUU�UGEVKQPCN
)TCFG�+++
+UJKJCTC� (CKNWTGU
EQPHKTOGF D[ CPQOC�
NQUEQR[
����� ������ OCNGU�
����� HGOCNGU
2TGXCNGPEG� /CNGU �����
(GOCNGU �����
χ� � ������ R�������
• 5GNGEVKQP OGVJQFU YGTG PQV UVCVGF�
• 2CTVKEKRCVKQP TCVG YCU PQV UVCVGF�
• #PQOCNQUEQR[ EQPHKTOGF UETGGPKPI HCKNWTGU�
2QUV� �����
#WUVTCNKC�
$TC\KN� 75#
0QP�U[UVGOCVKE
TGXKGY
)TCFG�+++
0QV UVCVGF 0QV UVCVGF ���� ���� • 0Q UGNGEVKQP FGVCKNU�
• 0Q RCTVKEKRCVKQP TCVG�
• 7PENGCT VGUVKPI OGVJQFU�
-JGTWOKCP GV
CN�� �����
(TCPEG
%TQUU�UGEVKQPCN
)TCFG�+++
#OGTKECP 1RVKECN
%QORCP[ VGUV
7PKXGTUKV[
UVWFGPVU
���� 2TGXCNGPEG� /CNGU �����
(GOCNGU �����
χ� � ������ R�������
• 7PKXGTUKV[ UVWFGPVU QPN[ RQUUKDNG UGNGEVKQP DKCU�
• #PQOCNQUEQR[ PQV WUGF�
• &KHHGTGPV OGVJQFU HQT OCNGU CPF HGOCNGU�
/KNGU� �����
7PKVGF 5VCVGU
%TQUU�UGEVKQPCN
)TCFG +++
+UJKJCTC 0QV UVCVGF ����� OCNG
OWUGWO XKUK�
VQTU� �����
HGOCNG OWUGWO
XKUKVQTU� �����
;CNG OGP
2TGXCNGPEG� /CNG OWUGWO� ����
(GOCNG OWUGWO� ����
/CNG ;CNG� ����
χ� � ������ R��������
• /WUGWO RCTVKEKRCPVU YGTG XQNWPVGGTU�
• 7PENGCT UGNGEVKQP OGVJQFU HQT VJG ;CNG ITQWR�
• #PQOCNQUEQR[ PQV WUGF�
• 7PMPQYP RCTVKEKRCVKQP TCVG�
� χ� HQT OCNG XGTUWU HGOCNG OWUGWO XKUKVQTU EQORCTKUQP

COLOUR VISION SCREENING
16
WERE THERE OTHER STUDIESINVESTIGATING THEPREVALENCE OF IMPAIREDCOLOUR VISION?
A review article (Grade III evidence) provided dataon the prevalence of impaired colour vision fromfive original studies (Pokorny et al., 1979). Onlyone of these studies could be retrieved so fourcould not be critically appraised. These four arti-cles are summarised in Table 3. The author of thisreport determined the χ2 values presented in thistable.
Table 3. Prevalence of impaired colour visionin studies that were not available forcritical appraisal.
Reference Samplesize
Results
9CCNGT�
�����
0QTYC[
����� 2TGXCNGPEG� /CNG �����
(GOCNG �����
χ� � ������ R�������
XQP 2NCPVC�
�����
5YKV\GTNCPF
���� 2TGXCNGPEG� /CNG �����
(GOCNG �����
χ� � ������ R�������
5EJOKFV�
�����
)GTOCP[
����� 2TGXCNGPEG� /CNG �����
(GOCNG �����
χ� � ������ R�������
(TCPEQKU GV
CN�� �����
$GNIKWO
����
/CNGU�
2TGXCNGPEG� /CNG �����
WHAT PROPORTION OFPEOPLE ARE UNAWARE THEYARE COLOUR VISIONIMPAIRED?
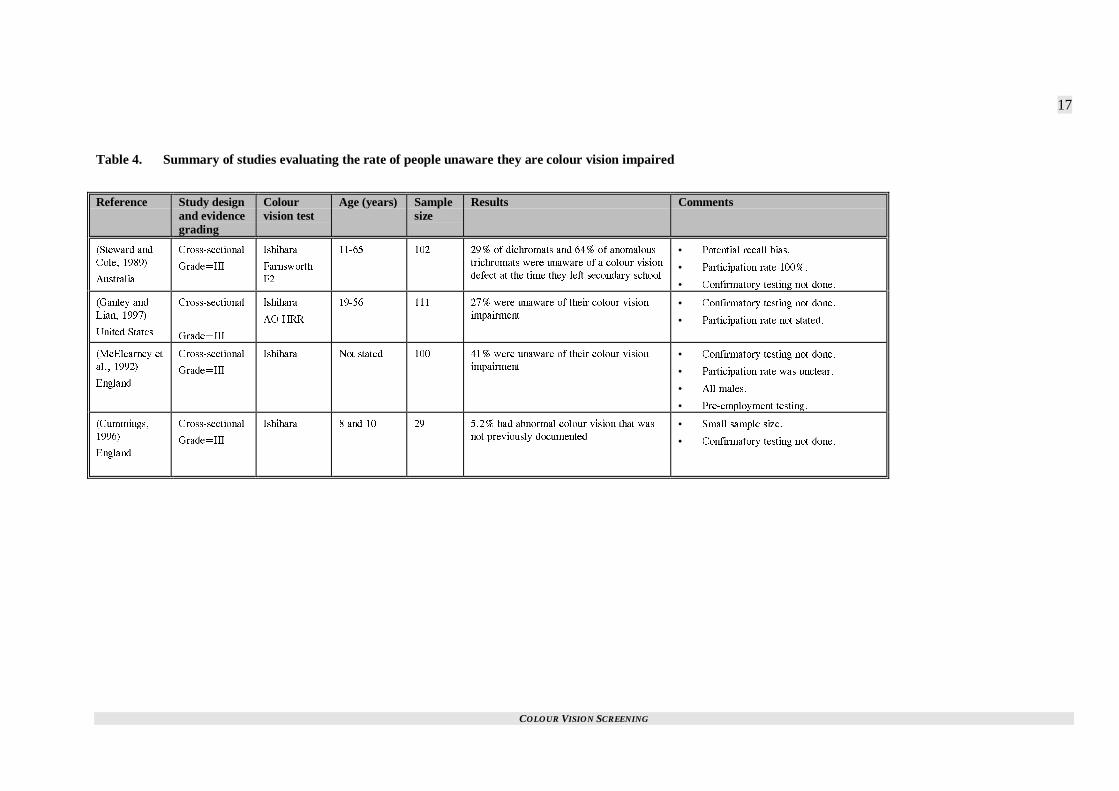
Four studies were identified that evaluated the rateof people unaware they had a colour vision im-pairment. These studies are summarised on Table 4(p. 17).
An Australian based study investigating the effectcolour vision impairment had on everyday tasksfound 71% of dichromats and 36% of anomaloustrichromats were aware of their colour vision im-pairment by the time of leaving secondary school(Steward and Cole, 1989). If it is assumed thatthere are three times as many anomalous trichro-mats as dichromats (Koliopoulos et al., 1976) thiswould suggest 55% of the colour-impaired popula-tion were unaware of the problem. A potentiallimitation of this result is the possibility of recallbias given the study population was aged between
11 and 65 years. Details of this study are presentedon p. 19.
In a study evaluating the sensitivity and specificityof slides in colour vision testing, three of 11 (27%)colour vision impaired university students (agerange and mean age not stated) were previouslyunaware of their impairment (Ganley and Lian,1997). This study was limited by using pseudoiso-chromatic tests only. More reliable results mighthave been obtained with anomaloscopy. More de-tails about this study are provided on p. 31.
In a study evaluating various types of tests for pre-employment screening, 41 of 100 participants thatfailed the Ishihara pseudoisochromatic test werepreviously unaware of any problems with colourvision (McElearney et al., 1992). More details areprovided about this study on p. 22.
A study investigating vision screening in eight andten-year-olds identified 29 children with impairedcolour vision (Cummings, 1996). In two of thesecases (5.2%) the impaired colour vision had notpreviously been documented. More details are pro-vided about this study on p. 43. It was not clearwhat proportion of children or parents were previ-ously aware of the impairment.
COLOUR VISION SCREENING
17
Table 4. Summary of studies evaluating the rate of people unaware they are colour vision impaired
Reference Study designand evidencegrading
Colourvision test
Age (years) Samplesize
Results Comments
5VGYCTF CPF
%QNG� �����
#WUVTCNKC
%TQUU�UGEVKQPCN
)TCFG�+++
+UJKJCTC
(CTPUYQTVJ
(�
����� ��� ��� QH FKEJTQOCVU CPF ��� QH CPQOCNQWU
VTKEJTQOCVU YGTG WPCYCTG QH C EQNQWT XKUKQP
FGHGEV CV VJG VKOG VJG[ NGHV UGEQPFCT[ UEJQQN
• 2QVGPVKCN TGECNN DKCU�
• 2CTVKEKRCVKQP TCVG �����
• %QPHKTOCVQT[ VGUVKPI PQV FQPG�
)CPNG[ CPF
.KCP� �����
7PKVGF 5VCVGU
%TQUU�UGEVKQPCN
)TCFG�+++
+UJKJCTC
#1�*44
����� ��� ��� YGTG WPCYCTG QH VJGKT EQNQWT XKUKQP
KORCKTOGPV• %QPHKTOCVQT[ VGUVKPI PQV FQPG�
• 2CTVKEKRCVKQP TCVG PQV UVCVGF�
/E'NGCTPG[ GV
CN�� �����
'PINCPF
%TQUU�UGEVKQPCN
)TCFG�+++
+UJKJCTC 0QV UVCVGF ��� ��� YGTG WPCYCTG QH VJGKT EQNQWT XKUKQP
KORCKTOGPV
• %QPHKTOCVQT[ VGUVKPI PQV FQPG�
• 2CTVKEKRCVKQP TCVG YCU WPENGCT�
• #NN OCNGU�
• 2TG�GORNQ[OGPV VGUVKPI�
%WOOKPIU�
�����
'PINCPF
%TQUU�UGEVKQPCN
)TCFG�+++
+UJKJCTC � CPF �� �� ���� JCF CDPQTOCN EQNQWT XKUKQP VJCV YCU
PQV RTGXKQWUN[ FQEWOGPVGF
• 5OCNN UCORNG UK\G�
• %QPHKTOCVQT[ VGUVKPI PQV FQPG�
COLOUR VISION SCREENING
18
SUMMARY
There was little data on the prevalence of impairedcolour vision in New Zealand. The literature re-trieved was problematic in terms of the populationssurveyed. Generalisability to New Zealand is al-ways a difficult issue in studies conducted else-where. Therefore, given the range of countries fromwhich prevalence data has been published, it wasnot possible to have any degree of confidence inestimating the prevalence in New Zealand. Otherstudies that evaluated the prevalence in particularpopulations (Rawlinson, 1993; Perez-Carpinell etal., 1994, Morton, 1975) were problematic giventheir potential selection biases.
Generally the studies reported prevalence based onscreening tests rather than diagnostic tests, few ofthe studies documented a participation rate and theparticipants were not randomly selected. Differentstudies used different pass/fail criteria for the samescreening test.
Bearing these issues in mind, the prevalence fig-ures should be treated with considerable caution.
A summary figure for the prevalence of impairedcolour vision was derived by aggregating (weight-ing by sample size) all the data except those wherethe results were not differentiated by gender(Macfarlane et al., 1987) and the study investigat-ing prevalence in trisomy 21 (Perez-Carpinell et al.,1994). The four studies that could not be criticallyappraised were included. By doing this a preva-lence of 7.3% was identified in males.
This data is helpful in terms of:
� Identifying the magnitude of the problem.� Estimating other data such as positive and
negative predictive values in conjunction withparticular colour vision screening tests.
However, it was also important to estimate howmany unidentified cases of impaired colour visionwere detected through screening. There were threestudies evaluating this question and in each case asignificant proportion of participants were previ-ously unaware of their impaired colour vision.However, this data was not derived from a NewZealand population. The results of these studies arelikely to be highly dependent on whether the par-ticipants were screened prior to conduct of thestudy. The ideal situation would be to conduct thisstudy in a country with no screening programme sothe impact of removing a programme could be es-timated.
In the three studies evaluating the proportion un-aware of their colour vision impairment a weighted
mean (by sample size) of 40% were unaware of thedeficit.
It is therefore concluded that bearing in mind thelimitations previously described:
Of the approximately 7% of the male populationwith congenitally impaired colour vision ap-proximately 40% of that population appears tobe unaware of the defect prior to leaving secon-dary school.
COLOUR VISION SCREENING
19
Disability
INTRODUCTION
Generally, screening programmes are introducedfor conditions with a significant public health im-pact. A significant public health impact requiresconsideration of the prevalence (see previous sec-tion), morbidity and mortality resulting from thecondition. Other disabilities resulting from the con-dition should also be considered when evaluating ascreening programme. The question of whethercolour vision screening might detect other diseasesbefore they would otherwise be detected was alsoconsidered since earlier treatment of such condi-tions might have resulted in improved health status.
In considering colour vision screening, most of theimpact concerns the disability category. Impairedcolour vision has implications concerning the per-formance of household activities, educational ac-tivities and occupational activities. Considerationshould also be given to morbidity and mortalitythrough the indirect mechanism of road trafficcrashes that occurred as a result of the impairedcolour vision. Impaired colour vision might alsohave implications concerning social and emotionaldevelopment (Evans, 1992).
WHAT EFFECT DOES IMPAIREDCOLOUR VISION HAVE ONDAILY HOUSEHOLDACTIVITIES?
One study was identified that evaluated the effectcolour vision impairment had on daily householdliving. That study is summarised in Table 5 (p. 21).
Steward and Cole, 1989
This study enrolled 102 patients who were colourvision impaired (tested using the Ishihara test andthe Farnsworth F2 plate). The participants wereaged between 11 and 65 years (mean age notstated) and had consecutively presented to an op-tometrist. The study had a 100% response rate.
Dichromats reported significantly more difficultywith everyday tasks (such as selection of colouredgoods, household tasks, plant and flower recogni-tion, and with the selection of ripe fruits and vege-tables) than anomalous trichromats. The resultswere similar with driving difficulties. Forty nine
percent of dichromats reported “ever experiencingdifficulty distinguishing the colour of trafficlights.” Other common complaints were confusionbetween traffic lights and streetlights as well asdifficulty seeing brake lights on other cars.
Colour vision impairment influenced career choicesin 43% of dichromats and 29% of anomalous tri-chromats. Having colour difficulties with everdaywork was a common complaint (46% of dichromatsand 15% of anomalous trichromats).
Limitations of the study included:
� This study was uncontrolled.� Comparison with a group with normal colour
vision would have been desirable. However, itprovided estimates of the prevalence of im-pairment in performing functional living tasks,although we do not know how this compares tothe normal colour vision population.
� The study was set in Australia so generalis-ability to New Zealand was unclear.
WHAT EFFECT DOES IMPAIREDCOLOUR VISION HAVE ONEDUCATION?
Two cohort studies and one review was identifiedthat examined the relationship between impairedcolour vision and education. These studies aresummarised in Table 5 (p. 21).
Lampe, 1973
A cohort study (Grade II-2 evidence) comparededucational outcome in colour deficient schoolchil-dren with schoolchildren who were not colour vi-sion impaired. There were 161 randomly selectedchildren with normal colour vision (age range fiveto seven years) and 80 colour vision impaired chil-dren (age range five to seven years). Both groupswere identified at kindergarten and first grade leveland outcome was assessed with the StanfordAchievement test a year later.
There was no significant difference in outcomebetween the two groups for either year.
Limitations of the study included:
� There was no baseline data to compare the twogroups.
� Anomaloscopy was not used to assign colourvision status. The prevalence of impaired col-our vision in boys was low at 3.5% indicatinga possible misclassification error. If impairedcolour vision was underdiagnosed, any differ-ence in outcome might have been diluted.
COLOUR VISION SCREENING
20
� The outcome data was measured a relativelyshort time after school entry so systematic dif-ferences in outcome might not have developed.
� The generalisability of the study is doubtfulsince this study was conducted in the UnitedStates during 1967 to 1969.
Mandola, 1969
Twenty colour deficient boys at primary schoolwere compared with 20 randomly selected boys ofthe same age range (seven to 12 years, mean agenot stated) with normal colour vision. There wereno significant differences in outcome (based onStanford Achievement tests, intelligence test scoresand teachers' marks for writing).
Limitations of the study included:
� no baseline data� small sample size� imprecise outcome measures� imprecise measure of colour deficiency� uncertain generalisability.
Voke, 1978b
In an early non-systematic review (Grade III evi-dence) of defective colour vision and education,there was no evidence describing an associationbetween poor educational achievement and colourvision impairment. In a study of career choice in355 colour-impaired children between 10 and 18years of age, 62% had chosen careers that weredeemed inappropriate for their impairment. It wasnoted that Ishihara’s test is particularly sensitivebut is not useful in differentiating between mildand severe impairment (which has more practical,long-term implications than the mere presence ofcolour vision impairment).

COLOUR VISION SCREENING
21
Table 5. Disability associated with colour vision impairment
Reference Study designand evidencegrading
Setting Age (years) Samplesize
Results Comments
5VGYCTF CPF
%QNG� �����
#WUVTCNKC
%TQUU�UGEVKQPCN
)TCFG�+++
2CVKGPVU RTG�
UGPVKPI VQ CP
QRVQOGVTKUV
����� ��� &KEJTQOCVU OQTG NKMGN[ VQ TGRQTV EQPHWUKQP
YKVJ GXGT[FC[ VCUMU� FTKXKPI CPF KPHNWGPE�
KPI ECTGGT EJQKEGU VJCP CPQOCNQWU VTKEJTQ�
OCVU�
• %QORCTKUQP YKVJ C ITQWR YKVJ PQTOCN
EQNQWT XKUKQP OKIJV JCXG DGGP WUGHWN�
• 2CTVKEKRCVKQP TCVG �����
.CORG� �����
7PKVGF 5VCVGU
%QJQTV
)TCFG�++��
5EJQQN ��� ��� 0Q UKIPKHKECPV FKHHGTGPEG KP 5VCPHQTF
CEJKGXGOGPV VGUVU KP KORCKTGF XGTUWU PQTOCN
EQNQWT XKUKQP
• 0Q DCUGNKPG FCVC�
• #PQOCNQUEQR[ PQV WUGF�
• 1WVEQOG FCVC OGCUWTGF C TGNCVKXGN[
UJQTV VKOG CHVGT UEJQQN GPVT[�
/CPFQNC�
�����
7PKVGF 5VCVGU
%QJQTV
)TCFG�++��
5EJQQN 2TKOCT[
5EJQQN
�� 0Q UKIPKHKECPV FKHHGTGPEG KP 5VCPHQTF
CEJKGXGOGPV VGUVU KP KORCKTGF XGTUWU PQTOCN
EQNQWT XKUKQP
• 0Q DCUGNKPG FCVC�
• #PQOCNQUEQR[ PQV WUGF�
• 1WVEQOG FCVC OGCUWTGF C TGNCVKXGN[
UJQTV VKOG CHVGT UEJQQN GPVT[�
• 5OCNN UCORNG UK\G�
8QMG� ����D�
'PINCPF
0QP�U[UVGOCVKE
TGXKGY
)TCFG�+++
%QNQWT KO�
RCKTGF EJKN�
FTGP
����� ��� ��� JCF EJQUGP ECTGGTU FGGOGF KPCRRTQ�
RTKCVG HQT VJGKT EQNQWT XKUKQP KORCKTOGPV
• +PCRRTQRTKCVG ECTGGTU YGTG PQV NKUVGF�
• 2CTVKEKRCVKQP TCVG PQV UVCVGF�

COLOUR VISION SCREENING
22
WHAT EFFECT DOES IMPAIREDCOLOUR VISION HAVE ONOCCUPATIONALPERFORMANCE?
The studies that evaluated the role colour visionimpairment had on occupational performance aresummarised in Table 6 (p. 24).
While the Ishihara pseudoisochromatic test (andother similar screening tests) are useful for identi-fying colour vision impairment, the degree of im-pairment is critical when considering occupationalfactors. The pseudoisochromatic tests are not suit-able for this task and it has been suggested thatthere is no ideal test for occupational purposes(Voke, 1978a). This was documented in a non-systematic review (Grade III evidence) so shouldbe treated with caution.
Mertens and Milburn, 1996
This study assessed the need for normal colourvision in air traffic control tasks. There were 121participants with normal colour vision and 123 withimpaired colour vision as diagnosed by Nagelanomaloscopy.
Four air traffic control tasks were used to assesssuitability for performance of that role. These taskshad been previously validated as representing tasksthat occur in the performance of air traffic controlduties. Overall, 6.6% of normal trichromats failedthe tests compared with 95.1% of those with im-paired colour vision. This was a significant differ-ence (p<0.0001). The probability of error increasedwith the severity of deficiency.
Limitations included:
� There was a lack of statistical comparisonbetween those with normal colour vision andthose with impaired colour vision by theauthors of the study but χ2 testing by theauthor of this report confirmed the significanceof the difference between the two groups.
� It was unclear from the study how participantswere selected.
� The study was conducted in the United Statesso its generalisability was unclear, althoughgiven the nature of the test was probably nottoo good.
Kuyk et al., 1986
Similar results were found in another study of airtraffic control (Kuyk et al., 1986). The 110 partici-pants were given a battery of colour vision tests(Dvorine, Ishihara, F-M 100 Hue and Panel D-15)
to determine and classify impaired colour vision.Nine participants were classified as protans and 22as deutans. Four tests that simulated daily air trafficcontrol tasks were used to assess the validity ofclinical testing.
The ability of all severe protans (seven partici-pants) was significantly reduced on all tests com-pared with those with normal colour vision(p<0.001).
Limitations of the study included:
� There was insufficient power to assess thepresence of a dose response curve.
� The participation rate was not stated and themethod of selecting participants was unclear.
� This study was conducted in the United Statesso has unclear generalisability.
Kuyk et al., 1987
The results for the deutans (Kuyk et al., 1987) werepresented separately from the protans (Kuyk et al.,1986). Mild deutans were able to perform the fourtasks with the same ability as the normal visionparticipants but moderate deutans were rated at79% of normal performance and severe deutans at62% of normal. Overall, the Farnsworth D-15 rela-tive error score was the best predictor of deutanperformance, explaining 60% of the variance.When combined with the Dvorine test 72% of thevariance was explained.
This study had the same limitations as the previousone.
McElearney et al., 1992
A descriptive study (Grade III evidence) evaluatedthe Ishihara test, the Electrical Supply Industry test(ESI) and the Giles Archer Lantern test in pre-employment screening for colour vision impair-ment for aircraft mechanical occupations. Therewere 1020 male participants.
One hundred participants failed the Ishihara test but61 of these passed both the ESI and lantern testsand a further 23 passed one of these tests. No onewho failed the ESI or lantern tests passed the Ishi-hara test. In this study, 83% of the candidates whofailed some part of the screening battery wereplaced successfully.
Limitations of the study included:
� There was a lack of ability to determine theappropriateness of the placements.
� It appeared as though the participation rate was100% (since colour vision screening was part
COLOUR VISION SCREENING
23
of the pre-employment battery) although thiswas not categorically stated.
� The study was set in England so its generalis-ability to New Zealand is unclear.
Vingrys and Cole, 1988
A review of colour vision examining the need forstandards in the transport industry was conductedin Australia. In the laboratory setting five trialswere identified that found colour defective observ-ers made significantly more errors in recognition ofcoloured signal lights and they had significantlyslower reaction times.
Six studies were identified that compared motorvehicle crash statistics between those with normalcolour vision and those with impaired colour vi-sion. Four of the studies did not find any significantdifferences between the two groups. One study thatidentified significantly more crashes in the colour-impaired group was criticised for not detailing therelative gender ratios in the two groups. The otherstudy showed that protans had almost twice asmany rear end collisions as a proportion of theirtotal crashes compared with normals (p<0.05) anddeutans (p<0.02) under wet conditions.
It was unfortunate that the methods employed inidentifying these studies was not detailed and itwould have been useful to calculate the power ofthe studies with the negative results.
Donderi, 1994
This study assessed the importance of colour visionin search and rescue operations at sea. The Dvorinepseudoisochromatic plates and the F-M 100-huetest were used to evaluate colour vision. Search andrescue performance was evaluated by arbitrarilydefining “opportunities” to detect life rafts (de-pendent on viewing distance and weather condi-tions). There were 57 participants and 588 watches.
Fewer errors on colour vision testing was corre-lated with better life raft detection rates in daylightand night searches. On multiple regression analysis(controlling for the weather and visual acuity andusing percentage of rafts detected as the dependentvariable) the correlation coefficient for colour er-rors in daylight search was –0.40 (p<0.002). Thatis, those individuals who made fewer colour errorslocated more life rafts (everything else controlledfor) during daylight hours.
Limitations included:
� There was a possible misclassification error inpercentage of rafts detected due to the arbitrarynature of defining “opportunities” for sighting.
� There was a possible misclassification error onthe colour vision testing due to expected errorson testing that are not related to colour vision.
� Other factors were not considered in the multi-ple regression analysis, such as duration ofwatch.
� The study was conducted under exercise con-ditions.
� The study was conducted in Canada so thegeneralisability was unclear.
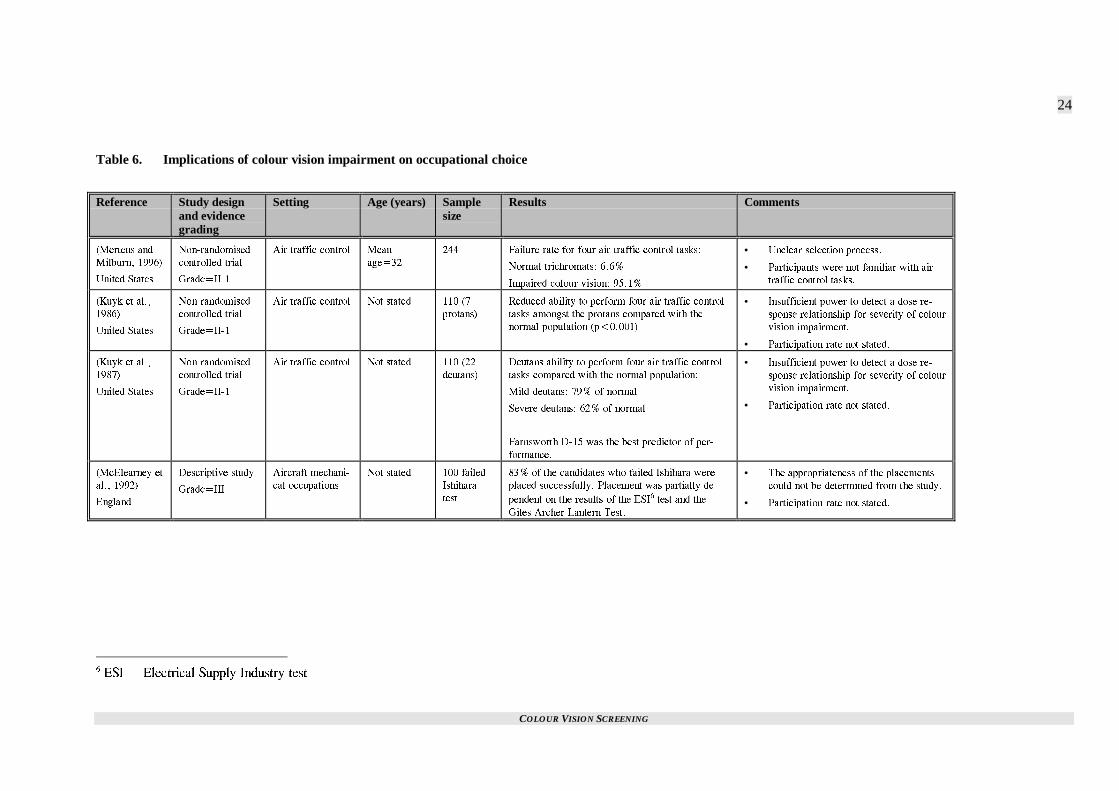
COLOUR VISION SCREENING
24
Table 6. Implications of colour vision impairment on occupational choice
Reference Study designand evidencegrading
Setting Age (years) Samplesize
Results Comments
/GTVGPU CPF
/KNDWTP� �����
7PKVGF 5VCVGU
0QP�TCPFQOKUGF
EQPVTQNNGF VTKCN
)TCFG�++��
#KT VTCHHKE EQPVTQN /GCP
CIG���
��� (CKNWTG TCVG HQT HQWT CKT VTCHHKE EQPVTQN VCUMU�
0QTOCN VTKEJTQOCVU� ����
+ORCKTGF EQNQWT XKUKQP� �����
• 7PENGCT UGNGEVKQP RTQEGUU�
• 2CTVKEKRCPVU YGTG PQV HCOKNKCT YKVJ CKT
VTCHHKE EQPVTQN VCUMU�
-W[M GV CN��
�����
7PKVGF 5VCVGU
0QP�TCPFQOKUGF
EQPVTQNNGF VTKCN
)TCFG�++��
#KT VTCHHKE EQPVTQN 0QV UVCVGF ��� �
RTQVCPU�
4GFWEGF CDKNKV[ VQ RGTHQTO HQWT CKT VTCHHKE EQPVTQN
VCUMU COQPIUV VJG RTQVCPU EQORCTGF YKVJ VJG
PQTOCN RQRWNCVKQP R�������
• +PUWHHKEKGPV RQYGT VQ FGVGEV C FQUG TG�
URQPUG TGNCVKQPUJKR HQT UGXGTKV[ QH EQNQWT
XKUKQP KORCKTOGPV�
• 2CTVKEKRCVKQP TCVG PQV UVCVGF�
-W[M GV CN��
�����
7PKVGF 5VCVGU
0QP�TCPFQOKUGF
EQPVTQNNGF VTKCN
)TCFG�++��
#KT VTCHHKE EQPVTQN 0QV UVCVGF ��� ��
FGWVCPU�
&GWVCPU CDKNKV[ VQ RGTHQTO HQWT CKT VTCHHKE EQPVTQN
VCUMU EQORCTGF YKVJ VJG PQTOCN RQRWNCVKQP�
/KNF FGWVCPU� ��� QH PQTOCN
5GXGTG FGWVCPU� ��� QH PQTOCN
(CTPUYQTVJ &��� YCU VJG DGUV RTGFKEVQT QH RGT�
HQTOCPEG�
• +PUWHHKEKGPV RQYGT VQ FGVGEV C FQUG TG�
URQPUG TGNCVKQPUJKR HQT UGXGTKV[ QH EQNQWT
XKUKQP KORCKTOGPV�
• 2CTVKEKRCVKQP TCVG PQV UVCVGF�
/E'NGCTPG[ GV
CN�� �����
'PINCPF
&GUETKRVKXG UVWF[
)TCFG�+++
#KTETCHV OGEJCPK�
ECN QEEWRCVKQPU
0QV UVCVGF ��� HCKNGF
+UJKJCTC
VGUV
��� QH VJG ECPFKFCVGU YJQ HCKNGF +UJKJCTC YGTG
RNCEGF UWEEGUUHWNN[� 2NCEGOGPV YCU RCTVKCNN[ FG�
RGPFGPV QP VJG TGUWNVU QH VJG '5+� VGUV CPF VJG
)KNGU #TEJGT .CPVGTP 6GUV�
• 6JG CRRTQRTKCVGPGUU QH VJG RNCEGOGPVU
EQWNF PQV DG FGVGTOKPGF HTQO VJG UVWF[�
• 2CTVKEKRCVKQP TCVG PQV UVCVGF�
� '5+ � 'NGEVTKECN 5WRRN[ +PFWUVT[ VGUV
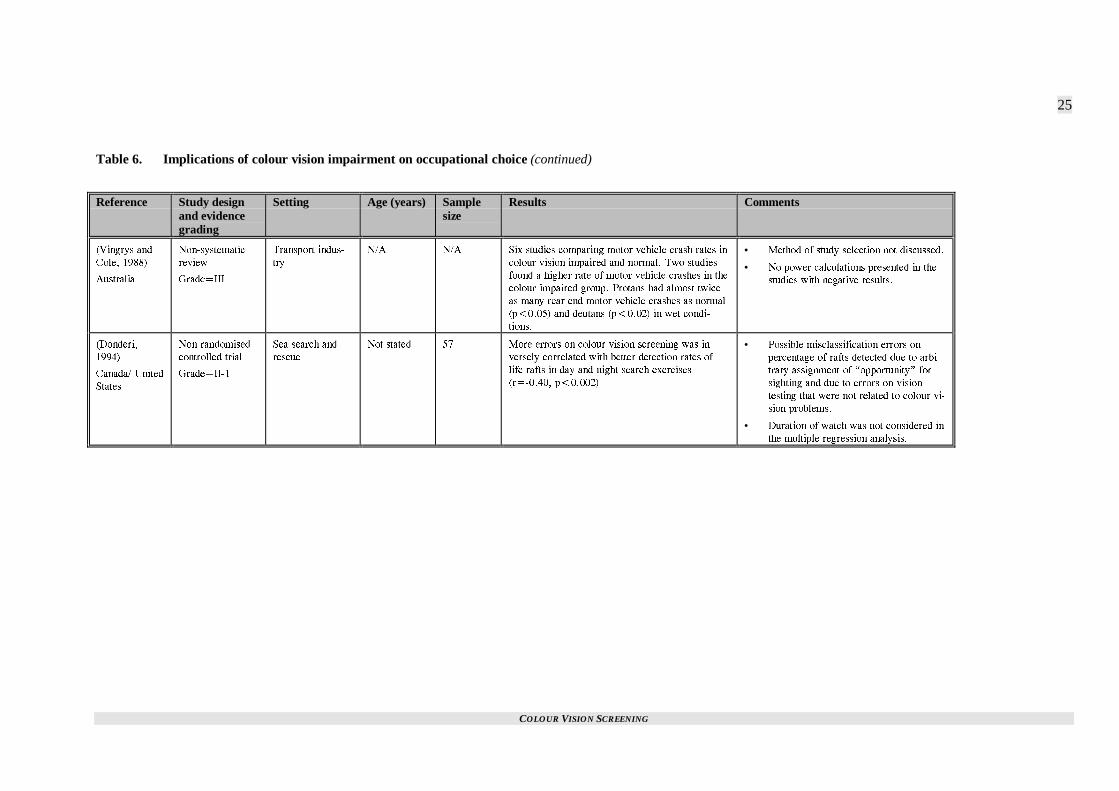
COLOUR VISION SCREENING
25
Table 6. Implications of colour vision impairment on occupational choice (continued)
Reference Study designand evidencegrading
Setting Age (years) Samplesize
Results Comments
8KPIT[U CPF
%QNG� �����
#WUVTCNKC
0QP�U[UVGOCVKE
TGXKGY
)TCFG�+++
6TCPURQTV KPFWU�
VT[
0�# 0�# 5KZ UVWFKGU EQORCTKPI OQVQT XGJKENG ETCUJ TCVGU KP
EQNQWT XKUKQP KORCKTGF CPF PQTOCN� 6YQ UVWFKGU
HQWPF C JKIJGT TCVG QH OQVQT XGJKENG ETCUJGU KP VJG
EQNQWT�KORCKTGF ITQWR� 2TQVCPU JCF CNOQUV VYKEG
CU OCP[ TGCT GPF OQVQT XGJKENG ETCUJGU CU PQTOCN
R������ CPF FGWVCPU R������ KP YGV EQPFK�
VKQPU�
• /GVJQF QH UVWF[ UGNGEVKQP PQV FKUEWUUGF�
• 0Q RQYGT ECNEWNCVKQPU RTGUGPVGF KP VJG
UVWFKGU YKVJ PGICVKXG TGUWNVU�
&QPFGTK�
�����
%CPCFC� 7PKVGF
5VCVGU
0QP�TCPFQOKUGF
EQPVTQNNGF VTKCN
)TCFG�++��
5GC UGCTEJ CPF
TGUEWG
0QV UVCVGF �� /QTG GTTQTU QP EQNQWT XKUKQP UETGGPKPI YCU KP�
XGTUGN[ EQTTGNCVGF YKVJ DGVVGT FGVGEVKQP TCVGU QH
NKHG TCHVU KP FC[ CPF PKIJV UGCTEJ GZGTEKUGU
T������� R�������
• 2QUUKDNG OKUENCUUKHKECVKQP GTTQTU QP
RGTEGPVCIG QH TCHVU FGVGEVGF FWG VQ CTDK�
VTCT[ CUUKIPOGPV QH KQRRQTVWPKV[L HQT
UKIJVKPI CPF FWG VQ GTTQTU QP XKUKQP
VGUVKPI VJCV YGTG PQV TGNCVGF VQ EQNQWT XK�
UKQP RTQDNGOU�
• &WTCVKQP QH YCVEJ YCU PQV EQPUKFGTGF KP
VJG OWNVKRNG TGITGUUKQP CPCN[UKU�

COLOUR VISION SCREENING
26
WHAT EFFECT DOES IMPAIREDCOLOUR VISION HAVE ONMOTOR VEHICLE CRASHRATES?
One review of motor vehicle crash rates was identi-fied in the search (Vingrys and Cole, 1988). Thisnon-systematic review was discussed in the sectionon occupational issues.
In a study in Germany, 2058 motor vehicle crashescaused by male drivers were investigated for theeffect impaired colour vision had on the crash rates(Verriest et al., 1980). A descriptive design wasused (Grade III evidence). Motor vehicle crasheswere caused by a colour deficient driver in 8.4% ofcases. The authors suggested that since this figureapproximates the prevalence of impaired colourvision among males there was no evidence for anincreased risk among that group.
However, protans had a higher proportion of theircrashes resulting from rear end collisions (43%versus 26% in normals, p<0.05). This suggests thetype of crash rather than the rate of crashes is dif-ferent in the colour normal and colour deficientpopulations.
Limitations of this study included:
� The assumption that the prevalence of colourvision impairment is 8.4% in male drivers inGermany was not backed up by data. There-fore, the reliability of the authors' claim con-cerning no excess risk in colour-impairedmales must be doubted.
� The rate of motor vehicle crashes with data oncolour vision status of the driver responsible(the study was retrospective) was not dis-cussed.
� The generalisability was unclear.
WHAT SPECIFIC CONDITIONSARE ASSOCIATED WITH ADISTURBANCE OF COLOURVISION?
Prior to establishing whether any conditions arelikely to be detected first by colour vision screen-ing it was necessary to identify conditions that re-sult in impaired colour vision.
van Everdingen et al., 1992
A family study of an X linked progressive conedystrophy suggested colour vision testing coulddetect the disorder prior to the onset of symptoms.This was on the basis of three family members
aged 10, 16 and 20 years who were presumed tohave the condition (based on a family tree) andwho had abnormal colour vision. The three patientswere not diagnosed with other conditions that couldexplain the colour vision findings and they werepart of a family with extensive documentation of Xlinked progressive cone dystrophy.
It would have been helpful if these patients werefollowed to monitor development of other charac-teristic findings. It was also disappointing that theprevalence of this condition was not discussed.
Verrotti et al., 1995
Abnormal colour vision is observed in diabetesprior to the onset of angiographically diagnoseddiabetic retinopathy. A cohort study comparingdiabetic children (aged 8-13 years) with childrenwith no personal or family history of diabetesfound significantly worse colour vision (as meas-ured by total errors on the F-M 100-hue test) atinitial entry to the study (p=0.0004) and at sevenyears follow-up in the diabetes group.
Only two patients developed fluorescein angio-graphic signs of retinopathy so it was not possibleto examine the relationship between colour visionand retinopathy.
Hardy et al., 1992
Hardy et al suggest the colour vision impairment indiabetics may not be associated with vascular dis-ease. This was the conclusion of a cohort study(Grade II-2 evidence) comparing 38 type 1 diabet-ics with 38 age-matched non-diabetics. The dia-betic group (which had no evidence of retinopathy)had significantly more errors on testing with the F-M 100-hue test than the controls (p<0.001). Therewas no association with duration of diabetes orwith biochemical measures of diabetic control(glycated haemoglobin, HbA1c). Since vascularabnormalities are associated with both those fac-tors, it was suggested that impaired colour visionoccurs as a result of diabetes per se rather than pre-ceding retinopathy.
It should be acknowledged that this evidence isindirect so the authors’ conclusion should betreated with caution in the latter study. However,the results of the two previous studies reveal con-flicting results and therefore colour vision testingcannot be recommended as a means of early detec-tion of retinopathy on current evidence.
Based on this study it would be unlikely that dia-betes would first be detected by colour visionscreening. The study had insufficient power to sat-isfactorily assess its role in the routine evaluation
COLOUR VISION SCREENING
27
of diabetics. It was set in Italy so its generalisabil-ity to New Zealand was unclear.
SUMMARY
Given that there is no satisfactory treatment forcolour vision deficiencies (See p. 2) it would bedesirable to know whether a knowledge of havingimpaired colour vision results in fewer educational,occupational and motor vehicle crash problemscompared with those who do not know they arecolour vision impaired. It is very difficult to answerthis question and there was an absence of suchstudies identified in this report.
Therefore, it was concluded that:
It was not possible to identify the impact colourvision screening has on reducing educationaland occupational difficulties or motor vehiclecrash rates.
It would also be useful to have an understanding ofthe same outcome measures in a group with im-paired colour vision and a group with normal col-our vision. Some literature does exist on this sub-ject. There were six such studies in a review ofmotor vehicle crash rates. There were no articlesidentified that compared health status in the twogroups.
Of the six studies comparing road traffic crashrates, four found no significant difference betweenthe impaired and normal colour vision groups. Thismight have been due to a lack of power in thesestudies. Of the two with a positive result one wascriticised for the lack of detail concerning relativegender proportions. The other found rear end colli-sions in wet weather were responsible for almostdouble the proportion of crashes in those with im-paired colour vision compared with normals. Giventhese inconsistent results, it was concluded that:
There was insufficient evidence to either agreeor disagree with the hypothesis that those withimpaired colour vision have more road trafficcrashes.
Three sources of data did not find any relationshipbetween impaired colour vision and educationalattainment. However, the data was characterised byshort follow-up so it was concluded that:
Further research was required to assess the roleimpaired colour vision has on educational at-tainment.
Bearing in mind the limitations discussed, the datafrom occupational studies provided some supportfor:
Those involved in air traffic control and seasearch and rescue operations should have nor-mal colour vision. Research on other occupa-tions which normally restrict those with im-paired colour vision was not identified in thisreport but it should not be assumed that suchrestrictions are unnecessary.
In considering health status issues it was useful toconsider whether colour vision screening might bethe first method of detecting other adverse healthoutcomes. This required a consideration of condi-tions that result in abnormal colour vision. Suchconditions included diabetes, optic atrophy, opticneuritis, cone dystrophies and various medications.Of these conditions only the cone dystrophies ap-peared to be relevant to this question. Cone dystro-phies are extremely rare at pre-adolescent years soit was concluded that:
There was insufficient evidence for the use ofcolour vision screening as a method of first de-tection of an adverse health outcome other thanimpaired colour vision.
COLOUR VISION SCREENING
29
Screening tests
INTRODUCTION
A range of colour vision tests exist (Birch, 1993).These tests can be classified into:
� anomaloscopes� pseudoisochromatic tests� hue discrimination tests� lanterns� others
The anomaloscopes are regarded as the gold stan-dard test for impaired vision on the red-green axisand are therefore used for diagnostic purposes.
The pseudoisochromatic tests are the most commonscreening tests. Specific types include:
� Ishihara� American Optical Hardy-Rand-Rittler (AO-
HRR)� Dvorine� F2� Ohkuma� Standard pseudoisochromatic plates 1st and 2nd
editions (SPP-1 and SPP-2)
The hue discrimination tests include:
� Farnsworth D15� Desaturated D15� Farnsworth-Munsell 100-hue (F-M 100-hue)
These tests are commonly used for classificationand grading as well as vocational purposes.
The lantern tests, such as Giles-Archer, are used forvocational purposes.
Other tests include the City University Colour Vi-sion Test (CUCVT). This test provides for thescreening of impaired colour vision on the blue-yellow axis as well as the red-green axis so is alsouseful for acquired defects. It was derived from theFarnsworth D15 test and contains the same Munsellhues with the addition of a neutral grey (Birch,1997b).
Viewing conditions have different effects on dif-ferent colour vision tests (Somerfield et al., 1989).In this study 120 participants were randomly as-signed to one of 12 viewing conditions (varied byviewing distance and duration). The tests employedwere Ishihara pseudoisochromatic test, the Stan-dard Pseudoisochromatic plates for congenital vi-sion defects (SPP-1) and for acquired defects (SPP-2) as well as the CUCVT.
The proportion of errors on the tests significantlyincreased (p<0.0001) as viewing duration de-creased and viewing distance increased. The rate oferrors varied with the different tests. The Ishiharatest was least susceptible to error under differentconditions.
Limitations of the study included:
� A small number of participants with impairedcolour vision.
� The colour vision status of each participantwas not assessed through anomaloscopy so thepossibility of misclassification bias should beconsidered.
Measures that should be evaluated in the develop-ment of a screening programme include a range ofitems that relate to the validity of the screening test.These include:
� sensitivity� specificity� repeatability� acceptability
The positive predictive value and negative predic-tive value should also be tested. These two meas-ures are not strictly an assessment of validity sincethey depend on prevalence as well as sensitivityand specificity, but they are important factors forconsidering a test as suitable as a population-basedscreening test.
WHAT IS THE SENSITIVITYAND SPECIFICITY OFCURRENTLY USED SCREENINGTESTS FOR COLOUR VISIONIMPAIRMENT?
Seven studies were identified that examined thesensitivity and specificity of specific colour visiontests in the same study. These studies are summa-rised in Table 8 (p. 32).
Pease and Allen, 1988
The Pease-Allen Colour Test (PACT) was evalu-ated with a view to using it in children aged four tosix years.
This evaluation consisted of:
1. Screening with PACT and other colour visiontests in an adult population with 233 adultsaged between 20 and 63 years (mean age=28years). The results were compared with Nagelanomaloscope findings.

COLOUR VISION SCREENING
30
2. A group of 47 adults with red-green colourdeficiency on the basis of anomaloscope find-ings.
3. A group of 109 children aged three to six yearsusing the AO HRR test as a gold standard.
In group 1, PACT had a sensitivity of 87% andspecificity of 100%. Kappa, the coefficient ofagreement, was 0.92 for PACT. The Ishihara testplates had a sensitivity of 96%, specificity of 100%and kappa was 0.98. Agreement was less for F-2,AO-HRR and Panel D-15. In the children 3.6% ofboys and 1.9% of girls were identified as colourdefective with PACT which compared with 10% onF-2 testing and 38.5% using traditional criteria forAO-HRR.
Limitations of this study were:
� The comparison group was inappropriate fortesting the validity of the screening test in theyoung age group.
� The authors attempted to compare the resultsof PACT, F-2 and AO-HRR with those ex-pected in the child population but it is unclearif the population selected was representative ofthe general population. It was interesting thatthe rate of identification of those with colourimpairment in the adult population was higherthan would be expected from standard preva-lence data.
Lee et al., 1997
The Kojima-Matsubara colour vision test plateswere evaluated by comparing with anomaloscopy.The first stage of this evaluation involved 20 colournormal adults and 13 red-green deficient adultsaged 22 to 31 years.
Specificity and sensitivity were 90% and 7.7% re-spectively based on interpretation recommended bythe manufacturer. Therefore, this test cannot berecommended.
Mantyjarvi, 1991b
The Velhagen Pflugertrident pseudoisochromaticplates were evaluated by comparing the results with425 students who were also tested with anomalo-scopy. The participants were aged between 16 and26 years.
The sensitivity of the test was 61.3% and specific-ity was 100%. Because of the low sensitivity thetest was considered inappropriate for screeningpurposes.
Limitations included:
� There was no direct comparison with otherscreening tests.
� The participation rate was 85.3%.� Generalisability was uncertain since the study
was conducted in Finland.
Dain et al., 1997
The performance of the Hahn pseudoisochromatictest was compared with other tests including Ishi-hara’s pseudoisochromatic test, Standard pseudoi-sochromatic plates, Farnsworth-Munsell D-15plates, Farnsworth Lantern and anomaloscopy.
There were 58 colour vision impaired participants(who had been referred to an optometry colour vi-sion clinic) and 68 participants with normal colourvision. The age range was nine to 59 years (meanage = 27 years).
Three screening tests performed well (compared toanomaloscopy). The Ishihara test had a sensitivityof 98% and specificity of 100%, SPP sensitivity99% and specificity 98% and Hahn sensitivity andspecificity was 100%. The authors were unable toseparate the validity of these three tests.
Limitations included:
� The colour-impaired population in this studywas not representative of the entire populationwith impaired colour vision as a result of thecase mix attending the study clinic.
� The participation rate was not stated.� There was evidence (based on results of other
studies using other editions) that colour repro-duction differed between different editions ofthe Hahn test potentially resulting in differ-ences in validity between the different tests.
� The generalisability was unclear given thelimitations discussed concerning the studypopulation. The study was set in Australia.
Hill et al., 1982
Four colour vision screening tests were evaluatedin 439 four to 11-year-old boys. Each participantperformed the Ishihara 1966 (pathway), AO-HRR,Guys and Matsubara pseudoisochromatic tests.Their results were compared with anomaloscopefindings.
The sensitivity, specificity and negative predictivevalue are presented in Table 7 (p. 31).
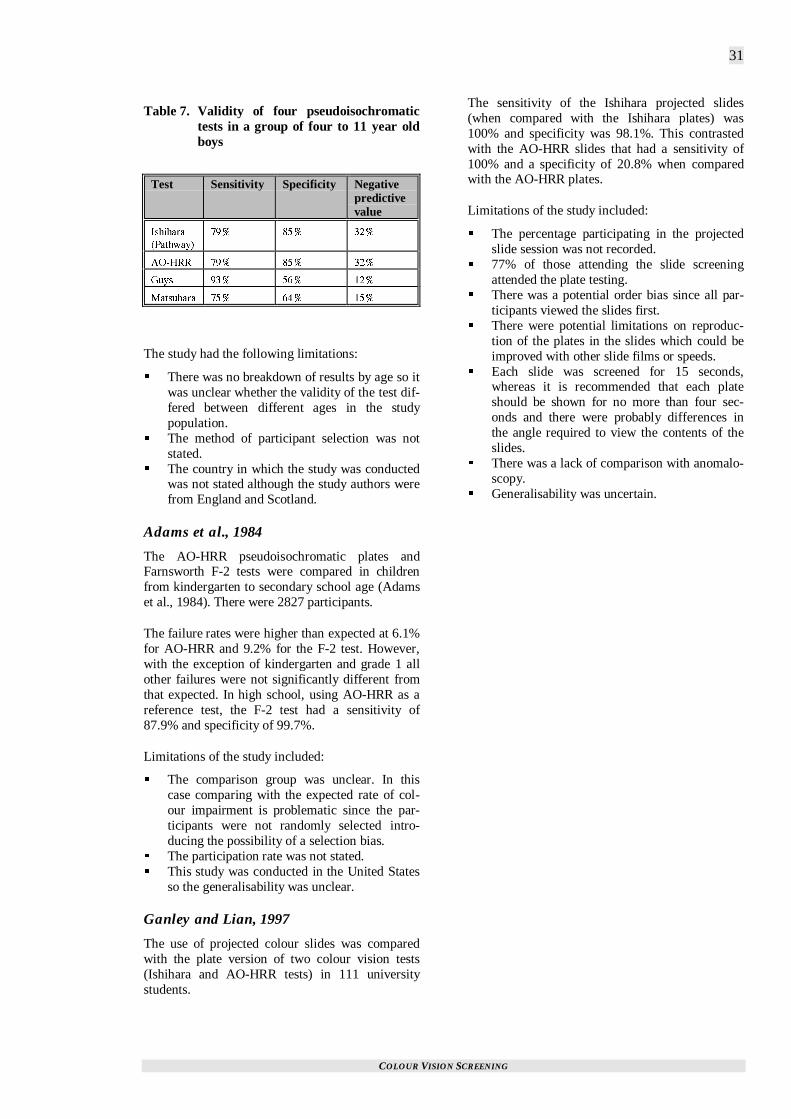
COLOUR VISION SCREENING
31
Table 7. Validity of four pseudoisochromatictests in a group of four to 11 year oldboys
Test Sensitivity Specificity Negativepredictivevalue
+UJKJCTC
2CVJYC[�
��� ��� ���
#1�*44 ��� ��� ���
)W[U ��� ��� ���
/CVUWDCTC ��� ��� ���
The study had the following limitations:
� There was no breakdown of results by age so itwas unclear whether the validity of the test dif-fered between different ages in the studypopulation.
� The method of participant selection was notstated.
� The country in which the study was conductedwas not stated although the study authors werefrom England and Scotland.
Adams et al., 1984
The AO-HRR pseudoisochromatic plates andFarnsworth F-2 tests were compared in childrenfrom kindergarten to secondary school age (Adamset al., 1984). There were 2827 participants.
The failure rates were higher than expected at 6.1%for AO-HRR and 9.2% for the F-2 test. However,with the exception of kindergarten and grade 1 allother failures were not significantly different fromthat expected. In high school, using AO-HRR as areference test, the F-2 test had a sensitivity of87.9% and specificity of 99.7%.
Limitations of the study included:
� The comparison group was unclear. In thiscase comparing with the expected rate of col-our impairment is problematic since the par-ticipants were not randomly selected intro-ducing the possibility of a selection bias.
� The participation rate was not stated.� This study was conducted in the United States
so the generalisability was unclear.
Ganley and Lian, 1997
The use of projected colour slides was comparedwith the plate version of two colour vision tests(Ishihara and AO-HRR tests) in 111 universitystudents.
The sensitivity of the Ishihara projected slides(when compared with the Ishihara plates) was100% and specificity was 98.1%. This contrastedwith the AO-HRR slides that had a sensitivity of100% and a specificity of 20.8% when comparedwith the AO-HRR plates.
Limitations of the study included:
� The percentage participating in the projectedslide session was not recorded.
� 77% of those attending the slide screeningattended the plate testing.
� There was a potential order bias since all par-ticipants viewed the slides first.
� There were potential limitations on reproduc-tion of the plates in the slides which could beimproved with other slide films or speeds.
� Each slide was screened for 15 seconds,whereas it is recommended that each plateshould be shown for no more than four sec-onds and there were probably differences inthe angle required to view the contents of theslides.
� There was a lack of comparison with anomalo-scopy.
� Generalisability was uncertain.
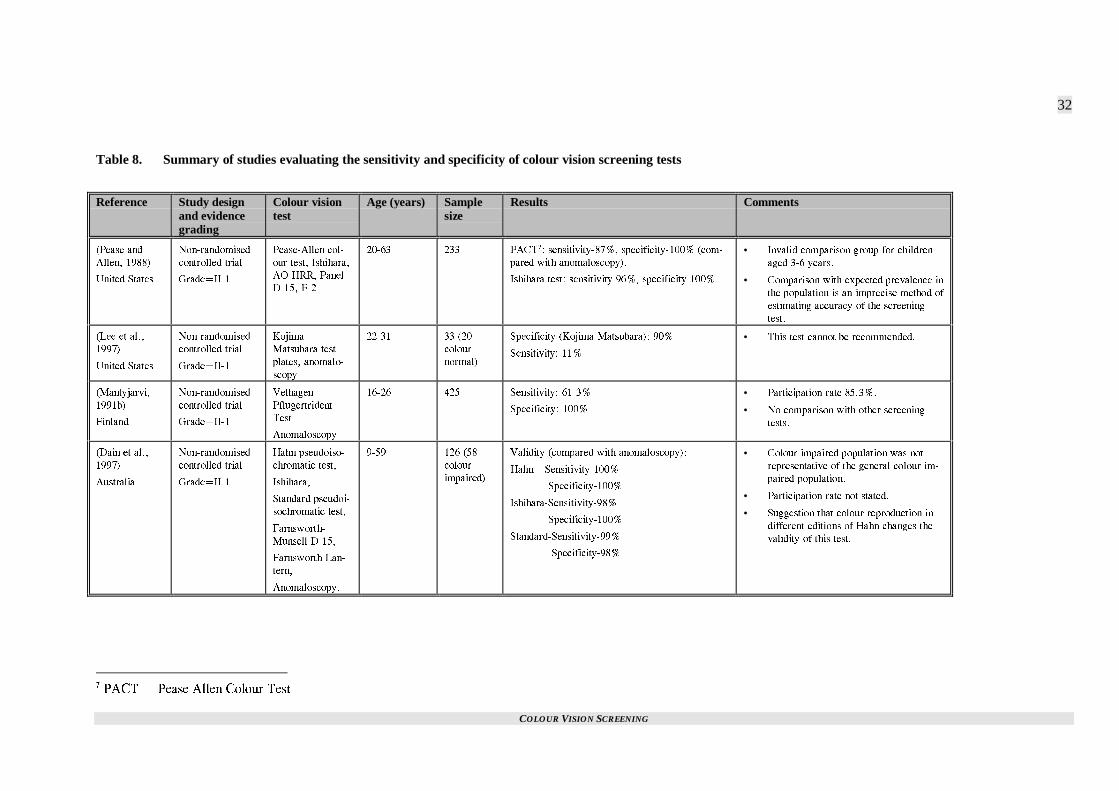
COLOUR VISION SCREENING
32
Table 8. Summary of studies evaluating the sensitivity and specificity of colour vision screening tests
Reference Study designand evidencegrading
Colour visiontest
Age (years) Samplesize
Results Comments
2GCUG CPF
#NNGP� �����
7PKVGF 5VCVGU
0QP�TCPFQOKUGF
EQPVTQNNGF VTKCN
)TCFG�++��
2GCUG�#NNGP EQN�
QWT VGUV� +UJKJCTC�
#1�*44� 2CPGN
&���� (��
����� ��� 2#%6�� UGPUKVKXKV[����� URGEKHKEKV[����� EQO�
RCTGF YKVJ CPQOCNQUEQR[��
+UJKJCTC VGUV� UGPUKVKXKV[ ���� URGEKHKEKV[ �����
• +PXCNKF EQORCTKUQP ITQWR HQT EJKNFTGP
CIGF ��� [GCTU�
• %QORCTKUQP YKVJ GZRGEVGF RTGXCNGPEG KP
VJG RQRWNCVKQP KU CP KORTGEKUG OGVJQF QH
GUVKOCVKPI CEEWTCE[ QH VJG UETGGPKPI
VGUV�
.GG GV CN��
�����
7PKVGF 5VCVGU
0QP�TCPFQOKUGF
EQPVTQNNGF VTKCN
)TCFG�++��
-QLKOC�
/CVUWDCTC VGUV
RNCVGU� CPQOCNQ�
UEQR[
����� �� ��
EQNQWT
PQTOCN�
5RGEKHKEKV[ -QLKOC�/CVUWDCTC�� ���
5GPUKVKXKV[� ���
• 6JKU VGUV ECPPQV DG TGEQOOGPFGF�
/CPV[LCTXK�
����D�
(KPNCPF
0QP�TCPFQOKUGF
EQPVTQNNGF VTKCN
)TCFG�++��
8GNJCIGP
2HNWIGTVTKFGPV
6GUV
#PQOCNQUEQR[
����� ��� 5GPUKVKXKV[� �����
5RGEKHKEKV[� ����
• 2CTVKEKRCVKQP TCVG ������
• 0Q EQORCTKUQP YKVJ QVJGT UETGGPKPI
VGUVU�
&CKP GV CN��
�����
#WUVTCNKC
0QP�TCPFQOKUGF
EQPVTQNNGF VTKCN
)TCFG�++��
*CJP RUGWFQKUQ�
EJTQOCVKE VGUV�
+UJKJCTC�
5VCPFCTF RUGWFQK�
UQEJTQOCVKE VGUV�
(CTPUYQTVJ�
/WPUGNN &����
(CTPUYQTVJ .CP�
VGTP�
#PQOCNQUEQR[�
���� ��� ��
EQNQWT
KORCKTGF�
8CNKFKV[ EQORCTGF YKVJ CPQOCNQUEQR[��
*CJP F 5GPUKVKXKV[�����
5RGEKHKEKV[�����
+UJKJCTC�5GPUKVKXKV[����
5RGEKHKEKV[�����
5VCPFCTF�5GPUKVKXKV[����
5RGEKHKEKV[����
• %QNQWT KORCKTGF RQRWNCVKQP YCU PQV
TGRTGUGPVCVKXG QH VJG IGPGTCN EQNQWT KO�
RCKTGF RQRWNCVKQP�
• 2CTVKEKRCVKQP TCVG PQV UVCVGF�
• 5WIIGUVKQP VJCV EQNQWT TGRTQFWEVKQP KP
FKHHGTGPV GFKVKQPU QH *CJP EJCPIGU VJG
XCNKFKV[ QH VJKU VGUV�
�2#%6 � 2GCUG #NNGP %QNQWT 6GUV
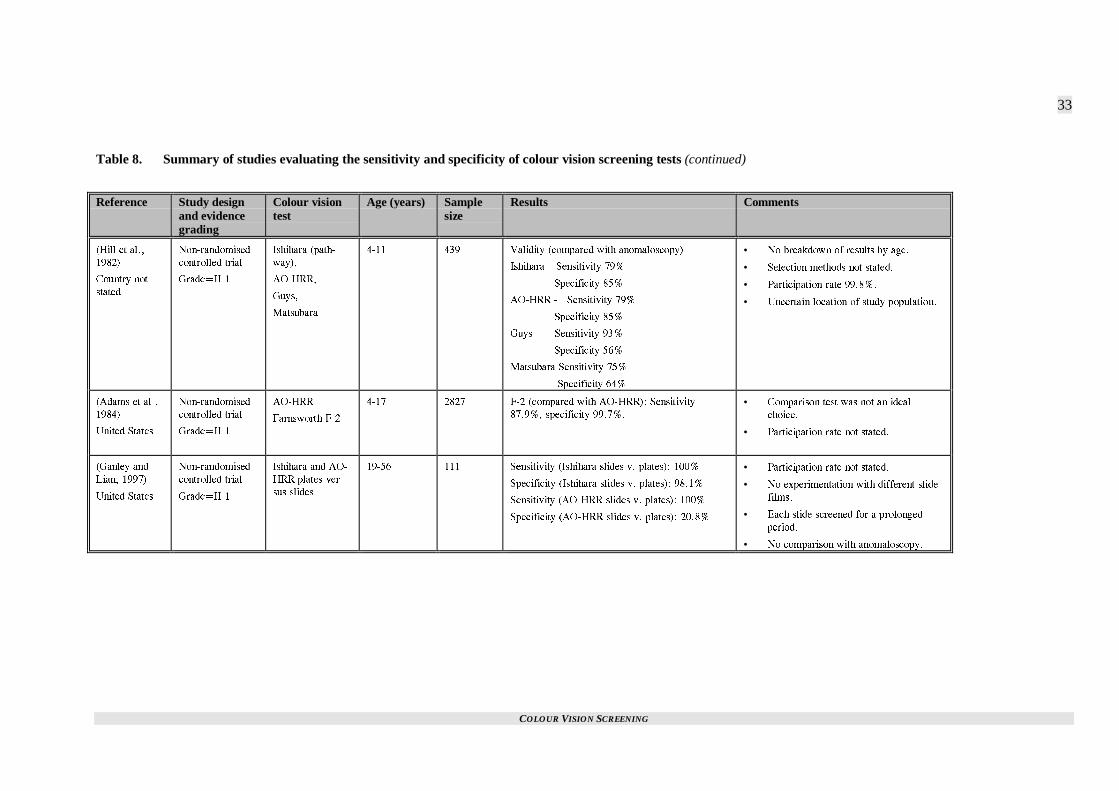
COLOUR VISION SCREENING
33
Table 8. Summary of studies evaluating the sensitivity and specificity of colour vision screening tests (continued)
Reference Study designand evidencegrading
Colour visiontest
Age (years) Samplesize
Results Comments
*KNN GV CN��
�����
%QWPVT[ PQV
UVCVGF
0QP�TCPFQOKUGF
EQPVTQNNGF VTKCN
)TCFG�++��
+UJKJCTC RCVJ�
YC[��
#1�*44�
)W[U�
/CVUWDCTC
���� ��� 8CNKFKV[ EQORCTGF YKVJ CPQOCNQUEQR[�
+UJKJCTC F 5GPUKVKXKV[ ���
5RGEKHKEKV[ ���
#1�*44 � 5GPUKVKXKV[ ���
5RGEKHKEKV[ ���
)W[U 5GPUKVKXKV[ ���
5RGEKHKEKV[ ���
/CVUWDCTC 5GPUKVKXKV[ ���
5RGEKHKEKV[ ���
• 0Q DTGCMFQYP QH TGUWNVU D[ CIG�
• 5GNGEVKQP OGVJQFU PQV UVCVGF�
• 2CTVKEKRCVKQP TCVG ������
• 7PEGTVCKP NQECVKQP QH UVWF[ RQRWNCVKQP�
#FCOU GV CN��
�����
7PKVGF 5VCVGU
0QP�TCPFQOKUGF
EQPVTQNNGF VTKCN
)TCFG�++��
#1�*44
(CTPUYQTVJ (��
���� ���� (�� EQORCTGF YKVJ #1�*44�� 5GPUKVKXKV[
������ URGEKHKEKV[ ������
• %QORCTKUQP VGUV YCU PQV CP KFGCN
EJQKEG�
• 2CTVKEKRCVKQP TCVG PQV UVCVGF�
)CPNG[ CPF
.KCP� �����
7PKVGF 5VCVGU
0QP�TCPFQOKUGF
EQPVTQNNGF VTKCN
)TCFG�++��
+UJKJCTC CPF #1�
*44 RNCVGU XGT�
UWU UNKFGU
����� ��� 5GPUKVKXKV[ +UJKJCTC UNKFGU X� RNCVGU�� ����
5RGEKHKEKV[ +UJKJCTC UNKFGU X� RNCVGU�� �����
5GPUKVKXKV[ #1�*44 UNKFGU X� RNCVGU�� ����
5RGEKHKEKV[ #1�*44 UNKFGU X� RNCVGU�� �����
• 2CTVKEKRCVKQP TCVG PQV UVCVGF�
• 0Q GZRGTKOGPVCVKQP YKVJ FKHHGTGPV UNKFG
HKNOU�
• 'CEJ UNKFG UETGGPGF HQT C RTQNQPIGF
RGTKQF�
• 0Q EQORCTKUQP YKVJ CPQOCNQUEQR[�

COLOUR VISION SCREENING
34
WHAT IS THE SENSITIVITY OFCURRENTLY USED COLOURVISION SCREENING TESTS?
Some studies only provided sufficient informationto allow the calculation of sensitivity alone. Theseare summarised in Table 10 (p. 36).
Birch, 1997c
The Ishihara test plates were compared withanomaloscope findings in 401 male subjects whowere red-green colour deficient. The participationrate was 100%.
The sensitivity was determined for the number oferrors on the transformation8 and vanishing9 de-signs. These results are presented in Table 9.
Table 9. Sensitivity of the transformationaland vanishing designs of Ishiharatest plates.
Number oferrors
Sensitivity
�� �����
� �����
� �����
� �����
� ����
Based on these results and another that investigatedspecificity (Birch and McKeever, 1993) using sixmistakes as the cut off, the specificity would be95.5% and sensitivity 94%. These figures werederived by a weighted estimate based on theprevalence of specific colour vision deficiencies inthe general population.
Limitations of the study included:
� The colour-impaired participants in this studywere not representative of the colour-impairedpopulation. This group tended to have moresevere colour impairment since they were re-ferred for advice about careers. The author at-tempted to overcome this limitation byweighting the results.
�6TCPUHQTOCVKQP FGUKIP � FKHHGTGPV TGUWNVU CTG
QDVCKPGF HQT EQNQWT PQTOCN CPF EQNQWT FGHKEKGPV
RQRWNCVKQPU� 8CPKUJKPI FGUKIP � XKGYKPI PWODGT DGEQOGU
NGUU FKUVKPEV CV VJG OCTIKPU
� The study was conducted in England so hasuncertain generalisability.
Birch, 1997a
In this study the AO-HRR plates were evaluated bycomparison with anomaloscope findings. Therewere 401 male colour deficient participants and thesensitivity of the test was 98%.
Limitations of this study included:
� Not testing a sample of participants with nor-mal colour vision, therefore the specificity ofthe test could not be established.
� The participants were not a true cross-sectionof the colour-impaired population since therewas an over-representation of dichromats. Thisindicates excess severity suggesting the truesensitivity of the test might be lower than theseresults indicate.
� The participation rate was not stated.� Generalisability was unclear since this study
was performed in a London clinic.
Lanthony, 1994
The validity of the Farnsworth D-15 desaturatedpanel was assessed. There were 248 participantswith congenital colour vision impairment.
Only six participants (2.4%) produced falselynegative results (compared with anomaloscopy) ontesting with the D-15 desaturated panel.
The study was limited by:
� The lack of a population with normal colourvision resulting in an inability to evaluate thespecificity.
� It was unclear whether the participants wererepresentative of the impaired colour visionpopulation.
� The participation rate was not stated.� The study was conducted in France so has un-
certain generalisability to New Zealand.
Birch, 1989
Farnsworth, in designing the F-M 100-hue test, didnot consider it appropriate for screening purposes.The validity of this assumption was assessed byBirch (1989). There were 238 subjects with im-paired colour vision (diagnosed by anomaloscopy).
The sensitivity on F-M 100-hue testing was 70%suggesting this test was not suitable for screeningpurposes.
Limitations of the study included:

COLOUR VISION SCREENING
35
� This was a retrospective study so it relied oncorrect coding. It was likely that any misclassi-fication errors due to incorrect coding wouldbe random so a systematic bias due to thislimitation was unlikely.
� The participation rate was not stated.� Estimation of the validity of the test was in-
complete due to the lack of a group with nor-mal colour vision.
� The study was set in England so had uncleargeneralisability.
Coren and Hakstian, 1995
A colour screening inventory (consisting of 10questions) was compared with the F-M 100-huetest in 268 volunteers with a mean age of 19.9years.
A non-linear relationship was found between thetwo tests with a correlation ratio, eta of 0.69. Thissuggests the colour-screening inventory explained48% of the predictive variance in the colour dis-crimination scores.
Limitations of the study included:
� A younger age group was not tested so theeffectiveness of this inventory cannot be as-sessed in a more appropriate age group (forscreening purposes).
� This level of variance explained by the inven-tory was relatively high but clearly it does notfully explain the results so the two tests are notinterchangeable.
� The study did not appear to be blinded whichis problematic especially since the developersof the inventory performed the study.
� There was no comparison of the sensitivity andspecificity of the two tests with a gold standardmeasure for impaired colour vision.
� The study was set in Canada so has uncertaingeneralisability.
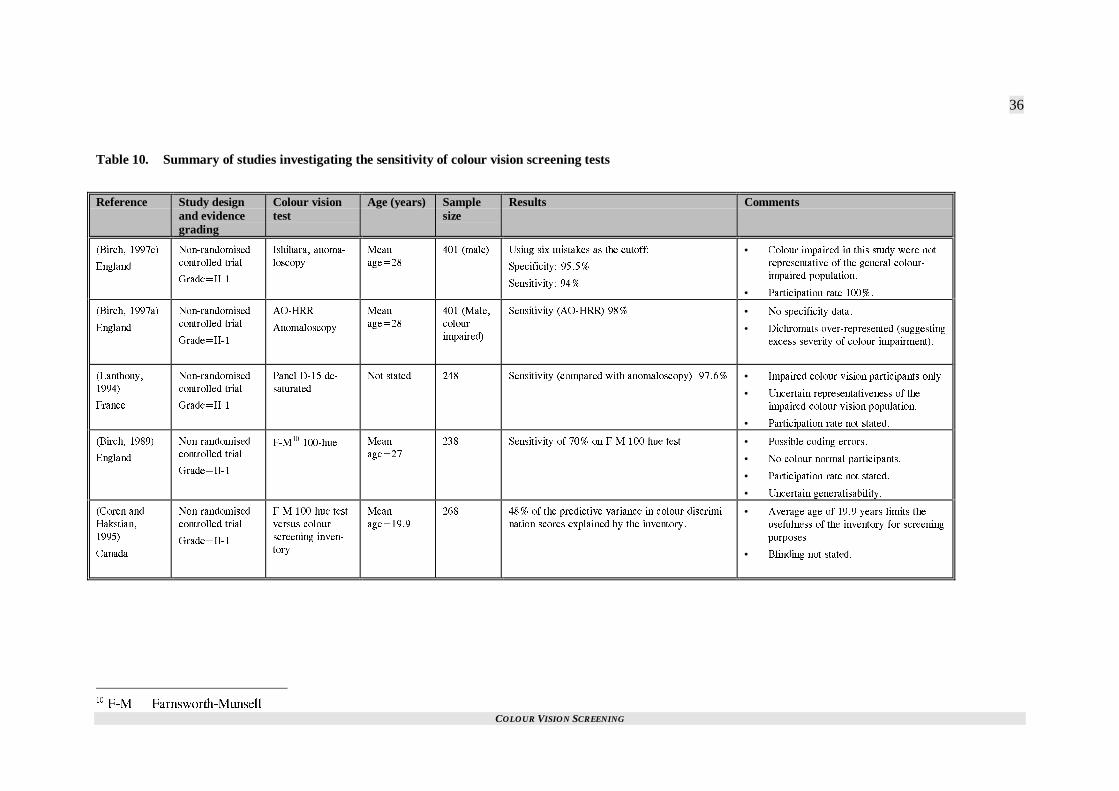
COLOUR VISION SCREENING
36
Table 10. Summary of studies investigating the sensitivity of colour vision screening tests
Reference Study designand evidencegrading
Colour visiontest
Age (years) Samplesize
Results Comments
$KTEJ� ����E�
'PINCPF
0QP�TCPFQOKUGF
EQPVTQNNGF VTKCN
)TCFG�++��
+UJKJCTC� CPQOC�
NQUEQR[
/GCP
CIG���
��� OCNG� 7UKPI UKZ OKUVCMGU CU VJG EWVQHH�
5RGEKHKEKV[� �����
5GPUKVKXKV[� ���
• %QNQWT KORCKTGF KP VJKU UVWF[ YGTG PQV
TGRTGUGPVCVKXG QH VJG IGPGTCN EQNQWT�
KORCKTGF RQRWNCVKQP�
• 2CTVKEKRCVKQP TCVG �����
$KTEJ� ����C�
'PINCPF
0QP�TCPFQOKUGF
EQPVTQNNGF VTKCN
)TCFG�++��
#1�*44
#PQOCNQUEQR[
/GCP
CIG���
��� /CNG�
EQNQWT
KORCKTGF�
5GPUKVKXKV[ #1�*44� ��� • 0Q URGEKHKEKV[ FCVC�
• &KEJTQOCVU QXGT�TGRTGUGPVGF UWIIGUVKPI
GZEGUU UGXGTKV[ QH EQNQWT KORCKTOGPV��
.CPVJQP[�
�����
(TCPEG
0QP�TCPFQOKUGF
EQPVTQNNGF VTKCN
)TCFG�++��
2CPGN &��� FG�
UCVWTCVGF
0QV UVCVGF ��� 5GPUKVKXKV[ EQORCTGF YKVJ CPQOCNQUEQR[�� ����� • +ORCKTGF EQNQWT XKUKQP RCTVKEKRCPVU QPN[�
• 7PEGTVCKP TGRTGUGPVCVKXGPGUU QH VJG
KORCKTGF EQNQWT XKUKQP RQRWNCVKQP�
• 2CTVKEKRCVKQP TCVG PQV UVCVGF�
$KTEJ� �����
'PINCPF
0QP�TCPFQOKUGF
EQPVTQNNGF VTKCN
)TCFG�++��
(�/�� ����JWG /GCP
CIG���
��� 5GPUKVKXKV[ QH ��� QP (�/ ����JWG VGUV • 2QUUKDNG EQFKPI GTTQTU�
• 0Q EQNQWT PQTOCN RCTVKEKRCPVU�
• 2CTVKEKRCVKQP TCVG PQV UVCVGF�
• 7PEGTVCKP IGPGTCNKUCDKNKV[�
%QTGP CPF
*CMUVKCP�
�����
%CPCFC
0QP�TCPFQOKUGF
EQPVTQNNGF VTKCN
)TCFG�++��
(�/ ����JWG VGUV
XGTUWU EQNQWT
UETGGPKPI KPXGP�
VQT[
/GCP
CIG�����
��� ��� QH VJG RTGFKEVKXG XCTKCPEG KP EQNQWT FKUETKOK�
PCVKQP UEQTGU GZRNCKPGF D[ VJG KPXGPVQT[�
• #XGTCIG CIG QH ���� [GCTU NKOKVU VJG
WUGHWNPGUU QH VJG KPXGPVQT[ HQT UETGGPKPI
RWTRQUGU�
• $NKPFKPI PQV UVCVGF�
��(�/ � (CTPUYQTVJ�/WPUGNN

COLOUR VISION SCREENING
37
WHAT WAS THEREPEATABILITY OFCOMMONLY USED COLOURVISION SCREENING TESTS?
The test-retest reliability of the Ishihara test hasbeen evaluated (Johnson, 1992). A controlled trialdesign (Grade II-1 evidence) was used to evaluate102 participants with colour vision impairmentaged between 17 and 35 years. The mean errorscore was 10.1 on test one and 10.07 on test two.This difference was not significant, indicating goodretest reliability.
Limitations of the study included:
� Participants with normal colour vision werenot included.
� Participants were not randomly selected.� The study was set in the United States so has
uncertain generalisability.
WERE OTHER METHODS OFASSESSING THE VALIDITY OFCOLOUR VISION SCREENINGTESTS USED?
The validity of colour screening tests were alsoassessed by other methods. These results are sum-marised in Table 11 (p. 39).
Kon and De Alwis, 1996
A new set of pseudoisochromatic plates were de-signed and tested by a group in Guildford, England.This test was used for both red-green axis disordersand blue-yellow axis disorders. The plates weregraded.
In this study, 14 patients with congenital red-greencolour blindness (diagnosed by Ishihara pseudoiso-chromatic plate) were compared with 14 age-matched controls with no colour impairment and 11patients with optic neuritis were compared with 11age-matched controls with no colour vision defects.
The results for those with red-green colour blind-ness were fully discriminating from their agedmatched controls, as were those in the optic neuritissection of the study. In the latter, there were sig-nificant differences for both vision axes.
Limitations included:
� The sample size was small.� Comparison with a confirmatory measure such
as anomaloscopy was not made.
� There was no comment on blinding of the test-ers to the participants colour vision status.
� The method of participant selection was un-clear.
� The participation rate was not documented.
The results of this study would need to be repeatedby an independent group before considerationshould be given to the use of this screening test.The addition of an ability to diagnose blue-yellowdisorders and to grade the severity are of doubtfulsignificance in a screening test conducted inschool-aged children since assessing severity is notthe role of a screening test and blue-yellow defectsare rare.
Hovis et al., 1996
The SPP-1 and SPP-2 test plates were compared in386 participants aged between four and 74 years.The participants were volunteers from a vision careclinic at a Canadian University and patients at aprivate practice in Canada.
There were 24 red-green impaired participants(6%). The level of agreement between the two testswas kappa=0.93 and supplementary testing of thediscrepancies suggested the SPP-2 results werecorrect in two out of the three cases. This resultsuggested that the SPP-2 test, that had been rec-ommended for acquired defects only, could also berecommended for detection of congenital defects.However, it was interesting that one of the supple-mentary tests for investigating the discrepant re-sults was Ishihara’s test suggesting the authors hadmore faith in this test for screening congenital col-our vision defects.
Limitations included:
� Anomaloscopy was not used in all discrepantcases.
� The introduction of a potential selection biasthrough the non-random selection of partici-pants.
� The participation rate was not stated.� Generalisability should be treated with caution
since it was set in Canada.
Birch and McKeever, 1993
In this study, newer pseudoisochromatic plateswere tested in England. These tests included Ishi-hara 1989 edition, Ohkuma test cards and the Ishi-hara test for unlettered persons, 1990.
There were 500 participants (471 with normal col-our vision) and most were aged between 18 and 22years. The Ishihara test for unlettered persons wasevaluated on 292 participants (263 with normalvision).

COLOUR VISION SCREENING
38
The results were evaluated by comparing the de-gree of overlap in errors for those with normal andimpaired colour vision. The Ishihara test 1989 edi-tion performed best with a gap of two errors be-tween the two groups. In contrast there was anoverlap of two errors in the Ohkuma test and oneerror in the Ishihara test for unlettered persons.
Limitations of the study included:
� It would have been useful if the authors hadpresented the results in terms of sensitivity andspecificity based on the instructions for inter-pretation given to the user.
� There was no comparison with a gold standardtest such as anomaloscopy.
� The participation rate was not stated.� The use of participants in other age ranges
would have been useful to assess generalis-ability to these other populations.

COLOUR VISION SCREENING
39
Table 11. Summary of studies evaluating the validity of colour vision screening tests with other outcome measures
Reference Study design andevidence grading
Colour vision test Age (years) Samplesize
Results Comments
-QP CPF &G
#NYKU� �����
'PINCPF
0QP�TCPFQOKUGF
EQPVTQNNGF VTKCN
)TCFG�++��
2UGWFQKUQEJTQOCVKE
RNCVGU PGY FGUKIP�
����� �� 6GUVGF HQT FKUQTFGT QP VJG TGF�ITGGP CZKU CPF VJG
DNWG [GNNQY CZKU� 6JG TGUWNVU YGTG HWNN[ FKUETKOK�
PCVKPI KP CNN ITQWRU EQORCTGF YKVJ PQTOCN EQP�
VTQNU�
• 5OCNN UCORNG�
• 0Q CPQOCNQUEQR[�
• 2CTVKEKRCVKQP TCVG PQV UVCVGF�
• /GVJQF QH UGNGEVKQP PQV UVCVGF�
$KTEJ CPF
2NCVVU� �����
'PINCPF
0QP�TCPFQOKUGF
EQPVTQNNGF VTKCN
)TCFG�++��
+UJKJCTC�
+UJKJCTC WPNGVVGTGF��
8GNJCIGP 2HNWIGTVTK�
FGPV
���� ��� ��
YKVJ FGHK�
EKGPV EQNQWT
XKUKQP�
%JKNFTGP YKVJ EQNQWT FGHKEKGPE[ WPCDNG VQ EQO�
RNGVG VGUVU�
+UJKJCTC����
+UJKJCTC 7PNGVVGTGF�� ��
8GNJCIGP 2HNWIGTVTKFGPV� ����
8GNJCIGP 2HNWIGTVTKFGPV UGPUKVKXKV[� ���
• #PQOCNQUEQR[ PQV WUGF�
• 7PENGCT OGVJQF QH RCTVKEKRCPV UGNGEVKQP
CPF RCTVKEKRCVKQP TCVG�
*QXKU GV CN��
�����
%CPCFC
0QP�TCPFQOKUGF
EQPVTQNNGF VTKCN
)TCFG�++��
522���� CPF �� ���� ��� -CRRC ���� DGVYGGP 522�� CPF 522�� • 2CTVKEKRCVKQP TCVG PQV UVCVGF�
• 2CTVKEKRCPVU UGNGEVGF D[ XQNWPVGGTKPI�
• .CEM QH C EQPUKUVGPV EQPHKTOCVQT[ VGUV
WUGF VQ EQPHKTO EQNQWT XKUKQP UVCVWU�
$KTEJ CPF
/E-GGXGT�
�����
'PINCPF
0QP�TCPFQOKUGF
EQPVTQNNGF VTKCN
)TCFG�++��
+UJKJCTC ����� 1J�
MWOC� +UJKJCTC HQT
WPNGVVGTGF RGTUQPU
����
����� OQUV� ��� +UJKJCTC �����PQ QXGTNCR KP PWODGT QH GTTQTU
DGVYGGP VJQUG YKVJ PQTOCN CPF KORCKTGF XKUKQP�
1XGTNCR QH VYQ GTTQTU HQT 1JMWOC CPF QPG HQT
+UJKJCTC WPNGVVGTGF��
• 5GPUKVKXKV[ CPF URGEKHKEKV[ YQWNF JCXG
DGGP OQTG WUGHWN�
• 1PN[ �� YKVJ KORCKTGF EQNQWT XKUKQP�
• ;QWPIGT CIG ITQWR YQWNF JCXG DGGP
WUGHWN�
• 0Q EQORCTKUQP YKVJ CPQOCNQUEQR[�
��522 � 5VCPFCTF 2UGWFQKUQEJTQOCVKE 2NCVGU

COLOUR VISION SCREENING
40
HOW DO YOUNG CHILDRENPERFORM ON COLOUR VISIONTESTING?
Mantyjarvi, 1991a
The Velhagen Pflugertrident test, Lanthony TritanAlbum and the Ishihara test were evaluated in 84children aged two to six years in Finland. The chil-dren were randomly selected from an outpatientdepartment of an eye clinic.
The proportion correctly understanding and inter-preting the tests is shown in Table 12. There were20 participants in each age group except the two-year-olds, which only had four participants.
Table 12. Proportion of children who under-stood and correctly interpreted dif-ferent colour vision tests in differentage groups.
Age(years)
Velhagen Lanthony Ishihara
� ���� ���� ����
� ���� ���� ����
� ��� ���� ���
� ��� ��� ���
� �� �� ��
Limitations of the study included:
� The absence of children with colour visionimpairment. In a study sample of 84 whichwas randomly selected this absence was sur-prising given the prevalence of colour visionimpairment.
� The results have unclear generalisability toNew Zealand.
Birch and Platts, 1993
Three types of colour vision screening test wereevaluated for the detection of impaired colour vi-sion in children aged between three and 11 years ofage. There were 495 children with normal colourvision and 18 children with deficient colour vision.
Of the children with colour deficiency, two wereunable to complete the Ishihara test, four the Vel-hagen Pflugertrident test and one could not com-plete the symbol section of the Ishihara test forunlettered persons while one other could not com-plete the pathway section of that test. The VelhagenPflugertrident test had low validity with only 11 of
the 18 children being found to be colour deficienton the other tests being identified with this test.
Limitations of the study included:
� There was no gold standard test with which tocompare the results.
� The method of selection of the participantswas not stated.
� The study was set in London so has uncleargeneralisability to New Zealand.
Ekert et al., 1995
A cross-sectional study (Grade III evidence) evalu-ated the use of the pathway plates in Ishihara’spseudoisochromatic plates for children aged 49months to 86 months (Ekert et al., 1995). The re-sults of those unable to interpret the plates areshown in Table 13.
Table 13. Proportion of children who wereunable to interpret the Ishihara testplates, by age group.
Age(Years)
Percentageunable to in-terpret plates(Male)
Percentage un-able to interpretplates (Female)
��� ���� ���
��� ��� ���
� ��� ���
Limitations of the study included:
� The colour vision status of the participants wasnot known, therefore the sensitivity and speci-ficity of the Ishihara test plates cannot be esti-mated on the basis of this study.
� This study was set in Croatia so has uncleargeneralisability to New Zealand.
Swanson and Everett, 1992
A colour vision test, the Anomaloscope Plate Test(APT-5), designed for use in children was evalu-ated in the United States (Swanson and Everett,1992). There were 1794 children aged three to 13years in the study. Those failing the test wereevaluated with anomaloscopy.
Of the children aged three to four years, 7.2% wereclassified as untestable, 0.2% of children aged fiveand six were untestable but all other participantswere evaluable. Forty children who failed thescreening were tested with anomaloscopy. Fourteenof these were normal by anomaloscopy, suggestinga false positive rate of 35%.

COLOUR VISION SCREENING
41
Limitations of the study included:
� It was unfortunate that the sensitivity andspecificity of the test could not be calculatedgiven the lack of information on those partici-pants testing negative on screening.
� It would have been useful to compare this testwith other tests commonly used for screeningsuch as the Ishihara pseudoisochromatic test.
� Only 37.5% of those failing screening wereevaluated by anomaloscopy, providing a po-tential selection bias.
� The generalisability of the study was unclear.
Marre et al., 1990
The Velhagen Pflugerhaken test was evaluated in agroup of four to seven-year-old boys in Germany.It was compared with anomaloscopy. Anomalo-scopy was performed in those failing the test whowere between 5½ and seven years. It was con-ducted two years after the screening test.
The false positive rate was 6.5% in this group.
This study was limited by:
� Results were only compared in the older agegroup. In general, there are more false positiveresults in colour vision screening in childrenunder the age of five.
� It was not possible to calculate the sensitivityand specificity since anomaloscopy was notperformed on those passing the screening test.
� In absolute numbers there were only three falsepositives so the numbers in this category weresmall, resulting in a potentially inaccuratemeasurement.
� The participation rate of those failing thescreening test was 90% at follow-up.
� The study was conducted in Germany so hasuncertain generalisability.
SUMMARY
There were three studies that measured the sensi-tivity and specificity of more than one colour vi-sion screening test against anomaloscopy. Ishi-hara’s test was included in all three of those stud-ies. In each case, there was no evidence that Ishi-hara’s test was less valid than any other screeningtest. One of the three studies surveyed a youngerage group (4-11 years) and the sensitivity andspecificity for all the screening tests was lower inthat study than the other two. The design used inthese three studies should produce the most reliableresults. Therefore it was concluded that:
There was currently insufficient evidence torecommend a change in the colour visionscreening test currently in use within New Zea-
land (Ishihara’s pseudoisochromatic test) on thebasis of its validity. Cost-effectiveness informa-tion is needed to compare the costs of the vari-ous screening tests against sensitivity and speci-ficity criteria.
The sensitivity and specificity of Ishihara’s pseu-doisochromatic test supported this conclusion. Af-ter excluding the study that included a preschoolpopulation (since colour vision screening appearsto be less reliable in this population) there werethree studies that documented the sensitivity andthree the specificity of this test type. The sensitivityranged between 94% and 98% and the mean was96%. The specificity ranged between 95% and100% and the mean was 98.5%.
However, it should be recognised that these threestudies also had limitations and those limitations(discussed under the particular studies) should beborne in mind when interpreting this conclusion.
Further support for this conclusion was provided bythe single study identified that investigated the re-peatability of a screening test. Ishihara’s testshowed good retest reliability in this study.
Consideration was given to the best age at which toperform colour vision screening. Ideally, screeningshould be performed at a time when it will make adifference to the three potential sequelae of im-paired colour vision: educational and occupationaldifficulties and increased problems with driving.From the educational viewpoint, a test precedingschool entrance would be useful. However, thescreening tests appeared to have lower validity inthese younger age groups. It was unfortunate thatthere were no results presented directly comparingthe performance of Ishihara’s test in various agegroups. However, it was concluded that:
There was insufficient evidence to recommend achange in the age at which colour visionscreening should occur in New Zealand.
COLOUR VISION SCREENING
43
Screeningprogrammes
ARE SCREENINGPROGRAMMES FOR COLOURVISION ABNORMALITIESEFFECTIVE?
Ideally screening programmes are evaluated with arandomised-controlled trial. No such studies wereidentified in this report. The studies that were iden-tified are summarised in Table 14 (p. 45).
Holroyd and Hall, 1997
An appraisal of screening for colour vision im-pairment was conducted in Sheffield. This pro-gramme was conducted in 11-year-old pupils inconjunction with visual acuity testing.
It was observed that colour vision screening doesnot fulfil all the Wilson and Jungner criteria. Nospecific treatment is available and facilities for de-finitive diagnosis and accurate counselling wouldbe inadequate if all screen positive cases were re-ferred for specialist opinion. Both these issues ap-ply in New Zealand.
A cross-sectional study design (Grade III evidence)was used in this study. Questionnaires were com-pleted by boys aged 12 to 16 years, by schoolnurses and by a random sample of optometrists.
A total of 791 questionnaires were distributed topupils with 784 being suitable for analysis (99%).Thirty-three (4.2%) boys stated they had impairedcolour vision. Only two remembered seeking fur-ther advice on the positive test result. Medical rec-ords were examined for 557 boys and 5.2% hadcolour vision impairment recorded in the notes.
The authors postulated that many cases of colourvision impairment were missed since the preva-lence was below the accepted figure of 8%. Theyalso commented that there was no clear guidanceon further action or referral. Despite this, the boysfelt it was useful to know about their colour visionimpairment given the potential implications con-cerning career options.
The study had a range of limitations:
� The ideal study design for assessment ofscreening programmes is a randomised-
controlled trial to minimise the effects of bias.This study does not have a control group so theeffectiveness of the screening programme can-not be estimated.
� The study was conducted in six selectedschools. These schools were selected on thebasis of diverse social backgrounds but itwould have been more appropriate to select theschools randomly.
� Comparison of recorded prevalence rates withexpected prevalence rates (as used in thisstudy) is inadequate in assessing the effective-ness of a screening programme.
� The study was conducted in England so hasuncertain generalisability.
Gordon, 1998
In this review (Grade III evidence) of colour blind-ness, it was noted that colour vision impairment isnot treatable but the purpose of screening was adesire to prevent adverse effects from this condi-tion rather than to treat it.
The influence of colours in education was dis-cussed given the implications this has on the bestage for colour vision screening. While it was notedthat colours are used particularly in the teaching ofyoung children no evidence was found that thosewho had impaired colour vision had inferior schoolachievement. It was therefore suggested that theage recommended by the Joint Working Party ofthe British Paediatric Association (11-14 years)remains the most appropriate for testing but colourvision testing should be performed in children withlearning disabilities.
This study should be treated with caution since itwas not a systematic review.
Cummings, 1996
An evaluation of a visual screening programme foreight and 10-year-old males and females in Cam-bridge was conducted.
There were 1809 children in this descriptive study(Grade III evidence) but only the 560 children withabnormal visual acuity had colour vision resultsrecorded. Colour vision was tested with Ishiharaplates.
Twenty-nine (5.2%) had abnormal colour visionbut only two of these cases had not previously beendocumented. The authors noted that the age of 11years had previously been advised as the most ap-propriate for colour vision testing but the majorityof children (approximately 80%) in this study had adefinitive result recorded at the five-year test.

COLOUR VISION SCREENING
44
Limitations of this study included:
� This study design was not the most appropriatefor evaluating a screening programme.
� The study was uncontrolled.� A direct comparison between screening pro-
grammes for different age groups was notmade.
� The study was set in England so its generalis-ability was uncertain.
Stewart-Brown and Haslum, 1988
A review of vision testing conducted in schools inEngland and Wales during 1984 was published.The article focussed predominantly on visual acuitybut noted that 96% of the 165 responding healthdistricts tested for abnormal colour vision. Theresponse rate was 81%. The authors were surprisedthat 48% of the districts that tested colour visiondid so more than once.
SUMMARY
Screening programmes are best evaluated with arandomised controlled trial design. Unfortunatelythere were no such studies identified for colourvision screening. There were four relevant studiesidentified but they evaluated aspects of screeningprogrammes rather than the whole programme.Three studies used a cross-sectional design and theother was a non-systematic review. Therefore, itwas concluded that:
It was not possible to evaluate the effectivenessof a colour vision screening programme on thebasis of current research. This was identified asan area requiring further research, incorporat-ing a randomised controlled trial as the mostappropriate research design for this purpose.
It was noted that economic analyses of colour vi-sion programmes were not identified in the conductof this report. Therefore, it was concluded that:
The cost-effectiveness of colour vision screeningcould not be estimated due to the lack of re-search in this area. This was an area requiringresearch attention.

COLOUR VISION SCREENING
45
Table 14. Summary of studies that evaluated colour vision screening programmes
Reference Study designand evidencegrading
Setting Age (years) Samplesize
Results Comments
*QNTQ[F CPF
*CNN� �����
'PINCPF
%TQUU�UGEVKQPCN
)TCFG�+++
�� [GCT QNF
UETGGPKPI
����� CV
EQORNGVKQP QH
UWTXG[�
��� �� DQ[U UVCVGF VJG[ YGTG EQNQWT XKUKQP
KORCKTGF� 6YQ TGOGODGTGF UGGMKPI HWTVJGT
CFXKEG�
• 2CTVKEKRCVKQP TCVG ����
• /GFKECN TGEQTFU CXCKNCDNG QP QPN[ ���
QH VJG UCORNG�
• $GVVGT OGVJQFU QH GXCNWCVKPI C UETGGPKPI
RTQITCOOG CTG CXCKNCDNG 4%6U CTG
DGUV��
• 5EJQQNU YGTG PQV UGNGEVGF TCPFQON[�
)QTFQP� �����
'PINCPF
0QP�U[UVGOCVKE
TGXKGY
)TCFG�+++
0�#�� 0�# 0�# %QNQWT XKUKQP UETGGPKPI YCU CKOGF CV RTG�
XGPVKPI CFXGTUG GHHGEVU HTQO VJG KORCKTOGPV
TCVJGT VJCP VTGCVKPI KV�
0Q GXKFGPEG HQT KPHGTKQT UEJQQN RGTHQTO�
CPEG KP VJG EQNQWT KORCKTGF
• 5GCTEJ OGVJQFQNQI[ PQV UVCVGF�
• 0Q GXCNWCVKQP QH UETGGPKPI RTQITCOOGU�
%WOOKPIU�
�����
'PINCPF
%TQUU�UGEVKQPCN
)TCFG�+++
5EJQQN � CPF �� ��� ���� JCF CDPQTOCN EQNQWT XKUKQP CPF ��
QH VJGUG YGTG RTGXKQWUN[ WPTGEQTFGF�• 0QV CP GXCNWCVKQP QH C UETGGPKPI RTQ�
ITCOOG�
• %QNQWT XKUKQP VGUV TGUWNVU TGEQTFGF QPN[
KP VJQUG YKVJ KORCKTGF XKUWCN CEWKV[�
5VGYCTV�
$TQYP CPF
*CUNWO� �����
'PINCPF CPF
9CNGU
%TQUU�UGEVKQPCN
)TCFG�+++
5EJQQN VGUVKPI 0�# ���
JGCNVJ
FKUVTKEVU
��� QH VJG ��� JGCNVJ FKUVTKEVU VGUVGF EQNQWT
XKUKQP KP VJGKT UEJQQNU� ��� VGUVGF OQTG
VJCP QPEG�
• 4GURQPUG TCVG YCU ����
• 0QV CP GXCNWCVKQP QH VJG GHHGEVKXGPGUU QH
UETGGPKPI�
��0�# � PQV CXCKNCDNG
COLOUR VISION SCREENING
47
Conclusions
Colour vision screening is currently performed on11-year-old boys in New Zealand. Impaired colourvision can have implications concerning education,occupation and health. Approximately 7% of boyshave a congenital colour vision deficit.
The Health Funding Authority currently funds col-our vision screening but, at a time when health re-sources are scarce, the value of such a programmeshould be critically appraised. Funding of a colourvision programme has an opportunity cost in termsof other potential health programmes not beingfunded.
A summary of the evidence is provided in Table 16(p. 53).
This report has attempted to evaluate the impact ofcolour vision defects on education, occupation andhealth but the literature did not allow an evaluationof the critical question: “Does a knowledge of im-paired colour vision reduce the impact of that im-pairment on educational achievement, occupationalopportunity and health status in a cost-effectivemanner?”
It needs to be recognised that colour visionscreening is different from other screening pro-grammes currently funded in the health sector.These differences include:
� With the majority of cases of impaired colourvision being congenital, there is not a recog-nisable latent phase to the condition and thenatural history of congenital colour vision de-fects is one of a constant rather than an evolv-ing defect.
� There is no known cure for impaired colourvision and the only corrective measures are oflow effectiveness.
This latter difference is particularly problematic interms of continuing a colour vision screening pro-gramme since Wilson and Jungner’s criteria clearlyare not fulfilled. However, one should ask whetherthese criteria are appropriate for a condition thathas more significant implications in sectors otherthan health. Clearly there are differences betweencolour vision screening and other screening pro-grammes such as cervical screening. Therefore, interms of the criteria assessing treatment, it wouldbe interesting to assess whether the knowledge ofbeing colour vision deficient results in a bettersafety record (encompassing road and occupationalissues) than would otherwise have been the case.
Screening criteria for non-health related issueswere not identified from a search of the literature.
There was also an interesting philosophical ques-tion pervading this report which was beyond itsscope. That was: “Should a screening programmethat has implications beyond the health sector bepurchased by the health sector?” If the answer wasno, how should this issue be addressed?
Currently colour vision is tested by hearing andvision testers in the school setting. Potential op-tions for the programme include, but are not limitedto:
� maintaining the status quo� stopping the screening programme� performing colour vision tests in the context of
a well-child check in the general practice set-ting
The third option is likely to result in a decreasedcost to the funder. However, this decreased costwould result from a decrease in testing and thegreatest decrease in access to testing is likely tooccur in families of low socio-economic status.Therefore, this option has difficulties with equity.
This report has been written using an explicitsearch strategy and appraising the literature re-trieved as a result of that search. Problems inherentin the documents retrieved were identified.
A report such as this is reliant on the quality of thestudies that are relevant to the topic being re-searched. In a review of a screening programme anevaluation of selected criteria is required. The basiccriteria evaluated in this report were:
� What is the natural history of impaired colourvision?
� What treatment options exist for impaired col-our vision?
� The prevalence of impaired colour vision.� What disabilities result from impaired colour
vision?� Are there any valid screening tests for im-
paired colour vision?� Are screening programmes for impaired colour
vision effective?
Those with impaired colour vision of congenitalorigin do not experience any change to their colourvision throughout life. If the impairment is ac-quired such a change can occur but the proportionof those detected with acquired defects at the 11-year test is low.
Long wavelength pass filters have been proposedfor the correction of colour vision abnormalities.The only study identified evaluating this therapeu-tic modality was descriptive in nature. This study
COLOUR VISION SCREENING
48
design is inadequate for the evaluation of effective-ness of a therapy (randomised controlled trials areideal). However, only 17% of users were interestedin purchasing the filters after a one-week trial.Therefore, it was concluded that:
There were no adequate treatment options forthe correction of impaired colour vision on cur-rent evidence.
The best study design for the evaluation of preva-lence is a cross-sectional design. There were 20studies identified in the search for this question.Eighteen of the studies were cross-sectional in de-sign. It was unfortunate that 17 of the 20 studiesrelied solely on pseudoisochromatic test results forthe diagnosis of impaired colour vision rather thanthrough use of anomaloscopy, which is the goldstandard for diagnosis.
In general, the participants were not randomly se-lected and the participation rate was not stated inthe majority of studies. The prevalence in the malepopulation ranged from 0.8% to 9.3. Lower rateswere observed in Koreans, Hispanics and SaudiArabians. The weighted (by sample size mean)prevalence of impaired colour vision in males was7.3%. The prevalence of impaired colour vision inthe female population was much lower with theprevalence ranging between 0.4% and 3.2% in thestudies identified.
From the point of view of a screening programme itmay be more important to know what proportion ofpeople are not aware of their colour vision impair-ment. There were three studies identified thatevaluated this question. The study design was ap-propriate in each case. The results were not con-firmed by anomaloscopy. In two studies, between27% and 41% of participants were unaware of theircolour vision defect prior to employment. In theother, 29% of dichromats and 64% of anomaloustrichromats were unaware of a colour vision defectat the time of leaving secondary school. No suchstudy has been replicated in New Zealand.
It is therefore concluded that, bearing in mind thelimitations previously described:
Of the approximately 7% of the male populationwith congenitally impaired colour vision ap-proximately 40% of that population appears tobe unaware of the defect prior to leaving secon-dary school.
Disability resulting from impaired colour vision ordetected by abnormal colour vision test results canbe considered under a range of headings:
� impact on household activities
� impact on education� impact on occupational choice� impact on motor vehicle crash rates� impact on health status
Given that there is no satisfactory treatment forcolour vision deficiencies (See p. 2) it would bedesirable to know whether a knowledge of havingimpaired colour vision results in fewer educational,occupational and motor vehicle crash problemscompared with those who do not know they arecolour vision impaired. It is very difficult to answerthis question and there was an absence of suchstudies identified in this report.
Therefore, it was concluded that:
It was not possible to identify the impact colourvision screening has on reducing educationaland occupational difficulties or motor vehiclecrash rates.
Ideally, these subjects would also be evaluated in acomparative study including participants with im-paired colour vision in one arm and those withnormal colour vision in the other arm. While thisquestion is of importance for all the headings out-lined above, it is of particular importance whendealing with areas in which a danger to human lifeexists.
Four such study designs were identified in the oc-cupational field. There were six such studies in areview of motor vehicle crash rates. Three studiesinvestigating the impact colour vision had on edu-cational attainment found no evidence that childrenwith impaired colour vision had poor educationaloutcomes compared to those with normal colourvision. There were no articles identified that com-pared health status in the two groups. Other studydesigns were also identified but these should beconsidered inferior and therefore were not consid-ered in the formation of conclusions.
Of the six studies comparing road traffic crashrates, four found no significant difference betweenthe impaired and normal colour vision groups. Thismight have been due to a lack of power in thesestudies. Of the two with a positive result, one wascriticised for the lack of detail concerning relativegender proportions. The other found wet weatherrear end collisions in those with impaired colourvision were responsible for almost double the pro-portion of crashes compared with normals. There-fore, given these inconsistent results, it was con-cluded that:
There was insufficient evidence to either agreeor disagree with the hypothesis that those with

COLOUR VISION SCREENING
49
impaired colour vision have more road trafficcrashes.
Three sources of data did not find any relationshipbetween impaired colour vision and educationalattainment. However, the data was characterised byshort follow-up so it was concluded that:
Further research was required to assess the roleimpaired colour vision has on educational at-tainment.
Bearing in mind the limitations discussed, the datafrom occupational studies provided some supportfor:
Those involved in air traffic control and seasearch and rescue operations should have nor-mal colour vision. Research on other occupa-tions which normally restrict those with im-paired colour vision was not identified in thisreport but it should not be assumed that suchrestrictions are unnecessary.
Different occupations have different requirementsregarding employment opportunities for those withimpaired colour vision. The Ishihara test, which iscurrently used for screening purposes in New Zea-land, is recognised as being a sensitive test andmany occupations with restrictions in terms of im-paired colour vision do not need such stringentcriteria. There is no single test that can be recom-mended for the testing of colour vision for all oc-cupations.
In considering health status issues it was useful toconsider whether colour vision screening might bethe first method of detecting other adverse healthoutcomes. This required a consideration of condi-tions that result in abnormal colour vision. Suchconditions included diabetes, optic atrophy, opticneuritis, cone dystrophies and various medications.Of these conditions only the cone dystrophies ap-peared to be relevant to this question. Cone dystro-phies are extremely rare (Buyse, 1990) at pre-adolescent years so it was concluded that
There was insufficient evidence for the use ofcolour vision screening as a method of first de-tection of an adverse health outcome other thanimpaired colour vision.
The most extensive literature on colour visionscreening concerned the validity of the screeningtests. Ideally, these tests should be examined in arandomised-controlled trial by comparing thescreening tests with a gold standard. In colour vi-sion testing the gold standard for red-green colourblindness is anomaloscopy. Ideally, participantswould be randomly selected and they would be
tested with both the screening test and the goldstandard. There were 19 studies identified and allused the appropriate design. However, anomalo-scopy was only used in 10 studies.
In three cases more than one screening test wasused allowing a comparison between differentscreening tests. The Ishihara test was included inthe battery of screening tests in these cases. In oneof these studies (Dain et al., 1997) three tests couldnot be separated as the best performing test. Thesewere the Ishihara, Hahn and Standard pseudoiso-chromatic tests. In all cases the sensitivity andspecificity were greater than 95%. In the secondstudy (Pease and Allen, 1988), Ishihara’s test hadthe best performance of the five tests used. It was96% sensitive and 100% specific. In the third study(Hill et al., 1982), Ishihara and AO-HRR tests wereequivalent in terms of sensitivity (79%) and speci-ficity (85%) but Guys test was more sensitive(93%) although less specific (56%) and the Matsu-bara test was inferior in both respects. The agegroup tested in this study was younger than theformer study. In another study (Mantyjarvi, 1991b)the Velhagen Pflugertrident test had a sensitivity of61% and specificity of 100% compared withanomaloscopy. Other tests evaluated had resultsthat were clearly inferior to Ishihara’s test.
In general, Ishihara’s test performed at least as wellas other screening tests it was compared against.The one difference worth commenting on was thatbetween the Ishihara’s test and Guys test. In thatcase, Guys test had a higher sensitivity but lowerspecificity. The sensitivity and specificity rateswere lower in that study than all other studies in-vestigating Ishihara’s test and the age group testedwas 4 to 11 years. There were no other evaluationsof Guy’s test identified.
A single study investigated the repeatability ofIshihara’s test (Johnson, 1992). The repeatability ofthe test was excellent in that study but it would bedesirable to have this repeated in other settings.
Therefore, it was concluded that:
There was currently insufficient evidence torecommend a change in the colour visionscreening test currently in use within New Zea-land (Ishihara’s pseudoisochromatic test) on thebasis of its validity. Cost-effectiveness informa-tion is needed to compare the costs of the vari-ous screening tests against sensitivity and speci-ficity criteria.
The sensitivity and specificity of Ishihara’s pseu-doisochromatic test supported this conclusion. Af-ter excluding the study that included a preschoolpopulation (since colour vision screening appears
COLOUR VISION SCREENING
50
to be less reliable in this population) there werethree studies that documented the sensitivity andthree the specificity of this test type. The sensitivityranged between 94% and 98% and the mean was96%. The specificity ranged between 95% and100% and the mean was 98.5%.
On the basis of the results in this report, assuming asensitivity of 96% and specificity of 98.5% whenusing Ishihara’s test and a prevalence of 7.3% in11-year-old boys then the positive predictive valueis 83% and the negative predictive value is 100%.The positive predictive value indicates that 83% ofthose testing positive on screening truly have im-paired colour vision. Clearly, therefore, it is im-
portant that this group should have further testing ifcolour vision screening is to be employed and theresult gives an indication of the efficiency ofscreening.
Table 15 (p. 51) presents a sensitivity analysis ofthe positive and negative predictive values across arange of prevalence figures and sensitivity andspecificity values (for the screening test).
The two studies that provided New Zealand databoth found a prevalence of impaired colour visionamong New Zealand males of 6% when ethnicitywas standardised to 1996 census figures.

COLOUR VISION SCREENING
51
Table 15. Sensitivity analysis of the effect varying sensitivity, specificity and prevalence values have on the positiveand negative predictive values for colour vision screening
Sensitivity=90%, Speci-ficity=90%
Sensitivity=95% Specific-ity=95%
Sensitivity=96%Specificity=98.5%
Sensitivity=99% Specific-ity=99%
2TGXCNGPEG 228���� 028���� 228�� 028�� 228�� 028�� 228�� 028��
�� ��� �� �� ��� �� ��� �� ���
���� �� �� �� ��� �� ��� �� ���
�� �� �� �� ��� �� ��� �� ���
�� �� �� �� ��� �� ��� �� ���
�� 228 � RQUKVKXG RTGFKEVKXG XCNWG�� 028 � PGICVKXG RTGFKEVKXG XCNWG

COLOUR VISION SCREENING
52
The issue of the best timing for screening was alsoconsidered. In general, it would seem logical toscreen colour vision abnormalities at as young anage as possible provided there is no decrease in theperformance of the screening test.
It was considered that colour vision screeningshould occur before the minimum driving age.There appeared to be a decrease in validity of thescreening tests prior to six years of age althoughdirect comparisons were lacking. After that agethere was insufficient evidence to choose any par-ticular age group. Bearing that in mind, and con-sidering the other testing that occurs at 11 years ofage, it was concluded that:
There was insufficient evidence to recommend achange in the age at which colour visionscreening should occur in New Zealand.
Screening programmes are best evaluated with arandomised controlled trial design. Unfortunatelythere were no such studies identified for colourvision screening. There were four relevant studiesidentified but they evaluated aspects of screeningprogrammes rather than the whole programme.Three studies used a cross-sectional design and theother was a non-systematic review. Therefore, itwas concluded that:
It was not possible to evaluate the effectivenessof a colour vision screening programme on thebasis of current research. This was identified asan area requiring further research, incorporat-ing a randomised controlled trial as the mostappropriate research design for this purpose.
It was noted that economic analyses of colour vi-sion programmes were not identified in the conductof this report. Therefore, it was concluded that:
The cost-effectiveness of colour vision screeningcould not be estimated due to the lack of re-search in this area. This is an area requiringfurther research attention.
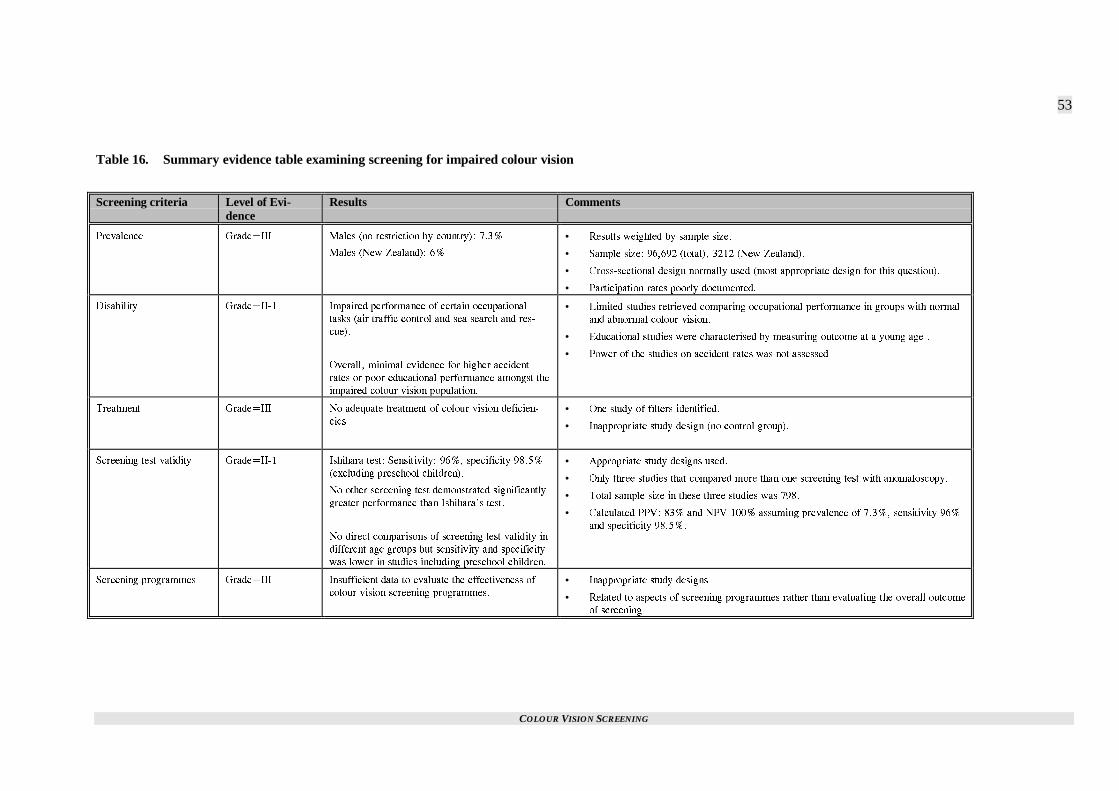
COLOUR VISION SCREENING
53
Table 16. Summary evidence table examining screening for impaired colour vision
Screening criteria Level of Evi-dence
Results Comments
2TGXCNGPEG )TCFG�+++ /CNGU PQ TGUVTKEVKQP D[ EQWPVT[�� ����
/CNGU 0GY <GCNCPF�� ��
• 4GUWNVU YGKIJVGF D[ UCORNG UK\G�
• 5CORNG UK\G� ������ VQVCN�� ���� 0GY <GCNCPF��
• %TQUU�UGEVKQPCN FGUKIP PQTOCNN[ WUGF OQUV CRRTQRTKCVG FGUKIP HQT VJKU SWGUVKQP��
• 2CTVKEKRCVKQP TCVGU RQQTN[ FQEWOGPVGF�
&KUCDKNKV[ )TCFG�++�� +ORCKTGF RGTHQTOCPEG QH EGTVCKP QEEWRCVKQPCN
VCUMU CKT VTCHHKE EQPVTQN CPF UGC UGCTEJ CPF TGU�
EWG��
1XGTCNN� OKPKOCN GXKFGPEG HQT JKIJGT CEEKFGPV
TCVGU QT RQQT GFWECVKQPCN RGTHQTOCPEG COQPIUV VJG
KORCKTGF EQNQWT XKUKQP RQRWNCVKQP�
• .KOKVGF UVWFKGU TGVTKGXGF EQORCTKPI QEEWRCVKQPCN RGTHQTOCPEG KP ITQWRU YKVJ PQTOCN
CPF CDPQTOCN EQNQWT XKUKQP�
• 'FWECVKQPCN UVWFKGU YGTG EJCTCEVGTKUGF D[ OGCUWTKPI QWVEQOG CV C [QWPI CIG �
• 2QYGT QH VJG UVWFKGU QP CEEKFGPV TCVGU YCU PQV CUUGUUGF�
6TGCVOGPV )TCFG�+++ 0Q CFGSWCVG VTGCVOGPV QH EQNQWT XKUKQP FGHKEKGP�
EKGU
• 1PG UVWF[ QH HKNVGTU KFGPVKHKGF�
• +PCRRTQRTKCVG UVWF[ FGUKIP PQ EQPVTQN ITQWR��
5ETGGPKPI VGUV XCNKFKV[ )TCFG�++�� +UJKJCTC VGUV� 5GPUKVKXKV[� ���� URGEKHKEKV[ �����
GZENWFKPI RTGUEJQQN EJKNFTGP��
0Q QVJGT UETGGPKPI VGUV FGOQPUVTCVGF UKIPKHKECPVN[
ITGCVGT RGTHQTOCPEG VJCP +UJKJCTCIU VGUV�
0Q FKTGEV EQORCTKUQPU QH UETGGPKPI VGUV XCNKFKV[ KP
FKHHGTGPV CIG ITQWRU DWV UGPUKVKXKV[ CPF URGEKHKEKV[
YCU NQYGT KP UVWFKGU KPENWFKPI RTGUEJQQN EJKNFTGP�
• #RRTQRTKCVG UVWF[ FGUKIPU WUGF�
• 1PN[ VJTGG UVWFKGU VJCV EQORCTGF OQTG VJCP QPG UETGGPKPI VGUV YKVJ CPQOCNQUEQR[�
• 6QVCN UCORNG UK\G KP VJGUG VJTGG UVWFKGU YCU ����
• %CNEWNCVGF 228� ��� CPF 028 ���� CUUWOKPI RTGXCNGPEG QH ����� UGPUKVKXKV[ ���
CPF URGEKHKEKV[ ������
5ETGGPKPI RTQITCOOGU )TCFG�+++ +PUWHHKEKGPV FCVC VQ GXCNWCVG VJG GHHGEVKXGPGUU QH
EQNQWT XKUKQP UETGGPKPI RTQITCOOGU�
• +PCRRTQRTKCVG UVWF[ FGUKIPU�
• 4GNCVGF VQ CURGEVU QH UETGGPKPI RTQITCOOGU TCVJGT VJCP GXCNWCVKPI VJG QXGTCNN QWVEQOG
QH UETGGPKPI�
COLOUR VISION SCREENING
55
References
Adams, A. J., Bailey, J. E. and Harwood, L. W. (1984) Color vision screening: a comparison of the AO H-R-Rand Farnsworth F-2 tests. Am J Optom Physiol Opt, 61, 1-9.
Al-Amood, W. S., Ghulam Mohammed, S., Al-Sanawi, D. A., Radhi, A. R. and Rehman, B. A. (1981)Incidence of colour blindness in Iraqi Arabs. Hum Hered, 31, 122-123.
Banford, D., North, R. V., Dolben, J., Butler, G. and Owens, D. R. (1994) Longitudinal study of visualfunctions in young insulin dependent diabetics. Ophthal Physiol Opt, 14, 339-346.
Birch, J. (1989) Use of the Farnsworth-Munsell 100-hue test in the examination of congenital colour visiondefects. Ophthal Physiol Opt, 9, 156-162.
Birch, J. (1993) Diagnosis of defective colour vision, Oxford University Press, Oxford.
Birch, J. (1997a) Clinical use of the American Optical Company (Hardy, Rand and Rittler) pseudoisochromaticplates for red-green colour deficiency. Ophthal Physiol Opt, 17, 248-254.
Birch, J. (1997b) Clinical use of the City University Test (2nd edition). Ophthal Physiol Opt, 17, 466-472.
Birch, J. (1997c) Efficiency of the Ishihara test for identifying red-green colour deficiency. Ophthal PhysiolOpt, 17, 403-408.
Birch, J. and McKeever, L. M. (1993) Survey of the accuracy of new pseudoisochromatic plates. OphthalPhysiol Opt, 13, 35-40.
Birch, J. and Platts, C. E. (1993) Colour vision screening in children: an evaluation of three pseudoisochromatictests. Ophthal Physiol Opt, 13, 344-349.
Brown, J., Jr., Fingert, J. H., Taylor, C. M., Lake, M., Sheffield, V. C. and Stone, E. M. (1997) Clinical andgenetic analysis of a family affected with dominant optic atrophy (OPA1). Arch Ophthalmol, 115, 95-99.
Buckalew, L. W., Buckalew, N. M. and Ross, S. (1989) Note on color preference and color vision testperformance. Percept Mot Skills, 69, 1039-1042.
Buyse, M. L. (Ed.) (1990) Birth defects encyclopedia, Mosby Year Book, Cambridge,MA.
Choi, T. B., Lee, D. A., Oelrich, F. O., Amponash, D., Bateman, J. B. and Christensen, R. E. (1995) Aretrospective study of eye disease among first grade children in Los Angeles. J Am Optom Assoc, 66,484-488.
Coren, S. and Hakstian, A. R. (1995) Testing color discrimination without the use of special stimuli or technicalequipment. Percept Mot Skills, 81, 931-938.
Cuckle, H. S. and Wald, N. J. (1984) Principles of screening. In Antenatal and neonatal screening (Ed, Wald, N.J.) Oxford University Press, Oxford.
Cummings, G. E. (1996) Vision screening in junior schools. Public Health, 110, 369-372.
Dain, S. J., Gray, S. and Tran, L. (1997) Colorimetric analysis and performance assessment of the Hahn newpseudoisochromatic colour vision test. Color Res Application, 23, 69-77.
COLOUR VISION SCREENING
56
Dean, A. G., Dean, J. A., Coulombier, D., Brendel, K. A., Smith, D. C., Burton, A. H. et al. (1995) Epi InfoVersion 6: a word-processing, database, and statistics program for public health on IBM-compatiblemicrocomputers., Centers for Disease Control & Prevention, Atlanta, GA.
Donderi, D. C. (1994) Visual acuity, color vision, and visual search performance at sea. Hum Factors, 36, 129-144.
Ekert, M., Bujger, Z. and Cerovski, B. (1995) Early detection of inborn dyschromatopsias in preschoolers andyoung schoolchildren. Ophthalmologica, 209, 242-247.
Elwood, J. M. (1988) Causal relationships in medicine: a practical system for critical appraisal, OxfordUniversity Press, New York.
Evans, A. (1992) Color-vision deficiency--what does it mean? J Sch Nurs, 8, 6-10.
Feig, K. and Ropers, H. H. (1978) On the incidence of unilateral and bilateral colour blindness in heterozygousfemales. Hum Genet, 41, 313-323.
Francois, J., Verriest, G., Mortier, V. and Vonderdonck, R. (1957) De la fréquence des dyschromatopsiescongenitales chez l'homme. Ann Ocul, 190, 5-16.
Ganley, J. P. and Lian, M. C. (1997) Projected color slides as a method for mass screening of red-green colordeficient individuals. Ophthalmic Epidemiol, 4, 213-221.
Geddes, W. R. (1946) The colour sense of Fijian natives. Br J Psychol, 37, 30-36.
Gordon, N. (1998) Colour blindness. Public Health, 112, 81-84.
Gray, M. (1997) Evidence-based health care: how to make health policy and management decisions, ChurchillLivingstone, Oxford.
Grieve, J. (1946) Incidence of defective colour vision. Nature, 157, 376.
Grosvenor, T. (1970) The incidence of red-green color deficiency in New Zealand's Maoris and "Islanders".Am J Optom Arch Am Acad Optom, 47, 445-450.
Group Health Cooperative of Puget Sound (1996) Provider education and guidelines, Group HealthCooperative of Puget Sound, Seattle.
Hardy, K. J., Lipton, J., Scase, M. O., Foster, D. H. and Scarpello, J. H. (1992) Detection of colour visionabnormalities in uncomplicated type 1 diabetic patients with angiographically normal retinas. Br JOphthalmol, 76, 461-464.
Hill, A. R., Heron, G., Lloyd, M. and Lowther, P. (1982) An evaluation of some colour vision tests for children.Doc Ophthal Proc Series, 33, 183-187.
Holroyd, E. and Hall, D. M. (1997) A re-appraisal of screening for colour vision impairments. Child CareHealth Dev, 23, 391-398.
Hovis, J. K. (1997) Long wavelength pass filters designed for the management of color vision deficiencies.Optom Vis Sci, 74, 222-230.
Hovis, J. K., Cawker, C. L. and Cranton, D. (1996) Comparison of the standard pseudoisochromatic plates--Parts 1 and 2--as screening tests for congenital red-green color vision deficiencies. J Am Optom Assoc,67, 320-326.
Ismail, G. M. and Whitaker, D. (1998) Early detection of changes in visual function in diabetes mellitus.Ophthal Physiol Opt, 18, 3-12.
COLOUR VISION SCREENING
57
Johnson, D. D. (1992) The Ishihara Test: on the prevention of job discrimination. J Am Optom Assoc, 63, 352-360.
Kherumian, R., Baudry, C., Lacorne, J. and Moullec, J. (1956) La fréquence des dyschromatopsies en France.Presse Med, 64, 303-304.
Kim, H. B., Lee, S. Y., Choe, J. K., Lee, J. H. and Ahn, B. H. (1989) The incidence of congenital colordeficiency among Koreans. J Korean Med Sci, 4, 117-120.
Kjer, P. (1959) Infantile optic atrophy with dominant mode of inheritance: a clinical and genetic study of 19Danish families. Acta Ophthalmol Suppl, 37, 1-146.
Koliopoulos, J., Iordanides, P., Palimeris, G. and Chimonidou, E. (1976) Data concerning colour visiondeficiencies amongst 29,985 young Greeks. Mod Probl Ophthalmol, 17, 161-164.
Kon, C. H. and De Alwis, D. (1996) A new colour vision test for clinical use. Eye, 10, 65-74.
Kurtenbach, A., Wagner, U., Neu, A., Schiefer, U., Ranke, M. B. and Zrenner, E. (1993) Brightness matchingand colour discrimination in young diabetics without retinopathy. Vision Res, 34, 115-122.
Kuyk, T. K., Veres, J. G. I., Lahey, M. A. and Clark, D. J. (1986) The ability of protan color defectives toperform color-dependent air traffic control tasks. Am J Optom Physiol Opt, 63, 582-586.
Kuyk, T. K., Veres, J. G. I., Lahey, M. A. and Clark, D. J. (1987) Ability of deutan color defectives to performsimulated air traffic control tasks. Am J Optom Physiol Opt, 64, 2-10.
Lampe, J. M. (1973) Summary of a three-year study of academic and school achievement between color-deficient and normal primary age pupils: phase two. J Sch Health, 43, 309-311.
Lanthony, P. (1994) Evaluation of desaturated Panel D-15. III. [French]. J Fr Ophtalmol, 17, 15-21.
Lee, D. Y., Cotter, S. A. and French, A. L. (1997) Evaluation of Kojima-Matsubara color vision test plates:validity in young children. Optom Vis Sci, 74, 726-731.
Littlewood, R. and Hyde, F. (1993) Screening for congenital colour vision defects. A comparison between theOhkuma and Ishihara plates. Aust N Z J Ophthalmol, 21, 31-35.
Lyle, W. M. (1990) Genetic risks, University of Waterloo Press, Waterloo, Ontario.
Macfarlane, D. J., Fitzgerald, W. J. and Stark, D. J. (1987) The prevalence of ocular disorders in 1000Queensland primary schoolchildren. Aust N Z J Ophthalmol, 15, 161-174.
Mandola, J. (1969) The role of color vision anomalies in elementary school achievement. J Sch Health, 39,633-636.
Mann, I. and Turner, C. (1956) Color vision in native races in Australasia. Am J Ophthalmol, 41, 797-800.
Mantyjarvi, M. (1991a) Colour vision testing in pre-school-aged children. Ophthalmologica, 202, 147-151.
Mantyjarvi, M. (1991b) Velhagen Pflugertrident pseudoisochromatic plates in screening congenital red-greenvision defects. Graefes Arch Clin Exp Ophthalmol, 229, 145-146.
Marre, M., Marre, E., Lange, C., Roitzsch, R., Buchmann, J. H. and Sender, R. (1990) Early diagnosis ofcongenital disorders of color vision with the Velhagen "Pflugerhaken Color Charts for evaluating colorperception" in 3,375 preschool children [German]. Klin Monatsbl Augenheilkd, 196, 21-25.
McElearney, N. L., Waddy, R. S. and Rawll, C. C. (1992) Pre-employment colour vision testing. Occup Med,42, 19-22.
COLOUR VISION SCREENING
58
Mertens, H. W. and Milburn, N. J. (1996) Performance of color-dependent air traffic control tasks as a functionof color vision deficiency. Aviat Space Environ Med, 67, 919-927.
Michael, C. R. (1973) Color vision. N Engl J Med, 288, 724-728.
Miles, W. R. (1943) Color blindness in eleven thousand museum visitors. Yale J Biol Med, 16, 59-76.
Modarres, M., Mirsamadi, M. and Peyman, G. A. (1996) Prevalence of congenital color deficiencies insecondary-school students in Tehran. Int Ophthalmol, 20, 221-222.
Morton, W. E. (1975) Hypertension and color blindness in young men. Arch Intern Med, 135, 653-656.
Neitz, M. and Neitz, J. (1995) Numbers and ratios of visual pigment genes for normal red-green color vision.Science, 267, 1013-1016.
New Zealand Guidelines Group (1997) Guidelines fellowship training 12-23 October 1997, Ministry of HealthNational Health Committee, Wellington.
North, R. V., Farrell, U., Banford, D., Jones, C., Gregory, J. W., Butler, G. and Owens, D. R. (1997) Visualfunction in young IDDM patients over 8 years of age. A 4-year longitudinal study. Diabet Care, 20,1724-1730.
Osuobeni, E. P. (1996) Prevalence of congenital red-green color vision defects in Arab boys from Riyadh,Saudi Arabia. Ophthalmic Epidemiol, 3, 167-170.
Pease, P. L. and Allen, J. (1988) A new test for screening color vision: concurrent validity and utility. Am JOptom Physiol Opt, 65, 729-738.
Perez-Carpinell, J., de Fez, M. D. and Climent, V. (1994) Vision evaluation in people with Down's syndrome.Ophthal Physiol Opt, 14, 115-121.
Pokorny, J., Smith, V. C., Verriest, G. and Pinckers, A. J. (1979) Congenital and acquired color vision defects,Grune & Stratton, New York.
Post, R. H. (1962) Population differences in red and green color vision deficiency: a review, and a query onselection relaxation. Eugen Q, 9, 131-146.
Rawlinson, A. (1993) A simple eyesight screening programme for dental undergraduates: results after 7 years.Aust Dent J, 38, 394-399.
Rollinson, R. D. (1977) Bilateral optic neuritis in childhood. Med J Aust, 2, 50-51.
Schmidt, I. (1936) Ergebnis einer Massenuntersuchung des Farbensinnes mit Anomaloskop. Z Bahnärzte, 31,44-53.
Schneck, M. E. and Haegerstrom-Portnoy, G. (1997) Color vision defect type and spatial vision in the opticneuritis treatment trial. Invest Ophthalmol Vis Sci, 38, 2278-2289.
Snowdon, S. K. and Stewart-Brown, S. L. (1997) Preschool vision screening: results of a systematic review,University of York Centre for Reviews and Dissemination, York.
Somerfield, M. R., Long, G. M., Tuck, J. P. and Gillard, E. T. (1989) Effects of viewing conditions on standardmeasures of acquired and congenital color defects. Optom Vis Sci, 66, 29-33.
Steinhoff, B. J., Freudenthaler, N. and Paulus, W. (1997a) The influence of established and new antiepilepticdrugs on visual perception. 1. A placebo-controlled, double-blind, single-dose study in healthyvolunteers. Epilepsy Res, 29, 35-47.
COLOUR VISION SCREENING
59
Steinhoff, B. J., Freudenthaler, N. and Paulus, W. (1997b) The influence of established and new antiepilepticdrugs on visual perception. II. A controlled study in patients with epilepsy under long-termantiepileptic medication. Epilepsy Res, 29, 49-58.
Steward, J. M. and Cole, B. L. (1989) What do color vision defectives say about everyday tasks? Optom VisSci, 66, 288-295.
Stewart-Brown, S. L. and Haslum, M. (1988) Screening of vision in school: could we do better by doing less?BMJ, 297, 1111-1113.
Swanson, W. H. and Everett, M. (1992) Color vision screening of young children. J Pediatr OphthalmolStrabismus, 29, 49-54.
U.S. Preventive Services Task Force (1989) Guide to clinical preventive services: an assessment of theeffectiveness of 169 interventions, Williams & Wilkins, Baltimore.
van Everdingen, J. A., Went, L. N., Keunen, J. E. and Oosterhuis, J. A. (1992) X linked progressive conedystrophy with specific attention to carrier detection. J Med Genet, 29, 291-294.
Verriest, G., Neubauer, O., Marre, M. and Uvijls, A. (1980) New investigations concerning the relationshipsbetween congenital colour vision defects and road traffic safety. Int Ophthalmol, 2, 87-99.
Verrotti, A., Lobefalo, L., Chiarelli, F., Mastropasqua, L., Ciancaglini, M. and Morgese, G. (1995) Colourvision and persistent microalbuminuria in children with type-1 (insulin-dependent) diabetes mellitus: alongitudinal study. Diabet Res Clin Pract, 30, 125-130.
Vingrys, A. J. and Cole, B. L. (1988) Are colour vision standards justified for the transport industry? OphthalPhysiol Opt, 8, 257-74.
Voke, J. (1978a) Colour vision defects - occupational significance and testing requirments. J Soc Occup Med,28, 51-56.
Voke, J. (1978b) Defective colour vision and education. Nurs Times, 74, 1238-1241.
von Planta, P. (1928) Die Häufigkeit der angeborenen Farbensinnstörungen bei Knaben und Mädchen und ihreFeststellung durch die üblichen klinischen Proben. Graefes Arch Ophthalmol, 120, 253-281.
Waaler, G. (1927) Über die Erblichkeitsverhältnisse der verschiedenen Arten von angeborenerRotgrünblindheit. Z Indukt Abstamm Vererbungsl, 45, 279-333.
Wilson, J. M. and Jungner, G. (1968) Principles and practice of screening for disease, World HealthOrganisation, Geneva.

COLOUR VISION SCREENING
Appendix 1
SEARCH STRATEGIES
MEDLINE/HEALTHSTAR
SSccrreeeenniinngg
color vision defects/color perception/vision screening/mass screening/screen:.tw.color vision.tw.colour vision.tw.1 or 2 or 6 or 73 or 4 or 58 and 9limit 10 to (yr=1988 or yr=1989 or yr=1990 or yr=1991 or yr=1992 or yr=1993 or yr=1994 or yr=1995 oryr=1996 or yr=1997 or yr=1998)limit 11 to english
color perception tests/color perception tests/mtlimit 2 to (yr=1988 or yr=1989 or yr=1990 or yr=1991 or yr=1992 or yr=1993 or yr=1994 or yr=1995 oryr=1996 or yr=1997 or yr=1998)limit 3 to humanletter.pt.4 not 5
TTrreeaattmmeenntt
color vision defects/dt,pc,rh,thlimit 1 to humanlimit 3 to (yr=1988 or yr=1989 or yr=1990 or yr=1991 or yr=1992 or yr=1993 or yr=1994 or yr=1995 oryr=1996 or yr=1997 or yr=1998)
PPrreevvaalleennccee;; DDiissaabbiilliittyy;; NNaattuurraall hhiissttoorryy
color perception tests/color perception/color vision defects/color vision.tw.colour vision.tw.color blind:.tw.colour blind:.tw.or/1-7prevalence/incidence/sn.fs.prevalen:.tw.incidence.tw.or/9-138 and 14letter.pt.15 not 16limit 17 to human
COLOUR VISION SCREENING
from 18 keep …natural history.tw.progress:.tw.clinical course.tw.or/20-22disease progression/prognosis/or/20-258 and 2627 not 17limit 28 to humanfrom 29 keep …color vision defects/etcolor perception/de,ge,re31 or 3217 or 2833 not 34from 35 keepdisabled/disabilit:.tw.career choice/employment/learning/educat:.tw.learning disorders/education/or/37-448 and 45from 46 keepfrom 18 keep
EMBASE
color blindness/color vision/color vision defect/color vision test/color discrimination/adolescen:.tw.adolescence/adolescent/or/6-8or/1-59 and 10from 11 keepmass screening/screening/screen:.tw.or/13-1516 and 1017 not 11limit 18 to humanfrom 19 keep12 or 20exp occupational medicine/10 and 2223 not 19from 24 keep 3,725 or 21
COLOUR VISION SCREENING
1 or 3exp incidence/prevalence/(incidence or prevalence).tw.or/28-3027 and 3132 not 26from 33 keepdisability/work disability/physical disability/perception disorder/or/35-3827 and 39from 40 keep 226 or 34 or 41color vision defect/dicolor blindness/di43 or 44color vision defect/et45 or 4647 not 42from 48 keep12 or 20 or 25 or 34 or 41 or 49
OTHER DATABASES
Because there was not a large amount of material on the other databases, Current Contents, Psychlit, ERIC, Sci-ence Citation Index, Social Science Citation Index and OSH-ROM were searched simply using the thesaurusheading color vision if available or, alternatively, the keywords colour vision/color vision.
COLOUR VISION SCREENING
Appendix 2
STUDY DESIGNS USED IN THIS REVIEW
The study designs included in this review were:
� Non-randomised controlled trial
� Cohort study
� Case-control study
� Descriptive studies (including cross-sectional studies and ecological studies).
The remainder of this appendix is based on material contained in Elwood (Elwood, 1988). This is pre-sented in the Table.
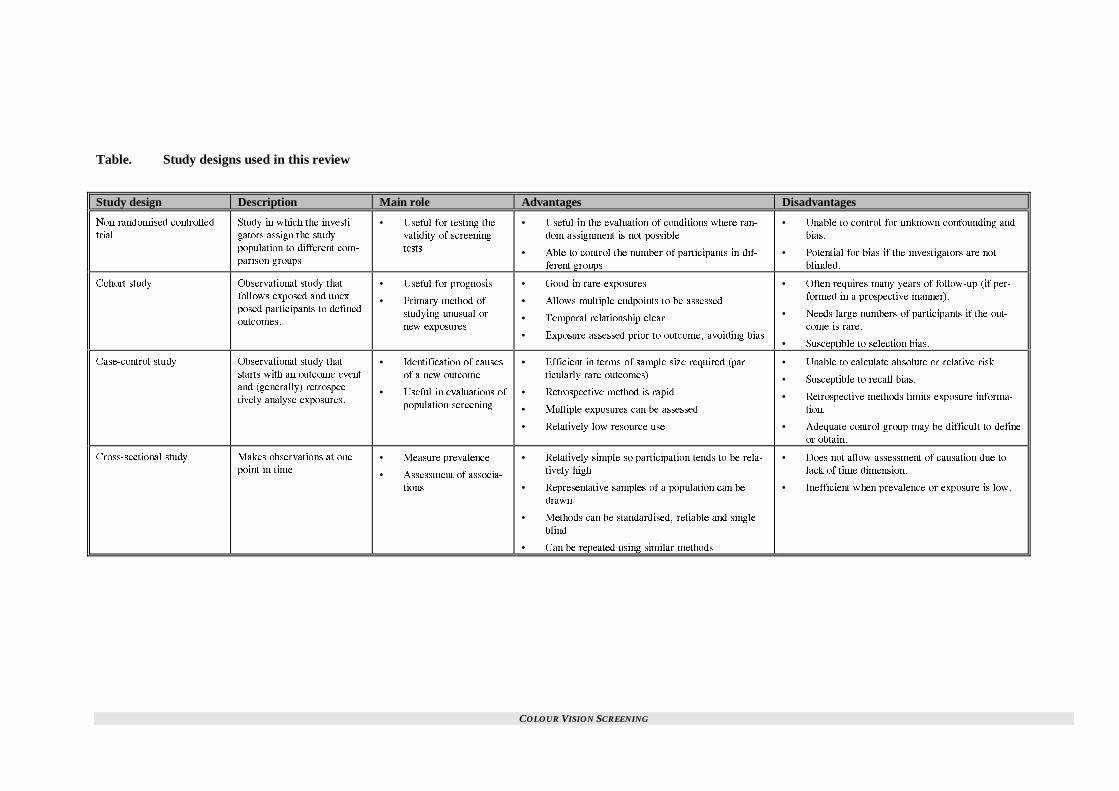
COLOUR VISION SCREENING
Table. Study designs used in this review
Study design Description Main role Advantages Disadvantages
0QP�TCPFQOKUGF EQPVTQNNGF
VTKCN
5VWF[ KP YJKEJ VJG KPXGUVK�
ICVQTU CUUKIP VJG UVWF[
RQRWNCVKQP VQ FKHHGTGPV EQO�
RCTKUQP ITQWRU�
• 7UGHWN HQT VGUVKPI VJG
XCNKFKV[ QH UETGGPKPI
VGUVU
• 7UGHWN KP VJG GXCNWCVKQP QH EQPFKVKQPU YJGTG TCP�
FQO CUUKIPOGPV KU PQV RQUUKDNG
• #DNG VQ EQPVTQN VJG PWODGT QH RCTVKEKRCPVU KP FKH�
HGTGPV ITQWRU
• 7PCDNG VQ EQPVTQN HQT WPMPQYP EQPHQWPFKPI CPF
DKCU�
• 2QVGPVKCN HQT DKCU KH VJG KPXGUVKICVQTU CTG PQV
DNKPFGF�
%QJQTV UVWF[ 1DUGTXCVKQPCN UVWF[ VJCV
HQNNQYU GZRQUGF CPF WPGZ�
RQUGF RCTVKEKRCPVU VQ FGHKPGF
QWVEQOGU�
• 7UGHWN HQT RTQIPQUKU
• 2TKOCT[ OGVJQF QH
UVWF[KPI WPWUWCN QT
PGY GZRQUWTGU
• )QQF KP TCTG GZRQUWTGU
• #NNQYU OWNVKRNG GPFRQKPVU VQ DG CUUGUUGF
• 6GORQTCN TGNCVKQPUJKR ENGCT
• 'ZRQUWTG CUUGUUGF RTKQT VQ QWVEQOG� CXQKFKPI DKCU
• 1HVGP TGSWKTGU OCP[ [GCTU QH HQNNQY�WR KH RGT�
HQTOGF KP C RTQURGEVKXG OCPPGT��
• 0GGFU NCTIG PWODGTU QH RCTVKEKRCPVU KH VJG QWV�
EQOG KU TCTG�
• 5WUEGRVKDNG VQ UGNGEVKQP DKCU�
%CUG�EQPVTQN UVWF[ 1DUGTXCVKQPCN UVWF[ VJCV
UVCTVU YKVJ CP QWVEQOG GXGPV
CPF IGPGTCNN[� TGVTQURGE�
VKXGN[ CPCN[UG GZRQUWTGU�
• +FGPVKHKECVKQP QH ECWUGU
QH C PGY QWVEQOG
• 7UGHWN KP GXCNWCVKQPU QH
RQRWNCVKQP UETGGPKPI
• 'HHKEKGPV KP VGTOU QH UCORNG UK\G TGSWKTGF RCT�
VKEWNCTN[ TCTG QWVEQOGU�
• 4GVTQURGEVKXG OGVJQF KU TCRKF
• /WNVKRNG GZRQUWTGU ECP DG CUUGUUGF
• 4GNCVKXGN[ NQY TGUQWTEG WUG
• 7PCDNG VQ ECNEWNCVG CDUQNWVG QT TGNCVKXG TKUM�
• 5WUEGRVKDNG VQ TGECNN DKCU�
• 4GVTQURGEVKXG OGVJQFU NKOKVU GZRQUWTG KPHQTOC�
VKQP�
• #FGSWCVG EQPVTQN ITQWR OC[ DG FKHHKEWNV VQ FGHKPG
QT QDVCKP�
%TQUU�UGEVKQPCN UVWF[ /CMGU QDUGTXCVKQPU CV QPG
RQKPV KP VKOG• /GCUWTG RTGXCNGPEG
• #UUGUUOGPV QH CUUQEKC�
VKQPU
• 4GNCVKXGN[ UKORNG UQ RCTVKEKRCVKQP VGPFU VQ DG TGNC�
VKXGN[ JKIJ
• 4GRTGUGPVCVKXG UCORNGU QH C RQRWNCVKQP ECP DG
FTCYP
• /GVJQFU ECP DG UVCPFCTFKUGF� TGNKCDNG CPF UKPING
DNKPF
• %CP DG TGRGCVGF WUKPI UKOKNCT OGVJQFU
• &QGU PQV CNNQY CUUGUUOGPV QH ECWUCVKQP FWG VQ
NCEM QH VKOG FKOGPUKQP�
• +PGHHKEKGPV YJGP RTGXCNGPEG QT GZRQUWTG KU NQY�
COLOUR VISION SCREENING
Appendix 3
REFERENCES NOT CONSIDERED FOR APPRAISAL
Adams, A. J., Schefrin, B. and Huie, K. (1987) New clinical color threshold test for eye disease. Am J Optom,64, 29-37.
Arden, G., Gunduz, K. and Perry, S. (1988) Color vision testing with a computer graphics system: preliminaryresults. Doc Ophthalmologica, 69, 167-174.
Aroichane, M., Pieramici, D. J., Miller, N. R. and Vitale, S. (1996) A comparative study of Hardy-Rand-Rittlerand Ishihara colour plates for the diagnosis of nonglaucomatous optic neuropathy. Can J Ophthalmol, 31, 350-355.
Atchison, D. A., Bowman, K. J. and Vingrys, A. J. (1991) Quantitative scoring methods for D15 panel tests inthe diagnosis of congenital color vision deficiencies. Optom Vis Sci, 68, 41-48.
Bassi, C. J., Galanis, J. C. and Hoffman, J. (1993) Comparison of the Farnsworth-Munsell 100-Hue, theFarnsworth D-15, and the L'Anthony D-15 desaturated color tests. Arch Ophthalmol, 111, 639-641.
Beck, R. W., Cleary, P. A. and Optic Neuritis Study Group (1993a) Optic neuritis treatment trial: one yearfollow-up results. Arch Ophthalmol, 111, 773-775.
Beck, R. W., Kupersmith, M. J., Cleary, P. A. and Katz, B. (1993b) Fellow eye abnormalities in acute unilateraloptic neuritis. Experience of the optic neuritis treatment trial. Ophthalmology, 100, 691-697; discussion 697-698.
Celesia, G. G., Kaufman, D. I., Brigell, M., Toleikis, S., Kokinakis, D., Lorance, R. and Lizano, B. (1990)Optic neuritis: a prospective study. Neurology, 40, 919-923.
Christie, W. (1930) Colour blindness in school children. Med J Aust, 1, 247-255.
Clements, F. (1930) Racial differences in color-blindness. Am J Anthropol, 14, 417-432.
Coren, S. and Hakstian, A. R. (1988) Color vision screening without the use of technical equipment: scaledevelopment and cross-validation. Percept Psychophys, 43, 115-120.
Dille, J. R. and Booze, C. F. (1980) The 1976 accident experience of civilian pilots with static physical defects.Aviat Space Environ Med, 51, 182-184.
Dobson, V., Quinn, G. E., Abramov, I., Hardy, R. J., Tung, B., Siatkowski, R. M. and Phelps, D. L. (1996)Color vision measured with pseudoisochromatic plates at five-and-a-half years in eyes of children from theCRYO-ROP study. Invest Ophthalmol Vis Sci, 37, 2467-2474.
Faraldi, J., Actis, G. and Fioravanti, L. (1977) Colour vision and road safety. Panminerva Med, 19, 245-246.
Fitzke, F. W. (1988) Clinical psychophysics. Eye, 2, S233-241.
Fleischman, J. A. and O'Donnell, F.E., Jr. (1981) Congenital X-linked incomplete achromatopsia. Evidence forslow progression, carrier fundus findings, and possible genetic linkage with glucose-6-phosphate dehydrogenaselocus. Arch Ophthalmol, 99, 468-472.
Fleishman, J. A., Beck, R. W., Linares, O. A. and Klein, J. W. (1987) Deficits in visual function after resolutionof optic neuritis. Ophthalmology, 94, 1029-1035.
COLOUR VISION SCREENING
Freeman, A. G. (1991) Off the rails. BMJ, 303, 1480.
Gnadt, G. R. and Amos, J. F. (1992) Dichromacy and its effect on a young male. J Am Optom Assoc, 63, 475-480.
Good, G. W., Weaver, J. L. and Augsburger, A. R. (1996) Determination and application of vision standards inindustry. Am J Indust Med, 30, 633-640.
Griffin, J. F. and Wray, S. H. (1978) Acquired color vision defects in retrobulbar neuritis. Am J Ophthalmol,86, 193-201.
Haegerstrom-Portnoy, G. (1993) New procedures for evaluating vision functions of special populations. OptomVis Sci, 70, 306-314.
Haegerstrom-Portnoy, G., Schneck, M. E., Verdon, W. A. and Hewlett, S. E. (1996) Clinical visioncharacteristics of the congenital achromatopsias: II. Color vision. Optom Vis Sci, 73, 457-465.
Hahn, C. S. (1991) Evaluation of congenital colour vision deficiencies. Int Ophthalmol, 5, 26-29.
Hill, A. R., Reeves, B. C. and Burgess, A. (1988) Huematic - an automated scorer for the Farnsworth-Munsell100 hue test. Eye, 2, 80-86.
Hovis, J. K., Cawker, C. L. and Cranton, D. (1990) Normative data for the standard pseudoisochromatic plates--Part 2. J Am Optom Assoc, 61, 913-920.
Huber, A. (1994) Genetic diseases of vision. Curr Opin Neurol, 7, 65-68.
Ing, E. B., Parker, J. A. and Emerton, L. A. (1994) Computerized colour vision testing. Can J Ophthalmol, 29,125-128.
Jacobson, D. M., Thompson, H. S. and Bartley, J. A. (1989) X-linked progressive cone dystrophy. Clinicalcharacteristics of affected males and female carriers. Ophthalmology, 96, 885-895.
Katz, B. (1995) The dyschromatopsia of optic neuritis: a descriptive analysis of data from the optic neuritistreatment trial. Trans Am Ophthamol Soc, 93, 685-708.
Kessler, J. (1977) What can be done for the color blind? Ann Ophthalmol, 9, 431-433.
Lanthony, P. (1990) The Ohkuma's test: an evaluation [French]. Ophthalmologica, 200, 84-88.
Mahon, L. E. and Vingrys, A. J. (1995) Scoring the Farnsworth-Munsell 100-hue for vocational guidance.Optom Vis Sci, 72, 547-551.
Mantyjarvi, M. I., Nousiainen, I. S. and Myohanen, T. (1988) Color vision in diabetic school children. JPediatr Ophthalmol Strabismus, 25, 244-248.
Margrain, T. and Birch, J. (1994) A suitable study to evaluate colour vision requirements for firefighters?Occup Med, 44, 257-258.
Mossman, P. B. and Young, L. L. (1983) Testing for degress of color blindness. Occup Health Saf, 52, 49-55.
Mounstephen, A. H. (1992) Pre-employment colour vision testing. Occup Med, 42, 217; discussion 217-218.
Norn, M. S. (1968) Achromatopsia. Frequency and occupational prognosis. Acta Ophthalmol, 46, 553-556.
Pinckers, A. (1982) Colour vision as a diagnostic aid. Doc Ophthalmolog, 52, 393-396.
Pinckers, A. and Deutman, A. F. (1987) X-linked cone dystrophy: an overlooked diagnosis. Int Ophthalmol,10, 241-243.
COLOUR VISION SCREENING
Rabin, J. (1996) Cone-specific measures of human color vision. Invest Ophthalmol Vis Sci, 37, 2771-2774.
Rawlinson, A. (1988) A study to investigate the visual quality quality of dental undergraduates using a simplescreening programme. Aust Dent J, 33, 303-307.
Regan, B. C., Reffin, J. P. and Mollon, J. D. (1994) Luminance noise and the rapid determination ofdiscrimination ellipses in colour deficiency. Vision Res, 34, 1279-1299.
Robinson, B., Acorn, C., Millar, C. C. and Lyle, W. M. (1997) The prevalence of selected ocular diseases andconditions. Optom Vis Sci, 74, 79-91.
Romano, P. E. (1990) Advances in vision and eye screening: screening at six months of age. Pediatrician, 17,134-141.
Roy, M. S., Gunkel, R. D. and Podgor, M. J. (1986) Color vision defects in early diabetc retinopathy. ArchOphthalmol, 104, 225-228.
Sadowski, B. and Zrenner, E. (1997) Cone and rod function in cone degenerations. Vision Res, 37, 2303-2314.
Sanders, E. A., Volkers, A. C., van der Poel, J. and van Lith, G. H. (1986) Estimation of visual function afteroptic neuritis: a comparison of clinical tests. Br J Ophthalmol, 70, 918-924.
Schiefer, U., Kurtenbach, A., Braun, E., Kraus, W. and Zrenner, E. (1995) Centrally tinted contact lenses. Auseful visual aid for patients with achromatopsia. Ger J Ophthalmol, 4, 52-56.
Sofoluwe, G. O. (1992) Pre-employment colour vision testing. Occup Med, 42, 217; discussion 217-8.
Tanabe, S. and Hukami, K. (1995) Evaluation of congenital defective color vision by lantern test [Japanese].Rinsho Ganka: Japan J Clin Ophthalmol, 49, 1373-1375.
Tanabe, S., Ishiguro, S., Fukuta, Y., Hukami, K. and Ichikawa, K. (1993) Pseudoisochromatic plates for massscreening [Japanese]. Rinsho Ganka: Japan J Clin Ophthalmol, 47, 971-974.
Tregear, S. J., Knowles, P. J., Ripley, L. G. and Casswell, A. G. (1997) Chromatic-contrast thresholdimpairment in diabetes. Eye, 11, 537-546.
Trobe, J. D., Beck, R. W., Moke, P. S. and Cleary, P. A. (1996) Contrast sensitivity and other vision tests in theoptic neuritis treatment trial. Am J Ophthalmol, 121, 547-553.
Tuck, J. P. and Long, G. M. (1990) The role of small-field tritanopia in two measures of colour vision. OphthalPhysiol Opt, 10, 195-199.
Ver Hoeve, J. N., France, T. D. and Bousch, G. A. (1996) A sweep VEP test for color vision deficits in infantsand young children. J Pediatr Ophthalmol Strabismus, 33, 298-302.
Verriest, G., Uvijls, A., Gandibleux, M.-F., Pierart, P., Malfroidt, A. and Coninck, M.-R. (1982a) Colour visiontests in children. Doc Ophthalmol Proc Series, 33, 175-178.
Verriest, G., Van Laethem, J. and Uvijls, A. (1982b) A new assessment of the normal ranges of the Farnsworth-Munsell 100-hue test scores. Am J Ophthalmol, 93, 635-642.
Vingrys, A. J., Atchison, D. A. and Bowman, K. J. (1992) The use of colour difference vectors in diagnosingcongenital colour vision deficiencies with the Farnsworth-Munsell 100-hue test. Ophthal Physiol Opt, 12, 38-45.
Vingrys, A. J. and King-Smith, P. E. (1988) A quantitative scoring technique for panel tests of color vision.Invest Ophthalmol, 29, 50-63.
Voke, J. (1986) Hazards of colour blindness. Safety Practitioner, 4, 32-35.

COLOUR VISION SCREENING
Wasson, W. and Schuman, N. (1992) Color vision and dentistry. Quintessence Int, 23, 349-353.
Whillans, M. G. (1983) Colour-blind drivers' perception of traffic signals. Can Med Assoc J, 128, 1187-1189.
Whillans, M. G. and Allen, M. J. (1992) Color defective drivers and safety. Optom Vis Sci, 69, 463-466.
Wilkinson, W. K. (1992) The cognitive and social-emotional correlates of color deficiency in children: aliterature review and analysis. Adolescence, 27, 603-611.
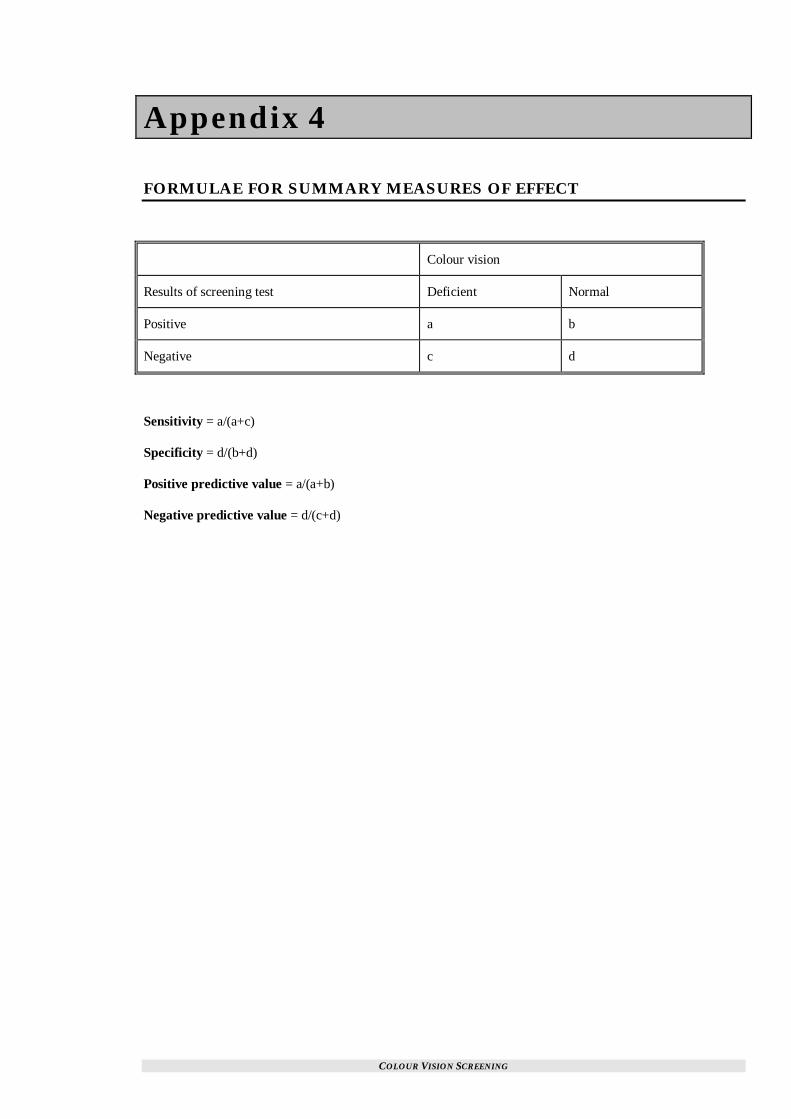
COLOUR VISION SCREENING
Appendix 4
FORMULAE FOR SUMMARY MEASURES OF EFFECT
Colour vision
Results of screening test Deficient Normal
Positive a b
Negative c d
Sensitivity = a/(a+c)
Specificity = d/(b+d)
Positive predictive value = a/(a+b)
Negative predictive value = d/(c+d)
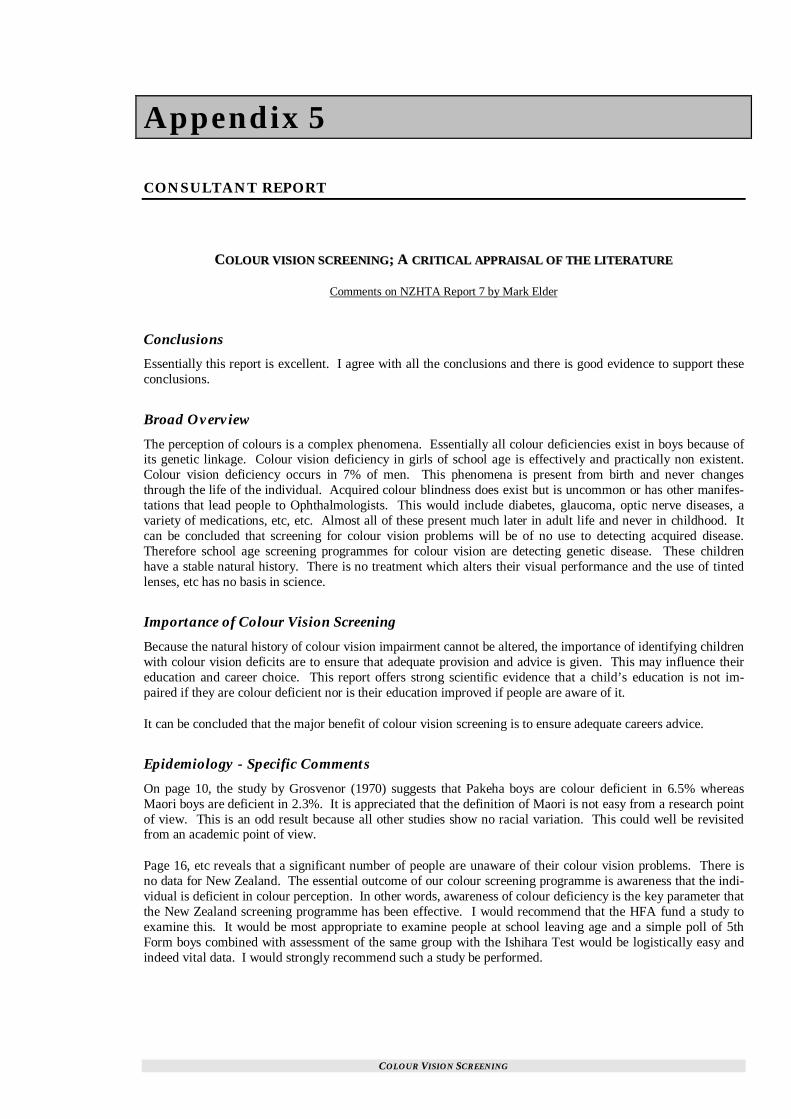
COLOUR VISION SCREENING
Appendix 5
CONSULTANT REPORT
CCOOLLOOUURR VVII SSII OONN SSCCRREEEENNII NNGG;; AA CCRRII TTII CCAALL AAPPPPRRAAII SSAALL OOFF TTHHEE LL II TTEERRAATTUURREE
Comments on NZHTA Report 7 by Mark Elder
Conclusions
Essentially this report is excellent. I agree with all the conclusions and there is good evidence to support theseconclusions.
Broad Overview
The perception of colours is a complex phenomena. Essentially all colour deficiencies exist in boys because ofits genetic linkage. Colour vision deficiency in girls of school age is effectively and practically non existent.Colour vision deficiency occurs in 7% of men. This phenomena is present from birth and never changesthrough the life of the individual. Acquired colour blindness does exist but is uncommon or has other manifes-tations that lead people to Ophthalmologists. This would include diabetes, glaucoma, optic nerve diseases, avariety of medications, etc, etc. Almost all of these present much later in adult life and never in childhood. Itcan be concluded that screening for colour vision problems will be of no use to detecting acquired disease.Therefore school age screening programmes for colour vision are detecting genetic disease. These childrenhave a stable natural history. There is no treatment which alters their visual performance and the use of tintedlenses, etc has no basis in science.
Importance of Colour Vision Screening
Because the natural history of colour vision impairment cannot be altered, the importance of identifying childrenwith colour vision deficits are to ensure that adequate provision and advice is given. This may influence theireducation and career choice. This report offers strong scientific evidence that a child’s education is not im-paired if they are colour deficient nor is their education improved if people are aware of it.
It can be concluded that the major benefit of colour vision screening is to ensure adequate careers advice.
Epidemiology - Specific Comments
On page 10, the study by Grosvenor (1970) suggests that Pakeha boys are colour deficient in 6.5% whereasMaori boys are deficient in 2.3%. It is appreciated that the definition of Maori is not easy from a research pointof view. This is an odd result because all other studies show no racial variation. This could well be revisitedfrom an academic point of view.
Page 16, etc reveals that a significant number of people are unaware of their colour vision problems. There isno data for New Zealand. The essential outcome of our colour screening programme is awareness that the indi-vidual is deficient in colour perception. In other words, awareness of colour deficiency is the key parameter thatthe New Zealand screening programme has been effective. I would recommend that the HFA fund a study toexamine this. It would be most appropriate to examine people at school leaving age and a simple poll of 5thForm boys combined with assessment of the same group with the Ishihara Test would be logistically easy andindeed vital data. I would strongly recommend such a study be performed.

COLOUR VISION SCREENING
Careers and Colour Vision; Specific Comments
Page 19 shows that Steward and Cole, 1989, demonstrate that knowledge of colour vision significantly influ-enced career choices.
On page 20 the study of Voke, 1978b, shows that 62% of people chose inappropriate careers for their visualimpairments.
Therefore it is important to identify colour vision deficits before a child embarks on a career pathway. If a childis advised too young then they may well forget, whereas if they are too old then it may be too late to changetheir pathway.
This aspect of knowledge of a colour vision deficit and appropriate career counselling probably needs to be di-rected at the parents. I would recommend that such advice and current counselling be reassessed.
Specific Career Choices
This report details the importance of colour vision to specific occupations such as air traffic control, electricalwork, search and rescue. There are others such as train drivers, and pilots etc. It is my opinion that it is up toindividual organisations to perform their own screening procedures for such applicants. Indeed this is done forpilots and train drivers and I believe air traffic controllers. From a clinical perspective there is no doubt thatnormal colour vision is vital for a number of occupations but this is well beyond the brief of a school screeningprogramme.
The evidence for colour vision playing a significant role in motor vehicle accidents is lacking. It is my opinionthat other variables such as speed, alcohol, road construction, weather conditions, driver fatigue, spatial aware-ness, etc, etc far outweigh the effects of colour vision. It is my opinion that colour vision does not need to beassessed for our current driving licence.
Means of Testing Colour Vision
This reports analysis on sensitivity, specificity, repeatable and the use of these tests in children is excellent and Iagree with their conclusions.
Age of Testing
The age of testing is based on whether colour vision deficits will affect education or career. I agree with thework of Gordon, 1989, (page 43), that the most appropriate age for testing is 11-14 years. The caveat is that anychild with a learning disability should have the opportunity for colour vision assessment.
It is important to appreciate that any child with learning impairment may be disabled for any number of reasons.It is my opinion that these children all need an adequate hearing test to exclude hearing disabilities and an ade-quate assessment of their visual acuity and colour vision. However this is beyond the brief of this report.
Cost-Effectiveness
This report does not deal with any of the fiscal aspects. There is no data as to the current incremental costs ofcolour vision screening, etc.
The main outcome of the screening procedure will be appropriate knowledge that may influence careers. Itwould be very difficult to cost account this. For example, what price is there if a person spends one year in anelectricians apprenticeship only to find that he cannot distinguish the red from green wires and therefore mustretrain in another area. The work of Voke, 1978b, certainly documents the opportunity cost to society for inap-propriate career choice.
The last paragraph of page 47 poses the philosophical question as to whether a screening programme that hasimplications beyond the health sector be purchased by the health sector. The fact that this question has beenraised illustrates that the compartmentalising of Government provided social services has pedantically gone too

COLOUR VISION SCREENING
far. All aspects of health care have benefits extending beyond health care. Every disease and disability affectsan individual and society over multiple aspects including health, economics, recreational, spiritual, etc.
Final Conclusions
1. That this report be accepted in its entirety.
2. There may be differences between colour vision impairment in Maori children compared to Pakeha andthis needs investigating.
3. A study needs to be performed on 5th Form children comparing their colour vision with their knowl-edge of their colour vision status (pretest) and their awareness of how this may influence career deci-sions.
4. For the boys identified as being colour vision impaired, the pathway and information and implicationof this needs to be revisited. For example, what is told to the child and their parents.
5. Children with learning impairment should have access to colour vision assessment.
Mark Elder, MBCHB, MD, FRACS, FRACO, OStJCONSULTANT OPHTHALMOLOGIST
ME:kld


![Proposed General Direction - Impaired Colour Vision · Impaired Colour Vision GD/VIS/01/2013.1 of [DATE] 2013 Description of the proposed Impaired Colour Vision GD: Page 1 ... is](https://img.pdfslide.us/doc/110x75/5ca4e23c88c99313358c1701/proposed-general-direction-impaired-colour-vision-impaired-colour-vision-gdvis0120131.jpg)