Embed Size (px)
Citation preview
Colorado River Basin Salinity Control Program
Manila - Washam Unit Monitoring and Evaluation Report, FY2007
U.S. Department of Agriculture Natural Resources Conservation Service
04/17/08 Page 2 of 33
Executive Summary
Project Status
• NRCS and Reclamation have reviewed and concurred on an initial agricultural salt loading of 27,000 tons on-farm and 13,000 tons off-farm pre-project salt loading
• Salt load reduction has been calculated using procedures developed in 2007 to assure proportionality and concurrence with consensus EIS projections
• For FY2007, $2.60 Million was obligated planning 1,835 acres to reduce salt loading by 4,200 tons at an amortized cost of $72/ton
• During FY2007, no salinity projects were applied
• Of 11,100 water rights acres, 7,500 acres are projected to be improved
Hydro-salinity
• Cooperators will need to complete installation before IWM record keeping, soil moisture monitoring, and sprinkler condition surveys can be initiated
Wildlife Habitat and Wetlands
• Habitat monitoring methodology will be land cover maps created by examining aerial photographs and quantified using GIS software
• USFS managed wetlands are an important part of wildlife habitat in the Salinity Area; secure water rights are needed for proper management
• There were no applications for wildlife habitat funds in FY2007
Economics
• Alfalfa production is in a slight downward trend
• Interest in salinity control projects is strong
04/17/08 Page 3 of 33
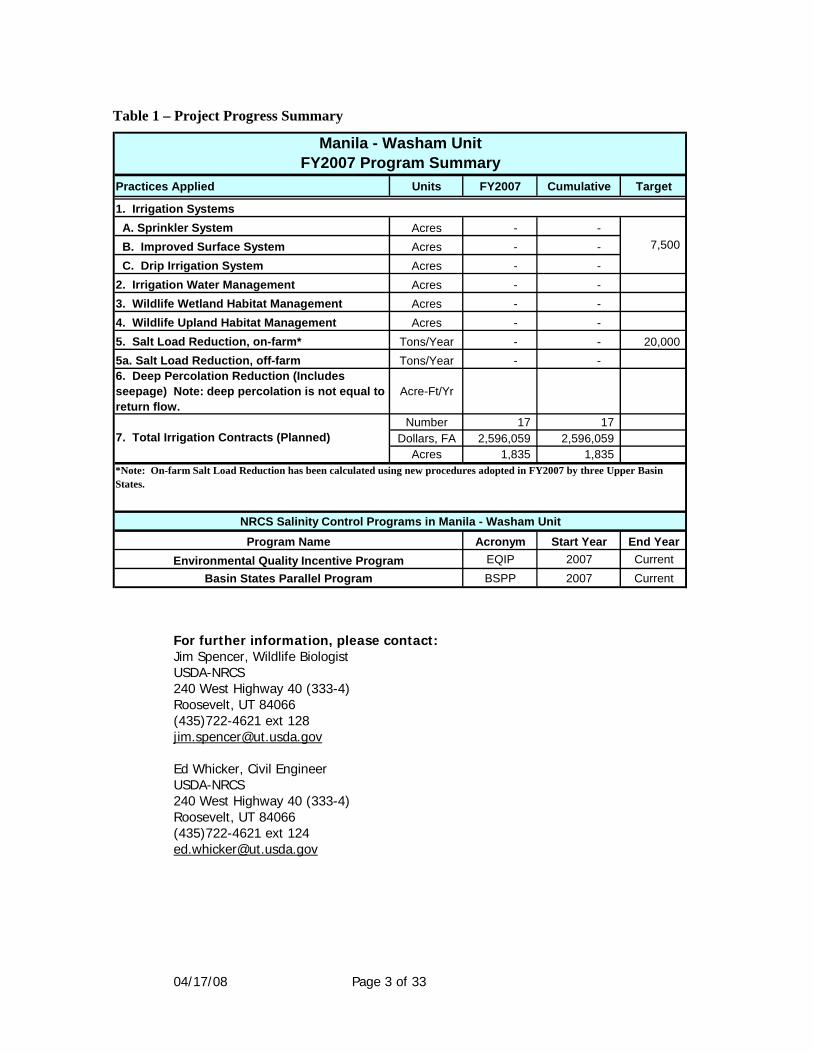
For further information, please contact: Jim Spencer, Wildlife Biologist USDA-NRCS 240 West Highway 40 (333-4) Roosevelt, UT 84066 (435)722-4621 ext 128 [email protected] Ed Whicker, Civil Engineer USDA-NRCS 240 West Highway 40 (333-4) Roosevelt, UT 84066 (435)722-4621 ext 124 [email protected]
Table 1 – Project Progress Summary
Practices Applied Units FY2007 Cumulative Target
A. Sprinkler System Acres - - B. Improved Surface System Acres - - C. Drip Irrigation System Acres - - 2. Irrigation Water Management Acres - - 3. Wildlife Wetland Habitat Management Acres - - 4. Wildlife Upland Habitat Management Acres - - 5. Salt Load Reduction, on-farm* Tons/Year - - 20,000 5a. Salt Load Reduction, off-farm Tons/Year - - 6. Deep Percolation Reduction (Includes seepage) Note: deep percolation is not equal to return flow.
Acre-Ft/Yr
Number 17 17 Dollars, FA 2,596,059 2,596,059
Acres 1,835 1,835
Acronym Start Year End YearEQIP 2007 CurrentBSPP 2007 CurrentBasin States Parallel Program
*Note: On-farm Salt Load Reduction has been calculated using new procedures adopted in FY2007 by three Upper Basin States.
NRCS Salinity Control Programs in Manila - Washam UnitProgram Name
Environmental Quality Incentive Program
Manila - Washam UnitFY2007 Program Summary
1. Irrigation Systems
7,500
7. Total Irrigation Contracts (Planned)
04/17/08 Page 4 of 33
Table of Contents
Executive Summary __________________________________________________________ 2 Project Status ____________________________________________________________________ 2 Hydro-salinity ___________________________________________________________________ 2 Wildlife Habitat and Wetlands______________________________________________________ 2 Economics_______________________________________________________________________ 2
Table of Contents ____________________________________________________________ 4
Tables _____________________________________________________________________ 5
Figures ____________________________________________________________________ 5
Monitoring and Evaluation History and Background _______________________________ 6
Project Status _______________________________________________________________ 6 Pre-Project Salt Loading___________________________________________________________ 6 Progress ________________________________________________________________________ 7 Funding_________________________________________________________________________ 7 Practices Planned and Applied______________________________________________________ 7 Salt Load Reduction ______________________________________________________________ 8
On-Farm _______________________________________________________________________________8 Off-farm _______________________________________________________________________________8
Cost per Ton_____________________________________________________________________ 9 Hydro Salinity______________________________________________________________ 10
Salinity Monitoring Methods _____________________________________________________________10 Cooperator questionnaires, interviews, and training sessions____________________________ 11 Irrigation Water Management (IWM) ______________________________________________ 11
Irrigation Record Keeping ________________________________________________________________12 Soil Moisture Monitoring _________________________________________________________________15
Wildlife Habitat and Wetlands_________________________________________________ 17 Background ____________________________________________________________________ 17 Area-wide Wildlife Habitat Monitoring _____________________________________________ 17 Managed Wetlands ______________________________________________________________ 17 Wildlife Habitat Contract Monitoring_______________________________________________ 17 Voluntary Habitat Replacement ___________________________________________________ 19
Economics_________________________________________________________________ 19 Cooperator Economics ___________________________________________________________ 19
Production Information___________________________________________________________________19
04/17/08 Page 5 of 33
Expense Information_____________________________________________________________________19 Public Economics________________________________________________________________ 20 Land Use Land Cover ____________________________________________________________ 20
Summary__________________________________________________________________ 20 Appendix I – Revised salt load reduction calculation __________________________________ 23 Appendix II - Salt Load Reduction Worksheet________________________________________ 28 Appendix III – Daggett County, Utah Hay Production _________________________________ 29
Glossary and Acronyms ______________________________________________________ 30
References_________________________________________________________________ 33
Tables Table 1 – Project Progress Summary _____________________________________________________________3 Table 2 – Nominal Financial Assistance Funds planned and applied by program __________________________7
Figures Figure 1 – Consensus Initial Salt Load Allocation. __________________________________________________7 Figure 2 – Acres projected, planned, and applied ___________________________________________________8 Figure 3 - Tons planned/applied compared to original agricultural salt load______________________________9 Figure 4 – Cost per acre for planned practices _____________________________________________________9 Figure 5 – US price of crude oil, by year __________________________________________________________9 Figure 6 – Nominal amortized cost/ton, planned and applied practices _________________________________10 Figure 7 – Data entry page from IWM self certification spreadsheet ___________________________________13 Figure 8 – Sample graphs from the IWM Self Certification Spreadsheet. ________________________________14 Figure 9 - Soil moisture data recorder with graphing _______________________________________________15 Figure 10 - Soil Moisture Data downloaded from recorder and graphed in Excel._________________________16 Figure 11, USFS Henrys Fork Complex__________________________________________________________18 Figure 12, USFS Linwood Complex _____________________________________________________________18 Figure 13, Manila - Washam Unit alfalfa production and yield________________________________________19 Figure 14, Manila - Washam Unit Mountain Precipitation from Utah Division of Water Resources ___________20 Figure 15, Pre-project land use land cover _______________________________________________________21
04/17/08 Page 6 of 33
Monitoring and Evaluation History and Background The Colorado River Basin Salinity Control Program was established by the following Congressional Actions:
• The Water Quality Act of 1965 (Public Law 89-234) as amended by the Federal Water Pollution Control Act of 1972, mandated efforts to maintain water quality standards in the United States.
• Congress enacted the Colorado River Basin Salinity Control Act (PL 93-320) in June, 1974. Title I of the Act addresses the United States’ commitment to Mexico and provided the means for the U.S. to comply with the provisions of Minute 242. Title II of the Act created a water quality program for salinity control in the United States. Primary responsibility was assigned to the Secretary of Interior and the Bureau of Reclamation (Reclamation). USDA was instructed to support Reclamation’s program with its existing authorities.
• The Environmental Protection Agency (EPA) promulgated a regulation in December, 1974, which established a basin wide salinity control policy for the Colorado River Basin and also established a water quality standards procedure requiring basin states to adopt and submit for approval to the EPA, standards for salinity, including numeric criteria and a plan of implementation.
• In 1984, PL 98-569 amended the Salinity Control Act, authorizing the USDA Colorado River Salinity Control Program. Congress appropriated funds to provide financial assistance through Long Term Agreements administered by Agricultural Stabilization and Conservation Service (ASCS) with technical support from Soil Conservation Service (SCS). PL 98-569 also requires continuing technical assistance along with monitoring and evaluation to determine effectiveness of measures applied.
• In 1995, PL 103-354 reorganized several agencies of USDA, transforming SCS into Natural Resources Conservation Service (NRCS) and ASCS into Farm Service Agency (FSA).
• In 1996, the Federal Agricultural Improvement and Reform Act (PL 104-127) combined four existing programs, including the Colorado River Basin Salinity Control Program, into the Environmental Quality Incentives Program (EQIP).
Over the years, Monitoring and Evaluation (M&E) has evolved from a mode of labor/cost intensive detailed evaluation of a few farms and biological sites to a broader, but less detailed evaluation of many farms and environmental concerns, driven by budgetary restraints and improved technology.
M&E is conducted as outlined in “The Framework Plan for Monitoring and Evaluating (M&E) the Colorado River Salinity Control Program”, last revised in 2001.
Project Status
Pre-Project Salt Loading
In order to plan and track progress in the Manila - Washam Unit (MW) of the Colorado River Basin Salinity Control Project (CRBSCP), it is necessary to understand pre-project conditions.
Salt load at a given point in a watercourse is generally estimated by multiplying average flow by average salt concentration over a discrete time period and summing to determine an annual average salt load. Since stream flow rates and concentrations are highly variable, shorter measurement intervals monitored over longer periods of record result in more acceptable estimates.
The average salt pickup for a given drainage is the salt load below the drainage, less the salt load above the drainage.
Salt pickup has many sources including natural processes, springs, wells, mines, agricultural activity, etc. Agricultural irrigation is a particularly large source which involves diverting
04/17/08 Page 7 of 33
water from a stream, transporting the water to a field and applying water to the soil. Salt pickup occurs when seepage from canals and excess water application on fields allows water to percolate below the plant root zone, where it dissolves salt from the soil and eventually returns the dissolved salt to the river system.
One of the challenges of salt load evaluation is to quantify how much salt is produced by what source, and what can be done to reduce the amount of salt returning to the river system. Agriculture is a primary source of salt loading and completely human induced. Therein is high potential to make positive change.
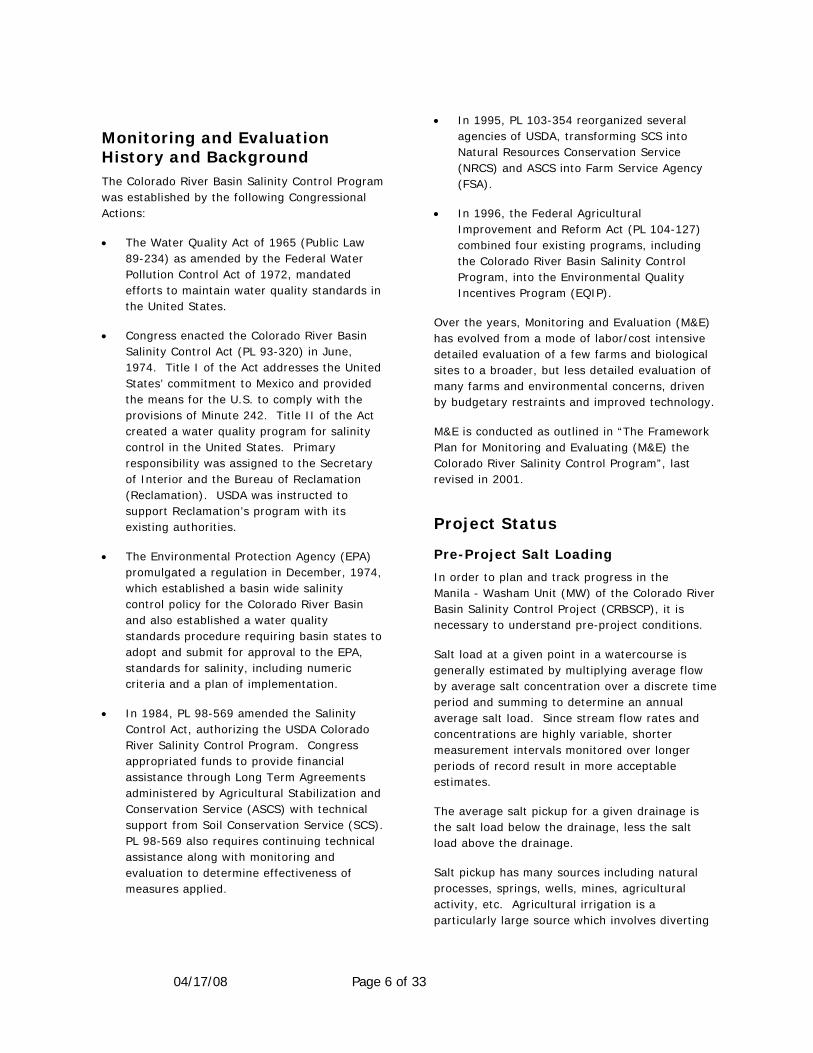
For the Manila - Washam Unit, in 2006, U.S. Department of Agriculture (USDA) Natural Resources Conservation Service (NRCS) developed an Environmental Assessment (EA) with a Finding of No Significant Impact (FONSI) for salinity control projects. NRCS projected the funding of on-farm improvements on 7,500 acres of irrigated land. No off-farm improvements are planned; however the U.S. Bureau of Reclamation (Reclamation) has issued a Funding Opportunity Application (FOA) to invite proposals for off-farm salinity improvements throughout the Upper Colorado River Basin.
In 2007, Reclamation and NRCS met to review the EA and made a consensus agreement on the probable initial salt contribution of agriculture, prior to implementing Federal Salinity Control Programs. The result of this effort is depicted in figure 1.
Progress
Table 1 (page 3) is a summary of the cumulative status of all USDA salinity control activities, which began in FY2007 with the Environmental Quality Improvement Program (EQIP) and the Basin
States Parallel Program (BSPP).
In FY2007, no BSPP contracts were written in the Manila – Washam Unit. Table 2 summarizes planning status by program.
Funding
Of a nominal $2.60 million Financial Assistance (FA) obligated, approximately $32,000 has been applied.
Practices Planned and Applied
There are about 11,100 acres of irrigated land in Manila - Washam Unit, of which an average 10,100 acres are irrigated in a given season.
Pre-project planning estimated that 7,500 acres would ultimately be treated. Virtually all treatments are expected to be sprinkler systems.
Figure 1 – Consensus Initial Salt Load Allocation.
Table 2 – Nominal Financial Assistance Funds planned and applied by program
Manila - Washam Salinity UnitSalt Load Allocation
On-farm
Off-Farm
Non-Ag
-
10,000
20,000
30,000
40,000
50,000
60,000
Tons
/yea
r
Non-Ag 9,000
Off-Farm 13,000
On-farm 27,000
USDA EA
Program Contracts Planned
FA, $ Obligated
FA, $Applied
Irrigation Acres
Planned
Tons Planned
$/Acre Planned
Avg Acres Planned
/Contract
Amortized $/Ton
PlannedEQIP 17 2,596,059 32,363 1,835 4,214 1,415 108 72 BSPP - - - - - - - -
Totals 17 2,596,059 32,363 1,835 4,214 - 108 72
04/17/08 Page 8 of 33
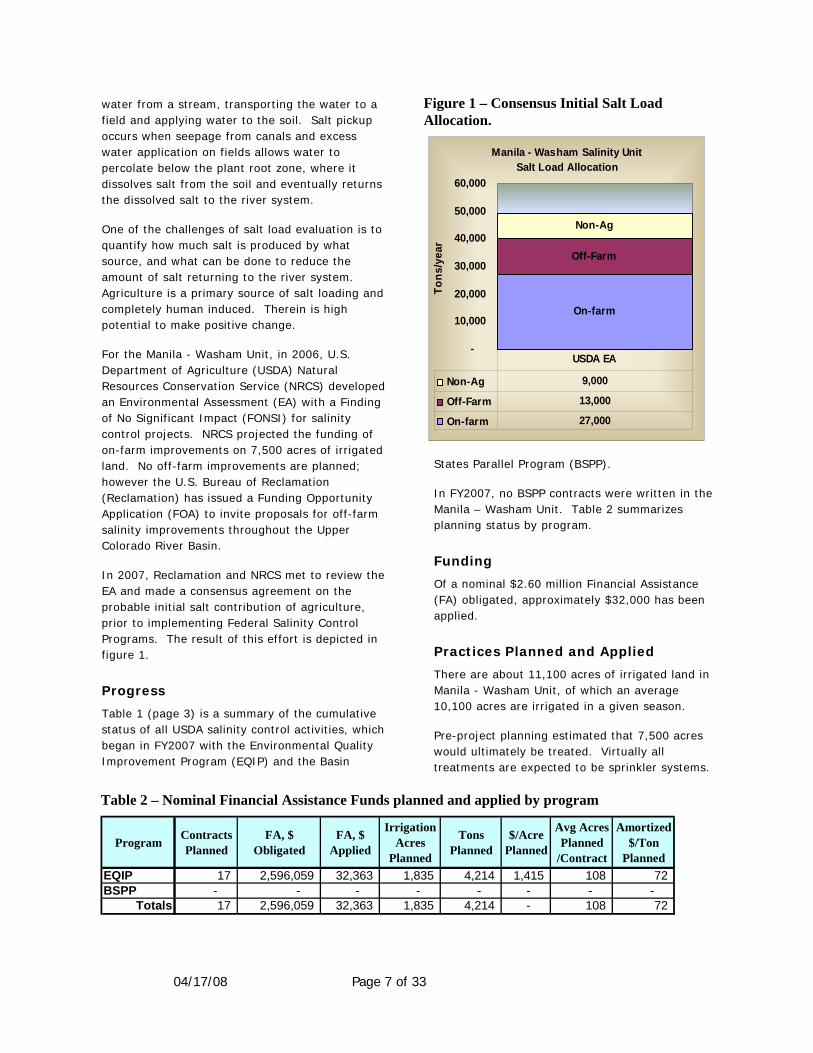
In FY2007, the first year of the project, 17 contracts were written, planning 1,835 acres. No contracts were completed in FY2007.
Figure 2 depicts cumulative acres projected, acres planned, and acres applied.
Salt Load Reduction
On-Farm For on-farm projects, total water applied to the field (irrigation and precipitation) must equal total water leaving the field (evaporation, crop evapotranspiration, run-off, non-crop plant consumption, and deep percolation, a fraction of which becomes return flow), adjusted for changes in water storage in the soil. If there is a high water table, additional variables must be evaluated.
Deep percolation is generally estimated by subtracting mathematically modeled evapotranspiration (ET) and run-off from total water applied (calculated by dividing ET by estimated application efficiency). This method assumes that full-season water volumes are available for delivery.
Difficulty in dealing with all potential variables has led to several different methods of calculating salt load reduction. Ideally, the calculation procedure used is expected to produce a result that is proportional and concurrent with acres treated.
In 2007, NRCS personnel in Utah and Colorado agreed to use a procedure that starts with pre-project tons/acre, as documented and agreed to by NRCS and Reclamation, and allocates salt load reduction based on acres treated and change in practice. For example, if 40 acres are upgraded from unimproved flood to a wheel line sprinkler system, irrigation salt load would be reduced by 84%. As illustrated in figure 1, Manila - Washam Unit was producing 27,000 on-farm tons/acre-year from an average annually irrigated 10,100 acres or 2.67 tons/acre-year. The salt load reduction for a hypothetical 40 acre wheel line would be 2.67 tons/acre–year x 40 acres x 0.84 = 90 tons/year. Development of this procedure is outlined in Appendix 1. The Water and Salt Savings Worksheet for Ranking, which uses this procedure, is in Appendix II.
Salt load reduction estimates for salinity control planning have been calculated using this procedure.
Off-farm Deep percolation from ditches and canals is due to seepage (uniform percolation of water through the soil layers) and leakage (water losses through fissures, cracks, or other channels, known or unknown). Seepage and leakage can be estimated by measuring channel flow changes, doing pit studies, or using other technical approaches. Seepage is often estimated using equations that account for wetted perimeter, permeability and canal length.
Once water has seeped/leaked from the channel, volumes used by vegetation and volumes returning to the river system must still be determined. Traditionally, 50% of deep percolation from canal seepage has been allocated to return flow although the actual fraction is probably highly variable.
In FY2007, Reclamation and NRCS agreed to the on-farm/off-farm salt load allocation presented in
Figure 2 – Acres projected, planned, and applied
Manila - Washam Unit Planned/Applied Acres
Projected
0
1,000
2,000
3,000
4,000
5,000
6,000
7,000
8,000
2007 2008 2009 2010 2011Fiscal Year
Cum
ulat
ive
Acr
es
Projected Planned Applied
04/17/08 Page 9 of 33
figure 1 (page 7). Reclamation is presently evaluating the off-farm allocation. When finished, the salt loading of canals will be expressed in tons/mile, greatly simplifying future calculations.
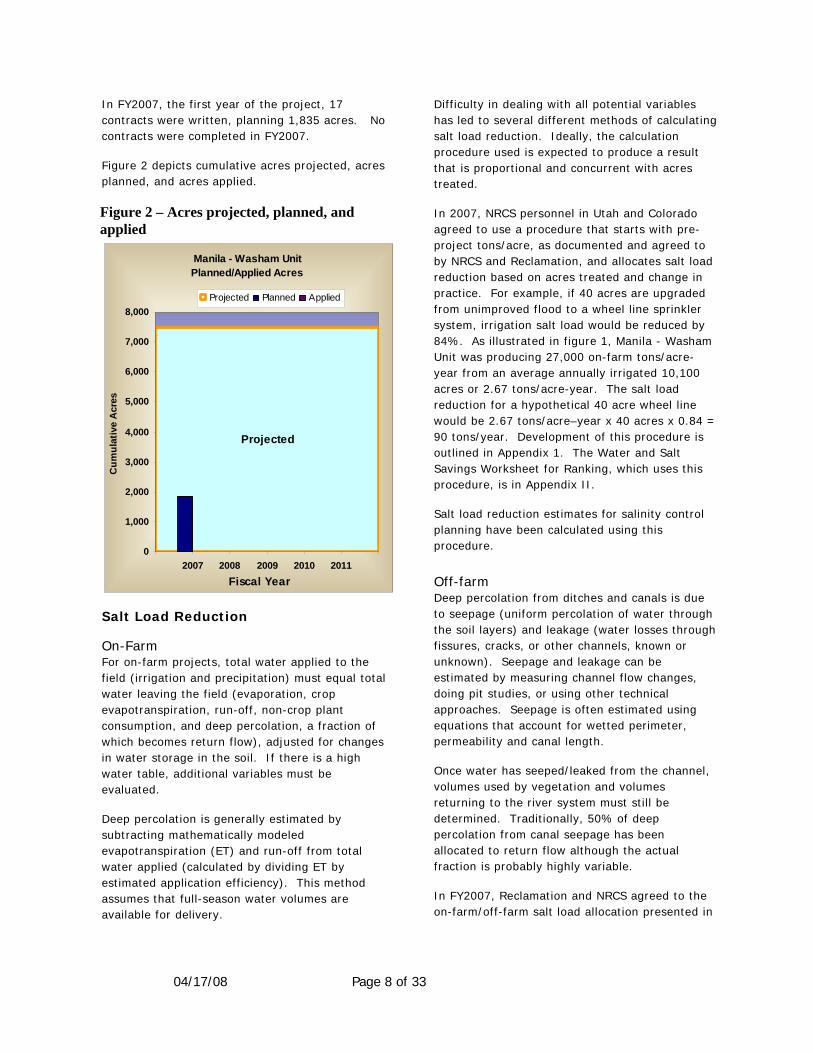
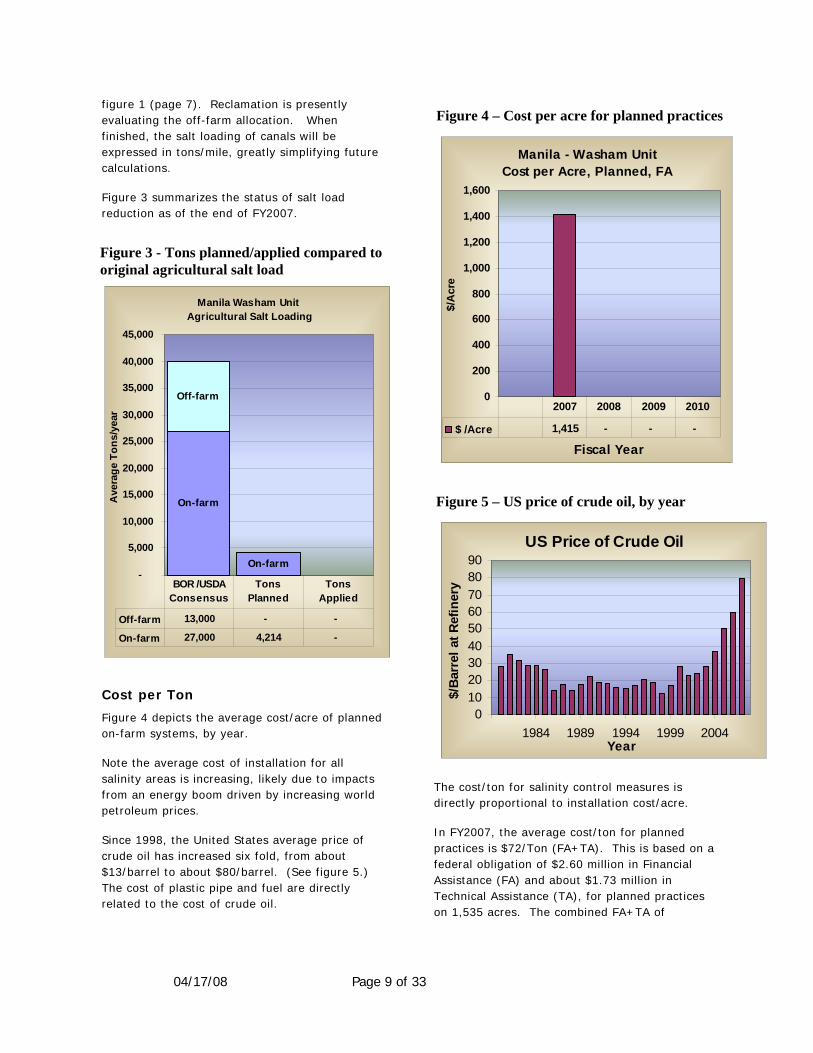
Figure 3 summarizes the status of salt load reduction as of the end of FY2007.
Cost per Ton
Figure 4 depicts the average cost/acre of planned on-farm systems, by year.
Note the average cost of installation for all salinity areas is increasing, likely due to impacts from an energy boom driven by increasing world petroleum prices.
Since 1998, the United States average price of crude oil has increased six fold, from about $13/barrel to about $80/barrel. (See figure 5.) The cost of plastic pipe and fuel are directly related to the cost of crude oil.
The cost/ton for salinity control measures is directly proportional to installation cost/acre.
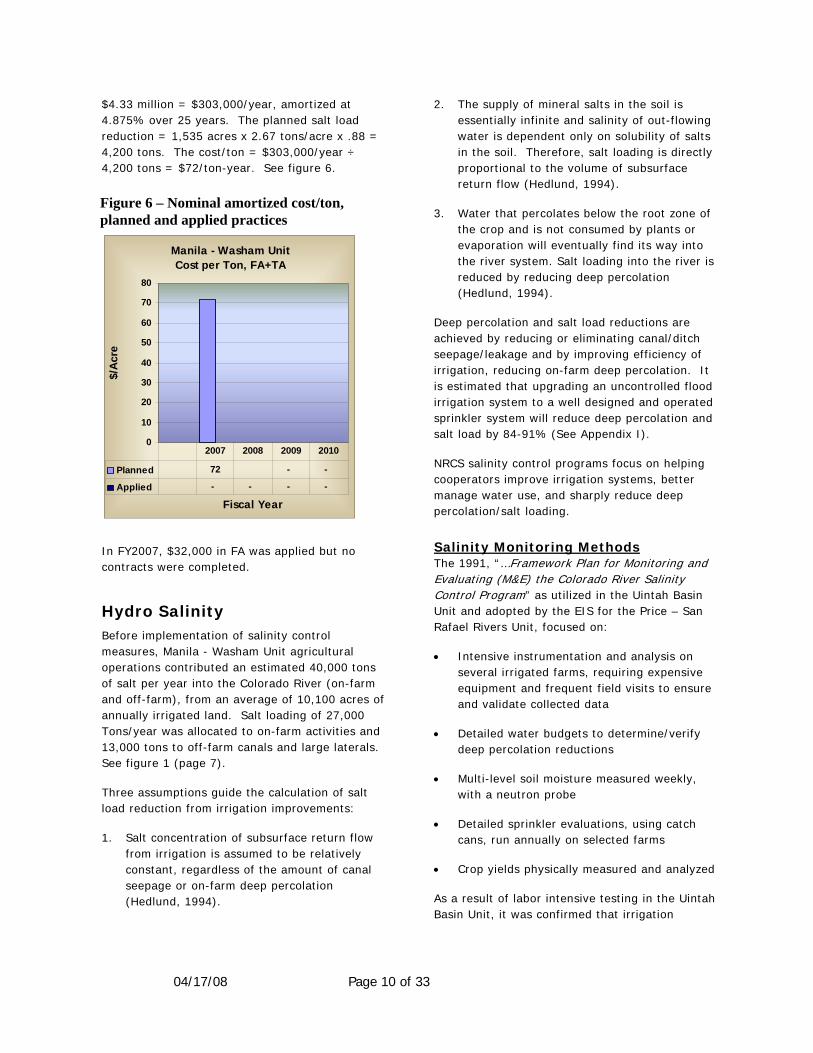
In FY2007, the average cost/ton for planned practices is $72/Ton (FA+TA). This is based on a federal obligation of $2.60 million in Financial Assistance (FA) and about $1.73 million in Technical Assistance (TA), for planned practices on 1,535 acres. The combined FA+TA of
Figure 3 - Tons planned/applied compared to original agricultural salt load
Figure 4 – Cost per acre for planned practices
Figure 5 – US price of crude oil, by year
Manila Washam Unit Agricultural Salt Loading
On-farm
On-farm
Off-farm
-
5,000
10,000
15,000
20,000
25,000
30,000
35,000
40,000
45,000
Ave
rage
Ton
s/ye
ar
Off-farm 13,000 - -
On-farm 27,000 4,214 -
BOR /USDA Consensus
Tons Planned
Tons Applied
US Price of Crude Oil
0102030405060708090
1984 1989 1994 1999 2004Year
$/B
arre
l at R
efin
ery
Manila - Washam UnitCost per Acre, Planned, FA
0
200
400
600
800
1,000
1,200
1,400
1,600
Fiscal Year$/
Acr
e
$ /Acre 1,415 - - -
2007 2008 2009 2010
04/17/08 Page 10 of 33
$4.33 million = $303,000/year, amortized at 4.875% over 25 years. The planned salt load reduction = 1,535 acres x 2.67 tons/acre x .88 = 4,200 tons. The cost/ton = $303,000/year ÷ 4,200 tons = $72/ton-year. See figure 6.
In FY2007, $32,000 in FA was applied but no contracts were completed.
Hydro Salinity Before implementation of salinity control measures, Manila - Washam Unit agricultural operations contributed an estimated 40,000 tons of salt per year into the Colorado River (on-farm and off-farm), from an average of 10,100 acres of annually irrigated land. Salt loading of 27,000 Tons/year was allocated to on-farm activities and 13,000 tons to off-farm canals and large laterals. See figure 1 (page 7).
Three assumptions guide the calculation of salt load reduction from irrigation improvements:
1. Salt concentration of subsurface return flow from irrigation is assumed to be relatively constant, regardless of the amount of canal seepage or on-farm deep percolation (Hedlund, 1994).
2. The supply of mineral salts in the soil is essentially infinite and salinity of out-flowing water is dependent only on solubility of salts in the soil. Therefore, salt loading is directly proportional to the volume of subsurface return flow (Hedlund, 1994).
3. Water that percolates below the root zone of the crop and is not consumed by plants or evaporation will eventually find its way into the river system. Salt loading into the river is reduced by reducing deep percolation (Hedlund, 1994).
Deep percolation and salt load reductions are achieved by reducing or eliminating canal/ditch seepage/leakage and by improving efficiency of irrigation, reducing on-farm deep percolation. It is estimated that upgrading an uncontrolled flood irrigation system to a well designed and operated sprinkler system will reduce deep percolation and salt load by 84-91% (See Appendix I).
NRCS salinity control programs focus on helping cooperators improve irrigation systems, better manage water use, and sharply reduce deep percolation/salt loading.
Salinity Monitoring Methods The 1991, “…Framework Plan for Monitoring and Evaluating (M&E) the Colorado River Salinity Control Program” as utilized in the Uintah Basin Unit and adopted by the EIS for the Price – San Rafael Rivers Unit, focused on:
• Intensive instrumentation and analysis on several irrigated farms, requiring expensive equipment and frequent field visits to ensure and validate collected data
• Detailed water budgets to determine/verify deep percolation reductions
• Multi-level soil moisture measured weekly, with a neutron probe
• Detailed sprinkler evaluations, using catch cans, run annually on selected farms
• Crop yields physically measured and analyzed
As a result of labor intensive testing in the Uintah Basin Unit, it was confirmed that irrigation
Figure 6 – Nominal amortized cost/ton, planned and applied practices
Manila - Washam UnitCost per Ton, FA+TA
0
10
20
30
40
50
60
70
80
Fiscal Year
$/Ac
re
Planned 72 - -
Applied - - - -
2007 2008 2009 2010
04/17/08 Page 11 of 33
systems installed and operated as originally designed, produced the desired result of improved irrigation efficiencies and sharply reduced deep percolation rates, concurrent with reduced farm labor and improved yields.
A new “Framework Plan for Monitoring and Evaluating (M&E) the Colorado River Salinity Control Program” was adopted in 2001. Having established that properly installed and operated practices yield predictable and favorable results, the 2001 Framework Plan addresses M&E by:
• Utilizing random cooperator surveys to collect and evaluate cooperator understanding and impressions concerning contracts and equipment
• Formal and informal Irrigation Water Management (IWM) training and encouragement
• Equipment spot checks and operational evaluations
• Agricultural statistics collected by government agencies
In the Manila – Washam Unit, virtually all salinity program irrigation improvements are expected to be sprinkler systems. Based on FY2007 planned projects, center pivots out number wheel lines by about two to one, on an acreage basis, presumably due to the influence of larger farms. The average contract size is 90 acres.
Cooperator questionnaires, interviews, and training sessions
No cooperator questionnaires have been done in the Manila – Washam Unit. It is anticipated that it will take two or three years for cooperators to become familiar with system operations before interviews would become practical.
Irrigation Water Management (IWM)
The goal of IWM is to assure that irrigated crops get the right amount of water at the right place at the right time, which will accomplish the goal of minimizing deep percolation and salt loading in the river. Proper IWM is achieved by careful equipment design, cooperator education, and
maintenance resulting in implementation of effective water management techniques.
In general, sprinkler systems designed by NRCS are capable of irrigating the most water-consumptive projected crop in the hottest part of the year. When growing crops with lower water needs, or at other times in the growing season, these systems are capable of over-irrigating to some extent.
Over-irrigating in early spring and late fall is mitigated by water storage aspects of the soil. Crops generally use water before irrigation begins and after irrigation ends, leaving the soil moisture profile partially depleted. Filling the soil with water requires additional irrigation, over and above crop needs, in the spring.
Preventing over-irrigation is a contractual obligation of the cooperator. To help cooperators fulfill this obligation they must be educated and coached in the proper use and maintenance of their irrigation systems.
Ideally, this is achieved by creating financial incentives for IWM, initial IWM training sessions, periodic water conferences, and developing IWM tools that simplify record keeping and help cooperators properly time irrigation cycles. Incentive IWM payments have resulted in a much greater interest in keeping records and understanding soil/water relationships.
Water management seminars and conventions are sponsored by various government, educational, and commercial groups, encouraging everyone to manage and conserve water. NRCS is a willing and eager participant in these partnership educational endeavors.
Additional, personal guidance is available to cooperators, on request, at the local NRCS field office.
Intensive and continuous IWM training is essential to successful long term salt load reduction.
To help cooperators with irrigation timing, a major part of IWM, NRCS demonstrates two simple, low-cost approaches:
04/17/08 Page 12 of 33
1. Irrigation record keeping, wherein the cooperator keeps track of water put on the field and compares the volume used to the volume required by the crop
2. Soil moisture monitoring, wherein the cooperator determines when to irrigate, based on available water content (AWC) of the soil
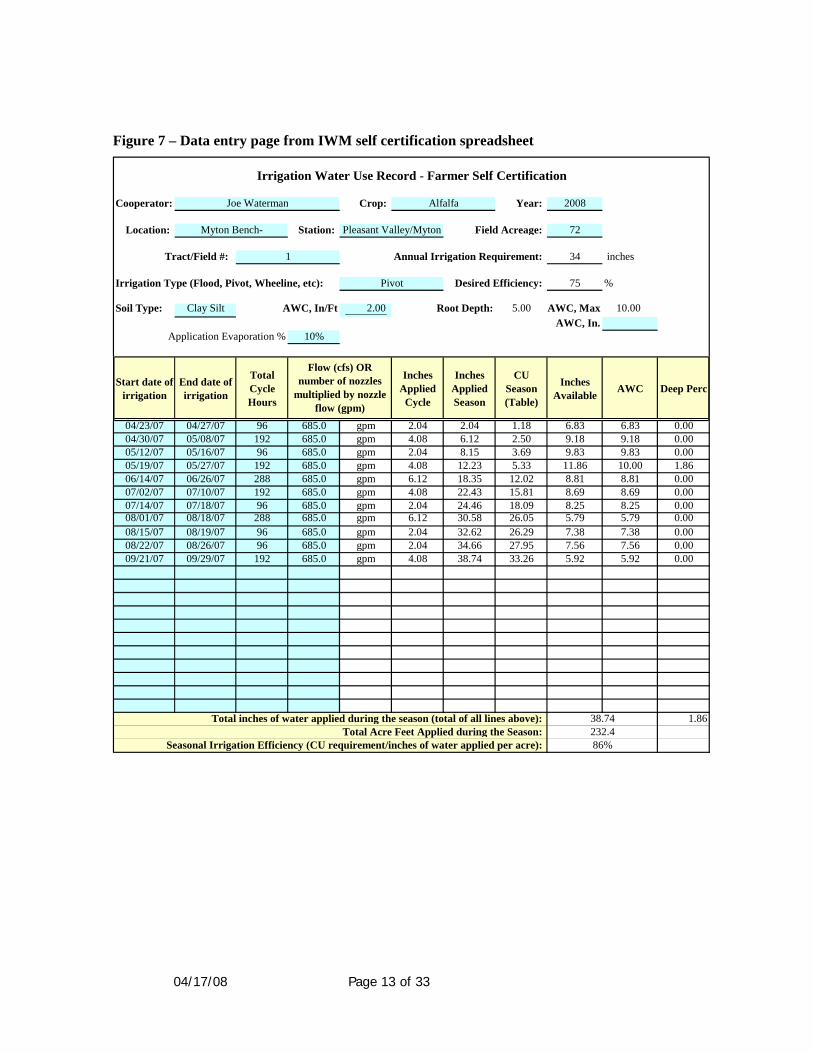
Irrigation Record Keeping To help with irrigation timing, NRCS has developed and provided the, “IWM Self Certification Spreadsheet” which allows cooperators to graphically compare actual irrigation with projected average crop water requirements and/or with modeled crop evapotranspiration. Evapotranspiration is calculated from weather data collected by NRCS and other public agencies, using crop simulation techniques developed by Utah State University. The final output of the spreadsheet is a graph comparing water applied, with water required, on a seasonal basis. See figures 7 and 8.
Figure 7 is the input form, on which the irrigator enters data into the blue shaded cells. The spreadsheet then calculates the remaining data.
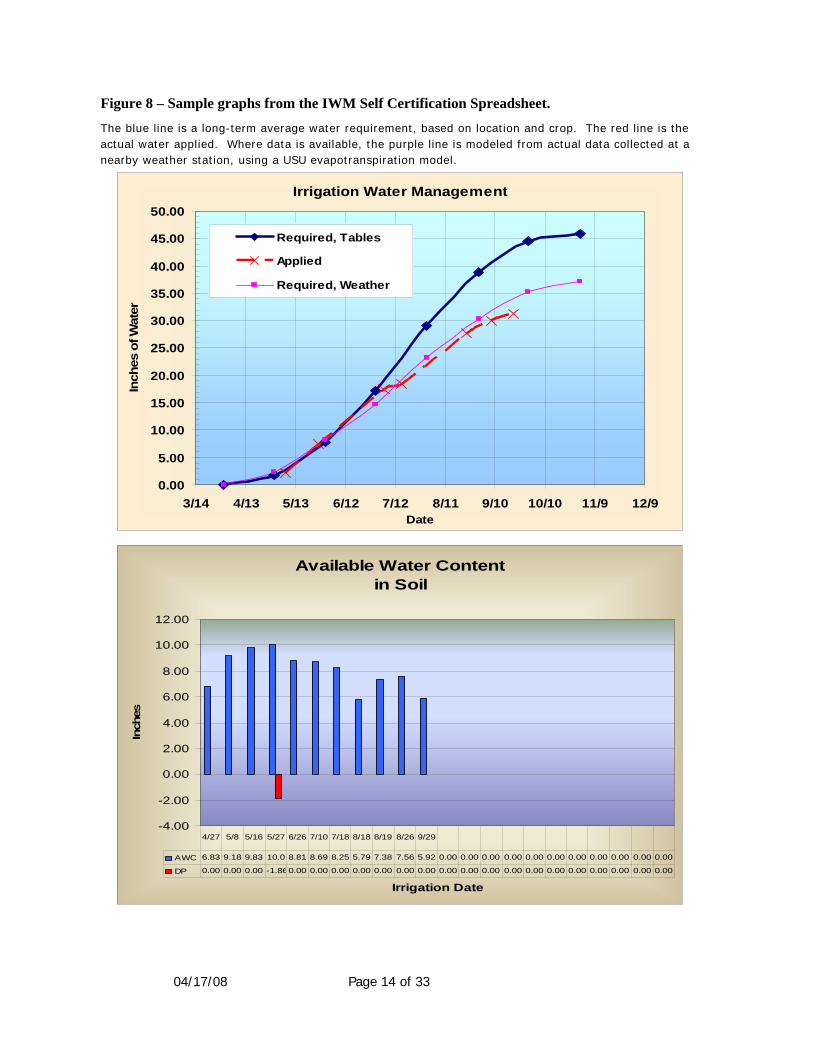
Figure 8 consists of two graphs created by the spreadsheet. In the first plot in figure 8, if the red actual application line is below and to the
right of the blue consumptive use line, the crop is under irrigated. If the red actual use line is above the blue consumptive use line, the field is over-irrigated and excessive deep percolation has occurred. (A small amount of deep percolation is designed into all irrigation systems to compensate for distribution anomalies and to leach accumulated salt from the root zone.)
In the second graph of figure 8, available water content (AWC) of the soil is plotted. If AWC reaches 100% (the soil/water profile is full), any additional irrigation water applied becomes deep percolation, expressed as red bars descending below the x axis.
In order to receive incentive payment for IWM, each irrigator must bring his irrigation records to the local field office, where data is entered into the spreadsheet and results are calculated, graphed, and discussed. The graphs are printed for the farmer’s reference. In general, cooperators respond positively to this training and work hard to irrigate more efficiently.
Since no salinity control projects have been completed in MW, no IWM Self Certification Spreadsheets have been turned in. However, there have been a few IWM conferences and training sessions in Manila and cooperators from the area have also participated in conferences in the Uintah Basin.
04/17/08 Page 13 of 33
Figure 7 – Data entry page from IWM self certification spreadsheet
Cooperator: Crop: Year: 2008
Location: Station: 72
34 inches
Irrigation Type (Flood, Pivot, Wheeline, etc): 75 %
Soil Type: Clay Silt 2.00 5.00 AWC, Max 10.005.00 AWC, In.
10%
Start date of irrigation
End date of irrigation
TotalCycleHours
InchesAppliedCycle
InchesAppliedSeason
CUSeason(Table)
Inches Available AWC Deep Perc
04/23/07 04/27/07 96 685.0 gpm 2.04 2.04 1.18 6.83 6.83 0.0004/30/07 05/08/07 192 685.0 gpm 4.08 6.12 2.50 9.18 9.18 0.0005/12/07 05/16/07 96 685.0 gpm 2.04 8.15 3.69 9.83 9.83 0.0005/19/07 05/27/07 192 685.0 gpm 4.08 12.23 5.33 11.86 10.00 1.8606/14/07 06/26/07 288 685.0 gpm 6.12 18.35 12.02 8.81 8.81 0.0007/02/07 07/10/07 192 685.0 gpm 4.08 22.43 15.81 8.69 8.69 0.0007/14/07 07/18/07 96 685.0 gpm 2.04 24.46 18.09 8.25 8.25 0.0008/01/07 08/18/07 288 685.0 gpm 6.12 30.58 26.05 5.79 5.79 0.0008/15/07 08/19/07 96 685.0 gpm 2.04 32.62 26.29 7.38 7.38 0.0008/22/07 08/26/07 96 685.0 gpm 2.04 34.66 27.95 7.56 7.56 0.0009/21/07 09/29/07 192 685.0 gpm 4.08 38.74 33.26 5.92 5.92 0.00
1.86
Irrigation Water Use Record - Farmer Self Certification
Alfalfa
Desired Efficiency: Pivot
Tract/Field #: 1
Joe Waterman
Myton Bench-
Total inches of water applied during the season (total of all lines above): Total Acre Feet Applied during the Season:
38.74232.486%
Flow (cfs) OR number of nozzles
multiplied by nozzle flow (gpm)
Pleasant Valley/Myton Field Acreage:
Seasonal Irrigation Efficiency (CU requirement/inches of water applied per acre):
Annual Irrigation Requirement:
AWC, In/Ft Root Depth:
Application Evaporation %
04/17/08 Page 14 of 33
Available Water Content in Soil
-4.00
-2.00
0.00
2.00
4.00
6.00
8.00
10.00
12.00
Irrigation Date
Inch
es
AWC 6.83 9.18 9.83 10.0 8.81 8.69 8.25 5.79 7.38 7.56 5.92 0.00 0.00 0.00 0.00 0.00 0.00 0.00 0.00 0.00 0.00 0.00
DP 0.00 0.00 0.00 -1.860.00 0.00 0.00 0.00 0.00 0.00 0.00 0.00 0.00 0.00 0.00 0.00 0.00 0.00 0.00 0.00 0.00 0.00
4/27 5/8 5/16 5/27 6/26 7/10 7/18 8/18 8/19 8/26 9/29
Figure 8 – Sample graphs from the IWM Self Certification Spreadsheet.
The blue line is a long-term average water requirement, based on location and crop. The red line is the actual water applied. Where data is available, the purple line is modeled from actual data collected at a nearby weather station, using a USU evapotranspiration model.
Irrigation Water Management
0.00
5.00
10.00
15.00
20.00
25.00
30.00
35.00
40.00
45.00
50.00
3/14 4/13 5/13 6/12 7/12 8/11 9/10 10/10 11/9 12/9Date
Inch
es o
f Wat
er
Required, Tables
Applied
Required, Weather
04/17/08 Page 15 of 33
Soil Moisture Monitoring A time-tested method for timing irrigation involves augering a hole and determining the water content of the soil to decide when to apply the next irrigation. This may well be the best method available for irrigation timing, both simple and inexpensive. However, it seems to be among the first practices abandoned when ordinary people are forced to allocate limited time resources.
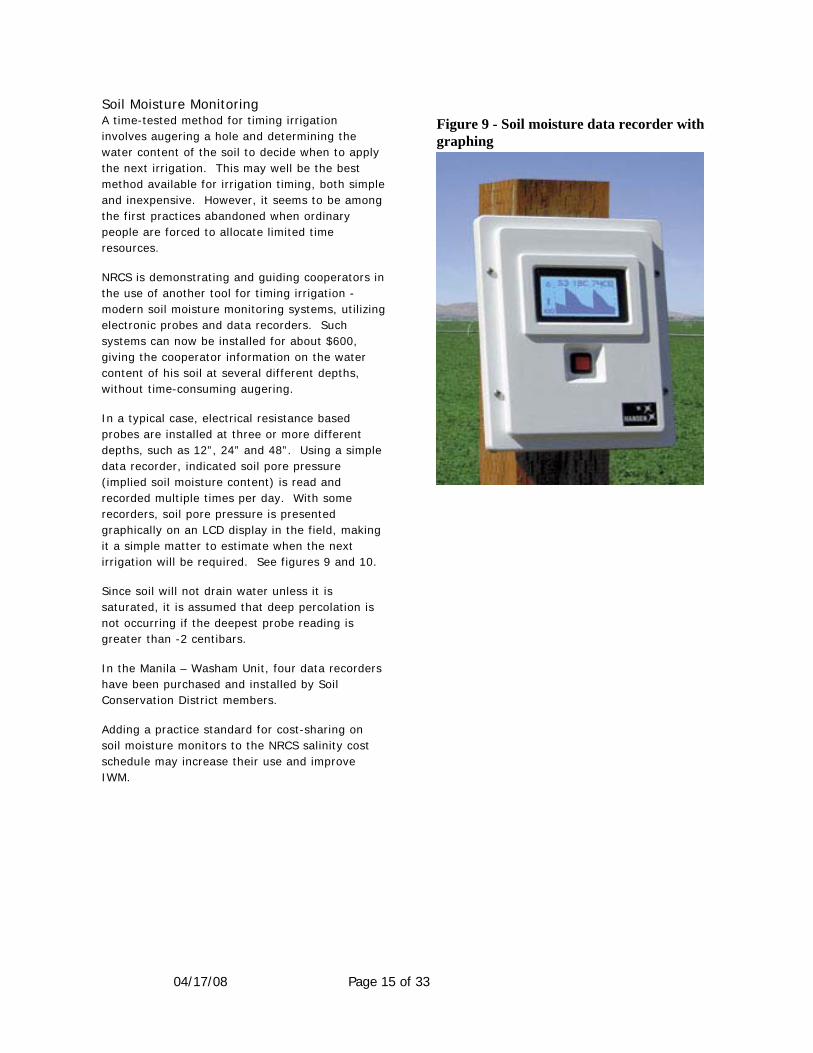
NRCS is demonstrating and guiding cooperators in the use of another tool for timing irrigation - modern soil moisture monitoring systems, utilizing electronic probes and data recorders. Such systems can now be installed for about $600, giving the cooperator information on the water content of his soil at several different depths, without time-consuming augering.
In a typical case, electrical resistance based probes are installed at three or more different depths, such as 12”, 24” and 48”. Using a simple data recorder, indicated soil pore pressure (implied soil moisture content) is read and recorded multiple times per day. With some recorders, soil pore pressure is presented graphically on an LCD display in the field, making it a simple matter to estimate when the next irrigation will be required. See figures 9 and 10.
Since soil will not drain water unless it is saturated, it is assumed that deep percolation is not occurring if the deepest probe reading is greater than -2 centibars.
In the Manila – Washam Unit, four data recorders have been purchased and installed by Soil Conservation District members.
Adding a practice standard for cost-sharing on soil moisture monitors to the NRCS salinity cost schedule may increase their use and improve IWM.
Figure 9 - Soil moisture data recorder with graphing
04/17/08 Page 16 of 33
Average Soil Pore Pressure, FY2007
Average
0.0
10.0
20.0
30.0
40.0
50.0
60.0
70.0
80.0
90.0
100.011/20/06 2/20/07 5/23/07 8/23/07
Date
- Cen
tibar
s
Average Too Wet Wilt
TOO WET
TOO DRY
Irrigation Begins
Ground Thaw s,Snow Melts, addingw ater to soil prof ile
Pivot cannot keep up w ith summer ET
Irrigation Ends
Crop begins toconsume w ater
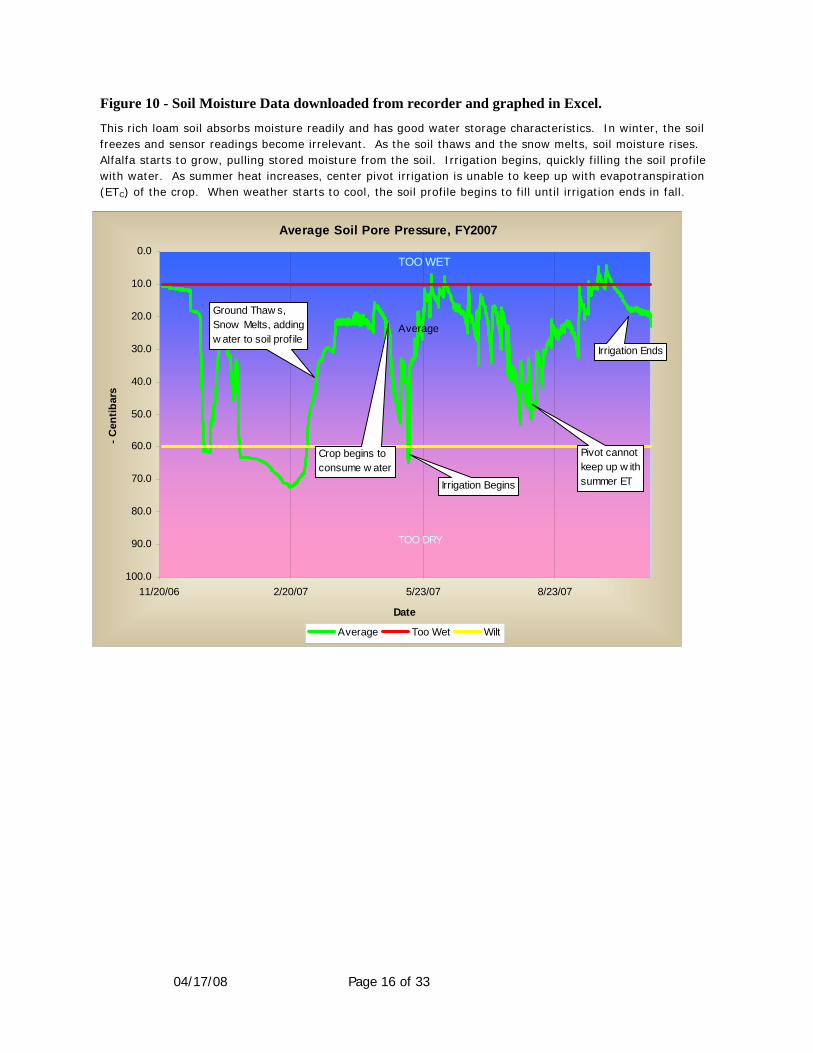
Figure 10 - Soil Moisture Data downloaded from recorder and graphed in Excel.
This rich loam soil absorbs moisture readily and has good water storage characteristics. In winter, the soil freezes and sensor readings become irrelevant. As the soil thaws and the snow melts, soil moisture rises. Alfalfa starts to grow, pulling stored moisture from the soil. Irrigation begins, quickly filling the soil profile with water. As summer heat increases, center pivot irrigation is unable to keep up with evapotranspiration (ETC) of the crop. When weather starts to cool, the soil profile begins to fill until irrigation ends in fall.
04/17/08 Page 17 of 33
Wildlife Habitat and Wetlands
Background
As of February 2007, the Manila-Washam project is the most recent addition to the Colorado River Basin Salinity Control Program (CRBSCP) Salinity Areas. Salinity irrigation and wildlife habitat development plans are now eligible to compete for funds allocated to the CRBSCP. Impacts from this project to wildlife habitat and wetlands will be monitored and evaluated and subsequently compensated. Compensation is accomplished on a voluntary basis from private landowners through applications for funding from the Environmental Quality Incentives Program (EQIP). Impacts include loss of wildlife habitat and wetlands, conversion of wetland habitats to upland areas such as agricultural fields, or other vegetation changes brought about by the more efficient use of irrigation water.
Area-wide Wildlife Habitat Monitoring
In the upper Colorado River Basins there are several Salinity Areas, each with its own unique methodology for monitoring and evaluating impacts and replacement of wildlife habitat and wetlands. The Manila-Washam Salinity Area is a relatively small project, and impacts from the project can be observed from project inception. The Monitoring and Evaluation Team (M&E) have decided to create a series of land cover maps utilizing aerial photography from the National Agricultural Image Program (NAIP). The NAIP images are one meter resolution true color or color-infrared aerial photos, projected to be re-flown biannually. With these high resolution photos, M&E has the ability to zoom in close and create a reasonably accurate land cover map which can be verified with minimal ground truthing. These images can be compared through time to monitor any land cover changes. By the use of Geographical Information System (GIS) software, estimates of gains or losses in wildlife habitat or wetlands can be quantified.
Representative photographic points will also be established, to be compared throughout the years, to assist with land cover mapping efforts, defining vegetation composition of the land cover elements and what impacts, if any, are occurring.
Managed Wetlands
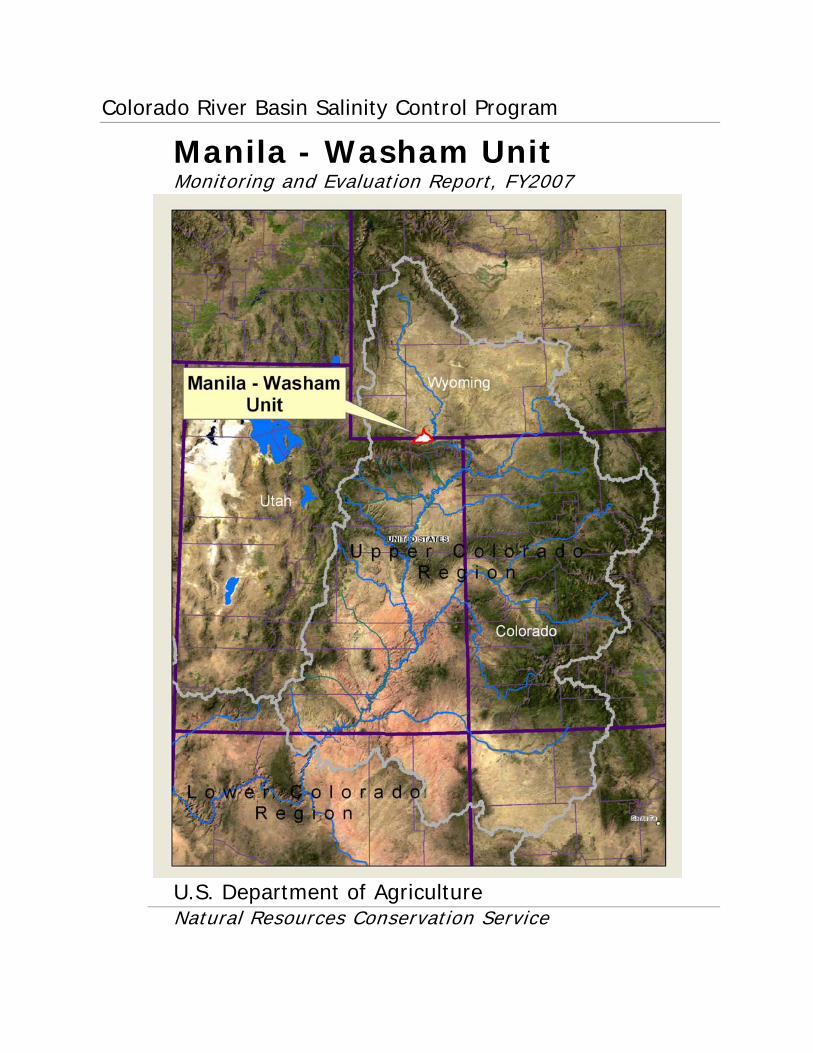
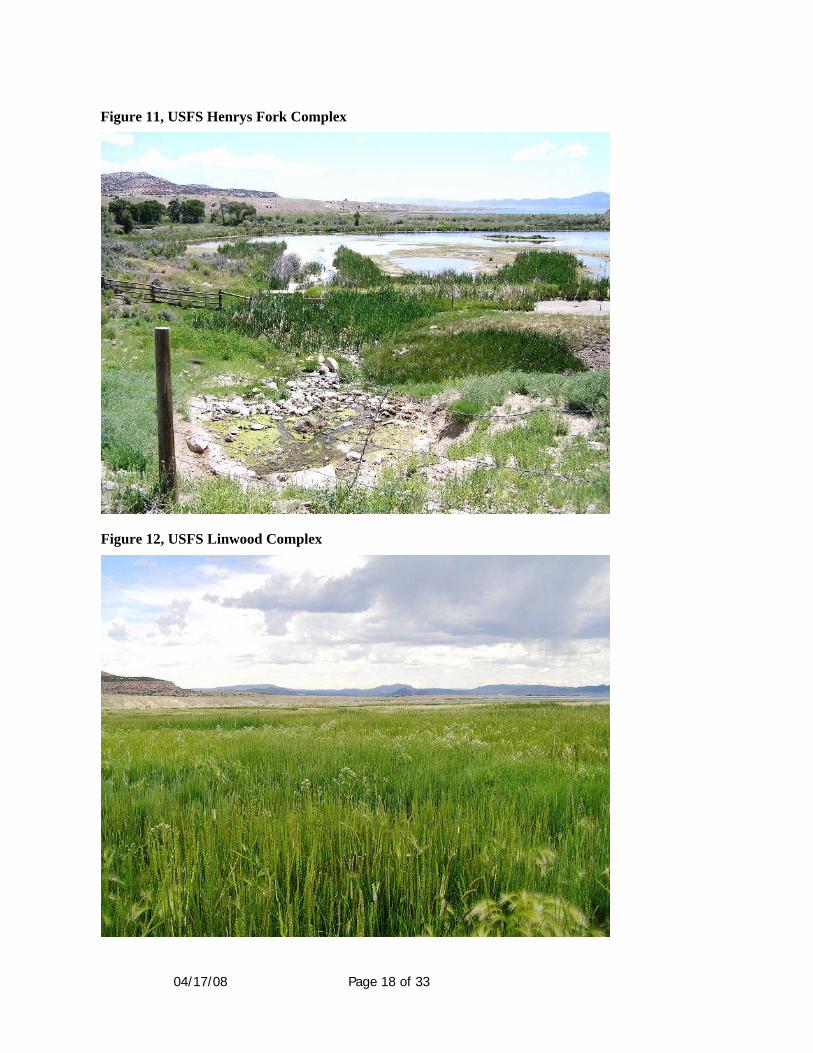
The U.S. Forest Service (USFS) has created two wetland complexes west of Flaming Gorge reservoir.
The Henry’s Fork complex (Figure 11), located north of the Utah-Wyoming border, has a secure water right which may need to be more carefully managed in the event that irrigation improvements reduce the amount of excess run-off now being collected and channeled through this USFS property.
The Linwood Pond complex (Figure 12), located south of the Utah-Wyoming border has no secure water right and could be impacted by reduced tailwater availability associated with irrigation improvements.
USFS has been encouraged to obtain more secure water rights for this wetland complex. As irrigation improvements proceed, NRCS cooperators will be encouraged to work with USFS to assure an adequate water supply for the complex.
These wetland complexes represent an important aspect of wildlife habitat found in the Manila-Washam Salinity Area. Many species of plants and animals are found in these areas and they are also used by many members of the public. These wetlands are located on federal, public land and provide access to all people wishing to enjoy their natural resources. M&E intends to work with USFS personnel and NRCS customers to help monitor the health of these systems, and provide input for solutions to the uncertain outcome of potential tailwater reduction.
Wildlife Habitat Contract Monitoring
In this first year of eligibility for salinity projects, there have been no applications for wildlife habitat improvement project funds. It is anticipated that there may be a time lag between project inception and applications for funding. NRCS will continue to advertise and outreach to promote public enthusiasm and desire to apply for wildlife habitat development projects.
04/17/08 Page 18 of 33
Figure 11, USFS Henrys Fork Complex
Figure 12, USFS Linwood Complex
04/17/08 Page 19 of 33
It has been experienced in other Salinity Areas, that as soon as the first projects are applied, the number and quality of funding applications increases.
Voluntary Habitat Replacement
NRCS continues to encourage replacement of wildlife habitat on a voluntary basis. Federal and State funding programs are in place to promote wildlife habitat replacement. This information is advertised annually in local newspapers, in Local Workgroup meetings, and Conservation District meetings throughout the Salinity Areas. The Utah NRCS Homepage also has information and deadlines relating to Farm Bill programs.
Economics
Cooperator Economics
It is logical to expect that upgrading from flood to sprinkler irrigation improves profitability by increasing production while decreasing costs for water, fertilizer, labor, and field maintenance. Irrigation system maintenance may increase somewhat, but should be less variable on an annual basis.
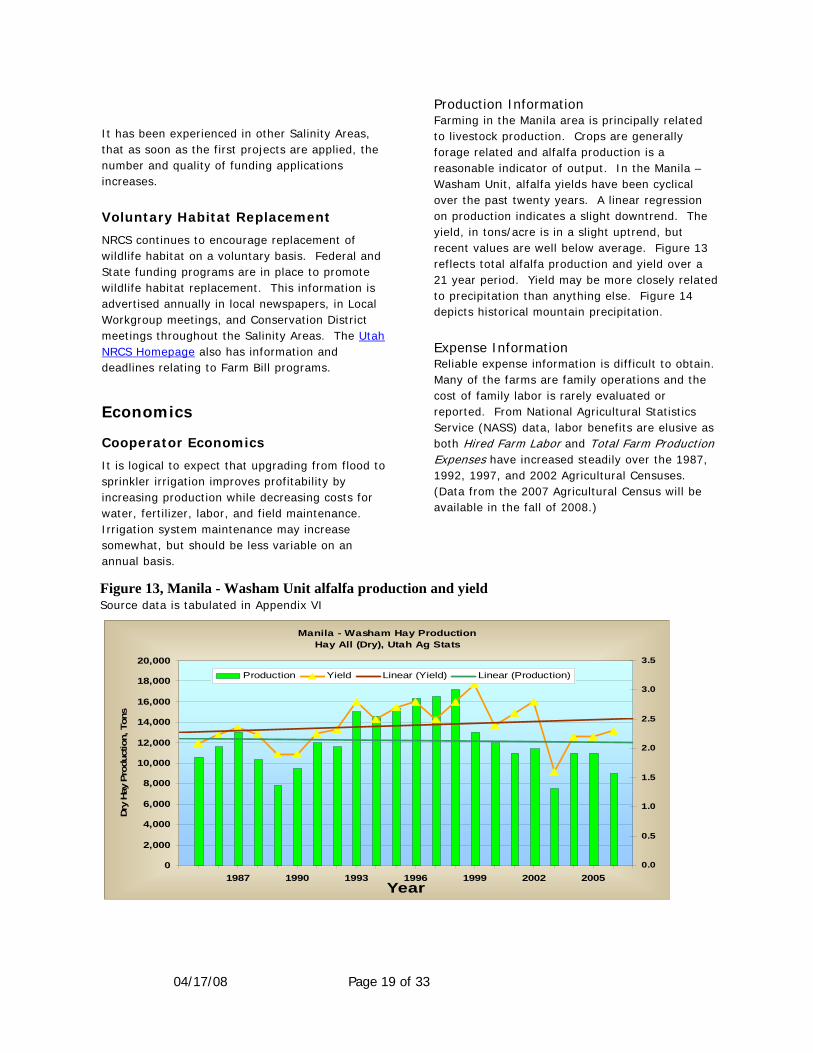
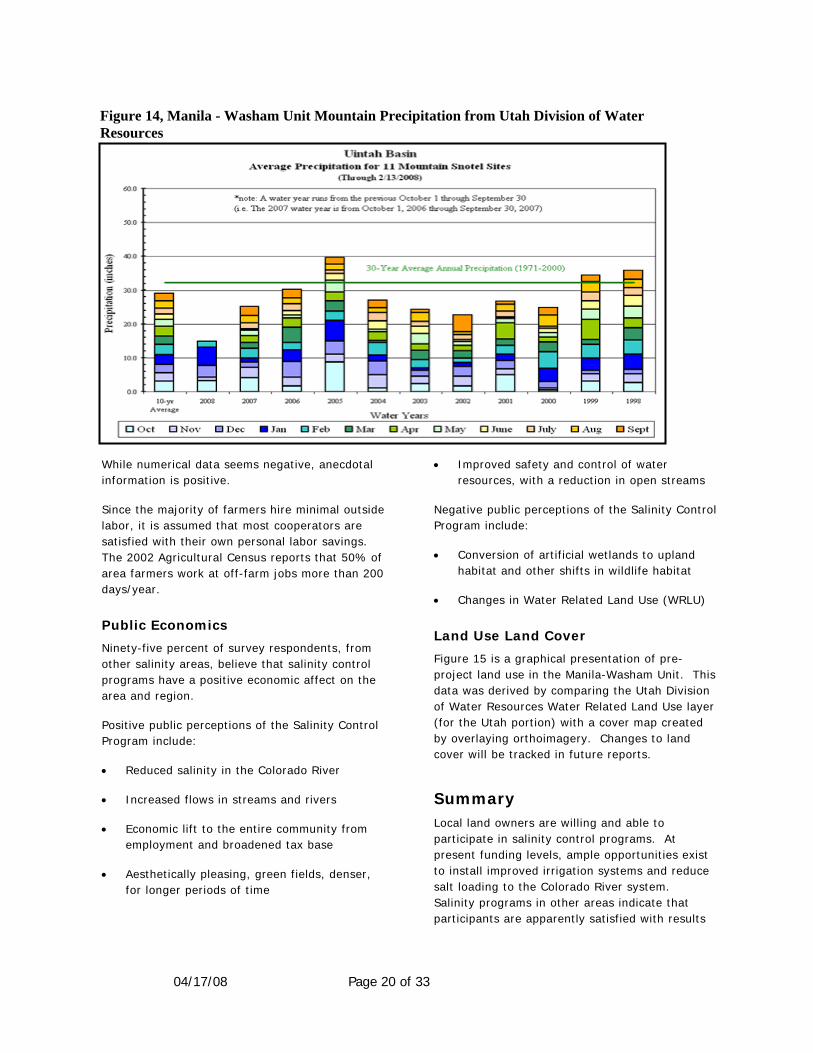
Production Information Farming in the Manila area is principally related to livestock production. Crops are generally forage related and alfalfa production is a reasonable indicator of output. In the Manila – Washam Unit, alfalfa yields have been cyclical over the past twenty years. A linear regression on production indicates a slight downtrend. The yield, in tons/acre is in a slight uptrend, but recent values are well below average. Figure 13 reflects total alfalfa production and yield over a 21 year period. Yield may be more closely related to precipitation than anything else. Figure 14 depicts historical mountain precipitation.
Expense Information Reliable expense information is difficult to obtain. Many of the farms are family operations and the cost of family labor is rarely evaluated or reported. From National Agricultural Statistics Service (NASS) data, labor benefits are elusive as both Hired Farm Labor and Total Farm Production Expenses have increased steadily over the 1987, 1992, 1997, and 2002 Agricultural Censuses. (Data from the 2007 Agricultural Census will be available in the fall of 2008.)
Figure 13, Manila - Washam Unit alfalfa production and yield Source data is tabulated in Appendix VI
Manila - Washam Hay ProductionHay All (Dry), Utah Ag Stats
0
2,000
4,000
6,000
8,000
10,000
12,000
14,000
16,000
18,000
20,000
1987 1990 1993 1996 1999 2002 2005Year
Dry
Hay
Pro
duct
ion,
Ton
s
0.0
0.5
1.0
1.5
2.0
2.5
3.0
3.5
Production Yield Linear (Yield) Linear (Production)
04/17/08 Page 20 of 33
While numerical data seems negative, anecdotal information is positive.
Since the majority of farmers hire minimal outside labor, it is assumed that most cooperators are satisfied with their own personal labor savings. The 2002 Agricultural Census reports that 50% of area farmers work at off-farm jobs more than 200 days/year.
Public Economics
Ninety-five percent of survey respondents, from other salinity areas, believe that salinity control programs have a positive economic affect on the area and region.
Positive public perceptions of the Salinity Control Program include:
• Reduced salinity in the Colorado River
• Increased flows in streams and rivers
• Economic lift to the entire community from employment and broadened tax base
• Aesthetically pleasing, green fields, denser, for longer periods of time
• Improved safety and control of water resources, with a reduction in open streams
Negative public perceptions of the Salinity Control Program include:
• Conversion of artificial wetlands to upland habitat and other shifts in wildlife habitat
• Changes in Water Related Land Use (WRLU)
Land Use Land Cover
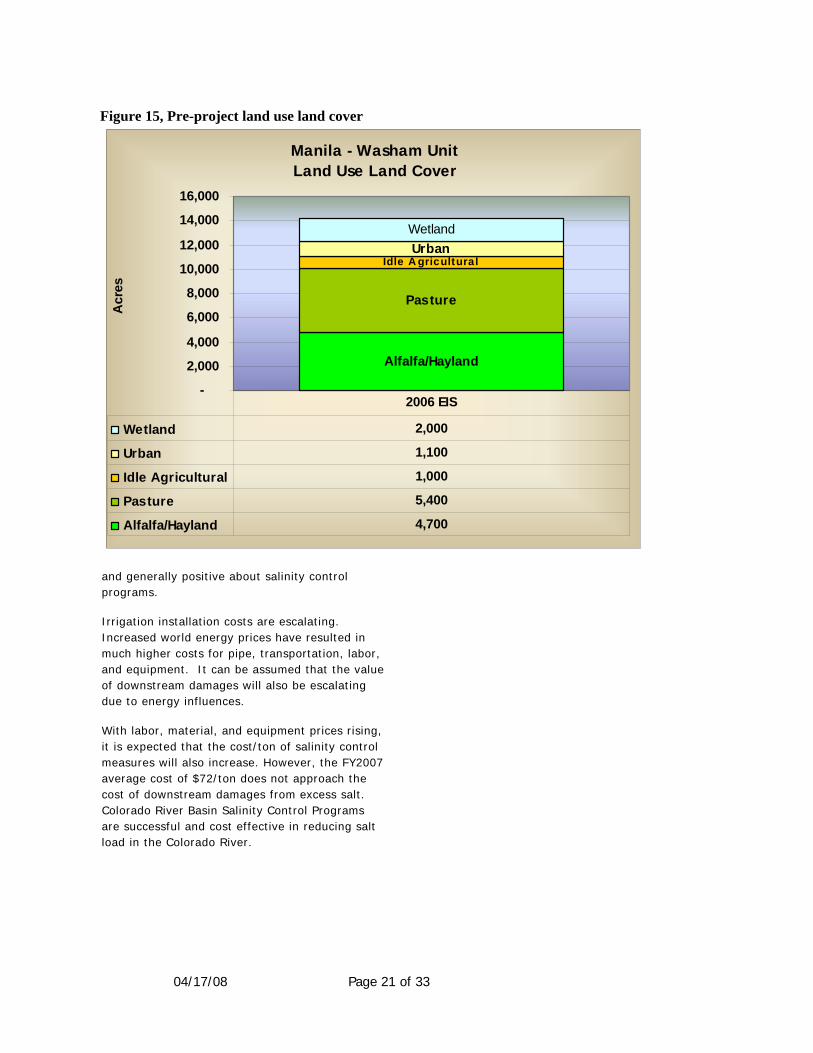
Figure 15 is a graphical presentation of pre-project land use in the Manila-Washam Unit. This data was derived by comparing the Utah Division of Water Resources Water Related Land Use layer (for the Utah portion) with a cover map created by overlaying orthoimagery. Changes to land cover will be tracked in future reports.
Summary Local land owners are willing and able to participate in salinity control programs. At present funding levels, ample opportunities exist to install improved irrigation systems and reduce salt loading to the Colorado River system. Salinity programs in other areas indicate that participants are apparently satisfied with results
Figure 14, Manila - Washam Unit Mountain Precipitation from Utah Division of Water Resources
04/17/08 Page 21 of 33
and generally positive about salinity control programs.
Irrigation installation costs are escalating. Increased world energy prices have resulted in much higher costs for pipe, transportation, labor, and equipment. It can be assumed that the value of downstream damages will also be escalating due to energy influences.
With labor, material, and equipment prices rising, it is expected that the cost/ton of salinity control measures will also increase. However, the FY2007 average cost of $72/ton does not approach the cost of downstream damages from excess salt. Colorado River Basin Salinity Control Programs are successful and cost effective in reducing salt load in the Colorado River.
Figure 15, Pre-project land use land cover
Manila - Washam UnitLand Use Land Cover
Alfalfa/Hayland
Pasture
UrbanWetland
Idle A gricultural
-
2,000
4,000
6,000
8,000
10,000
12,000
14,000
16,000
Acr
es
Wetland 2,000
Urban 1,100
Idle Agricultural 1,000
Pasture 5,400
Alfalfa/Hayland 4,700
2006 EIS

04/17/08 Page 22 of 33
APPENDICES
04/17/08 Page 23 of 33
CALCULATING SALT LOAD REDUCTION MODIFICATION OF PROCEDURE
JULY 30, 2007
Prepared by Natural Resources Conservation Service
Ed Whicker, Civil Engineer, Roosevelt, Utah, Email: [email protected]
Frank Riggle, Assistant State Conservationist for Water Resources, Lakewood, CO, Email: [email protected]
Travis James, Salinity Coordinator, Salt Lake City, Utah, Email: [email protected]
The U.S. Department of Agriculture (USDA) prohibits discrimination in all its programs and activities on the basis of race, color, national origin, sex, religion, age, disability, political beliefs, sexual orientation, or marital or family status. (Not all prohibited bases apply to all programs.) Persons with disabilities who require alternative means for communication of program information (Braille, large print, audiotape, etc.) should contact USDA’s TARGET Center at (202) 720-2600 (voice and TDD). To file a complaint of discrimination, write USDA, Director, Office of Civil Rights, Room 326-W Whitten Building, 1400 Independence Avenue SW, Washington DC 20250-9410, or call (202) 720-5964 (voice and TDD). USDA is an equal opportunity provider and employer.
C O L O R A D O R I V E R B A S I NS A L I N I T Y C O N T R O L P R O G R A M
Appendix I – Revised salt load reduction calculation
04/17/08 Page 24 of 33
Executive Summary
The Salinity Worksheet for Ranking has been modified to simplify use, assure proportionality with the EIS/EA and to make calculations uniform in Utah and Colorado by making the following changes:
• Inputs for net irrigation requirement and seasonal irrigation factor have been eliminated.
• Minimum initial efficiency has been increased to 32%.
• Salt Load Factors have been developed that express a percentage of original salt load for a given irrigation efficiency.
• The original salt load has been determined for each salinity area from the EIS/EA or reasonable proxy data where EIS data is inconclusive.
• The salt load reduction calculation is greatly simplified. The salt load reduction is calculated by multiplying the original salt load by a factor related to the initial and final irrigation practice.
• As an example, a 20 acre flooded field has an irrigation efficiency of 32% and a salt load factor of 100%. The salinity area has an original salt load of 2.0 Tons/acre/year. It is proposed to install wheel lines with an efficiency of 65% and a salt load factor of 16%. The change in salt load is (100%-16%) x (2.0 tons/acre/year) x (20 acres) = 34 tons/year.
• Since the difference in salt load factor is always less than 100%, the cumulative tons/acre/year due to on-farm irrigation will never be exceeded, relative to the EIS/EA.
• The original salt load, SL0 is unique to each salinity area. All salinity areas in Colorado and Utah will use the same salt load factors, SLFe. The derived cost/ton will have the same computational basis for all salinity areas.
04/17/08 Page 25 of 33
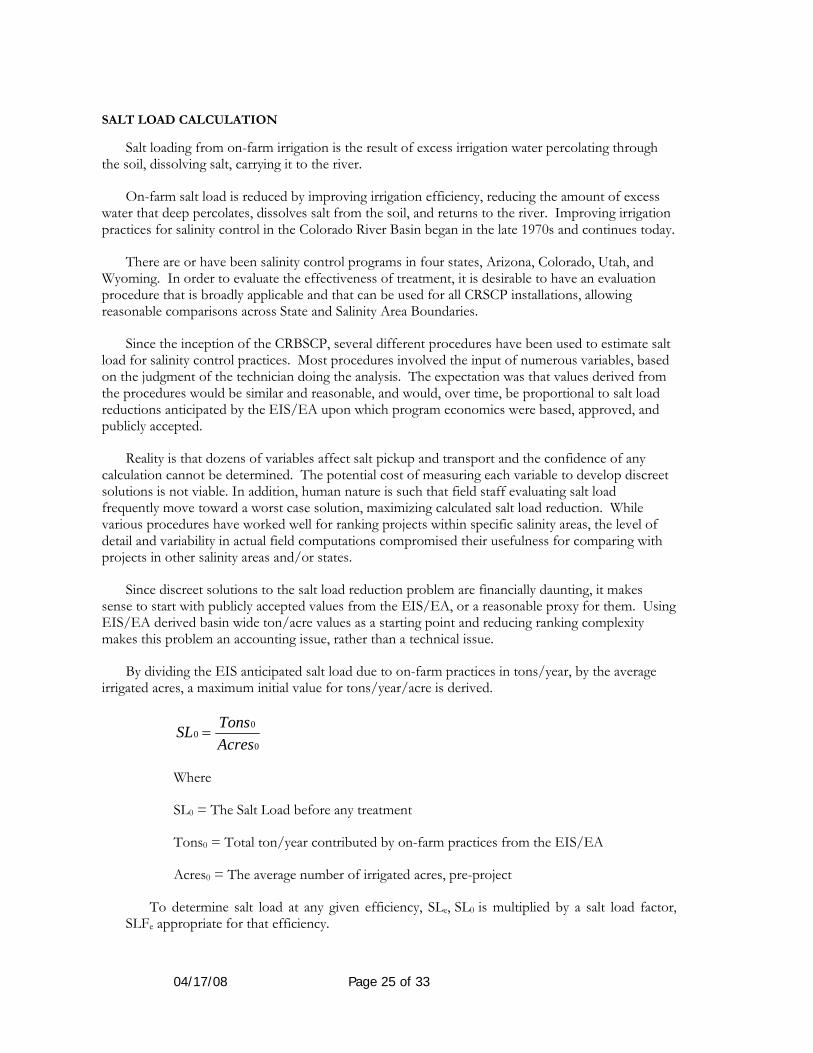
SALT LOAD CALCULATION
Salt loading from on-farm irrigation is the result of excess irrigation water percolating through the soil, dissolving salt, carrying it to the river.
On-farm salt load is reduced by improving irrigation efficiency, reducing the amount of excess water that deep percolates, dissolves salt from the soil, and returns to the river. Improving irrigation practices for salinity control in the Colorado River Basin began in the late 1970s and continues today.
There are or have been salinity control programs in four states, Arizona, Colorado, Utah, and Wyoming. In order to evaluate the effectiveness of treatment, it is desirable to have an evaluation procedure that is broadly applicable and that can be used for all CRSCP installations, allowing reasonable comparisons across State and Salinity Area Boundaries.
Since the inception of the CRBSCP, several different procedures have been used to estimate salt load for salinity control practices. Most procedures involved the input of numerous variables, based on the judgment of the technician doing the analysis. The expectation was that values derived from the procedures would be similar and reasonable, and would, over time, be proportional to salt load reductions anticipated by the EIS/EA upon which program economics were based, approved, and publicly accepted.
Reality is that dozens of variables affect salt pickup and transport and the confidence of any calculation cannot be determined. The potential cost of measuring each variable to develop discreet solutions is not viable. In addition, human nature is such that field staff evaluating salt load frequently move toward a worst case solution, maximizing calculated salt load reduction. While various procedures have worked well for ranking projects within specific salinity areas, the level of detail and variability in actual field computations compromised their usefulness for comparing with projects in other salinity areas and/or states.
Since discreet solutions to the salt load reduction problem are financially daunting, it makes sense to start with publicly accepted values from the EIS/EA, or a reasonable proxy for them. Using EIS/EA derived basin wide ton/acre values as a starting point and reducing ranking complexity makes this problem an accounting issue, rather than a technical issue.
By dividing the EIS anticipated salt load due to on-farm practices in tons/year, by the average irrigated acres, a maximum initial value for tons/year/acre is derived.
0
00
AcresTonsSL =
Where
SL0 = The Salt Load before any treatment
Tons0 = Total ton/year contributed by on-farm practices from the EIS/EA
Acres0 = The average number of irrigated acres, pre-project
To determine salt load at any given efficiency, SLe, SL0 is multiplied by a salt load factor,SLFe appropriate for that efficiency.
04/17/08 Page 26 of 33
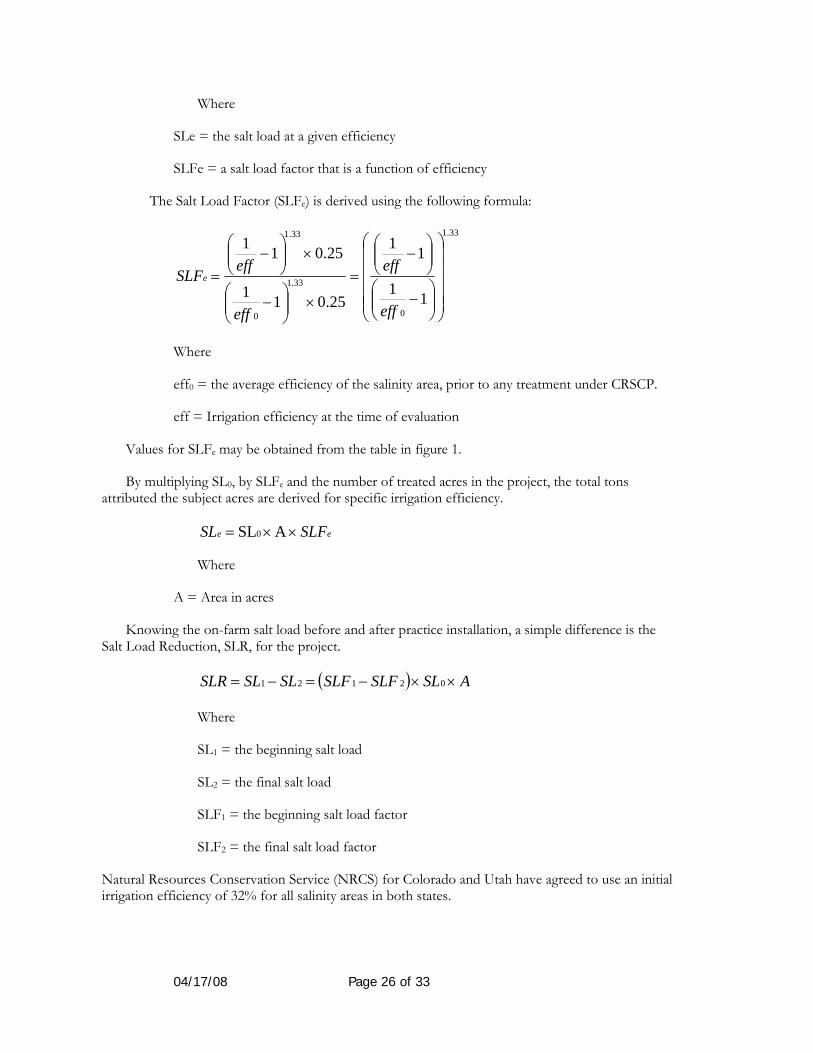
Where
SLe = the salt load at a given efficiency
SLFe = a salt load factor that is a function of efficiency
The Salt Load Factor (SLFe) is derived using the following formula:
33.1
0
33.1
0
33.1
11
11
25.011
25.011
⎟⎟⎟⎟⎟
⎠
⎞
⎜⎜⎜⎜⎜
⎝
⎛
⎟⎟⎠
⎞⎜⎜⎝
⎛−
⎟⎟⎠
⎞⎜⎜⎝
⎛−
=
×⎟⎟⎠
⎞⎜⎜⎝
⎛−
×⎟⎟⎠
⎞⎜⎜⎝
⎛−
=
eff
eff
eff
effSLFe
Where
eff0 = the average efficiency of the salinity area, prior to any treatment under CRSCP.
eff = Irrigation efficiency at the time of evaluation
Values for SLFe may be obtained from the table in figure 1.
By multiplying SL0, by SLFe and the number of treated acres in the project, the total tons attributed the subject acres are derived for specific irrigation efficiency.
ee SLFSL ××= ASL0
Where
A = Area in acres
Knowing the on-farm salt load before and after practice installation, a simple difference is the Salt Load Reduction, SLR, for the project.
( ) ASLSLFSLFSLSLSLR ××−=−= 02121
Where
SL1 = the beginning salt load
SL2 = the final salt load
SLF1 = the beginning salt load factor
SLF2 = the final salt load factor
Natural Resources Conservation Service (NRCS) for Colorado and Utah have agreed to use an initial irrigation efficiency of 32% for all salinity areas in both states.
04/17/08 Page 27 of 33
Efficiency SLFe
SLR due to Upgrade from
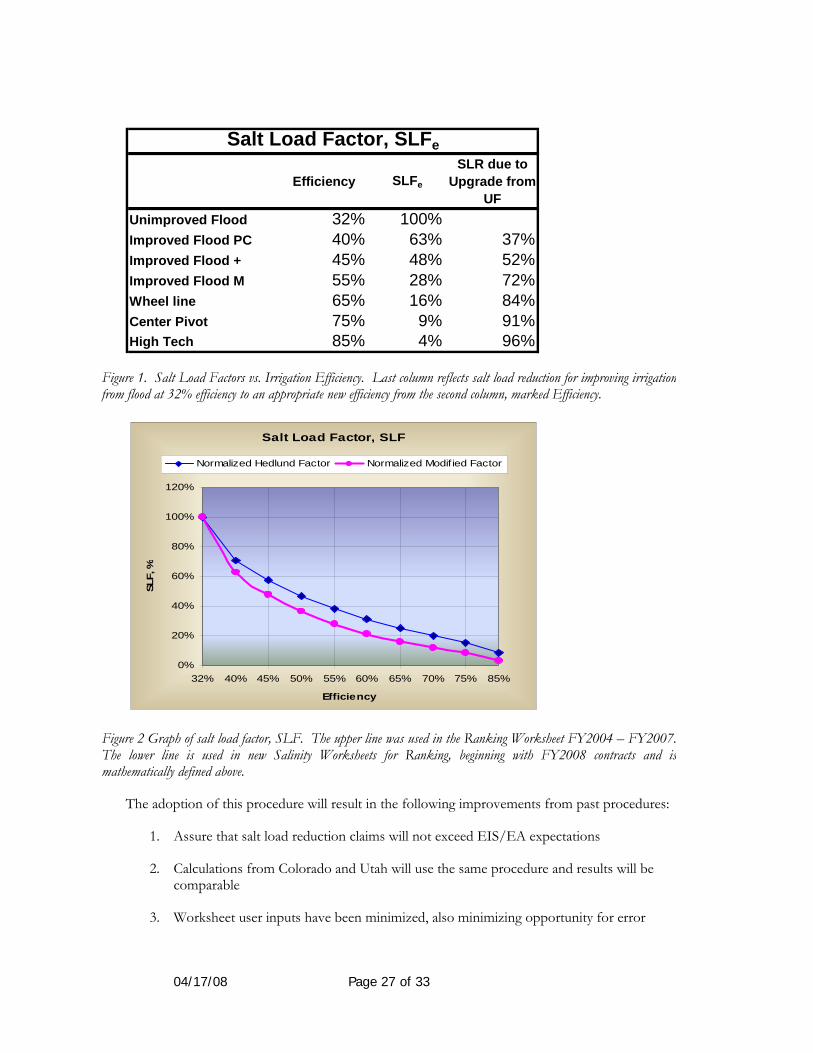
UFUnimproved Flood 32% 100%Improved Flood PC 40% 63% 37%Improved Flood + 45% 48% 52%Improved Flood M 55% 28% 72%Wheel line 65% 16% 84%Center Pivot 75% 9% 91%High Tech 85% 4% 96%
Salt Load Factor, SLFe
Figure 1. Salt Load Factors vs. Irrigation Efficiency. Last column reflects salt load reduction for improving irrigationfrom flood at 32% efficiency to an appropriate new efficiency from the second column, marked Efficiency.
Salt Load Factor, SLF
0%
20%
40%
60%
80%
100%
120%
32% 40% 45% 50% 55% 60% 65% 70% 75% 85%
Efficiency
SLF,
%
Normalized Hedlund Factor Normalized Modif ied Factor
Figure 2 Graph of salt load factor, SLF. The upper line was used in the Ranking Worksheet FY2004 – FY2007.The lower line is used in new Salinity Worksheets for Ranking, beginning with FY2008 contracts and ismathematically defined above.
The adoption of this procedure will result in the following improvements from past procedures:
1. Assure that salt load reduction claims will not exceed EIS/EA expectations
2. Calculations from Colorado and Utah will use the same procedure and results will be comparable
3. Worksheet user inputs have been minimized, also minimizing opportunity for error
04/17/08 Page 28 of 33
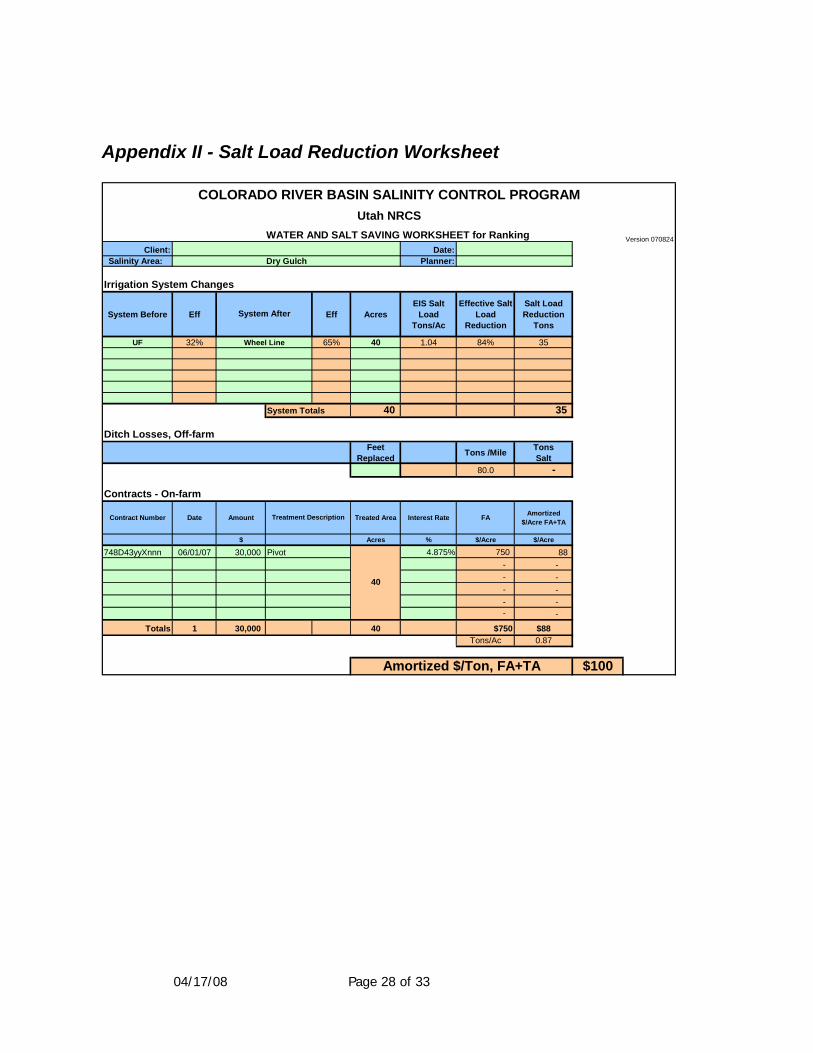
Client: Date: Salinity Area: Planner:
Irrigation System Changes
System Before Eff Eff AcresEIS Salt
LoadTons/Ac
Effective Salt Load
Reduction
Salt Load Reduction
Tons
UF 32% 65% 40 1.04 84% 35
System Totals 40 35
Ditch Losses, Off-farmFeet
Replaced Tons /Mile TonsSalt
80.0 -
Contracts - On-farm
Contract Number Date Amount Treated Area Interest Rate FA Amortized $/Acre FA+TA
$ Acres % $/Acre $/Acre
748D43yyXnnn 06/01/07 30,000 4.875% 750 88 - - - - - - - - - -
Totals 1 30,000 40 $750 $88Tons/Ac 0.87
$100
40
Amortized $/Ton, FA+TA
Pivot
Treatment Description
COLORADO RIVER BASIN SALINITY CONTROL PROGRAM
WATER AND SALT SAVING WORKSHEET for Ranking
Utah NRCS
Wheel Line
Version 070824
Dry Gulch
System After
Appendix II - Salt Load Reduction Worksheet
04/17/08 Page 29 of 33
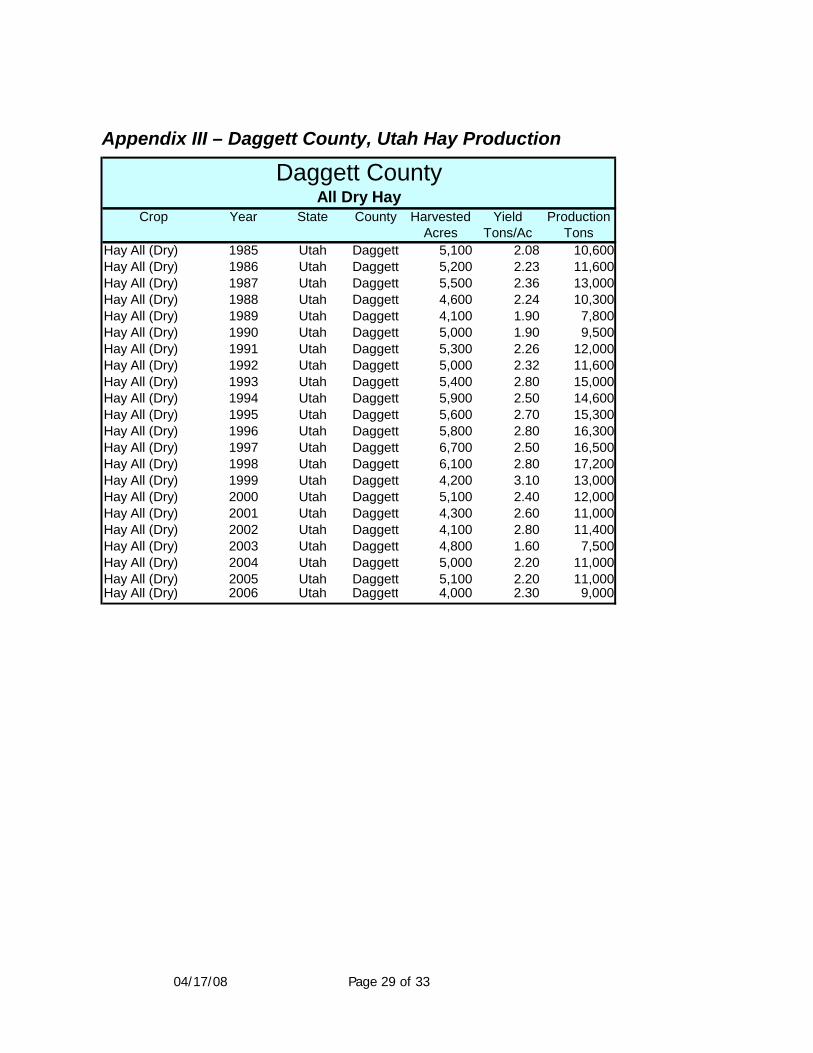
Appendix III – Daggett County, Utah Hay Production
Crop Year State County Harvested Yield ProductionAcres Tons/Ac Tons
Hay All (Dry) 1985 Utah Daggett 5,100 2.08 10,600 Hay All (Dry) 1986 Utah Daggett 5,200 2.23 11,600 Hay All (Dry) 1987 Utah Daggett 5,500 2.36 13,000 Hay All (Dry) 1988 Utah Daggett 4,600 2.24 10,300 Hay All (Dry) 1989 Utah Daggett 4,100 1.90 7,800 Hay All (Dry) 1990 Utah Daggett 5,000 1.90 9,500 Hay All (Dry) 1991 Utah Daggett 5,300 2.26 12,000 Hay All (Dry) 1992 Utah Daggett 5,000 2.32 11,600 Hay All (Dry) 1993 Utah Daggett 5,400 2.80 15,000 Hay All (Dry) 1994 Utah Daggett 5,900 2.50 14,600 Hay All (Dry) 1995 Utah Daggett 5,600 2.70 15,300 Hay All (Dry) 1996 Utah Daggett 5,800 2.80 16,300 Hay All (Dry) 1997 Utah Daggett 6,700 2.50 16,500 Hay All (Dry) 1998 Utah Daggett 6,100 2.80 17,200 Hay All (Dry) 1999 Utah Daggett 4,200 3.10 13,000 Hay All (Dry) 2000 Utah Daggett 5,100 2.40 12,000 Hay All (Dry) 2001 Utah Daggett 4,300 2.60 11,000 Hay All (Dry) 2002 Utah Daggett 4,100 2.80 11,400 Hay All (Dry) 2003 Utah Daggett 4,800 1.60 7,500 Hay All (Dry) 2004 Utah Daggett 5,000 2.20 11,000 Hay All (Dry) 2005 Utah Daggett 5,100 2.20 11,000 Hay All (Dry) 2006 Utah Daggett 4,000 2.30 9,000
Daggett CountyAll Dry Hay
04/17/08 Page 30 of 33
Glossary and Acronyms
Average salt pickup – The increase in the amount of salt carried by a stream as it flows as a result of inflows containing increase salt from dissolution of the soil. Usually expressed as tons/acre-foot.
Annual average salt load – The average estimated annual salt load carried by a stream, based on a period of record of several years. Usually expressed as tons/year.
Application efficiency – The portion of the irrigation water delivered to the field that is consumed by the crop, expressed as a percentage of the total delivery volume.
Applied Practices – Functioning practices for which Federal cost share dollars have been expended.
BSPP – Basin States Parallel Program
Bureau of Reclamation (Reclamation) – A branch of the U.S. Department of Interior charged with water interests in the United States. Reclamation is the lead agency for salinity control in the Colorado River.
Catch can testing – a procedure whereby dozens of containers are spread out under a sprinkler system in an array, to determine how much water is being applied to different spots of ground under the sprinkler to evaluate uniformity.
cfs – Cubic feet per second or second-feet.
Cover Map – a map categorizing land use based on surface cover, e.g. urban, crop type, wetlands, etc.
Crop Consumptive Use (CU) – The amount of water required by the crop for optimal production. It is dependant on many factors including altitude, temperature, wind, humidity, and solar radiation.
CRSCP – Colorado River Salinity Control Program
Daubenmire cover class frame – An instrument used to quantify vegetation cover and species frequency occurrences within a sampling transect or plot.
Deep Percolation – The amount of irrigation water that percolates below the root zone of the crop, usually expressed in acre-feet.
Dissolved salt or Total Dissolved Solids (TDS) – The amount of cations and anions in a sample of water, usually expressed in milligrams/liter, but often expressed in Tons/Acre-foot for salinity control programs.
Distribution Uniformity (DU) – A measure of how evenly the irrigation water is applied to the field. If DU is poor, more water is needed to assure that the entire crop has an adequate supply.
EQIP – Environmental Quality Improvement Program
Evapotranspiration (ET) - The amount of water used by the crop. ET is generally synonymous with CU and is frequently mathematically modeled from weather station data.
Financial Assistance (FA) – The Federal cost share of conservation practices. FA is normally 60% of total cost of conservation practices.
04/17/08 Page 31 of 33
Gated Pipe – Water delivery pipe with individual, evenly spaced gates to spread water evenly across the top of a field.
Hand line – An irrigation system composed of separate joints of aluminum pipe, each with one sprinkler, designed to irrigate for a period of time and be moved to the next parallel strip of land.
Improved Flood – Increasing the efficiency of flood irrigation systems with control and measurement structures, corrugations, land-leveling, gated pipe, etc.
Irrigation Water Management (IWM) – Using practices and procedures to maximize water use efficiency by applying the right amount of water at the right place at the right time.
Leakage – Water loss from ditches and canals through fissures, cracks or other channels through the soil, either known or unknown.
National Agricultural Statistics Service (NASS) - A branch of the U.S. Department of Agriculture (USDA)
Natural Resource Conservation Service (NRCS) A branch of the U.S. Department of Agriculture (USDA) charged with providing technical assistance to agricultural interests and programs.
Periodic Move – A sprinkler system designed to irrigate in one position for a set amount of time, then be periodically moved to a new position by hand or on wheels repeatedly until the field is covered.
Pivot or Center Pivot – A sprinkler system that uses moving towers to rotate a sprinkler lateral about a pivot point.
Planned Practices – Practices for which Federal cost share dollars have been obligated by contract.
Ranking – A process by which applications for federal funds are prioritized based on their effectiveness in achieving Federal goals.
Return Flow – The fraction of deep percolation that is not consumed by plants, animals, or evaporation and returns to the river system, carrying salt.
Salts – Any chemical compound that is dissolved from the soil and carried to the river system by water. Salt concentration is frequently expressed as “Total Dissolved Solids” measured in parts per million (ppm) or milligrams per liter (mg/l). For salinity control work, it is often converted to Tons per acre-foot of water.
Salt load – The amount of dissolved salt carried by a flowing stream
Seepage – Fairly uniform percolation of water into the soil from ditches and canals.
Salt Load Reduction – A measure of the annual tons of salt prevented from entering the waters of the Colorado River. As applied to agriculture, salt load reduction is achieved by reducing seepage and deep percolation from over-irrigating.
Soil Conservation Service – The predecessor agency to NRCS.
Technical Assistance (TA) – The cost of technical assistance provided by Federal Agencies to design, monitor, and evaluate practice installation and operation, and to train and consult with cooperators. TA is generally assumed to be 40% of the total cost of conservation practices.
04/17/08 Page 32 of 33
Uniformity – A mathematical expression representing how evenly water is applied to a plot of ground by a sprinkler system. The two most common measures used by NRCS are Christiansen Uniformity (CCU) and Distribution Uniformity (DU).
Utah Division of Wildlife Resources (UDWR or DWR) – The State of Utah’s agency for managing wildlife resources.
Wheel line, Wheeline, Sideroll – A sprinkler system designed to be moved periodically by rolling the sprinkler lateral on large wheels.
WHIP – Wildlife Habitat Incentives Program, a Farm bill program instituted in 1997, designed to create, restore, and enhance wildlife habitat.
Water Budget – An accounting for the amount of water entering (irrigation and precipitation) and the amount of water leaving (evaporation, CU, deep percolation) a given plot of land to determine efficiency and estimate deep percolation.
Yield (or Crop Yield) – The amount of a given crop harvested from an acre of ground. Yield is usually expressed as Tons/Acre or Bushels/Acre, depending on the crop.
04/17/08 Page 33 of 33
References 1. U.S. Department of the Interior, Bureau of Land Management, The Effects of Surface
Disturbance on the Salinity of Public Lands in the Upper Colorado River Basin, 1977 Status Report, February, 1978.
2. U.S. Department of Agriculture, Natural Resources Conservation Service, Plan and Environmental Assessment, Manila – Washam Project Area of the Colorado River Salinity Control Program, July, 2006.
3. “Salt Primer – Water and Salt Budgets”, John C. Hedlund, Soil Conservation Service, 1992.
4. “FRAMEWORK PLAN FOR MONITORING AND EVALUATING THE COLORADO RIVER SALINITY CONTROLL PROGRAMS of the U.S. Department of Agriculture (USDA)-Natural Resources Conservation Service (NRCS)”, May, 2002.
5. “QUALITY OF WATER COLORADO RIVER BASIN – Progress Report #20”, U.S. Department of the Interior, 2001.
6. “Colorado River Salinity Control Program, Uintah Basin Unit, Monitoring and Evaluation, 2001 Report”, Draper, Brent W., Goins, Donald J., Lundstrom, D. Nick.
7. “Colorado River Salinity Control Program, Uintah Basin Unit, Monitoring and Evaluation, 2005 Report”, USDA-NRCS.
8. 1987, 1992, 1997, 2003 “Census of Agriculture”, United Stated Department of Agriculture, National Agricultural Statistics Service.