Embed Size (px)
Citation preview

Summary of Findings
48 Grouper 66 Grouper
Total Increase to Reimbursement 4,165,307 911,175
Average Per Diem Increase per Facility 1.30 0.37
Average Percentage Increase per Facility 0.6% 0.2%
Number of Facilities with Increase in Per Diem 128 107
Number of Facilities with Decrease in Per Diem 59 80
Colorado MedicaidTransition to RUG IV
November 2014
All Class I nursing facility July 1, 2013 reimbursement rates were recalculated utilizing the RUG IV 48 and 66 groupers. This recalculation included the rebasing of the statewide average CMI and health care maximum used in the reimbursement rate calculation. These calculations do not consider limitations to the general fund growth nor the provider fee model. As such, they do not reflect net changes to program funding.
Page 1

Cost Report Begin
Cost Report End
Actual Rate RUG III
34 Grouper
Proposed Rate
RUG IV 48 Grouper
Increase / (Decrease)
Proposed Rate
RUG IV 66 Grouper
Increase / (Decrease)
Medicaid Days
48 Grouper Medicaid Program Increase/Decrease BEFORE Modeling
66 Grouper Medicaid Program Increase/Decrease BEFORE Modeling
Provider 1 01/01/12 12/31/12 217.73 218.11 0.38 217.21 (0.52) 20,937 7,956 (10,887) Provider 2 10/01/11 09/30/12 220.41 225.14 4.73 223.07 2.66 20,787 98,323 55,293 Provider 3 01/01/12 12/31/12 221.64 224.33 2.69 223.14 1.50 20,742 55,796 31,113 Provider 4 10/01/11 09/30/12 187.95 190.63 2.68 190.32 2.37 21,874 58,622 51,841 Provider 5 04/01/12 03/31/13 217.63 213.06 (4.57) 211.87 (5.76) 17,243 (78,801) (99,320) Provider 6 01/01/12 12/31/12 216.70 214.95 (1.75) 213.40 (3.30) 10,228 (17,899) (33,752) Provider 7 10/01/11 09/30/12 189.95 191.09 1.14 190.87 0.92 25,766 29,373 23,705 Provider 8 07/01/11 06/30/12 182.19 183.68 1.49 183.85 1.66 22,273 33,187 36,973 Provider 9 01/01/12 12/31/12 200.48 201.66 1.18 201.84 1.36 28,678 33,840 39,002 Provider 10 01/01/12 12/31/12 223.18 220.59 (2.59) 219.88 (3.30) 35,014 (90,686) (115,546) Provider 11 10/01/11 09/30/12 189.88 196.23 6.35 195.23 5.35 23,493 149,181 125,688 Provider 12 01/01/12 12/31/12 207.61 208.99 1.38 208.54 0.93 11,103 15,322 10,326 Provider 13 10/01/11 09/30/12 235.84 230.89 (4.95) 229.55 (6.29) 20,054 (99,267) (126,140) Provider 14 10/01/11 09/30/12 188.07 186.93 (1.14) 187.69 (0.38) 16,168 (18,432) (6,144) Provider 15 01/01/12 12/31/12 228.03 230.20 2.17 230.15 2.12 31,900 69,223 67,628 Provider 16 01/01/12 12/31/12 188.34 187.75 (0.59) 187.66 (0.68) 40,114 (23,667) (27,278) Provider 17 10/01/11 09/30/12 233.90 239.33 5.43 238.71 4.81 22,172 120,394 106,647 Provider 18 01/01/12 12/31/12 252.14 255.17 3.03 253.75 1.61 19,880 60,236 32,007 Provider 19 01/01/12 12/31/12 236.63 231.31 (5.32) 229.76 (6.87) 18,060 (96,079) (124,072) Provider 20 01/01/12 12/31/12 247.78 249.51 1.73 249.87 2.09 26,493 45,833 55,370 Provider 21 01/01/12 12/31/12 210.78 212.91 2.13 211.07 0.29 36,924 78,648 10,708 Provider 22 07/01/11 06/30/12 238.01 230.60 (7.41) 231.36 (6.65) 19,808 (146,777) (131,723) Provider 23 01/01/12 12/31/12 212.28 224.36 12.08 221.50 9.22 12,740 153,899 117,463 Provider 24 01/01/12 12/31/12 209.17 211.72 2.55 210.95 1.78 23,771 60,616 42,312 Provider 25 01/01/12 12/31/12 204.97 204.51 (0.46) 204.03 (0.94) 7,214 (3,318) (6,781) Provider 26 01/01/12 12/31/12 183.19 176.73 (6.46) 176.95 (6.24) 8,112 (52,404) (50,619) Provider 27 01/01/12 12/31/12 201.38 204.51 3.13 203.94 2.56 20,562 64,359 52,639 Provider 28 01/01/12 12/31/12 233.27 236.46 3.19 235.76 2.49 22,692 72,387 56,503 Provider 29 10/01/11 09/30/12 192.55 195.90 3.35 194.33 1.78 17,594 58,940 31,317 Provider 30 10/01/11 09/30/12 179.10 180.99 1.89 180.20 1.10 27,171 51,353 29,888 Provider 31 07/01/11 06/30/12 224.41 225.22 0.81 224.47 0.06 13,130 10,635 788 Provider 32 07/01/11 06/30/12 214.28 215.62 1.34 215.19 0.91 17,044 22,839 15,510 Provider 33 07/01/11 06/30/12 239.08 244.38 5.30 241.63 2.55 9,650 51,145 24,607 Provider 34 01/01/12 12/31/12 221.70 223.09 1.39 222.01 0.31 39,276 54,594 12,176 Provider 35 01/01/12 12/31/12 211.68 213.27 1.59 212.96 1.28 52,093 82,828 66,679 Provider 36 01/01/12 12/31/12 255.74 266.81 11.07 265.39 9.65 3,004 33,254 28,989 Provider 37 01/01/12 12/31/12 219.32 218.60 (0.72) 216.79 (2.53) 33,016 (23,772) (83,530) Provider 38 01/01/12 12/31/12 232.52 231.54 (0.98) 229.53 (2.99) 14,869 (14,572) (44,458) Provider 39 01/01/12 12/31/12 248.15 248.71 0.56 246.47 (1.68) 16,819 9,419 (28,256) Provider 40 10/01/11 09/30/12 193.60 197.24 3.64 196.43 2.83 19,725 71,799 55,822 Provider 41 07/01/11 06/30/12 259.87 258.92 (0.95) 256.72 (3.15) 44,154 (41,946) (139,085) Provider 42 07/01/11 06/30/12 229.76 225.72 (4.04) 225.38 (4.38) 8,297 (33,520) (36,341)
RUG III (34 Grouper) versus RUG IV (48 Grouper and 66 Grouper)
48 Grouper 66 Grouper
July 1, 2013 Reimbursement Rates
Page 2

Cost Report Begin
Cost Report End
Actual Rate RUG III
34 Grouper
Proposed Rate
RUG IV 48 Grouper
Increase / (Decrease)
Proposed Rate
RUG IV 66 Grouper
Increase / (Decrease)
Medicaid Days
48 Grouper Medicaid Program Increase/Decrease BEFORE Modeling
66 Grouper Medicaid Program Increase/Decrease BEFORE Modeling
48 Grouper 66 Grouper
Provider 43 07/01/11 06/30/12 252.48 252.11 (0.37) 250.13 (2.35) 18,397 (6,807) (43,233) Provider 44 01/01/12 12/31/12 244.42 247.25 2.83 244.44 0.02 19,741 55,867 395 Provider 45 01/01/12 12/31/12 222.60 222.82 0.22 221.96 (0.64) 15,039 3,309 (9,625) Provider 46 10/01/11 09/30/12 193.27 196.99 3.72 195.00 1.73 18,339 68,221 31,726 Provider 47 01/01/12 12/31/12 217.24 214.27 (2.97) 215.25 (1.99) 15,093 (44,826) (30,035) Provider 48 01/01/12 12/31/12 164.03 165.98 1.95 165.20 1.17 35,986 70,173 42,104 Provider 49 01/01/12 12/31/12 177.05 175.19 (1.86) 174.86 (2.19) 14,184 (26,382) (31,063) Provider 50 04/01/12 03/31/13 235.92 233.10 (2.82) 232.36 (3.56) 6,126 (17,275) (21,809) Provider 51 01/01/12 12/31/12 209.29 207.51 (1.78) 207.90 (1.39) 26,077 (46,417) (36,247) Provider 52 01/01/12 12/31/12 178.17 180.44 2.27 180.66 2.49 16,327 37,062 40,654 Provider 53 10/01/11 09/30/12 258.94 264.69 5.75 263.03 4.09 12,101 69,581 49,493 Provider 54 01/01/12 12/31/12 259.88 265.22 5.34 263.58 3.70 11,967 63,904 44,278 Provider 55 01/01/12 12/31/12 213.39 213.79 0.40 212.44 (0.95) 12,361 4,944 (11,743) Provider 56 01/01/12 12/31/12 220.05 220.95 0.90 219.95 (0.10) 26,438 23,794 (2,644) Provider 57 06/01/11 05/31/12 203.44 202.16 (1.28) 201.59 (1.85) 47,627 (60,963) (88,110) Provider 58 01/01/12 12/31/12 220.99 223.65 2.66 223.18 2.19 12,331 32,800 27,005 Provider 59 01/01/12 12/31/12 168.17 173.17 5.00 172.36 4.19 12,968 64,840 54,336 Provider 60 01/01/12 12/31/12 237.39 237.12 (0.27) 237.30 (0.09) 27,344 (7,383) (2,461) Provider 61 01/01/12 12/31/12 241.74 240.76 (0.98) 238.67 (3.07) 22,428 (21,979) (68,854) Provider 62 01/01/12 12/31/12 211.39 210.00 (1.39) 209.84 (1.55) 31,517 (43,809) (48,851) Provider 63 01/01/12 12/31/12 199.65 199.77 0.12 200.83 1.18 17,585 2,110 20,750 Provider 64 10/01/11 09/30/12 189.76 191.53 1.77 191.32 1.56 17,658 31,255 27,546 Provider 65 10/01/11 09/30/12 199.49 199.02 (0.47) 197.02 (2.47) 23,537 (11,062) (58,136) Provider 66 11/01/11 10/31/12 218.24 219.57 1.33 218.37 0.13 11,473 15,259 1,491 Provider 67 07/01/11 06/30/12 244.94 248.36 3.42 247.69 2.75 10,996 37,606 30,239 Provider 68 10/01/11 09/30/12 233.40 237.23 3.83 236.79 3.39 9,731 37,270 32,988 Provider 69 01/01/12 12/31/12 200.45 200.61 0.16 200.82 0.37 10,410 1,666 3,852 Provider 70 01/01/12 12/31/12 215.04 213.76 (1.28) 213.64 (1.40) 11,841 (15,156) (16,577) Provider 71 01/01/12 12/31/12 210.62 209.31 (1.31) 209.04 (1.58) 32,195 (42,175) (50,868) Provider 72 01/01/12 12/31/12 224.29 226.76 2.47 225.99 1.70 13,996 34,570 23,793 Provider 73 01/01/12 12/31/12 244.42 245.88 1.46 244.09 (0.33) 19,290 28,163 (6,366) Provider 74 01/01/12 12/31/12 179.54 183.66 4.12 183.66 4.12 7,597 31,300 31,300 Provider 75 01/01/12 12/31/12 238.67 230.39 (8.28) 229.02 (9.65) 8,488 (70,281) (81,909) Provider 76 01/01/12 12/31/12 193.41 190.68 (2.73) 190.58 (2.83) 5,440 (14,851) (15,395) Provider 77 01/01/12 12/31/12 275.70 278.22 2.52 276.16 0.46 8,127 20,480 3,738 Provider 78 01/01/12 12/31/12 251.86 252.00 0.14 250.03 (1.83) 16,341 2,288 (29,904) Provider 79 01/01/12 12/31/12 199.77 198.80 (0.97) 199.22 (0.55) 20,872 (20,246) (11,480) Provider 80 09/01/11 08/31/12 218.85 218.99 0.14 218.12 (0.73) 22,844 3,198 (16,676) Provider 81 01/01/12 12/31/12 247.35 253.98 6.63 249.60 2.25 13,521 89,644 30,422 Provider 82 01/01/12 12/31/12 233.90 235.39 1.49 235.17 1.27 32,658 48,660 41,476 Provider 83 08/01/11 07/31/12 213.69 214.51 0.82 214.64 0.95 18,422 15,106 17,501 Provider 84 01/01/12 12/31/12 226.91 226.75 (0.16) 227.20 0.29 9,991 (1,599) 2,897 Provider 85 01/01/12 12/31/12 201.10 197.94 (3.16) 198.50 (2.60) 27,883 (88,110) (72,496) Provider 86 01/01/12 12/31/12 192.40 187.89 (4.51) 187.71 (4.69) 9,349 (42,164) (43,847) Provider 87 01/01/12 12/31/12 192.89 191.67 (1.22) 191.25 (1.64) 10,885 (13,280) (17,851) Provider 88 07/01/11 06/30/12 234.31 236.41 2.10 235.08 0.77 11,753 24,681 9,050 Provider 89 01/01/12 12/31/12 212.75 217.16 4.41 215.48 2.73 23,146 102,074 63,189
Page 3

Cost Report Begin
Cost Report End
Actual Rate RUG III
34 Grouper
Proposed Rate
RUG IV 48 Grouper
Increase / (Decrease)
Proposed Rate
RUG IV 66 Grouper
Increase / (Decrease)
Medicaid Days
48 Grouper Medicaid Program Increase/Decrease BEFORE Modeling
66 Grouper Medicaid Program Increase/Decrease BEFORE Modeling
48 Grouper 66 Grouper
Provider 90 01/01/12 12/31/12 201.52 202.48 0.96 202.10 0.58 28,382 27,247 16,462 Provider 91 01/01/12 12/31/12 190.72 183.14 (7.58) 183.71 (7.01) 38,095 (288,760) (267,046) Provider 92 01/01/12 12/31/12 186.82 189.76 2.94 189.93 3.11 13,288 39,067 41,326 Provider 93 01/01/12 12/31/12 201.09 201.53 0.44 200.95 (0.14) 14,719 6,476 (2,061) Provider 94 10/01/11 09/30/12 187.84 187.82 (0.02) 186.94 (0.90) 25,817 (516) (23,235) Provider 95 07/01/12 03/31/13 201.62 202.12 0.50 200.01 (1.61) 15,634 7,817 (25,171) Provider 96 07/01/11 06/30/12 235.61 236.32 0.71 235.73 0.12 10,359 7,355 1,243 Provider 97 07/01/12 03/31/13 220.32 220.58 0.26 219.65 (0.67) 19,931 5,182 (13,354) Provider 98 01/01/12 12/31/12 219.22 220.44 1.22 220.47 1.25 16,068 19,603 20,085 Provider 99 01/01/12 12/31/12 231.57 233.61 2.04 229.13 (2.44) 17,218 35,125 (42,012) Provider 100 07/01/11 06/30/12 207.08 212.30 5.22 211.30 4.22 16,975 88,610 71,635 Provider 101 01/01/12 12/31/12 241.19 241.91 0.72 240.09 (1.10) 19,470 14,018 (21,417) Provider 102 01/01/12 12/31/12 252.00 258.07 6.07 257.69 5.69 12,902 78,315 73,412 Provider 103 01/01/12 12/31/12 236.07 241.93 5.86 239.59 3.52 22,717 133,122 79,964 Provider 104 01/01/12 12/31/12 242.97 246.37 3.40 242.28 (0.69) 13,116 44,594 (9,050) Provider 105 01/01/12 12/31/12 275.59 284.79 9.20 280.78 5.19 7,406 68,135 38,437 Provider 106 01/01/12 12/31/12 243.66 246.66 3.00 243.04 (0.62) 32,606 97,818 (20,216) Provider 107 01/01/12 12/31/12 221.67 225.04 3.37 222.64 0.97 32,059 108,039 31,097 Provider 108 01/01/12 12/31/12 269.23 275.19 5.96 273.74 4.51 11,754 70,054 53,011 Provider 109 01/01/12 12/31/12 200.34 199.28 (1.06) 199.28 (1.06) 6,500 (6,890) (6,890) Provider 110 01/01/12 12/31/12 245.91 245.92 0.01 246.29 0.38 13,907 139 5,285 Provider 111 01/01/12 12/31/12 246.54 250.30 3.76 248.14 1.60 5,867 22,060 9,387 Provider 112 01/01/12 12/31/12 223.98 228.35 4.37 226.86 2.88 19,057 83,279 54,884 Provider 113 01/01/12 12/31/12 249.35 253.82 4.47 251.40 2.05 19,729 88,189 40,444 Provider 114 01/01/12 12/31/12 224.16 224.81 0.65 224.02 (0.14) 14,509 9,431 (2,031) Provider 115 01/01/12 12/31/12 211.32 208.89 (2.43) 208.82 (2.50) 18,431 (44,787) (46,078) Provider 116 01/01/12 12/31/12 193.80 192.95 (0.85) 192.17 (1.63) 15,466 (13,146) (25,210) Provider 117 01/01/12 12/31/12 186.95 188.65 1.70 187.70 0.75 43,085 73,245 32,314 Provider 118 10/01/11 09/30/12 191.25 192.85 1.60 191.86 0.61 20,376 32,602 12,429 Provider 119 01/01/12 12/31/12 202.82 198.88 (3.94) 197.84 (4.98) 24,724 (97,413) (123,126) Provider 120 01/01/12 12/31/12 216.25 217.54 1.29 217.11 0.86 20,136 25,975 17,317 Provider 121 01/01/12 12/31/12 243.51 240.50 (3.01) 239.71 (3.80) 26,103 (78,570) (99,191) Provider 122 01/01/12 12/31/12 196.16 194.26 (1.90) 193.74 (2.42) 20,191 (38,363) (48,862) Provider 123 09/01/11 08/31/12 242.08 249.94 7.86 249.02 6.94 35,486 278,920 246,273 Provider 124 01/01/12 12/31/12 221.82 226.67 4.85 224.92 3.10 24,440 118,534 75,764 Provider 125 01/01/12 12/31/12 215.46 218.74 3.28 217.16 1.70 25,087 82,285 42,648 Provider 126 01/01/12 12/31/12 273.21 268.08 (5.13) 267.44 (5.77) 14,527 (74,524) (83,821) Provider 127 10/01/11 09/30/12 196.13 200.80 4.67 200.32 4.19 15,791 73,744 66,164 Provider 128 01/01/12 12/31/12 205.06 205.75 0.69 204.31 (0.75) 9,556 6,594 (7,167) Provider 129 01/01/12 12/31/12 164.80 165.27 0.47 165.24 0.44 32,467 15,259 14,285 Provider 130 01/01/12 12/31/12 226.01 227.33 1.32 226.49 0.48 21,152 27,921 10,153 Provider 131 01/01/12 12/31/12 231.44 228.47 (2.97) 227.61 (3.83) 19,857 (58,975) (76,052) Provider 132 01/01/12 12/31/12 237.23 246.52 9.29 245.90 8.67 18,705 173,769 162,172 Provider 133 10/01/11 09/30/12 212.80 215.35 2.55 213.82 1.02 14,864 37,903 15,161 Provider 134 01/01/12 12/31/12 201.04 200.32 (0.72) 199.71 (1.33) 44,688 (32,175) (59,435) Provider 135 01/01/12 12/31/12 179.67 179.50 (0.17) 179.17 (0.50) 17,418 (2,961) (8,709) Provider 136 01/01/12 12/31/12 188.06 189.89 1.83 188.84 0.78 15,272 27,948 11,912
Page 4
Cost Report Begin
Cost Report End
Actual Rate RUG III
34 Grouper
Proposed Rate
RUG IV 48 Grouper
Increase / (Decrease)
Proposed Rate
RUG IV 66 Grouper
Increase / (Decrease)
Medicaid Days
48 Grouper Medicaid Program Increase/Decrease BEFORE Modeling
66 Grouper Medicaid Program Increase/Decrease BEFORE Modeling
48 Grouper 66 Grouper
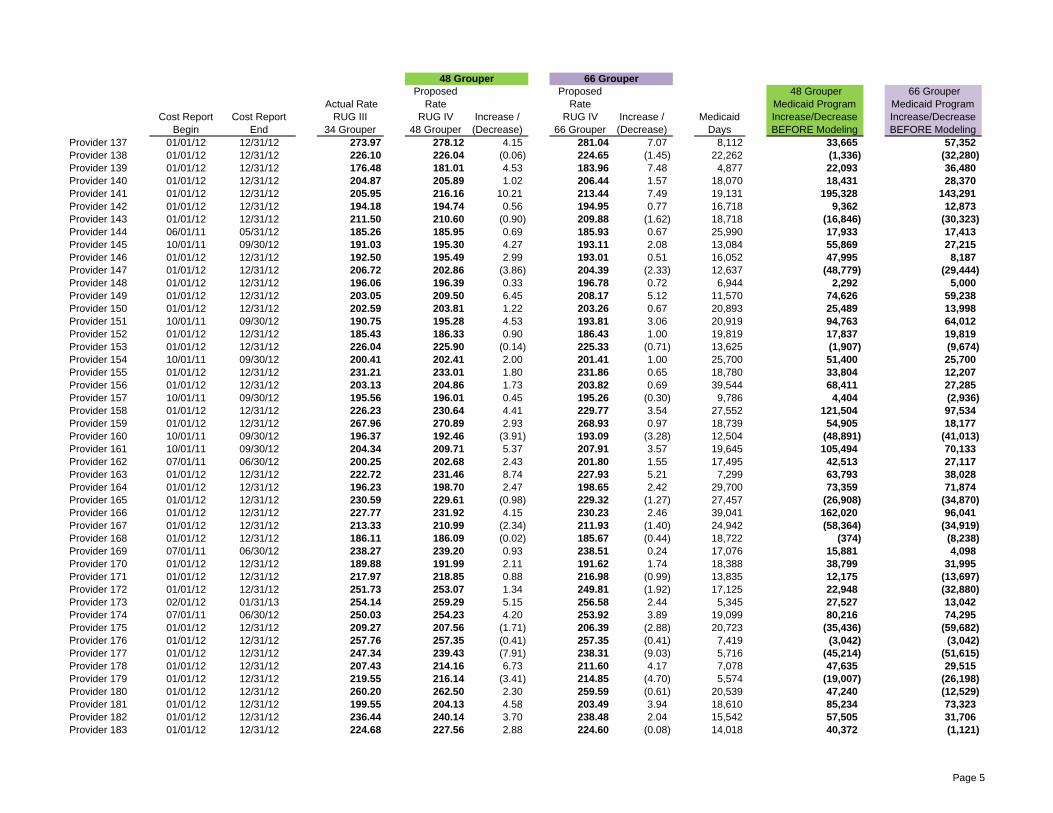
Provider 137 01/01/12 12/31/12 273.97 278.12 4.15 281.04 7.07 8,112 33,665 57,352 Provider 138 01/01/12 12/31/12 226.10 226.04 (0.06) 224.65 (1.45) 22,262 (1,336) (32,280) Provider 139 01/01/12 12/31/12 176.48 181.01 4.53 183.96 7.48 4,877 22,093 36,480 Provider 140 01/01/12 12/31/12 204.87 205.89 1.02 206.44 1.57 18,070 18,431 28,370 Provider 141 01/01/12 12/31/12 205.95 216.16 10.21 213.44 7.49 19,131 195,328 143,291 Provider 142 01/01/12 12/31/12 194.18 194.74 0.56 194.95 0.77 16,718 9,362 12,873 Provider 143 01/01/12 12/31/12 211.50 210.60 (0.90) 209.88 (1.62) 18,718 (16,846) (30,323) Provider 144 06/01/11 05/31/12 185.26 185.95 0.69 185.93 0.67 25,990 17,933 17,413 Provider 145 10/01/11 09/30/12 191.03 195.30 4.27 193.11 2.08 13,084 55,869 27,215 Provider 146 01/01/12 12/31/12 192.50 195.49 2.99 193.01 0.51 16,052 47,995 8,187 Provider 147 01/01/12 12/31/12 206.72 202.86 (3.86) 204.39 (2.33) 12,637 (48,779) (29,444) Provider 148 01/01/12 12/31/12 196.06 196.39 0.33 196.78 0.72 6,944 2,292 5,000 Provider 149 01/01/12 12/31/12 203.05 209.50 6.45 208.17 5.12 11,570 74,626 59,238 Provider 150 01/01/12 12/31/12 202.59 203.81 1.22 203.26 0.67 20,893 25,489 13,998 Provider 151 10/01/11 09/30/12 190.75 195.28 4.53 193.81 3.06 20,919 94,763 64,012 Provider 152 01/01/12 12/31/12 185.43 186.33 0.90 186.43 1.00 19,819 17,837 19,819 Provider 153 01/01/12 12/31/12 226.04 225.90 (0.14) 225.33 (0.71) 13,625 (1,907) (9,674) Provider 154 10/01/11 09/30/12 200.41 202.41 2.00 201.41 1.00 25,700 51,400 25,700 Provider 155 01/01/12 12/31/12 231.21 233.01 1.80 231.86 0.65 18,780 33,804 12,207 Provider 156 01/01/12 12/31/12 203.13 204.86 1.73 203.82 0.69 39,544 68,411 27,285 Provider 157 10/01/11 09/30/12 195.56 196.01 0.45 195.26 (0.30) 9,786 4,404 (2,936) Provider 158 01/01/12 12/31/12 226.23 230.64 4.41 229.77 3.54 27,552 121,504 97,534 Provider 159 01/01/12 12/31/12 267.96 270.89 2.93 268.93 0.97 18,739 54,905 18,177 Provider 160 10/01/11 09/30/12 196.37 192.46 (3.91) 193.09 (3.28) 12,504 (48,891) (41,013) Provider 161 10/01/11 09/30/12 204.34 209.71 5.37 207.91 3.57 19,645 105,494 70,133 Provider 162 07/01/11 06/30/12 200.25 202.68 2.43 201.80 1.55 17,495 42,513 27,117 Provider 163 01/01/12 12/31/12 222.72 231.46 8.74 227.93 5.21 7,299 63,793 38,028 Provider 164 01/01/12 12/31/12 196.23 198.70 2.47 198.65 2.42 29,700 73,359 71,874 Provider 165 01/01/12 12/31/12 230.59 229.61 (0.98) 229.32 (1.27) 27,457 (26,908) (34,870) Provider 166 01/01/12 12/31/12 227.77 231.92 4.15 230.23 2.46 39,041 162,020 96,041 Provider 167 01/01/12 12/31/12 213.33 210.99 (2.34) 211.93 (1.40) 24,942 (58,364) (34,919) Provider 168 01/01/12 12/31/12 186.11 186.09 (0.02) 185.67 (0.44) 18,722 (374) (8,238) Provider 169 07/01/11 06/30/12 238.27 239.20 0.93 238.51 0.24 17,076 15,881 4,098 Provider 170 01/01/12 12/31/12 189.88 191.99 2.11 191.62 1.74 18,388 38,799 31,995 Provider 171 01/01/12 12/31/12 217.97 218.85 0.88 216.98 (0.99) 13,835 12,175 (13,697) Provider 172 01/01/12 12/31/12 251.73 253.07 1.34 249.81 (1.92) 17,125 22,948 (32,880) Provider 173 02/01/12 01/31/13 254.14 259.29 5.15 256.58 2.44 5,345 27,527 13,042 Provider 174 07/01/11 06/30/12 250.03 254.23 4.20 253.92 3.89 19,099 80,216 74,295 Provider 175 01/01/12 12/31/12 209.27 207.56 (1.71) 206.39 (2.88) 20,723 (35,436) (59,682) Provider 176 01/01/12 12/31/12 257.76 257.35 (0.41) 257.35 (0.41) 7,419 (3,042) (3,042) Provider 177 01/01/12 12/31/12 247.34 239.43 (7.91) 238.31 (9.03) 5,716 (45,214) (51,615) Provider 178 01/01/12 12/31/12 207.43 214.16 6.73 211.60 4.17 7,078 47,635 29,515 Provider 179 01/01/12 12/31/12 219.55 216.14 (3.41) 214.85 (4.70) 5,574 (19,007) (26,198) Provider 180 01/01/12 12/31/12 260.20 262.50 2.30 259.59 (0.61) 20,539 47,240 (12,529) Provider 181 01/01/12 12/31/12 199.55 204.13 4.58 203.49 3.94 18,610 85,234 73,323 Provider 182 01/01/12 12/31/12 236.44 240.14 3.70 238.48 2.04 15,542 57,505 31,706 Provider 183 01/01/12 12/31/12 224.68 227.56 2.88 224.60 (0.08) 14,018 40,372 (1,121)
Page 5

Cost Report Begin
Cost Report End
Actual Rate RUG III
34 Grouper
Proposed Rate
RUG IV 48 Grouper
Increase / (Decrease)
Proposed Rate
RUG IV 66 Grouper
Increase / (Decrease)
Medicaid Days
48 Grouper Medicaid Program Increase/Decrease BEFORE Modeling
66 Grouper Medicaid Program Increase/Decrease BEFORE Modeling
48 Grouper 66 Grouper
Provider 184 01/01/12 12/31/12 203.90 206.00 2.10 205.83 1.93 8,262 17,350 15,946 Provider 185 10/01/11 09/30/12 180.79 178.69 (2.10) 178.43 (2.36) 25,869 (54,325) (61,051) Provider 186 01/01/12 12/31/12 216.19 214.81 (1.38) 214.09 (2.10) 24,367 (33,626) (51,171) Provider 187 10/01/11 09/30/12 162.11 165.31 3.20 164.70 2.59 12,493 39,978 32,357
1.30 0.37 4,165,307 911,175 Average Rate Average Rate Total Increase to Total Increase to
Increase per Facility Increase per Facility Reimbursement ReimbursementBefore Modeling Before Modeling
Page 6

Allison Care Center6393427201/01/2012 - 12/31/20121660 Allison StLakewood, CO 80214
Myers and Stauffer LC
93.0030,285
34,03889.0%
07/01/2013
Patient Days:
Colorado Medicaid
Provider Name:Provider Number:Cost Report Period:Address:City/State/ZIP:
Bed Days:Occupancy:
Beds:Rate Effective Date:
Medicaid Days: 20,937
Schedule Of Core Components Reimbursement RateRun On 06/19/2014Page 1
Fair Rental Value (FRV) RateTotal Appraisal Value of FRV Property $4,634,000
Lesser Of: Base Value Or Maximum Allowable
Thru RED 07/01/2011: 1.14516420 x $4,840,000After RED 07/01/2011: 1.02252870 x $1,300
Maximum Allowable: 93.00 Beds x $93,079 Base Rate
After RED 07/01/2012: 1.00338260 x $0After RED 07/01/2013: 1.00000000 x $0Base Value $5,543,924
$8,656,347$5,543,924
$457,374
$457,374
0.08250
$14.93
Administration & General Rate
$64.45Administration & General Per Diem Rate
Adjustment For FRV Additions/Construction Index:
Times: Rental RateAnnual Fair Rental Allowable
Fair Rental Allowance This PeriodTimes: Annualizer For Cost Report Period: 366 / 366 Days 1.0000000000
30,285Imputed Patient Days: 93.00 Beds x 366 Days x 90% 30,634
30,634Greater Of: Actual Or Imputed Patient Days
Fair Rental Value Per Diem Rate
$64.4507/01/2013 Price (61 Beds Or More)
A:
B:
A/B:
$1,329$0$0
$5,542,595
Actual Patient Days
$64.45
$42.81
Greater Of: A&G Price Or Hold Harmless (HH) Rate
HH: 06/30/2008 Per Diem Rate (05/01/2008 Rate)$4.33HH: Management Fee
$47.14HH: Per Diem Rate Plus Management Fee
Health Care Rate
DirectHealth Care
IndirectHealth Care
$2,919,435$1,135,861
Total Direct Health Care
$127.34 $49.56$96.40 $37.51
$97.19 $37.51
$99.82 $38.53
1.0082
Health Care Per Diem Rates
Facility-Specific Maximum (Page 2)
Times: Medicaid Acuity RatioReimbursable Per Diem
$37.51$96.40Per Diem Cost
Lesser Of: Per Diem Cost Or Maximum
1.027091633 1.027091633Times: Inflation Factor (Page 2)
30,285Divided By: Actual Patient Days
$99.82 $38.53Inflation-Adjusted Reimbursable Per Diem
N/A
$4,055,296Total Health Care
$422,680$2,496,755
A:B:
D (A+B):C:
Total Indirect Health CareC-D:
$2,883,410$488,137
Divided By: Total Health Care Wages$2,496,755Direct Health Care Wages
Times: Total Health Care Payroll Taxes & BenefitsDirect Health Care Payroll Taxes & Benefits
$37.51$96.40Allowable Per Diem Cost (Page 3)
Direct Health Care (MED-13 Lines 1-5)
$217.73Per Diem Reimbursement Rate+ =+ ++
Revision to Appraisal Value of FRV Property $4,840,000$206,000

RED 07/01/2013
Statewide Average CMI At 07/01/2013
01/01/2013 1.1604
07/01/2013
Case Mix Calculations - Acuity Information Used In Rate SettingCost Report Normalization, Medicaid &
PictureDates Wide CMI
Facility-Pictures
CMI
04/01/2012 1.0973 01/01/201304/01/2013
1.1453
Medicaid
1.1474
1.1547
DirectNursing Care
Total
Per Diem
$96.400.9905$95.4871.79%
$126.131.0096
$127.34
28.21%$49.56
$49.56
N/A
N/A
$133.91
$132.99
$175.69
$176.90
N/A
N/A
07/01/2013 - 06/30/2014Rate Effective Dates
Facility-Specific Direct & Other Health Care MaximumsTimes The Facility Specific Acuity RatioDistribution Of Overall Health Care MaximumPercentage Of Total
Times The Normalization RatioNormalized Facility Health Care Costs
Health MaximumOther
Per Diem Cost (Page 1)
100.00%
$37.51
$37.51
Inflation Factors
1.1344
0.99051.1453
1.00821.0096
07/01/2012 1.11281.210610/01/2012
1.1619
Allison Care Center6393427201/01/2012 - 12/31/2012
Average
Average
CMI
Provider Name:Provider Number:Cost Report Period:
Facility-Specific RatiosPeriod CMI Used In Rate
Facility-Wide Average CMI
Facility-Specific Ratio (Facility/Statewide)Medicaid Ratio (Medicaid/Facility)Normalization Ratio (Statewide/Facility)
07/01/2013Rate Effective Date:
Schedule Of Core Components Reimbursement Rate
Medicaid Acuity
Case Mix Calculations - Facility Specific Health Care Maximum
Divided By: 06/30/2012 Midpoint Of Cost Report Period (01/01/2012 - 12/31/2012) Inflation IndexInflation Factor Used In Health Care Rate Setting
1.2891.255
1.027091633
08/31/2013 Midpoint Of Rate Period (07/01/2013 - 10/31/2013) Inflation Index
Myers and Stauffer LCColorado MedicaidRun On 06/19/2014
Page 2

Allison Care Center6393427201/01/2012 - 12/31/2012
Provider Name:Provider Number:Cost Report Period:
Divided By Facility-Wide Average CMI, From Rate Sheet Page 2Normalization Ratio, From Rate Sheet Page 2Medicaid Ratio, From Rate Sheet Page 2Facility Specific Ratio, From Rate Sheet Page 2
Current Year Per Diem Cost, From Rate Sheet Page 2Normalization Ratio, From Rate Sheet Page 2Current Year Normalized Cost, From Rate Sheet Page 2Current Year Percentage Of Total, From Rate Sheet Page 2
Prior Year Normalized Cost Inflated By 8%, From Box Below
Lesser Of The Two
Allowable Per Diem Cost, To Rate Sheet Page 1
Prior Year Per Diem Cost, From Prior Year Rate Sheet
Prior Year Normalized Cost, From Prior Year Rate SheetInflation 01/01/2012-12/31/2012Prior Year Normalized Cost Inflated
Calculate Prior Year Normalized Cost Inflated By 8%
12/31/2011 12/31/2012Prior Year Current Year
Statewide Average CMI, From Rate Sheet Page 2
Prior Year Normalization Ratio, From Prior Year Rate Sheet
1.1344
0.99051.1453
1.00821.0096
96.40Health Care Health Care Total
Direct Indirect
37.51 133.910.990595.48
71.79%37.51
28.21%
N/A132.99
N/A
1.07021.1270
1.05311.02930.9496
95.61 38.90 134.511.0531
108.75 42.01 150.76
100.69 38.90 139.59108.00% 108.00%
132.99
108.75 42.01 150.76
96.40 37.51 133.91
N/A N/A
N/A
<- changes every year on 07/01/xxxx
<- same for each rate driven by same cost report
<- statewide average CMI/facility-wide average CMI
<- medicaid average CMI/facility-wide average CMI
<- facility-wide average CMI/statewide average CMI
inverses; driven by change
<- in theory, this would be rate if
Filler
Calculation Of Health Care Allowable Per Diem Cost
in statewide average at07/01/xxxx (Note 1)
equaled statewide average CMIfacility-wide average CMI
07/01/2013Rate Effective Date:
Myers and Stauffer LCColorado Medicaid
Schedule Of Core Components Reimbursement Rate
100.00%
Run On 06/19/2014Page 3

Allison Care Center
07/01/2013
Number Of Beds As Of 12/31/2011 93 366 34,038No Current Period ChangesBed Days Available 366 34,038Bed Days Per Schedule MDifference (Adjustment) 0
34,038
Date OfAmount
Days In Bed DaysChange Period Available
Description Date Change Amount
6393427201/01/2012 - 12/31/2012
None
Provider Name:Provider Number:Cost Report Period:Rate Effective Date:
In Service Licensure
Bed Days Available & Number Of Beds
Listing Of Current Fair Rental Value (FRV) Additions & Deletions
Myers and Stauffer LCColorado Medicaid
Schedule Of Core Components Reimbursement Rate
Original Related To
$0
Calculate Bed Days Available
Calculate Number Of BedsNumberOf Beds
Bed Days AvailableDivided By: Days In PeriodWeighted Average Number Of Beds
34,038366
93.00
Run On 06/19/2014Page 4

Allison Care Center6393427201/01/2012 - 12/31/20121660 Allison StLakewood, CO 80214
Myers and Stauffer LC
93.0030,285
34,03889.0%
07/01/2013
Patient Days:
Colorado Medicaid
Provider Name:Provider Number:Cost Report Period:Address:City/State/ZIP:
Bed Days:Occupancy:
Beds:Rate Effective Date:
Medicaid Days: 20,937
Schedule Of Core Components Reimbursement RateRun On 06/19/2014Page 1
Fair Rental Value (FRV) RateTotal Appraisal Value of FRV Property $4,634,000
Lesser Of: Base Value Or Maximum Allowable
Thru RED 07/01/2011: 1.14516420 x $4,840,000After RED 07/01/2011: 1.02252870 x $1,300
Maximum Allowable: 93.00 Beds x $93,079 Base Rate
After RED 07/01/2012: 1.00338260 x $0After RED 07/01/2013: 1.00000000 x $0Base Value $5,543,924
$8,656,347$5,543,924
$457,374
$457,374
0.08250
$14.93
Administration & General Rate
$64.45Administration & General Per Diem Rate
Adjustment For FRV Additions/Construction Index:
Times: Rental RateAnnual Fair Rental Allowable
Fair Rental Allowance This PeriodTimes: Annualizer For Cost Report Period: 366 / 366 Days 1.0000000000
30,285Imputed Patient Days: 93.00 Beds x 366 Days x 90% 30,634
30,634Greater Of: Actual Or Imputed Patient Days
Fair Rental Value Per Diem Rate
$64.4507/01/2013 Price (61 Beds Or More)
A:
B:
A/B:
$1,329$0$0
$5,542,595
Actual Patient Days
$64.45
$42.81
Greater Of: A&G Price Or Hold Harmless (HH) Rate
HH: 06/30/2008 Per Diem Rate (05/01/2008 Rate)$4.33HH: Management Fee
$47.14HH: Per Diem Rate Plus Management Fee
Health Care Rate
DirectHealth Care
IndirectHealth Care
$2,919,435$1,135,861
Total Direct Health Care
$131.16 $51.04$96.40 $37.51
$97.56 $37.51
$100.20 $38.53
1.0120
Health Care Per Diem Rates
Facility-Specific Maximum (Page 2)
Times: Medicaid Acuity RatioReimbursable Per Diem
$37.51$96.40Per Diem Cost
Lesser Of: Per Diem Cost Or Maximum
1.027091633 1.027091633Times: Inflation Factor (Page 2)
30,285Divided By: Actual Patient Days
$100.20 $38.53Inflation-Adjusted Reimbursable Per Diem
N/A
$4,055,296Total Health Care
$422,680$2,496,755
A:B:
D (A+B):C:
Total Indirect Health CareC-D:
$2,883,410$488,137
Divided By: Total Health Care Wages$2,496,755Direct Health Care Wages
Times: Total Health Care Payroll Taxes & BenefitsDirect Health Care Payroll Taxes & Benefits
$37.51$96.40Allowable Per Diem Cost (Page 3)
Direct Health Care (MED-13 Lines 1-5)
$218.11Per Diem Reimbursement Rate+ =+ ++
Revision to Appraisal Value of FRV Property $4,840,000$206,000

RED 07/01/2013
Statewide Average CMI At 07/01/2013
01/01/2013 1.0068
07/01/2013
Case Mix Calculations - Acuity Information Used In Rate SettingCost Report Normalization, Medicaid &
PictureDates Wide CMI
Facility-Pictures
CMI
04/01/2012 0.9833 01/01/201304/01/2013
1.0186
Medicaid
1.0219
1.0308
DirectNursing Care
Total
Per Diem
$96.400.9522$91.7970.99%
$124.891.0502
$131.16
29.01%$51.04
$51.04
N/A
N/A
$133.91
$129.30
$175.93
$182.20
N/A
N/A
07/01/2013 - 06/30/2014Rate Effective Dates
Facility-Specific Direct & Other Health Care MaximumsTimes The Facility Specific Acuity RatioDistribution Of Overall Health Care MaximumPercentage Of Total
Times The Normalization RatioNormalized Facility Health Care Costs
Health MaximumOther
Per Diem Cost (Page 1)
100.00%
$37.51
$37.51
Inflation Factors
0.9699
0.95221.0186
1.01201.0502
07/01/2012 1.04111.043310/01/2012
1.0397
Allison Care Center6393427201/01/2012 - 12/31/2012
Average
Average
CMI
Provider Name:Provider Number:Cost Report Period:
Facility-Specific RatiosPeriod CMI Used In Rate
Facility-Wide Average CMI
Facility-Specific Ratio (Facility/Statewide)Medicaid Ratio (Medicaid/Facility)Normalization Ratio (Statewide/Facility)
07/01/2013Rate Effective Date:
Schedule Of Core Components Reimbursement Rate
Medicaid Acuity
Case Mix Calculations - Facility Specific Health Care Maximum
Divided By: 06/30/2012 Midpoint Of Cost Report Period (01/01/2012 - 12/31/2012) Inflation IndexInflation Factor Used In Health Care Rate Setting
1.2891.255
1.027091633
08/31/2013 Midpoint Of Rate Period (07/01/2013 - 10/31/2013) Inflation Index
Myers and Stauffer LCColorado MedicaidRun On 06/19/2014
Page 2

Allison Care Center6393427201/01/2012 - 12/31/2012
Provider Name:Provider Number:Cost Report Period:
Divided By Facility-Wide Average CMI, From Rate Sheet Page 2Normalization Ratio, From Rate Sheet Page 2Medicaid Ratio, From Rate Sheet Page 2Facility Specific Ratio, From Rate Sheet Page 2
Current Year Per Diem Cost, From Rate Sheet Page 2Normalization Ratio, From Rate Sheet Page 2Current Year Normalized Cost, From Rate Sheet Page 2Current Year Percentage Of Total, From Rate Sheet Page 2
Prior Year Normalized Cost Inflated By 8%, From Box Below
Lesser Of The Two
Allowable Per Diem Cost, To Rate Sheet Page 1
Prior Year Per Diem Cost, From Prior Year Rate Sheet
Prior Year Normalized Cost, From Prior Year Rate SheetInflation 01/01/2012-12/31/2012Prior Year Normalized Cost Inflated
Calculate Prior Year Normalized Cost Inflated By 8%
12/31/2011 12/31/2012Prior Year Current Year
Statewide Average CMI, From Rate Sheet Page 2
Prior Year Normalization Ratio, From Prior Year Rate Sheet
0.9699
0.95221.0186
1.01201.0502
96.40Health Care Health Care Total
Direct Indirect
37.51 133.910.952291.79
70.99%37.51
29.01%
N/A129.30
N/A
1.07021.1270
1.05311.02930.9496
95.61 38.90 134.511.0531
108.75 42.01 150.76
100.69 38.90 139.59108.00% 108.00%
129.30
108.75 42.01 150.76
96.40 37.51 133.91
N/A N/A
N/A
<- changes every year on 07/01/xxxx
<- same for each rate driven by same cost report
<- statewide average CMI/facility-wide average CMI
<- medicaid average CMI/facility-wide average CMI
<- facility-wide average CMI/statewide average CMI
inverses; driven by change
<- in theory, this would be rate if
Filler
Calculation Of Health Care Allowable Per Diem Cost
in statewide average at07/01/xxxx (Note 1)
equaled statewide average CMIfacility-wide average CMI
07/01/2013Rate Effective Date:
Myers and Stauffer LCColorado Medicaid
Schedule Of Core Components Reimbursement Rate
100.00%
Run On 06/19/2014Page 3

Allison Care Center
07/01/2013
Number Of Beds As Of 12/31/2011 93 366 34,038No Current Period ChangesBed Days Available 366 34,038Bed Days Per Schedule MDifference (Adjustment) 0
34,038
Date OfAmount
Days In Bed DaysChange Period Available
Description Date Change Amount
6393427201/01/2012 - 12/31/2012
None
Provider Name:Provider Number:Cost Report Period:Rate Effective Date:
In Service Licensure
Bed Days Available & Number Of Beds
Listing Of Current Fair Rental Value (FRV) Additions & Deletions
Myers and Stauffer LCColorado Medicaid
Schedule Of Core Components Reimbursement Rate
Original Related To
$0
Calculate Bed Days Available
Calculate Number Of BedsNumberOf Beds
Bed Days AvailableDivided By: Days In PeriodWeighted Average Number Of Beds
34,038366
93.00
Run On 06/19/2014Page 4

Allison Care Center6393427201/01/2012 - 12/31/20121660 Allison StLakewood, CO 80214
Myers and Stauffer LC
93.0030,285
34,03889.0%
07/01/2013
Patient Days:
Colorado Medicaid
Provider Name:Provider Number:Cost Report Period:Address:City/State/ZIP:
Bed Days:Occupancy:
Beds:Rate Effective Date:
Medicaid Days: 20,937
Schedule Of Core Components Reimbursement RateRun On 06/19/2014Page 749
Fair Rental Value (FRV) RateTotal Appraisal Value of FRV Property $4,634,000
Lesser Of: Base Value Or Maximum Allowable
Thru RED 07/01/2011: 1.14516420 x $4,840,000After RED 07/01/2011: 1.02252870 x $1,300
Maximum Allowable: 93.00 Beds x $93,079 Base Rate
After RED 07/01/2012: 1.00338260 x $0After RED 07/01/2013: 1.00000000 x $0Base Value $5,543,924
$8,656,347$5,543,924
$457,374
$457,374
0.08250
$14.93
Administration & General Rate
$64.45Administration & General Per Diem Rate
Adjustment For FRV Additions/Construction Index:
Times: Rental RateAnnual Fair Rental Allowable
Fair Rental Allowance This PeriodTimes: Annualizer For Cost Report Period: 366 / 366 Days 1.0000000000
30,285Imputed Patient Days: 93.00 Beds x 366 Days x 90% 30,634
30,634Greater Of: Actual Or Imputed Patient Days
Fair Rental Value Per Diem Rate
$64.4507/01/2013 Price (61 Beds Or More)
A:
B:
A/B:
$1,329$0$0
$5,542,595
Actual Patient Days
$64.45
$42.81
Greater Of: A&G Price Or Hold Harmless (HH) Rate
HH: 06/30/2008 Per Diem Rate (05/01/2008 Rate)$4.33HH: Management Fee
$47.14HH: Per Diem Rate Plus Management Fee
Health Care Rate
DirectHealth Care
IndirectHealth Care
$2,919,435$1,135,861
Total Direct Health Care
$129.71 $50.48$96.40 $37.51
$96.68 $37.51
$99.30 $38.53
1.0029
Health Care Per Diem Rates
Facility-Specific Maximum (Page 2)
Times: Medicaid Acuity RatioReimbursable Per Diem
$37.51$96.40Per Diem Cost
Lesser Of: Per Diem Cost Or Maximum
1.027091633 1.027091633Times: Inflation Factor (Page 2)
30,285Divided By: Actual Patient Days
$99.30 $38.53Inflation-Adjusted Reimbursable Per Diem
N/A
$4,055,296Total Health Care
$422,680$2,496,755
A:B:
D (A+B):C:
Total Indirect Health CareC-D:
$2,883,410$488,137
Divided By: Total Health Care Wages$2,496,755Direct Health Care Wages
Times: Total Health Care Payroll Taxes & BenefitsDirect Health Care Payroll Taxes & Benefits
$37.51$96.40Allowable Per Diem Cost (Page 3)
Direct Health Care (MED-13 Lines 1-5)
$217.21Per Diem Reimbursement Rate+ =+ ++
Revision to Appraisal Value of FRV Property $4,840,000$206,000

RED 07/01/2013
Statewide Average CMI At 07/01/2013
01/01/2013 0.9955
07/01/2013
Case Mix Calculations - Acuity Information Used In Rate SettingCost Report Normalization, Medicaid &
PictureDates Wide CMI
Facility-Pictures
CMI
04/01/2012 0.9904 01/01/201304/01/2013
1.0181
Medicaid
1.0103
1.0211
DirectNursing Care
Total
Per Diem
$96.400.9635$92.8871.23%
$124.971.0379
$129.71
28.77%$50.48
$50.48
N/A
N/A
$133.91
$130.39
$175.45
$180.19
N/A
N/A
07/01/2013 - 06/30/2014Rate Effective Dates
Facility-Specific Direct & Other Health Care MaximumsTimes The Facility Specific Acuity RatioDistribution Of Overall Health Care MaximumPercentage Of Total
Times The Normalization RatioNormalized Facility Health Care Costs
Health MaximumOther
Per Diem Cost (Page 1)
100.00%
$37.51
$37.51
Inflation Factors
0.9809
0.96351.0181
1.00291.0379
07/01/2012 1.04041.046210/01/2012
1.0319
Allison Care Center6393427201/01/2012 - 12/31/2012
Average
Average
CMI
Provider Name:Provider Number:Cost Report Period:
Facility-Specific RatiosPeriod CMI Used In Rate
Facility-Wide Average CMI
Facility-Specific Ratio (Facility/Statewide)Medicaid Ratio (Medicaid/Facility)Normalization Ratio (Statewide/Facility)
07/01/2013Rate Effective Date:
Schedule Of Core Components Reimbursement Rate
Medicaid Acuity
Case Mix Calculations - Facility Specific Health Care Maximum
Divided By: 06/30/2012 Midpoint Of Cost Report Period (01/01/2012 - 12/31/2012) Inflation IndexInflation Factor Used In Health Care Rate Setting
1.2891.255
1.027091633
08/31/2013 Midpoint Of Rate Period (07/01/2013 - 10/31/2013) Inflation Index
Myers and Stauffer LCColorado MedicaidRun On 06/19/2014
Page 750

Allison Care Center6393427201/01/2012 - 12/31/2012
Provider Name:Provider Number:Cost Report Period:
Divided By Facility-Wide Average CMI, From Rate Sheet Page 2Normalization Ratio, From Rate Sheet Page 2Medicaid Ratio, From Rate Sheet Page 2Facility Specific Ratio, From Rate Sheet Page 2
Current Year Per Diem Cost, From Rate Sheet Page 2Normalization Ratio, From Rate Sheet Page 2Current Year Normalized Cost, From Rate Sheet Page 2Current Year Percentage Of Total, From Rate Sheet Page 2
Prior Year Normalized Cost Inflated By 8%, From Box Below
Lesser Of The Two
Allowable Per Diem Cost, To Rate Sheet Page 1
Prior Year Per Diem Cost, From Prior Year Rate Sheet
Prior Year Normalized Cost, From Prior Year Rate SheetInflation 01/01/2012-12/31/2012Prior Year Normalized Cost Inflated
Calculate Prior Year Normalized Cost Inflated By 8%
12/31/2011 12/31/2012Prior Year Current Year
Statewide Average CMI, From Rate Sheet Page 2
Prior Year Normalization Ratio, From Prior Year Rate Sheet
0.9809
0.96351.0181
1.00291.0379
96.40Health Care Health Care Total
Direct Indirect
37.51 133.910.963592.88
71.23%37.51
28.77%
N/A130.39
N/A
1.07021.1270
1.05311.02930.9496
95.61 38.90 134.511.0531
108.75 42.01 150.76
100.69 38.90 139.59108.00% 108.00%
130.39
108.75 42.01 150.76
96.40 37.51 133.91
N/A N/A
N/A
<- changes every year on 07/01/xxxx
<- same for each rate driven by same cost report
<- statewide average CMI/facility-wide average CMI
<- medicaid average CMI/facility-wide average CMI
<- facility-wide average CMI/statewide average CMI
inverses; driven by change
<- in theory, this would be rate if
Filler
Calculation Of Health Care Allowable Per Diem Cost
in statewide average at07/01/xxxx (Note 1)
equaled statewide average CMIfacility-wide average CMI
07/01/2013Rate Effective Date:
Myers and Stauffer LCColorado Medicaid
Schedule Of Core Components Reimbursement Rate
100.00%
Run On 06/19/2014Page 751

Allison Care Center
07/01/2013
Number Of Beds As Of 12/31/2011 93 366 34,038No Current Period ChangesBed Days Available 366 34,038Bed Days Per Schedule MDifference (Adjustment) 0
34,038
Date OfAmount
Days In Bed DaysChange Period Available
Description Date Change Amount
6393427201/01/2012 - 12/31/2012
None
Provider Name:Provider Number:Cost Report Period:Rate Effective Date:
In Service Licensure
Bed Days Available & Number Of Beds
Listing Of Current Fair Rental Value (FRV) Additions & Deletions
Myers and Stauffer LCColorado Medicaid
Schedule Of Core Components Reimbursement Rate
Original Related To
$0
Calculate Bed Days Available
Calculate Number Of BedsNumberOf Beds
Bed Days AvailableDivided By: Days In PeriodWeighted Average Number Of Beds
34,038366
93.00
Run On 06/19/2014Page 752