Embed Size (px)
Citation preview
Colorado Child Health Plan Plus 2018 Member Satisfaction Report
Colorado Department of Health Care Policy & Financing
September 2018
2018 Child Health Plan Plus Member Satisfaction Report for Health First Colorado Page i State of Colorado CO2017-18_CAHPS_CHP+_SatisfactionRpt_0918
Table of Contents
1. Executive Summary ....................................................................................................................... 1-1
Performance Highlights ................................................................................................................... 1-1
NCQA Comparisons .................................................................................................................. 1-2
Trend Analysis ........................................................................................................................... 1-3
Plan Comparisons ....................................................................................................................... 1-4
Priority Assignments .................................................................................................................. 1-5
2. Results .............................................................................................................................................. 2-1
Survey Administration and Response Rates .................................................................................... 2-1
Survey Administration ............................................................................................................... 2-1
Response Rates ........................................................................................................................... 2-2
Child and Respondent Demographics .............................................................................................. 2-3
NCQA Comparisons ........................................................................................................................ 2-5
Summary of NCQA Comparisons Results ................................................................................. 2-7
Trend Analysis ................................................................................................................................. 2-8
Global Ratings .......................................................................................................................... 2-10
Composite Measures ................................................................................................................ 2-14
Individual Item Measures ......................................................................................................... 2-19
Summary of Trend Analysis Results ........................................................................................ 2-21
Plan Comparisons ........................................................................................................................... 2-22
Summary of Plan Comparisons Results ................................................................................... 2-23
Supplemental Items ........................................................................................................................ 2-24
Talked About Child’s Behavior ............................................................................................... 2-25
Talked About Household Problems That Might Affect Child ................................................. 2-25
Received Information About After-Hours Care ....................................................................... 2-26
Access to After-Hours Care ..................................................................................................... 2-26
Number of Days Waiting to See Health Provider .................................................................... 2-27
3. Conclusions and Recommendations ............................................................................................. 3-1
Plan-Specific Priority Assignments ................................................................................................. 3-1
Global Ratings ............................................................................................................................ 3-3
Composite Measures .................................................................................................................. 3-5
Individual Item Measure ............................................................................................................ 3-7
Conclusions ...................................................................................................................................... 3-7
Low Priority Assignments .......................................................................................................... 3-7
High Priority Assignments ......................................................................................................... 3-7
General Recommendations .............................................................................................................. 3-7
Quality Improvement Recommendations ........................................................................................ 3-8
Perform Root Cause Analyses ................................................................................................... 3-8
Conduct Frequent Assessments of Targeted Interventions ........................................................ 3-8
Facilitate Coordinated Care ........................................................................................................ 3-9
Customer Service ....................................................................................................................... 3-9
Access to Care ............................................................................................................................ 3-9
TABLE OF CONTENTS
2018 Child Health Plan Plus Member Satisfaction Report for Health First Colorado Page ii State of Colorado CO2017-18_CAHPS_CHP+_SatisfactionRpt_0918
Key Drivers of Satisfaction Analysis ....................................................................................... 3-10
Accountability and Improvement of Care ...................................................................................... 3-11
4. Reader’s Guide ............................................................................................................................... 4-1
Survey Administration ..................................................................................................................... 4-1
Survey Overview ........................................................................................................................ 4-1
Sampling Procedures .................................................................................................................. 4-3
Survey Protocol .......................................................................................................................... 4-3
Methodology .................................................................................................................................... 4-5
Response Rates ........................................................................................................................... 4-5
Child and Respondent Demographics ........................................................................................ 4-5
NCQA Comparisons .................................................................................................................. 4-6
Trend Analysis ........................................................................................................................... 4-7
Weighting ................................................................................................................................... 4-9
Plan Comparisons ....................................................................................................................... 4-9
Limitations and Cautions ............................................................................................................... 4-10
Case-Mix Adjustment .............................................................................................................. 4-10
Non-Response Bias .................................................................................................................. 4-10
Causal Inferences ..................................................................................................................... 4-11
Quality Improvement References .................................................................................................. 4-11
5. Survey Instrument .......................................................................................................................... 5-1
2018 Child Health Plan Plus Member Satisfaction Report for Health First Colorado Page 1-1
State of Colorado CO2017-18_CAHPS_CHP+_SatisfactionRpt_0918
1. Executive Summary
Colorado’s Quality Strategy includes the administration of satisfaction surveys to members enrolled in
the following Child Health Plan Plus (CHP+) health plans: Colorado Access, Denver Health Medical
Plan (DHMP), Friday Health Plans of Colorado (FHP), Kaiser Permanente (Kaiser), and Rocky
Mountain Health Plans (RMHP).1-1 The Colorado Department of Health Care Policy & Financing (the
Department) contracts with Health Services Advisory Group, Inc. (HSAG) to administer and report the
results of the Consumer Assessment of Healthcare Providers and Systems (CAHPS®) Health Plan
Surveys.1-2 The goal of the CAHPS Health Plan Surveys is to provide performance feedback that is
actionable and will aid in improving overall member satisfaction.
The standardized survey instrument selected was the CAHPS 5.0 Child Medicaid Health Plan Survey
with the Healthcare Effectiveness Data and Information Set (HEDIS®) supplemental item set without the
Children with Chronic Conditions (CCC) measurement set.1-3 The parents or caretakers of child
members from the CHP+ health plans completed the surveys from March to June 2018.
Performance Highlights
The Results section of this report details the CAHPS results for the CHP+ health plans. The following is
a summary of the CHP+ CAHPS performance highlights for each health plan. The performance
highlights are categorized into the four major types of analyses performed on the CHP+ CAHPS data:
• National Committee for Quality Assurance (NCQA) Comparisons
• Trend Analysis
• Plan Comparisons
• Priority Assignments
1-1 Colorado Choice was acquired by FHP in November 2017. 1-2 CAHPS® is a registered trademark of the Agency for Healthcare Research and Quality (AHRQ). 1-3 HEDIS® is a registered trademark of the National Committee for Quality Assurance (NCQA).
EXECUTIVE SUMMARY
2018 Child Health Plan Plus Member Satisfaction Report for Health First Colorado Page 1-2
State of Colorado CO2017-18_CAHPS_CHP+_SatisfactionRpt_0918
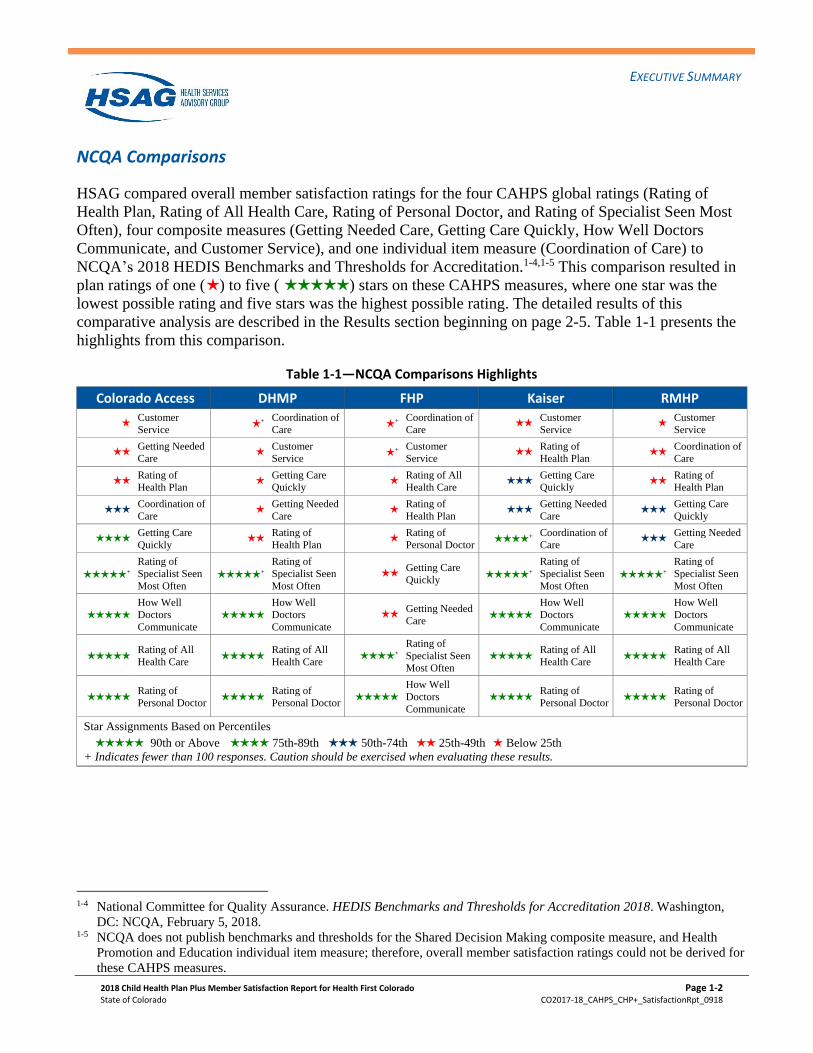
NCQA Comparisons
HSAG compared overall member satisfaction ratings for the four CAHPS global ratings (Rating of
Health Plan, Rating of All Health Care, Rating of Personal Doctor, and Rating of Specialist Seen Most
Often), four composite measures (Getting Needed Care, Getting Care Quickly, How Well Doctors
Communicate, and Customer Service), and one individual item measure (Coordination of Care) to
NCQA’s 2018 HEDIS Benchmarks and Thresholds for Accreditation.1-4,1-5 This comparison resulted in
plan ratings of one (H ) to five (HHHHH ) stars on these CAHPS measures, where one star was the
lowest possible rating and five stars was the highest possible rating. The detailed results of this
comparative analysis are described in the Results section beginning on page 2-5. Table 1-1 presents the
highlights from this comparison.
Table 1-1—NCQA Comparisons Highlights
Colorado Access DHMP FHP Kaiser RMHP
H Customer
Service H +
Coordination of
Care H +
Coordination of
Care HH
Customer
Service H
Customer
Service
HH Getting Needed
Care H
Customer
Service H +
Customer
Service HH
Rating of
Health Plan HH
Coordination of
Care
HH Rating of
Health Plan H
Getting Care
Quickly H
Rating of All
Health Care HHH
Getting Care
Quickly HH
Rating of
Health Plan
HHH Coordination of
Care H
Getting Needed
Care H
Rating of
Health Plan HHH
Getting Needed
Care HHH
Getting Care
Quickly
HHHH Getting Care
Quickly HH
Rating of
Health Plan H
Rating of
Personal Doctor HHHH +
Coordination of
Care HHH
Getting Needed
Care
HHHHH +
Rating of
Specialist Seen
Most Often
HHHHH +
Rating of
Specialist Seen
Most Often
HH Getting Care
Quickly
HHHHH +
Rating of
Specialist Seen
Most Often
HHHHH +
Rating of
Specialist Seen
Most Often
HHHHH
How Well
Doctors
Communicate
HHHHH
How Well
Doctors
Communicate
HH Getting Needed
Care
HHHHH
How Well
Doctors
Communicate
HHHHH
How Well
Doctors
Communicate
HHHHH
Rating of All
Health Care
HHHHH
Rating of All
Health Care HHHH +
Rating of
Specialist Seen
Most Often
HHHHH
Rating of All
Health Care
HHHHH
Rating of All
Health Care
HHHHH
Rating of
Personal Doctor
HHHHH
Rating of
Personal Doctor
HHHHH
How Well
Doctors
Communicate
HHHHH
Rating of
Personal Doctor
HHHHH
Rating of
Personal Doctor
Star Assignments Based on Percentiles
HHHHH 90th or Above HHHH 75th-89th HHH 50th-74th HH 25th-49th H Below 25th
+ Indicates fewer than 100 responses. Caution should be exercised when evaluating these results.
1-4 National Committee for Quality Assurance. HEDIS Benchmarks and Thresholds for Accreditation 2018. Washington,
DC: NCQA, February 5, 2018. 1-5 NCQA does not publish benchmarks and thresholds for the Shared Decision Making composite measure, and Health
Promotion and Education individual item measure; therefore, overall member satisfaction ratings could not be derived for
these CAHPS measures.
EXECUTIVE SUMMARY
2018 Child Health Plan Plus Member Satisfaction Report for Health First Colorado Page 1-3
State of Colorado CO2017-18_CAHPS_CHP+_SatisfactionRpt_0918
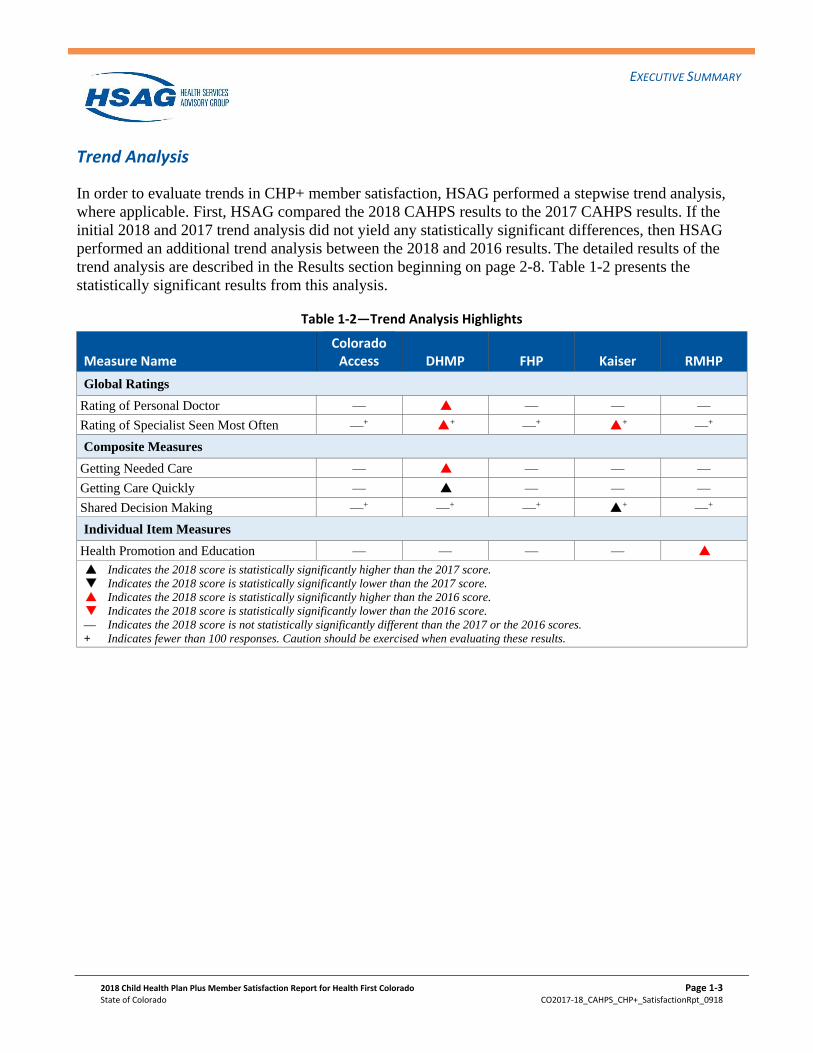
Trend Analysis
In order to evaluate trends in CHP+ member satisfaction, HSAG performed a stepwise trend analysis,
where applicable. First, HSAG compared the 2018 CAHPS results to the 2017 CAHPS results. If the
initial 2018 and 2017 trend analysis did not yield any statistically significant differences, then HSAG
performed an additional trend analysis between the 2018 and 2016 results. The detailed results of the
trend analysis are described in the Results section beginning on page 2-8. Table 1-2 presents the
statistically significant results from this analysis.
Table 1-2—Trend Analysis Highlights
Measure Name Colorado
Access DHMP FHP Kaiser RMHP
Global Ratings
Rating of Personal Doctor — P6 — — —
Rating of Specialist Seen Most Often —+ P6+ —+ P6
+ —+
Composite Measures
Getting Needed Care — P6 — — —
Getting Care Quickly — P7 — — —
Shared Decision Making —+ —+ —+ P7+ —+
Individual Item Measures
Health Promotion and Education — — — — P6
P7 Indicates the 2018 score is statistically significantly higher than the 2017 score.
Q7 Indicates the 2018 score is statistically significantly lower than the 2017 score.
P6 Indicates the 2018 score is statistically significantly higher than the 2016 score.
Q6 Indicates the 2018 score is statistically significantly lower than the 2016 score.
— Indicates the 2018 score is not statistically significantly different than the 2017 or the 2016 scores.
+ Indicates fewer than 100 responses. Caution should be exercised when evaluating these results.
EXECUTIVE SUMMARY
2018 Child Health Plan Plus Member Satisfaction Report for Health First Colorado Page 1-4
State of Colorado CO2017-18_CAHPS_CHP+_SatisfactionRpt_0918
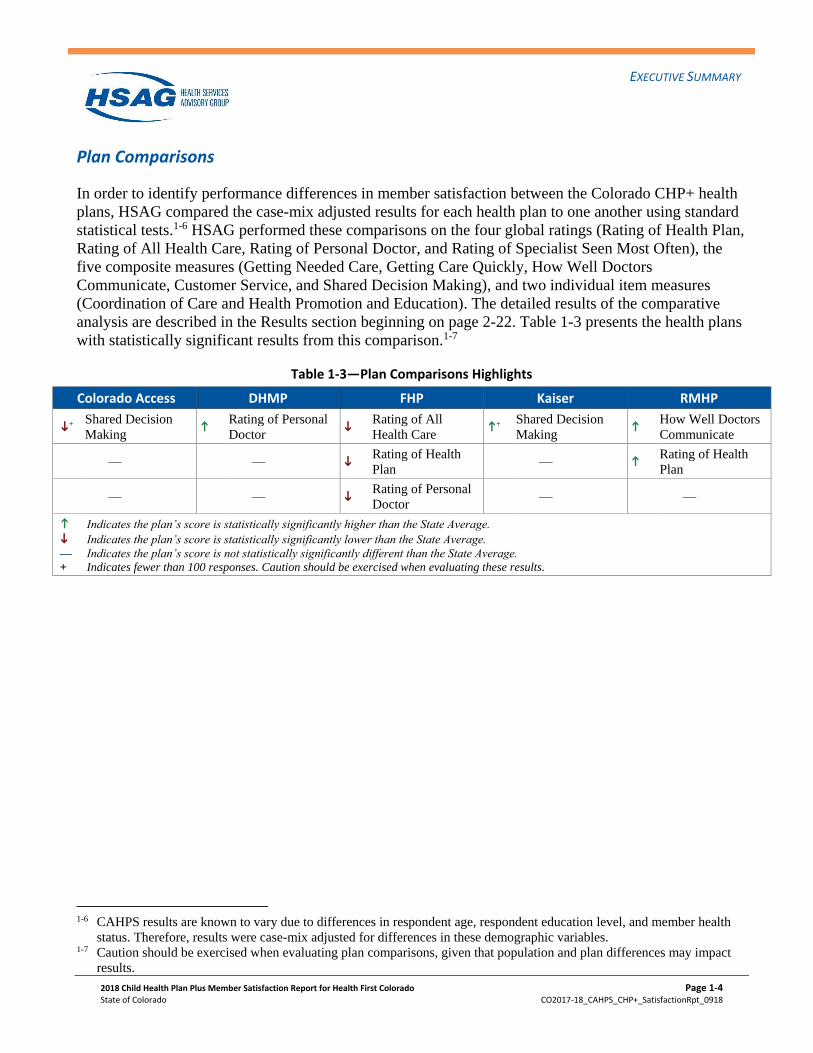
Plan Comparisons
In order to identify performance differences in member satisfaction between the Colorado CHP+ health
plans, HSAG compared the case-mix adjusted results for each health plan to one another using standard
statistical tests.1-6 HSAG performed these comparisons on the four global ratings (Rating of Health Plan,
Rating of All Health Care, Rating of Personal Doctor, and Rating of Specialist Seen Most Often), the
five composite measures (Getting Needed Care, Getting Care Quickly, How Well Doctors
Communicate, Customer Service, and Shared Decision Making), and two individual item measures
(Coordination of Care and Health Promotion and Education). The detailed results of the comparative
analysis are described in the Results section beginning on page 2-22. Table 1-3 presents the health plans
with statistically significant results from this comparison.1-7
Table 1-3—Plan Comparisons Highlights
Colorado Access DHMP FHP Kaiser RMHP
i+
Shared Decision
Making k
Rating of Personal
Doctor i
Rating of All
Health Care k
+ Shared Decision
Making k
How Well Doctors
Communicate
— — i Rating of Health
Plan — k
Rating of Health
Plan
— — i Rating of Personal
Doctor — —
k Indicates the plan’s score is statistically significantly higher than the State Average.
i Indicates the plan’s score is statistically significantly lower than the State Average.
— Indicates the plan’s score is not statistically significantly different than the State Average.
+ Indicates fewer than 100 responses. Caution should be exercised when evaluating these results.
1-6 CAHPS results are known to vary due to differences in respondent age, respondent education level, and member health
status. Therefore, results were case-mix adjusted for differences in these demographic variables. 1-7 Caution should be exercised when evaluating plan comparisons, given that population and plan differences may impact
results.
EXECUTIVE SUMMARY
2018 Child Health Plan Plus Member Satisfaction Report for Health First Colorado Page 1-5
State of Colorado CO2017-18_CAHPS_CHP+_SatisfactionRpt_0918
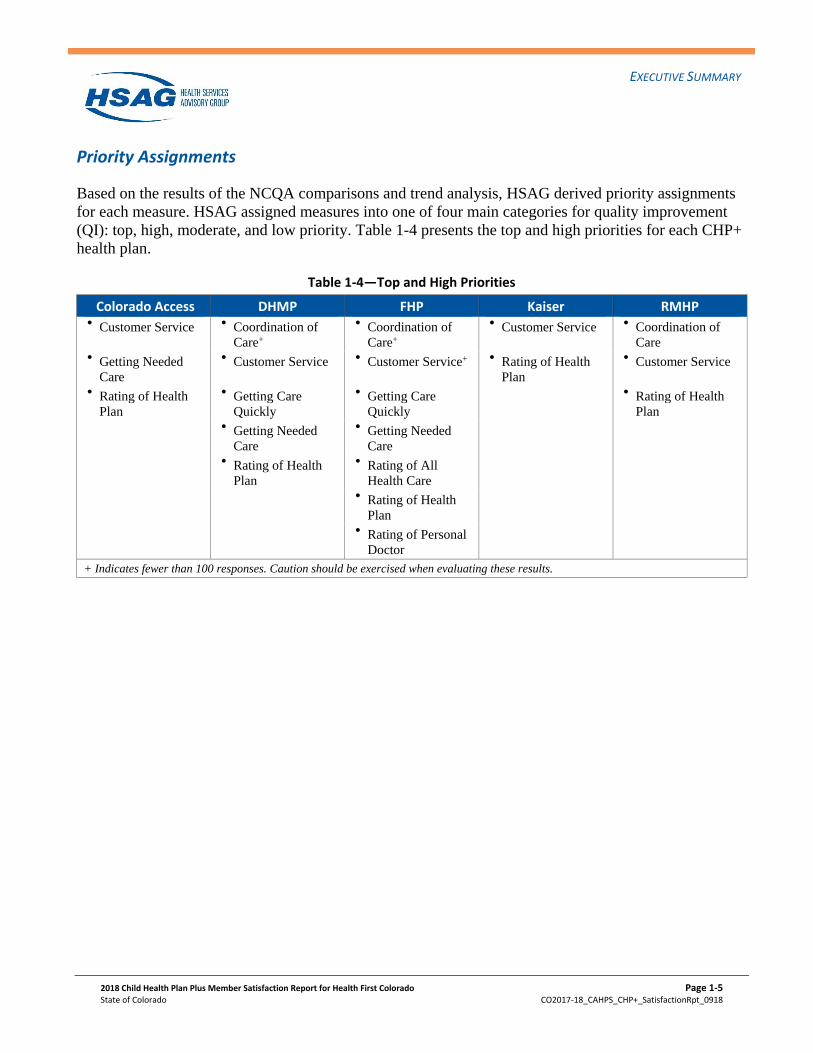
Priority Assignments
Based on the results of the NCQA comparisons and trend analysis, HSAG derived priority assignments
for each measure. HSAG assigned measures into one of four main categories for quality improvement
(QI): top, high, moderate, and low priority. Table 1-4 presents the top and high priorities for each CHP+
health plan.
Table 1-4—Top and High Priorities
Colorado Access DHMP FHP Kaiser RMHP
Customer Service
Coordination of
Care+
Coordination of
Care+
Customer Service
Coordination of
Care
Getting Needed
Care
Customer Service
Customer Service+
Rating of Health
Plan
Customer Service
Rating of Health
Plan
Getting Care
Quickly
Getting Care
Quickly
Rating of Health
Plan
Getting Needed
Care
Getting Needed
Care
Rating of Health
Plan
Rating of All
Health Care
Rating of Health
Plan
Rating of Personal
Doctor
+ Indicates fewer than 100 responses. Caution should be exercised when evaluating these results.
2018 Child Health Plan Plus Member Satisfaction Report for Health First Colorado Page 2-1
State of Colorado CO2017-18_CAHPS_CHP+_SatisfactionRpt_0918
2. Results
Survey Administration and Response Rates
Survey Administration
The standard NCQA HEDIS Specifications for Survey Measures require a sample size of 1,650
members for the CAHPS 5.0 Child Medicaid Health Plan Survey.2-1 Members eligible for sampling
included those who were enrolled in Colorado Access, DHMP, FHP, Kaiser, and RMHP at the time the
sample was drawn, and who were continuously enrolled in the health plan for at least five of the last six
months (July through December) of 2017. Child members eligible for sampling included those who
were 17 years of age or younger as of December 31, 2017.
Colorado Access, DHMP, Kaiser, and RMHP met the sample size requirements of 1,650. However, FHP
did not meet the minimum sample size criteria. HSAG followed historical NCQA protocol where only
one survey can be sent to each household; therefore, after adjusting for duplicate addresses, the actual
sample size for FHP was 1,166. Oversampling was not performed for any of the CHP+ health plans.
The survey administration protocol was designed to achieve a high response rate from members, thus
minimizing the potential effects of non-response bias. The survey process allowed for two methods by
which surveys could be completed. The first phase, or mail phase, consisted of a survey being mailed to
the sampled members. For CHP+ health plans, those members who were identified as Spanish-speaking
through administrative data were mailed a Spanish version of the survey. The cover letter provided with
the Spanish version of the CAHPS questionnaire included a text box with a toll-free number that
members could call to request a survey in another language (i.e., English). Members that were not
identified as Spanish-speaking received an English version of the survey. The cover letter included with
the English version of the survey had a Spanish cover letter on the back side informing members that
they could call the toll-free number to request a Spanish version of the CAHPS questionnaire. A
reminder postcard was sent to all non-respondents, followed by a second survey mailing and reminder
postcard. The second phase, or telephone phase, consisted of Computer Assisted Telephone
Interviewing (CATI) for sampled members who had not mailed in a completed survey. A maximum of
six CATI calls was made to each non-respondent. Additional information on the survey protocol is
included in the Reader’s Guide section beginning on page 4-3.
2-1 National Committee for Quality Assurance. HEDIS® 2018, Volume 3: Specifications for Survey Measures. Washington,
DC: NCQA; 2017.
RESULTS
2018 Child Health Plan Plus Member Satisfaction Report for Health First Colorado Page 2-2
State of Colorado CO2017-18_CAHPS_CHP+_SatisfactionRpt_0918
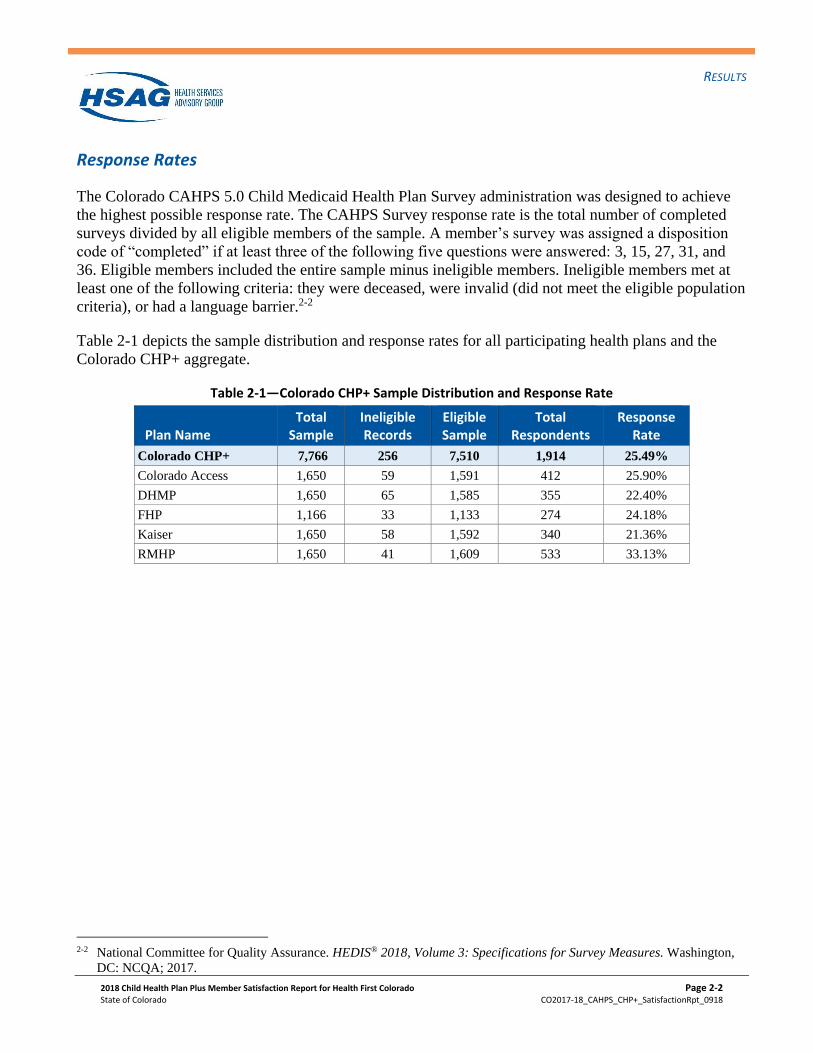
Response Rates
The Colorado CAHPS 5.0 Child Medicaid Health Plan Survey administration was designed to achieve
the highest possible response rate. The CAHPS Survey response rate is the total number of completed
surveys divided by all eligible members of the sample. A member’s survey was assigned a disposition
code of “completed” if at least three of the following five questions were answered: 3, 15, 27, 31, and
36. Eligible members included the entire sample minus ineligible members. Ineligible members met at
least one of the following criteria: they were deceased, were invalid (did not meet the eligible population
criteria), or had a language barrier.2-2
Table 2-1 depicts the sample distribution and response rates for all participating health plans and the
Colorado CHP+ aggregate.
Table 2-1—Colorado CHP+ Sample Distribution and Response Rate
Plan Name Total
Sample Ineligible Records
Eligible Sample
Total Respondents
Response Rate
Colorado CHP+ 7,766 256 7,510 1,914 25.49%
Colorado Access 1,650 59 1,591 412 25.90%
DHMP 1,650 65 1,585 355 22.40%
FHP 1,166 33 1,133 274 24.18%
Kaiser 1,650 58 1,592 340 21.36%
RMHP 1,650 41 1,609 533 33.13%
2-2 National Committee for Quality Assurance. HEDIS® 2018, Volume 3: Specifications for Survey Measures. Washington,
DC: NCQA; 2017.
RESULTS
2018 Child Health Plan Plus Member Satisfaction Report for Health First Colorado Page 2-3
State of Colorado CO2017-18_CAHPS_CHP+_SatisfactionRpt_0918
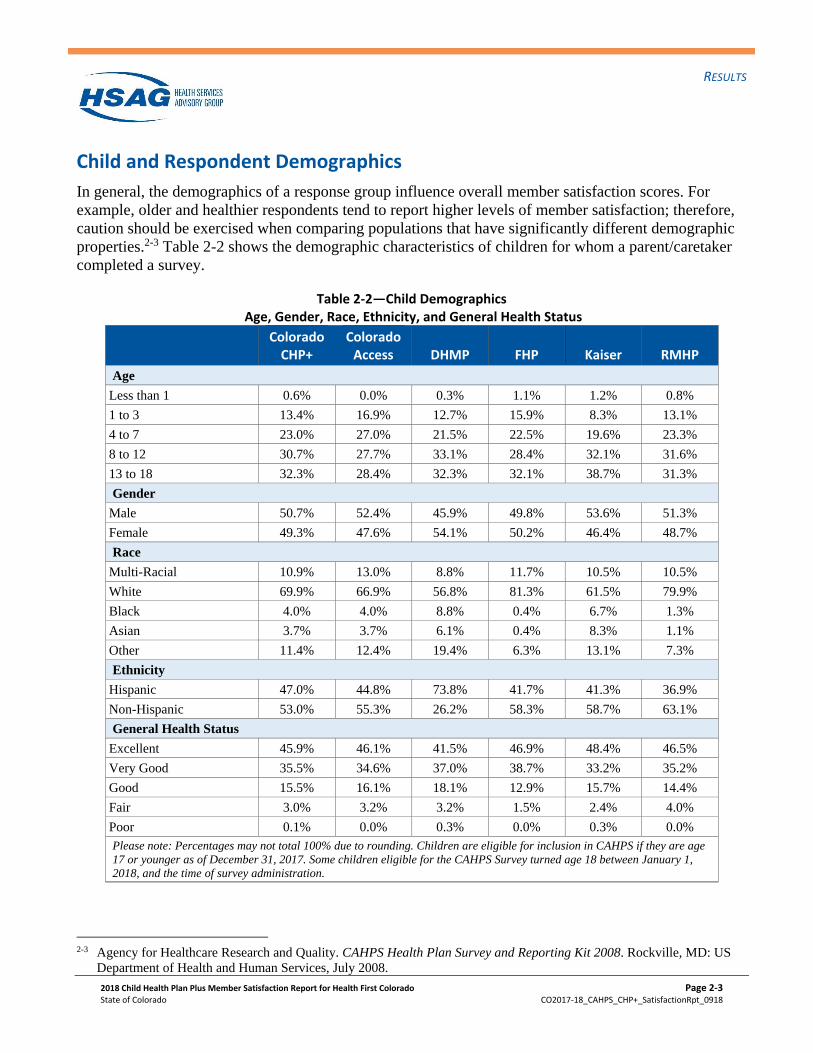
Child and Respondent Demographics
In general, the demographics of a response group influence overall member satisfaction scores. For
example, older and healthier respondents tend to report higher levels of member satisfaction; therefore,
caution should be exercised when comparing populations that have significantly different demographic
properties.2-3 Table 2-2 shows the demographic characteristics of children for whom a parent/caretaker
completed a survey.
Table 2-2—Child Demographics Age, Gender, Race, Ethnicity, and General Health Status
Colorado CHP+
Colorado Access DHMP FHP Kaiser RMHP
Age
Less than 1 0.6% 0.0% 0.3% 1.1% 1.2% 0.8%
1 to 3 13.4% 16.9% 12.7% 15.9% 8.3% 13.1%
4 to 7 23.0% 27.0% 21.5% 22.5% 19.6% 23.3%
8 to 12 30.7% 27.7% 33.1% 28.4% 32.1% 31.6%
13 to 18 32.3% 28.4% 32.3% 32.1% 38.7% 31.3%
Gender
Male 50.7% 52.4% 45.9% 49.8% 53.6% 51.3%
Female 49.3% 47.6% 54.1% 50.2% 46.4% 48.7%
Race
Multi-Racial 10.9% 13.0% 8.8% 11.7% 10.5% 10.5%
White 69.9% 66.9% 56.8% 81.3% 61.5% 79.9%
Black 4.0% 4.0% 8.8% 0.4% 6.7% 1.3%
Asian 3.7% 3.7% 6.1% 0.4% 8.3% 1.1%
Other 11.4% 12.4% 19.4% 6.3% 13.1% 7.3%
Ethnicity
Hispanic 47.0% 44.8% 73.8% 41.7% 41.3% 36.9%
Non-Hispanic 53.0% 55.3% 26.2% 58.3% 58.7% 63.1%
General Health Status
Excellent 45.9% 46.1% 41.5% 46.9% 48.4% 46.5%
Very Good 35.5% 34.6% 37.0% 38.7% 33.2% 35.2%
Good 15.5% 16.1% 18.1% 12.9% 15.7% 14.4%
Fair 3.0% 3.2% 3.2% 1.5% 2.4% 4.0%
Poor 0.1% 0.0% 0.3% 0.0% 0.3% 0.0%
Please note: Percentages may not total 100% due to rounding. Children are eligible for inclusion in CAHPS if they are age
17 or younger as of December 31, 2017. Some children eligible for the CAHPS Survey turned age 18 between January 1,
2018, and the time of survey administration.
2-3 Agency for Healthcare Research and Quality. CAHPS Health Plan Survey and Reporting Kit 2008. Rockville, MD: US
Department of Health and Human Services, July 2008.
RESULTS
2018 Child Health Plan Plus Member Satisfaction Report for Health First Colorado Page 2-4
State of Colorado CO2017-18_CAHPS_CHP+_SatisfactionRpt_0918
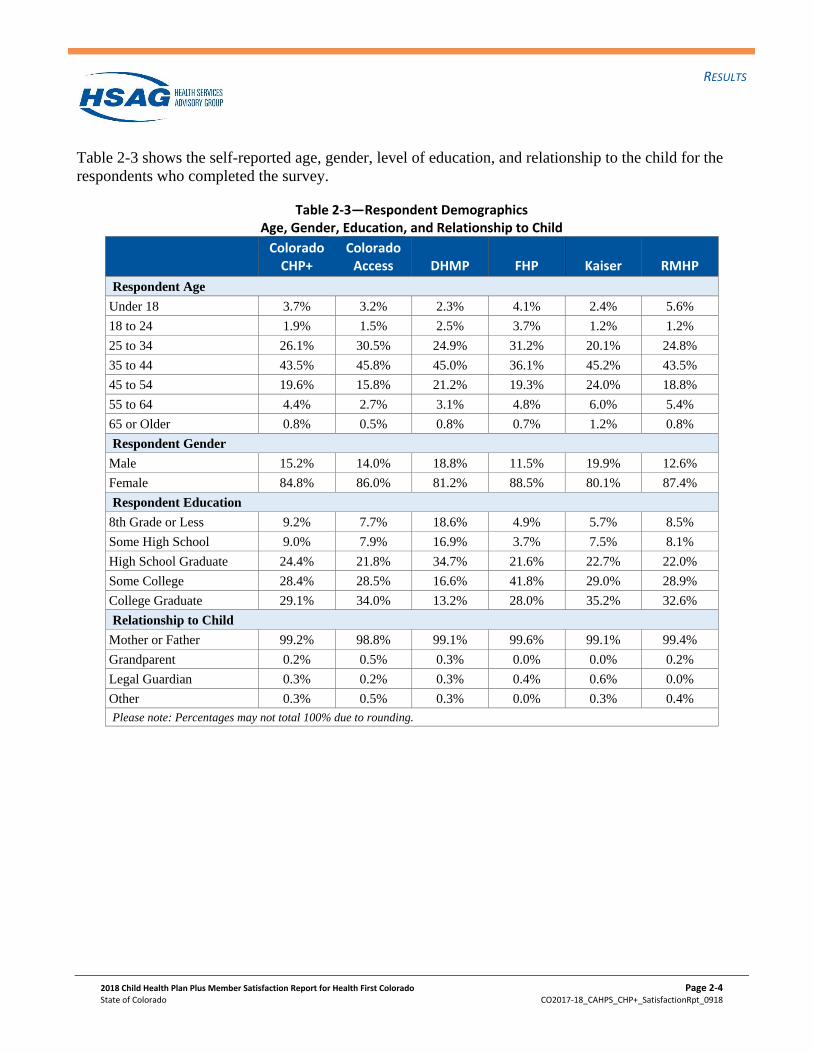
Table 2-3 shows the self-reported age, gender, level of education, and relationship to the child for the
respondents who completed the survey.
Table 2-3—Respondent Demographics Age, Gender, Education, and Relationship to Child
Colorado CHP+
Colorado Access DHMP FHP Kaiser RMHP
Respondent Age
Under 18 3.7% 3.2% 2.3% 4.1% 2.4% 5.6%
18 to 24 1.9% 1.5% 2.5% 3.7% 1.2% 1.2%
25 to 34 26.1% 30.5% 24.9% 31.2% 20.1% 24.8%
35 to 44 43.5% 45.8% 45.0% 36.1% 45.2% 43.5%
45 to 54 19.6% 15.8% 21.2% 19.3% 24.0% 18.8%
55 to 64 4.4% 2.7% 3.1% 4.8% 6.0% 5.4%
65 or Older 0.8% 0.5% 0.8% 0.7% 1.2% 0.8%
Respondent Gender
Male 15.2% 14.0% 18.8% 11.5% 19.9% 12.6%
Female 84.8% 86.0% 81.2% 88.5% 80.1% 87.4%
Respondent Education
8th Grade or Less 9.2% 7.7% 18.6% 4.9% 5.7% 8.5%
Some High School 9.0% 7.9% 16.9% 3.7% 7.5% 8.1%
High School Graduate 24.4% 21.8% 34.7% 21.6% 22.7% 22.0%
Some College 28.4% 28.5% 16.6% 41.8% 29.0% 28.9%
College Graduate 29.1% 34.0% 13.2% 28.0% 35.2% 32.6%
Relationship to Child
Mother or Father 99.2% 98.8% 99.1% 99.6% 99.1% 99.4%
Grandparent 0.2% 0.5% 0.3% 0.0% 0.0% 0.2%
Legal Guardian 0.3% 0.2% 0.3% 0.4% 0.6% 0.0%
Other 0.3% 0.5% 0.3% 0.0% 0.3% 0.4%
Please note: Percentages may not total 100% due to rounding.
RESULTS
2018 Child Health Plan Plus Member Satisfaction Report for Health First Colorado Page 2-5
State of Colorado CO2017-18_CAHPS_CHP+_SatisfactionRpt_0918
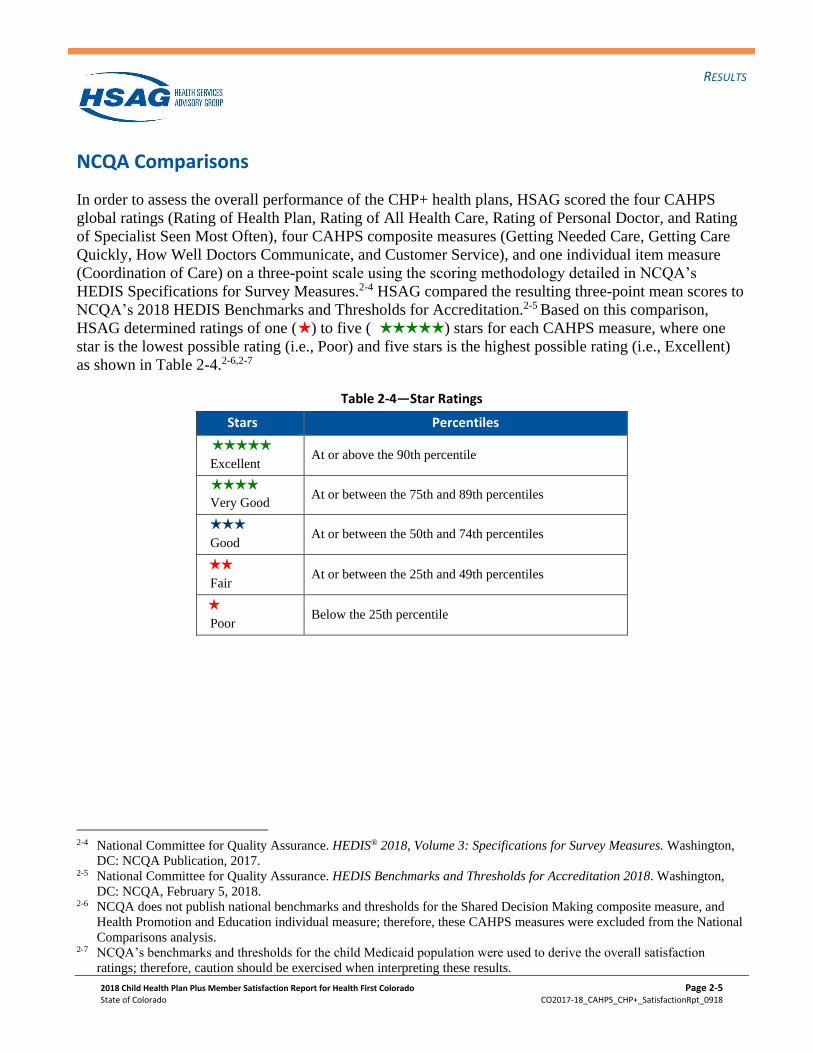
NCQA Comparisons
In order to assess the overall performance of the CHP+ health plans, HSAG scored the four CAHPS
global ratings (Rating of Health Plan, Rating of All Health Care, Rating of Personal Doctor, and Rating
of Specialist Seen Most Often), four CAHPS composite measures (Getting Needed Care, Getting Care
Quickly, How Well Doctors Communicate, and Customer Service), and one individual item measure
(Coordination of Care) on a three-point scale using the scoring methodology detailed in NCQA’s
HEDIS Specifications for Survey Measures.2-4 HSAG compared the resulting three-point mean scores to
NCQA’s 2018 HEDIS Benchmarks and Thresholds for Accreditation.2-5 Based on this comparison,
HSAG determined ratings of one (H ) to five (HHHHH ) stars for each CAHPS measure, where one
star is the lowest possible rating (i.e., Poor) and five stars is the highest possible rating (i.e., Excellent)
as shown in Table 2-4.2-6,2-7
Table 2-4—Star Ratings
Stars Percentiles
HHHHH Excellent
At or above the 90th percentile
HHHH
Very Good At or between the 75th and 89th percentiles
HHH
Good At or between the 50th and 74th percentiles
HH
Fair At or between the 25th and 49th percentiles
H Poor
Below the 25th percentile
2-4 National Committee for Quality Assurance. HEDIS® 2018, Volume 3: Specifications for Survey Measures. Washington,
DC: NCQA Publication, 2017. 2-5 National Committee for Quality Assurance. HEDIS Benchmarks and Thresholds for Accreditation 2018. Washington,
DC: NCQA, February 5, 2018. 2-6 NCQA does not publish national benchmarks and thresholds for the Shared Decision Making composite measure, and
Health Promotion and Education individual measure; therefore, these CAHPS measures were excluded from the National
Comparisons analysis. 2-7 NCQA’s benchmarks and thresholds for the child Medicaid population were used to derive the overall satisfaction
ratings; therefore, caution should be exercised when interpreting these results.
RESULTS
2018 Child Health Plan Plus Member Satisfaction Report for Health First Colorado Page 2-6
State of Colorado CO2017-18_CAHPS_CHP+_SatisfactionRpt_0918
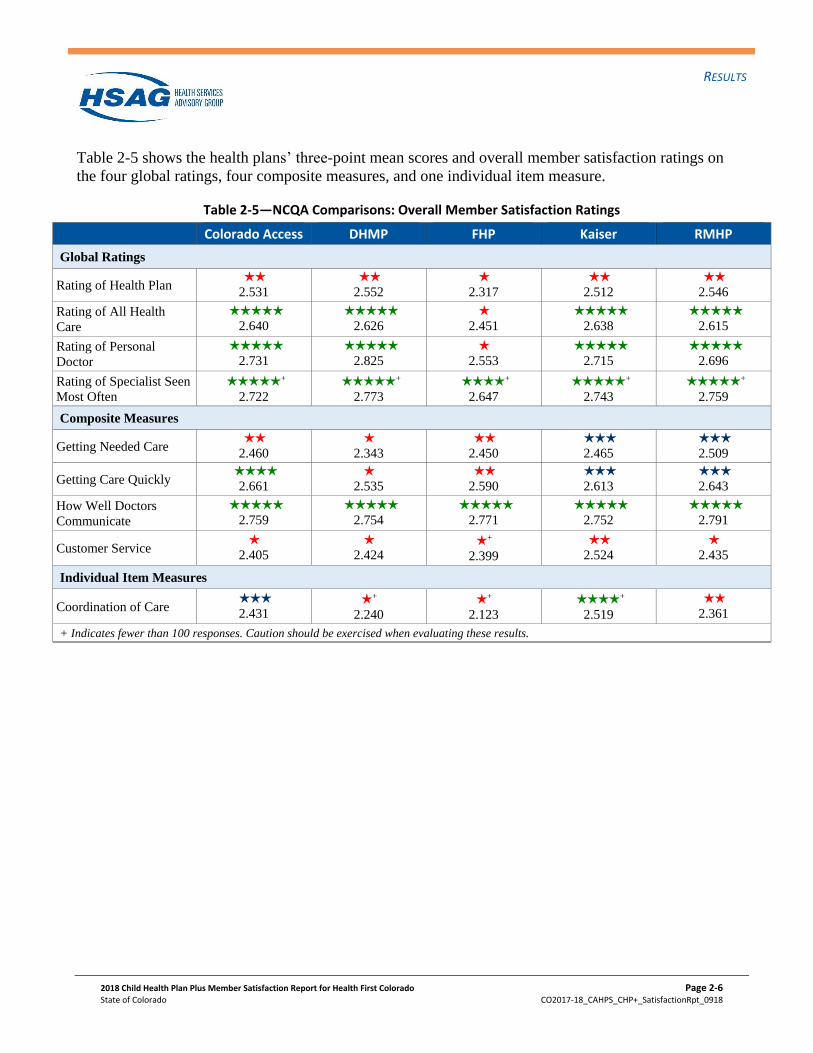
Table 2-5 shows the health plans’ three-point mean scores and overall member satisfaction ratings on
the four global ratings, four composite measures, and one individual item measure.
Table 2-5—NCQA Comparisons: Overall Member Satisfaction Ratings
Colorado Access DHMP FHP Kaiser RMHP
Global Ratings
Rating of Health Plan HH 2.531
HH 2.552
H 2.317
HH 2.512
HH 2.546
Rating of All Health
Care
HHHHH 2.640
HHHHH 2.626
H 2.451
HHHHH 2.638
HHHHH 2.615
Rating of Personal
Doctor
HHHHH 2.731
HHHHH 2.825
H 2.553
HHHHH 2.715
HHHHH 2.696
Rating of Specialist Seen
Most Often
HHHHH +
2.722
HHHHH +
2.773
HHHH +
2.647
HHHHH +
2.743
HHHHH +
2.759
Composite Measures
Getting Needed Care HH 2.460
H 2.343
HH 2.450
HHH 2.465
HHH 2.509
Getting Care Quickly HHHH
2.661 H
2.535 HH 2.590
HHH 2.613
HHH 2.643
How Well Doctors
Communicate
HHHHH 2.759
HHHHH 2.754
HHHHH 2.771
HHHHH 2.752
HHHHH 2.791
Customer Service H
2.405 H
2.424 H +
2.399
HH 2.524
H 2.435
Individual Item Measures
Coordination of Care HHH 2.431
H +
2.240
H +
2.123
HHHH +
2.519
HH 2.361
+ Indicates fewer than 100 responses. Caution should be exercised when evaluating these results.
RESULTS
2018 Child Health Plan Plus Member Satisfaction Report for Health First Colorado Page 2-7
State of Colorado CO2017-18_CAHPS_CHP+_SatisfactionRpt_0918
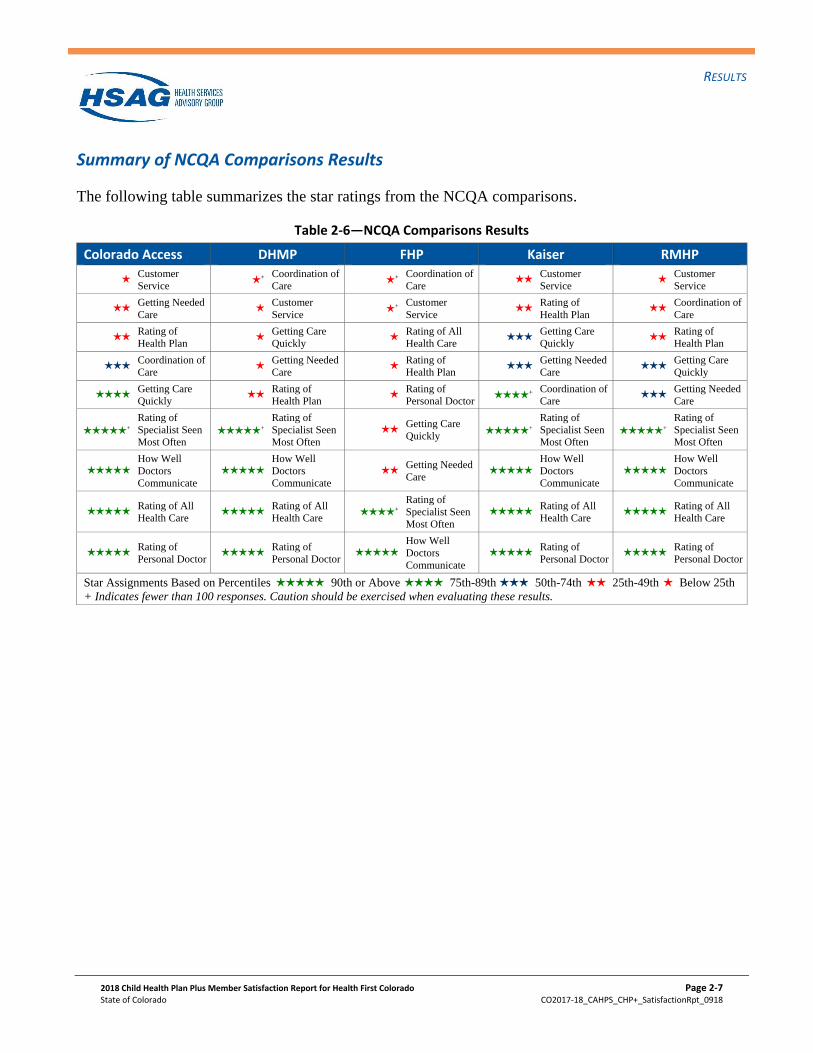
Summary of NCQA Comparisons Results
The following table summarizes the star ratings from the NCQA comparisons.
Table 2-6—NCQA Comparisons Results
Colorado Access DHMP FHP Kaiser RMHP
H Customer
Service H +
Coordination of
Care H +
Coordination of
Care HH
Customer
Service H
Customer
Service
HH Getting Needed
Care H
Customer
Service H +
Customer
Service HH
Rating of
Health Plan HH
Coordination of
Care
HH Rating of
Health Plan H
Getting Care
Quickly H
Rating of All
Health Care HHH
Getting Care
Quickly HH
Rating of
Health Plan
HHH Coordination of
Care H
Getting Needed
Care H
Rating of
Health Plan HHH
Getting Needed
Care HHH
Getting Care
Quickly
HHHH Getting Care
Quickly HH
Rating of
Health Plan H
Rating of
Personal Doctor HHHH +
Coordination of
Care HHH
Getting Needed
Care
HHHHH
+
Rating of
Specialist Seen
Most Often
HHHHH
+
Rating of
Specialist Seen
Most Often
HH Getting Care
Quickly
HHHHH
+
Rating of
Specialist Seen
Most Often
HHHHH
+
Rating of
Specialist Seen
Most Often
HHHHH How Well
Doctors
Communicate
HHHHH How Well
Doctors
Communicate
HH Getting Needed
Care HHHHH
How Well
Doctors
Communicate
HHHHH How Well
Doctors
Communicate
HHHHH Rating of All
Health Care HHHHH
Rating of All
Health Care HHHH +
Rating of
Specialist Seen
Most Often
HHHHH Rating of All
Health Care HHHHH
Rating of All
Health Care
HHHHH Rating of
Personal Doctor HHHHH
Rating of
Personal Doctor HHHHH
How Well
Doctors
Communicate
HHHHH Rating of
Personal Doctor HHHHH
Rating of
Personal Doctor
Star Assignments Based on PercentilesHHHHH 90th or AboveHHHH 75th-89thHHH 50th-74th HH 25th-49th H Below 25th
+ Indicates fewer than 100 responses. Caution should be exercised when evaluating these results.
RESULTS
2018 Child Health Plan Plus Member Satisfaction Report for Health First Colorado Page 2-8
State of Colorado CO2017-18_CAHPS_CHP+_SatisfactionRpt_0918
Trend Analysis
Table 2-7 shows the number of completed surveys in 2016, 2017, and 2018.2-8
Table 2-7—Completed Surveys in 2016, 2017, and 2018
Plan Name 2016 2017 2018
Colorado Access 516 497 412
DHMP 354 504 355
FHP 312 353 274
Kaiser 475 526 340
RMHP 624 485 533
Total Respondents 2,281 2,365 1,914
HSAG used these completed surveys to calculate the Colorado CHP+ program’s and corresponding
health plans’ 2016, 2017, and 2018 CAHPS results presented in this section for trending purposes.
Additionally, the Colorado CHP+ program’s 2016, 2017, and 2018 CAHPS results were weighted based
on the total eligible population of each health plan’s CHP+ population.
For purposes of the trend analysis, HSAG calculated question summary rates for each global rating and
individual item measure, and global proportions for each composite measure. Both the question
summary rates and global proportions were calculated in accordance with NCQA HEDIS Specifications
for Survey Measures.2-9 The scoring of the global ratings, composite measures, and individual item
measures involved assigning top-box rates a score of one, with all other responses receiving a score of
zero. A “top-box” response was defined as follows:
• “9” or “10” for the global ratings;
• “Usually” or “Always” for the Getting Needed Care, Getting Care Quickly, How Well Doctors
Communicate, and Customer Service composite measures, and Coordination of Care individual
items.
• “Yes” for the Shared Decision Making composite measure and the Health Promotion and Education
individual item.
After applying this scoring methodology, HSAG calculated the percentage of top-box rates in order to
determine the question summary rates and global proportions. NCQA national averages for the child
Medicaid population are used for comparative purposes, since NCQA does not provide separate
2-8 FHP was referred to as Colorado Choice in 2016 and 2017. Colorado Choice was acquired by FHP in November 2017. 2-9 National Committee for Quality Assurance. HEDIS® 2018, Volume 3: Specifications for Survey Measures. Washington,
DC: NCQA; 2017.
RESULTS
2018 Child Health Plan Plus Member Satisfaction Report for Health First Colorado Page 2-9
State of Colorado CO2017-18_CAHPS_CHP+_SatisfactionRpt_0918
benchmarking data for the CHP+ population.2-10,2-11 For additional details, please refer to the NCQA
HEDIS 2018 Specifications for Survey Measures, Volume 3.
In order to evaluate trends in CHP+ member satisfaction, HSAG performed a stepwise three-year trend
analysis. First, HSAG compared the 2018 Colorado CHP+ and plan-level CAHPS scores to the
corresponding 2017 scores. If the initial 2018 and 2017 trend analysis did not yield any statistically
significant differences, then HSAG performed an additional trend analysis between the 2018 and 2016
results. Figure 2-1 through Figure 2-11 show the results of this trend analysis. Statistically significant
differences are noted with directional triangles. Scores that were statistically significantly higher in 2018
than in 2017 are noted with black upward (P7) triangles. Scores that were statistically significantly lower
in 2018 than in 2017 are noted with black downward (Q7) triangles. Scores that were statistically
significantly higher in 2018 than in 2016 are noted with red upward (P6) triangles. Scores that were
statistically significantly lower in 2018 than in 2016 are noted with red downward (Q6) triangles. Scores
in 2018 that were not statistically significantly different from scores in 2017 or in 2016 are not noted
with triangles.
CAHPS scores with fewer than 100 respondents are denoted with a cross (+). Caution should be
exercised when interpreting results for those measures with fewer than 100 respondents.
2-10 NCQA national averages were not available for 2018 at the time this report was prepared; therefore, 2017 NCQA national
data are presented in this section. 2-11 The source for the NCQA national averages contained in this publication is Quality Compass® 2017 data and is used with
the permission of the National Committee for Quality Assurance (NCQA). Quality Compass 2017 includes certain CAHPS
data. Any data display, analysis, interpretation, or conclusion based on these data is solely that of the authors, and NCQA
specifically disclaims responsibility for any such display, analysis, interpretation, or conclusion. Quality Compass® is a
registered trademark of NCQA. CAHPS® is a registered trademark of the Agency for Healthcare Research and Quality
(AHRQ).
RESULTS
2018 Child Health Plan Plus Member Satisfaction Report for Health First Colorado Page 2-10
State of Colorado CO2017-18_CAHPS_CHP+_SatisfactionRpt_0918
Global Ratings
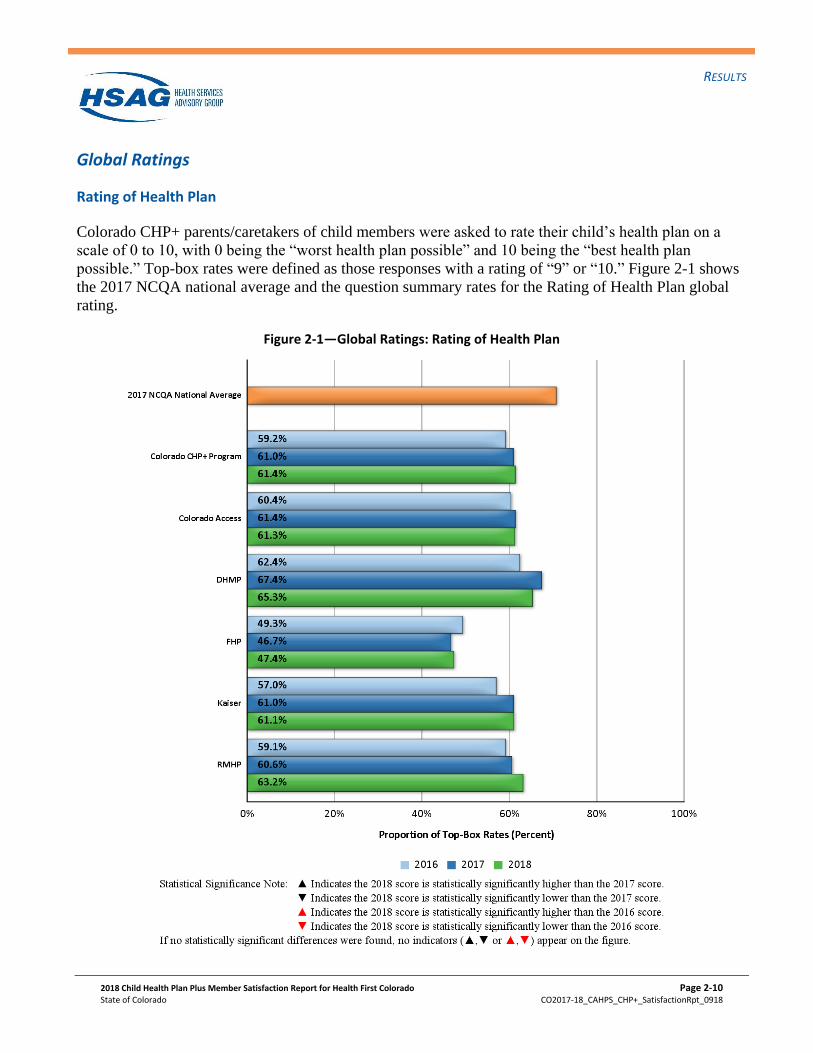
Rating of Health Plan
Colorado CHP+ parents/caretakers of child members were asked to rate their child’s health plan on a
scale of 0 to 10, with 0 being the “worst health plan possible” and 10 being the “best health plan
possible.” Top-box rates were defined as those responses with a rating of “9” or “10.” Figure 2-1 shows
the 2017 NCQA national average and the question summary rates for the Rating of Health Plan global
rating.
Figure 2-1—Global Ratings: Rating of Health Plan
RESULTS
2018 Child Health Plan Plus Member Satisfaction Report for Health First Colorado Page 2-11
State of Colorado CO2017-18_CAHPS_CHP+_SatisfactionRpt_0918
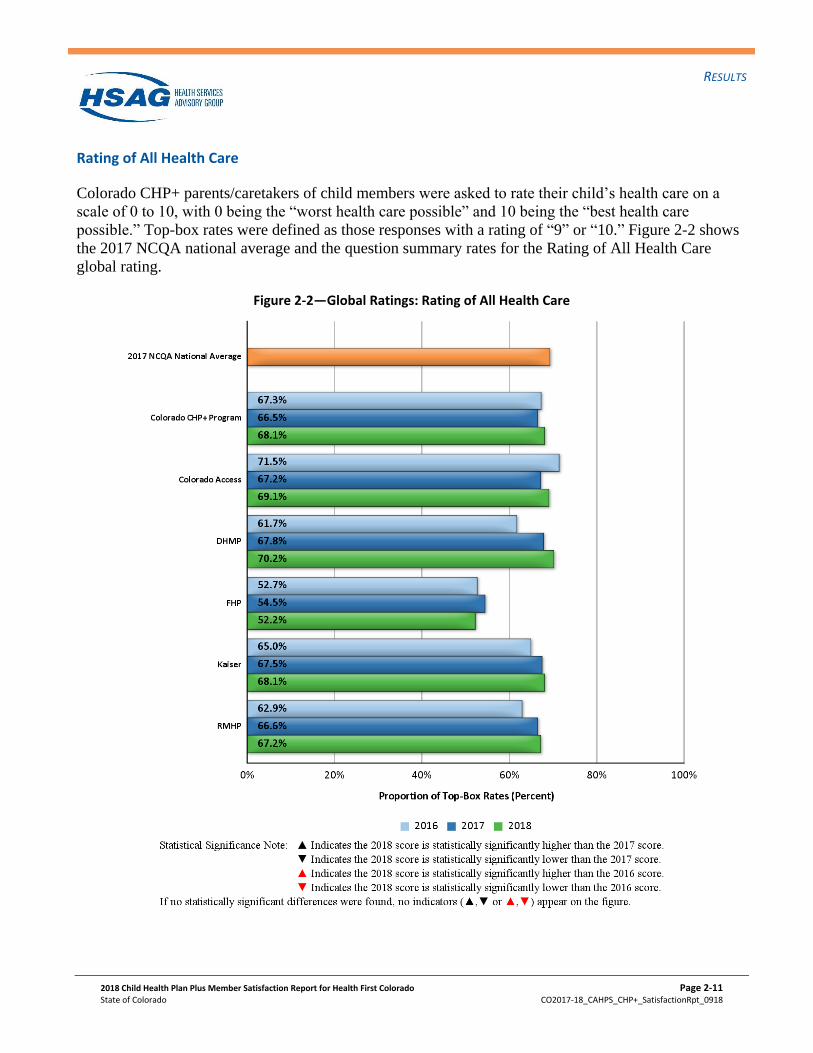
Rating of All Health Care
Colorado CHP+ parents/caretakers of child members were asked to rate their child’s health care on a
scale of 0 to 10, with 0 being the “worst health care possible” and 10 being the “best health care
possible.” Top-box rates were defined as those responses with a rating of “9” or “10.” Figure 2-2 shows
the 2017 NCQA national average and the question summary rates for the Rating of All Health Care
global rating.
Figure 2-2—Global Ratings: Rating of All Health Care
RESULTS
2018 Child Health Plan Plus Member Satisfaction Report for Health First Colorado Page 2-12
State of Colorado CO2017-18_CAHPS_CHP+_SatisfactionRpt_0918
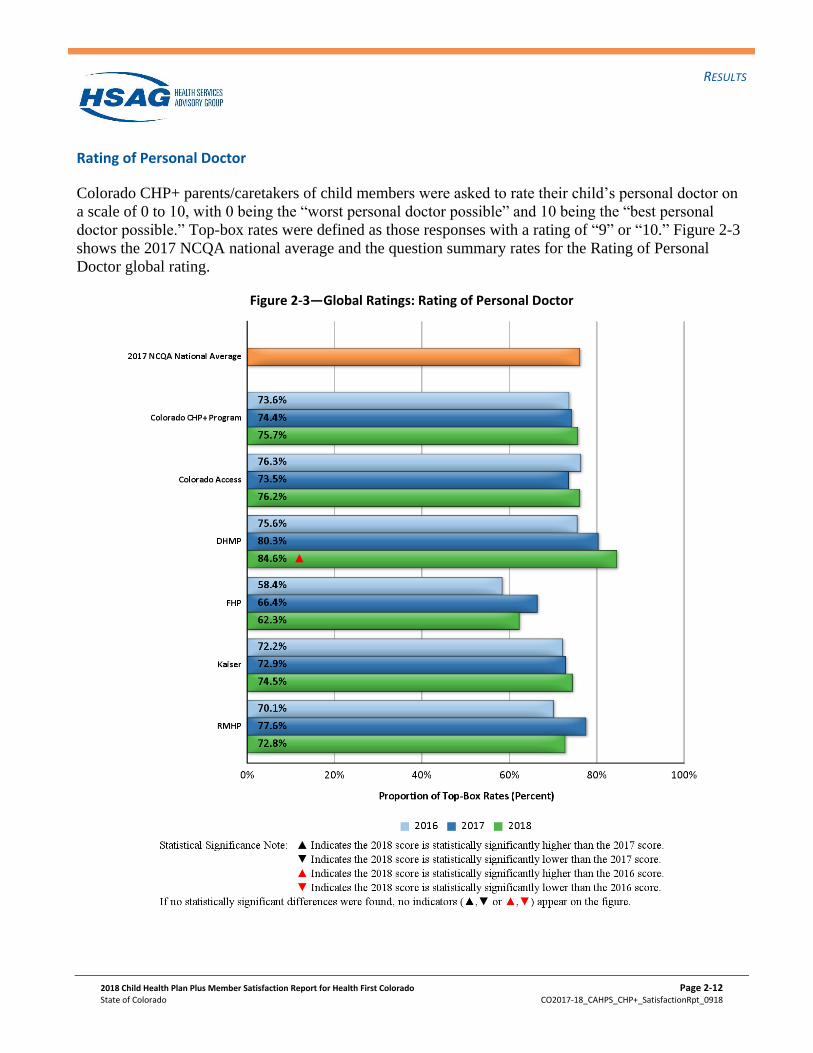
Rating of Personal Doctor
Colorado CHP+ parents/caretakers of child members were asked to rate their child’s personal doctor on
a scale of 0 to 10, with 0 being the “worst personal doctor possible” and 10 being the “best personal
doctor possible.” Top-box rates were defined as those responses with a rating of “9” or “10.” Figure 2-3
shows the 2017 NCQA national average and the question summary rates for the Rating of Personal
Doctor global rating.
Figure 2-3—Global Ratings: Rating of Personal Doctor
RESULTS
2018 Child Health Plan Plus Member Satisfaction Report for Health First Colorado Page 2-13
State of Colorado CO2017-18_CAHPS_CHP+_SatisfactionRpt_0918
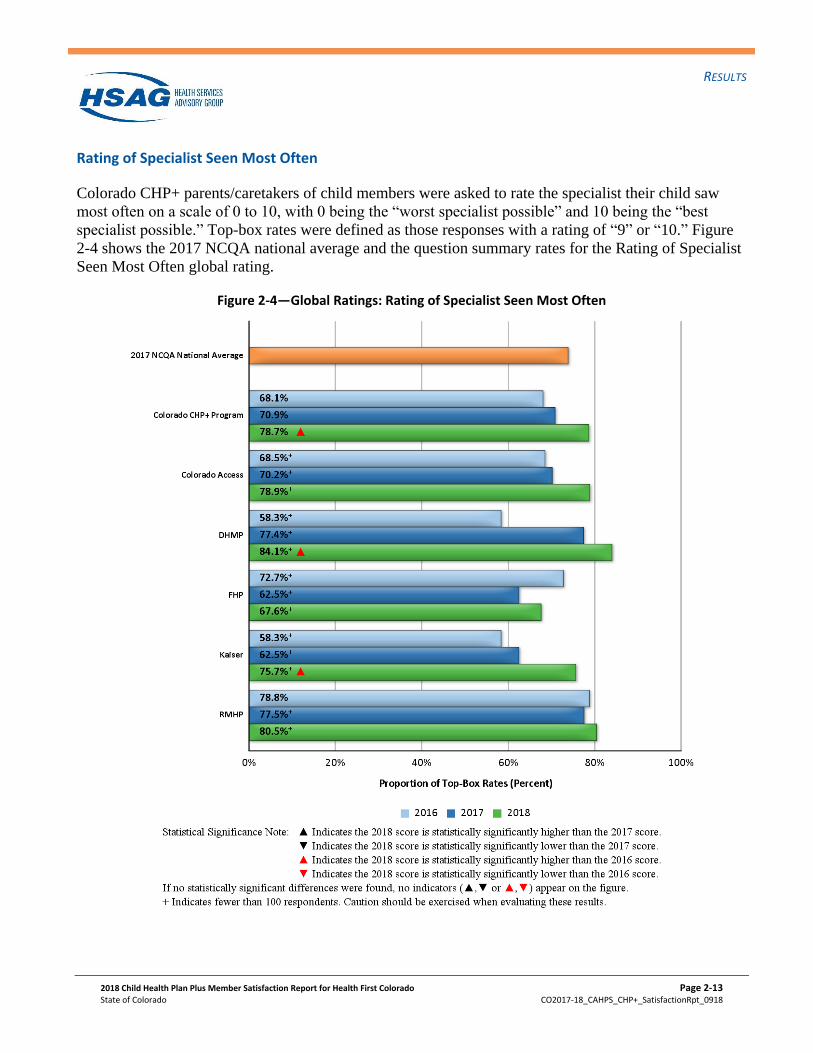
Rating of Specialist Seen Most Often
Colorado CHP+ parents/caretakers of child members were asked to rate the specialist their child saw
most often on a scale of 0 to 10, with 0 being the “worst specialist possible” and 10 being the “best
specialist possible.” Top-box rates were defined as those responses with a rating of “9” or “10.” Figure
2-4 shows the 2017 NCQA national average and the question summary rates for the Rating of Specialist
Seen Most Often global rating.
Figure 2-4—Global Ratings: Rating of Specialist Seen Most Often
RESULTS
2018 Child Health Plan Plus Member Satisfaction Report for Health First Colorado Page 2-14
State of Colorado CO2017-18_CAHPS_CHP+_SatisfactionRpt_0918
Composite Measures
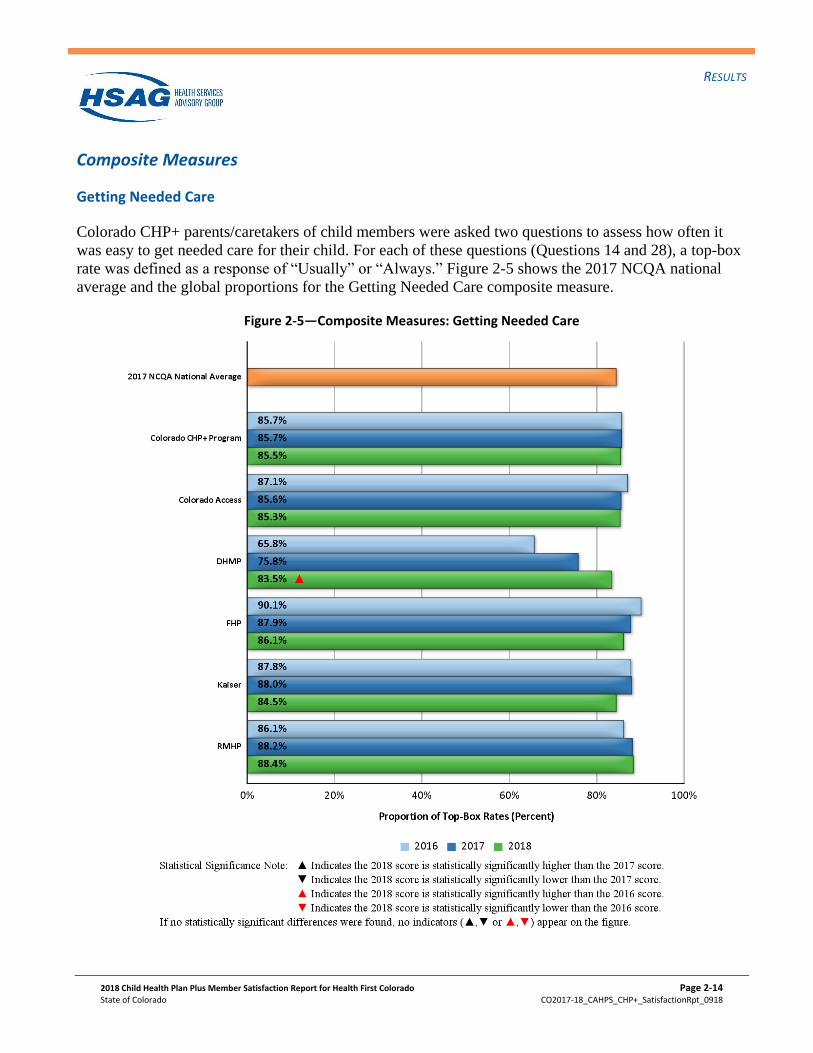
Getting Needed Care
Colorado CHP+ parents/caretakers of child members were asked two questions to assess how often it
was easy to get needed care for their child. For each of these questions (Questions 14 and 28), a top-box
rate was defined as a response of “Usually” or “Always.” Figure 2-5 shows the 2017 NCQA national
average and the global proportions for the Getting Needed Care composite measure.
Figure 2-5—Composite Measures: Getting Needed Care
RESULTS
2018 Child Health Plan Plus Member Satisfaction Report for Health First Colorado Page 2-15
State of Colorado CO2017-18_CAHPS_CHP+_SatisfactionRpt_0918
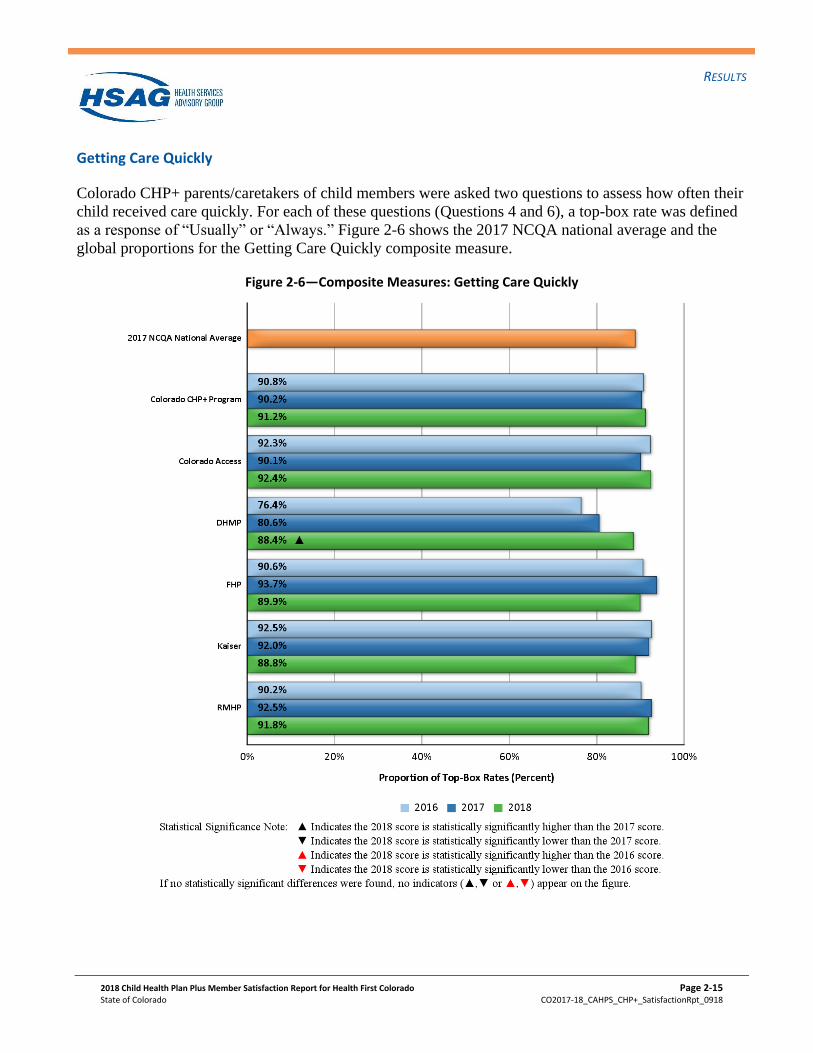
Getting Care Quickly
Colorado CHP+ parents/caretakers of child members were asked two questions to assess how often their
child received care quickly. For each of these questions (Questions 4 and 6), a top-box rate was defined
as a response of “Usually” or “Always.” Figure 2-6 shows the 2017 NCQA national average and the
global proportions for the Getting Care Quickly composite measure.
Figure 2-6—Composite Measures: Getting Care Quickly
RESULTS
2018 Child Health Plan Plus Member Satisfaction Report for Health First Colorado Page 2-16
State of Colorado CO2017-18_CAHPS_CHP+_SatisfactionRpt_0918
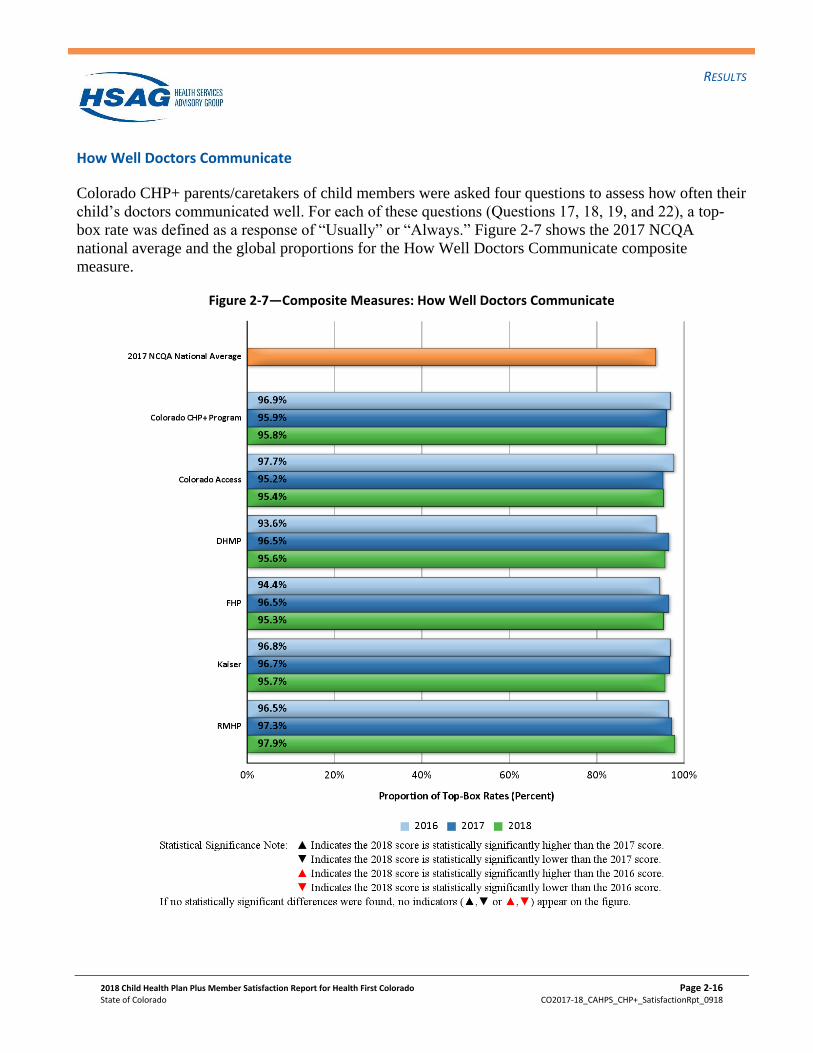
How Well Doctors Communicate
Colorado CHP+ parents/caretakers of child members were asked four questions to assess how often their
child’s doctors communicated well. For each of these questions (Questions 17, 18, 19, and 22), a top-
box rate was defined as a response of “Usually” or “Always.” Figure 2-7 shows the 2017 NCQA
national average and the global proportions for the How Well Doctors Communicate composite
measure.
Figure 2-7—Composite Measures: How Well Doctors Communicate
RESULTS
2018 Child Health Plan Plus Member Satisfaction Report for Health First Colorado Page 2-17
State of Colorado CO2017-18_CAHPS_CHP+_SatisfactionRpt_0918
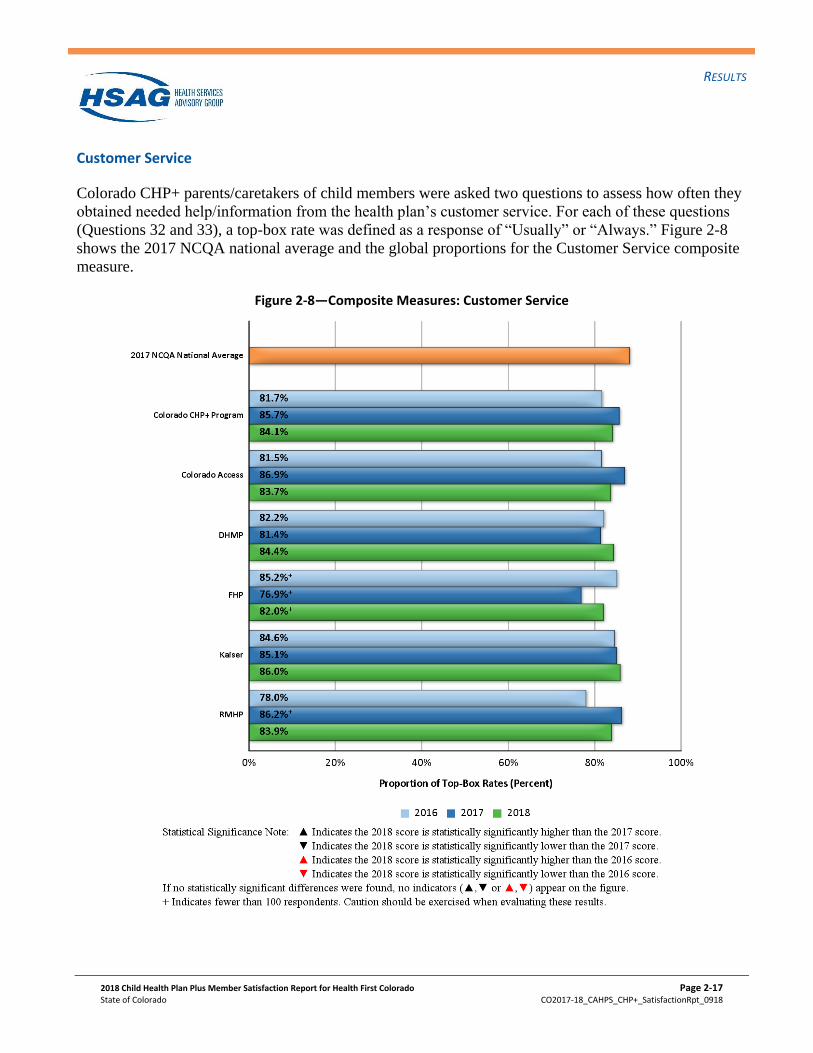
Customer Service
Colorado CHP+ parents/caretakers of child members were asked two questions to assess how often they
obtained needed help/information from the health plan’s customer service. For each of these questions
(Questions 32 and 33), a top-box rate was defined as a response of “Usually” or “Always.” Figure 2-8
shows the 2017 NCQA national average and the global proportions for the Customer Service composite
measure.
Figure 2-8—Composite Measures: Customer Service
RESULTS
2018 Child Health Plan Plus Member Satisfaction Report for Health First Colorado Page 2-18
State of Colorado CO2017-18_CAHPS_CHP+_SatisfactionRpt_0918
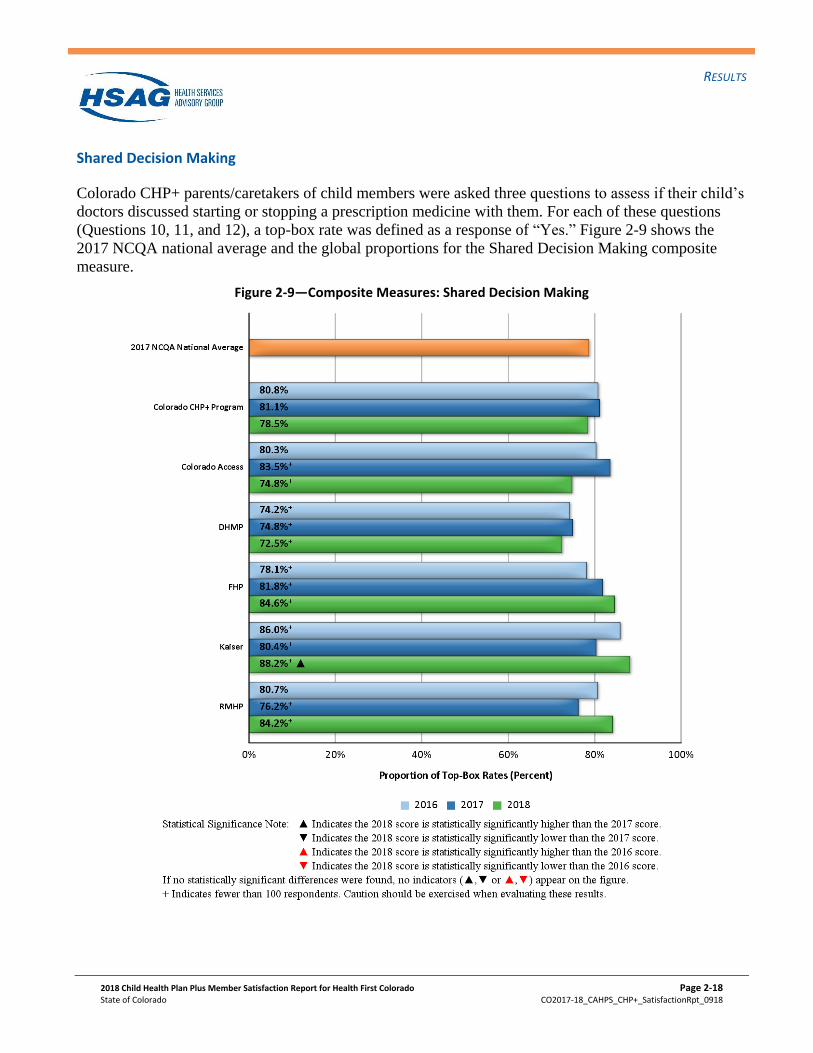
Shared Decision Making
Colorado CHP+ parents/caretakers of child members were asked three questions to assess if their child’s
doctors discussed starting or stopping a prescription medicine with them. For each of these questions
(Questions 10, 11, and 12), a top-box rate was defined as a response of “Yes.” Figure 2-9 shows the
2017 NCQA national average and the global proportions for the Shared Decision Making composite
measure.
Figure 2-9—Composite Measures: Shared Decision Making
RESULTS
2018 Child Health Plan Plus Member Satisfaction Report for Health First Colorado Page 2-19
State of Colorado CO2017-18_CAHPS_CHP+_SatisfactionRpt_0918
Individual Item Measures
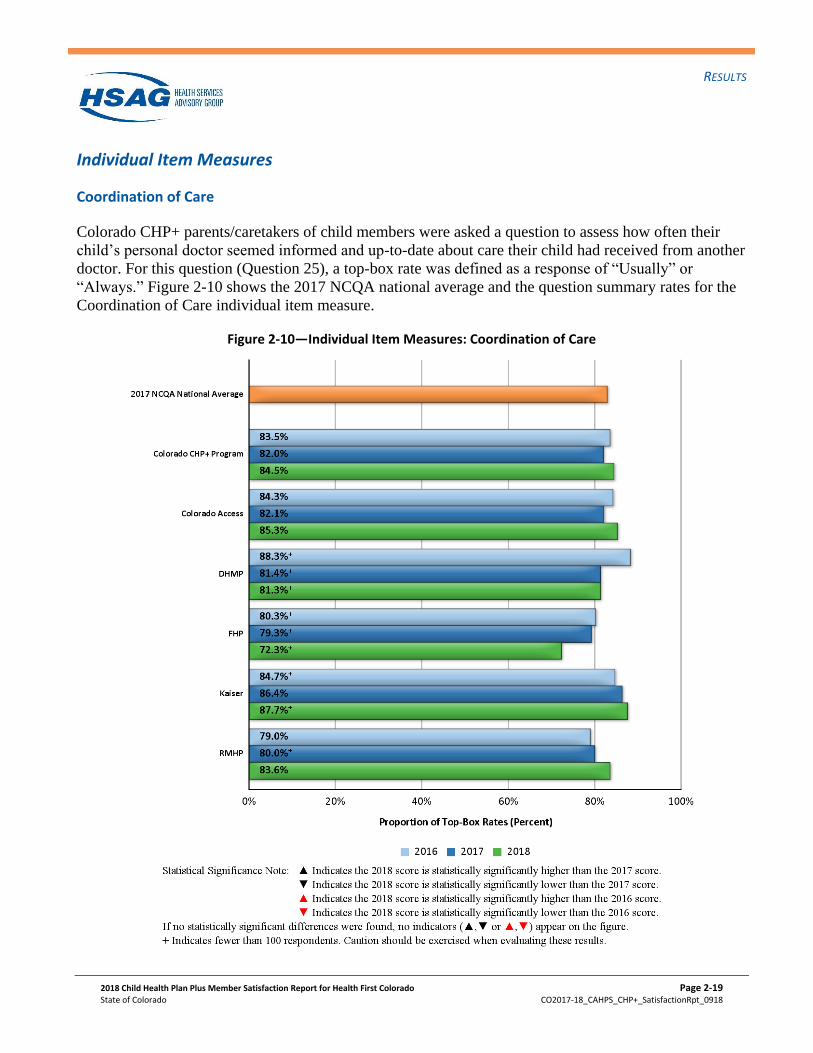
Coordination of Care
Colorado CHP+ parents/caretakers of child members were asked a question to assess how often their
child’s personal doctor seemed informed and up-to-date about care their child had received from another
doctor. For this question (Question 25), a top-box rate was defined as a response of “Usually” or
“Always.” Figure 2-10 shows the 2017 NCQA national average and the question summary rates for the
Coordination of Care individual item measure.
Figure 2-10—Individual Item Measures: Coordination of Care
RESULTS
2018 Child Health Plan Plus Member Satisfaction Report for Health First Colorado Page 2-20
State of Colorado CO2017-18_CAHPS_CHP+_SatisfactionRpt_0918
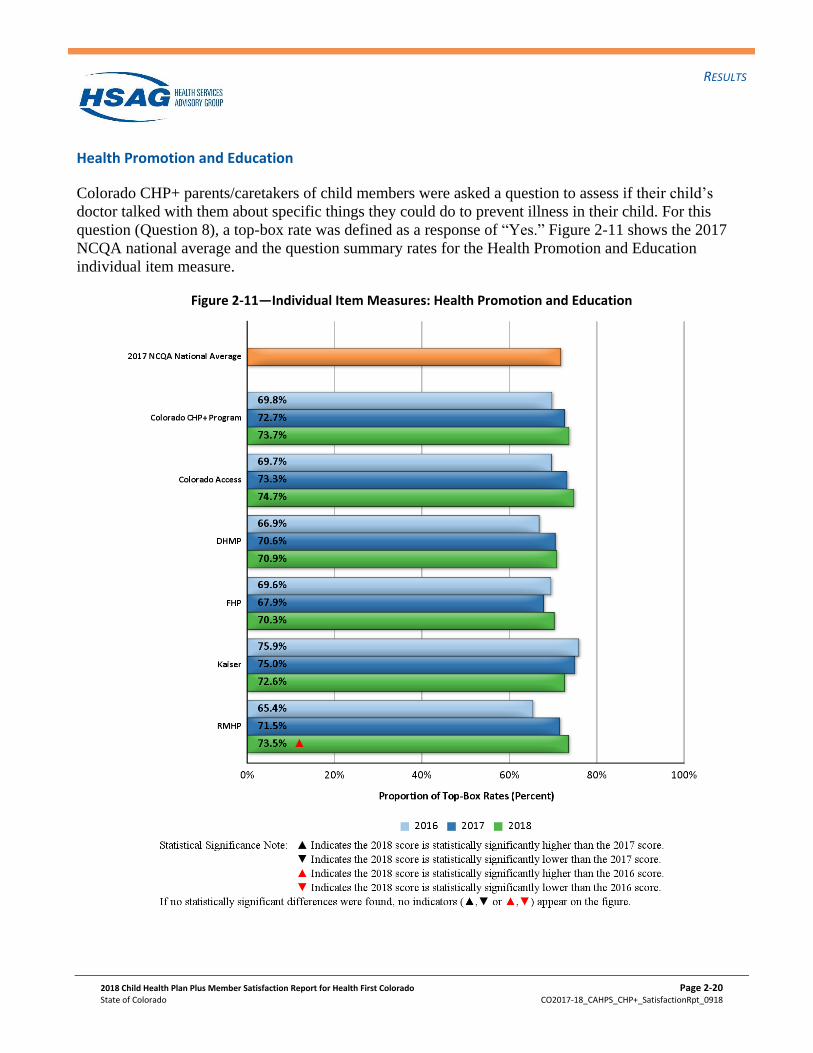
Health Promotion and Education
Colorado CHP+ parents/caretakers of child members were asked a question to assess if their child’s
doctor talked with them about specific things they could do to prevent illness in their child. For this
question (Question 8), a top-box rate was defined as a response of “Yes.” Figure 2-11 shows the 2017
NCQA national average and the question summary rates for the Health Promotion and Education
individual item measure.
Figure 2-11—Individual Item Measures: Health Promotion and Education
RESULTS
2018 Child Health Plan Plus Member Satisfaction Report for Health First Colorado Page 2-21
State of Colorado CO2017-18_CAHPS_CHP+_SatisfactionRpt_0918
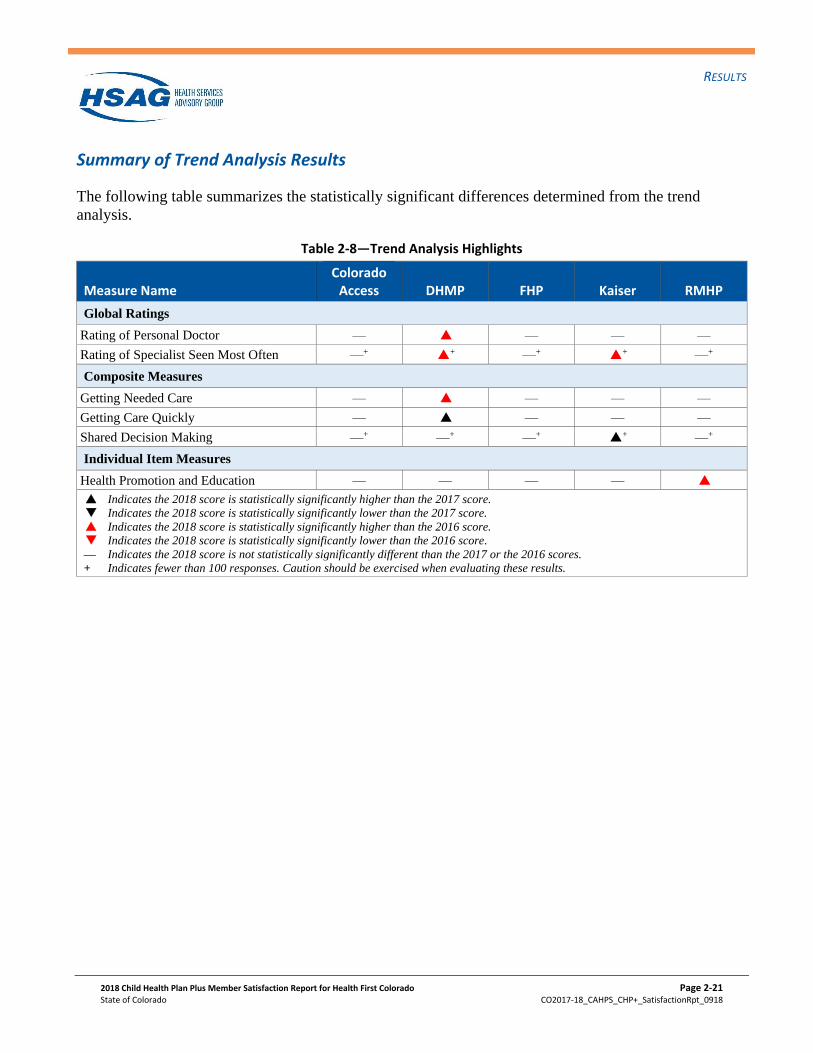
Summary of Trend Analysis Results
The following table summarizes the statistically significant differences determined from the trend
analysis.
Table 2-8—Trend Analysis Highlights
Measure Name Colorado
Access DHMP FHP Kaiser RMHP
Global Ratings
Rating of Personal Doctor — P6 — — —
Rating of Specialist Seen Most Often —+ P6+ —+ P6
+ —+
Composite Measures
Getting Needed Care — P6 — — —
Getting Care Quickly — P7 — — —
Shared Decision Making —+ —+ —+ P7+ —+
Individual Item Measures
Health Promotion and Education — — — — P6
P7 Indicates the 2018 score is statistically significantly higher than the 2017 score.
Q7 Indicates the 2018 score is statistically significantly lower than the 2017 score.
P6 Indicates the 2018 score is statistically significantly higher than the 2016 score.
Q6 Indicates the 2018 score is statistically significantly lower than the 2016 score.
— Indicates the 2018 score is not statistically significantly different than the 2017 or the 2016 scores.
+ Indicates fewer than 100 responses. Caution should be exercised when evaluating these results.
RESULTS
2018 Child Health Plan Plus Member Satisfaction Report for Health First Colorado Page 2-22
State of Colorado CO2017-18_CAHPS_CHP+_SatisfactionRpt_0918
Plan Comparisons
In order to identify performance differences in member satisfaction between the five Colorado CHP+
health plans, HSAG compared the results for Colorado Access, DHMP, FHP, Kaiser, and RMHP to the
Colorado CHP+ program average using standard tests for statistical significance.2-12 For purposes of this
comparison, results were case-mix adjusted. Case-mix refers to the characteristics of respondents used in
adjusting the results for comparability among health plans. Results for the CHP+ health plans were case-
mix adjusted for member general health status, respondent educational level, and respondent age.2-13
Given that differences in case-mix can result in differences in ratings between health plans that are not
due to differences in quality, the data were adjusted to account for disparities in these characteristics.
The case-mix adjustment was performed using standard regression techniques (i.e., covariance
adjustment).
The scoring of the global ratings, composite measures, and individual item measures involved assigning
top-box rates a score of one, with all other responses receiving a score of zero. A “top-box” response
was defined as follows:
• “9” or “10” for the global ratings;
• “Usually” or “Always” for the Getting Needed Care, Getting Care Quickly, How Well Doctors
Communicate, and Customer Service composite measures, and Coordination of Care individual
items.
• “Yes” for the Shared Decision Making composite measure and the Health Promotion and Education
individual item.
After applying this scoring methodology, HSAG calculated the percentage of top-box rates in order to
determine the question summary rates and global proportions. For additional detail, please refer to the
NCQA HEDIS 2018 Specifications for Survey Measures, Volume 3.
Statistically significant differences are noted in Table 2-9 by arrows. A health plan that performed
statistically significantly higher than the Colorado CHP+ program average is denoted with an upward
(k) arrow. Conversely, a health plan that performed statistically significantly lower than the Colorado
CHP+ program average is denoted with a downward ( i) arrow. A health plan that is not statistically
significantly different than the Colorado CHP+ program average is denoted with a horizontal ( n) arrow.
For purposes of this report, CAHPS scores are reported for those measures even when NCQA’s
minimum reporting threshold of 100 respondents was not met; therefore, caution should be exercised
when interpreting these results. CAHPS scores with less than 100 respondents are denoted with a cross
(+).
2-12 Caution should be exercised when evaluating plan comparisons, given that population and plan differences may impact
CAHPS results. 2-13 Agency for Healthcare Research and Quality. CAHPS Health Plan Survey and Reporting Kit 2008. Rockville, MD: US
Department of Health and Human Services, July 2008.
RESULTS
2018 Child Health Plan Plus Member Satisfaction Report for Health First Colorado Page 2-23
State of Colorado CO2017-18_CAHPS_CHP+_SatisfactionRpt_0918
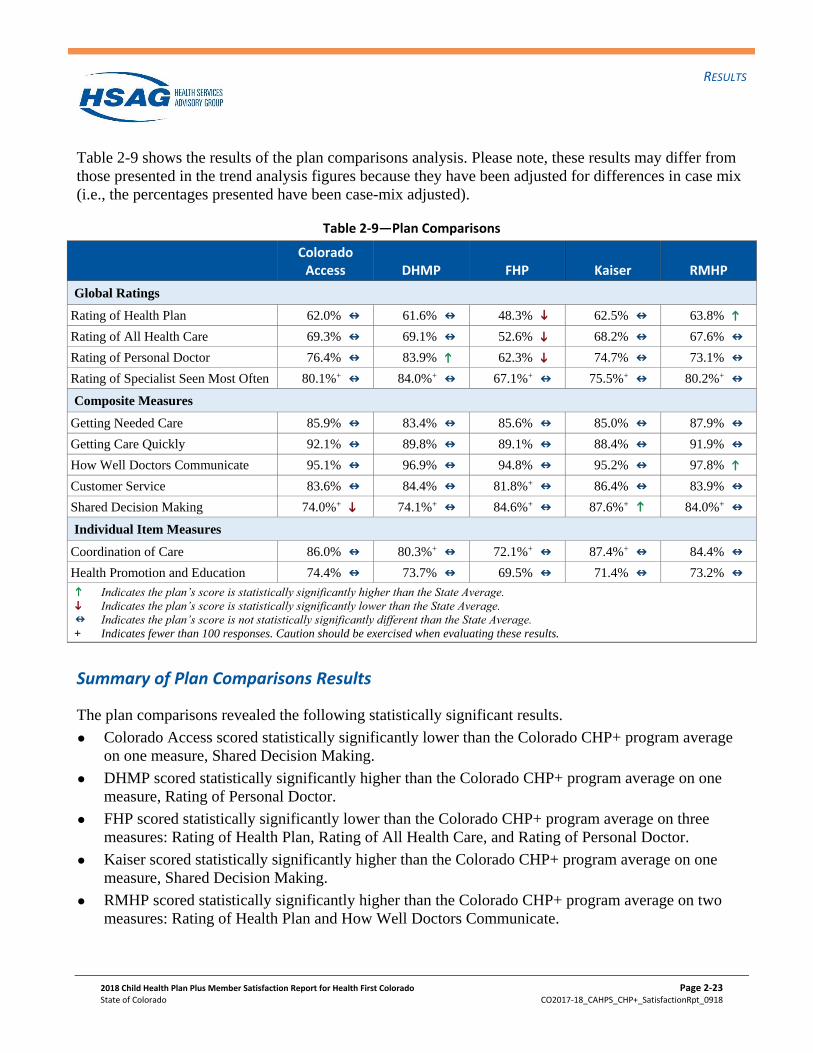
Table 2-9 shows the results of the plan comparisons analysis. Please note, these results may differ from
those presented in the trend analysis figures because they have been adjusted for differences in case mix
(i.e., the percentages presented have been case-mix adjusted).
Table 2-9—Plan Comparisons
Colorado Access DHMP FHP Kaiser RMHP
Global Ratings
Rating of Health Plan 62.0% n
61.6% n
48.3% i 62.5% n
63.8% k
Rating of All Health Care 69.3% n
69.1% n
52.6% i
68.2% n
67.6% n
Rating of Personal Doctor 76.4% n
83.9% k
62.3% i
74.7% n
73.1% n
Rating of Specialist Seen Most Often 80.1%+ n
84.0%+ n
67.1%+ n
75.5%+ n
80.2%+ n
Composite Measures
Getting Needed Care 85.9% n
83.4% n
85.6% n
85.0% n
87.9% n
Getting Care Quickly 92.1% n
89.8% n
89.1% n
88.4% n
91.9% n
How Well Doctors Communicate 95.1% n
96.9% n
94.8% n
95.2% n
97.8% k
Customer Service 83.6% n
84.4% n
81.8%+ n
86.4% n
83.9% n
Shared Decision Making 74.0%+ i
74.1%+ n
84.6%+ n
87.6%+ k 84.0%+ n
Individual Item Measures
Coordination of Care 86.0% n
80.3%+ n
72.1%+ n
87.4%+ n
84.4% n
Health Promotion and Education 74.4% n
73.7% n
69.5% n
71.4% n
73.2% n
k Indicates the plan’s score is statistically significantly higher than the State Average.
i Indicates the plan’s score is statistically significantly lower than the State Average.
n Indicates the plan’s score is not statistically significantly different than the State Average.
+ Indicates fewer than 100 responses. Caution should be exercised when evaluating these results.
Summary of Plan Comparisons Results
The plan comparisons revealed the following statistically significant results.
Colorado Access scored statistically significantly lower than the Colorado CHP+ program average
on one measure, Shared Decision Making.
DHMP scored statistically significantly higher than the Colorado CHP+ program average on one
measure, Rating of Personal Doctor.
FHP scored statistically significantly lower than the Colorado CHP+ program average on three
measures: Rating of Health Plan, Rating of All Health Care, and Rating of Personal Doctor.
Kaiser scored statistically significantly higher than the Colorado CHP+ program average on one
measure, Shared Decision Making.
RMHP scored statistically significantly higher than the Colorado CHP+ program average on two
measures: Rating of Health Plan and How Well Doctors Communicate.
RESULTS
2018 Child Health Plan Plus Member Satisfaction Report for Health First Colorado Page 2-24
State of Colorado CO2017-18_CAHPS_CHP+_SatisfactionRpt_0918
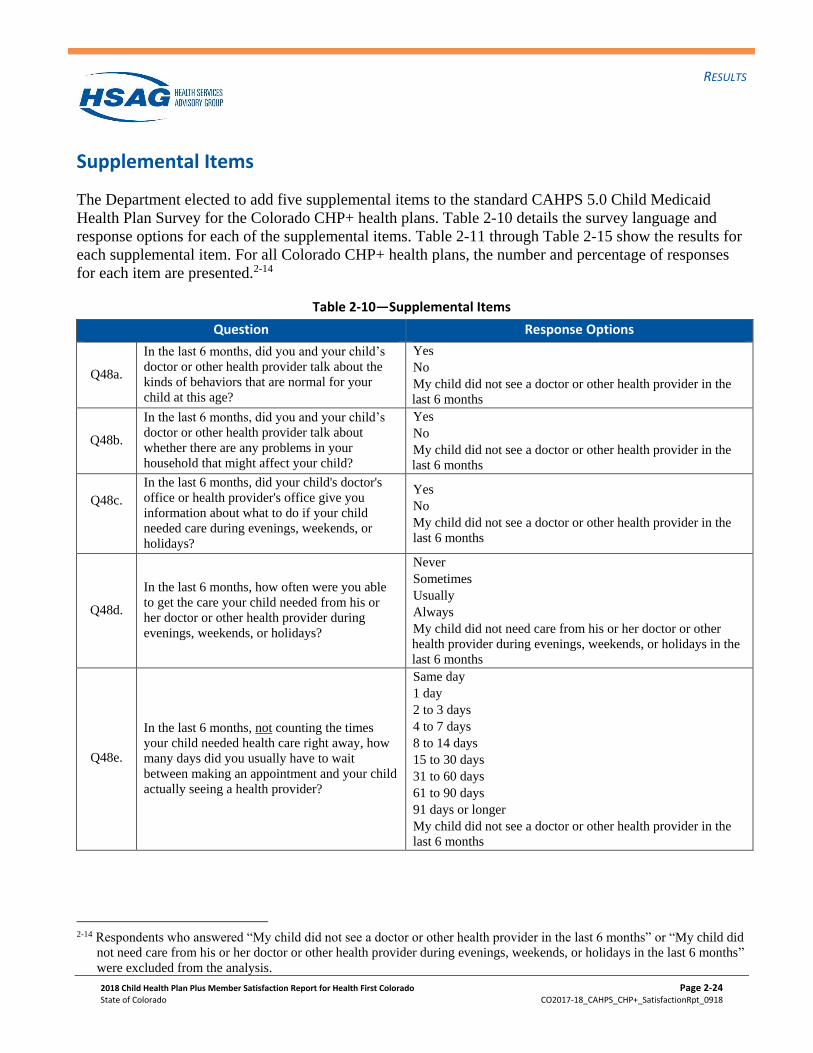
Supplemental Items
The Department elected to add five supplemental items to the standard CAHPS 5.0 Child Medicaid
Health Plan Survey for the Colorado CHP+ health plans. Table 2-10 details the survey language and
response options for each of the supplemental items. Table 2-11 through Table 2-15 show the results for
each supplemental item. For all Colorado CHP+ health plans, the number and percentage of responses
for each item are presented.2-14
Table 2-10—Supplemental Items
Question Response Options
Q48a.
In the last 6 months, did you and your child’s
doctor or other health provider talk about the
kinds of behaviors that are normal for your
child at this age?
Yes
No
My child did not see a doctor or other health provider in the
last 6 months
Q48b.
In the last 6 months, did you and your child’s
doctor or other health provider talk about
whether there are any problems in your
household that might affect your child?
Yes
No
My child did not see a doctor or other health provider in the
last 6 months
Q48c.
In the last 6 months, did your child's doctor's
office or health provider's office give you
information about what to do if your child
needed care during evenings, weekends, or
holidays?
Yes
No
My child did not see a doctor or other health provider in the
last 6 months
Q48d.
In the last 6 months, how often were you able
to get the care your child needed from his or
her doctor or other health provider during
evenings, weekends, or holidays?
Never
Sometimes
Usually
Always
My child did not need care from his or her doctor or other
health provider during evenings, weekends, or holidays in the
last 6 months
Q48e.
In the last 6 months, not counting the times
your child needed health care right away, how
many days did you usually have to wait
between making an appointment and your child
actually seeing a health provider?
Same day
1 day
2 to 3 days
4 to 7 days
8 to 14 days
15 to 30 days
31 to 60 days
61 to 90 days
91 days or longer
My child did not see a doctor or other health provider in the
last 6 months
2-14 Respondents who answered “My child did not see a doctor or other health provider in the last 6 months” or “My child did
not need care from his or her doctor or other health provider during evenings, weekends, or holidays in the last 6 months”
were excluded from the analysis.
RESULTS
2018 Child Health Plan Plus Member Satisfaction Report for Health First Colorado Page 2-25
State of Colorado CO2017-18_CAHPS_CHP+_SatisfactionRpt_0918
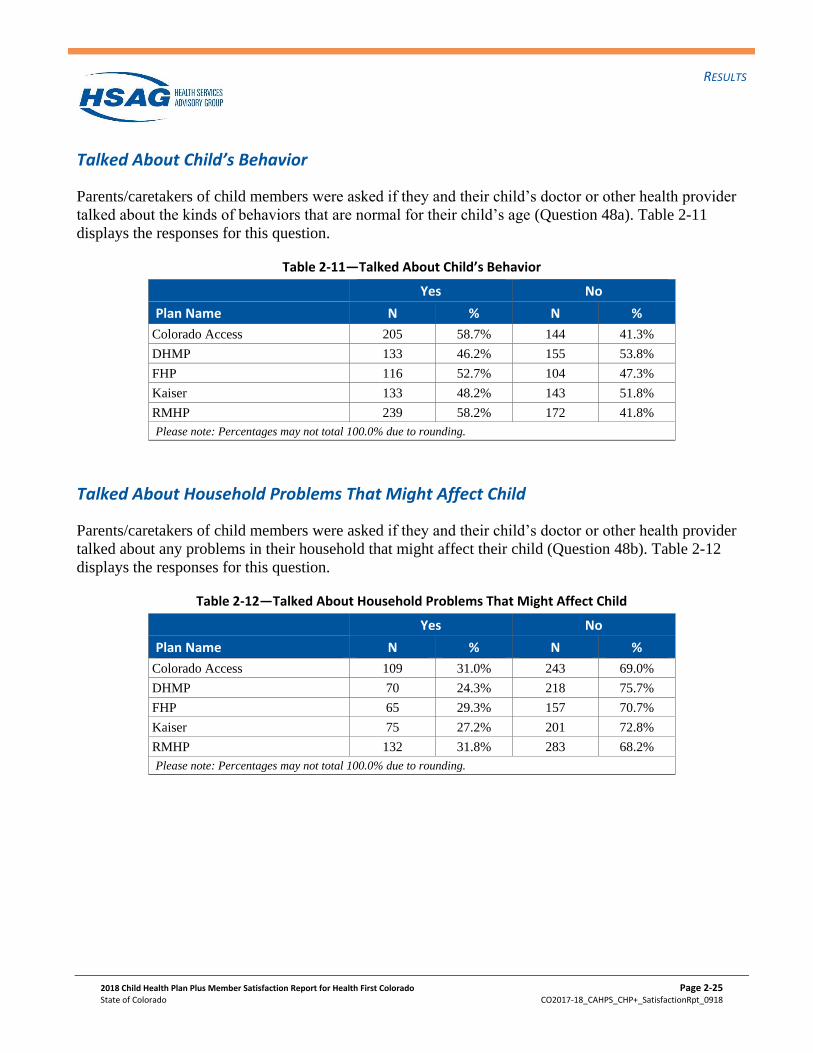
Talked About Child’s Behavior
Parents/caretakers of child members were asked if they and their child’s doctor or other health provider
talked about the kinds of behaviors that are normal for their child’s age (Question 48a). Table 2-11
displays the responses for this question.
Table 2-11—Talked About Child’s Behavior
Yes No
Plan Name N % N %
Colorado Access 205 58.7% 144 41.3%
DHMP 133 46.2% 155 53.8%
FHP 116 52.7% 104 47.3%
Kaiser 133 48.2% 143 51.8%
RMHP 239 58.2% 172 41.8%
Please note: Percentages may not total 100.0% due to rounding.
Talked About Household Problems That Might Affect Child
Parents/caretakers of child members were asked if they and their child’s doctor or other health provider
talked about any problems in their household that might affect their child (Question 48b). Table 2-12
displays the responses for this question.
Table 2-12—Talked About Household Problems That Might Affect Child
Yes No
Plan Name N % N %
Colorado Access 109 31.0% 243 69.0%
DHMP 70 24.3% 218 75.7%
FHP 65 29.3% 157 70.7%
Kaiser 75 27.2% 201 72.8%
RMHP 132 31.8% 283 68.2%
Please note: Percentages may not total 100.0% due to rounding.
RESULTS
2018 Child Health Plan Plus Member Satisfaction Report for Health First Colorado Page 2-26
State of Colorado CO2017-18_CAHPS_CHP+_SatisfactionRpt_0918
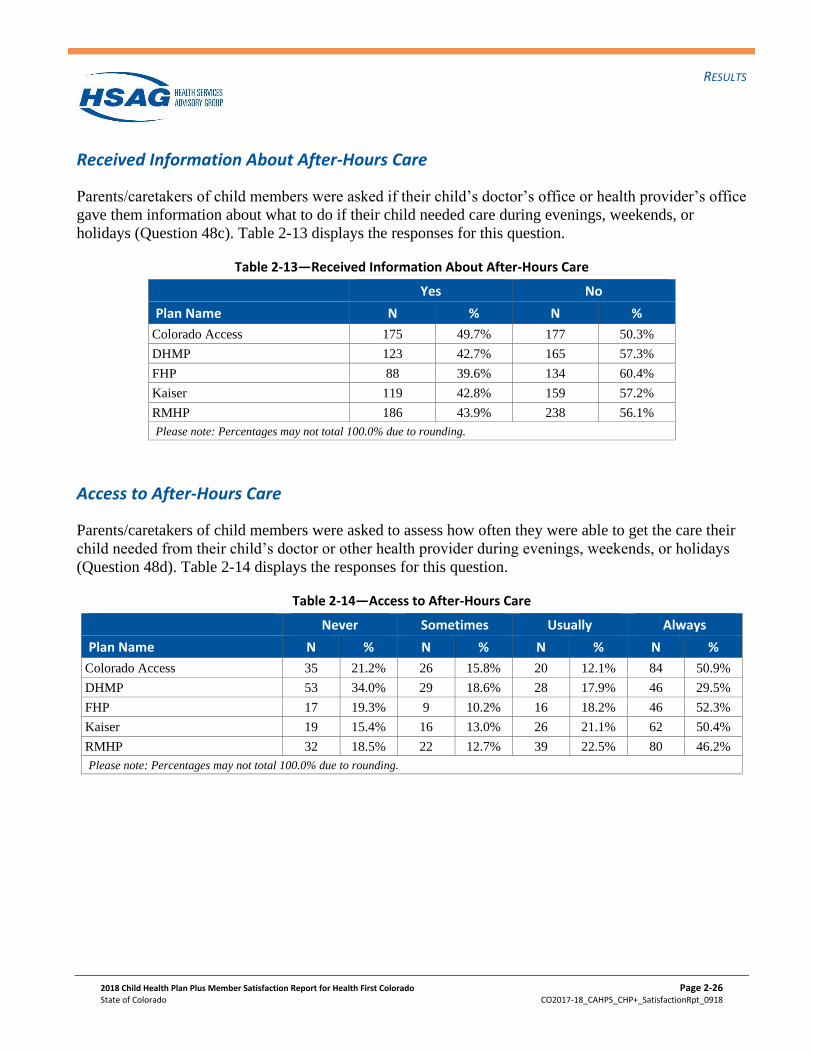
Received Information About After-Hours Care
Parents/caretakers of child members were asked if their child’s doctor’s office or health provider’s office
gave them information about what to do if their child needed care during evenings, weekends, or
holidays (Question 48c). Table 2-13 displays the responses for this question.
Table 2-13—Received Information About After-Hours Care
Yes No
Plan Name N % N %
Colorado Access 175 49.7% 177 50.3%
DHMP 123 42.7% 165 57.3%
FHP 88 39.6% 134 60.4%
Kaiser 119 42.8% 159 57.2%
RMHP 186 43.9% 238 56.1%
Please note: Percentages may not total 100.0% due to rounding.
Access to After-Hours Care
Parents/caretakers of child members were asked to assess how often they were able to get the care their
child needed from their child’s doctor or other health provider during evenings, weekends, or holidays
(Question 48d). Table 2-14 displays the responses for this question.
Table 2-14—Access to After-Hours Care
Never Sometimes Usually Always
Plan Name N % N % N % N %
Colorado Access 35 21.2% 26 15.8% 20 12.1% 84 50.9%
DHMP 53 34.0% 29 18.6% 28 17.9% 46 29.5%
FHP 17 19.3% 9 10.2% 16 18.2% 46 52.3%
Kaiser 19 15.4% 16 13.0% 26 21.1% 62 50.4%
RMHP 32 18.5% 22 12.7% 39 22.5% 80 46.2%
Please note: Percentages may not total 100.0% due to rounding.
RESULTS
2018 Child Health Plan Plus Member Satisfaction Report for Health First Colorado Page 2-27
State of Colorado CO2017-18_CAHPS_CHP+_SatisfactionRpt_0918
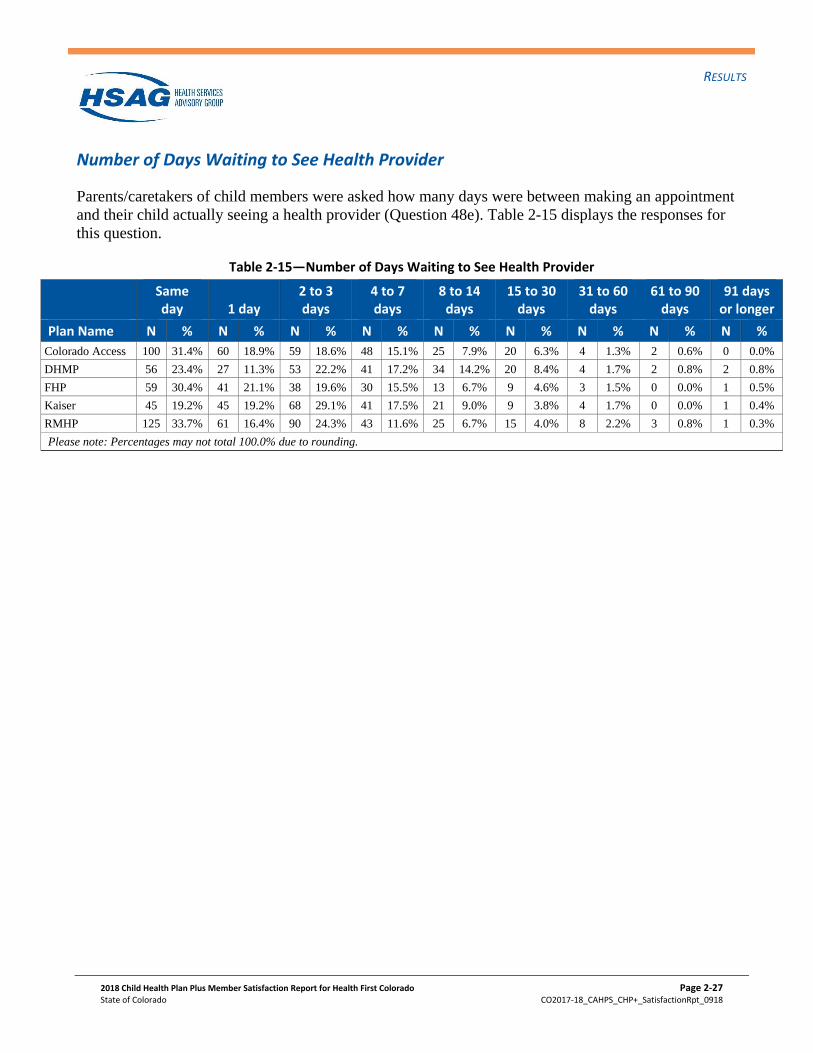
Number of Days Waiting to See Health Provider
Parents/caretakers of child members were asked how many days were between making an appointment
and their child actually seeing a health provider (Question 48e). Table 2-15 displays the responses for
this question.
Table 2-15—Number of Days Waiting to See Health Provider
Same day 1 day
2 to 3 days
4 to 7 days
8 to 14 days
15 to 30 days
31 to 60 days
61 to 90 days
91 days or longer
Plan Name N % N % N % N % N % N % N % N % N %
Colorado Access 100 31.4% 60 18.9% 59 18.6% 48 15.1% 25 7.9% 20 6.3% 4 1.3% 2 0.6% 0 0.0%
DHMP 56 23.4% 27 11.3% 53 22.2% 41 17.2% 34 14.2% 20 8.4% 4 1.7% 2 0.8% 2 0.8%
FHP 59 30.4% 41 21.1% 38 19.6% 30 15.5% 13 6.7% 9 4.6% 3 1.5% 0 0.0% 1 0.5%
Kaiser 45 19.2% 45 19.2% 68 29.1% 41 17.5% 21 9.0% 9 3.8% 4 1.7% 0 0.0% 1 0.4%
RMHP 125 33.7% 61 16.4% 90 24.3% 43 11.6% 25 6.7% 15 4.0% 8 2.2% 3 0.8% 1 0.3%
Please note: Percentages may not total 100.0% due to rounding.
2018 Child Health Plan Plus Member Satisfaction Report for Health First Colorado Page 3-1
State of Colorado CO2017-18_CAHPS_CHP+_SatisfactionRpt_0918
3. Conclusions and Recommendations
HSAG drew conclusions and identified quality improvement (QI) recommendations for each of the five
Colorado CHP+ health plans based on the two analyses that were performed: comparisons to NCQA’s
2018 HEDIS Benchmarks and Thresholds for Accreditation and trending analyses. HSAG used the
results from these analyses to determine areas of low to high performance and create conclusions and
recommendations for the CHP+ health plans’ consideration.
Plan-Specific Priority Assignments
This section presents the results of the priority assignments for the five Colorado CHP+ health plans.
The priority assignments are grouped into four main categories for QI: top, high, moderate, and low
priority. The priority assignment of the CAHPS measure is based on the results of the NCQA
comparisons and trend analysis.3-1
The priorities presented in this section should be viewed as potential suggestions for QI. Additional
sources of QI information, such as other HEDIS results, should be incorporated into a comprehensive QI
health plan. A number of resources are available to assist state Medicaid agencies and health plans with
the implementation of CAHPS-based QI initiatives. A comprehensive list of these resources is included
in the Reader’s Guide section, beginning on page 4-11.
3-1 NCQA does not provide benchmarks for the Shared Decision Making composite measure, and Health Promotion and
Education individual item measure; therefore, priority assignments cannot be derived for these measures.
CONCLUSIONS AND RECOMMENDATIONS
2018 Child Health Plan Plus Member Satisfaction Report for Health First Colorado Page 3-2
State of Colorado CO2017-18_CAHPS_CHP+_SatisfactionRpt_0918
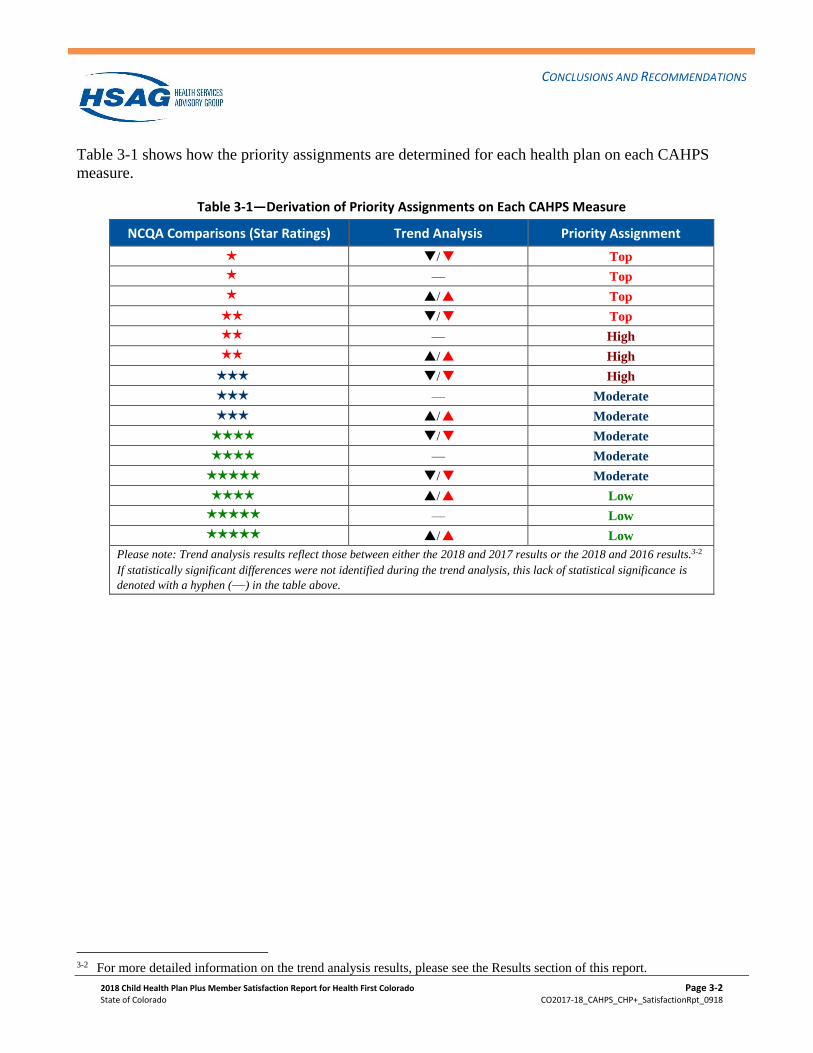
Table 3-1 shows how the priority assignments are determined for each health plan on each CAHPS
measure.
Table 3-1—Derivation of Priority Assignments on Each CAHPS Measure
NCQA Comparisons (Star Ratings) Trend Analysis Priority Assignment
H Q7/Q6 Top
H — Top
H P7/P6 Top
HH Q7/Q6 Top
HH — High
HH P7/P6 High
HHH Q7/Q6 High
HHH — Moderate
HHH P7/P6 Moderate
HHHH Q7/Q6 Moderate
HHHH — Moderate
HHHHH Q7/Q6 Moderate
HHHH P7/P6 Low
HHHHH — Low
HHHHH P7/P6 Low
Please note: Trend analysis results reflect those between either the 2018 and 2017 results or the 2018 and 2016 results.3-2
If statistically significant differences were not identified during the trend analysis, this lack of statistical significance is
denoted with a hyphen (—) in the table above.
3-2 For more detailed information on the trend analysis results, please see the Results section of this report.
CONCLUSIONS AND RECOMMENDATIONS
2018 Child Health Plan Plus Member Satisfaction Report for Health First Colorado Page 3-3
State of Colorado CO2017-18_CAHPS_CHP+_SatisfactionRpt_0918
Global Ratings
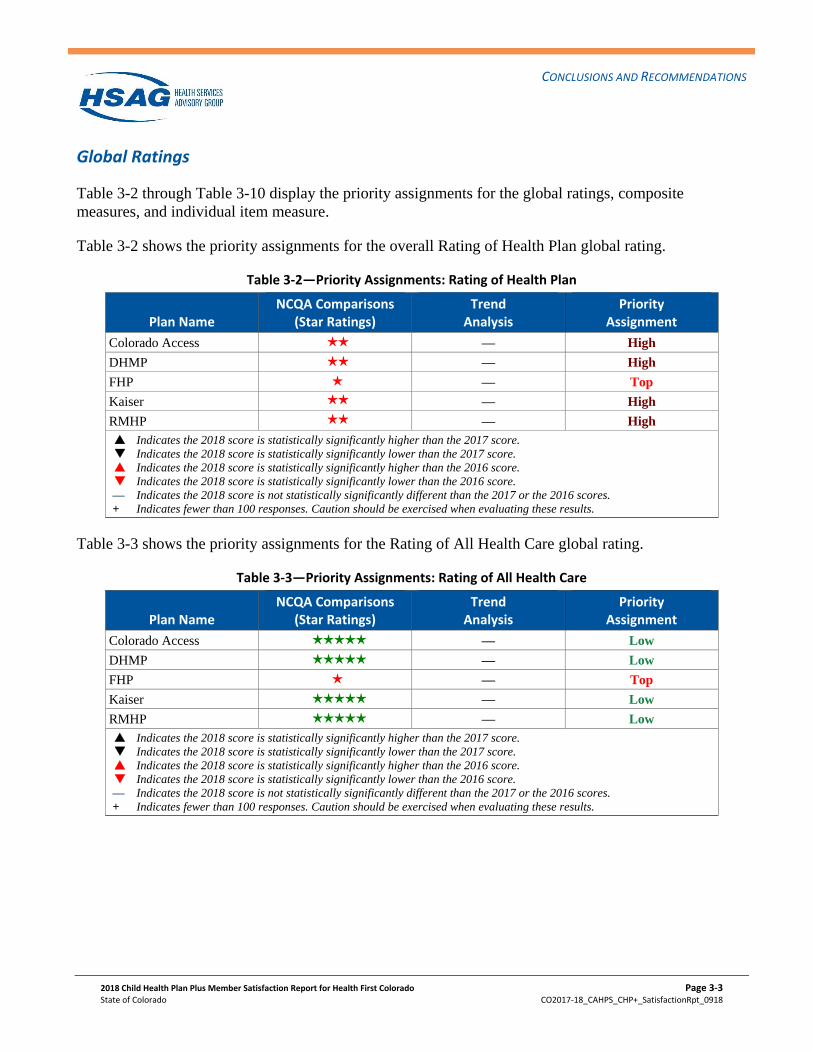
Table 3-2 through Table 3-10 display the priority assignments for the global ratings, composite
measures, and individual item measure.
Table 3-2 shows the priority assignments for the overall Rating of Health Plan global rating.
Table 3-2—Priority Assignments: Rating of Health Plan
Plan Name NCQA Comparisons
(Star Ratings) Trend
Analysis Priority
Assignment
Colorado Access HH — High
DHMP HH — High
FHP H — Top
Kaiser HH — High
RMHP HH — High
P7 Indicates the 2018 score is statistically significantly higher than the 2017 score.
Q7 Indicates the 2018 score is statistically significantly lower than the 2017 score.
P6 Indicates the 2018 score is statistically significantly higher than the 2016 score.
Q6 Indicates the 2018 score is statistically significantly lower than the 2016 score.
— Indicates the 2018 score is not statistically significantly different than the 2017 or the 2016 scores.
+ Indicates fewer than 100 responses. Caution should be exercised when evaluating these results.
Table 3-3 shows the priority assignments for the Rating of All Health Care global rating.
Table 3-3—Priority Assignments: Rating of All Health Care
Plan Name NCQA Comparisons
(Star Ratings) Trend
Analysis Priority
Assignment
Colorado Access HHHHH — Low
DHMP HHHHH — Low
FHP H — Top
Kaiser HHHHH — Low
RMHP HHHHH — Low
P7 Indicates the 2018 score is statistically significantly higher than the 2017 score.
Q7 Indicates the 2018 score is statistically significantly lower than the 2017 score.
P6 Indicates the 2018 score is statistically significantly higher than the 2016 score.
Q6 Indicates the 2018 score is statistically significantly lower than the 2016 score.
— Indicates the 2018 score is not statistically significantly different than the 2017 or the 2016 scores.
+ Indicates fewer than 100 responses. Caution should be exercised when evaluating these results.
CONCLUSIONS AND RECOMMENDATIONS
2018 Child Health Plan Plus Member Satisfaction Report for Health First Colorado Page 3-4
State of Colorado CO2017-18_CAHPS_CHP+_SatisfactionRpt_0918
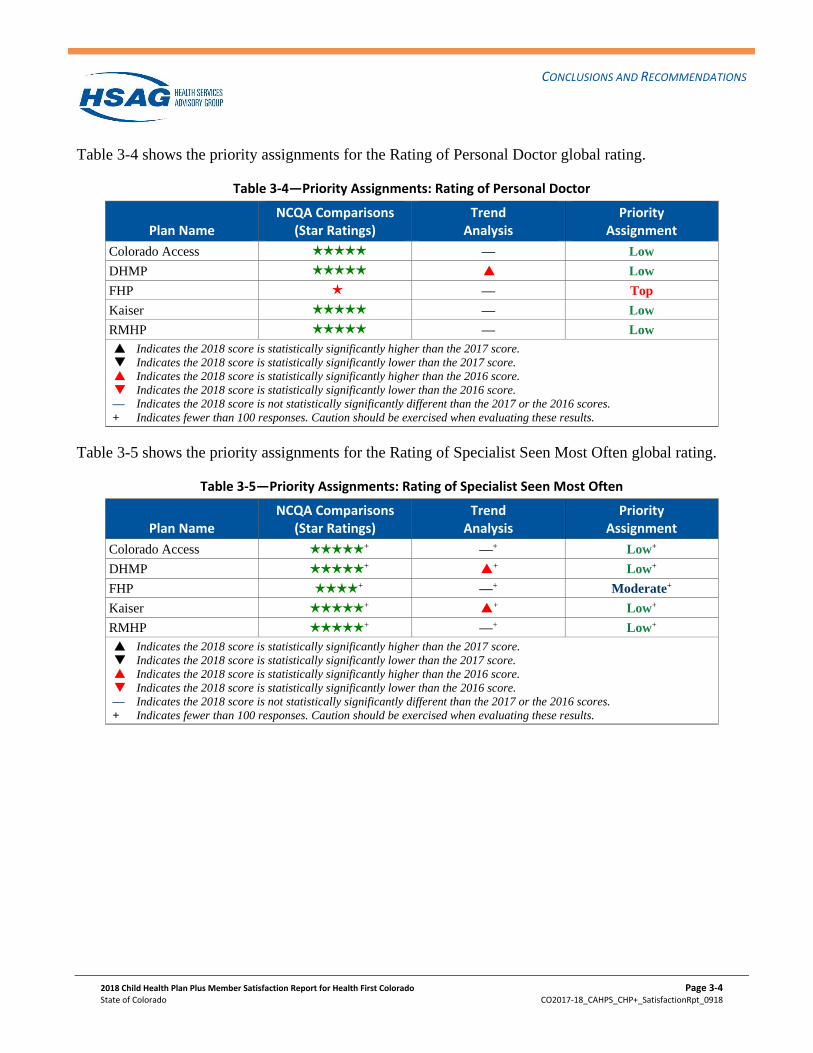
Table 3-4 shows the priority assignments for the Rating of Personal Doctor global rating.
Table 3-4—Priority Assignments: Rating of Personal Doctor
Plan Name NCQA Comparisons
(Star Ratings) Trend
Analysis Priority
Assignment
Colorado Access HHHHH — Low
DHMP HHHHH P6 Low
FHP H — Top
Kaiser HHHHH — Low
RMHP HHHHH — Low
P7 Indicates the 2018 score is statistically significantly higher than the 2017 score.
Q7 Indicates the 2018 score is statistically significantly lower than the 2017 score.
P6 Indicates the 2018 score is statistically significantly higher than the 2016 score.
Q6 Indicates the 2018 score is statistically significantly lower than the 2016 score.
— Indicates the 2018 score is not statistically significantly different than the 2017 or the 2016 scores.
+ Indicates fewer than 100 responses. Caution should be exercised when evaluating these results.
Table 3-5 shows the priority assignments for the Rating of Specialist Seen Most Often global rating.
Table 3-5—Priority Assignments: Rating of Specialist Seen Most Often
Plan Name NCQA Comparisons
(Star Ratings) Trend
Analysis Priority
Assignment
Colorado Access HHHHH + —+ Low+
DHMP HHHHH + P6+ Low+
FHP HHHH + —+ Moderate+
Kaiser HHHHH + P6+ Low+
RMHP HHHHH + —+ Low+
P7 Indicates the 2018 score is statistically significantly higher than the 2017 score.
Q7 Indicates the 2018 score is statistically significantly lower than the 2017 score.
P6 Indicates the 2018 score is statistically significantly higher than the 2016 score.
Q6 Indicates the 2018 score is statistically significantly lower than the 2016 score.
— Indicates the 2018 score is not statistically significantly different than the 2017 or the 2016 scores.
+ Indicates fewer than 100 responses. Caution should be exercised when evaluating these results.
CONCLUSIONS AND RECOMMENDATIONS
2018 Child Health Plan Plus Member Satisfaction Report for Health First Colorado Page 3-5
State of Colorado CO2017-18_CAHPS_CHP+_SatisfactionRpt_0918
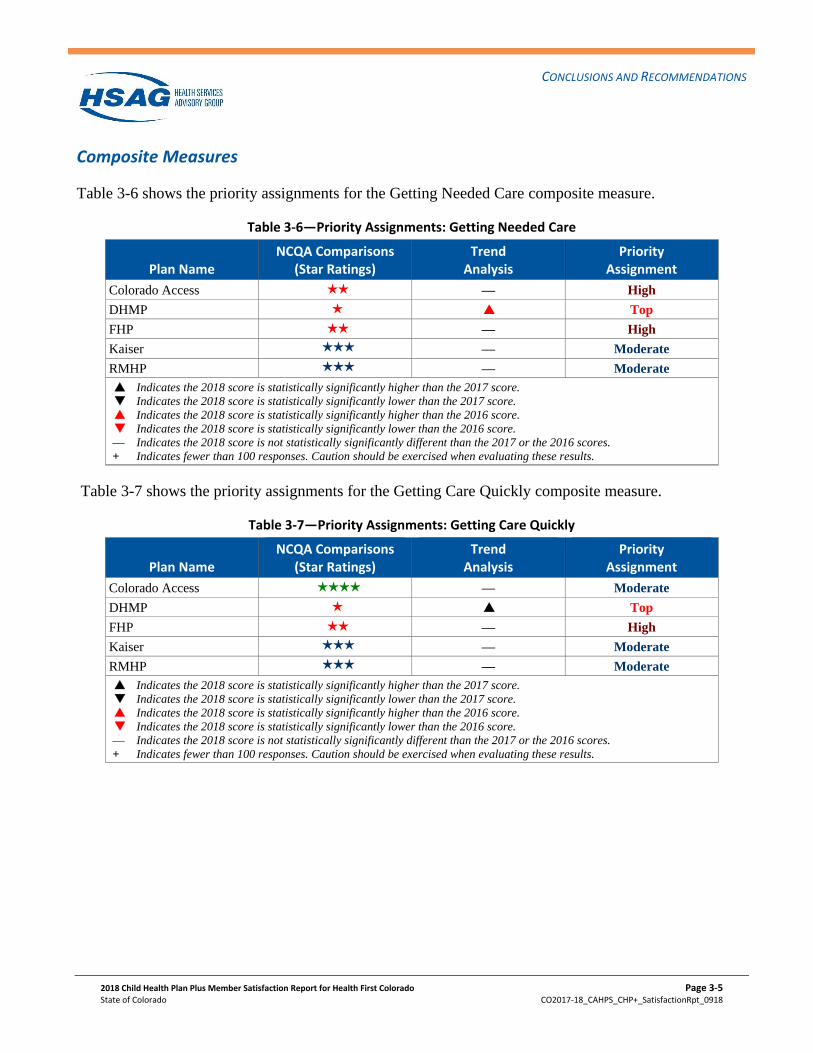
Composite Measures
Table 3-6 shows the priority assignments for the Getting Needed Care composite measure.
Table 3-6—Priority Assignments: Getting Needed Care
Plan Name NCQA Comparisons
(Star Ratings) Trend
Analysis Priority
Assignment
Colorado Access HH — High
DHMP H P6 Top
FHP HH — High
Kaiser HHH — Moderate
RMHP HHH — Moderate
P7 Indicates the 2018 score is statistically significantly higher than the 2017 score.
Q7 Indicates the 2018 score is statistically significantly lower than the 2017 score.
P6 Indicates the 2018 score is statistically significantly higher than the 2016 score.
Q6 Indicates the 2018 score is statistically significantly lower than the 2016 score.
— Indicates the 2018 score is not statistically significantly different than the 2017 or the 2016 scores.
+ Indicates fewer than 100 responses. Caution should be exercised when evaluating these results.
Table 3-7 shows the priority assignments for the Getting Care Quickly composite measure.
Table 3-7—Priority Assignments: Getting Care Quickly
Plan Name NCQA Comparisons
(Star Ratings) Trend
Analysis Priority
Assignment
Colorado Access HHHH — Moderate
DHMP H P7 Top
FHP HH — High
Kaiser HHH — Moderate
RMHP HHH — Moderate
P7 Indicates the 2018 score is statistically significantly higher than the 2017 score.
Q7 Indicates the 2018 score is statistically significantly lower than the 2017 score.
P6 Indicates the 2018 score is statistically significantly higher than the 2016 score.
Q6 Indicates the 2018 score is statistically significantly lower than the 2016 score.
— Indicates the 2018 score is not statistically significantly different than the 2017 or the 2016 scores.
+ Indicates fewer than 100 responses. Caution should be exercised when evaluating these results.
CONCLUSIONS AND RECOMMENDATIONS
2018 Child Health Plan Plus Member Satisfaction Report for Health First Colorado Page 3-6
State of Colorado CO2017-18_CAHPS_CHP+_SatisfactionRpt_0918
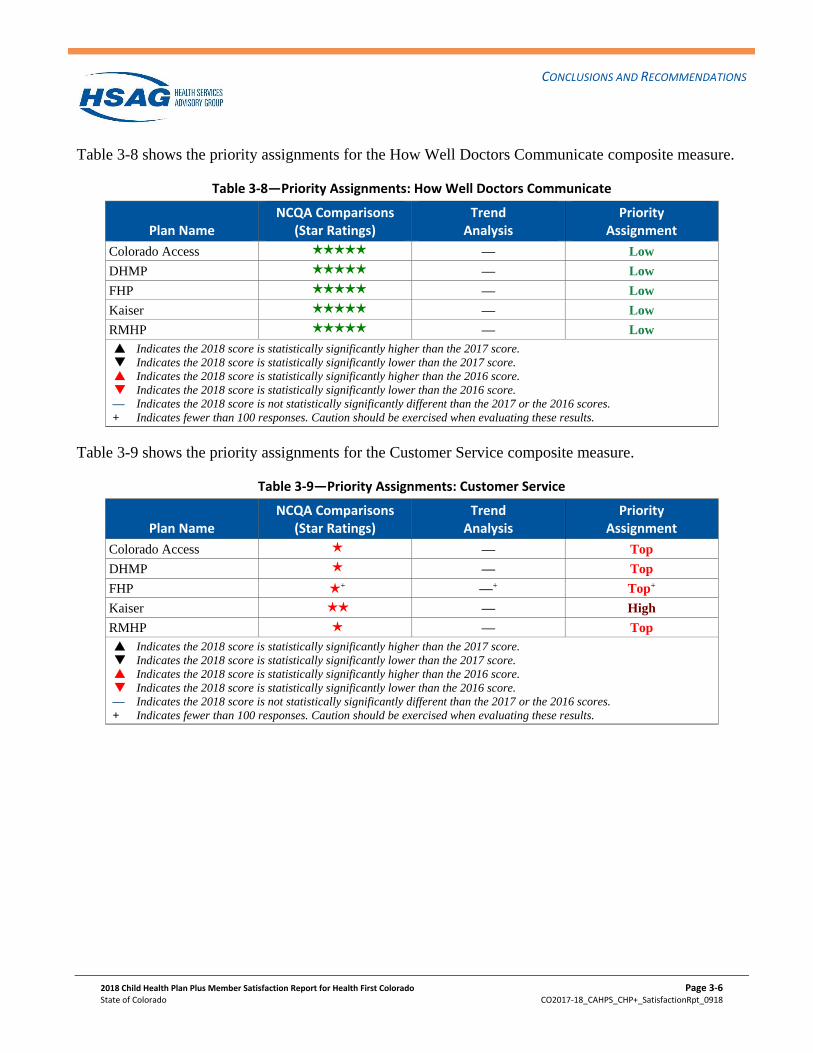
Table 3-8 shows the priority assignments for the How Well Doctors Communicate composite measure.
Table 3-8—Priority Assignments: How Well Doctors Communicate
Plan Name NCQA Comparisons
(Star Ratings) Trend
Analysis Priority
Assignment
Colorado Access HHHHH — Low
DHMP HHHHH — Low
FHP HHHHH — Low
Kaiser HHHHH — Low
RMHP HHHHH — Low
P7 Indicates the 2018 score is statistically significantly higher than the 2017 score.
Q7 Indicates the 2018 score is statistically significantly lower than the 2017 score.
P6 Indicates the 2018 score is statistically significantly higher than the 2016 score.
Q6 Indicates the 2018 score is statistically significantly lower than the 2016 score.
— Indicates the 2018 score is not statistically significantly different than the 2017 or the 2016 scores.
+ Indicates fewer than 100 responses. Caution should be exercised when evaluating these results.
Table 3-9 shows the priority assignments for the Customer Service composite measure.
Table 3-9—Priority Assignments: Customer Service
Plan Name NCQA Comparisons
(Star Ratings) Trend
Analysis Priority
Assignment
Colorado Access H — Top
DHMP H — Top
FHP H + —+ Top+
Kaiser HH — High
RMHP H — Top
P7 Indicates the 2018 score is statistically significantly higher than the 2017 score.
Q7 Indicates the 2018 score is statistically significantly lower than the 2017 score.
P6 Indicates the 2018 score is statistically significantly higher than the 2016 score.
Q6 Indicates the 2018 score is statistically significantly lower than the 2016 score.
— Indicates the 2018 score is not statistically significantly different than the 2017 or the 2016 scores.
+ Indicates fewer than 100 responses. Caution should be exercised when evaluating these results.
HHH
H
H
HHHH
HH
P7
Q7
P6
Q6
-----------.... HSAG HEALTH SERVICES
ADVISORY GROUP
"'------
CONCLUSIONS AND RECOMMENDATIONS
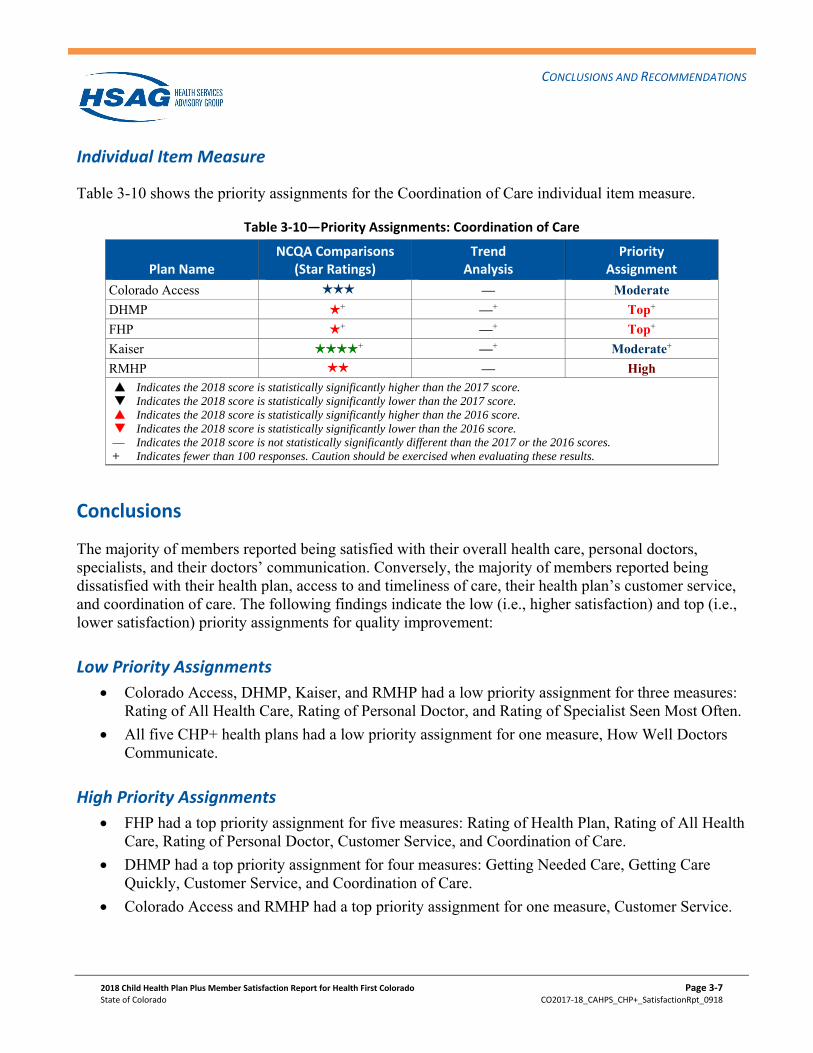
Individual Item Measure
Table 3-10 shows the priority assignments for the Coordination of Care individual item measure.
Table 3‐10—Priority Assignments: Coordination of Care
Plan Name NCQA Comparisons
(Star Ratings) Trend
Analysis Priority
Assignment
Colorado Access — Moderate
DHMP + —+ Top+
FHP + —+ Top+
Kaiser + —+ Moderate+
RMHP — High Indicates the 2018 score is statistically significantly higher than the 2017 score. Indicates the 2018 score is statistically significantly lower than the 2017 score. Indicates the 2018 score is statistically significantly higher than the 2016 score. Indicates the 2018 score is statistically significantly lower than the 2016 score. — Indicates the 2018 score is not statistically significantly different than the 2017 or the 2016 scores. + Indicates fewer than 100 responses. Caution should be exercised when evaluating these results.
Conclusions
The majority of members reported being satisfied with their overall health care, personal doctors, specialists, and their doctors’ communication. Conversely, the majority of members reported being dissatisfied with their health plan, access to and timeliness of care, their health plan’s customer service, and coordination of care. The following findings indicate the low (i.e., higher satisfaction) and top (i.e., lower satisfaction) priority assignments for quality improvement:
Low Priority Assignments
Colorado Access, DHMP, Kaiser, and RMHP had a low priority assignment for three measures: Rating of All Health Care, Rating of Personal Doctor, and Rating of Specialist Seen Most Often.
All five CHP+ health plans had a low priority assignment for one measure, How Well Doctors Communicate.
High Priority Assignments
FHP had a top priority assignment for five measures: Rating of Health Plan, Rating of All Health Care, Rating of Personal Doctor, Customer Service, and Coordination of Care.
DHMP had a top priority assignment for four measures: Getting Needed Care, Getting Care Quickly, Customer Service, and Coordination of Care.
Colorado Access and RMHP had a top priority assignment for one measure, Customer Service.
2018 Child Health Plan Plus Member Satisfaction Report for Health First Colorado Page 3‐7 State of Colorado CO2017‐18_CAHPS_CHP+_SatisfactionRpt_0918
-----------.... HSAG HEALTH SERVICES
ADVISORY GROUP
"'------
CONCLUSIONS AND RECOMMENDATIONS
General Recommendations
Colorado could benefit from continuing administration of the CHP+ CAHPS Survey per the following:
Continued benchmarking and trend analysis
The opportunity for longitudinal studies
Continued implementation of Colorado’s Quality Strategy
Continued use of administrative data in identifying the Spanish-speaking population. There were 512 completed surveys in Spanish for the FY 2017-2018 survey administration, which accounted for approximately 27 percent of the total number of responses.
The opportunity for those health plans with statistically significantly higher ratings sharing “best practices” among the other health plans
Quality Improvement Recommendations
The following QI recommendations are based on the results of the low priority assignments for the five Colorado CHP+ health plans. Each health plan should evaluate these recommendations in the context of its own operational and QI activities. The following includes best practices and other proven strategies that may be used or adapted by the CHP+ health plans in order to improve the overall priority assignment ratings.
Perform Root Cause Analyses
The health plans could conduct root cause analyses of study indicators that have been identified as areas of low performance. This type of analysis is typically conducted to investigate process deficiencies and unexplained outcomes to identify causes and devise potential improvement strategies. If used to study deficiencies in care or services provided to members, root cause analyses would enable the health plans to better understand the nature and scope of problems, identify causes and their interrelationships, identify specific populations for targeted interventions, and establish potential performance improvement strategies and solutions. Methods commonly used to conduct root cause analyses include process flow mapping, which is used to define and analyze processes and identify opportunities for process improvement, and the four-stage Plan-Do-Study-Act (PDSA) problem-solving model used for continuous process improvement.3-3
Conduct Frequent Assessments of Targeted Interventions
Continuous quality improvement (CQI) is a cyclical, data-driven process in which small-scale, incremental changes are identified, implemented, and measured to improve a process or system, similar
3-3 Plan-Do-Study-Act (PDSA) Worksheet. Institute for Healthcare Improvement. Available at: http://www.ihi.org/knowledge/Pages/Tools/PlanDoStudyActWorksheet.aspx. Accessed on: August 14, 2018.
2018 Child Health Plan Plus Member Satisfaction Report for Health First Colorado Page 3‐8 State of Colorado CO2017‐18_CAHPS_CHP+_SatisfactionRpt_0918
-----------.... HSAG HEALTH SERVICES
ADVISORY GROUP
"'------
CONCLUSIONS AND RECOMMENDATIONS
to the PDSA problem-solving model. Changes that demonstrate improvement can then be standardized and implemented on a broader scale. To support continuous, cyclical improvement, the health plans should frequently measure and monitor targeted interventions. Key data should be collected and reviewed regularly to provide timely, ongoing feedback regarding the effectiveness of interventions in achieving desired results. A variety of methods can be used for CQI data collection and analysis, including surveys, interviews, focus groups, “round table” sessions, document reviews, and benchmarking.
Facilitate Coordinated Care
Health plans should assist in facilitating the process of coordinated care to ensure child members are receiving the care and services most appropriate for their health care needs. This effort should extend beyond typical care coordination between a primary care provider and another health care provider to include cross-system coordination. This ensures that coordination occurs between primary care providers and home health services, schools, mental health systems, or other institutional systems. Cross systems collaboration finds solutions to community problems, streamlines access to and expedites service delivery, and promises to impact social determinants of health. It addresses the multi-faceted needs of various populations that individual programs are not designed to address, specifically for children from at-risk families and youth involved with the child welfare system. Coordinated care is most effective when care coordinators and providers organize their efforts to deliver the same message to parents or caretakers of child members, who are more likely to play an active role in the management of their child’s health care. Additionally, providing patient registries or clinical information systems that allow providers and care coordinators to enter and view information on patients (e.g., notes from a telephone call with a parent or caretaker or a child’s physician visit) can help reduce duplication of services and facilitate care coordination.
Customer Service
Health plans should keep their members engaged through regular communications about programs and services available through their health plan. Also, they should educate members about the health plan’s programs that meet their individualized cost and care needs and guide them through the application and enrollment process. Health plans should ensure that their websites are informative and easy to navigate, especially for new members. Also, health plans should implement self-service options, which ensures that data are shared consistently across systems (e.g., mobile, web, interactive voice response [IVR], etc.) and that members have easy access to help through web virtual health assistants and chat features. This helps decrease the amount of inbound calls and contact resolution, provides a seamless experience for members to get their questions answered, and provides clinical advice to assess members’ conditions along with the appropriate follow-up. Proactive engagement, including text, email, and automated voice notifications, helps inform members of appointments and further actions required and lets members know the status of claims and when preventive services, such as flu shots, are available.
2018 Child Health Plan Plus Member Satisfaction Report for Health First Colorado Page 3‐9 State of Colorado CO2017‐18_CAHPS_CHP+_SatisfactionRpt_0918
-----------.... HSAG HEALTH SERVICES
ADVISORY GROUP
"'------
CONCLUSIONS AND RECOMMENDATIONS
Access to Care
Health plans should identify potential barriers for parents or caretakers of child members receiving appropriate access to care. Access to care issues include obtaining the care that the parent and/or physician deemed necessary, obtaining timely urgent care, or locating a personal doctor for a child. Establishing standard practices and protocols, including scripts for common occurrences within the provider office setting could ensure that access to care issues are handled consistently across all health plans. Also, health plans should continue efforts to expand the availability of evening and weekend hours by adopting alternative schedules. Additionally, health plans should encourage or incentivize provider practices to collaborate for providing extended hours of operation if the individual provider is solely unable to do so.
Key Drivers of Satisfaction Analysis
The Department could consider conducting a key drivers of satisfaction analysis for future reporting to identify the specific survey questions that could be driving satisfaction. This analysis would help to identify specific aspects of care that are most likely to benefit from QI activities. A key drivers of satisfaction analysis would assist the Department in identifying and targeting specific areas for QI. The analysis could provide information, such as how well the health plans are performing on a survey item and how that survey item correlates to members’ overall satisfaction. In many cases there are common key drivers across multiple measures; therefore, rather than focusing exclusively on improving a single measure, a common key driver of performance may influence multiple measures.
2018 Child Health Plan Plus Member Satisfaction Report for Health First Colorado Page 3‐10 State of Colorado CO2017‐18_CAHPS_CHP+_SatisfactionRpt_0918
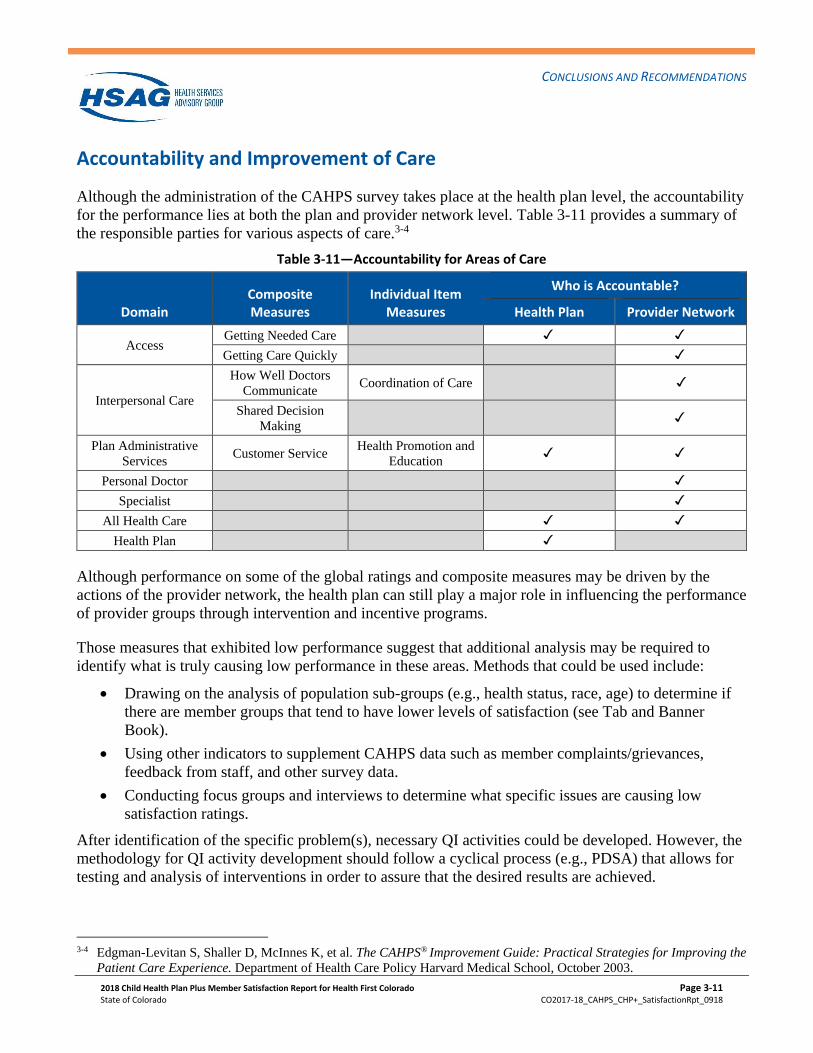
CONCLUSIONS AND RECOMMENDATIONS
2018 Child Health Plan Plus Member Satisfaction Report for Health First Colorado Page 3-11
State of Colorado CO2017-18_CAHPS_CHP+_SatisfactionRpt_0918
Accountability and Improvement of Care
Although the administration of the CAHPS survey takes place at the health plan level, the accountability
for the performance lies at both the plan and provider network level. Table 3-11 provides a summary of
the responsible parties for various aspects of care.3-4
Table 3-11—Accountability for Areas of Care
Domain Composite Measures
Individual Item Measures
Who is Accountable?
Health Plan Provider Network
Access Getting Needed Care
Getting Care Quickly
Interpersonal Care
How Well Doctors
Communicate Coordination of Care
Shared Decision
Making
Plan Administrative
Services Customer Service
Health Promotion and
Education
Personal Doctor
Specialist
All Health Care
Health Plan
Although performance on some of the global ratings and composite measures may be driven by the
actions of the provider network, the health plan can still play a major role in influencing the performance
of provider groups through intervention and incentive programs.
Those measures that exhibited low performance suggest that additional analysis may be required to
identify what is truly causing low performance in these areas. Methods that could be used include:
• Drawing on the analysis of population sub-groups (e.g., health status, race, age) to determine if
there are member groups that tend to have lower levels of satisfaction (see Tab and Banner
Book).
• Using other indicators to supplement CAHPS data such as member complaints/grievances,
feedback from staff, and other survey data.
• Conducting focus groups and interviews to determine what specific issues are causing low
satisfaction ratings.
After identification of the specific problem(s), necessary QI activities could be developed. However, the
methodology for QI activity development should follow a cyclical process (e.g., PDSA) that allows for
testing and analysis of interventions in order to assure that the desired results are achieved.
3-4 Edgman-Levitan S, Shaller D, McInnes K, et al. The CAHPS® Improvement Guide: Practical Strategies for Improving the
Patient Care Experience. Department of Health Care Policy Harvard Medical School, October 2003.
2018 Child Health Plan Plus Member Satisfaction Report for Health First Colorado Page 4-1
State of Colorado CO2017-18_CAHPS_CHP+_SatisfactionRpt_0918
4. Reader’s Guide
This section provides a comprehensive overview of CAHPS, including the CAHPS Survey
administration protocol and analytic methodology. It is designed to provide supplemental information to
the reader that may aid in the interpretation and use of the CAHPS results presented in this report.
Survey Administration
Survey Overview
The survey instrument selected was the CAHPS 5.0 Child Medicaid Health Plan Survey with the HEDIS
supplemental item set. The CAHPS 5.0 Health Plan Surveys are a set of standardized surveys that assess
patient perspectives on care. Originally, CAHPS was a five-year collaborative project sponsored by the
Agency for Healthcare Research and Quality (AHRQ). The CAHPS questionnaires and consumer
reports were developed under cooperative agreements among AHRQ, Harvard Medical School, RAND,
and the Research Triangle Institute (RTI). In 1997, NCQA, in conjunction with AHRQ, created the
CAHPS 2.0H Survey measure as part of NCQA’s HEDIS.4-1 In 2002, AHRQ convened the CAHPS
Instrument Panel to re-evaluate and update the CAHPS Health Plan Surveys and to improve the state-of-
the-art methods for assessing members’ experiences with care.4-2 The result of this re-evaluation and
update process was the development of the CAHPS 3.0H Health Plan Surveys. The goal of the CAHPS
3.0H Health Plan Surveys was to effectively and efficiently obtain information from the person
receiving care. In 2006, AHRQ released the CAHPS 4.0 Health Plan Surveys. Based on the CAHPS 4.0
versions, NCQA introduced new HEDIS versions of the Adult Health Plan Survey in 2007 and the Child
Health Plan Survey in 2009, which are referred to as the CAHPS 4.0H Health Plan Surveys.4-3,4-4 In
2012, AHRQ released the CAHPS 5.0 Health Plan Surveys. Based on the CAHPS 5.0 versions, NCQA
introduced new HEDIS versions of the Adult and Child Health Plan Surveys in August 2012, which are
referred to as the CAHPS 5.0 Health Plan Surveys.4-5
4-1 National Committee for Quality Assurance. HEDIS® 2002, Volume 3: Specifications for Survey Measures. Washington,
DC: NCQA Publication, 2001. 4-2 National Committee for Quality Assurance. HEDIS® 2003, Volume 3: Specifications for Survey Measures. Washington,
DC: NCQA Publication, 2002. 4-3 National Committee for Quality Assurance. HEDIS® 2007, Volume 3: Specifications for Survey Measures. Washington,
DC: NCQA Publication, 2006. 4-4 National Committee for Quality Assurance. HEDIS® 2009, Volume 3: Specifications for Survey Measures. Washington,
DC: NCQA Publication, 2008. 4-5 National Committee for Quality Assurance. HEDIS® 2013, Volume 3: Specifications for Survey Measures. Washington,
DC: NCQA Publication, 2012.
READER’S GUIDE
2018 Child Health Plan Plus Member Satisfaction Report for Health First Colorado Page 4-2
State of Colorado CO2017-18_CAHPS_CHP+_SatisfactionRpt_0918
The sampling and data collection procedures for the CAHPS 5.0 Health Plan Survey are designed to
capture accurate and complete information about consumer-reported experiences with health care. The
sampling and data collection procedures promote both the standardized administration of survey
instruments and the comparability of the resulting health plan data. The sampling and data collection
procedures for the CAHPS 5.0 Health Plan Surveys are designed to capture accurate and complete
information about consumer-reported experiences with health care. The sampling and data collection
procedures promote both the standardized administration of survey instruments and the comparability of
the resulting health plan data.
The CAHPS 5.0 Child Medicaid Health Plan Survey includes 48 core questions that yield 11 measures
of satisfaction. These measures include four global rating questions, five composite measures, and two
individual item measures. The global measures (also referred to as global ratings) reflect overall
satisfaction with the health plan, health care, personal doctors, and specialists. The composite measures
are sets of questions grouped together to address different aspects of care (e.g., “Getting Needed Care”
or “Getting Care Quickly”). The individual item measures are individual questions that look at a specific
area of care (i.e., “Coordination of Care” and “Health Promotion and Education”).
Table 4-1 lists the global ratings, composite measures, and individual item measures included in the
CAHPS 5.0 Child Medicaid Health Plan Survey.
Table 4-1—CAHPS Measures
Global Ratings Composite Measures Individual Item Measures
Rating of Health Plan Getting Needed Care Coordination of Care
Rating of All Health Care Getting Care Quickly Health Promotion and Education
Rating of Personal Doctor How Well Doctors
Communicate
Rating of Specialist Seen Most
Often Customer Service
Shared Decision Making
READER’S GUIDE
2018 Child Health Plan Plus Member Satisfaction Report for Health First Colorado Page 4-3
State of Colorado CO2017-18_CAHPS_CHP+_SatisfactionRpt_0918
Sampling Procedures
NCQA specifications require that health plans provide a list of all eligible members for the sampling
frame. Following these requirements, sampled members included those who met the following criteria:
• Were age 17 or younger as of December 31, 2017.
• Were currently enrolled in Colorado Access, DHMP, FHP, Kaiser, or RMHP.
• Had been continuously enrolled for at least five of the last six months of 2017.
• Had Medicaid as a payer.
Additionally, NCQA specifications require a sample size of 1,650 members for the CAHPS 5.0 Child
Medicaid Health Plan Survey. For Colorado Access, DHMP, Kaiser, and RMHP, a total random sample
of 1,650 child members was selected from these health plans. FHP did not meet the minimum sample
size criteria; therefore, 1,166 child members were selected from FHP’s eligible population. The selected
survey samples were random samples with no more than one member being selected per household.
Survey Protocol
Table 4-2 shows the standard mixed mode (i.e., mail followed by telephone follow-up) CAHPS timeline
used in the administration of the Colorado CAHPS 5.0 Child Medicaid Health Plan Surveys. The
timeline is based on NCQA HEDIS Specifications for Survey Measures.4-6
Table 4-2—CAHPS 5.0 Mixed-Mode Survey Timeline
Task Timeline
Send first questionnaire with cover letter to the parent/caretaker of child member. 0 days
Send a postcard reminder to non-respondents four to 10 days after mailing the first
questionnaire. 4 – 10 days
Send a second questionnaire (and letter) to non-respondents approximately 35
days after mailing the first questionnaire. 35 days
Send a second postcard reminder to non-respondents four to 10 days after mailing
the second questionnaire. 39 – 45 days
Initiate CATI interviews for non-respondents approximately 21 days after mailing
the second questionnaire. 56 days
Initiate systematic contact for all non-respondents such that at least three
telephone calls are attempted at different times of the day, on different days of the
week, and in different weeks.
56 – 70 days
Telephone follow-up sequence completed (i.e., completed interviews obtained or
maximum calls reached for all non-respondents) approximately 14 days after
initiation.
70 days
4-6 National Committee for Quality Assurance. HEDIS® 2018, Volume 3: Specifications for Survey Measures. Washington,
DC: NCQA Publication, 2017.
READER’S GUIDE
2018 Child Health Plan Plus Member Satisfaction Report for Health First Colorado Page 4-4
State of Colorado CO2017-18_CAHPS_CHP+_SatisfactionRpt_0918
The CAHPS 5.0 Health Plan Survey process allowed for two methods by which surveys could be
completed. The first phase, or mail phase, consisted of a survey being mailed to all sampled members.
For CHP+ health plans, those members who were identified as Spanish-speaking through administrative
data were mailed a Spanish version of the survey. Members that were not identified as Spanish-speaking
received an English version of the survey. The English and Spanish versions of the survey included a
toll-free number that members could call to request a survey in another language (i.e., English or
Spanish). A reminder postcard was sent to all non-respondents, followed by a second survey mailing and
reminder postcard. The second phase, or telephone phase, consisted of CATI of sampled members who
had not mailed in a completed survey. A series of up to six CATI calls was made to each non-
respondent. It has been shown that the addition of the telephone phase aids in the reduction of non-
response bias by increasing the number of respondents who are more demographically representative of
a health plan’s population.4-7
HSAG inspected a sample of the file records to check for any apparent problems with the files, such as
missing address elements. The entire sample of records from each population was passed through the
United States Postal Service’s National Change of Address (NCOA) system to obtain new addresses for
members who had moved (if they had given the Postal Service a new address). Prior to initiating CATI,
HSAG employed the Telematch telephone number verification service to locate and/or update telephone
numbers for all non-respondents.
The specifications also require that the name of the health plan appear in the questionnaires and cover
letters; that the letters bear the signature of a high-ranking health plan or state official; and that the
questionnaire packages include a postage-paid reply envelope addressed to the organization conducting
the surveys. HSAG followed these specifications.
4-7 Fowler FJ Jr., Gallagher PM, Stringfellow VL, et al. “Using Telephone Interviews to Reduce Nonresponse Bias to Mail
Surveys of Health Plan Members.” Medical Care. 2002; 40(3): 190-200.
READER’S GUIDE
2018 Child Health Plan Plus Member Satisfaction Report for Health First Colorado Page 4-5
State of Colorado CO2017-18_CAHPS_CHP+_SatisfactionRpt_0918
Methodology
HSAG used the CAHPS scoring approach recommended by NCQA in Volume 3 of HEDIS
Specifications for Survey Measures. Based on NCQA’s recommendations and HSAG’s extensive
experience evaluating CAHPS data, a number of analyses were performed to comprehensively assess
member satisfaction with the CHP+ health plans. This section provides an overview of each analysis.
Response Rates
The administration of the CAHPS 5.0 Child Medicaid Health Plan Survey is comprehensive and is
designed to achieve the highest possible response rate. NCQA defines the response rate as the total
number of completed surveys divided by all eligible members of the sample.4-8 A member’s survey was
assigned a disposition code of “completed” if at least three of the following five questions were
answered: 3, 15, 27, 31, and 36. Eligible members include the entire sample minus ineligible members.
Ineligible members of the sample met one or more of the following criteria: were deceased, were invalid
(did not meet criteria described on page 4-3), or had a language barrier.
Response Rate = Number of Completed Surveys
Sample - Ineligibles
Child and Respondent Demographics
The demographic analysis evaluated child and self-reported demographic information from survey
respondents.
4-8 National Committee for Quality Assurance. HEDIS® 2018, Volume 3: Specifications for Survey Measures. Washington,
DC: NCQA Publication, 2017.
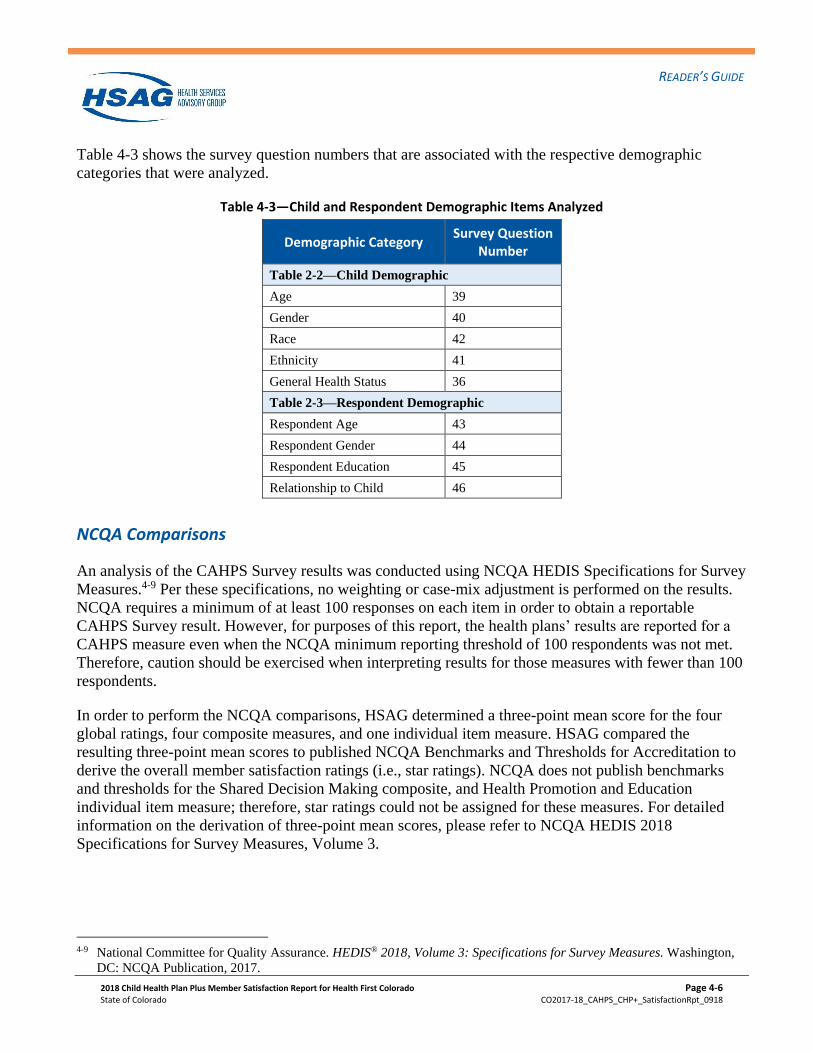
READER’S GUIDE
2018 Child Health Plan Plus Member Satisfaction Report for Health First Colorado Page 4-6
State of Colorado CO2017-18_CAHPS_CHP+_SatisfactionRpt_0918
Table 4-3 shows the survey question numbers that are associated with the respective demographic
categories that were analyzed.
Table 4-3—Child and Respondent Demographic Items Analyzed
Demographic Category Survey Question
Number
Table 2-2—Child Demographic
Age 39
Gender 40
Race 42
Ethnicity 41
General Health Status 36
Table 2-3—Respondent Demographic
Respondent Age 43
Respondent Gender 44
Respondent Education 45
Relationship to Child 46
NCQA Comparisons
An analysis of the CAHPS Survey results was conducted using NCQA HEDIS Specifications for Survey
Measures.4-9 Per these specifications, no weighting or case-mix adjustment is performed on the results.
NCQA requires a minimum of at least 100 responses on each item in order to obtain a reportable
CAHPS Survey result. However, for purposes of this report, the health plans’ results are reported for a
CAHPS measure even when the NCQA minimum reporting threshold of 100 respondents was not met.
Therefore, caution should be exercised when interpreting results for those measures with fewer than 100
respondents.
In order to perform the NCQA comparisons, HSAG determined a three-point mean score for the four
global ratings, four composite measures, and one individual item measure. HSAG compared the
resulting three-point mean scores to published NCQA Benchmarks and Thresholds for Accreditation to
derive the overall member satisfaction ratings (i.e., star ratings). NCQA does not publish benchmarks
and thresholds for the Shared Decision Making composite, and Health Promotion and Education
individual item measure; therefore, star ratings could not be assigned for these measures. For detailed
information on the derivation of three-point mean scores, please refer to NCQA HEDIS 2018
Specifications for Survey Measures, Volume 3.
4-9 National Committee for Quality Assurance. HEDIS® 2018, Volume 3: Specifications for Survey Measures. Washington,
DC: NCQA Publication, 2017.
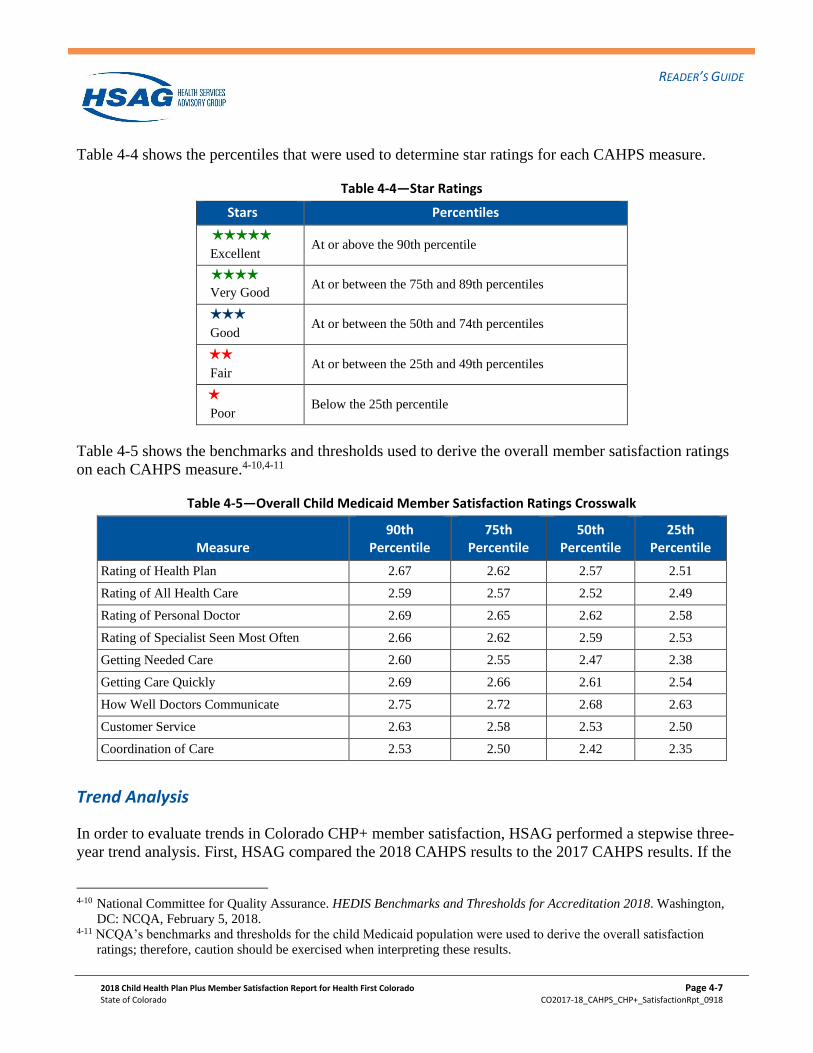
READER’S GUIDE
2018 Child Health Plan Plus Member Satisfaction Report for Health First Colorado Page 4-7
State of Colorado CO2017-18_CAHPS_CHP+_SatisfactionRpt_0918
Table 4-4 shows the percentiles that were used to determine star ratings for each CAHPS measure.
Table 4-4—Star Ratings
Stars Percentiles
HHHHH Excellent
At or above the 90th percentile
HHHH
Very Good At or between the 75th and 89th percentiles
HHH
Good At or between the 50th and 74th percentiles
HH
Fair At or between the 25th and 49th percentiles
H Poor
Below the 25th percentile
Table 4-5 shows the benchmarks and thresholds used to derive the overall member satisfaction ratings
on each CAHPS measure.4-10,4-11
Table 4-5—Overall Child Medicaid Member Satisfaction Ratings Crosswalk
Measure 90th
Percentile 75th
Percentile 50th
Percentile 25th
Percentile
Rating of Health Plan 2.67 2.62 2.57 2.51
Rating of All Health Care 2.59 2.57 2.52 2.49
Rating of Personal Doctor 2.69 2.65 2.62 2.58
Rating of Specialist Seen Most Often 2.66 2.62 2.59 2.53
Getting Needed Care 2.60 2.55 2.47 2.38
Getting Care Quickly 2.69 2.66 2.61 2.54
How Well Doctors Communicate 2.75 2.72 2.68 2.63
Customer Service 2.63 2.58 2.53 2.50
Coordination of Care 2.53 2.50 2.42 2.35
Trend Analysis
In order to evaluate trends in Colorado CHP+ member satisfaction, HSAG performed a stepwise three-
year trend analysis. First, HSAG compared the 2018 CAHPS results to the 2017 CAHPS results. If the
4-10 National Committee for Quality Assurance. HEDIS Benchmarks and Thresholds for Accreditation 2018. Washington,
DC: NCQA, February 5, 2018. 4-11 NCQA’s benchmarks and thresholds for the child Medicaid population were used to derive the overall satisfaction
ratings; therefore, caution should be exercised when interpreting these results.
READER’S GUIDE
2018 Child Health Plan Plus Member Satisfaction Report for Health First Colorado Page 4-8
State of Colorado CO2017-18_CAHPS_CHP+_SatisfactionRpt_0918
initial 2018 and 2017 trend analysis did not yield any significant differences, then HSAG performed an
additional trend analysis between the 2018 and 2016 results. For purposes of this analysis, HSAG
calculated question summary rates for each global rating and individual item measure, and global
proportions for each composite measure. Both the question summary rates and global proportions were
calculated in accordance with NCQA HEDIS Specifications for Survey Measures.4-12 The scoring of the
global ratings, composite measures, and individual item measures involved assigning top-box rates a
score of one, with all other responses receiving a score of zero. After applying this scoring methodology,
HSAG calculated the percentage of top-box rates in order to determine the question summary rates and
global proportions. For additional details, please refer to the NCQA HEDIS 2018 Specifications for
Survey Measures, Volume 3.
A difference is considered statistically significant if the two-sided p value of the t test is less than 0.05.
Scores that were statistically significantly higher in 2018 than in 2017 are noted with black upward (P7)
triangles. Scores that were statistically significantly lower in 2018 than in 2017 are noted with black
downward (Q7) triangles. Scores that were statistically significantly higher in 2018 than in 2016 are
noted with red upward (P6) triangles. Scores that were statistically significantly lower in 2018 than in
2016 are noted with red downward (Q6) triangles. Scores in 2018 that were not statistically significantly
different from scores in 2017 or in 2016 are not noted with triangles.
For purposes of this report, health plans’ results are reported for a CAHPS measure even when the
NCQA minimum reporting threshold of 100 respondents was not met. Therefore, caution should be
exercised when interpreting results for those measures with fewer than 100 respondents.
4-12 National Committee for Quality Assurance. HEDIS® 2018, Volume 3: Specifications for Survey Measures. Washington,
DC: NCQA Publication, 2017.
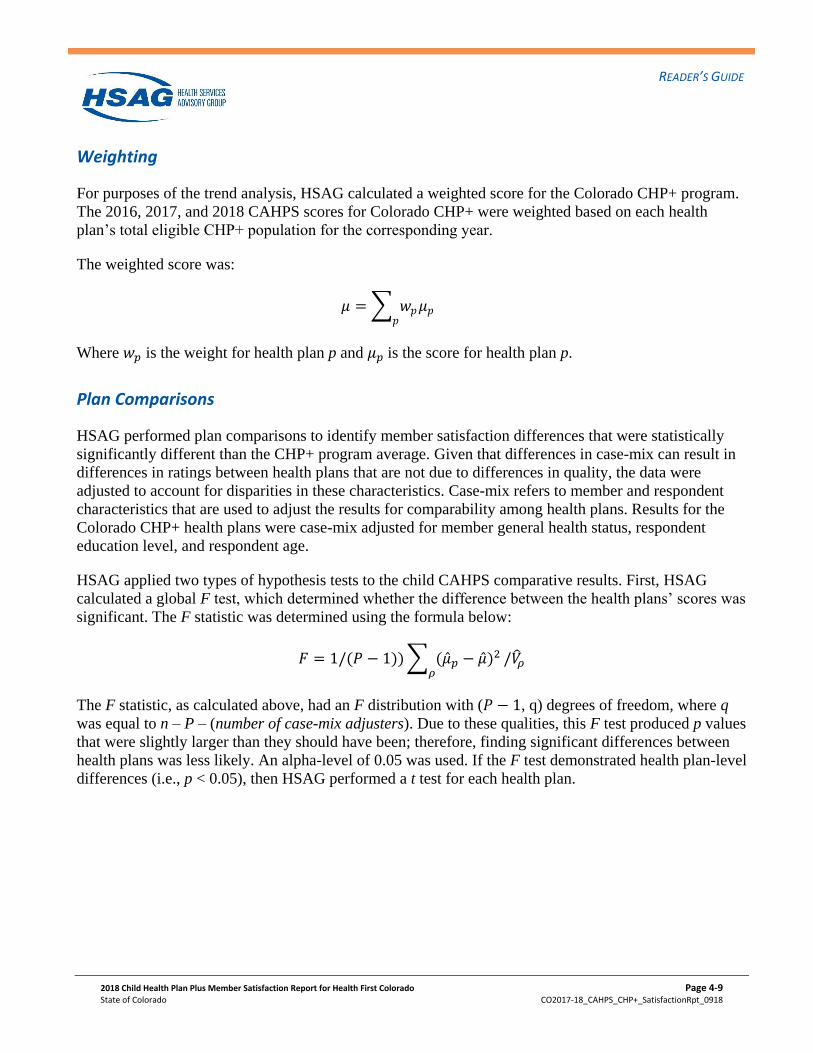
READER’S GUIDE
2018 Child Health Plan Plus Member Satisfaction Report for Health First Colorado Page 4-9
State of Colorado CO2017-18_CAHPS_CHP+_SatisfactionRpt_0918
Weighting
For purposes of the trend analysis, HSAG calculated a weighted score for the Colorado CHP+ program.
The 2016, 2017, and 2018 CAHPS scores for Colorado CHP+ were weighted based on each health
plan’s total eligible CHP+ population for the corresponding year.
The weighted score was:
𝜇 = ∑ 𝑤𝑝 𝜇𝑝𝑝
Where 𝑤𝑝 is the weight for health plan p and 𝜇𝑝 is the score for health plan p.
Plan Comparisons
HSAG performed plan comparisons to identify member satisfaction differences that were statistically
significantly different than the CHP+ program average. Given that differences in case-mix can result in
differences in ratings between health plans that are not due to differences in quality, the data were
adjusted to account for disparities in these characteristics. Case-mix refers to member and respondent
characteristics that are used to adjust the results for comparability among health plans. Results for the
Colorado CHP+ health plans were case-mix adjusted for member general health status, respondent
education level, and respondent age.
HSAG applied two types of hypothesis tests to the child CAHPS comparative results. First, HSAG
calculated a global F test, which determined whether the difference between the health plans’ scores was
significant. The F statistic was determined using the formula below:
𝐹 = 1/(𝑃 − 1)) ∑ (�̂�𝑝 − �̂�)2
𝜌/�̂�𝜌
The F statistic, as calculated above, had an F distribution with (𝑃 − 1, q) degrees of freedom, where q
was equal to n – P – (number of case-mix adjusters). Due to these qualities, this F test produced p values
that were slightly larger than they should have been; therefore, finding significant differences between
health plans was less likely. An alpha-level of 0.05 was used. If the F test demonstrated health plan-level
differences (i.e., p < 0.05), then HSAG performed a t test for each health plan.
READER’S GUIDE
2018 Child Health Plan Plus Member Satisfaction Report for Health First Colorado Page 4-10
State of Colorado CO2017-18_CAHPS_CHP+_SatisfactionRpt_0918
The t test determined whether each health plan’s score was significantly different from the overall
results of the other Colorado CHP+ health plans. The equation for the differences was as follows:
∆𝑝= �̂�𝑝 −∑ �̂�𝑝′𝑝′
𝑃= (1 −
1
𝑃) �̂�𝑝 −
∑ �̂�𝑝′∗𝑝′
𝑃
In this equation, Σ∗ was the sum of all health plans except health plan p.
The variance of ∆𝑝was:
�̂�(∆𝑝) = (1 −1
𝑃)
2
�̂�𝑝 +∑ �̂�𝑝′
∗𝑝′
𝑃2
The t statistic was ∆𝑝
√�̂�(∆𝑝) and had a t distribution with n – P – (number of case-mix adjusters) degrees of
freedom. This statistic also produced p values that were slightly larger than they should have been;
therefore, finding significant differences between a health plan p and the combined results of all
Colorado CHP+ health plans was less likely.
For the plan comparisons, no threshold number of responses was required for the results to be reported.
Measures with less than 100 responses are denoted with a cross (+). Caution should be used when
evaluating rates derived from fewer than 100 respondents.
Limitations and Cautions
The findings presented in this CAHPS report are subject to some limitations in the survey design,
analysis, and interpretation. These limitations should be considered carefully when interpreting or
generalizing the findings. These limitations are discussed below.
Case-Mix Adjustment
While data for the plan comparisons have been adjusted for differences in survey-reported general health
status, age, and education, it was not possible to adjust for differences in member and respondent
characteristics that were not measured. These characteristics include income, employment, or any other
characteristics that may not be under the health plans’ control.
Non-Response Bias
The experiences of the survey respondent population may be different than that of non-respondents with
respect to their health care services. Therefore, the potential for non-response bias should be considered
when interpreting CAHPS results.
READER’S GUIDE
2018 Child Health Plan Plus Member Satisfaction Report for Health First Colorado Page 4-11
State of Colorado CO2017-18_CAHPS_CHP+_SatisfactionRpt_0918
Causal Inferences
Although this report examines whether members report differences in satisfaction with various aspects
of their health care experiences, these differences may not be completely attributable to the CHP+ health
plan. The survey by itself does not necessarily reveal the exact cause of these differences.
Quality Improvement References
The CAHPS surveys were originally developed to meet the needs of consumers for usable, relevant
information on quality of care from the members’ perspectives. However, they also play an important
role as a QI tool for health care organizations, which can use the standardized data and results to identify
relative strengths and weaknesses in their performance, determine where they need to improve, and track
their progress over time. The following references offer guidance on possible approaches to CAHPS-
related QI activities.4-13
AHRQ Health Care Innovations Exchange Web site. Improving Cultural Competency in Children’s
Health Care: Expanding Perspectives. Available at:
https://innovations.ahrq.gov/qualitytools/improving-cultural-competency-childrens-health-care-
expanding-perspectives. Accessed on: August 14, 2018.
AHRQ Health Care Innovations Exchange Web site. Improving Quality and Achieving Equity: A Guide
for Hospital Leaders. Available at: https://innovations.ahrq.gov/qualitytools/improving-quality-and-
achieving-equity-guide-hospital-leaders. Accessed on: August 14, 2018.
AHRQ Health Care Innovations Exchange Web site. Interactive Workshops Enhance Access to Health
Education and Screenings, Improve Outcomes for Low-Income and Minority Women. Available at:
https://innovations.ahrq.gov/profiles/interactive-workshops-enhance-access-health-education-and-
screenings-improve-outcomes-low. Accessed on: August 14, 2018.
AHRQ Health Care Innovations Exchange Web site. Online Tools and Services Activate Plan Enrollees
and Engage Them in Their Care, Enhance Efficiency, and Improve Satisfaction and Retention. Available
at: https://innovations.ahrq.gov/profiles/online-tools-and-services-activate-plan-enrollees-and-engage-
them-their-care-enhance. Accessed on: August 14, 2018.
AHRQ Health Care Innovations Exchange Web site. Health Plan’s Comprehensive Strategy Involving
Physician Incentives and Targeted Recruitment Enhances Patient Access to Language-Concordant
Physicians. Available at: https://innovations.ahrq.gov/profiles/health-plans-comprehensive-strategy-
involving-physician-incentives-and-targeted-recruitment. Accessed on: August 14, 2018.
4-13 Agency for Healthcare Research and Quality. Improving Patient Experience. Available at:
http://www.ahrq.gov/cahps/quality-improvement/index.html. Accessed on: August 14, 2018.
READER’S GUIDE
2018 Child Health Plan Plus Member Satisfaction Report for Health First Colorado Page 4-12
State of Colorado CO2017-18_CAHPS_CHP+_SatisfactionRpt_0918
American Academy of Pediatrics Web site. Open Access Scheduling. Available at:
https://www.aap.org/en-us/professional-resources/practice-transformation/managing-
practice/Pages/open-access-scheduling.aspx. Accessed on: August 14, 2018.
Ansell D, Crispo JAG, Simard B, Bjerre LM. Interventions to reduce wait times for primary care
appointments: a systematic review. BMC Health Services Research. 2017; 17(295). Available at:
https://bmchealthservres.biomedcentral.com/track/pdf/10.1186/s12913-017-2219-y. Accessed on:
August 14, 2018.
Backer LA. Strategies for better patient flow and cycle time. Family Practice Management. 2002; 9(6):
45-50. Available at: http://www.aafp.org/fpm/20020600/45stra.html. Accessed on: August 14, 2018.
Berwick DM. A user’s manual for the IOM’s ‘Quality Chasm’ report. Health Affairs. 2002; 21(3): 80-
90. Available at: https://www.healthaffairs.org/doi/full/10.1377/hlthaff.21.3.80. Accessed on: August
14, 2018.
Better Together Toolkit. Available at: http://www.ipfcc.org/events/better-together.html. Accessed on:
August 14, 2018.
Conway J, Johnson B, Edgman-Levitan S, et al. Partnering with patients and families to design a patient-
and family-centered health care system: A roadmap for the future. Institute for Patient- and Family-
Centered Care. Available at: http://www.ipfcc.org/resources/Roadmap.pdf. Accessed on: August 14,
2018.
Edgman-Levitan S, Shaller D, McInnes K, et al. The CAHPS® Improvement Guide: Practical Strategies
for Improving the Patient Care Experience. June 27, 2012. Available at:
http://www.pcpci.org/sites/default/files/resources/The%20CAHPS%20Improvement%20Guide.pdf.
Accessed on: August 14, 2018.
Flores G. Language barriers to health care in the United States. The New England Journal of Medicine.
2006; 355(3): 229-31. Available at: https://www.nejm.org/doi/full/10.1056/NEJMp058316. Accessed
on: August 14, 2018.
Fong Ha J, Longnecker N. Doctor-patient communication: a review. The Ochsner Journal. 2010; 10(1):
38-43. Available at: http://www.ncbi.nlm.nih.gov/pmc/articles/PMC3096184/pdf/i1524-5012-10-1-
38.pdf. Accessed on: August 14, 2018.
Fottler MD, Ford RC, Heaton CP. Achieving Service Excellence: Strategies for Healthcare (Second
Edition). Chicago, IL: Health Administration Press; 2010.
HealthyPeople.gov Website. Access to Health Services. Available at:
https://www.healthypeople.gov/2020/topics-objectives/topic/Access-to-Health-Services. Accessed on:
August 14, 2018.
READER’S GUIDE
2018 Child Health Plan Plus Member Satisfaction Report for Health First Colorado Page 4-13
State of Colorado CO2017-18_CAHPS_CHP+_SatisfactionRpt_0918
Heath S. Assessing CAHPS Surveys, Patient Satisfaction with Machine Learning. Patient Engagement
HIT. February 2018. Available at: https://patientengagementhit.com/news/assessing-cahps-surveys-
patient-satisfaction-with-machine-learning. Accessed on: August 14, 2018.
Heath S. How Patient Education Tools Improve Chronic Disease Management. Patient Engagement
HIT. January 2017. Available at: https://patientengagementhit.com/news/how-patient-education-tools-
improve-chronic-disease-management. Accessed on: August 14, 2018.
Heath S. Using Shared Decision-Making to Improve Patient Engagement. Patient Engagement HIT.
Available at: https://patientengagementhit.com/features/using-shared-decision-making-to-improve-
patient-engagement. Accessed on: August 14, 2018.
Houck S. What Works: Effective Tools & Case Studies to Improve Clinical Office Practice. Boulder,
CO: HealthPress Publishing; 2004.
Institute for Healthcare Improvement Web site. Decrease Demand for Appointments. Available at:
http://www.ihi.org/knowledge/Pages/Changes/DecreaseDemandforAppointments.aspx. Accessed on:
August 14, 2018.
Institute for Healthcare Improvement Web site. Office Visit Cycle Time. Available at:
http://www.ihi.org/knowledge/Pages/Measures/OfficeVisitCycleTime.aspx. Accessed on: August 14,
2018.
Institute for Healthcare Improvement Web site. Reduce Scheduling Complexity: Maintain Truth in
Scheduling. Available at:
http://www.ihi.org/knowledge/Pages/Changes/ReduceSchedulingComplexity.aspx. Accessed on: August
14, 2018.
Institute for Patient- and Family-Centered Care. Changing Hospital “Visiting” Policies and Practices:
Supporting Family Presence and Participation. Available at:
http://www.ipfcc.org/resources/visiting.pdf. Accessed on: August 14, 2018.
Institute for Patient- and Family-Centered Care. Partnering with Patients and Families to Enhance
Safety and Quality: A Mini Toolkit. Available at: http://www.ipfcc.org/resources/Patient-Safety-Toolkit-
04.pdf. Accessed on: August 14, 2018.
Johnson B, Abraham M, Conway J, et al. Partnering with patients and families to design a patient- and
family-centered health care system: Recommendations and promising practices. Institute for Patient- and
Family-Centered Care. Available at:
http://www.ipfcc.org/resources/PartneringwithPatientsandFamilies.pdf. Accessed on: August 14, 2018.
Juckett G, Unger K. Appropriate Use of Medical Interpreters. Am Fam Physician. 2014 Oct 1;90(7):476-
480. Available at: https://www.aafp.org/afp/2014/1001/p476.html. Accessed on: August 14, 2018.
READER’S GUIDE
2018 Child Health Plan Plus Member Satisfaction Report for Health First Colorado Page 4-14
State of Colorado CO2017-18_CAHPS_CHP+_SatisfactionRpt_0918
Matthew B. KevinMD Web site. How to navigate the language barrier with patients. February 2017.
Available at: https://www.kevinmd.com/blog/2017/02/navigate-language-barrier-patients.html.
Accessed on: August 14, 2018.
Landro L. The Talking Cure for Health Care. The Wall Street Journal. 2014. Available at:
http://online.wsj.com/article/SB10001424127887323628804578346223960774296.html. Accessed on:
August 14, 2018.
Lovaglio PG. Benchmarking Strategies for Measuring the Quality of Healthcare: Problems and
Prospects. The Scientific World Journal. 2011; 2012. Available at:
https://www.hindawi.com/journals/tswj/2012/606154/. Accessed on: August 14, 2018.
Major DA. Utilizing role theory to help employed parents cope with children’s chronic illness. Health
Education Research. 2003; 18 (1): 45-57
McDonald KM, Schultz E, Chapman T, et al. Prospects for Care Coordination Measurement Using
Electronic Data Sources. Agency for Healthcare Research and Quality, March 2012.
Patient language barriers: Why physicians are responsible. Medical Economics. August 2015. Available
at: http://www.medicaleconomics.com/health-law-policy/patient-language-barriers-why-physicians-are-
responsible. Accessed on: August 14, 2018.
Murray M. Reducing waits and delays in the referral process. Family Practice Management. 2002; 9(3):
39-42. Available at: http://www.aafp.org/fpm/2002/0300/p39.html. Accessed on: August 14, 2018.
Quigley D, Wiseman S, Farley D. Improving Performance For Health Plan Customer Service: A Case
Study of a Successful CAHPS Quality Improvement Intervention. Rand Health Working Paper; 2007.
Available at: http://www.rand.org/pubs/working_papers/WR517. Accessed on: August 14, 2018.
Reinertsen JL, Bisognano M, Pugh MD. Seven Leadership Leverage Points for Organization-Level
Improvement in Health Care (Second Edition). Cambridge, MA: Institute for Healthcare Improvement;
2008.
Schaefer J, Miller D, Goldstein M, et al. Partnering in Self-Management Support: A Toolkit for
Clinicians. Cambridge, MA: Institute for Healthcare Improvement; 2009. Available at:
http://www.improvingchroniccare.org/downloads/selfmanagement_support_toolkit_for_clinicians_2012
_update.pdf. Accessed on: August 14, 2018.
Simons D, Pires SA, Hendricks T, and Lipper J. Intensive care coordination using high-quality
wraparound: state and community profiles. Center for Health Care Strategies. July 2014. Available at:
http://www.chcs.org/resource/intensive-care-coordination-using-high-quality-wraparound-children-
serious-behavioral-health-needs-state-community-profiles/. Accessed on: August 14, 2018.
Smith BA, and Kaye DL. Treating parents of children with chronic conditions: the role of the general
psychiatrist. Focus. 2012; X (3): 255-265.
READER’S GUIDE
2018 Child Health Plan Plus Member Satisfaction Report for Health First Colorado Page 4-15
State of Colorado CO2017-18_CAHPS_CHP+_SatisfactionRpt_0918
Stevenson A, Barry C, Britten N, et al. Doctor-patient communication about drugs: the evidence for
shared decision making. Social Science & Medicine. 2000; 50: 829-840.
The CAHPS Ambulatory Care Improvement Guide : Practical Strategies for Improving Patient
Experience. June 2016. Agency for Healthcare Research and Quality, Rockville, MD. Available at :
http://www.ahrq.gov/cahps/quality-improvement/improvement-guide/improvement-guide.html.
Accessed on: August 14, 2018.
Travaline J, Ruchinskas, R, D'Alonzo GE, Jr. Patient-Physician Communication: Why and How. The
Journal of the American Osteopathic Association. 2005; 105: 13-18. Available at:
http://jaoa.org/article.aspx?articleid=2093086. Accessed on: August 14, 2018.
Wasson JH, Godfrey MM, Nelson EC, et al. Microsystems in health care: Part 4. Planning patient-
centered care. Joint Commission Journal on Quality and Safety. 2003; 29(5): 227-237. Available at:
http://howsyourhealth.com/html/CARE.pdf. Accessed on: August 14, 2018.
Wiitala K, Metzger MA, Hwang A. Consumer Engagement in Medicaid Accountable Care
Organizations: A Review of Practices in Six States. Center for Consumer Engagement in Health
Innovation. 2016. Available at:
https://www.communitycatalyst.org/resources/publications/document/ConsumerEngagementMedicaidA
COs.pdf?1474915709. Accessed on: August 14, 2018.
Wilson-Stronks A, Lee KK, Cordero CL, Kopp AL, and Galvez E. One Size DoesNot Fit All: Meeting
the Health Care Needs of Diverse Populations. The Joint Commission. 2008. Available at:
https://www.jointcommission.org/assets/1/6/HLCOneSizeFinal.pdf. Accessed on: August 14, 2018.
Winters NC, and Metz WP. The wraparound approach in systems of care. Psychiatric Clinics. Mar
2009; 32 (1): 135-151.
2018 Child Health Plan Plus Member Satisfaction Report for Health First Colorado Page 5-1
State of Colorado CO2017-18_CAHPS_CHP+_SatisfactionRpt_0918
5. Survey Instrument
The survey instrument selected for the 2018 Colorado CHP+ Member Satisfaction Survey was the
CAHPS 5.0 Child Medicaid Health Plan Survey with the HEDIS supplemental item set without CCC
measurement set. This section provides a copy of the survey instrument.
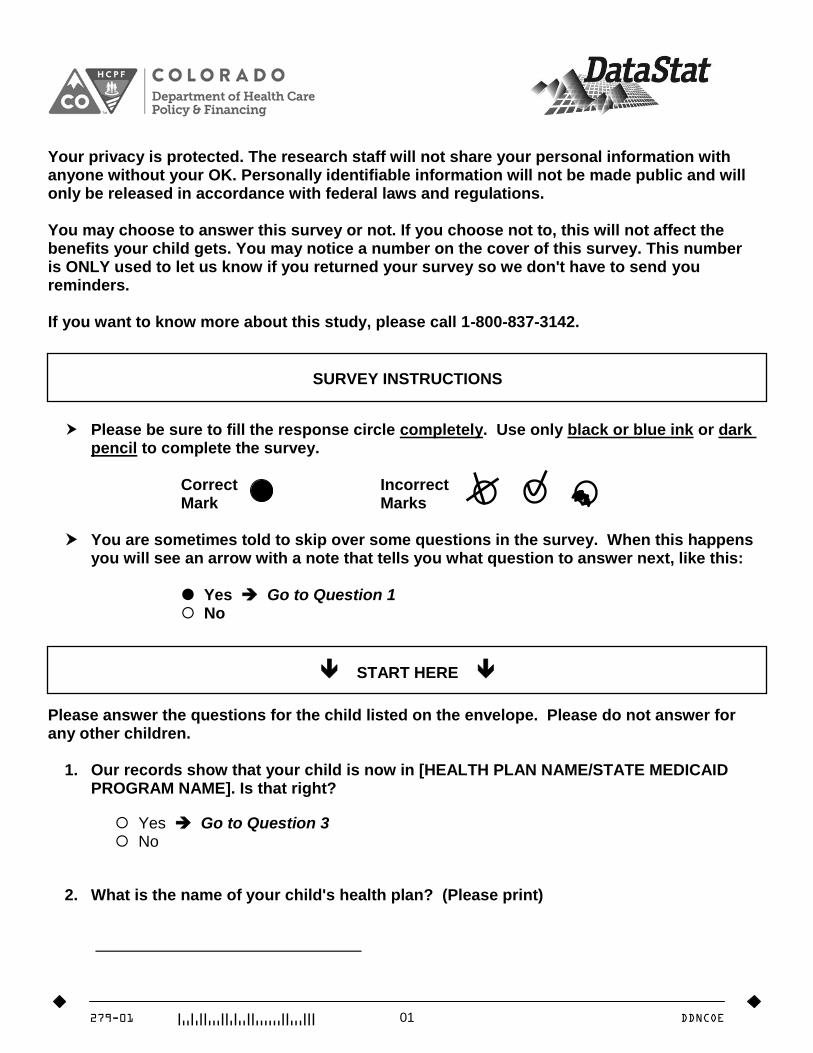
279-01 01 DDNCOE
Your privacy is protected. The research staff will not share your personal information with anyone without your OK. Personally identifiable information will not be made public and will only be released in accordance with federal laws and regulations. You may choose to answer this survey or not. If you choose not to, this will not affect the benefits your child gets. You may notice a number on the cover of this survey. This number is ONLY used to let us know if you returned your survey so we don't have to send you reminders. If you want to know more about this study, please call 1-800-837-3142.
SURVEY INSTRUCTIONS
Please be sure to fill the response circle completely. Use only black or blue ink or dark
pencil to complete the survey.
Correct Incorrect Mark Marks
You are sometimes told to skip over some questions in the survey. When this happens you will see an arrow with a note that tells you what question to answer next, like this:
Yes Go to Question 1 No
START HERE
Please answer the questions for the child listed on the envelope. Please do not answer for any other children. 1. Our records show that your child is now in [HEALTH PLAN NAME/STATE MEDICAID
PROGRAM NAME]. Is that right?
Yes Go to Question 3 No
2. What is the name of your child's health plan? (Please print)
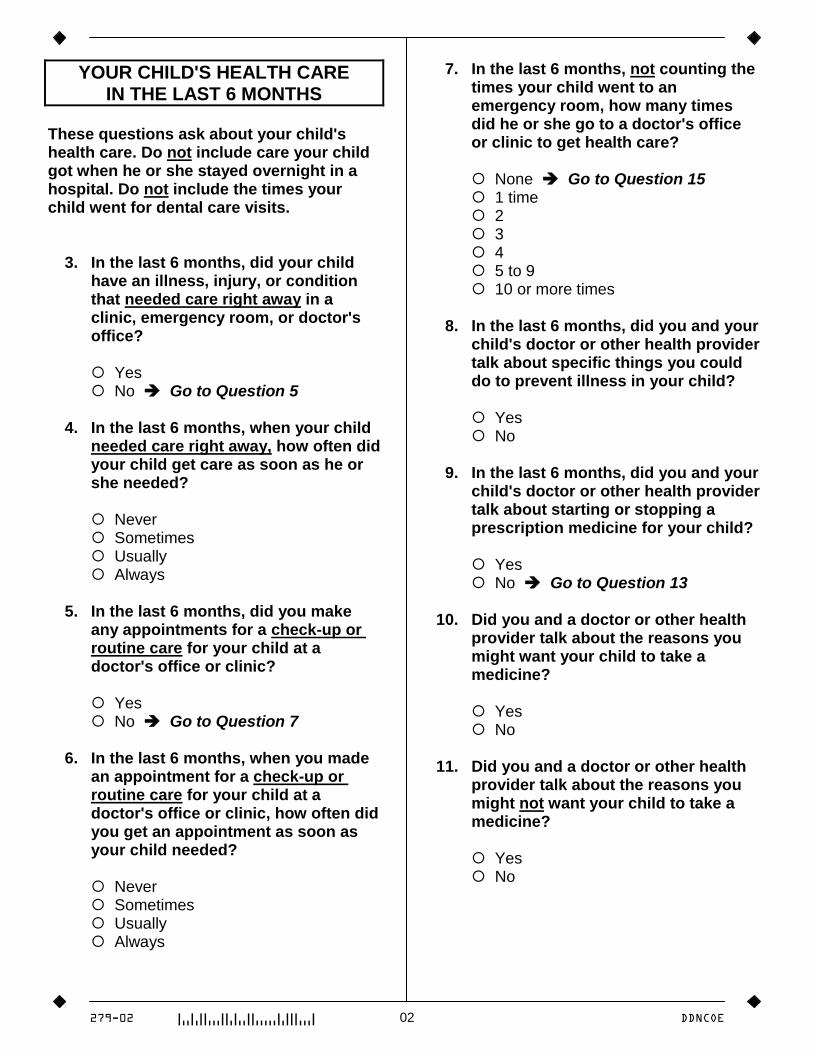
279-02 02 DDNCOE
YOUR CHILD'S HEALTH CARE IN THE LAST 6 MONTHS
These questions ask about your child's health care. Do not include care your child got when he or she stayed overnight in a hospital. Do not include the times your child went for dental care visits. 3. In the last 6 months, did your child
have an illness, injury, or condition that needed care right away in a clinic, emergency room, or doctor's office?
Yes No Go to Question 5 4. In the last 6 months, when your child
needed care right away, how often did your child get care as soon as he or she needed?
Never Sometimes Usually Always 5. In the last 6 months, did you make
any appointments for a check-up or routine care for your child at a doctor's office or clinic?
Yes No Go to Question 7 6. In the last 6 months, when you made
an appointment for a check-up or routine care for your child at a doctor's office or clinic, how often did you get an appointment as soon as your child needed?
Never Sometimes Usually Always
7. In the last 6 months, not counting the times your child went to an emergency room, how many times did he or she go to a doctor's office or clinic to get health care?
None Go to Question 15 1 time 2 3 4 5 to 9 10 or more times 8. In the last 6 months, did you and your
child's doctor or other health provider talk about specific things you could do to prevent illness in your child?
Yes No 9. In the last 6 months, did you and your
child's doctor or other health provider talk about starting or stopping a prescription medicine for your child?
Yes No Go to Question 13 10. Did you and a doctor or other health
provider talk about the reasons you might want your child to take a medicine?
Yes No 11. Did you and a doctor or other health
provider talk about the reasons you might not want your child to take a medicine?
Yes No
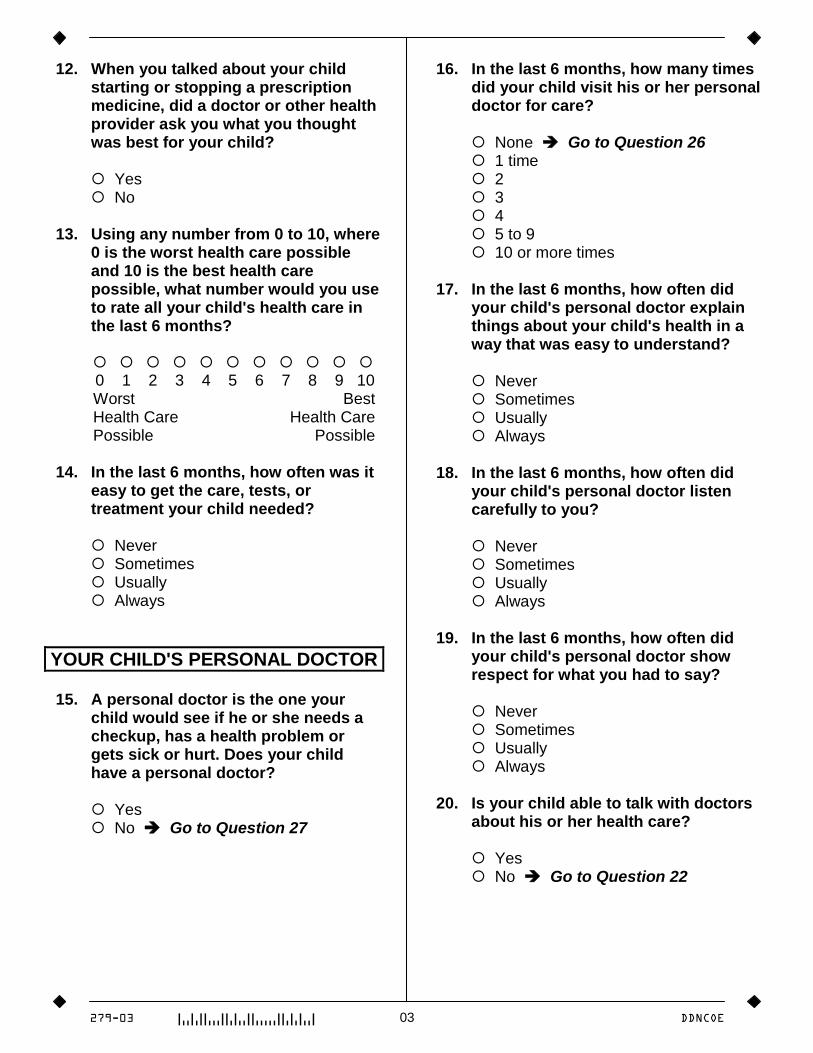
279-03 03 DDNCOE
12. When you talked about your child starting or stopping a prescription medicine, did a doctor or other health provider ask you what you thought was best for your child?
Yes No 13. Using any number from 0 to 10, where
0 is the worst health care possible and 10 is the best health care possible, what number would you use to rate all your child's health care in the last 6 months?
0 1 2 3 4 5 6 7 8 9 10 Worst Best Health Care Health Care Possible Possible 14. In the last 6 months, how often was it
easy to get the care, tests, or treatment your child needed?
Never Sometimes Usually Always
YOUR CHILD'S PERSONAL DOCTOR 15. A personal doctor is the one your
child would see if he or she needs a checkup, has a health problem or gets sick or hurt. Does your child have a personal doctor?
Yes No Go to Question 27
16. In the last 6 months, how many times did your child visit his or her personal doctor for care?
None Go to Question 26 1 time 2 3 4 5 to 9 10 or more times 17. In the last 6 months, how often did
your child's personal doctor explain things about your child's health in a way that was easy to understand?
Never Sometimes Usually Always 18. In the last 6 months, how often did
your child's personal doctor listen carefully to you?
Never Sometimes Usually Always 19. In the last 6 months, how often did
your child's personal doctor show respect for what you had to say?
Never Sometimes Usually Always 20. Is your child able to talk with doctors
about his or her health care?
Yes No Go to Question 22
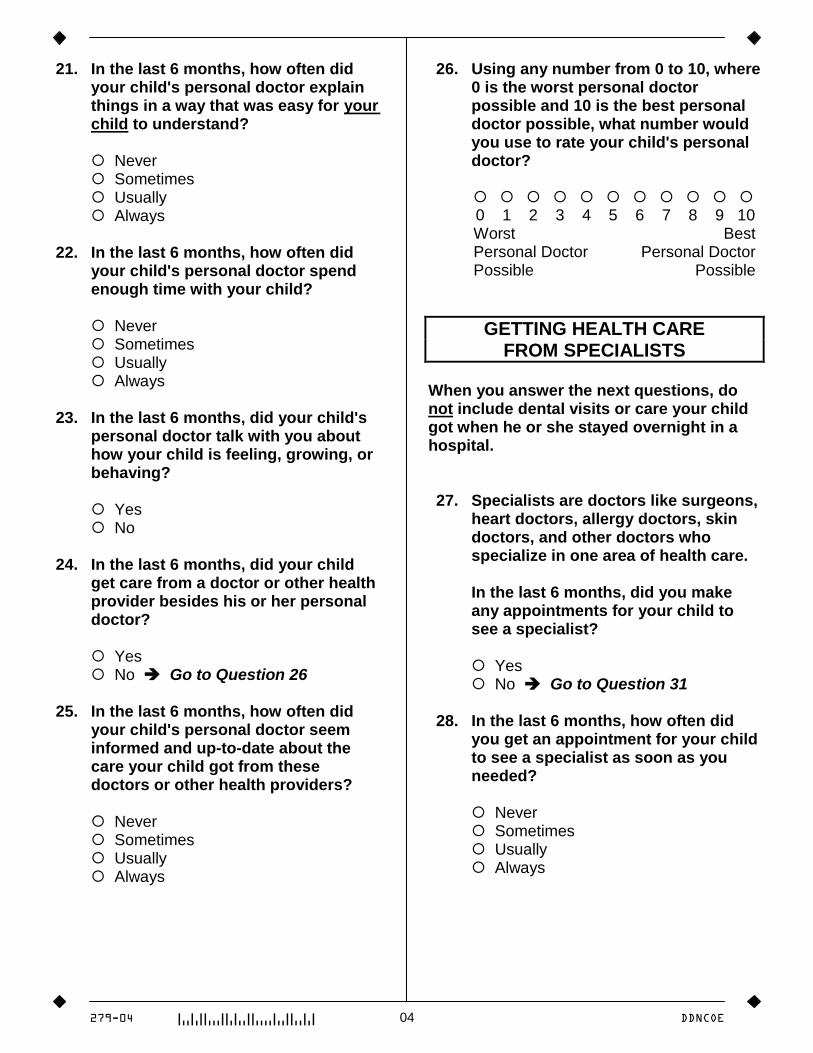
279-04 04 DDNCOE
21. In the last 6 months, how often did your child's personal doctor explain things in a way that was easy for your child to understand?
Never Sometimes Usually Always 22. In the last 6 months, how often did
your child's personal doctor spend enough time with your child?
Never Sometimes Usually Always 23. In the last 6 months, did your child's
personal doctor talk with you about how your child is feeling, growing, or behaving?
Yes No 24. In the last 6 months, did your child
get care from a doctor or other health provider besides his or her personal doctor?
Yes No Go to Question 26 25. In the last 6 months, how often did
your child's personal doctor seem informed and up-to-date about the care your child got from these doctors or other health providers?
Never Sometimes Usually Always
26. Using any number from 0 to 10, where 0 is the worst personal doctor possible and 10 is the best personal doctor possible, what number would you use to rate your child's personal doctor?
0 1 2 3 4 5 6 7 8 9 10 Worst Best Personal Doctor Personal Doctor Possible Possible
GETTING HEALTH CARE FROM SPECIALISTS
When you answer the next questions, do not include dental visits or care your child got when he or she stayed overnight in a hospital. 27. Specialists are doctors like surgeons,
heart doctors, allergy doctors, skin doctors, and other doctors who specialize in one area of health care.
In the last 6 months, did you make
any appointments for your child to see a specialist?
Yes No Go to Question 31 28. In the last 6 months, how often did
you get an appointment for your child to see a specialist as soon as you needed?
Never Sometimes Usually Always
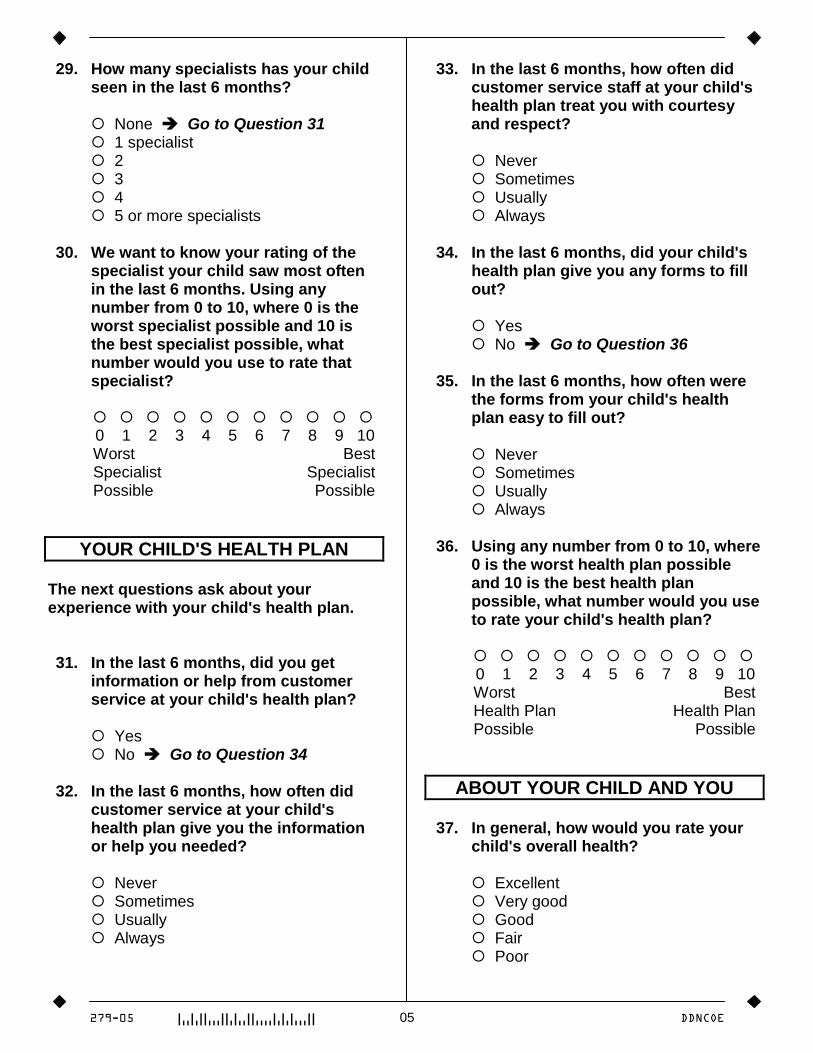
279-05 05 DDNCOE
29. How many specialists has your child seen in the last 6 months?
None Go to Question 31 1 specialist 2 3 4 5 or more specialists 30. We want to know your rating of the
specialist your child saw most often in the last 6 months. Using any number from 0 to 10, where 0 is the worst specialist possible and 10 is the best specialist possible, what number would you use to rate that specialist?
0 1 2 3 4 5 6 7 8 9 10 Worst Best Specialist Specialist Possible Possible
YOUR CHILD'S HEALTH PLAN The next questions ask about your experience with your child's health plan. 31. In the last 6 months, did you get
information or help from customer service at your child's health plan?
Yes No Go to Question 34 32. In the last 6 months, how often did
customer service at your child's health plan give you the information or help you needed?
Never Sometimes Usually Always
33. In the last 6 months, how often did customer service staff at your child's health plan treat you with courtesy and respect?
Never Sometimes Usually Always 34. In the last 6 months, did your child's
health plan give you any forms to fill out?
Yes No Go to Question 36 35. In the last 6 months, how often were
the forms from your child's health plan easy to fill out?
Never Sometimes Usually Always 36. Using any number from 0 to 10, where
0 is the worst health plan possible and 10 is the best health plan possible, what number would you use to rate your child's health plan?
0 1 2 3 4 5 6 7 8 9 10 Worst Best Health Plan Health Plan Possible Possible
ABOUT YOUR CHILD AND YOU 37. In general, how would you rate your
child's overall health?
Excellent Very good Good Fair Poor
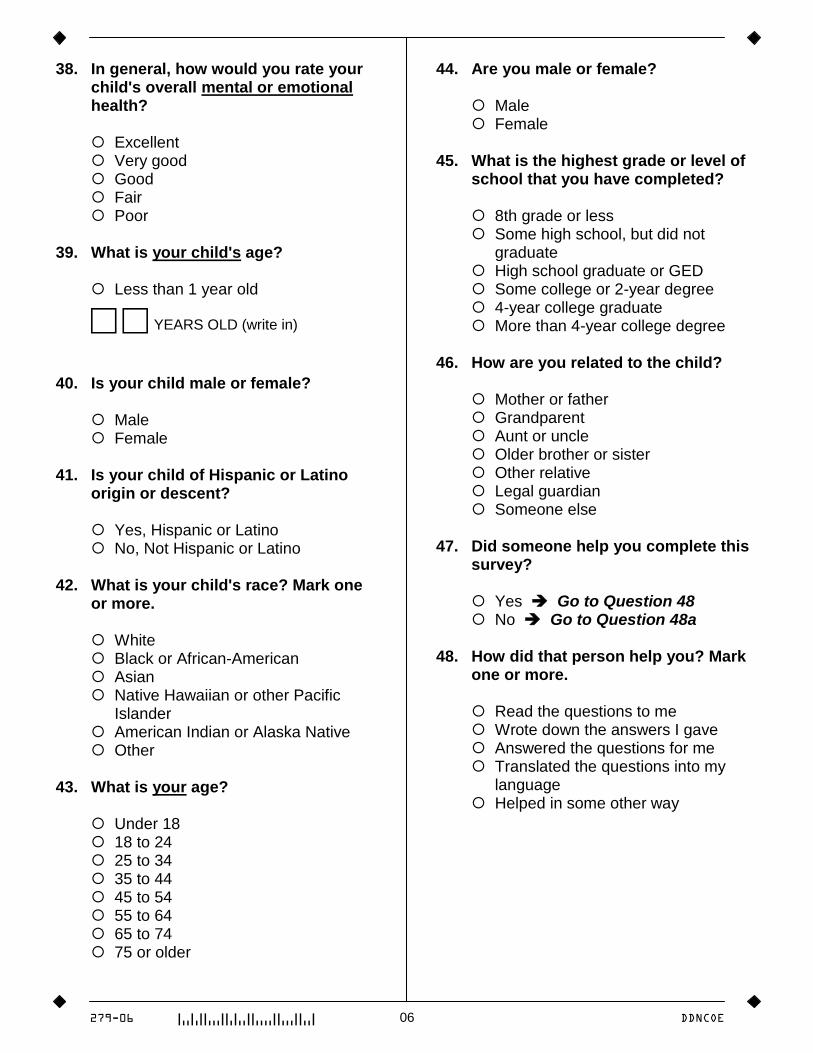
279-06 06 DDNCOE
38. In general, how would you rate your child's overall mental or emotional health?
Excellent Very good Good Fair Poor 39. What is your child's age?
Less than 1 year old
□ □ YEARS OLD (write in)
40. Is your child male or female?
Male Female 41. Is your child of Hispanic or Latino
origin or descent?
Yes, Hispanic or Latino No, Not Hispanic or Latino 42. What is your child's race? Mark one
or more.
White Black or African-American Asian Native Hawaiian or other Pacific
Islander American Indian or Alaska Native Other 43. What is your age?
Under 18 18 to 24 25 to 34 35 to 44 45 to 54 55 to 64 65 to 74 75 or older
44. Are you male or female?
Male Female 45. What is the highest grade or level of
school that you have completed?
8th grade or less Some high school, but did not
graduate High school graduate or GED Some college or 2-year degree 4-year college graduate More than 4-year college degree 46. How are you related to the child?
Mother or father Grandparent Aunt or uncle Older brother or sister Other relative Legal guardian Someone else 47. Did someone help you complete this
survey?
Yes Go to Question 48 No Go to Question 48a 48. How did that person help you? Mark
one or more.
Read the questions to me Wrote down the answers I gave Answered the questions for me Translated the questions into my
language Helped in some other way
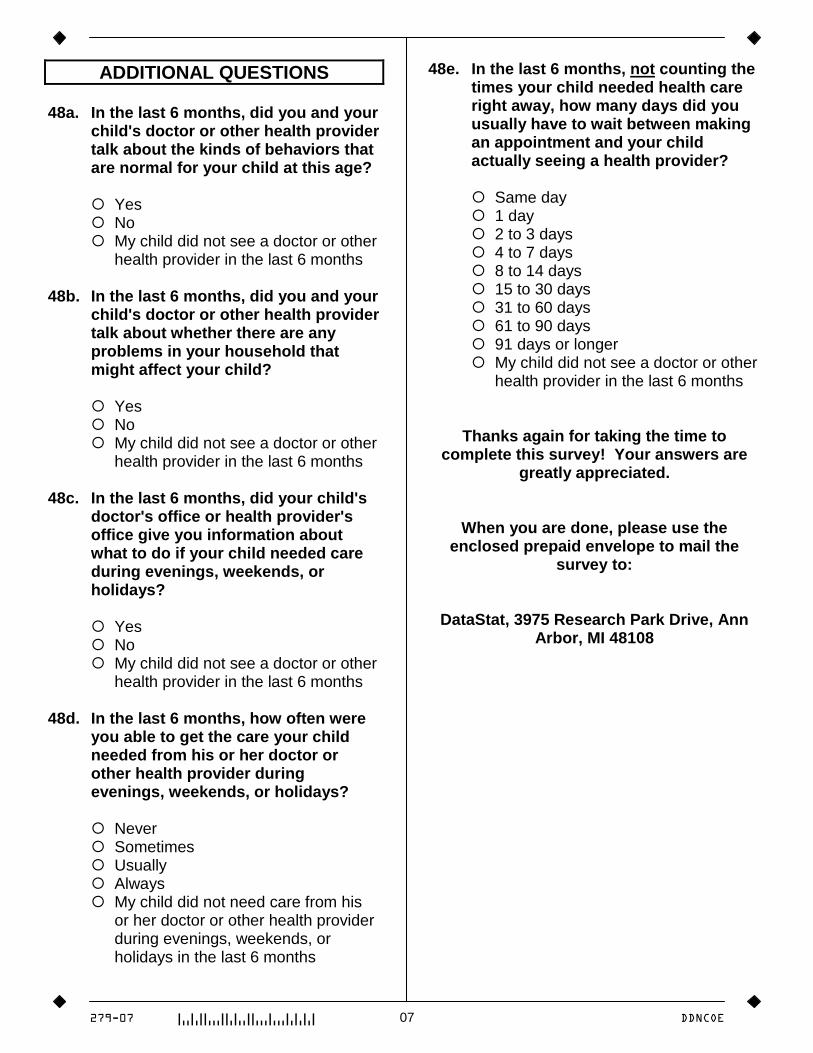
279-07 07 DDNCOE
ADDITIONAL QUESTIONS 48a. In the last 6 months, did you and your
child's doctor or other health provider talk about the kinds of behaviors that are normal for your child at this age?
Yes No My child did not see a doctor or other
health provider in the last 6 months 48b. In the last 6 months, did you and your
child's doctor or other health provider talk about whether there are any problems in your household that might affect your child?
Yes No My child did not see a doctor or other
health provider in the last 6 months 48c. In the last 6 months, did your child's
doctor's office or health provider's office give you information about what to do if your child needed care during evenings, weekends, or holidays?
Yes No My child did not see a doctor or other
health provider in the last 6 months 48d. In the last 6 months, how often were
you able to get the care your child needed from his or her doctor or other health provider during evenings, weekends, or holidays?
Never Sometimes Usually Always My child did not need care from his
or her doctor or other health provider during evenings, weekends, or holidays in the last 6 months
48e. In the last 6 months, not counting the times your child needed health care right away, how many days did you usually have to wait between making an appointment and your child actually seeing a health provider?
Same day 1 day 2 to 3 days 4 to 7 days 8 to 14 days 15 to 30 days 31 to 60 days 61 to 90 days 91 days or longer My child did not see a doctor or other
health provider in the last 6 months
Thanks again for taking the time to complete this survey! Your answers are
greatly appreciated.
When you are done, please use the enclosed prepaid envelope to mail the
survey to:
DataStat, 3975 Research Park Drive, Ann Arbor, MI 48108


![[CN]Chapter 3 [CT]Getting the Right Doctors [IP]A good doctor](https://img.pdfslide.us/doc/110x75/546fa5f6b4af9ff5638b457f/cnchapter-3-ctgetting-the-right-doctors-ipa-good-doctor-.jpg)