Embed Size (px)
Citation preview
Colorado Agricultural Statistics
2007
National Agricultural Statistics Service Colorado Field Office
UNIO
N
CONSTIT
UTIO
N
AN
D
COLORADO AGRICULTURAL STATISTICS
2006 Preliminary - 2005 Revised
Issued Cooperatively By
COLORADO DEPARTMENT OF AGRICULTURE
National Agricultural Statistics Service
R. RONALD BOSECKER, Administrator JOHN R. STULP, Commissioner
Prepared and Published by
USDA NASS Colorado Field Office PO Box 150969
645 Parfet Street, Room W201 Lakewood, Colorado 80215
(303) 236-2300 / 1-800-392-3202 e-Mail: [email protected]
This report is also available on the Internet at: www.nass.usda.gov/co
R. Reneé Picanso, Director Steve Anderson, Deputy Director July 2007 Price $10.00
NATIONAL AGRICULTURAL STATISTICS SERVICE
Bill Ritter, Jr. Governor
700 Kipling Street, Suite 4000
Lakewood, CO 80215 303-239-4100 ♦ Fax 303-239-4125
www.ag.state.co.us
CONSTITUTION
AN
D
U N I ON
John R. Stulp, Commissioner Sheldon R. Jones, Deputy Commissioner
July 2007 Dear Friends: It is my pleasure to present to you the 2007 Colorado Agricultural Statistics publication. This book contains valuable information on the agricultural industry in this state. As a farmer and rancher, I know how important accurate statistics are in understanding the current role of agriculture and projecting the future for agribusiness. This book is a joint effort by Colorado farmers and ranchers, USDA’s National Agricultural Statistics Service, and the Colorado Department of Agriculture. Within these pages, you’ll find the most current and comprehensive information available on agriculture in this state. Agriculture continues to expand into new markets. Ethanol is taking on a greater role as an energy source in this country and cattle are now sharing their land with wind farms. Scientists continue to explore new frontiers of crop and livestock technology, which will bring even greater productivity to feed and provide energy for a growing world population. Maintaining accurate information today helps plan for a successful tomorrow. I invite all of you to glance through these pages to not only learn more about your own area of agribusiness, but to discover more about agriculture across the state. Sincerely,
John R. Stulp Commissioner
USDA, NASS - Colorado Field Office 2007
R. Renee Picanso, Director
Steve Anderson, Deputy Director Crops Livestock Surveys Tom Vesey Tom Sabel Paul Post Chris Hawthorn Cody Brokmeyer Jodi Miller
Roseann Monge
Office Enumerators* Sampling Operations Evelyn Ostermiller Angela Umlauf Melinda Kraus Albert Bollwerk Tina Logsdon Pat Touchton Cecilia Boucher Maureen Kruse Michael Fowler Mark Keller Jim Hahn Cameron Naish Administration Molly Case Anna Hooker Field Supervisors* Field Enumerators* David Abbott-Kremmling Caren Graham-Center Kris Crump-Rocky Ford Dana Haskins-Hayden Talana Davis-Burlington Violet Lane-Chivington Bonnie Egan-Greeley Linda Larsen-Manassa Bette Hertneky-Calhan Deborah Locke- Mack Smiley Shawcroft-Alamosa Don Mitchell-Brush Robert Morrison-Limon Donna Musgrave-Wiggins Field Enumerators* Judy Reyher-La Junta Jerry Amen-Sterling Bonnie Smith-Moore-Holyoke Pat Anderson-Meeker Lucille Stofer-Denver Nancy Beattie-Longmont Nitschka Ter Kuile-La Jara Deanna Davidson-Greeley Marilyn Van Well-Akron Willetta Doherty-Trinchera Gayle Drager-Joes * National Association of State Departments of Agriculture (NASDA) staff.
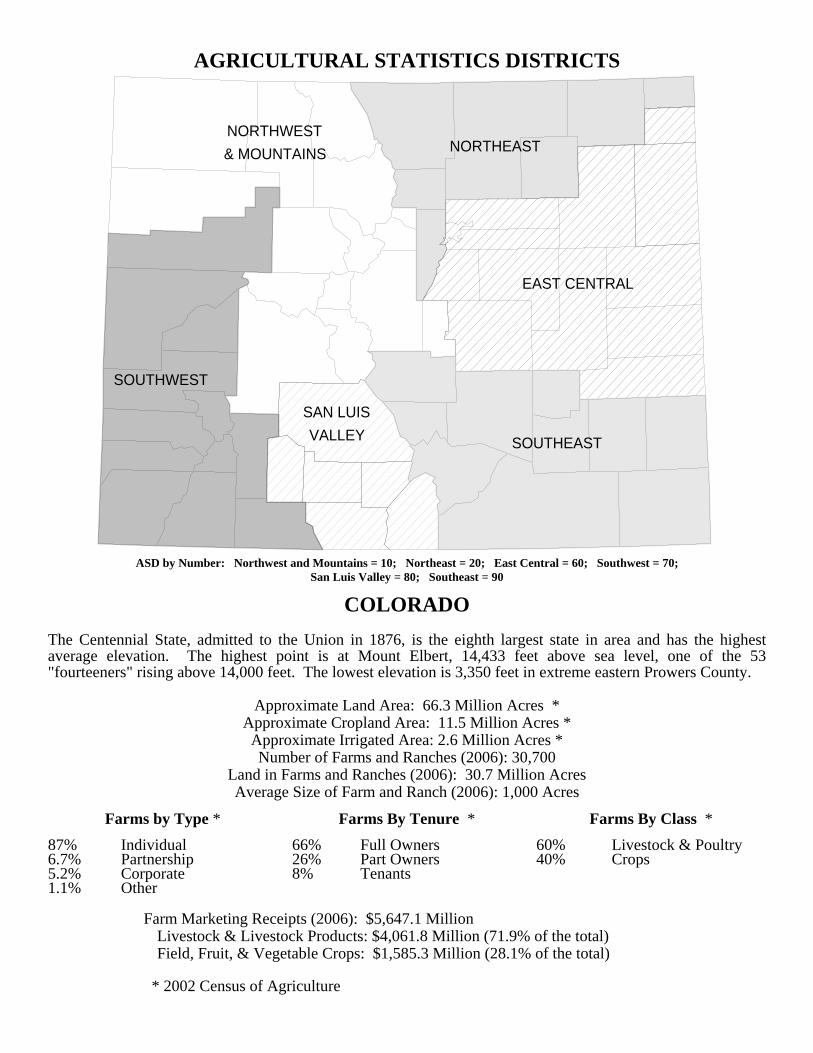
AGRICULTURAL STATISTICS DISTRICTS
ASD by Number: Northwest and Mountains = 10; Northeast = 20; East Central = 60; Southwest = 70;
San Luis Valley = 80; Southeast = 90
COLORADO The Centennial State, admitted to the Union in 1876, is the eighth largest state in area and has the highest average elevation. The highest point is at Mount Elbert, 14,433 feet above sea level, one of the 53 "fourteeners" rising above 14,000 feet. The lowest elevation is 3,350 feet in extreme eastern Prowers County.
Approximate Land Area: 66.3 Million Acres * Approximate Cropland Area: 11.5 Million Acres *
Approximate Irrigated Area: 2.6 Million Acres * Number of Farms and Ranches (2006): 30,700
Land in Farms and Ranches (2006): 30.7 Million Acres Average Size of Farm and Ranch (2006): 1,000 Acres
Farms by Type * Farms By Tenure * Farms By Class *
87% Individual 66% Full Owners 60% Livestock & Poultry 6.7% Partnership 26% Part Owners 40% Crops 5.2% Corporate 8% Tenants 1.1% Other Farm Marketing Receipts (2006): $5,647.1 Million Livestock & Livestock Products: $4,061.8 Million (71.9% of the total) Field, Fruit, & Vegetable Crops: $1,585.3 Million (28.1% of the total) * 2002 Census of Agriculture
NORTHWEST& MOUNTAINS NORTHEAST
EAST CENTRAL
SOUTHWEST
SAN LUISVALLEY SOUTHEAST
Colorado Agricultural Statistics 2007 1
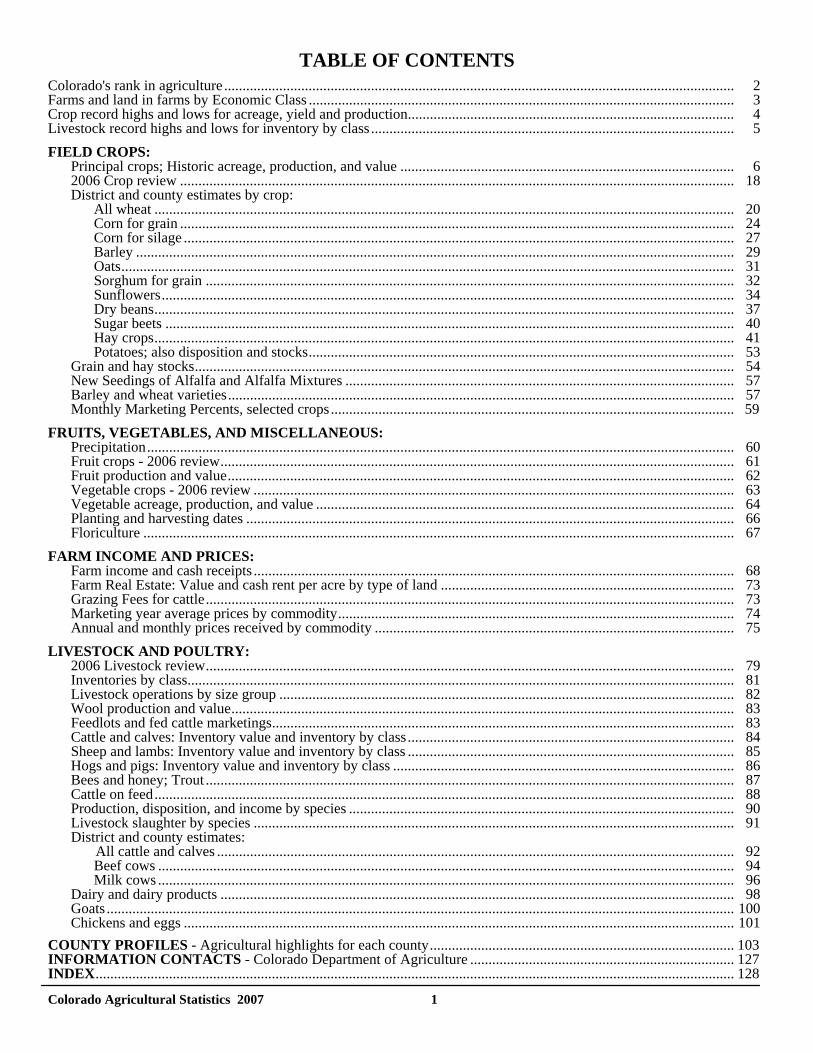
TABLE OF CONTENTS Colorado's rank in agriculture ........................................................................................................................................... 2 Farms and land in farms by Economic Class .................................................................................................................... 3 Crop record highs and lows for acreage, yield and production......................................................................................... 4 Livestock record highs and lows for inventory by class ................................................................................................... 5 FIELD CROPS: Principal crops; Historic acreage, production, and value ........................................................................................... 6 2006 Crop review ....................................................................................................................................................... 18 District and county estimates by crop: All wheat .............................................................................................................................................................. 20 Corn for grain ....................................................................................................................................................... 24 Corn for silage ...................................................................................................................................................... 27 Barley ................................................................................................................................................................... 29 Oats....................................................................................................................................................................... 31 Sorghum for grain ................................................................................................................................................ 32 Sunflowers............................................................................................................................................................ 34 Dry beans.............................................................................................................................................................. 37 Sugar beets ........................................................................................................................................................... 40 Hay crops.............................................................................................................................................................. 41 Potatoes; also disposition and stocks.................................................................................................................... 53 Grain and hay stocks................................................................................................................................................... 54 New Seedings of Alfalfa and Alfalfa Mixtures .......................................................................................................... 57 Barley and wheat varieties.......................................................................................................................................... 57 Monthly Marketing Percents, selected crops.............................................................................................................. 59 FRUITS, VEGETABLES, AND MISCELLANEOUS: Precipitation................................................................................................................................................................ 60 Fruit crops - 2006 review............................................................................................................................................ 61 Fruit production and value.......................................................................................................................................... 62 Vegetable crops - 2006 review ................................................................................................................................... 63 Vegetable acreage, production, and value .................................................................................................................. 64 Planting and harvesting dates ..................................................................................................................................... 66 Floriculture ................................................................................................................................................................. 67 FARM INCOME AND PRICES: Farm income and cash receipts ................................................................................................................................... 68 Farm Real Estate: Value and cash rent per acre by type of land ................................................................................ 73 Grazing Fees for cattle................................................................................................................................................ 73 Marketing year average prices by commodity............................................................................................................ 74 Annual and monthly prices received by commodity .................................................................................................. 75 LIVESTOCK AND POULTRY: 2006 Livestock review................................................................................................................................................ 79 Inventories by class..................................................................................................................................................... 81 Livestock operations by size group ............................................................................................................................ 82 Wool production and value......................................................................................................................................... 83 Feedlots and fed cattle marketings.............................................................................................................................. 83 Cattle and calves: Inventory value and inventory by class ......................................................................................... 84 Sheep and lambs: Inventory value and inventory by class ......................................................................................... 85 Hogs and pigs: Inventory value and inventory by class ............................................................................................. 86 Bees and honey; Trout ................................................................................................................................................ 87 Cattle on feed.............................................................................................................................................................. 88 Production, disposition, and income by species ......................................................................................................... 90 Livestock slaughter by species ................................................................................................................................... 91 District and county estimates: All cattle and calves ............................................................................................................................................. 92 Beef cows ............................................................................................................................................................. 94 Milk cows ............................................................................................................................................................. 96 Dairy and dairy products ............................................................................................................................................ 98 Goats ........................................................................................................................................................................... 100 Chickens and eggs ...................................................................................................................................................... 101 COUNTY PROFILES - Agricultural highlights for each county................................................................................... 103 INFORMATION CONTACTS - Colorado Department of Agriculture ........................................................................ 127 INDEX.............................................................................................................................................................................. 128
Colorado Agricultural Statistics 2007 2
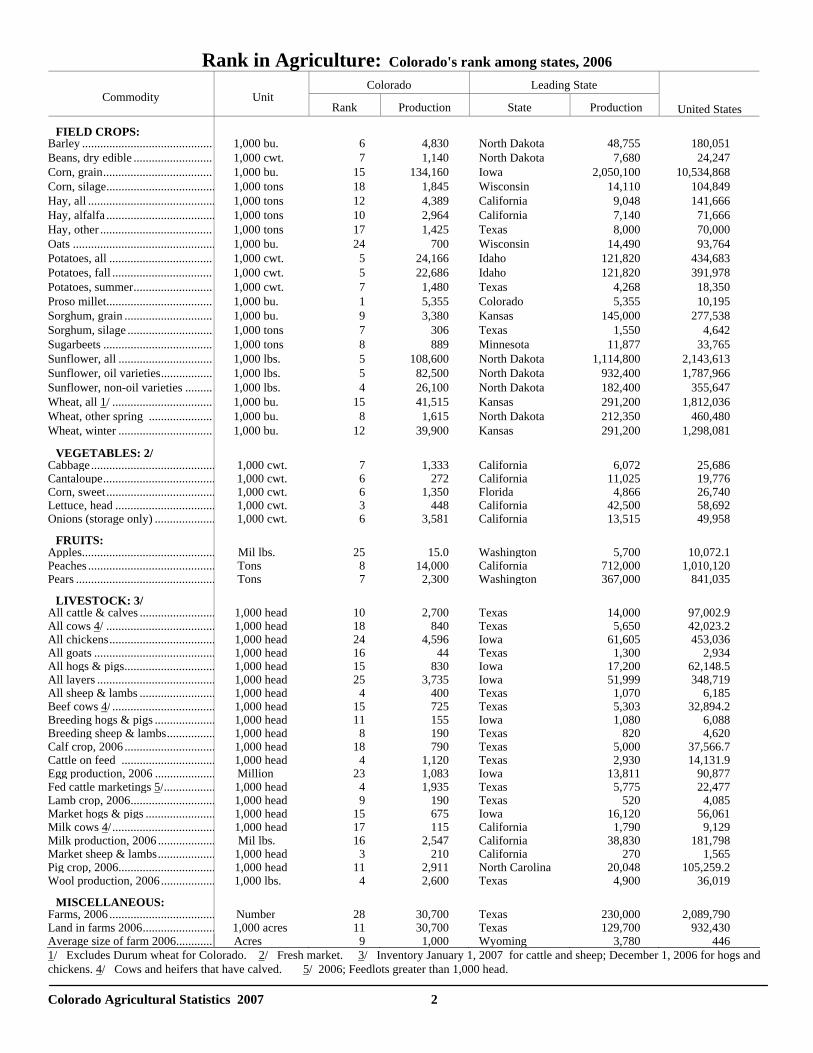
Rank in Agriculture: Colorado's rank among states, 2006
Colorado Leading State Commodity
Unit
Rank Production State Production
United States
FIELD CROPS: Barley ........................................... 1,000 bu. 6 4,830 North Dakota 48,755 180,051 Beans, dry edible .......................... 1,000 cwt. 7 1,140 North Dakota 7,680 24,247 Corn, grain.................................... 1,000 bu. 15 134,160 Iowa 2,050,100 10,534,868 Corn, silage.................................... 1,000 tons 18 1,845 Wisconsin 14,110 104,849 Hay, all .......................................... 1,000 tons 12 4,389 California 9,048 141,666 Hay, alfalfa .................................... 1,000 tons 10 2,964 California 7,140 71,666 Hay, other ..................................... 1,000 tons 17 1,425 Texas 8,000 70,000 Oats ............................................... 1,000 bu. 24 700 Wisconsin 14,490 93,764 Potatoes, all .................................. 1,000 cwt. 5 24,166 Idaho 121,820 434,683 Potatoes, fall ................................. 1,000 cwt. 5 22,686 Idaho 121,820 391,978 Potatoes, summer.......................... 1,000 cwt. 7 1,480 Texas 4,268 18,350 Proso millet................................... 1,000 bu. 1 5,355 Colorado 5,355 10,195 Sorghum, grain ............................. 1,000 bu. 9 3,380 Kansas 145,000 277,538 Sorghum, silage ............................ 1,000 tons 7 306 Texas 1,550 4,642 Sugarbeets .................................... 1,000 tons 8 889 Minnesota 11,877 33,765 Sunflower, all ............................... 1,000 lbs. 5 108,600 North Dakota 1,114,800 2,143,613 Sunflower, oil varieties................. 1,000 lbs. 5 82,500 North Dakota 932,400 1,787,966 Sunflower, non-oil varieties ......... 1,000 lbs. 4 26,100 North Dakota 182,400 355,647 Wheat, all 1/ ................................. 1,000 bu. 15 41,515 Kansas 291,200 1,812,036 Wheat, other spring ..................... 1,000 bu. 8 1,615 North Dakota 212,350 460,480 Wheat, winter ............................... 1,000 bu. 12 39,900 Kansas 291,200 1,298,081
VEGETABLES: 2/ Cabbage......................................... 1,000 cwt. 7 1,333 California 6,072 25,686Cantaloupe..................................... 1,000 cwt. 6 272 California 11,025 19,776Corn, sweet.................................... 1,000 cwt. 6 1,350 Florida 4,866 26,740Lettuce, head ................................. 1,000 cwt. 3 448 California 42,500 58,692Onions (storage only) .................... 1,000 cwt. 6 3,581 California 13,515 49,958
FRUITS: Apples............................................ Mil lbs. 25 15.0 Washington 5,700 10,072.1Peaches .......................................... Tons 8 14,000 California 712,000 1,010,120Pears .............................................. Tons 7 2,300 Washington 367,000 841,035
LIVESTOCK: 3/ All cattle & calves ......................... 1,000 head 10 2,700 Texas 14,000 97,002.9All cows 4/ .................................... 1,000 head 18 840 Texas 5,650 42,023.2All chickens................................... 1,000 head 24 4,596 Iowa 61,605 453,036All goats ........................................ 1,000 head 16 44 Texas 1,300 2,934All hogs & pigs.............................. 1,000 head 15 830 Iowa 17,200 62,148.5All layers ....................................... 1,000 head 25 3,735 Iowa 51,999 348,719All sheep & lambs ......................... 1,000 head 4 400 Texas 1,070 6,185Beef cows 4/ .................................. 1,000 head 15 725 Texas 5,303 32,894.2Breeding hogs & pigs .................... 1,000 head 11 155 Iowa 1,080 6,088Breeding sheep & lambs................ 1,000 head 8 190 Texas 820 4,620Calf crop, 2006 .............................. 1,000 head 18 790 Texas 5,000 37,566.7Cattle on feed ............................... 1,000 head 4 1,120 Texas 2,930 14,131.9Egg production, 2006 .................... Million 23 1,083 Iowa 13,811 90,877Fed cattle marketings 5/................. 1,000 head 4 1,935 Texas 5,775 22,477Lamb crop, 2006............................ 1,000 head 9 190 Texas 520 4,085Market hogs & pigs ....................... 1,000 head 15 675 Iowa 16,120 56,061Milk cows 4/.................................. 1,000 head 17 115 California 1,790 9,129Milk production, 2006 ................... Mil lbs. 16 2,547 California 38,830 181,798Market sheep & lambs................... 1,000 head 3 210 California 270 1,565Pig crop, 2006................................ 1,000 head 11 2,911 North Carolina 20,048 105,259.2Wool production, 2006.................. 1,000 lbs. 4 2,600 Texas 4,900 36,019
MISCELLANEOUS: Farms, 2006 ................................... Number 28 30,700 Texas 230,000 2,089,790Land in farms 2006........................ 1,000 acres 11 30,700 Texas 129,700 932,430Average size of farm 2006............. Acres 9 1,000 Wyoming 3,780 4461/ Excludes Durum wheat for Colorado. 2/ Fresh market. 3/ Inventory January 1, 2007 for cattle and sheep; December 1, 2006 for hogs and chickens. 4/ Cows and heifers that have calved. 5/ 2006; Feedlots greater than 1,000 head.
Colorado Agricultural Statistics 2007 3
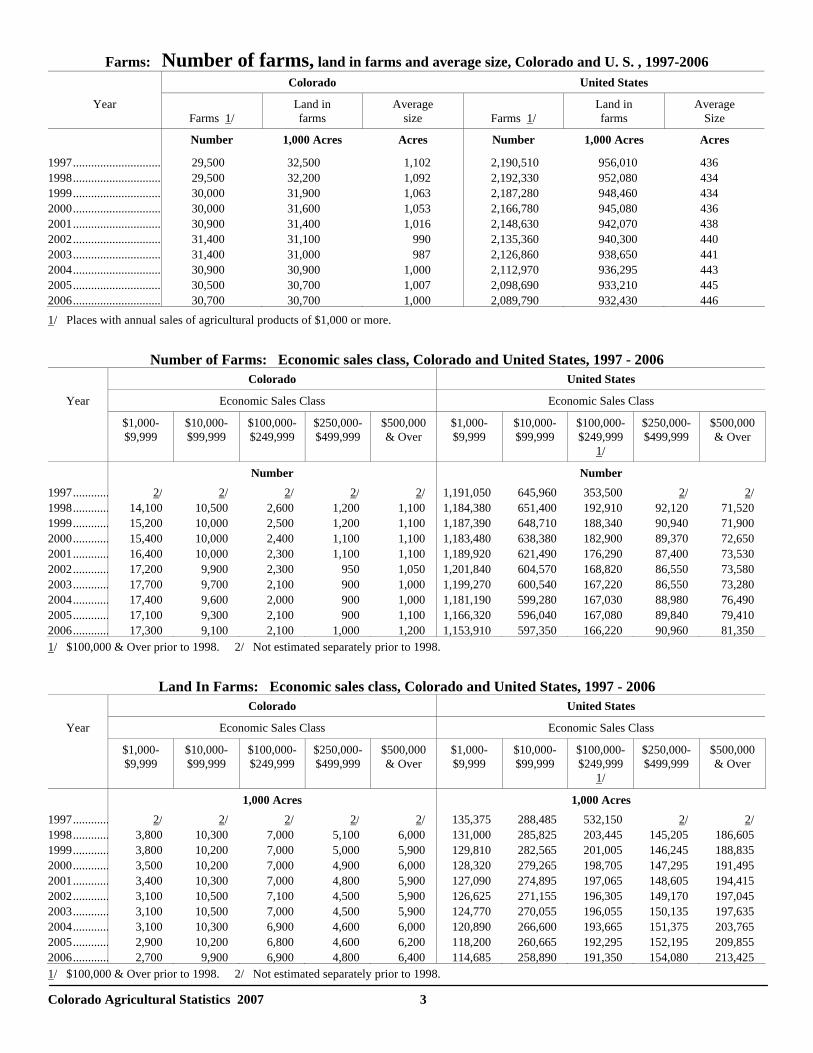
Farms: Number of farms, land in farms and average size, Colorado and U. S. , 1997-2006 Colorado United States
Year Farms 1/
Land in farms
Average size
Farms 1/
Land in farms
Average Size
Number
1,000 Acres Acres Number 1,000 Acres Acres
1997............................. 29,500 32,500 1,102 2,190,510 956,010 4361998............................. 29,500 32,200 1,092 2,192,330 952,080 4341999............................. 30,000 31,900 1,063 2,187,280 948,460 4342000............................. 30,000 31,600 1,053 2,166,780 945,080 4362001............................. 30,900 31,400 1,016 2,148,630 942,070 4382002............................. 31,400 31,100 990 2,135,360 940,300 4402003............................. 31,400 31,000 987 2,126,860 938,650 4412004............................. 30,900 30,900 1,000 2,112,970 936,295 4432005............................. 30,500 30,700 1,007 2,098,690 933,210 4452006............................. 30,700 30,700 1,000 2,089,790 932,430 446 1/ Places with annual sales of agricultural products of $1,000 or more.
Number of Farms: Economic sales class, Colorado and United States, 1997 - 2006 Colorado United States
Year Economic Sales Class Economic Sales Class
$1,000- $9,999
$10,000- $99,999
$100,000- $249,999
$250,000- $499,999
$500,000 & Over
$1,000- $9,999
$10,000- $99,999
$100,000- $249,999
1/
$250,000- $499,999
$500,000 & Over
Number Number 1997............ 2/ 2/ 2/ 2/ 2/ 1,191,050 645,960 353,500 2/ 2/1998............ 14,100 10,500 2,600 1,200 1,100 1,184,380 651,400 192,910 92,120 71,5201999............ 15,200 10,000 2,500 1,200 1,100 1,187,390 648,710 188,340 90,940 71,9002000............ 15,400 10,000 2,400 1,100 1,100 1,183,480 638,380 182,900 89,370 72,6502001............ 16,400 10,000 2,300 1,100 1,100 1,189,920 621,490 176,290 87,400 73,5302002............ 17,200 9,900 2,300 950 1,050 1,201,840 604,570 168,820 86,550 73,5802003............ 17,700 9,700 2,100 900 1,000 1,199,270 600,540 167,220 86,550 73,2802004............ 17,400 9,600 2,000 900 1,000 1,181,190 599,280 167,030 88,980 76,4902005............ 17,100 9,300 2,100 900 1,100 1,166,320 596,040 167,080 89,840 79,4102006............ 17,300 9,100 2,100 1,000 1,200 1,153,910 597,350 166,220 90,960 81,3501/ $100,000 & Over prior to 1998. 2/ Not estimated separately prior to 1998.
Land In Farms: Economic sales class, Colorado and United States, 1997 - 2006 Colorado United States
Year Economic Sales Class Economic Sales Class
$1,000- $9,999
$10,000- $99,999
$100,000- $249,999
$250,000- $499,999
$500,000 & Over
$1,000- $9,999
$10,000- $99,999
$100,000- $249,999
1/
$250,000- $499,999
$500,000 & Over
1,000 Acres 1,000 Acres 1997............ 2/ 2/ 2/ 2/ 2/ 135,375 288,485 532,150 2/ 2/1998............ 3,800 10,300 7,000 5,100 6,000 131,000 285,825 203,445 145,205 186,6051999............ 3,800 10,200 7,000 5,000 5,900 129,810 282,565 201,005 146,245 188,8352000............ 3,500 10,200 7,000 4,900 6,000 128,320 279,265 198,705 147,295 191,4952001............ 3,400 10,300 7,000 4,800 5,900 127,090 274,895 197,065 148,605 194,4152002............ 3,100 10,500 7,100 4,500 5,900 126,625 271,155 196,305 149,170 197,0452003............ 3,100 10,500 7,000 4,500 5,900 124,770 270,055 196,055 150,135 197,6352004............ 3,100 10,300 6,900 4,600 6,000 120,890 266,600 193,665 151,375 203,7652005............ 2,900 10,200 6,800 4,600 6,200 118,200 260,665 192,295 152,195 209,8552006............ 2,700 9,900 6,900 4,800 6,400 114,685 258,890 191,350 154,080 213,4251/ $100,000 & Over prior to 1998. 2/ Not estimated separately prior to 1998.
HISTORIC STATE LEVEL DATA BY CROP
Colorado Agricultural Statistics 2007 4
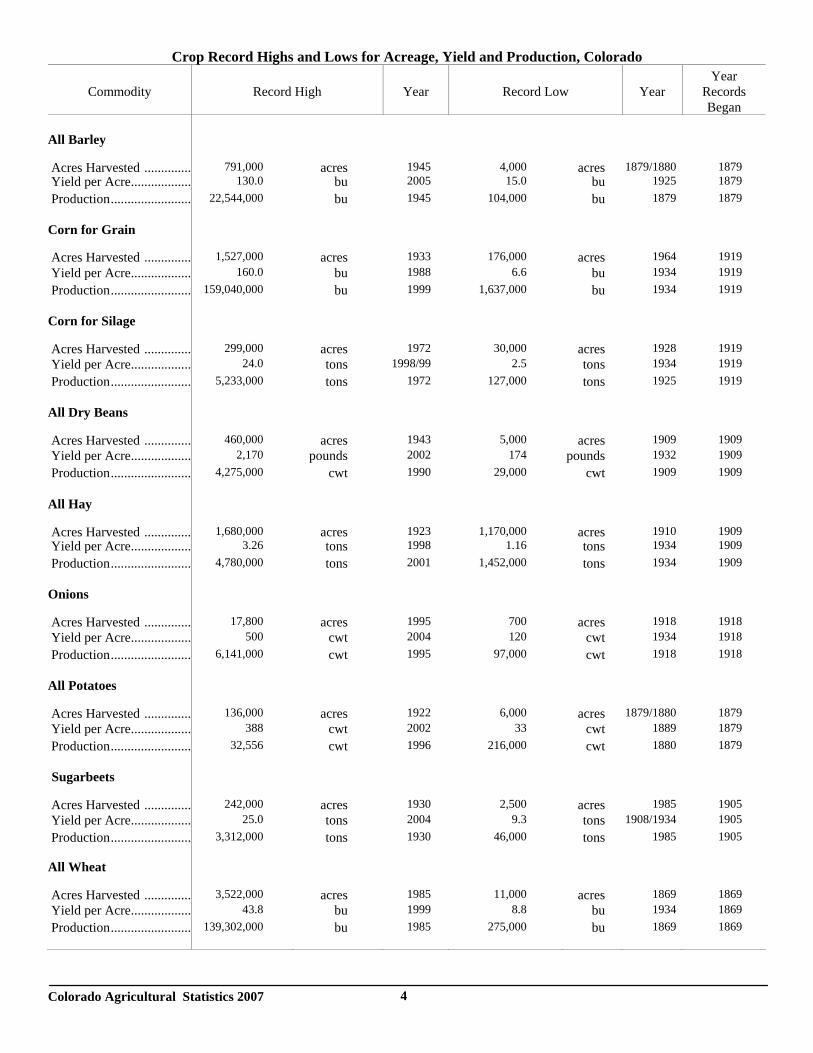
Crop Record Highs and Lows for Acreage, Yield and Production, Colorado
Commodity
Record High
Year
Record Low
Year Year
Records Began
All Barley
Acres Harvested .............. 791,000 acres 1945 4,000 acres 1879/1880 1879 Yield per Acre.................. 130.0 bu 2005 15.0 bu 1925 1879 Production........................ 22,544,000 bu 1945 104,000 bu 1879 1879 Corn for Grain
Acres Harvested .............. 1,527,000 acres 1933 176,000 acres 1964 1919 Yield per Acre.................. 160.0 bu 1988 6.6 bu 1934 1919 Production........................ 159,040,000 bu 1999 1,637,000 bu 1934 1919 Corn for Silage
Acres Harvested .............. 299,000 acres 1972 30,000 acres 1928 1919 Yield per Acre.................. 24.0 tons 1998/99 2.5 tons 1934 1919 Production........................ 5,233,000 tons 1972 127,000 tons 1925 1919 All Dry Beans
Acres Harvested .............. 460,000 acres 1943 5,000 acres 1909 1909 Yield per Acre.................. 2,170 pounds 2002 174 pounds 1932 1909 Production........................ 4,275,000 cwt 1990 29,000 cwt 1909 1909 All Hay
Acres Harvested .............. 1,680,000 acres 1923 1,170,000 acres 1910 1909 Yield per Acre.................. 3.26 tons 1998 1.16 tons 1934 1909 Production........................ 4,780,000 tons 2001 1,452,000 tons 1934 1909 Onions
Acres Harvested .............. 17,800 acres 1995 700 acres 1918 1918 Yield per Acre.................. 500 cwt 2004 120 cwt 1934 1918 Production........................ 6,141,000 cwt 1995 97,000 cwt 1918 1918 All Potatoes
Acres Harvested .............. 136,000 acres 1922 6,000 acres 1879/1880 1879 Yield per Acre.................. 388 cwt 2002 33 cwt 1889 1879 Production........................ 32,556 cwt 1996 216,000 cwt 1880 1879 Sugarbeets
Acres Harvested .............. 242,000 acres 1930 2,500 acres 1985 1905 Yield per Acre.................. 25.0 tons 2004 9.3 tons 1908/1934 1905 Production........................ 3,312,000 tons 1930 46,000 tons 1985 1905 All Wheat
Acres Harvested .............. 3,522,000 acres 1985 11,000 acres 1869 1869 Yield per Acre.................. 43.8 bu 1999 8.8 bu 1934 1869 Production........................ 139,302,000 bu 1985 275,000 bu 1869 1869
Colorado Agricultural Statistics 2007 5
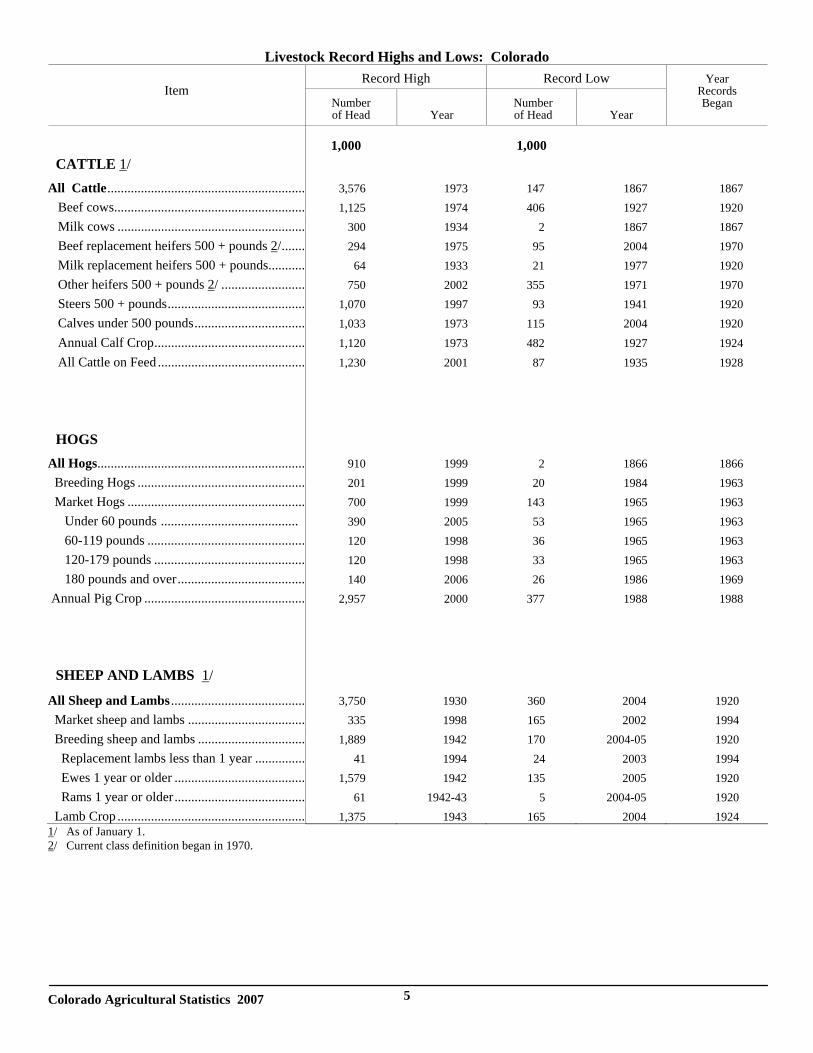
Livestock Record Highs and Lows: Colorado Record High Record Low
Item Number
of Head
Year Number of Head
Year
Year Records Began
CATTLE 1/
1,000 1,000
All Cattle........................................................... 3,576 1973 147 1867 1867 Beef cows......................................................... 1,125 1974 406 1927 1920 Milk cows ........................................................ 300 1934 2 1867 1867 Beef replacement heifers 500 + pounds 2/....... 294 1975 95 2004 1970 Milk replacement heifers 500 + pounds........... 64 1933 21 1977 1920 Other heifers 500 + pounds 2/ ......................... 750 2002 355 1971 1970 Steers 500 + pounds......................................... 1,070 1997 93 1941 1920 Calves under 500 pounds................................. 1,033 1973 115 2004 1920 Annual Calf Crop............................................. 1,120 1973 482 1927 1924 All Cattle on Feed ............................................ 1,230 2001 87 1935 1928
HOGS
All Hogs.............................................................. 910 1999 2 1866 1866 Breeding Hogs .................................................. 201 1999 20 1984 1963 Market Hogs ..................................................... 700 1999 143 1965 1963 Under 60 pounds ......................................... 390 2005 53 1965 1963 60-119 pounds ............................................... 120 1998 36 1965 1963 120-179 pounds ............................................. 120 1998 33 1965 1963 180 pounds and over...................................... 140 2006 26 1986 1969 Annual Pig Crop ................................................ 2,957 2000 377 1988 1988
SHEEP AND LAMBS 1/
All Sheep and Lambs ........................................ 3,750 1930 360 2004 1920 Market sheep and lambs ................................... 335 1998 165 2002 1994 Breeding sheep and lambs ................................ 1,889 1942 170 2004-05 1920 Replacement lambs less than 1 year ............... 41 1994 24 2003 1994 Ewes 1 year or older ....................................... 1,579 1942 135 2005 1920 Rams 1 year or older....................................... 61 1942-43 5 2004-05 1920 Lamb Crop ........................................................ 1,375 1943 165 2004 1924 1/ As of January 1. 2/ Current class definition began in 1970.
Colorado Agricultural Statistics 2007 6
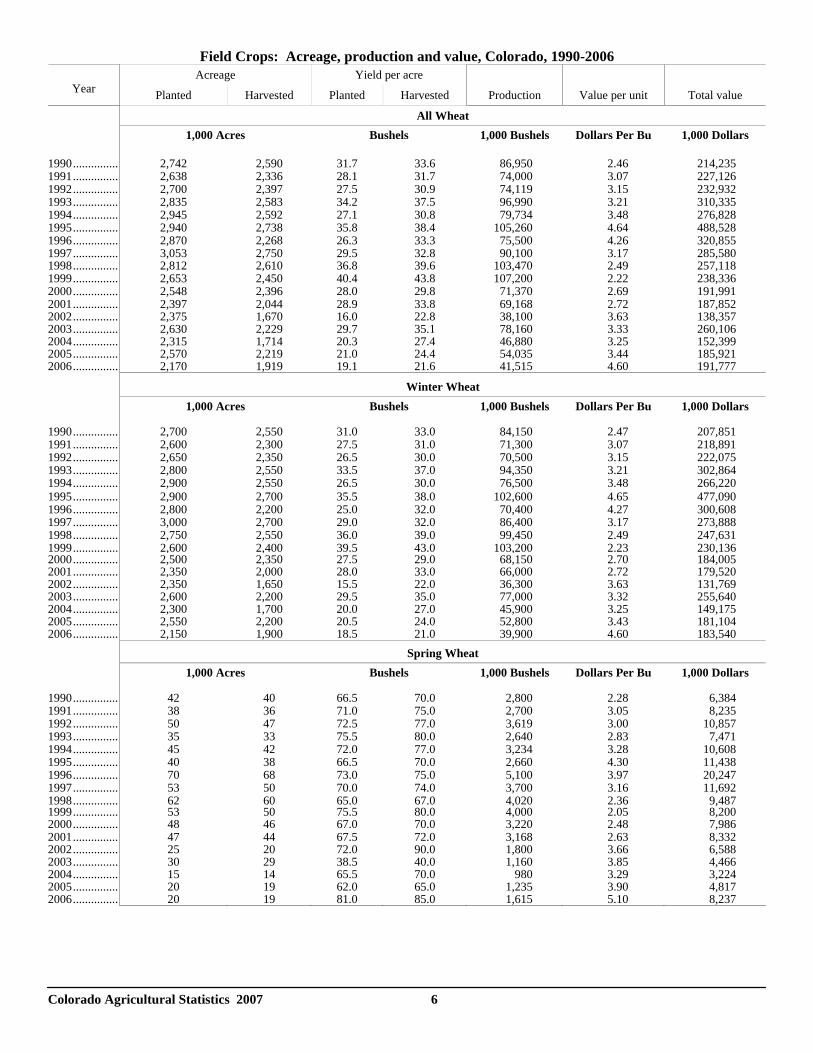
Field Crops: Acreage, production and value, Colorado, 1990-2006Acreage Yield per acre
Year Planted Harvested Planted Harvested Production Value per unit Total value
All Wheat 1,000 Acres Bushels 1,000 Bushels Dollars Per Bu 1,000 Dollars
1990............... 2,742 2,590 31.7 33.6 86,950 2.46 214,235 1991............... 2,638 2,336 28.1 31.7 74,000 3.07 227,126 1992............... 2,700 2,397 27.5 30.9 74,119 3.15 232,932 1993............... 2,835 2,583 34.2 37.5 96,990 3.21 310,335 1994............... 2,945 2,592 27.1 30.8 79,734 3.48 276,828 1995............... 2,940 2,738 35.8 38.4 105,260 4.64 488,528 1996............... 2,870 2,268 26.3 33.3 75,500 4.26 320,855 1997............... 3,053 2,750 29.5 32.8 90,100 3.17 285,5801998............... 2,812 2,610 36.8 39.6 103,470 2.49 257,118 1999............... 2,653 2,450 40.4 43.8 107,200 2.22 238,336 2000............... 2,548 2,396 28.0 29.8 71,370 2.69 191,991 2001............... 2,397 2,044 28.9 33.8 69,168 2.72 187,852 2002............... 2,375 1,670 16.0 22.8 38,100 3.63 138,357 2003............... 2,630 2,229 29.7 35.1 78,160 3.33 260,106 2004............... 2,315 1,714 20.3 27.4 46,880 3.25 152,399 2005............... 2,570 2,219 21.0 24.4 54,035 3.44 185,921 2006............... 2,170 1,919 19.1 21.6 41,515 4.60 191,777
Winter Wheat 1,000 Acres Bushels 1,000 Bushels Dollars Per Bu 1,000 Dollars
1990............... 2,700 2,550 31.0 33.0 84,150 2.47 207,851 1991............... 2,600 2,300 27.5 31.0 71,300 3.07 218,891 1992............... 2,650 2,350 26.5 30.0 70,500 3.15 222,075 1993............... 2,800 2,550 33.5 37.0 94,350 3.21 302,864 1994............... 2,900 2,550 26.5 30.0 76,500 3.48 266,220 1995............... 2,900 2,700 35.5 38.0 102,600 4.65 477,090 1996............... 2,800 2,200 25.0 32.0 70,400 4.27 300,608 1997............... 3,000 2,700 29.0 32.0 86,400 3.17 273,888 1998............... 2,750 2,550 36.0 39.0 99,450 2.49 247,631 1999............... 2,600 2,400 39.5 43.0 103,200 2.23 230,1362000............... 2,500 2,350 27.5 29.0 68,150 2.70 184,0052001............... 2,350 2,000 28.0 33.0 66,000 2.72 179,520 2002............... 2,350 1,650 15.5 22.0 36,300 3.63 131,769 2003............... 2,600 2,200 29.5 35.0 77,000 3.32 255,640 2004............... 2,300 1,700 20.0 27.0 45,900 3.25 149,175 2005............... 2,550 2,200 20.5 24.0 52,800 3.43 181,104 2006............... 2,150 1,900 18.5 21.0 39,900 4.60 183,540
Spring Wheat 1,000 Acres Bushels 1,000 Bushels Dollars Per Bu 1,000 Dollars
1990............... 42 40 66.5 70.0 2,800 2.28 6,384 1991............... 38 36 71.0 75.0 2,700 3.05 8,235 1992............... 50 47 72.5 77.0 3,619 3.00 10,857 1993............... 35 33 75.5 80.0 2,640 2.83 7,471 1994............... 45 42 72.0 77.0 3,234 3.28 10,608 1995............... 40 38 66.5 70.0 2,660 4.30 11,438 1996............... 70 68 73.0 75.0 5,100 3.97 20,247 1997............... 53 50 70.0 74.0 3,700 3.16 11,692 1998............... 62 60 65.0 67.0 4,020 2.36 9,4871999............... 53 50 75.5 80.0 4,000 2.05 8,2002000............... 48 46 67.0 70.0 3,220 2.48 7,986 2001............... 47 44 67.5 72.0 3,168 2.63 8,332 2002............... 25 20 72.0 90.0 1,800 3.66 6,588 2003............... 30 29 38.5 40.0 1,160 3.85 4,466 2004............... 15 14 65.5 70.0 980 3.29 3,224 2005............... 20 19 62.0 65.0 1,235 3.90 4,817 2006............... 20 19 81.0 85.0 1,615 5.10 8,237
Colorado Agricultural Statistics 2007 7
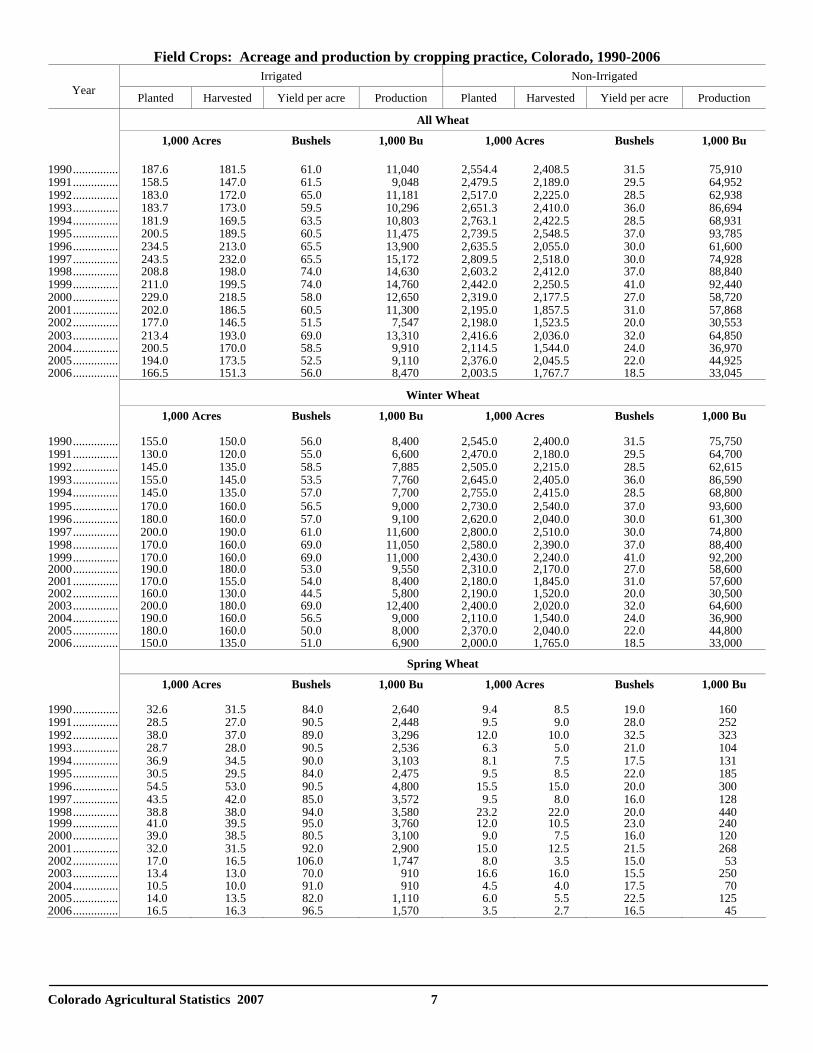
Field Crops: Acreage and production by cropping practice, Colorado, 1990-2006 Irrigated Non-Irrigated
Year Planted Harvested Yield per acre Production Planted Harvested Yield per acre Production
All Wheat
1,000 Acres Bushels 1,000 Bu 1,000 Acres Bushels 1,000 Bu 1990............... 187.6 181.5 61.0 11,040 2,554.4 2,408.5 31.5 75,910 1991............... 158.5 147.0 61.5 9,048 2,479.5 2,189.0 29.5 64,952 1992............... 183.0 172.0 65.0 11,181 2,517.0 2,225.0 28.5 62,938 1993............... 183.7 173.0 59.5 10,296 2,651.3 2,410.0 36.0 86,694 1994............... 181.9 169.5 63.5 10,803 2,763.1 2,422.5 28.5 68,931 1995............... 200.5 189.5 60.5 11,475 2,739.5 2,548.5 37.0 93,785 1996............... 234.5 213.0 65.5 13,900 2,635.5 2,055.0 30.0 61,600 1997............... 243.5 232.0 65.5 15,172 2,809.5 2,518.0 30.0 74,9281998............... 208.8 198.0 74.0 14,630 2,603.2 2,412.0 37.0 88,840 1999............... 211.0 199.5 74.0 14,760 2,442.0 2,250.5 41.0 92,440 2000............... 229.0 218.5 58.0 12,650 2,319.0 2,177.5 27.0 58,720 2001............... 202.0 186.5 60.5 11,300 2,195.0 1,857.5 31.0 57,868 2002............... 177.0 146.5 51.5 7,547 2,198.0 1,523.5 20.0 30,553 2003............... 213.4 193.0 69.0 13,310 2,416.6 2,036.0 32.0 64,850 2004............... 200.5 170.0 58.5 9,910 2,114.5 1,544.0 24.0 36,970 2005............... 194.0 173.5 52.5 9,110 2,376.0 2,045.5 22.0 44,925 2006............... 166.5 151.3 56.0 8,470 2,003.5 1,767.7 18.5 33,045
Winter Wheat
1,000 Acres Bushels 1,000 Bu 1,000 Acres Bushels 1,000 Bu 1990............... 155.0 150.0 56.0 8,400 2,545.0 2,400.0 31.5 75,750 1991............... 130.0 120.0 55.0 6,600 2,470.0 2,180.0 29.5 64,700 1992............... 145.0 135.0 58.5 7,885 2,505.0 2,215.0 28.5 62,615 1993............... 155.0 145.0 53.5 7,760 2,645.0 2,405.0 36.0 86,590 1994............... 145.0 135.0 57.0 7,700 2,755.0 2,415.0 28.5 68,800 1995............... 170.0 160.0 56.5 9,000 2,730.0 2,540.0 37.0 93,600 1996............... 180.0 160.0 57.0 9,100 2,620.0 2,040.0 30.0 61,300 1997............... 200.0 190.0 61.0 11,600 2,800.0 2,510.0 30.0 74,800 1998............... 170.0 160.0 69.0 11,050 2,580.0 2,390.0 37.0 88,400 1999............... 170.0 160.0 69.0 11,000 2,430.0 2,240.0 41.0 92,2002000............... 190.0 180.0 53.0 9,550 2,310.0 2,170.0 27.0 58,6002001............... 170.0 155.0 54.0 8,400 2,180.0 1,845.0 31.0 57,6002002............... 160.0 130.0 44.5 5,800 2,190.0 1,520.0 20.0 30,5002003............... 200.0 180.0 69.0 12,400 2,400.0 2,020.0 32.0 64,600 2004............... 190.0 160.0 56.5 9,000 2,110.0 1,540.0 24.0 36,900 2005............... 180.0 160.0 50.0 8,000 2,370.0 2,040.0 22.0 44,800 2006............... 150.0 135.0 51.0 6,900 2,000.0 1,765.0 18.5 33,000
Spring Wheat
1,000 Acres Bushels 1,000 Bu 1,000 Acres Bushels 1,000 Bu 1990............... 32.6 31.5 84.0 2,640 9.4 8.5 19.0 160 1991............... 28.5 27.0 90.5 2,448 9.5 9.0 28.0 252 1992............... 38.0 37.0 89.0 3,296 12.0 10.0 32.5 323 1993............... 28.7 28.0 90.5 2,536 6.3 5.0 21.0 104 1994............... 36.9 34.5 90.0 3,103 8.1 7.5 17.5 131 1995............... 30.5 29.5 84.0 2,475 9.5 8.5 22.0 185 1996............... 54.5 53.0 90.5 4,800 15.5 15.0 20.0 300 1997............... 43.5 42.0 85.0 3,572 9.5 8.0 16.0 128 1998............... 38.8 38.0 94.0 3,580 23.2 22.0 20.0 4401999............... 41.0 39.5 95.0 3,760 12.0 10.5 23.0 2402000............... 39.0 38.5 80.5 3,100 9.0 7.5 16.0 120 2001............... 32.0 31.5 92.0 2,900 15.0 12.5 21.5 268 2002............... 17.0 16.5 106.0 1,747 8.0 3.5 15.0 53 2003............... 13.4 13.0 70.0 910 16.6 16.0 15.5 250 2004............... 10.5 10.0 91.0 910 4.5 4.0 17.5 70 2005............... 14.0 13.5 82.0 1,110 6.0 5.5 22.5 125 2006............... 16.5 16.3 96.5 1,570 3.5 2.7 16.5 45
Colorado Agricultural Statistics 2007 8
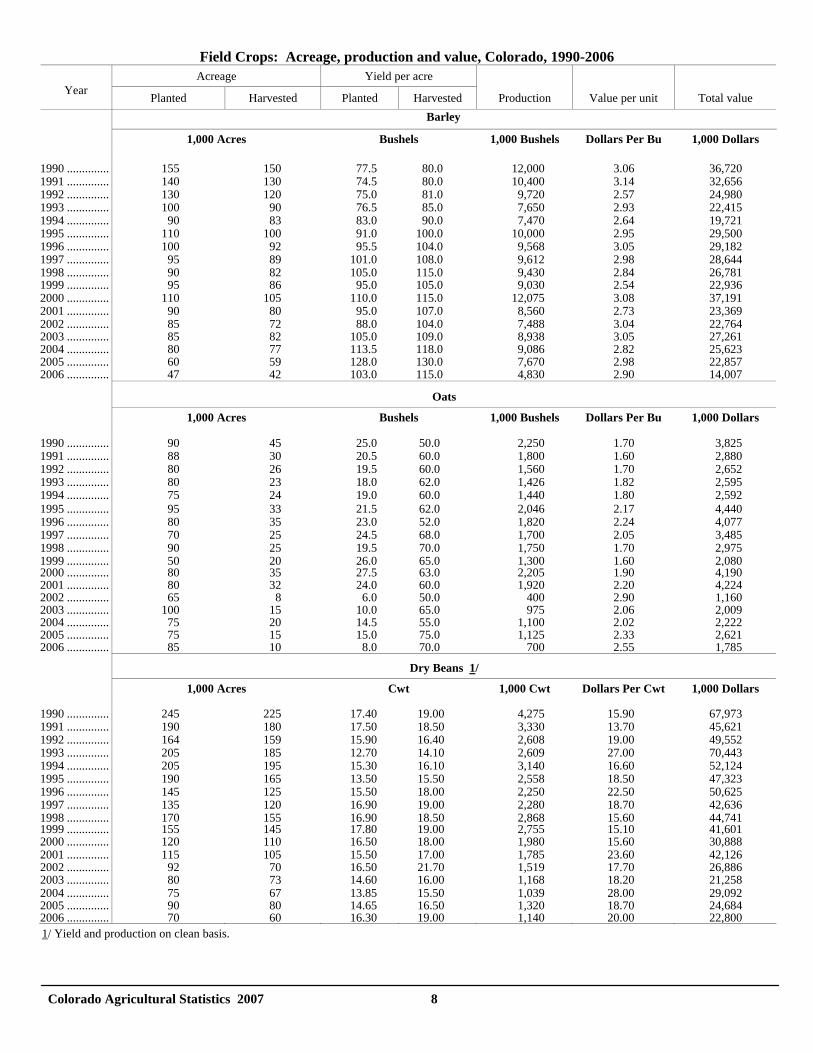
Field Crops: Acreage, production and value, Colorado, 1990-2006
1/ Yield and production on clean basis.
Acreage Yield per acre Year Planted Harvested Planted Harvested Production Value per unit Total value
Barley
1,000 Acres Bushels 1,000 Bushels Dollars Per Bu 1,000 Dollars 1990 .............. 155 150 77.5 80.0 12,000 3.06 36,720 1991 .............. 140 130 74.5 80.0 10,400 3.14 32,656 1992 .............. 130 120 75.0 81.0 9,720 2.57 24,980 1993 .............. 100 90 76.5 85.0 7,650 2.93 22,415 1994 .............. 90 83 83.0 90.0 7,470 2.64 19,721 1995 .............. 110 100 91.0 100.0 10,000 2.95 29,500 1996 .............. 100 92 95.5 104.0 9,568 3.05 29,182 1997 .............. 95 89 101.0 108.0 9,612 2.98 28,644 1998 .............. 90 82 105.0 115.0 9,430 2.84 26,781 1999 .............. 95 86 95.0 105.0 9,030 2.54 22,936 2000 .............. 110 105 110.0 115.0 12,075 3.08 37,191 2001 .............. 90 80 95.0 107.0 8,560 2.73 23,369 2002 .............. 85 72 88.0 104.0 7,488 3.04 22,764 2003 .............. 85 82 105.0 109.0 8,938 3.05 27,261 2004 .............. 80 77 113.5 118.0 9,086 2.82 25,623 2005 .............. 60 59 128.0 130.0 7,670 2.98 22,857 2006 .............. 47 42 103.0 115.0 4,830 2.90 14,007
Oats
1,000 Acres Bushels 1,000 Bushels Dollars Per Bu 1,000 Dollars 1990 .............. 90 45 25.0 50.0 2,250 1.70 3,825 1991 .............. 88 30 20.5 60.0 1,800 1.60 2,880 1992 .............. 80 26 19.5 60.0 1,560 1.70 2,652 1993 .............. 80 23 18.0 62.0 1,426 1.82 2,595 1994 .............. 75 24 19.0 60.0 1,440 1.80 2,592 1995 .............. 95 33 21.5 62.0 2,046 2.17 4,440 1996 .............. 80 35 23.0 52.0 1,820 2.24 4,077 1997 .............. 70 25 24.5 68.0 1,700 2.05 3,485 1998 .............. 90 25 19.5 70.0 1,750 1.70 2,975 1999 .............. 50 20 26.0 65.0 1,300 1.60 2,0802000 .............. 80 35 27.5 63.0 2,205 1.90 4,190 2001 .............. 80 32 24.0 60.0 1,920 2.20 4,224 2002 .............. 65 8 6.0 50.0 400 2.90 1,160 2003 .............. 100 15 10.0 65.0 975 2.06 2,009 2004 .............. 75 20 14.5 55.0 1,100 2.02 2,222 2005 .............. 75 15 15.0 75.0 1,125 2.33 2,621 2006 .............. 85 10 8.0 70.0 700 2.55 1,785
Dry Beans 1/
1,000 Acres Cwt 1,000 Cwt Dollars Per Cwt 1,000 Dollars 1990 .............. 245 225 17.40 19.00 4,275 15.90 67,973 1991 .............. 190 180 17.50 18.50 3,330 13.70 45,621 1992 .............. 164 159 15.90 16.40 2,608 19.00 49,552 1993 .............. 205 185 12.70 14.10 2,609 27.00 70,443 1994 .............. 205 195 15.30 16.10 3,140 16.60 52,124 1995 .............. 190 165 13.50 15.50 2,558 18.50 47,323 1996 .............. 145 125 15.50 18.00 2,250 22.50 50,625 1997 .............. 135 120 16.90 19.00 2,280 18.70 42,636 1998 .............. 170 155 16.90 18.50 2,868 15.60 44,7411999 .............. 155 145 17.80 19.00 2,755 15.10 41,601 2000 .............. 120 110 16.50 18.00 1,980 15.60 30,888 2001 .............. 115 105 15.50 17.00 1,785 23.60 42,126 2002 .............. 92 70 16.50 21.70 1,519 17.70 26,886 2003 .............. 80 73 14.60 16.00 1,168 18.20 21,258 2004 .............. 75 67 13.85 15.50 1,039 28.00 29,0922005 .............. 90 80 14.65 16.50 1,320 18.70 24,6842006 .............. 70 60 16.30 19.00 1,140 20.00 22,800
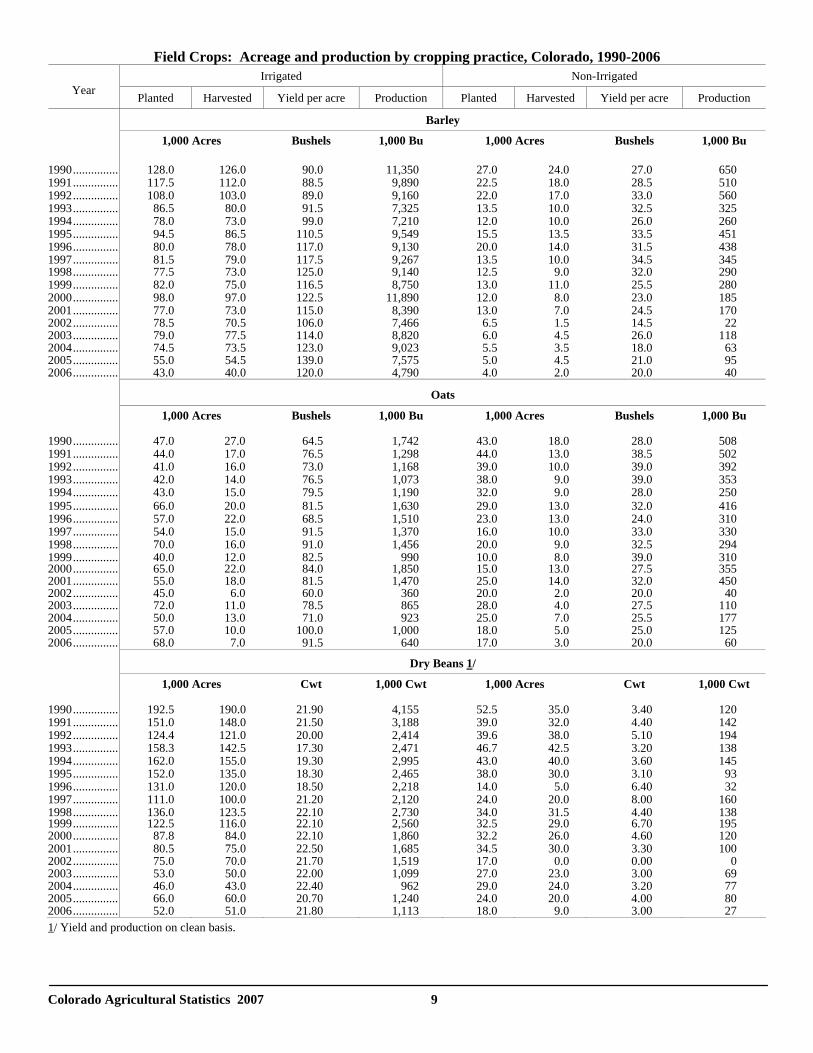
Colorado Agricultural Statistics 2007 9
Field Crops: Acreage and production by cropping practice, Colorado, 1990-2006 Irrigated Non-Irrigated
Year Planted Harvested Yield per acre Production Planted Harvested Yield per acre Production
Barley
1,000 Acres Bushels 1,000 Bu 1,000 Acres Bushels 1,000 Bu 1990............... 128.0 126.0 90.0 11,350 27.0 24.0 27.0 650 1991............... 117.5 112.0 88.5 9,890 22.5 18.0 28.5 510 1992............... 108.0 103.0 89.0 9,160 22.0 17.0 33.0 560 1993............... 86.5 80.0 91.5 7,325 13.5 10.0 32.5 325 1994............... 78.0 73.0 99.0 7,210 12.0 10.0 26.0 260 1995............... 94.5 86.5 110.5 9,549 15.5 13.5 33.5 451 1996............... 80.0 78.0 117.0 9,130 20.0 14.0 31.5 438 1997............... 81.5 79.0 117.5 9,267 13.5 10.0 34.5 3451998............... 77.5 73.0 125.0 9,140 12.5 9.0 32.0 290 1999............... 82.0 75.0 116.5 8,750 13.0 11.0 25.5 280 2000............... 98.0 97.0 122.5 11,890 12.0 8.0 23.0 185 2001............... 77.0 73.0 115.0 8,390 13.0 7.0 24.5 170 2002............... 78.5 70.5 106.0 7,466 6.5 1.5 14.5 22 2003............... 79.0 77.5 114.0 8,820 6.0 4.5 26.0 118 2004............... 74.5 73.5 123.0 9,023 5.5 3.5 18.0 63 2005............... 55.0 54.5 139.0 7,575 5.0 4.5 21.0 95 2006............... 43.0 40.0 120.0 4,790 4.0 2.0 20.0 40
Oats
1,000 Acres Bushels 1,000 Bu 1,000 Acres Bushels 1,000 Bu 1990............... 47.0 27.0 64.5 1,742 43.0 18.0 28.0 508 1991............... 44.0 17.0 76.5 1,298 44.0 13.0 38.5 502 1992............... 41.0 16.0 73.0 1,168 39.0 10.0 39.0 392 1993............... 42.0 14.0 76.5 1,073 38.0 9.0 39.0 353 1994............... 43.0 15.0 79.5 1,190 32.0 9.0 28.0 250 1995............... 66.0 20.0 81.5 1,630 29.0 13.0 32.0 416 1996............... 57.0 22.0 68.5 1,510 23.0 13.0 24.0 310 1997............... 54.0 15.0 91.5 1,370 16.0 10.0 33.0 330 1998............... 70.0 16.0 91.0 1,456 20.0 9.0 32.5 294 1999............... 40.0 12.0 82.5 990 10.0 8.0 39.0 3102000............... 65.0 22.0 84.0 1,850 15.0 13.0 27.5 3552001............... 55.0 18.0 81.5 1,470 25.0 14.0 32.0 4502002............... 45.0 6.0 60.0 360 20.0 2.0 20.0 402003............... 72.0 11.0 78.5 865 28.0 4.0 27.5 110 2004............... 50.0 13.0 71.0 923 25.0 7.0 25.5 177 2005............... 57.0 10.0 100.0 1,000 18.0 5.0 25.0 125 2006............... 68.0 7.0 91.5 640 17.0 3.0 20.0 60
Dry Beans 1/
1,000 Acres Cwt 1,000 Cwt 1,000 Acres Cwt 1,000 Cwt 1990............... 192.5 190.0 21.90 4,155 52.5 35.0 3.40 120 1991............... 151.0 148.0 21.50 3,188 39.0 32.0 4.40 142 1992............... 124.4 121.0 20.00 2,414 39.6 38.0 5.10 194 1993............... 158.3 142.5 17.30 2,471 46.7 42.5 3.20 138 1994............... 162.0 155.0 19.30 2,995 43.0 40.0 3.60 145 1995............... 152.0 135.0 18.30 2,465 38.0 30.0 3.10 93 1996............... 131.0 120.0 18.50 2,218 14.0 5.0 6.40 32 1997............... 111.0 100.0 21.20 2,120 24.0 20.0 8.00 160 1998............... 136.0 123.5 22.10 2,730 34.0 31.5 4.40 1381999............... 122.5 116.0 22.10 2,560 32.5 29.0 6.70 1952000............... 87.8 84.0 22.10 1,860 32.2 26.0 4.60 120 2001............... 80.5 75.0 22.50 1,685 34.5 30.0 3.30 100 2002............... 75.0 70.0 21.70 1,519 17.0 0.0 0.00 0 2003............... 53.0 50.0 22.00 1,099 27.0 23.0 3.00 69 2004............... 46.0 43.0 22.40 962 29.0 24.0 3.20 77 2005............... 66.0 60.0 20.70 1,240 24.0 20.0 4.00 80 2006............... 52.0 51.0 21.80 1,113 18.0 9.0 3.00 27 1/ Yield and production on clean basis.
Colorado Agricultural Statistics 2007 10
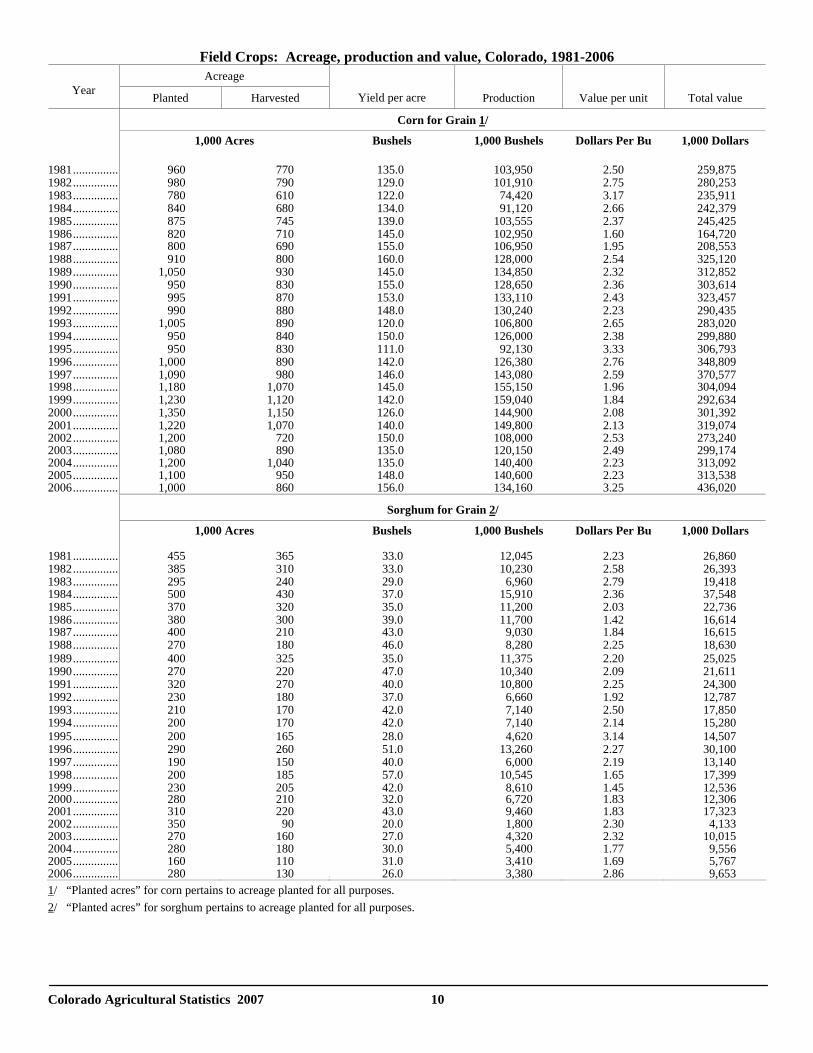
Field Crops: Acreage, production and value, Colorado, 1981-2006 Acreage
Year Planted Harvested
Yield per acre Production Value per unit Total value
Corn for Grain 1/
1,000 Acres Bushels 1,000 Bushels Dollars Per Bu 1,000 Dollars 1981............... 960 770 135.0 103,950 2.50 259,875 1982............... 980 790 129.0 101,910 2.75 280,253 1983............... 780 610 122.0 74,420 3.17 235,911 1984............... 840 680 134.0 91,120 2.66 242,379 1985............... 875 745 139.0 103,555 2.37 245,425 1986............... 820 710 145.0 102,950 1.60 164,7201987............... 800 690 155.0 106,950 1.95 208,553 1988............... 910 800 160.0 128,000 2.54 325,120 1989............... 1,050 930 145.0 134,850 2.32 312,852 1990............... 950 830 155.0 128,650 2.36 303,614 1991............... 995 870 153.0 133,110 2.43 323,457 1992............... 990 880 148.0 130,240 2.23 290,435 1993............... 1,005 890 120.0 106,800 2.65 283,020 1994............... 950 840 150.0 126,000 2.38 299,880 1995............... 950 830 111.0 92,130 3.33 306,793 1996............... 1,000 890 142.0 126,380 2.76 348,809 1997............... 1,090 980 146.0 143,080 2.59 370,5771998............... 1,180 1,070 145.0 155,150 1.96 304,094 1999............... 1,230 1,120 142.0 159,040 1.84 292,634 2000............... 1,350 1,150 126.0 144,900 2.08 301,392 2001............... 1,220 1,070 140.0 149,800 2.13 319,074 2002............... 1,200 720 150.0 108,000 2.53 273,240 2003............... 1,080 890 135.0 120,150 2.49 299,174 2004............... 1,200 1,040 135.0 140,400 2.23 313,092 2005............... 1,100 950 148.0 140,600 2.23 313,538 2006............... 1,000 860 156.0 134,160 3.25 436,020
Sorghum for Grain 2/
1,000 Acres Bushels 1,000 Bushels Dollars Per Bu 1,000 Dollars 1981............... 455 365 33.0 12,045 2.23 26,860 1982............... 385 310 33.0 10,230 2.58 26,393 1983............... 295 240 29.0 6,960 2.79 19,418 1984............... 500 430 37.0 15,910 2.36 37,548 1985............... 370 320 35.0 11,200 2.03 22,736 1986............... 380 300 39.0 11,700 1.42 16,6141987............... 400 210 43.0 9,030 1.84 16,615 1988............... 270 180 46.0 8,280 2.25 18,630 1989............... 400 325 35.0 11,375 2.20 25,025 1990............... 270 220 47.0 10,340 2.09 21,611 1991............... 320 270 40.0 10,800 2.25 24,300 1992............... 230 180 37.0 6,660 1.92 12,787 1993............... 210 170 42.0 7,140 2.50 17,850 1994............... 200 170 42.0 7,140 2.14 15,280 1995............... 200 165 28.0 4,620 3.14 14,507 1996............... 290 260 51.0 13,260 2.27 30,100 1997............... 190 150 40.0 6,000 2.19 13,140 1998............... 200 185 57.0 10,545 1.65 17,399 1999............... 230 205 42.0 8,610 1.45 12,5362000............... 280 210 32.0 6,720 1.83 12,3062001............... 310 220 43.0 9,460 1.83 17,323 2002............... 350 90 20.0 1,800 2.30 4,133 2003............... 270 160 27.0 4,320 2.32 10,015 2004............... 280 180 30.0 5,400 1.77 9,556 2005............... 160 110 31.0 3,410 1.69 5,767 2006............... 280 130 2 26.0 3,380 2.86 9,653 1/ “Planted acres” for corn pertains to acreage planted for all purposes. 2/ “Planted acres” for sorghum pertains to acreage planted for all purposes.
Colorado Agricultural Statistics 2007 11
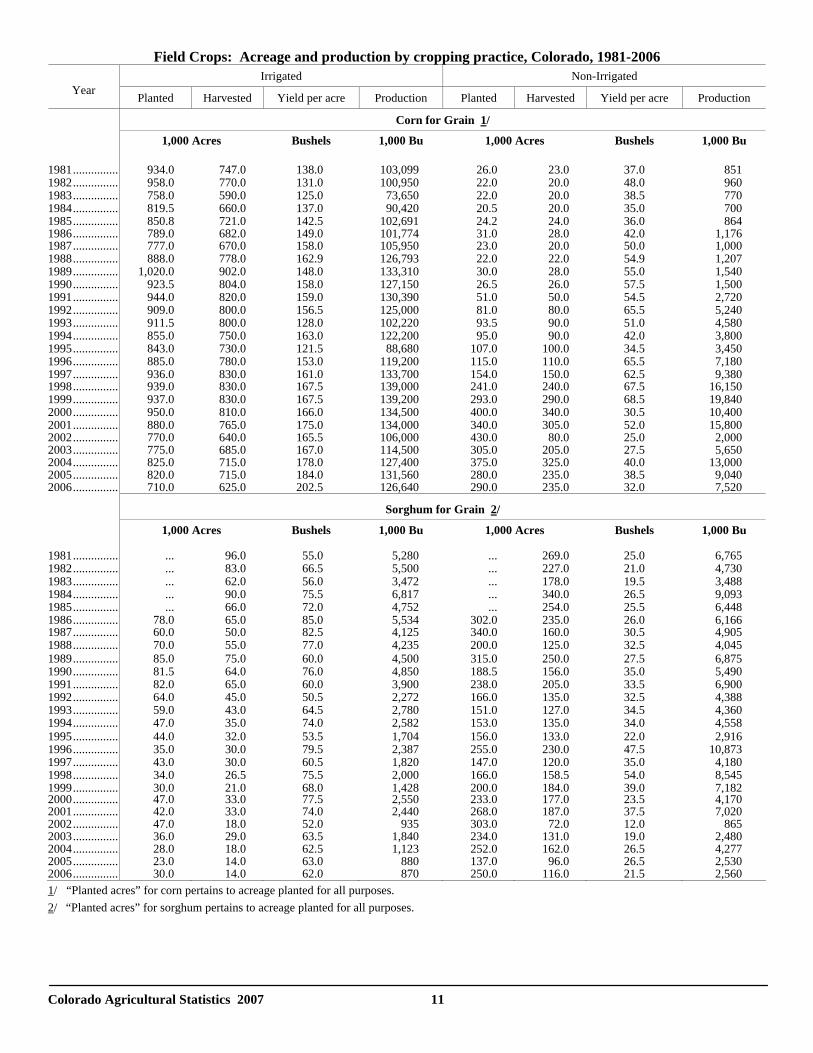
Field Crops: Acreage and production by cropping practice, Colorado, 1981-2006 Irrigated Non-Irrigated
Year Planted Harvested Yield per acre Production Planted Harvested Yield per acre Production
Corn for Grain 1/
1,000 Acres Bushels 1,000 Bu 1,000 Acres Bushels 1,000 Bu 1981............... 934.0 747.0 138.0 103,099 26.0 23.0 37.0 851 1982............... 958.0 770.0 131.0 100,950 22.0 20.0 48.0 960 1983............... 758.0 590.0 125.0 73,650 22.0 20.0 38.5 770 1984............... 819.5 660.0 137.0 90,420 20.5 20.0 35.0 700 1985............... 850.8 721.0 142.5 102,691 24.2 24.0 36.0 864 1986............... 789.0 682.0 149.0 101,774 31.0 28.0 42.0 1,1761987............... 777.0 670.0 158.0 105,950 23.0 20.0 50.0 1,000 1988............... 888.0 778.0 162.9 126,793 22.0 22.0 54.9 1,207 1989............... 1,020.0 902.0 148.0 133,310 30.0 28.0 55.0 1,540 1990............... 923.5 804.0 158.0 127,150 26.5 26.0 57.5 1,500 1991............... 944.0 820.0 159.0 130,390 51.0 50.0 54.5 2,720 1992............... 909.0 800.0 156.5 125,000 81.0 80.0 65.5 5,240 1993............... 911.5 800.0 128.0 102,220 93.5 90.0 51.0 4,580 1994............... 855.0 750.0 163.0 122,200 95.0 90.0 42.0 3,800 1995............... 843.0 730.0 121.5 88,680 107.0 100.0 34.5 3,450 1996............... 885.0 780.0 153.0 119,200 115.0 110.0 65.5 7,180 1997............... 936.0 830.0 161.0 133,700 154.0 150.0 62.5 9,3801998............... 939.0 830.0 167.5 139,000 241.0 240.0 67.5 16,150 1999............... 937.0 830.0 167.5 139,200 293.0 290.0 68.5 19,840 2000............... 950.0 810.0 166.0 134,500 400.0 340.0 30.5 10,400 2001............... 880.0 765.0 175.0 134,000 340.0 305.0 52.0 15,800 2002............... 770.0 640.0 165.5 106,000 430.0 80.0 25.0 2,000 2003............... 775.0 685.0 167.0 114,500 305.0 205.0 27.5 5,650 2004............... 825.0 715.0 178.0 127,400 375.0 325.0 40.0 13,000 2005............... 820.0 715.0 184.0 131,560 280.0 235.0 38.5 9,040 2006............... 710.0 625.0 202.5 126,640 290.0 235.0 32.0 7,520
Sorghum for Grain 2/
1,000 Acres Bushels 1,000 Bu 1,000 Acres Bushels 1,000 Bu 1981............... ... 96.0 55.0 5,280 ... 269.0 25.0 6,765 1982............... ... 83.0 66.5 5,500 ... 227.0 21.0 4,730 1983............... ... 62.0 56.0 3,472 ... 178.0 19.5 3,488 1984............... ... 90.0 75.5 6,817 ... 340.0 26.5 9,093 1985............... ... 66.0 72.0 4,752 ... 254.0 25.5 6,448 1986............... 78.0 65.0 85.0 5,534 302.0 235.0 26.0 6,1661987............... 60.0 50.0 82.5 4,125 340.0 160.0 30.5 4,905 1988............... 70.0 55.0 77.0 4,235 200.0 125.0 32.5 4,045 1989............... 85.0 75.0 60.0 4,500 315.0 250.0 27.5 6,875 1990............... 81.5 64.0 76.0 4,850 188.5 156.0 35.0 5,490 1991............... 82.0 65.0 60.0 3,900 238.0 205.0 33.5 6,900 1992............... 64.0 45.0 50.5 2,272 166.0 135.0 32.5 4,388 1993............... 59.0 43.0 64.5 2,780 151.0 127.0 34.5 4,360 1994............... 47.0 35.0 74.0 2,582 153.0 135.0 34.0 4,558 1995............... 44.0 32.0 53.5 1,704 156.0 133.0 22.0 2,916 1996............... 35.0 30.0 79.5 2,387 255.0 230.0 47.5 10,873 1997............... 43.0 30.0 60.5 1,820 147.0 120.0 35.0 4,180 1998............... 34.0 26.5 75.5 2,000 166.0 158.5 54.0 8,545 1999............... 30.0 21.0 68.0 1,428 200.0 184.0 39.0 7,1822000............... 47.0 33.0 77.5 2,550 233.0 177.0 23.5 4,1702001............... 42.0 33.0 74.0 2,440 268.0 187.0 37.5 7,020 2002............... 47.0 18.0 52.0 935 303.0 72.0 12.0 865 2003............... 36.0 29.0 63.5 1,840 234.0 131.0 19.0 2,480 2004............... 28.0 18.0 62.5 1,123 252.0 162.0 26.5 4,277 2005............... 23.0 14.0 63.0 880 137.0 96.0 26.5 2,530 2006............... 30.0 14.0 62.0 870 250.0 116.0 21.5 2,560 1/ “Planted acres” for corn pertains to acreage planted for all purposes. 2/ “Planted acres” for sorghum pertains to acreage planted for all purposes.
Colorado Agricultural Statistics 2007 12
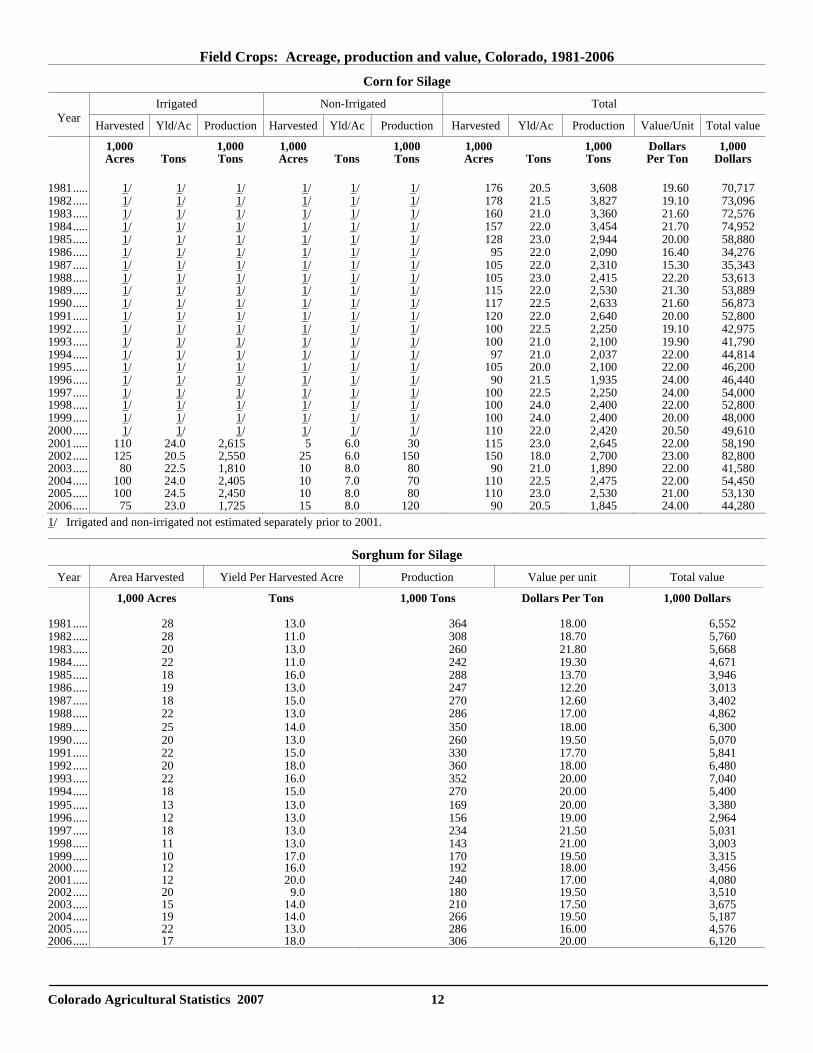
Field Crops: Acreage, production and value, Colorado, 1981-2006 Corn for Silage
Irrigated Non-Irrigated Total Year Harvested Yld/Ac Production Harvested Yld/Ac Production Harvested Yld/Ac Production Value/Unit Total value
1,000 Acres
Tons
1,000 Tons
1,000 Acres
Tons
1,000 Tons
1,000 Acres
Tons
1,000 Tons
Dollars Per Ton
1,000 Dollars
1981..... 1/ 1/ 1/ 1/ 1/ 1/ 176 20.5 3,608 19.60 70,717 1982..... 1/ 1/ 1/ 1/ 1/ 1/ 178 21.5 3,827 19.10 73,096 1983..... 1/ 1/ 1/ 1/ 1/ 1/ 160 21.0 3,360 21.60 72,576 1984..... 1/ 1/ 1/ 1/ 1/ 1/ 157 22.0 3,454 21.70 74,952 1985..... 1/ 1/ 1/ 1/ 1/ 1/ 128 23.0 2,944 20.00 58,880 1986..... 1/ 1/ 1/ 1/ 1/ 1/ 95 22.0 2,090 16.40 34,276 1987..... 1/ 1/ 1/ 1/ 1/ 1/ 105 22.0 2,310 15.30 35,343 1988..... 1/ 1/ 1/ 1/ 1/ 1/ 105 23.0 2,415 22.20 53,613 1989..... 1/ 1/ 1/ 1/ 1/ 1/ 115 22.0 2,530 21.30 53,889 1990..... 1/ 1/ 1/ 1/ 1/ 1/ 117 22.5 2,633 21.60 56,873 1991..... 1/ 1/ 1/ 1/ 1/ 1/ 120 22.0 2,640 20.00 52,800 1992..... 1/ 1/ 1/ 1/ 1/ 1/ 100 22.5 2,250 19.10 42,975 1993..... 1/ 1/ 1/ 1/ 1/ 1/ 100 21.0 2,100 19.90 41,790 1994..... 1/ 1/ 1/ 1/ 1/ 1/ 97 21.0 2,037 22.00 44,814 1995..... 1/ 1/ 1/ 1/ 1/ 1/ 105 20.0 2,100 22.00 46,200 1996..... 1/ 1/ 1/ 1/ 1/ 1/ 90 21.5 1,935 24.00 46,440 1997..... 1/ 1/ 1/ 1/ 1/ 1/ 100 22.5 2,250 24.00 54,0001998..... 1/ 1/ 1/ 1/ 1/ 1/ 100 24.0 2,400 22.00 52,800 1999..... 1/ 1/ 1/ 1/ 1/ 1/ 100 24.0 2,400 20.00 48,000 2000..... 1/ 1/ 1/ 1/ 1/ 1/ 110 22.0 2,420 20.50 49,610 2001..... 110 24.0 2,615 5 6.0 30 115 23.0 2,645 22.00 58,190 2002..... 125 20.5 2,550 25 6.0 150 150 18.0 2,700 23.00 82,800 2003..... 80 22.5 1,810 10 8.0 80 90 21.0 1,890 22.00 41,580 2004..... 100 24.0 2,405 10 7.0 70 110 22.5 2,475 22.00 54,450 2005..... 100 24.5 2,450 10 8.0 80 110 23.0 2,530 21.00 53,130 2006..... 75 23.0 1,725 15 8.0 120 90 20.5 1,845 24.00 44,280 1/ Irrigated and non-irrigated not estimated separately prior to 2001.
Sorghum for Silage
Year Area Harvested Yield Per Harvested Acre Production Value per unit Total value
1,000 Acres Tons 1,000 Tons Dollars Per Ton 1,000 Dollars 1981..... 28 13.0 364 18.00 6,552 1982..... 28 11.0 308 18.70 5,760 1983..... 20 13.0 260 21.80 5,668 1984..... 22 11.0 242 19.30 4,671 1985..... 18 16.0 288 13.70 3,946 1986..... 19 13.0 247 12.20 3,013 1987..... 18 15.0 270 12.60 3,402 1988..... 22 13.0 286 17.00 4,862 1989..... 25 14.0 350 18.00 6,300 1990..... 20 13.0 260 19.50 5,070 1991..... 22 15.0 330 17.70 5,841 1992..... 20 18.0 360 18.00 6,480 1993..... 22 16.0 352 20.00 7,040 1994..... 18 15.0 270 20.00 5,400 1995..... 13 13.0 169 20.00 3,380 1996..... 12 13.0 156 19.00 2,964 1997..... 18 13.0 234 21.50 5,031 1998..... 11 13.0 143 21.00 3,003 1999..... 10 17.0 170 19.50 3,3152000..... 12 16.0 192 18.00 3,4562001..... 12 20.0 240 17.00 4,0802002..... 20 9.0 180 19.50 3,5102003..... 15 14.0 210 17.50 3,6752004..... 19 14.0 266 19.50 5,1872005..... 22 13.0 286 16.00 4,5762006..... 17 18.0 306 20.00 6,120
Colorado Agricultural Statistics 2007 13
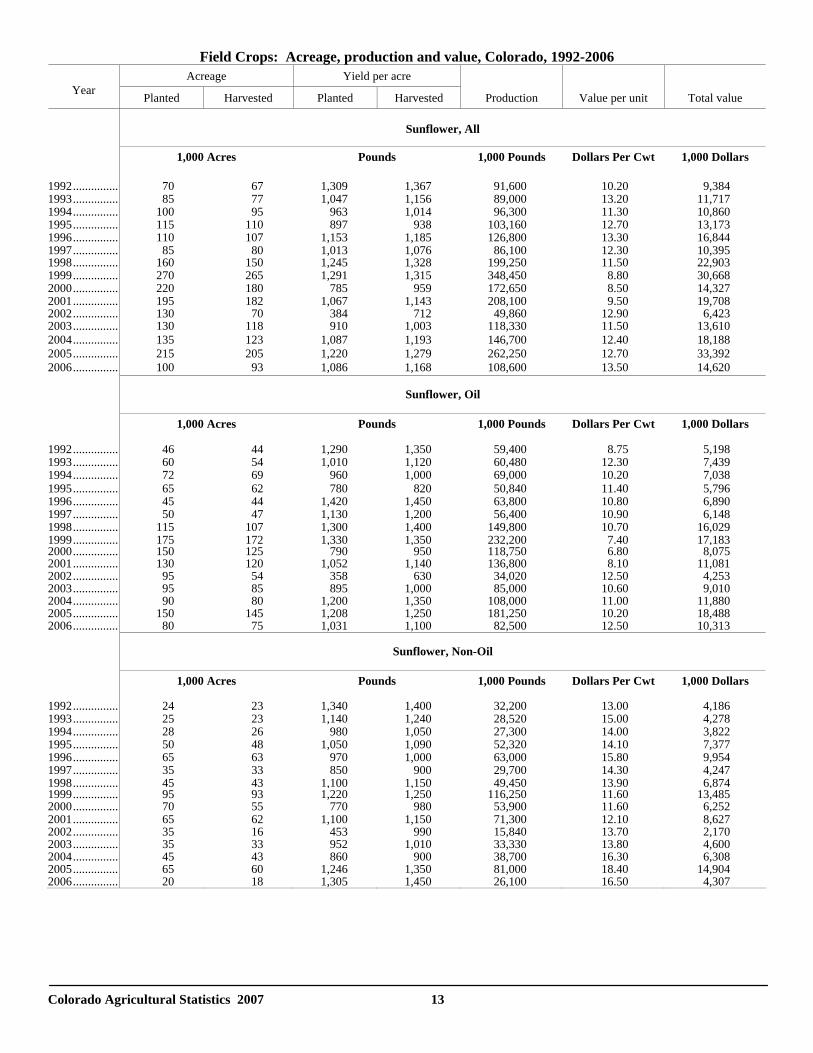
Field Crops: Acreage, production and value, Colorado, 1992-2006 Acreage Yield per acre
Year Planted Harvested Planted Harvested Production Value per unit Total value
Sunflower, All
1,000 Acres Pounds 1,000 Pounds Dollars Per Cwt 1,000 Dollars 1992............... 70 67 1,309 1,367 91,600 10.20 9,384 1993............... 85 77 1,047 1,156 89,000 13.20 11,717 1994............... 100 95 963 1,014 96,300 11.30 10,860 1995............... 115 110 897 938 103,160 12.70 13,173 1996............... 110 107 1,153 1,185 126,800 13.30 16,844 1997............... 85 80 1,013 1,076 86,100 12.30 10,3951998............... 160 150 1,245 1,328 199,250 11.50 22,903 1999............... 270 265 1,291 1,315 348,450 8.80 30,668 2000............... 220 180 785 959 172,650 8.50 14,327 2001............... 195 182 1,067 1,143 208,100 9.50 19,708 2002............... 130 70 384 712 49,860 12.90 6,423 2003............... 130 118 910 1,003 118,330 11.50 13,610 2004............... 135 123 1,087 1,193 146,700 12.40 18,188 2005............... 215 205 1,220 1,279 262,250 12.70 33,392 2006............... 100 93 1,086 1,168 108,600 13.50 14,620
Sunflower, Oil
1,000 Acres Pounds 1,000 Pounds Dollars Per Cwt 1,000 Dollars 1992............... 46 44 1,290 1,350 59,400 8.75 5,198 1993............... 60 54 1,010 1,120 60,480 12.30 7,439 1994............... 72 69 960 1,000 69,000 10.20 7,038 1995............... 65 62 780 820 50,840 11.40 5,796 1996............... 45 44 1,420 1,450 63,800 10.80 6,890 1997............... 50 47 1,130 1,200 56,400 10.90 6,148 1998............... 115 107 1,300 1,400 149,800 10.70 16,029 1999............... 175 172 1,330 1,350 232,200 7.40 17,1832000............... 150 125 790 950 118,750 6.80 8,0752001............... 130 120 1,052 1,140 136,800 8.10 11,081 2002............... 95 54 358 630 34,020 12.50 4,253 2003............... 95 85 895 1,000 85,000 10.60 9,010 2004............... 90 80 1,200 1,350 108,000 11.00 11,880 2005............... 150 145 1,208 1,250 181,250 10.20 18,488 2006............... 80 75 1,031 1,100 82,500 12.50 10,313
Sunflower, Non-Oil
1,000 Acres Pounds 1,000 Pounds Dollars Per Cwt 1,000 Dollars 1992............... 24 23 1,340 1,400 32,200 13.00 4,186 1993............... 25 23 1,140 1,240 28,520 15.00 4,278 1994............... 28 26 980 1,050 27,300 14.00 3,822 1995............... 50 48 1,050 1,090 52,320 14.10 7,377 1996............... 65 63 970 1,000 63,000 15.80 9,954 1997............... 35 33 850 900 29,700 14.30 4,247 1998............... 45 43 1,100 1,150 49,450 13.90 6,8741999............... 95 93 1,220 1,250 116,250 11.60 13,4852000............... 70 55 770 980 53,900 11.60 6,252 2001............... 65 62 1,100 1,150 71,300 12.10 8,627 2002............... 35 16 453 990 15,840 13.70 2,170 2003............... 35 33 952 1,010 33,330 13.80 4,600 2004............... 45 43 860 900 38,700 16.30 6,308 2005............... 65 60 1,246 1,350 81,000 18.40 14,904 2006............... 20 18 1,305 1,450 26,100 16.50 4,307
Colorado Agricultural Statistics 2007 14
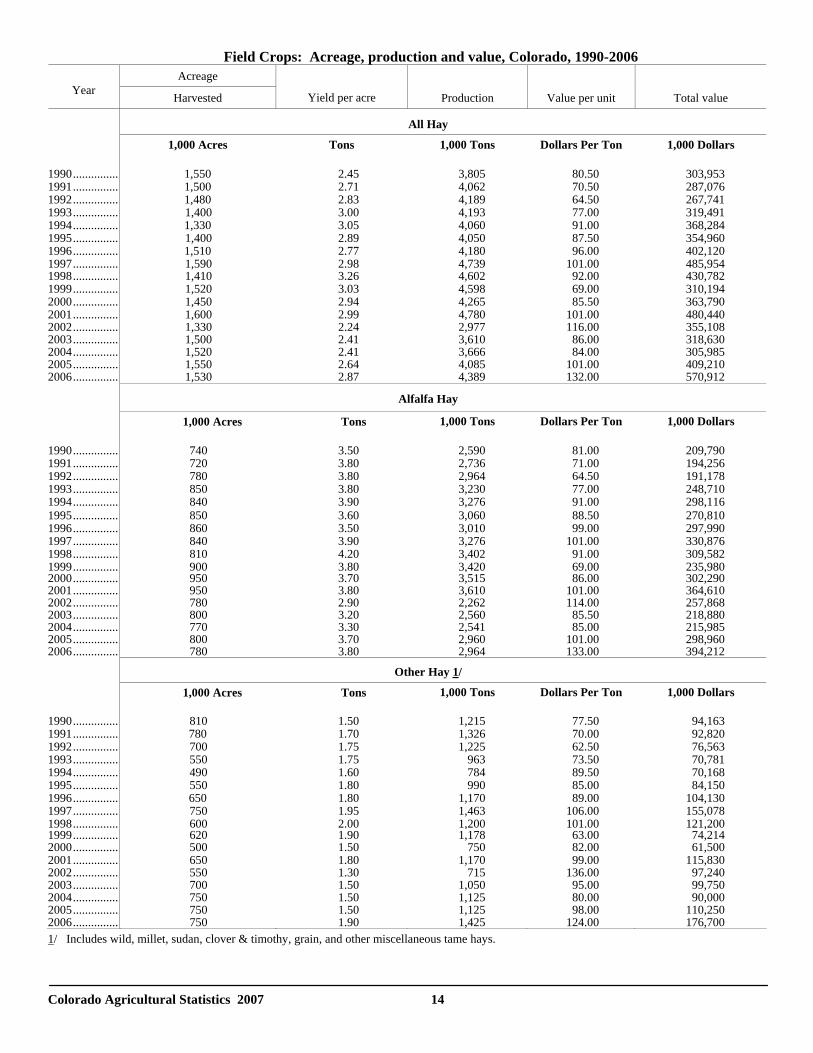
Field Crops: Acreage, production and value, Colorado, 1990-2006 Acreage
Year Harvested
Yield per acre Production Value per unit Total value
All Hay
1,000 Acres Tons 1,000 Tons Dollars Per Ton 1,000 Dollars 1990............... 1,550 2.45 3,805 80.50 303,953 1991............... 1,500 2.71 4,062 70.50 287,076 1992............... 1,480 2.83 4,189 64.50 267,741 1993............... 1,400 3.00 4,193 77.00 319,491 1994............... 1,330 3.05 4,060 91.00 368,284 1995............... 1,400 2.89 4,050 87.50 354,960 1996............... 1,510 2.77 4,180 96.00 402,120 1997............... 1,590 2.98 4,739 101.00 485,9541998............... 1,410 3.26 4,602 92.00 430,782 1999............... 1,520 3.03 4,598 69.00 310,194 2000............... 1,450 2.94 4,265 85.50 363,790 2001............... 1,600 2.99 4,780 101.00 480,440 2002............... 1,330 2.24 2,977 116.00 355,108 2003............... 1,500 2.41 3,610 86.00 318,630 2004............... 1,520 2.41 3,666 84.00 305,985 2005............... 1,550 2.64 4,085 101.00 409,210 2006............... 1,530 2.87 4,389 132.00 570,912
Alfalfa Hay
1,000 Acres Tons 1,000 Tons Dollars Per Ton 1,000 Dollars 1990............... 740 3.50 2,590 81.00 209,790 1991............... 720 3.80 2,736 71.00 194,256 1992............... 780 3.80 2,964 64.50 191,178 1993............... 850 3.80 3,230 77.00 248,710 1994............... 840 3.90 3,276 91.00 298,116 1995............... 850 3.60 3,060 88.50 270,810 1996............... 860 3.50 3,010 99.00 297,990 1997............... 840 3.90 3,276 101.00 330,876 1998............... 810 4.20 3,402 91.00 309,582 1999............... 900 3.80 3,420 69.00 235,9802000............... 950 3.70 3,515 86.00 302,2902001............... 950 3.80 3,610 101.00 364,6102002............... 780 2.90 2,262 114.00 257,8682003............... 800 3.20 2,560 85.50 218,8802004............... 770 3.30 2,541 85.00 215,9852005............... 800 3.70 2,960 101.00 298,9602006............... 780 3.80 2,964 133.00 394,212
Other Hay 1/
1,000 Acres Tons 1,000 Tons Dollars Per Ton 1,000 Dollars 1990............... 810 1.50 1,215 77.50 94,163 1991............... 780 1.70 1,326 70.00 92,820 1992............... 700 1.75 1,225 62.50 76,563 1993............... 550 1.75 963 73.50 70,781 1994............... 490 1.60 784 89.50 70,168 1995............... 550 1.80 990 85.00 84,150 1996............... 650 1.80 1,170 89.00 104,130 1997............... 750 1.95 1,463 106.00 155,078 1998............... 600 2.00 1,200 101.00 121,2001999............... 620 1.90 1,178 63.00 74,2142000............... 500 1.50 750 82.00 61,500 2001............... 650 1.80 1,170 99.00 115,830 2002............... 550 1.30 715 136.00 97,240 2003............... 700 1.50 1,050 95.00 99,750 2004............... 750 1.50 1,125 80.00 90,000 2005............... 750 1.50 1,125 98.00 110,250 2006............... 750 1.90 1,425 124.00 176,700 1/ Includes wild, millet, sudan, clover & timothy, grain, and other miscellaneous tame hays.
Colorado Agricultural Statistics 2007 15
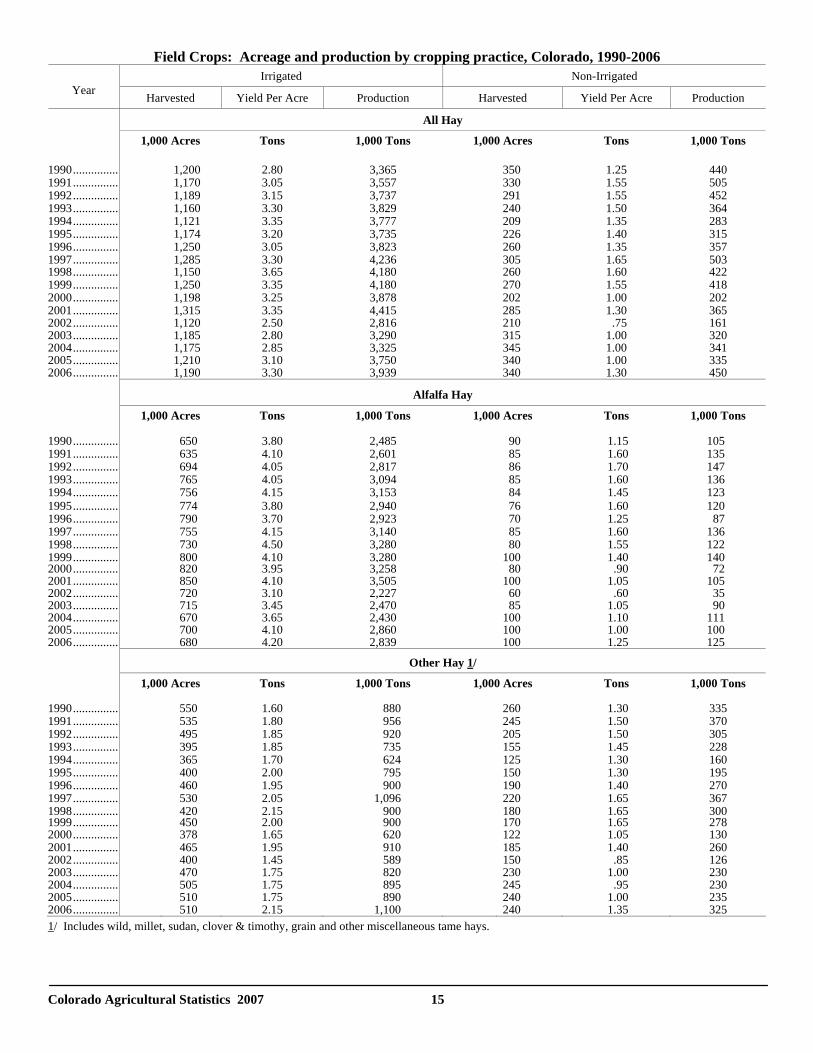
Field Crops: Acreage and production by cropping practice, Colorado, 1990-2006 Irrigated Non-Irrigated
Year Harvested Yield Per Acre Production Harvested Yield Per Acre Production
All Hay
1,000 Acres Tons 1,000 Tons 1,000 Acres Tons 1,000 Tons 1990............... 1,200 2.80 3,365 350 1.25 440 1991............... 1,170 3.05 3,557 330 1.55 505 1992............... 1,189 3.15 3,737 291 1.55 452 1993............... 1,160 3.30 3,829 240 1.50 364 1994............... 1,121 3.35 3,777 209 1.35 283 1995............... 1,174 3.20 3,735 226 1.40 315 1996............... 1,250 3.05 3,823 260 1.35 357 1997............... 1,285 3.30 4,236 305 1.65 5031998............... 1,150 3.65 4,180 260 1.60 422 1999............... 1,250 3.35 4,180 270 1.55 418 2000............... 1,198 3.25 3,878 202 1.00 202 2001............... 1,315 3.35 4,415 285 1.30 365 2002............... 1,120 2.50 2,816 210 .75 161 2003............... 1,185 2.80 3,290 315 1.00 320 2004............... 1,175 2.85 3,325 345 1.00 341 2005............... 1,210 3.10 3,750 340 1.00 335 2006............... 1,190 3.30 3,939 340 1.30 450
Alfalfa Hay
1,000 Acres Tons 1,000 Tons 1,000 Acres Tons 1,000 Tons 1990............... 650 3.80 2,485 90 1.15 105 1991............... 635 4.10 2,601 85 1.60 135 1992............... 694 4.05 2,817 86 1.70 147 1993............... 765 4.05 3,094 85 1.60 136 1994............... 756 4.15 3,153 84 1.45 123 1995............... 774 3.80 2,940 76 1.60 120 1996............... 790 3.70 2,923 70 1.25 87 1997............... 755 4.15 3,140 85 1.60 136 1998............... 730 4.50 3,280 80 1.55 122 1999............... 800 4.10 3,280 100 1.40 1402000............... 820 3.95 3,258 80 .90 722001............... 850 4.10 3,505 100 1.05 1052002............... 720 3.10 2,227 60 .60 352003............... 715 3.45 2,470 85 1.05 902004............... 670 3.65 2,430 100 1.10 1112005............... 700 4.10 2,860 100 1.00 100 2006............... 680 4.20 2,839 100 1.25 125
Other Hay 1/
1,000 Acres Tons 1,000 Tons 1,000 Acres Tons 1,000 Tons 1990............... 550 1.60 880 260 1.30 335 1991............... 535 1.80 956 245 1.50 370 1992............... 495 1.85 920 205 1.50 305 1993............... 395 1.85 735 155 1.45 228 1994............... 365 1.70 624 125 1.30 160 1995............... 400 2.00 795 150 1.30 195 1996............... 460 1.95 900 190 1.40 270 1997............... 530 2.05 1,096 220 1.65 367 1998............... 420 2.15 900 180 1.65 3001999............... 450 2.00 900 170 1.65 2782000............... 378 1.65 620 122 1.05 130 2001............... 465 1.95 910 185 1.40 260 2002............... 400 1.45 589 150 .85 126 2003............... 470 1.75 820 230 1.00 230 2004............... 505 1.75 895 245 .95 230 2005............... 510 1.75 890 240 1.00 235 2006............... 510 2.15 1,100 240 1.35 325 1/ Includes wild, millet, sudan, clover & timothy, grain and other miscellaneous tame hays.
Colorado Agricultural Statistics 2007 16
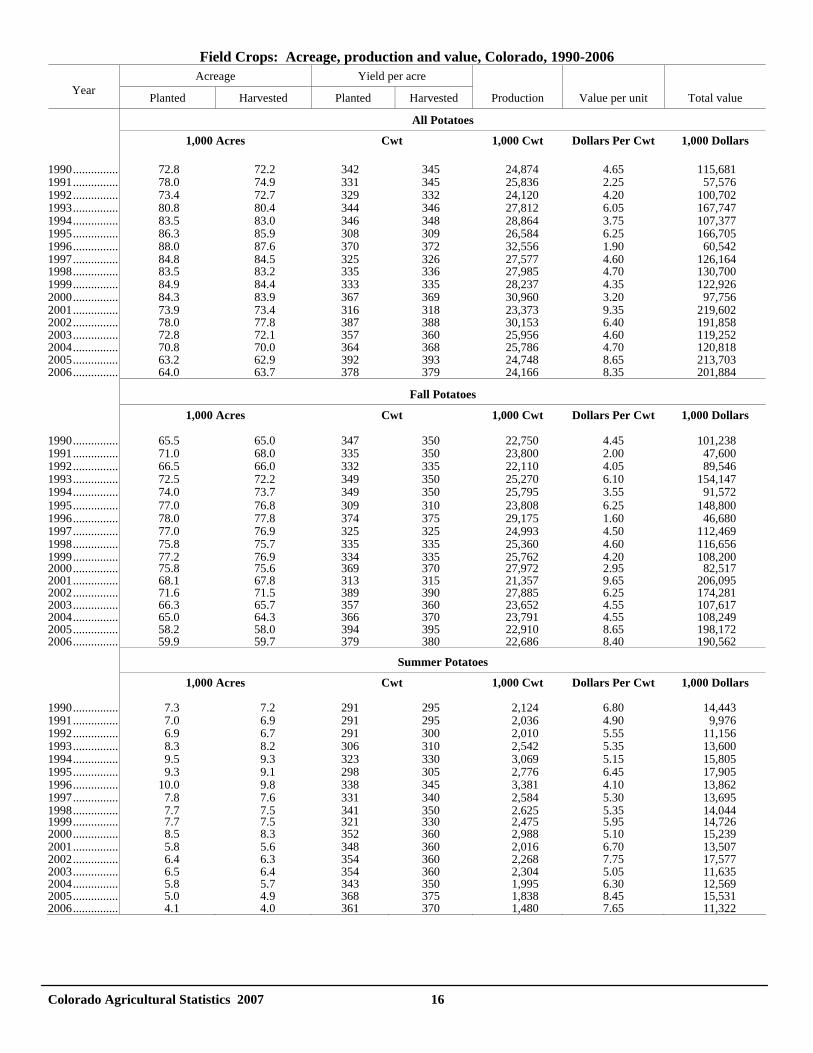
Field Crops: Acreage, production and value, Colorado, 1990-2006 Acreage Yield per acre
Year Planted Harvested Planted Harvested Production Value per unit Total value
All Potatoes
1,000 Acres Cwt 1,000 Cwt Dollars Per Cwt 1,000 Dollars 1990............... 72.8 72.2 342 345 24,874 4.65 115,681 1991............... 78.0 74.9 331 345 25,836 2.25 57,576 1992............... 73.4 72.7 329 332 24,120 4.20 100,702 1993............... 80.8 80.4 344 346 27,812 6.05 167,747 1994............... 83.5 83.0 346 348 28,864 3.75 107,377 1995............... 86.3 85.9 308 309 26,584 6.25 166,705 1996............... 88.0 87.6 370 372 32,556 1.90 60,542 1997............... 84.8 84.5 325 326 27,577 4.60 126,1641998............... 83.5 83.2 335 336 27,985 4.70 130,700 1999............... 84.9 84.4 333 335 28,237 4.35 122,926 2000............... 84.3 83.9 367 369 30,960 3.20 97,756 2001............... 73.9 73.4 316 318 23,373 9.35 219,602 2002............... 78.0 77.8 387 388 30,153 6.40 191,858 2003............... 72.8 72.1 357 360 25,956 4.60 119,252 2004............... 70.8 70.0 364 368 25,786 4.70 120,818 2005............... 63.2 62.9 392 393 24,748 8.65 213,703 2006............... 64.0 63.7 378 379 24,166 8.35 201,884
Fall Potatoes
1,000 Acres Cwt 1,000 Cwt Dollars Per Cwt 1,000 Dollars 1990............... 65.5 65.0 347 350 22,750 4.45 101,238 1991............... 71.0 68.0 335 350 23,800 2.00 47,600 1992............... 66.5 66.0 332 335 22,110 4.05 89,546 1993............... 72.5 72.2 349 350 25,270 6.10 154,147 1994............... 74.0 73.7 349 350 25,795 3.55 91,572 1995............... 77.0 76.8 309 310 23,808 6.25 148,800 1996............... 78.0 77.8 374 375 29,175 1.60 46,680 1997............... 77.0 76.9 325 325 24,993 4.50 112,469 1998............... 75.8 75.7 335 335 25,360 4.60 116,656 1999............... 77.2 76.9 334 335 25,762 4.20 108,2002000............... 75.8 75.6 369 370 27,972 2.95 82,5172001............... 68.1 67.8 313 315 21,357 9.65 206,0952002............... 71.6 71.5 389 390 27,885 6.25 174,2812003............... 66.3 65.7 357 360 23,652 4.55 107,6172004............... 65.0 64.3 366 370 23,791 4.55 108,2492005............... 58.2 58.0 394 395 22,910 8.65 198,1722006............... 59.9 59.7 379 380 22,686 8.40 190,562
Summer Potatoes
1,000 Acres Cwt 1,000 Cwt Dollars Per Cwt 1,000 Dollars 1990............... 7.3 7.2 291 295 2,124 6.80 14,443 1991............... 7.0 6.9 291 295 2,036 4.90 9,976 1992............... 6.9 6.7 291 300 2,010 5.55 11,156 1993............... 8.3 8.2 306 310 2,542 5.35 13,600 1994............... 9.5 9.3 323 330 3,069 5.15 15,805 1995............... 9.3 9.1 298 305 2,776 6.45 17,905 1996............... 10.0 9.8 338 345 3,381 4.10 13,862 1997............... 7.8 7.6 331 340 2,584 5.30 13,695 1998............... 7.7 7.5 341 350 2,625 5.35 14,0441999............... 7.7 7.5 321 330 2,475 5.95 14,7262000............... 8.5 8.3 352 360 2,988 5.10 15,239 2001............... 5.8 5.6 348 360 2,016 6.70 13,507 2002............... 6.4 6.3 354 360 2,268 7.75 17,577 2003............... 6.5 6.4 354 360 2,304 5.05 11,6352004............... 5.8 5.7 343 350 1,995 6.30 12,5692005............... 5.0 4.9 368 375 1,838 8.45 15,5312006............... 4.1 4.0 361 370 1,480 7.65 11,322
Colorado Agricultural Statistics 2007 17
Field Crops: Acreage, production and value, Colorado, 1981-2006 Acreage Yield per acre
Year Planted Harvested Planted Harvested Production Value per unit Total value
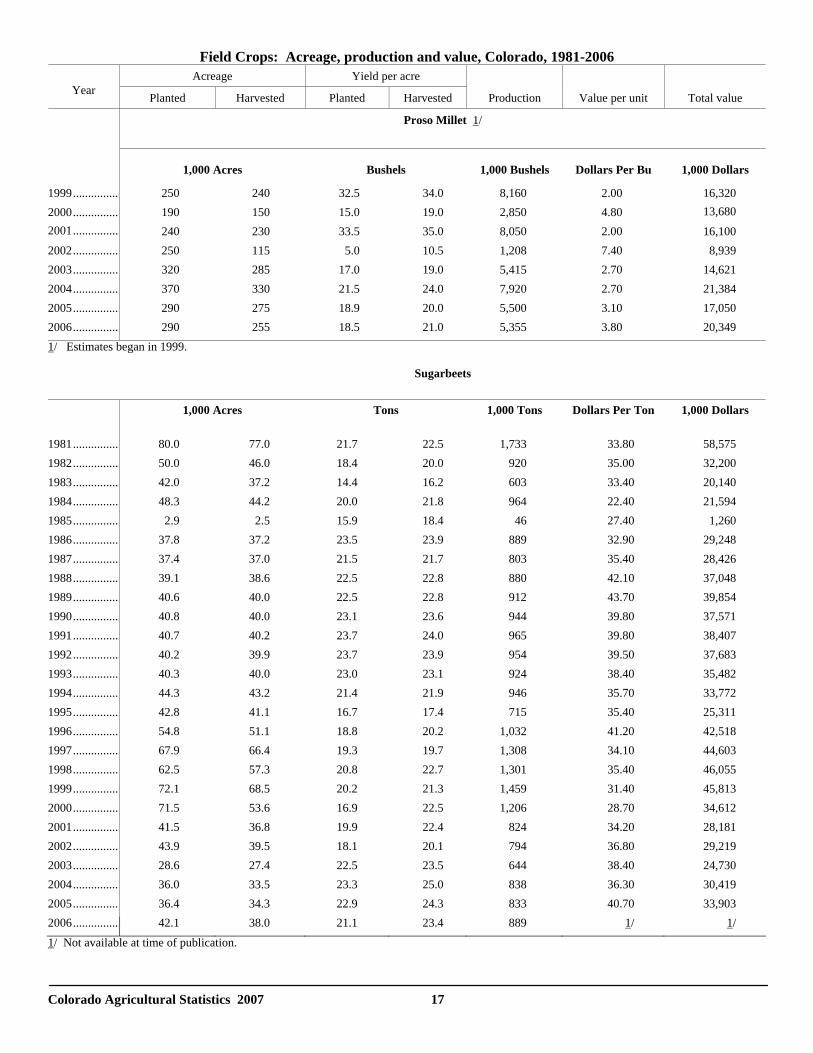
Proso Millet 1/
1,000 Acres Bushels 1,000 Bushels Dollars Per Bu 1,000 Dollars
1999............... 250 240 32.5 34.0 8,160 2.00 16,320 2000............... 190 150 15.0 19.0 2,850 4.80 13,680 2001............... 240 230 33.5 35.0 8,050 2.00 16,100 2002............... 250 115 5.0 10.5 1,208 7.40 8,939 2003............... 320 285 17.0 19.0 5,415 2.70 14,621 2004............... 370 330 21.5 24.0 7,920 2.70 21,384 2005............... 290 275 18.9 20.0 5,500 3.10 17,050 2006............... 290 255 18.5 21.0 5,355 3.80 20,349 1/ Estimates began in 1999.
Sugarbeets
1,000 Acres Tons 1,000 Tons Dollars Per Ton 1,000 Dollars
1981............... 80.0 77.0 21.7 22.5 1,733 33.80 58,575 1982............... 50.0 46.0 18.4 20.0 920 35.00 32,200 1983............... 42.0 37.2 14.4 16.2 603 33.40 20,140 1984............... 48.3 44.2 20.0 21.8 964 22.40 21,594 1985............... 2.9 2.5 15.9 18.4 46 27.40 1,260 1986............... 37.8 37.2 23.5 23.9 889 32.90 29,248 1987............... 37.4 37.0 21.5 21.7 803 35.40 28,426 1988............... 39.1 38.6 22.5 22.8 880 42.10 37,048 1989............... 40.6 40.0 22.5 22.8 912 43.70 39,854 1990............... 40.8 40.0 23.1 23.6 944 39.80 37,571 1991............... 40.7 40.2 23.7 24.0 965 39.80 38,407 1992............... 40.2 39.9 23.7 23.9 954 39.50 37,683 1993............... 40.3 40.0 23.0 23.1 924 38.40 35,482 1994............... 44.3 43.2 21.4 21.9 946 35.70 33,772 1995............... 42.8 41.1 16.7 17.4 715 35.40 25,311 1996............... 54.8 51.1 18.8 20.2 1,032 41.20 42,518 1997............... 67.9 66.4 19.3 19.7 1,308 34.10 44,603 1998............... 62.5 57.3 20.8 22.7 1,301 35.40 46,055 1999............... 72.1 68.5 20.2 21.3 1,459 31.40 45,813 2000............... 71.5 53.6 16.9 22.5 1,206 28.70 34,612 2001............... 41.5 36.8 19.9 22.4 824 34.20 28,181 2002............... 43.9 39.5 18.1 20.1 794 36.80 29,219 2003............... 28.6 27.4 22.5 23.5 644 38.40 24,730 2004............... 36.0 33.5 23.3 25.0 838 36.30 30,419 2005............... 36.4 34.3 22.9 24.3 833 40.70 33,903 2006............... 42.1 38.0 21.1 23.4 889 1/ 1/
1/ Not available at time of publication.
Colorado Agricultural Statistics 2007 18
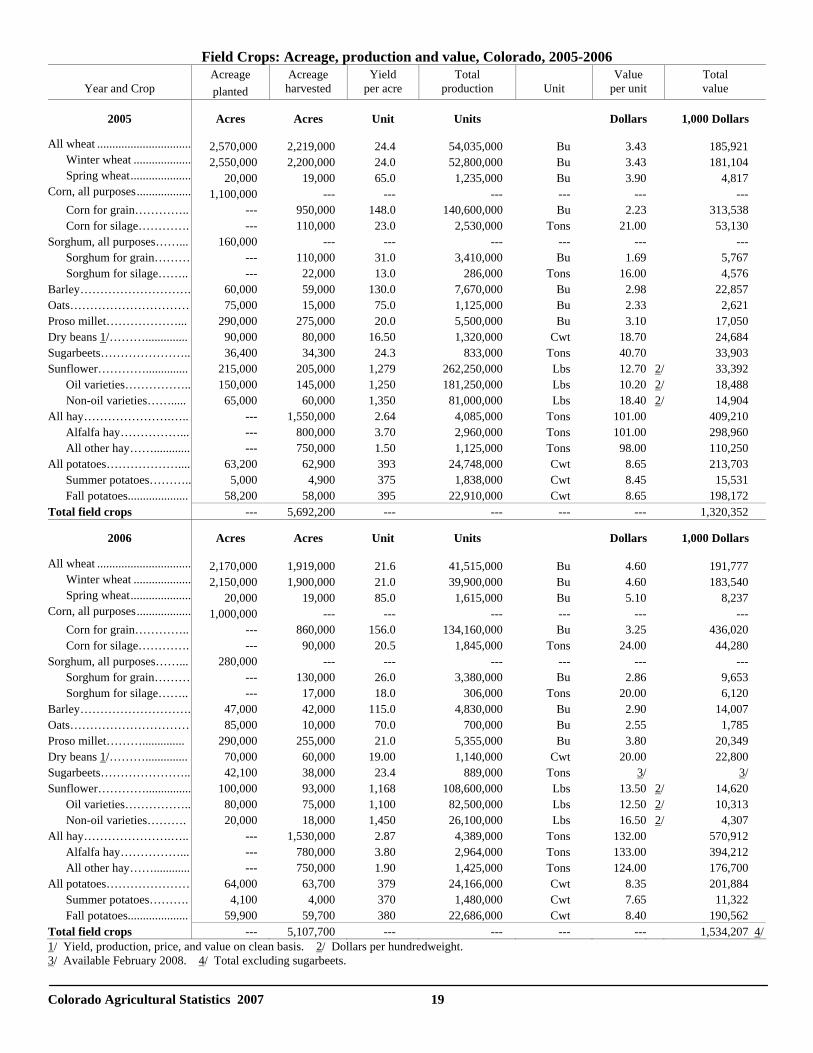
FIELD CROP REVIEW 2006 The estimated value of production for Colorado’s principal field crops (excluding sugarbeets) totaled just over $1.53 billion in 2006, up 15 percent from the comparable value of $1.32 billion in 2005. The value of production from the State’s four leading crops (all hay, corn for grain, all potatoes and all wheat) totaled $1.40 billion for the 2006 crops and accounted for 91 percent of the total value from all field crops (excluding sugarbeets). Growing conditions deteriorated somewhat in 2006 and resulted in lower production than the previous year for many crops. Water shortages and well restrictions continued in 2006. Price increases more than offset the lower production for most crops. Hay continued as Colorado’s leading crop in value of production. The value of all hay production increased 40 percent from the previous year to $570.9 million and accounted for 37 percent of the total value from all field crops produced. Value of the 2006 alfalfa hay crop, at $394.2 million, was up 32 percent from the previous year with a decrease in acreage harvested, but yield and the average price received increased. The value of production for all other hay also increased, up 60 percent to $176.7 million, due to an increase in both the price received and yield per acre. Production was up 27 percent from the previous year. Corn was the second leading crop produced in the State in terms of total value of production. The combined value of corn for grain and corn for silage was estimated at $480.3 million for the 2006 crop, up nearly 31 percent from the comparable value of $366.7 million for the 2005 crop. Corn for grain production decreased from a year earlier as a 5 percent increase in yield was not enough to offset a 9 percent drop in harvested acreage. Yields averaged 156 bushels per acre, up 8 bushels from last year. The 2006 corn for grain crop was valued at $436.0 million. A 17 percent decrease in the value of production for corn silage in 2006 was the result of a 20,000 acre decrease in acreage harvested and a 2.5 ton reduction in yield per acre. The average price received was up $3.00 per ton to $24. Value of the 2006 crop was estimated at $44.3 million, down from $53.1 million in 2005. Production decreased to 1.85 million tons with a 20.5 ton per acre yield. Acres harvested totaled 90,000. Potatoes ranked third in terms of value of production with the 2006 crop value estimated at $201.9 million, down 6 percent from $213.7 million received for the 2005 crop. The crop was smaller than last year’s in terms of total production. The summer potato crop was 19 percent smaller than the 2005 crop and the fall potato crop fell 1 percent. Harvested acreage was 800 acres more last year at 63,700. Average yield decreased 14 hundredweight per acre from last year’s crop. Wheat received a fourth place ranking in value of production for 2006 with a total value of nearly $191.8 million, up 3 percent from the $185.9 million value assigned to the 2005 crop. The value of the winter wheat crop, at $183.5 million, was up 1 percent while the value of the spring wheat crop increased 71 percent to $8.2 million. The 2006 winter wheat crop of 39.9 million bushels was down 24 percent from the 2005 crop, the result of 14 percent fewer acres harvested and a
3.0 bushel reduction in yield. Hot and dry conditions at critical periods of development lowered average yields to 21.0 bushels per acre from 24.0 last year and the lowest average since 1968. Spring wheat production rose 31 percent from last year to 1.6 million bushels due entirely to a 20.0 bushel increase in average yield. Yield was set at 85.0 bushels per acre, the second highest on record in Colorado. Harvested acreage remained at 19,000 acres. Sugarbeet production totaled 889,000 tons in 2006, up 7 percent from the 2005 crop of 833,000 tons. The 38,000 acres harvested represented an increase of 11 percent from the previous year. The 2005 crop was valued at $33.9 million but no value has yet been determined for the 2006 crop. The dry edible bean crop produced in 2006 was valued at $22.8 million, down 8 percent from a revised 2005 crop. Harvested acreage was down 20,000 acres from 2005 to 60,000. Total production of 1.1 million cwt was down 14 percent from the 2005 crop. However, prices received for the latest crop are expected to average $20.00 per cwt, up $1.30 per cwt in 2005. Proso millet production in 2006 had an estimated value of $20.3 million, up 19 percent from the value of the 2005 crop. Producers harvested 255,000 acres of proso millet in 2006 compared to 275,000 acres in 2005. Total production, at 5.4 million bushels, was 3 percent less than the 2005 crop. Average yield, at 21.0 bushels per acre, was 1.0 bushel above last year. Prices for the 2006 crop averaged $3.80 per bushel, up from $3.10 received for the 2005 crop. The combined production of grain and silage sorghum had an estimated value of $15.8 million for the 2006 crop compared with $10.3 million the previous year. Sorghum for grain in 2006 totaled 3.4 million bushels, virtually unchanged from a year earlier as producers harvested 18 percent more acres but realized a 5.0 bushel reduction in the average yield. Total value of production of grain sorghum totaled $9.7 million compared with $5.8 million the previous year as the average price received increased $1.17 per bushel to $2.86. The 2006 crop of sunflowers was valued at $14.6 million, down 56 percent from the 2005 crop value of $33.4 million. A 55 percent decrease in acres harvested and lower yields resulted in a 59 percent decrease in production. Production of oil varieties, at 82.5 million pounds, was down 54 percent from that of a year earlier. Non-oil production also decreased 68 percent to 26.1 million pounds. The oil crop’s value is estimated at $10.3 million while the non-oil crop is estimated at $4.3 million. The 2006 barley crop has an estimated value of $14.0 million, down 39 percent from the 2005 crop value of $22.9 million. Producers harvested 29 percent fewer acres than a year earlier, and averaged a 115.0 bushel per acre yield, 15.0 bushels below the previous year. Producers received lower prices for the latest crop averaging $2.90 per bushel compared with $2.98 last year. Much of the malt barley grown in the San Luis Valley did not meet quality standards and was sold for feed.
Colorado Agricultural Statistics 2007 19
Field Crops: Acreage, production and value, Colorado, 2005-2006
Year and Crop Acreage planted
Acreage harvested
Yield per acre
Total production
Unit
Value per unit
Total value
2005 Acres Acres Unit Units Dollars 1,000 Dollars
All wheat ............................... 2,570,000 2,219,000 24.4 54,035,000 Bu 3.43 185,921 Winter wheat ................... 2,550,000 2,200,000 24.0 52,800,000 Bu 3.43 181,104 Spring wheat.................... 20,000 19,000 65.0 1,235,000 Bu 3.90 4,817Corn, all purposes.................. 1,100,000 --- --- --- --- --- --- Corn for grain………….. --- 950,000 148.0 140,600,000 Bu 2.23 313,538 Corn for silage…………. --- 110,000 23.0 2,530,000 Tons 21.00 53,130Sorghum, all purposes……... 160,000 --- --- --- --- --- --- Sorghum for grain……… --- 110,000 31.0 3,410,000 Bu 1.69 5,767 Sorghum for silage…….. --- 22,000 13.0 286,000 Tons 16.00 4,576Barley………………………. 60,000 59,000 130.0 7,670,000 Bu 2.98 22,857Oats………………………… 75,000 15,000 75.0 1,125,000 Bu 2.33 2,621 Proso millet………………... 290,000 275,000 20.0 5,500,000 Bu 3.10 17,050 Dry beans 1/……….............. 90,000 80,000 16.50 1,320,000 Cwt 18.70 24,684 Sugarbeets………………….. 36,400 34,300 24.3 833,000 Tons 40.70 33,903 Sunflower………….............. 215,000 205,000 1,279 262,250,000 Lbs 12.70 2/ 33,392 Oil varieties…………….. 150,000 145,000 1,250 181,250,000 Lbs 10.20 2/ 18,488 Non-oil varieties……..... 65,000 60,000 1,350 81,000,000 Lbs 18.40 2/ 14,904 All hay………………….….. --- 1,550,000 2.64 4,085,000 Tons 101.00 409,210 Alfalfa hay……………... --- 800,000 3.70 2,960,000 Tons 101.00 298,960 All other hay……............ --- 750,000 1.50 1,125,000 Tons 98.00 110,250 All potatoes……………….... 63,200 62,900 393 24,748,000 Cwt 8.65 213,703 Summer potatoes……….. 5,000 4,900 375 1,838,000 Cwt 8.45 15,531 Fall potatoes.................... 58,200 58,000 395 22,910,000 Cwt 8.65 198,172 Total field crops --- 5,692,200 --- --- --- --- 1,320,352
2006 Acres Acres Unit Units Dollars 1,000 Dollars
All wheat ............................... 2,170,000 1,919,000 21.6 41,515,000 Bu 4.60 191,777 Winter wheat ................... 2,150,000 1,900,000 21.0 39,900,000 Bu 4.60 183,540 Spring wheat.................... 20,000 19,000 85.0 1,615,000 Bu 5.10 8,237Corn, all purposes.................. 1,000,000 --- --- --- --- --- --- Corn for grain………….. --- 860,000 156.0 134,160,000 Bu 3.25 436,020 Corn for silage…………. --- 90,000 20.5 1,845,000 Tons 24.00 44,280Sorghum, all purposes……... 280,000 --- --- --- --- --- --- Sorghum for grain……… --- 130,000 26.0 3,380,000 Bu 2.86 9,653 Sorghum for silage…….. --- 17,000 18.0 306,000 Tons 20.00 6,120Barley………………………. 47,000 42,000 115.0 4,830,000 Bu 2.90 14,007Oats………………………… 85,000 10,000 70.0 700,000 Bu 2.55 1,785 Proso millet……….............. 290,000 255,000 21.0 5,355,000 Bu 3.80 20,349 Dry beans 1/……….............. 70,000 60,000 19.00 1,140,000 Cwt 20.00 22,800 Sugarbeets………………….. 42,100 38,000 23.4 889,000 Tons 3/ 3/ Sunflower…………............... 100,000 93,000 1,168 108,600,000 Lbs 13.50 2/ 14,620 Oil varieties…………….. 80,000 75,000 1,100 82,500,000 Lbs 12.50 2/ 10,313 Non-oil varieties………. 20,000 18,000 1,450 26,100,000 Lbs 16.50 2/ 4,307 All hay………………….….. --- 1,530,000 2.87 4,389,000 Tons 132.00 570,912 Alfalfa hay……………... --- 780,000 3.80 2,964,000 Tons 133.00 394,212 All other hay……............ --- 750,000 1.90 1,425,000 Tons 124.00 176,700 All potatoes………………… 64,000 63,700 379 24,166,000 Cwt 8.35 201,884 Summer potatoes………. 4,100 4,000 370 1,480,000 Cwt 7.65 11,322 Fall potatoes.................... 59,900 59,700 380 22,686,000 Cwt 8.40 190,562 Total field crops --- 5,107,700 --- --- --- --- 1,534,207 4/1/ Yield, production, price, and value on clean basis. 2/ Dollars per hundredweight. 3/ Available February 2008. 4/ Total excluding sugarbeets.
COUNTY ESTIMATES
Colorado Agricultural Statistics 2007 20
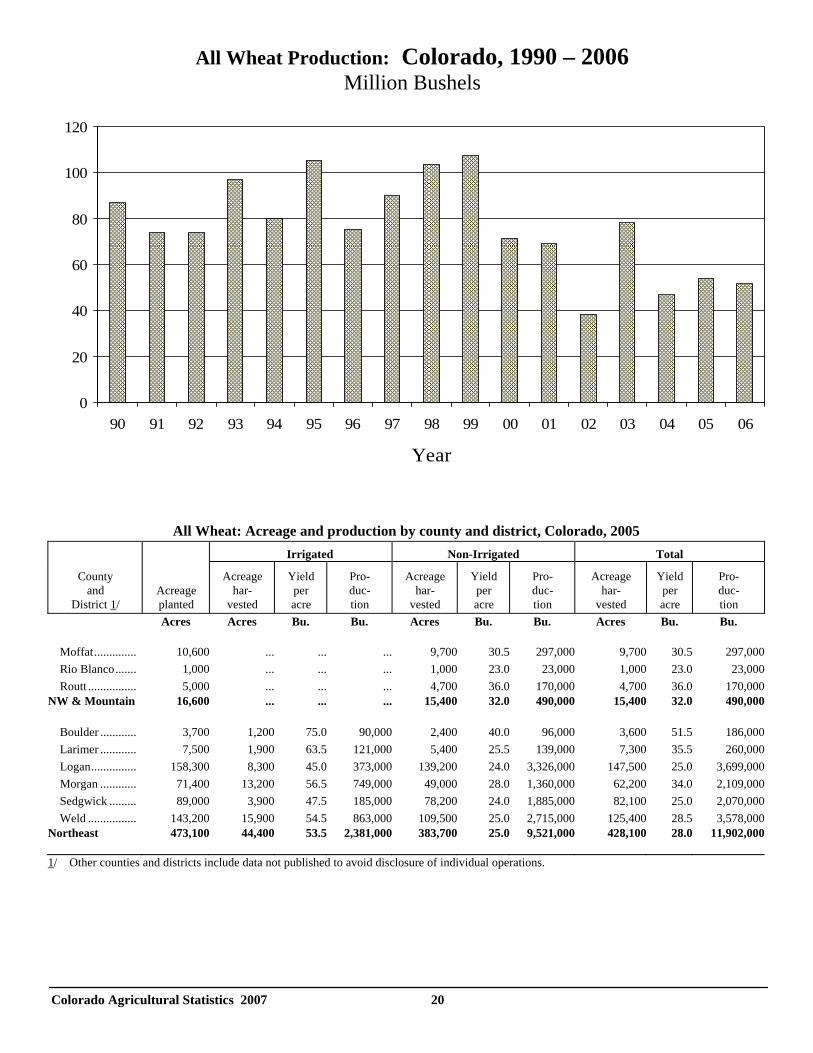
All Wheat: Acreage and production by county and district, Colorado, 2005
Irrigated
Non-Irrigated
Total
County and District 1/
Acreage planted
Acreage har- vested
Yield per acre
Pro- duc- tion
Acreage har- vested
Yield per acre
Pro- duc- tion
Acreage har- vested
Yield per acre
Pro- duc- tion
Acres
Acres
Bu.
Bu.
Acres
Bu.
Bu.
Acres
Bu. Bu.
Moffat..............
10,600
...
...
...
9,700
30.5
297,000
9,700
30.5
297,000
Rio Blanco.......
1,000
...
...
...
1,000
23.0
23,000
1,000
23.0
23,000 Routt ................
5,000
...
...
...
4,700
36.0
170,000
4,700
36.0
170,000
NW & Mountain
16,600
...
...
...
15,400
32.0
490,000
15,400
32.0
490,000
Boulder ............
3,700
1,200
75.0
90,000
2,400
40.0
96,000
3,600
51.5
186,000
Larimer ............
7,500
1,900
63.5
121,000
5,400
25.5
139,000
7,300
35.5
260,000 Logan...............
158,300
8,300
45.0
373,000
139,200
24.0
3,326,000
147,500
25.0
3,699,000
Morgan ............
71,400
13,200
56.5
749,000
49,000
28.0
1,360,000
62,200
34.0
2,109,000 Sedgwick .........
89,000
3,900
47.5
185,000
78,200
24.0
1,885,000
82,100
25.0
2,070,000
Weld ................
143,200
15,900
54.5
863,000
109,500
25.0
2,715,000
125,400
28.5
3,578,000 Northeast
473,100
44,400
53.5
2,381,000
383,700
25.0
9,521,000
428,100
28.0
11,902,000
1/ Other counties and districts include data not published to avoid disclosure of individual operations.
All Wheat Production: Colorado, 1990 – 2006 Million Bushels
0
20
40
60
80
100
120
90 91 92 93 94 95 96 97 98 99 00 01 02 03 04 05 06
Year
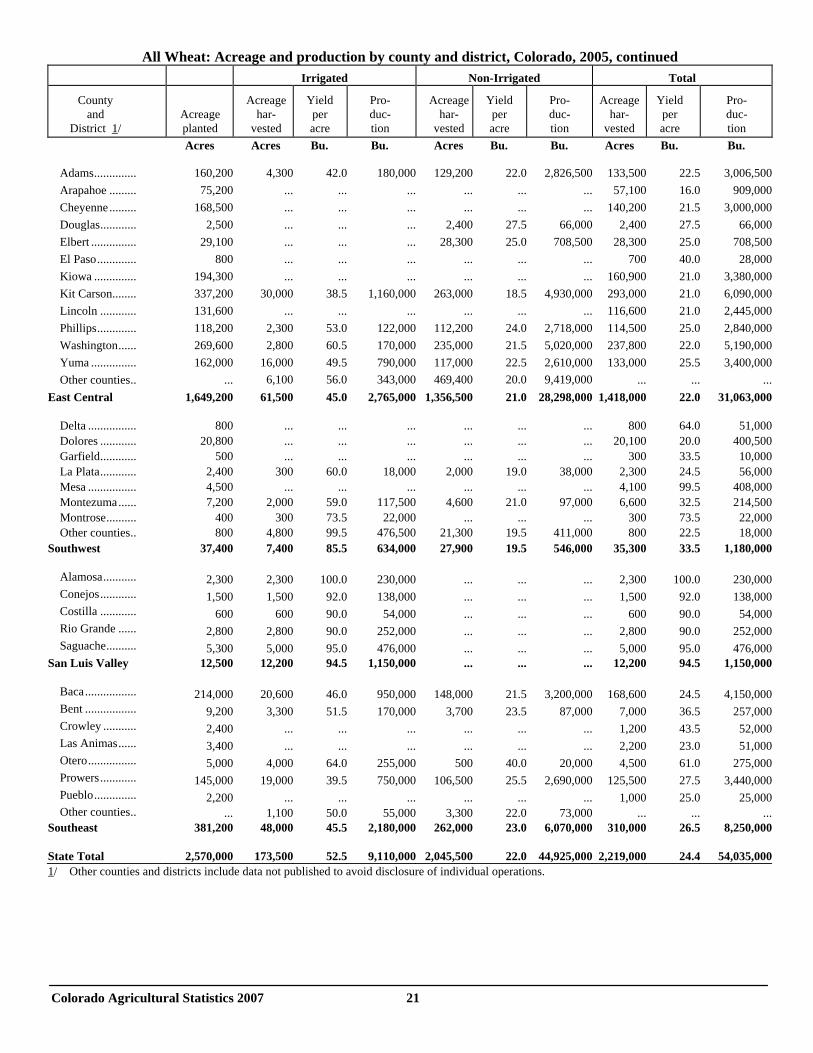
Colorado Agricultural Statistics 2007 21
All Wheat: Acreage and production by county and district, Colorado, 2005, continued
Irrigated
Non-Irrigated
Total
County and District 1/
Acreage planted
Acreage har- vested
Yield per acre
Pro- duc- tion
Acreage har- vested
Yield per acre
Pro- duc- tion
Acreage
har- vested
Yield per acre
Pro- duc- tion
Acres
Acres
Bu.
Bu.
Acres
Bu.
Bu.
Acres
Bu. Bu.
Adams..............
160,200
4,300
42.0
180,000
129,200
22.0
2,826,500
133,500
22.5
3,006,500
Arapahoe .........
75,200
...
...
...
...
...
...
57,100
16.0
909,000 Cheyenne.........
168,500
...
...
...
...
...
...
140,200
21.5
3,000,000
Douglas............
2,500
...
...
...
2,400
27.5
66,000
2,400
27.5
66,000 Elbert ...............
29,100
...
...
...
28,300
25.0
708,500
28,300
25.0
708,500
El Paso.............
800
...
...
...
...
...
...
700
40.0
28,000 Kiowa ..............
194,300
...
...
...
...
...
...
160,900
21.0
3,380,000
Kit Carson........
337,200
30,000
38.5
1,160,000
263,000
18.5
4,930,000
293,000
21.0
6,090,000 Lincoln ............
131,600
...
...
...
...
...
...
116,600
21.0
2,445,000
Phillips.............
118,200
2,300
53.0
122,000
112,200
24.0
2,718,000
114,500
25.0
2,840,000 Washington......
269,600
2,800
60.5
170,000
235,000
21.5
5,020,000
237,800
22.0
5,190,000
Yuma ...............
162,000
16,000
49.5
790,000
117,000
22.5
2,610,000
133,000
25.5
3,400,000 Other counties..
... 6,100 56.0 343,000 469,400 20.0 9,419,000
...
...
...
East Central
1,649,200
61,500
45.0
2,765,000
1,356,500
21.0
28,298,000
1,418,000
22.0
31,063,000
Delta ................
800
...
...
...
...
...
...
800
64.0
51,000
Dolores ............
20,800
...
...
...
...
...
...
20,100
20.0
400,500 Garfield............
500
...
...
...
...
...
...
300
33.5
10,000
La Plata............
2,400
300
60.0
18,000
2,000
19.0
38,000
2,300
24.5
56,000 Mesa ................
4,500
...
...
...
...
...
...
4,100
99.5
408,000
Montezuma......
7,200
2,000
59.0
117,500
4,600
21.0
97,000
6,600
32.5
214,500 Montrose..........
400
300
73.5
22,000
...
...
...
300
73.5
22,000
Other counties.. 800 4,800 99.5 476,500 21,300 19.5 411,000 800 22.5 18,000 Southwest
37,400
7,400
85.5
634,000
27,900
19.5
546,000
35,300
33.5
1,180,000
Alamosa...........
2,300
2,300
100.0
230,000
...
...
...
2,300
100.0
230,000
Conejos............
1,500
1,500
92.0
138,000
...
...
...
1,500
92.0
138,000 Costilla ............
600
600
90.0
54,000
...
...
...
600
90.0
54,000
Rio Grande ......
2,800
2,800
90.0
252,000
...
...
...
2,800
90.0
252,000 Saguache..........
5,300
5,000
95.0
476,000
...
...
...
5,000
95.0
476,000
San Luis Valley
12,500
12,200
94.5
1,150,000
...
...
...
12,200
94.5
1,150,000
Baca.................
214,000
20,600
46.0
950,000
148,000
21.5
3,200,000
168,600
24.5
4,150,000
Bent .................
9,200
3,300
51.5
170,000
3,700
23.5
87,000
7,000
36.5
257,000 Crowley ...........
2,400
...
...
...
...
...
...
1,200
43.5
52,000
Las Animas......
3,400
...
...
...
...
...
...
2,200
23.0
51,000 Otero................
5,000
4,000
64.0
255,000
500
40.0
20,000
4,500
61.0
275,000
Prowers............
145,000
19,000
39.5
750,000
106,500
25.5
2,690,000
125,500
27.5
3,440,000 Pueblo..............
2,200
...
...
...
...
...
...
1,000
25.0
25,000
Other counties.. ... 1,100 50.0 55,000 3,300 22.0 73,000
...
...
... Southeast
381,200
48,000
45.5
2,180,000
262,000
23.0
6,070,000
310,000
26.5
8,250,000
State Total
2,570,000
173,500
52.5
9,110,000
2,045,500
22.0
44,925,000
2,219,000
24.4
54,035,000
1/ Other counties and districts include data not published to avoid disclosure of individual operations.
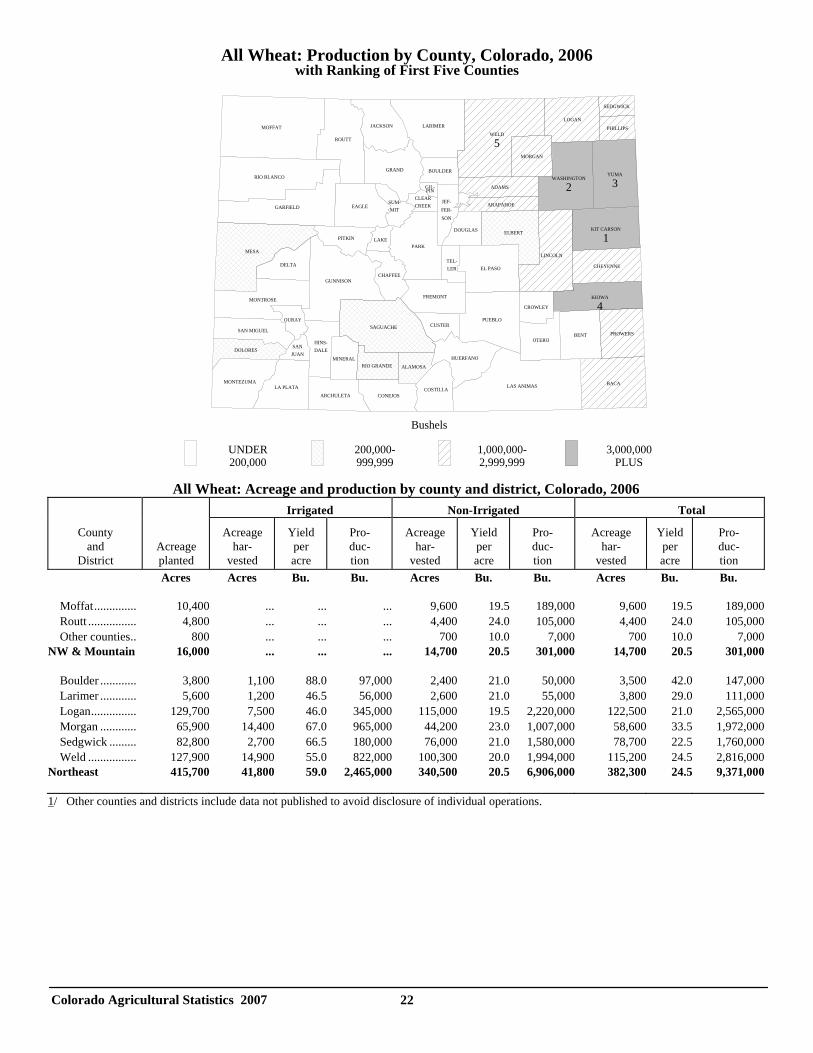
Colorado Agricultural Statistics 2007 22
All Wheat: Production by County, Colorado, 2006 with Ranking of First Five Counties
All Wheat: Acreage and production by county and district, Colorado, 2006
Irrigated
Non-Irrigated
Total
County and District
Acreage planted
Acreage har- vested
Yield per acre
Pro- duc- tion
Acreage har- vested
Yield per acre
Pro- duc- tion
Acreage har- vested
Yield per acre
Pro- duc- tion
Acres
Acres
Bu.
Bu.
Acres
Bu.
Bu.
Acres
Bu. Bu.
Moffat..............
10,400
...
...
...
9,600
19.5
189,000
9,600
19.5
189,000
Routt ................
4,800
...
...
...
4,400
24.0
105,000
4,400
24.0
105,000 Other counties..
800
...
...
...
700
10.0
7,000
700
10.0
7,000
NW & Mountain
16,000
...
...
...
14,700
20.5
301,000
14,700
20.5
301,000
Boulder ............
3,800
1,100
88.0
97,000
2,400
21.0
50,000
3,500
42.0
147,000
Larimer ............
5,600
1,200
46.5
56,000
2,600
21.0
55,000
3,800
29.0
111,000 Logan...............
129,700
7,500
46.0
345,000
115,000
19.5
2,220,000
122,500
21.0
2,565,000
Morgan ............
65,900
14,400
67.0
965,000
44,200
23.0
1,007,000
58,600
33.5
1,972,000 Sedgwick .........
82,800
2,700
66.5
180,000
76,000
21.0
1,580,000
78,700
22.5
1,760,000
Weld ................
127,900
14,900
55.0
822,000
100,300
20.0
1,994,000
115,200
24.5
2,816,000 Northeast
415,700
41,800
59.0
2,465,000
340,500
20.5
6,906,000
382,300
24.5
9,371,000
1/ Other counties and districts include data not published to avoid disclosure of individual operations.
Bushels
UNDER200,000
200,000-999,999
1,000,000-2,999,999
3,000,000PLUS
ADAMS
ALAMOSA
ARAPAHOE
ARCHULETA
BACA
BENT
BOULDER
CHAFFEE
CHEYENNE
CLEARCREEK
CONEJOSCOSTILLA
CROWLEY
CUSTER
DELTA
DOLORES
DOUGLAS
EAGLE
ELBERT
EL PASO
FREMONT
GARFIELD
GIL-PIN
GRAND
GUNNISON
HINS-DALE
HUERFANO
JACKSON
JEF-FER-SON
KIOWA
4
KIT CARSON
1LAKE
LA PLATA
LARIMER
LAS ANIMAS
LINCOLN
LOGAN
MESA
MINERAL
MOFFAT
MONTEZUMA
MONTROSE
MORGAN
OTERO
OURAY
PARK
PHILLIPS
PITKIN
PROWERS
PUEBLO
RIO BLANCO
RIO GRANDE
ROUTT
SAGUACHE
SANJUAN
SAN MIGUEL
SEDGWICK
SUM-MIT
TEL-LER
WASHINGTON
2
WELD
5
YUMA
3
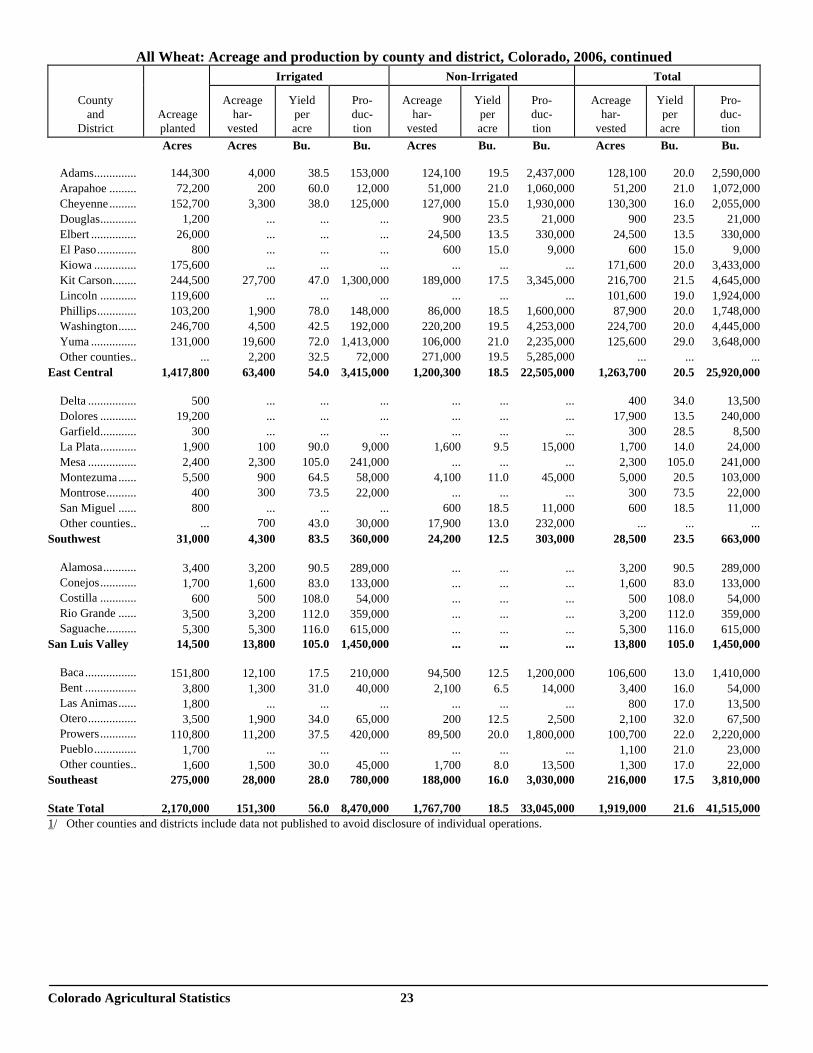
Colorado Agricultural Statistics 23
All Wheat: Acreage and production by county and district, Colorado, 2006, continued
Irrigated
Non-Irrigated
Total
County and District
Acreage planted
Acreage har- vested
Yield per acre
Pro- duc- tion
Acreage har- vested
Yield per acre
Pro- duc- tion
Acreage har- vested
Yield per acre
Pro- duc- tion
Acres
Acres
Bu.
Bu.
Acres
Bu.
Bu.
Acres
Bu. Bu.
Adams..............
144,300
4,000
38.5
153,000
124,100
19.5
2,437,000
128,100
20.0
2,590,000
Arapahoe .........
72,200
200
60.0
12,000
51,000
21.0
1,060,000
51,200
21.0
1,072,000 Cheyenne.........
152,700
3,300
38.0
125,000
127,000
15.0
1,930,000
130,300
16.0
2,055,000
Douglas............
1,200
...
...
...
900
23.5
21,000
900
23.5
21,000 Elbert ...............
26,000
...
...
...
24,500
13.5
330,000
24,500
13.5
330,000
El Paso.............
800
...
...
...
600
15.0
9,000
600
15.0
9,000 Kiowa ..............
175,600
...
...
...
...
...
...
171,600
20.0
3,433,000
Kit Carson........
244,500
27,700
47.0
1,300,000
189,000
17.5
3,345,000
216,700
21.5
4,645,000 Lincoln ............
119,600
...
...
...
...
...
...
101,600
19.0
1,924,000
Phillips.............
103,200
1,900
78.0
148,000
86,000
18.5
1,600,000
87,900
20.0
1,748,000 Washington......
246,700
4,500
42.5
192,000
220,200
19.5
4,253,000
224,700
20.0
4,445,000
Yuma ...............
131,000
19,600
72.0
1,413,000
106,000
21.0
2,235,000
125,600
29.0
3,648,000 Other counties..
...
2,200
32.5
72,000 271,000 19.5 5,285,000
...
...
...
East Central
1,417,800
63,400
54.0
3,415,000
1,200,300
18.5
22,505,000
1,263,700
20.5
25,920,000
Delta ................
500
...
...
...
...
...
...
400
34.0
13,500
Dolores ............
19,200
...
...
...
...
...
...
17,900
13.5
240,000 Garfield............
300
...
...
...
...
...
...
300
28.5
8,500
La Plata............
1,900
100
90.0
9,000
1,600
9.5
15,000
1,700
14.0
24,000 Mesa ................
2,400
2,300
105.0
241,000
...
...
...
2,300
105.0
241,000
Montezuma......
5,500
900
64.5
58,000
4,100
11.0
45,000
5,000
20.5
103,000 Montrose..........
400 300
73.5
22,000
...
...
...
300
73.5
22,000
San Miguel ......
800
...
...
...
600
18.5
11,000
600
18.5
11,000 Other counties..
... 700
43.0
30,000
17,900
13.0
232,000
...
...
...
Southwest
31,000
4,300
83.5
360,000
24,200
12.5
303,000
28,500
23.5
663,000
Alamosa...........
3,400
3,200
90.5
289,000
...
...
...
3,200
90.5
289,000
Conejos............
1,700
1,600
83.0
133,000
...
...
...
1,600
83.0
133,000 Costilla ............
600
500
108.0
54,000
...
...
...
500
108.0
54,000
Rio Grande ......
3,500
3,200
112.0
359,000
...
...
...
3,200 112.0
359,000
Saguache..........
5,300
5,300
116.0
615,000
...
...
...
5,300 116.0
615,000
San Luis Valley
14,500
13,800
105.0
1,450,000
...
...
...
13,800
105.0
1,450,000
Baca.................
151,800
12,100
17.5
210,000
94,500
12.5
1,200,000
106,600
13.0
1,410,000
Bent .................
3,800
1,300
31.0
40,000
2,100
6.5
14,000
3,400
16.0
54,000 Las Animas......
1,800
...
...
...
...
...
...
800
17.0
13,500
Otero................
3,500
1,900
34.0
65,000
200
12.5
2,500
2,100
32.0
67,500 Prowers............
110,800
11,200
37.5
420,000
89,500
20.0
1,800,000
100,700
22.0
2,220,000
Pueblo..............
1,700
...
...
...
...
...
...
1,100
21.0
23,000 Other counties..
1,600
1,500
30.0
45,000
1,700
8.0
13,500
1,300
17.0
22,000
Southeast
275,000
28,000
28.0
780,000
188,000
16.0
3,030,000
216,000
17.5
3,810,000
State Total
2,170,000
151,300
56.0
8,470,000
1,767,700
18.5
33,045,000
1,919,000
21.6
41,515,000
1/ Other counties and districts include data not published to avoid disclosure of individual operations.
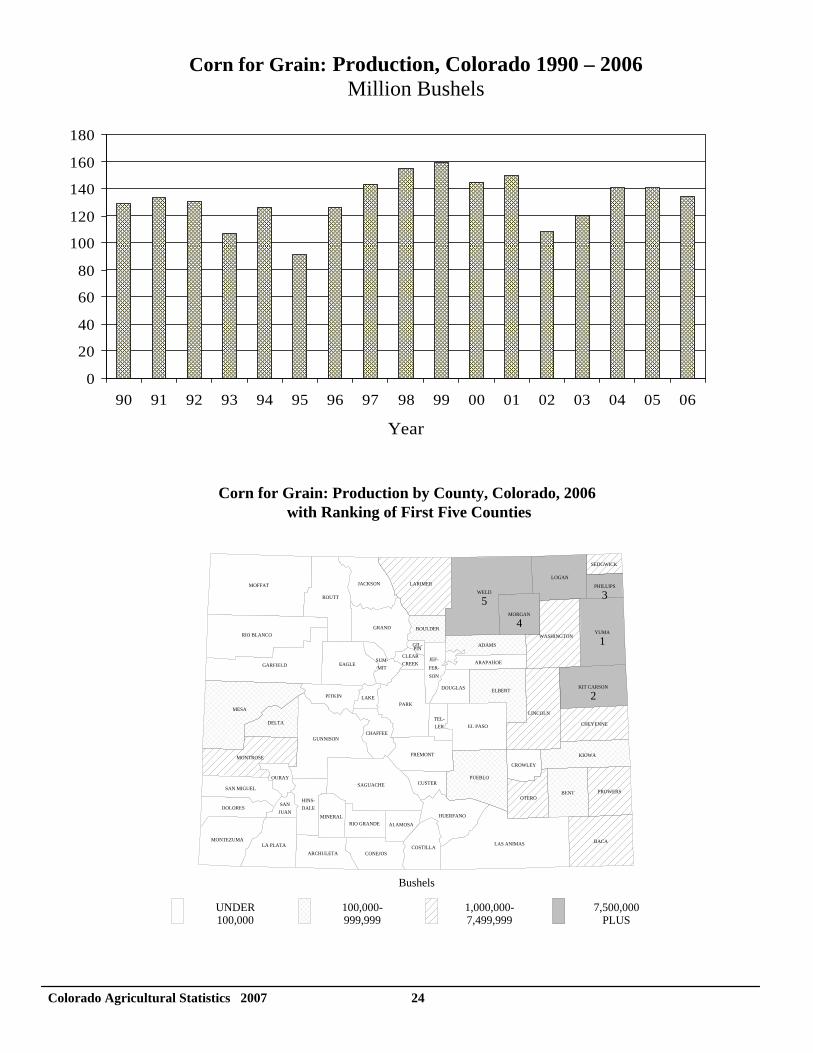
Colorado Agricultural Statistics 2007 24
Corn for Grain: Production by County, Colorado, 2006 with Ranking of First Five Counties
Corn for Grain: Production, Colorado 1990 – 2006 Million Bushels
0
20
40
60
80
100
120
140
160
180
90 91 92 93 94 95 96 97 98 99 00 01 02 03 04 05 06
Year
Bushels
UNDER100,000
100,000-999,999
1,000,000-7,499,999
7,500,000PLUS
ADAMS
ALAMOSA
ARAPAHOE
ARCHULETA
BACA
BENT
BOULDER
CHAFFEE
CHEYENNE
CLEARCREEK
CONEJOSCOSTILLA
CROWLEY
CUSTER
DELTA
DOLORES
DOUGLAS
EAGLE
ELBERT
EL PASO
FREMONT
GARFIELD
GIL-PIN
GRAND
GUNNISON
HINS-DALE
HUERFANO
JACKSON
JEF-FER-SON
KIOWA
KIT CARSON
2LAKE
LA PLATA
LARIMER
LAS ANIMAS
LINCOLN
LOGAN
MESA
MINERAL
MOFFAT
MONTEZUMA
MONTROSE
MORGAN
4
OTERO
OURAY
PARK
PHILLIPS
3
PITKIN
PROWERS
PUEBLO
RIO BLANCO
RIO GRANDE
ROUTT
SAGUACHE
SANJUAN
SAN MIGUEL
SEDGWICK
SUM-MIT
TEL-LER
WASHINGTON
WELD
5
YUMA
1
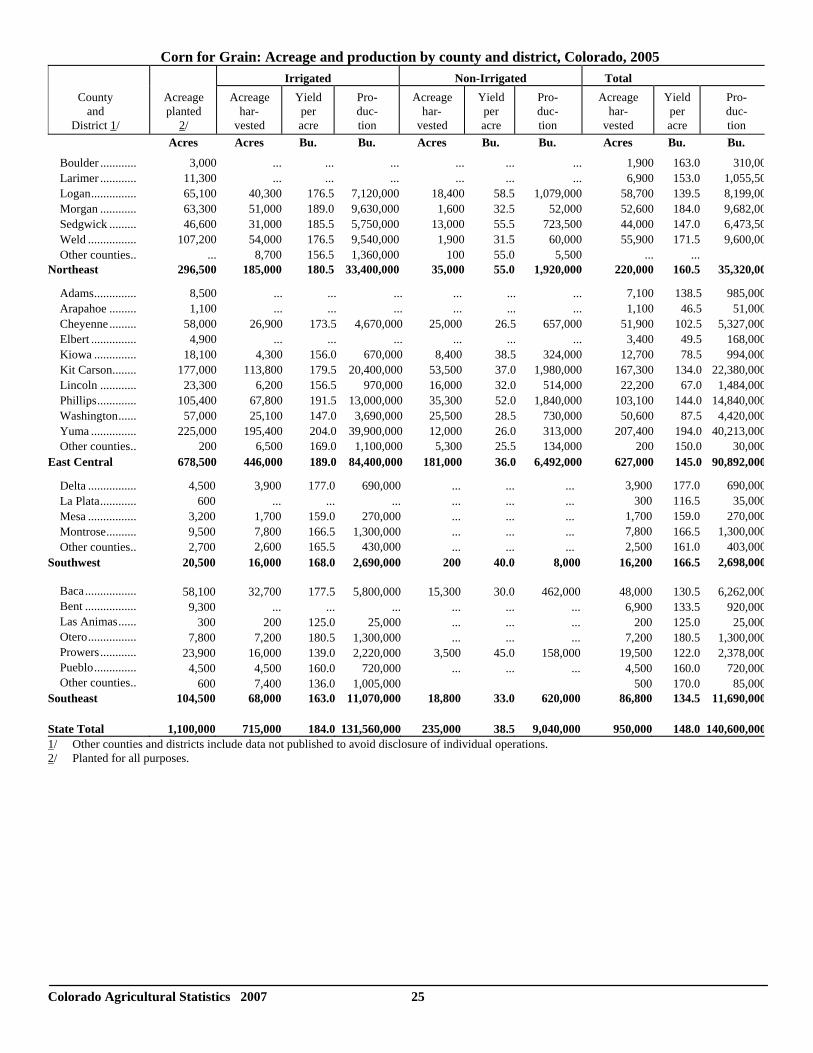
Colorado Agricultural Statistics 2007 25
Corn for Grain: Acreage and production by county and district, Colorado, 2005
Irrigated
Non-Irrigated
Total
County and District 1/
Acreage planted 2/
Acreage
har- vested
Yield per acre
Pro- duc- tion
Acreage
har- vested
Yield per acre
Pro- duc- tion
Acreage har- vested
Yield per acre
Pro- duc- tion
Acres
Acres
Bu.
Bu.
Acres
Bu.
Bu.
Acres
Bu. Bu.
Boulder ............
3,000
...
...
...
...
...
...
1,900
163.0
310,00
Larimer ............
11,300
...
...
...
...
...
...
6,900 153.0
1,055,50
Logan...............
65,100
40,300
176.5
7,120,000
18,400
58.5
1,079,000
58,700
139.5
8,199,00 Morgan ............
63,300
51,000
189.0
9,630,000
1,600
32.5
52,000
52,600
184.0
9,682,00
Sedgwick .........
46,600
31,000
185.5
5,750,000
13,000
55.5
723,500
44,000 147.0
6,473,50
Weld ................
107,200
54,000
176.5
9,540,000
1,900
31.5
60,000
55,900
171.5
9,600,00Other counties.. ... 8,700 156.5 1,360,000 100 55.0 5,500
...
...
.
Northeast
296,500
185,000
180.5
33,400,000
35,000
55.0
1,920,000
220,000
160.5
35,320,00
Adams..............
8,500
...
...
...
...
...
...
7,100
138.5
985,000 Arapahoe .........
1,100
...
...
...
...
...
...
1,100
46.5
51,000
Cheyenne.........
58,000
26,900
173.5
4,670,000
25,000
26.5
657,000
51,900
102.5
5,327,000 Elbert ...............
4,900
...
...
...
...
...
...
3,400
49.5
168,000
Kiowa ..............
18,100
4,300
156.0
670,000
8,400
38.5
324,000
12,700
78.5
994,000 Kit Carson........
177,000
113,800
179.5
20,400,000
53,500
37.0
1,980,000
167,300
134.0
22,380,000
Lincoln ............
23,300
6,200
156.5
970,000
16,000
32.0
514,000
22,200
67.0
1,484,000 Phillips.............
105,400
67,800
191.5
13,000,000
35,300
52.0
1,840,000
103,100
144.0
14,840,000
Washington......
57,000
25,100
147.0
3,690,000
25,500
28.5
730,000
50,600
87.5
4,420,000 Yuma ...............
225,000
195,400
204.0
39,900,000
12,000
26.0
313,000
207,400
194.0
40,213,000
Other counties.. 200 6,500 169.0 1,100,000 5,300 25.5 134,000 200 150.0 30,000 East Central
678,500
446,000
189.0
84,400,000
181,000
36.0
6,492,000
627,000
145.0
90,892,000
Delta ................
4,500
3,900
177.0
690,000
...
...
... 3,900 177.0 690,000
La Plata............
600
...
...
...
...
...
... 300 116.5 35,000 Mesa ................
3,200
1,700
159.0
270,000
...
...
... 1,700 159.0 270,000
Montrose..........
9,500
7,800
166.5
1,300,000
...
...
... 7,800
166.5 1,300,000 Other counties..
2,700 2,600 165.5 430,000
...
...
... 2,500 161.0 403,000
Southwest
20,500
16,000
168.0
2,690,000
200
40.0
8,000
16,200
166.5 2,698,000
Baca.................
58,100
32,700
177.5
5,800,000
15,300
30.0
462,000
48,000
130.5
6,262,000
Bent .................
9,300
...
...
...
...
...
...
6,900
133.5
920,000 Las Animas......
300
200
125.0
25,000
...
...
...
200
125.0
25,000
Otero................
7,800
7,200
180.5
1,300,000
...
...
...
7,200
180.5
1,300,000 Prowers............
23,900
16,000
139.0
2,220,000
3,500
45.0
158,000
19,500
122.0
2,378,000
Pueblo..............
4,500
4,500
160.0
720,000
...
...
...
4,500 160.0
720,000
Other counties.. 600 7,400 136.0 1,005,000 500 170.0 85,000 Southeast
104,500
68,000
163.0
11,070,000
18,800
33.0
620,000
86,800
134.5
11,690,000
State Total
1,100,000
715,000
184.0
131,560,000
235,000
38.5
9,040,000
950,000
148.0
140,600,000
1/ Other counties and districts include data not published to avoid disclosure of individual operations. 2/ Planted for all purposes.
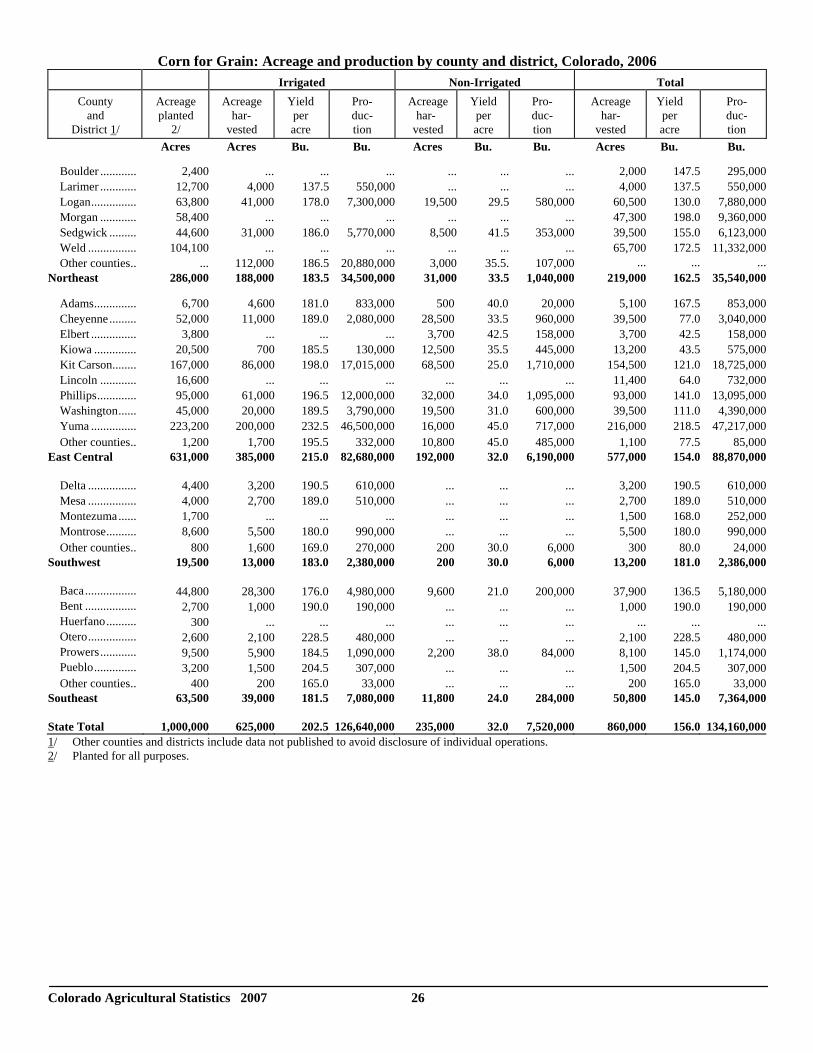
Colorado Agricultural Statistics 2007 26
Corn for Grain: Acreage and production by county and district, Colorado, 2006
Irrigated
Non-Irrigated
Total
County and District 1/
Acreage planted 2/
Acreage
har- vested
Yield per acre
Pro- duc- tion
Acreage
har- vested
Yield per acre
Pro- duc- tion
Acreage har- vested
Yield per acre
Pro- duc- tion
Acres
Acres
Bu.
Bu.
Acres
Bu.
Bu.
Acres
Bu. Bu.
Boulder ............
2,400
...
...
...
...
...
...
2,000
147.5
295,000
Larimer ............
12,700
4,000
137.5
550,000
...
...
...
4,000
137.5
550,000 Logan...............
63,800
41,000
178.0
7,300,000
19,500
29.5
580,000
60,500
130.0
7,880,000
Morgan ............
58,400
...
...
...
...
...
...
47,300
198.0
9,360,000 Sedgwick .........
44,600
31,000
186.0
5,770,000
8,500
41.5
353,000
39,500
155.0
6,123,000
Weld ................
104,100
...
...
...
...
...
...
65,700
172.5
11,332,000 Other counties..
... 112,000 186.5 20,880,000 3,000 35.5. 107,000
...
...
...
Northeast
286,000
188,000
183.5
34,500,000
31,000
33.5
1,040,000
219,000
162.5
35,540,000
Adams..............
6,700
4,600
181.0
833,000
500
40.0
20,000
5,100
167.5
853,000 Cheyenne.........
52,000
11,000
189.0
2,080,000
28,500
33.5
960,000
39,500
77.0
3,040,000
Elbert ...............
3,800
...
...
...
3,700
42.5
158,000
3,700
42.5
158,000 Kiowa ..............
20,500
700
185.5
130,000
12,500
35.5
445,000
13,200
43.5
575,000
Kit Carson........
167,000
86,000
198.0
17,015,000
68,500
25.0
1,710,000
154,500
121.0
18,725,000 Lincoln ............
16,600
...
...
...
...
...
...
11,400
64.0
732,000
Phillips.............
95,000
61,000
196.5
12,000,000
32,000
34.0
1,095,000
93,000
141.0
13,095,000 Washington......
45,000
20,000
189.5
3,790,000
19,500
31.0
600,000
39,500
111.0
4,390,000
Yuma ...............
223,200
200,000
232.5
46,500,000
16,000
45.0
717,000
216,000
218.5
47,217,000 Other counties.. 1,200 1,700 195.5 332,000 10,800 45.0 485,000 1,100 77.5 85,000
East Central
631,000
385,000
215.0
82,680,000
192,000
32.0
6,190,000
577,000
154.0
88,870,000
Delta ................
4,400
3,200
190.5
610,000
...
...
...
3,200
190.5
610,000
Mesa ................
4,000
2,700
189.0
510,000
...
...
...
2,700
189.0
510,000 Montezuma......
1,700
...
...
...
...
...
...
1,500
168.0
252,000
Montrose..........
8,600
5,500
180.0
990,000
...
...
...
5,500
180.0
990,000 Other counties.. 800 1,600 169.0 270,000 200 30.0 6,000 300 80.0 24,000
Southwest
19,500
13,000
183.0
2,380,000
200
30.0
6,000
13,200
181.0
2,386,000
Baca.................
44,800
28,300
176.0
4,980,000
9,600
21.0
200,000
37,900
136.5
5,180,000
Bent .................
2,700
1,000
190.0
190,000
...
...
...
1,000
190.0
190,000 Huerfano..........
300
...
...
...
...
...
...
...
...
...
Otero................
2,600
2,100
228.5
480,000
...
...
...
2,100
228.5
480,000 Prowers............
9,500
5,900
184.5
1,090,000
2,200
38.0
84,000
8,100
145.0
1,174,000
Pueblo..............
3,200
1,500
204.5
307,000
...
...
...
1,500
204.5
307,000 Other counties.. 400 200 165.0 33,000
...
...
... 200 165.0 33,000
Southeast
63,500
39,000
181.5
7,080,000
11,800
24.0
284,000
50,800
145.0
7,364,000
State Total
1,000,000
625,000
202.5
126,640,000
235,000
32.0
7,520,000
860,000
156.0
134,160,000
1/ Other counties and districts include data not published to avoid disclosure of individual operations. 2/ Planted for all purposes.
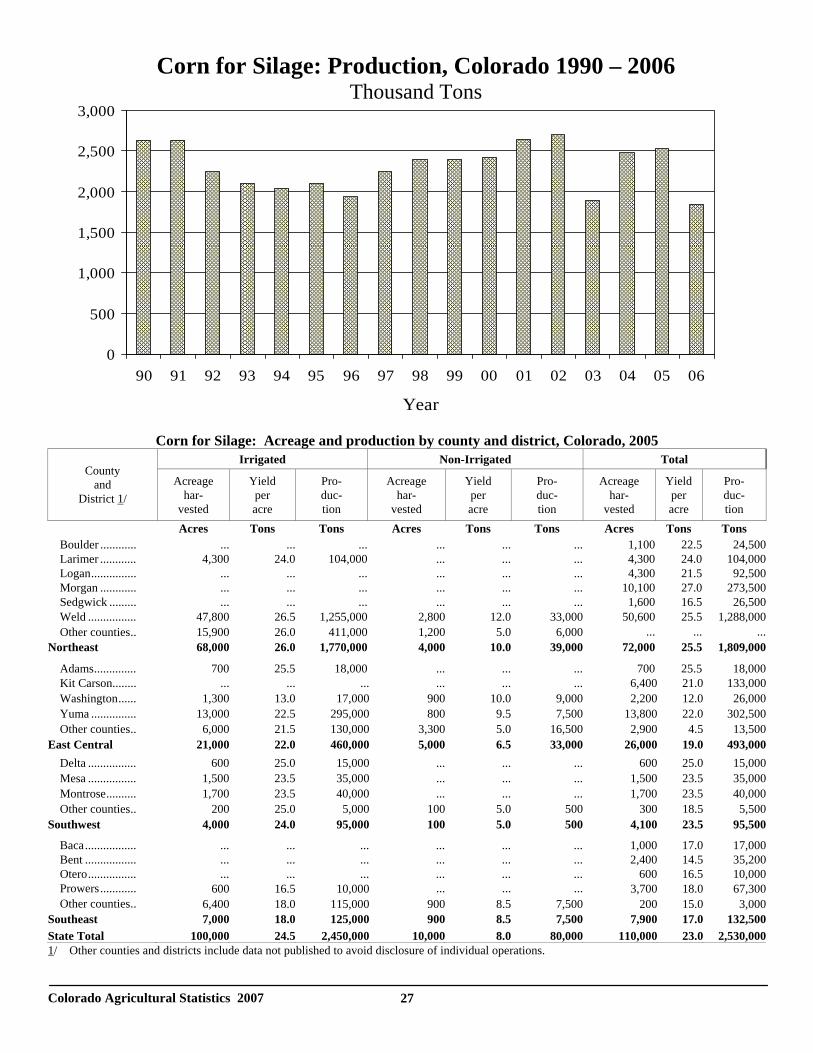
Colorado Agricultural Statistics 2007 27
Corn for Silage: Acreage and production by county and district, Colorado, 2005
Irrigated Non-Irrigated Total County
and District 1/
Acreage har-
vested
Yield per acre
Pro- duc- tion
Acreage har-
vested
Yield per acre
Pro- duc- tion
Acreage har-
vested
Yield per acre
Pro- duc- tion
Acres Tons Tons Acres Tons Tons Acres Tons Tons Boulder ............ ... ... ... ... ... ... 1,100 22.5 24,500 Larimer ............ 4,300 24.0 104,000 ... ... ... 4,300 24.0 104,000 Logan............... ... ... ... ... ... ... 4,300 21.5 92,500 Morgan ............ ... ... ... ... ... ... 10,100 27.0 273,500 Sedgwick ......... ... ... ... ... ... ... 1,600 16.5 26,500 Weld ................ 47,800 26.5 1,255,000 2,800 12.0 33,000 50,600 25.5 1,288,000 Other counties.. 15,900 26.0 411,000 1,200 5.0 6,000 ... ... ...Northeast 68,000 26.0 1,770,000 4,000 10.0 39,000 72,000 25.5 1,809,000
Adams.............. 700 25.5 18,000 ... ... ... 700 25.5 18,000 Kit Carson........ ... ... ... ... ... ... 6,400 21.0 133,000 Washington...... 1,300 13.0 17,000 900 10.0 9,000 2,200 12.0 26,000 Yuma ............... 13,000 22.5 295,000 800 9.5 7,500 13,800 22.0 302,500 Other counties.. 6,000 21.5 130,000 3,300 5.0 16,500 2,900 4.5 13,500East Central 21,000 22.0 460,000 5,000 6.5 33,000 26,000 19.0 493,000 Delta ................ 600 25.0 15,000 ... ... ... 600 25.0 15,000 Mesa ................ 1,500 23.5 35,000 ... ... ... 1,500 23.5 35,000 Montrose.......... 1,700 23.5 40,000 ... ... ... 1,700 23.5 40,000 Other counties.. 200 25.0 5,000 100 5.0 500 300 18.5 5,500Southwest 4,000 24.0 95,000 100 5.0 500 4,100 23.5 95,500
Baca................. ... ... ... ... ... ... 1,000 17.0 17,000 Bent ................. ... ... ... ... ... ... 2,400 14.5 35,200 Otero................ ... ... ... ... ... ... 600 16.5 10,000 Prowers............ 600 16.5 10,000 ... ... ... 3,700 18.0 67,300 Other counties.. 6,400 18.0 115,000 900 8.5 7,500 200 15.0 3,000Southeast 7,000 18.0 125,000 900 8.5 7,500 7,900 17.0 132,500State Total 100,000 24.5 2,450,000 10,000 8.0 80,000 110,000 23.0 2,530,0001/ Other counties and districts include data not published to avoid disclosure of individual operations.
Corn for Silage: Production, Colorado 1990 – 2006 Thousand Tons
0
500
1,000
1,500
2,000
2,500
3,000
90 91 92 93 94 95 96 97 98 99 00 01 02 03 04 05 06
Year
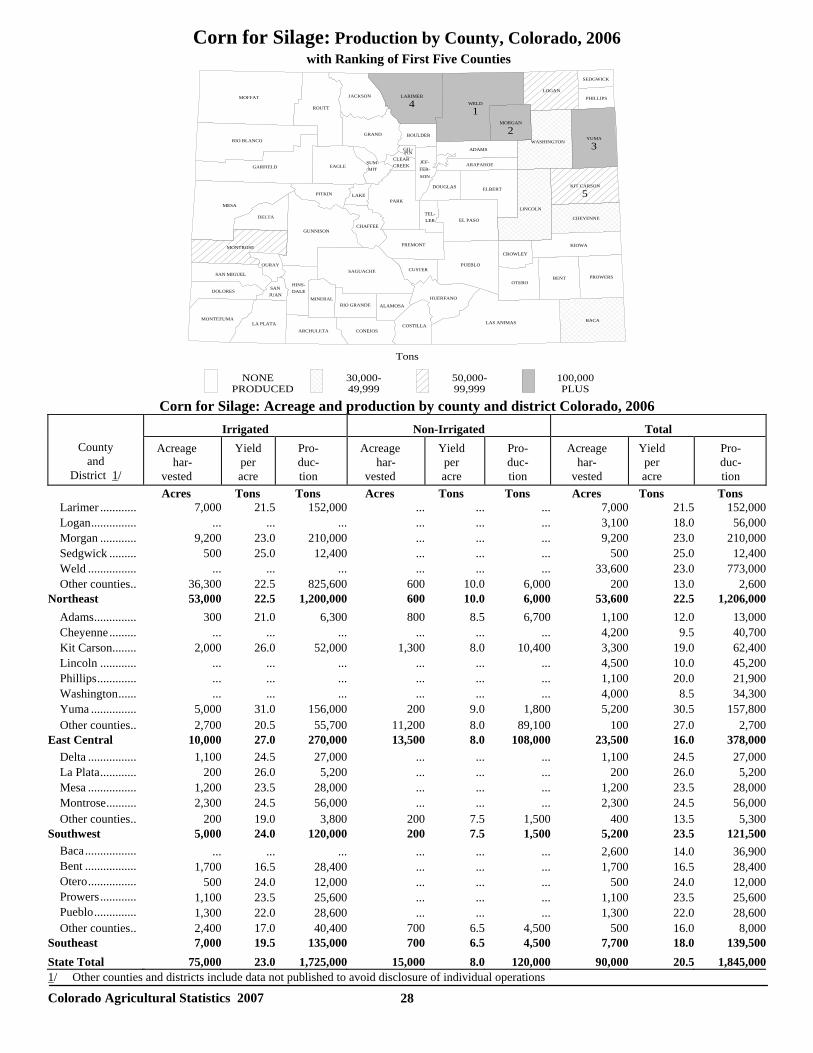
Colorado Agricultural Statistics 2007 28
Corn for Silage: Production by County, Colorado, 2006 with Ranking of First Five Counties
Tons
NONE PRODUCED
30,000-49,999
50,000-99,999
100,000PLUS
ADAMS
ALAMOSA
ARAPAHOE
ARCHULETA
BACA
BENT
BOULDER
CHAFFEE
CHEYENNE
CLEARCREEK
CONEJOSCOSTILLA
CROWLEY
CUSTER
DELTA
DOLORES
DOUGLAS
EAGLE
ELBERT
EL PASO
FREMONT
GARFIELD
GIL-PIN
GRAND
GUNNISON
HINS-DALE
HUERFANO
JACKSON
JEF-FER-SON
KIOWA
KIT CARSON
5LAKE
LA PLATA
LARIMER
4
LAS ANIMAS
LINCOLN
LOGAN
MESA
MINERAL
MOFFAT
MONTEZUMA
MONTROSE
MORGAN
2
OTERO
OURAY
PARK
PHILLIPS
PITKIN
PROWERS
PUEBLO
RIO BLANCO
RIO GRANDE
ROUTT
SAGUACHE
SANJUAN
SAN MIGUEL
SEDGWICK
SUM-MIT
TEL-LER
WASHINGTON
WELD
1
YUMA
3
Corn for Silage: Acreage and production by county and district Colorado, 2006
Irrigated
Non-Irrigated
Total
County and
District 1/
Acreage
har- vested
Yield per acre
Pro- duc- tion
Acreage
har- vested
Yield per acre
Pro- duc- tion
Acreage har- vested
Yield per acre
Pro- duc- tion
Acres
Tons
Tons Acres Tons Tons Acres
Tons Tons
Larimer ............
7,000
21.5
152,000
...
...
...
7,000
21.5
152,000 Logan...............
...
...
...
...
...
...
3,100
18.0
56,000
Morgan ............
9,200
23.0
210,000
...
...
...
9,200
23.0
210,000 Sedgwick .........
500
25.0
12,400
...
...
...
500
25.0
12,400
Weld ................
...
...
...
...
...
...
33,600
23.0
773,000 Other counties..
36,300
22.5 825,600
600 10.0
6,000
200
13.0
2,600
Northeast
53,000
22.5
1,200,000
600
10.0
6,000
53,600
22.5
1,206,000 Adams..............
300
21.0
6,300
800
8.5
6,700
1,100
12.0
13,000
Cheyenne.........
...
...
...
...
...
...
4,200
9.5
40,700 Kit Carson........
2,000
26.0
52,000
1,300
8.0
10,400
3,300
19.0
62,400
Lincoln ............
...
...
...
...
...
...
4,500
10.0
45,200 Phillips.............
...
...
...
...
...
...
1,100
20.0
21,900
Washington......
...
...
...
...
...
...
4,000
8.5
34,300 Yuma ...............
5,000
31.0
156,000
200
9.0
1,800
5,200
30.5
157,800
Other counties..
2,700
20.5
55,700
11,200
8.0
89,100 100 27.0 2,700 East Central
10,000
27.0
270,000
13,500
8.0
108,000
23,500
16.0
378,000
Delta ................
1,100
24.5
27,000
...
...
...
1,100
24.5
27,000 La Plata............
200
26.0
5,200
...
...
...
200
26.0
5,200
Mesa ................
1,200
23.5
28,000
...
...
...
1,200
23.5
28,000 Montrose..........
2,300
24.5
56,000
...
...
...
2,300
24.5
56,000
Other counties..
200 19.0
3,800
200 7.5 1,500 400 13.5 5,300 Southwest
5,000
24.0
120,000
200
7.5
1,500
5,200
23.5
121,500
Baca.................
...
...
...
...
...
...
2,600
14.0
36,900 Bent .................
1,700
16.5
28,400
...
...
...
1,700
16.5
28,400
Otero................
500
24.0
12,000
...
...
...
500
24.0
12,000 Prowers............
1,100
23.5
25,600
...
...
...
1,100
23.5
25,600
Pueblo..............
1,300
22.0
28,600
...
...
...
1,300
22.0
28,600 Other counties..
2,400
17.0
40,400
700 6.5
4,500 500 16.0 8,000
Southeast
7,000
19.5
135,000
700
6.5
4,500
7,700
18.0
139,500 State Total
75,000
23.0
1,725,000
15,000
8.0
120,000
90,000
20.5
1,845,000
1/ Other counties and districts include data not published to avoid disclosure of individual operations
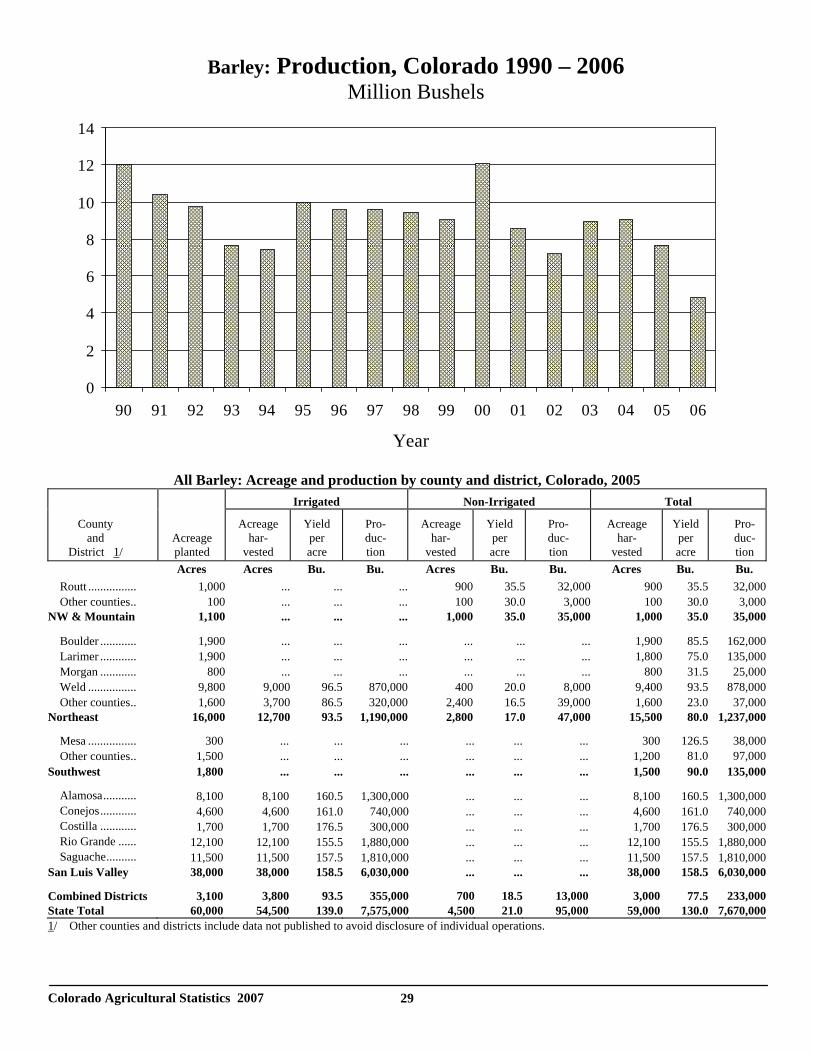
Colorado Agricultural Statistics 2007 29
All Barley: Acreage and production by county and district, Colorado, 2005
Irrigated
Non-Irrigated
Total
County and District 1/
Acreage planted
Acreage har- vested
Yield per acre
Pro- duc- tion
Acreage har- vested
Yield per acre
Pro- duc- tion
Acreage har- vested
Yield per acre
Pro- duc- tion
Acres
Acres
Bu.
Bu.
Acres
Bu.
Bu.
Acres
Bu. Bu.
Routt ................
1,000
...
...
...
900 35.5
32,000
900
35.5
32,000 Other counties..
100
...
...
... 100 30.0
3,000
100
30.0
3,000
NW & Mountain
1,100
...
...
...
1,000
35.0
35,000
1,000
35.0
35,000
Boulder ............
1,900
...
...
...
...
...
...
1,900
85.5
162,000 Larimer ............
1,900
...
...
...
...
...
...
1,800
75.0
135,000
Morgan ............
800
...
...
...
...
...
...
800
31.5
25,000 Weld ................
9,800
9,000
96.5
870,000
400
20.0
8,000
9,400
93.5
878,000
Other counties.. 1,600 3,700 86.5 320,000 2,400 16.5 39,000 1,600 23.0 37,000 Northeast
16,000
12,700
93.5
1,190,000
2,800
17.0
47,000
15,500
80.0
1,237,000
Mesa ................
300
...
...
...
...
...
...
300
126.5
38,000
Other counties..
1,500
...
...
...
...
...
...
1,200 81.0 97,000 Southwest
1,800
...
...
...
...
...
...
1,500
90.0
135,000
Alamosa...........
8,100
8,100
160.5
1,300,000
...
...
...
8,100
160.5
1,300,000
Conejos............
4,600
4,600
161.0
740,000
...
...
...
4,600 161.0
740,000
Costilla ............
1,700
1,700
176.5
300,000
...
...
...
1,700
176.5
300,000 Rio Grande ......
12,100
12,100
155.5
1,880,000
...
...
...
12,100
155.5
1,880,000
Saguache..........
11,500
11,500
157.5
1,810,000
...
...
...
11,500
157.5
1,810,000 San Luis Valley
38,000
38,000
158.5
6,030,000
...
...
...
38,000
158.5
6,030,000
Combined Districts
3,100 3,800 93.5 355,000 700 18.5 13,000 3,000
77.5 233,000
State Total
60,000
54,500
139.0
7,575,000
4,500
21.0
95,000
59,000 130.0
7,670,000
1/ Other counties and districts include data not published to avoid disclosure of individual operations.
Barley: Production, Colorado 1990 – 2006 Million Bushels
0
2
4
6
8
10
12
14
90 91 92 93 94 95 96 97 98 99 00 01 02 03 04 05 06
Year
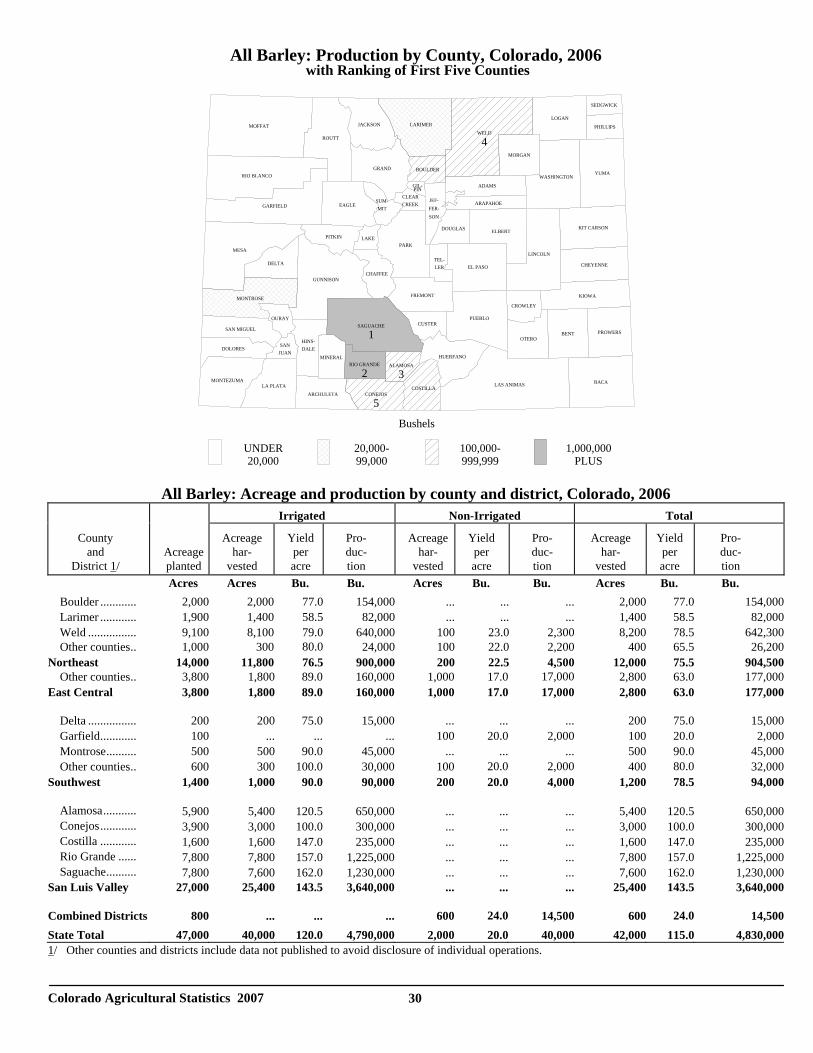
Colorado Agricultural Statistics 2007 30
All Barley: Production by County, Colorado, 2006 with Ranking of First Five Counties
All Barley: Acreage and production by county and district, Colorado, 2006
Irrigated
Non-Irrigated
Total
County and District 1/
Acreage planted
Acreage har- vested
Yield per acre
Pro- duc- tion
Acreage har- vested
Yield per acre
Pro- duc- tion
Acreage har- vested
Yield per acre
Pro- duc- tion
Acres
Acres
Bu.
Bu.
Acres
Bu.
Bu.
Acres
Bu. Bu.
Boulder ............
2,000
2,000
77.0
154,000
...
...
...
2,000
77.0
154,000 Larimer ............
1,900
1,400
58.5
82,000
...
...
...
1,400
58.5
82,000
Weld ................
9,100
8,100
79.0
640,000
100
23.0
2,300
8,200
78.5
642,300 Other counties..
1,000
300 80.0
24,000
100
22.0
2,200
400
65.5
26,200
Northeast
14,000
11,800
76.5
900,000
200
22.5
4,500
12,000
75.5
904,500 Other counties..
3,800
1,800
89.0
160,000
1,000
17.0 17,000
2,800
63.0
177,000
East Central
3,800
1,800
89.0
160,000
1,000
17.0
17,000
2,800
63.0
177,000
Delta ................
200
200
75.0
15,000
...
...
...
200
75.0
15,000
Garfield............
100
...
...
...
100
20.0
2,000
100
20.0
2,000 Montrose..........
500
500
90.0
45,000
...
...
...
500
90.0
45,000
Other counties..
600
300
100.0
30,000
100 20.0 2,000
400 80.0
32,000 Southwest
1,400
1,000
90.0
90,000
200
20.0
4,000
1,200
78.5
94,000
Alamosa...........
5,900
5,400
120.5
650,000
...
...
...
5,400
120.5
650,000
Conejos............
3,900
3,000 100.0
300,000
...
...
...
3,000
100.0
300,000
Costilla ............
1,600
1,600 147.0
235,000
...
...
...
1,600
147.0
235,000
Rio Grande ......
7,800
7,800 157.0
1,225,000
...
...
...
7,800
157.0
1,225,000
Saguache..........
7,800
7,600 162.0
1,230,000
...
...
...
7,600
162.0
1,230,000
San Luis Valley
27,000
25,400
143.5
3,640,000
...
...
...
25,400
143.5
3,640,000
Combined Districts
800
...
...
...
600 24.0
14,500
600 24.0
14,500
State Total
47,000
40,000 120.0
4,790,000
2,000
20.0
40,000
42,000
115.0
4,830,000
1/ Other counties and districts include data not published to avoid disclosure of individual operations.
Bushels
UNDER20,000
20,000-99,000
100,000-999,999
1,000,000PLUS
ADAMS
ALAMOSA
3
ARAPAHOE
ARCHULETA
BACA
BENT
BOULDER
CHAFFEE
CHEYENNE
CLEARCREEK
CONEJOS
5COSTILLA
CROWLEY
CUSTER
DELTA
DOLORES
DOUGLAS
EAGLE
ELBERT
EL PASO
FREMONT
GARFIELD
GIL-PIN
GRAND
GUNNISON
HINS-DALE
HUERFANO
JACKSON
JEF-FER-SON
KIOWA
KIT CARSON
LAKE
LA PLATA
LARIMER
LAS ANIMAS
LINCOLN
LOGAN
MESA
MINERAL
MOFFAT
MONTEZUMA
MONTROSE
MORGAN
OTERO
OURAY
PARK
PHILLIPS
PITKIN
PROWERS
PUEBLO
RIO BLANCO
RIO GRANDE
2
ROUTT
SAGUACHE
1SAN
JUAN
SAN MIGUEL
SEDGWICK
SUM-MIT
TEL-LER
WASHINGTON
WELD
4
YUMA
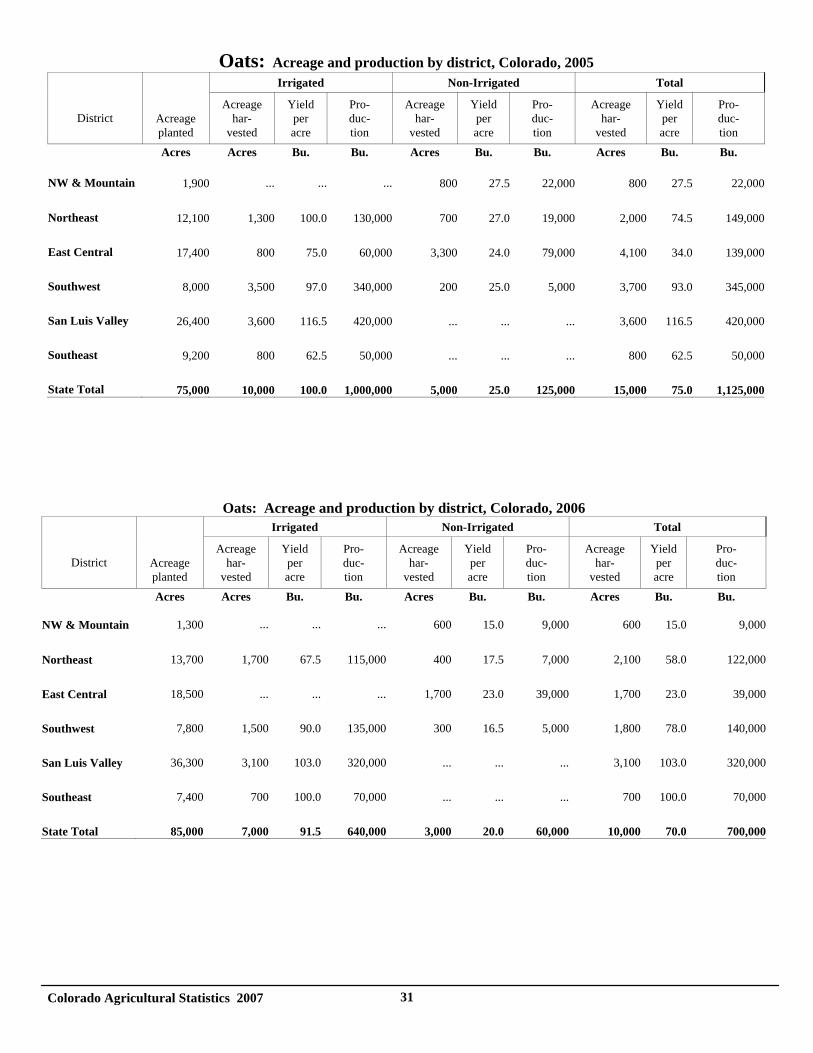
Colorado Agricultural Statistics 2007 31
Oats: Acreage and production by district, Colorado, 2005 Irrigated Non-Irrigated Total
District
Acreage planted
Acreage har-
vested
Yield per acre
Pro- duc- tion
Acreage har-
vested
Yield per acre
Pro- duc- tion
Acreage har-
vested
Yield per acre
Pro- duc- tion
Acres Acres Bu. Bu. Acres Bu. Bu. Acres Bu. Bu.
NW & Mountain
1,900 ... ... ... 800 27.5 22,000 800 27.5 22,000
Northeast
12,100 1,300 100.0 130,000 700 27.0 19,000 2,000 74.5 149,000
East Central
17,400 800 75.0 60,000 3,300 24.0 79,000 4,100 34.0 139,000
Southwest
8,000 3,500 97.0 340,000 200 25.0 5,000 3,700 93.0 345,000
San Luis Valley
26,400 3,600 116.5 420,000 ... ... ... 3,600 116.5 420,000
Southeast
9,200 800 62.5 50,000 ... ... ... 800 62.5 50,000
State Total 75,000 10,000 100.0 1,000,000 5,000 25.0 125,000 15,000 75.0 1,125,000
Oats: Acreage and production by district, Colorado, 2006 Irrigated Non-Irrigated Total
District
Acreage planted
Acreage har-
vested
Yield per acre
Pro- duc- tion
Acreage har-
vested
Yield per acre
Pro- duc- tion
Acreage har-
vested
Yield per acre
Pro- duc- tion
Acres Acres Bu. Bu. Acres Bu. Bu. Acres Bu. Bu.
NW & Mountain
1,300 ... ... ... 600 15.0 9,000 600 15.0 9,000
Northeast
13,700 1,700 67.5 115,000 400 17.5 7,000 2,100 58.0 122,000
East Central
18,500 ... ... ... 1,700 23.0 39,000 1,700 23.0 39,000
Southwest
7,800 1,500 90.0 135,000 300 16.5 5,000 1,800 78.0 140,000
San Luis Valley
36,300 3,100 103.0 320,000 ... ... ... 3,100 103.0 320,000
Southeast
7,400 700 100.0 70,000 ... ... ... 700 100.0 70,000
State Total 85,000 7,000 91.5 640,000 3,000 20.0 60,000 10,000 70.0 700,000
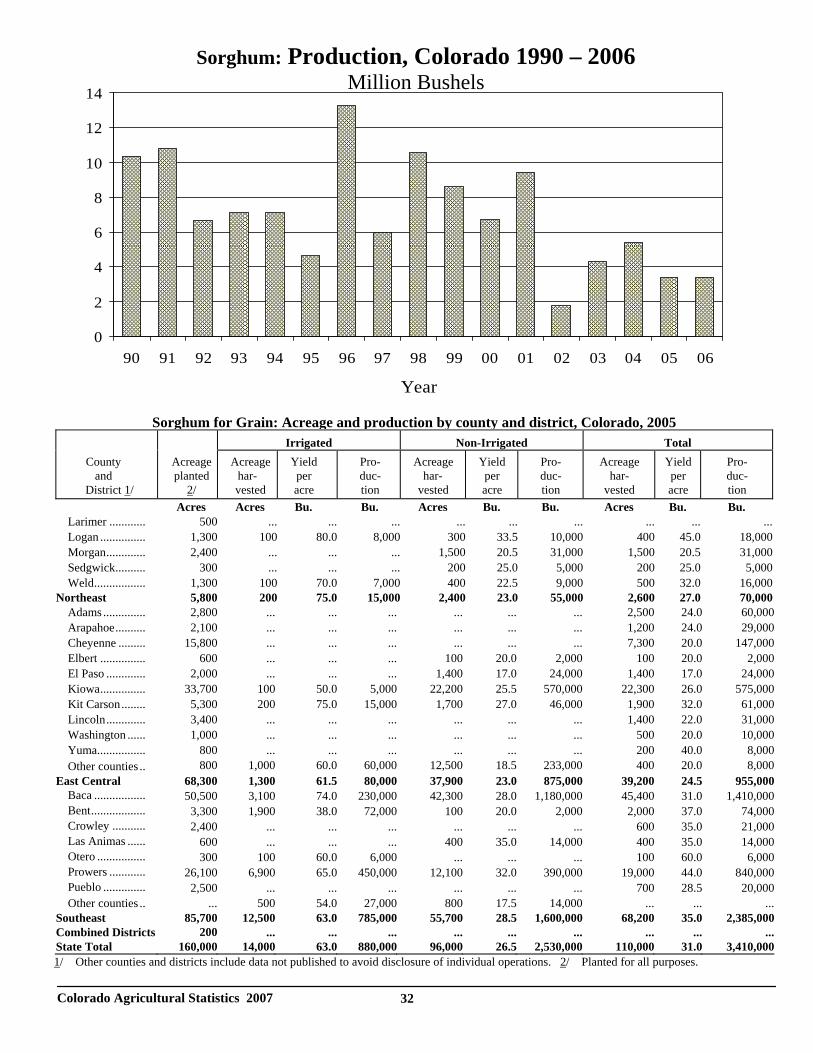
Colorado Agricultural Statistics 2007 32
Sorghum for Grain: Acreage and production by county and district, Colorado, 2005
Irrigated
Non-Irrigated
Total
County and District 1/
Acreage planted 2/
Acreage
har- vested
Yield per acre
Pro- duc- tion
Acreage
har- vested
Yield per acre
Pro- duc- tion
Acreage har- vested
Yield per acre
Pro- duc- tion
Acres
Acres
Bu. Bu. Acres Bu. Bu.
Acres Bu. Bu.
Larimer ............
500
...
...
...
...
...
...
...
...
... Logan ...............
1,300
100
80.0
8,000
300
33.5
10,000
400
45.0
18,000
Morgan.............
2,400
...
...
...
1,500
20.5
31,000
1,500
20.5
31,000 Sedgwick..........
300
...
...
...
200
25.0
5,000
200
25.0
5,000
Weld.................
1,300
100
70.0
7,000
400
22.5
9,000
500
32.0
16,000 Northeast
5,800
200
75.0 15,000 2,400 23.0 55,000
2,600 27.0 70,000
Adams ..............
2,800
...
...
...
...
...
...
2,500
24.0
60,000 Arapahoe..........
2,100
...
...
...
...
...
...
1,200
24.0
29,000
Cheyenne .........
15,800
...
...
...
...
...
...
7,300
20.0
147,000 Elbert ...............
600
...
...
...
100
20.0
2,000
100
20.0
2,000
El Paso .............
2,000
...
...
...
1,400
17.0
24,000
1,400
17.0
24,000 Kiowa...............
33,700
100
50.0
5,000
22,200
25.5
570,000
22,300
26.0
575,000
Kit Carson........
5,300
200
75.0
15,000
1,700
27.0
46,000
1,900
32.0
61,000 Lincoln.............
3,400
...
...
...
...
...
...
1,400
22.0
31,000
Washington ......
1,000
...
...
...
...
...
...
500
20.0
10,000 Yuma................
800
...
...
...
...
...
...
200
40.0
8,000
Other counties .. 800 1,000 60.0 60,000 12,500 18.5 233,000 400 20.0 8,000 East Central
68,300
1,300
61.5 80,000 37,900 23.0 875,000
39,200 24.5 955,000
Baca .................
50,500
3,100
74.0
230,000
42,300
28.0
1,180,000
45,400
31.0
1,410,000 Bent..................
3,300
1,900
38.0
72,000
100
20.0
2,000
2,000
37.0
74,000
Crowley ...........
2,400
...
...
...
...
...
...
600
35.0
21,000 Las Animas ......
600
...
...
...
400
35.0
14,000
400
35.0
14,000
Otero ................
300
100
60.0
6,000
...
...
...
100
60.0
6,000 Prowers ............
26,100
6,900
65.0
450,000
12,100
32.0
390,000
19,000
44.0
840,000
Pueblo ..............
2,500
...
...
...
...
...
...
700
28.5
20,000 Other counties ..
... 500 54.0 27,000 800 17.5 14,000
...
...
...
Southeast
85,700
12,500
63.0 785,000 55,700 28.5 1,600,000
68,200 35.0 2,385,000 Combined Districts 200
...
... ... ... ... ...
... ... ...
State Total
160,000
14,000
63.0
880,000
96,000
26.5
2,530,000
110,000
31.0
3,410,000 1/ Other counties and districts include data not published to avoid disclosure of individual operations. 2/ Planted for all purposes.
Sorghum: Production, Colorado 1990 – 2006 Million Bushels
0
2
4
6
8
10
12
14
90 91 92 93 94 95 96 97 98 99 00 01 02 03 04 05 06
Year
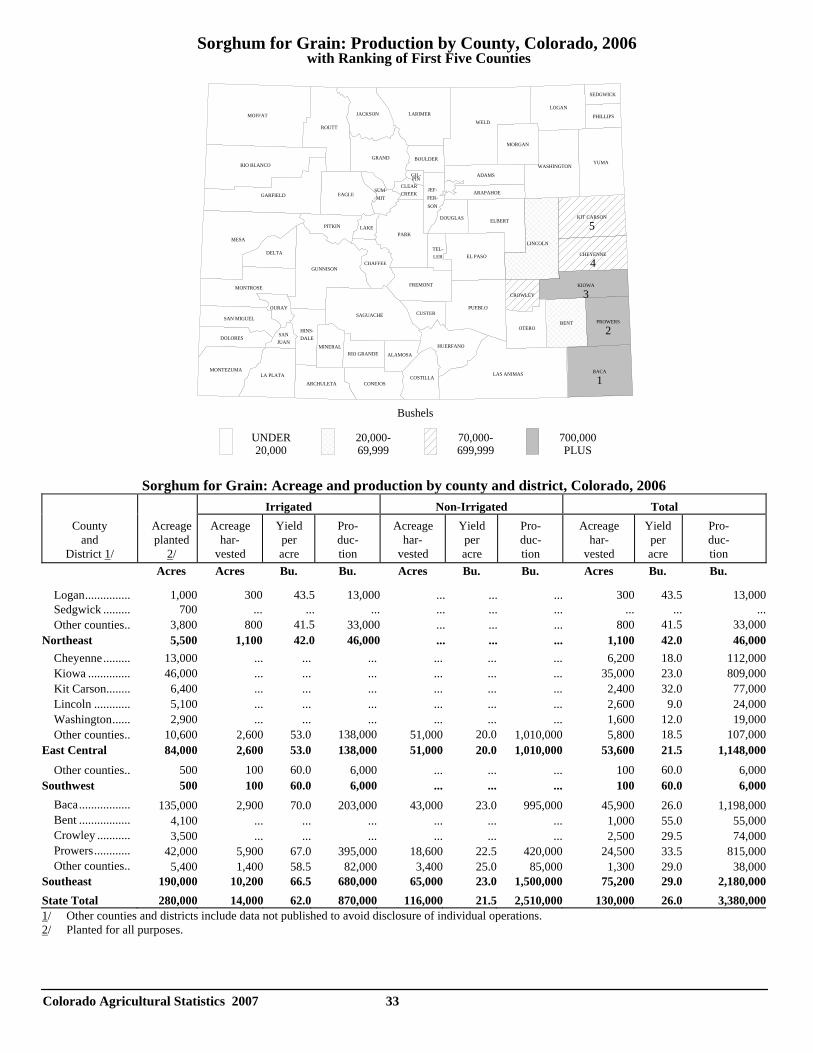
Colorado Agricultural Statistics 2007 33
Sorghum for Grain: Production by County, Colorado, 2006 with Ranking of First Five Counties
Sorghum for Grain: Acreage and production by county and district, Colorado, 2006
Irrigated
Non-Irrigated
Total
County and
District 1/
Acreage planted 2/
Acreage
har- vested
Yield per acre
Pro- duc- tion
Acreage
har- vested
Yield per acre
Pro- duc- tion
Acreage har- vested
Yield per acre
Pro- duc- tion
Acres
Acres
Bu.
Bu.
Acres
Bu.
Bu.
Acres
Bu. Bu.
Logan...............
1,000
300
43.5
13,000
...
...
...
300
43.5
13,000
Sedgwick .........
700
...
...
...
...
...
...
...
...
... Other counties..
3,800
800 41.5
33,000
...
...
...
800 41.5 33,000
Northeast
5,500
1,100
42.0
46,000
...
...
...
1,100
42.0
46,000 Cheyenne.........
13,000
...
...
...
...
...
...
6,200
18.0
112,000
Kiowa ..............
46,000
...
...
...
...
...
...
35,000
23.0
809,000 Kit Carson........
6,400
...
...
...
...
...
...
2,400
32.0
77,000
Lincoln ............
5,100
...
...
...
...
...
...
2,600
9.0
24,000 Washington......
2,900
...
...
...
...
...
...
1,600
12.0
19,000
Other counties..
10,600
2,600
53.0 138,000
51,000 20.0
1,010,000
5,800 18.5 107,000 East Central
84,000
2,600
53.0
138,000
51,000
20.0
1,010,000
53,600
21.5
1,148,000
Other counties..
500 100 60.0
6,000
...
...
...
100 60.0
6,000
Southwest
500
100
60.0
6,000
...
...
...
100
60.0
6,000 Baca.................
135,000
2,900
70.0
203,000
43,000
23.0
995,000
45,900
26.0
1,198,000
Bent .................
4,100
...
...
...
...
...
...
1,000
55.0
55,000 Crowley ...........
3,500
...
...
...
...
...
...
2,500
29.5
74,000
Prowers............
42,000
5,900
67.0
395,000
18,600
22.5
420,000
24,500
33.5
815,000 Other counties..
5,400
1,400
58.5
82,000
3,400
25.0
85,000 1,300
29.0
38,000
Southeast
190,000
10,200
66.5
680,000
65,000
23.0
1,500,000
75,200
29.0
2,180,000 State Total
280,000
14,000
62.0
870,000
116,000
21.5
2,510,000
130,000
26.0
3,380,000
1/ Other counties and districts include data not published to avoid disclosure of individual operations. 2/ Planted for all purposes.
Bushels
UNDER20,000
20,000-69,999
70,000-699,999
700,000PLUS
ADAMS
ALAMOSA
ARAPAHOE
ARCHULETA
BACA
1
BENT
BOULDER
CHAFFEE
CHEYENNE
4
CLEARCREEK
CONEJOSCOSTILLA
CROWLEY
CUSTER
DELTA
DOLORES
DOUGLAS
EAGLE
ELBERT
EL PASO
FREMONT
GARFIELD
GIL-PIN
GRAND
GUNNISON
HINS-DALE
HUERFANO
JACKSON
JEF-FER-SON
KIOWA
3
KIT CARSON
5LAKE
LA PLATA
LARIMER
LAS ANIMAS
LINCOLN
LOGAN
MESA
MINERAL
MOFFAT
MONTEZUMA
MONTROSE
MORGAN
OTERO
OURAY
PARK
PHILLIPS
PITKIN
PROWERS
2
PUEBLO
RIO BLANCO
RIO GRANDE
ROUTT
SAGUACHE
SANJUAN
SAN MIGUEL
SEDGWICK
SUM-MIT
TEL-LER
WASHINGTON
WELD
YUMA
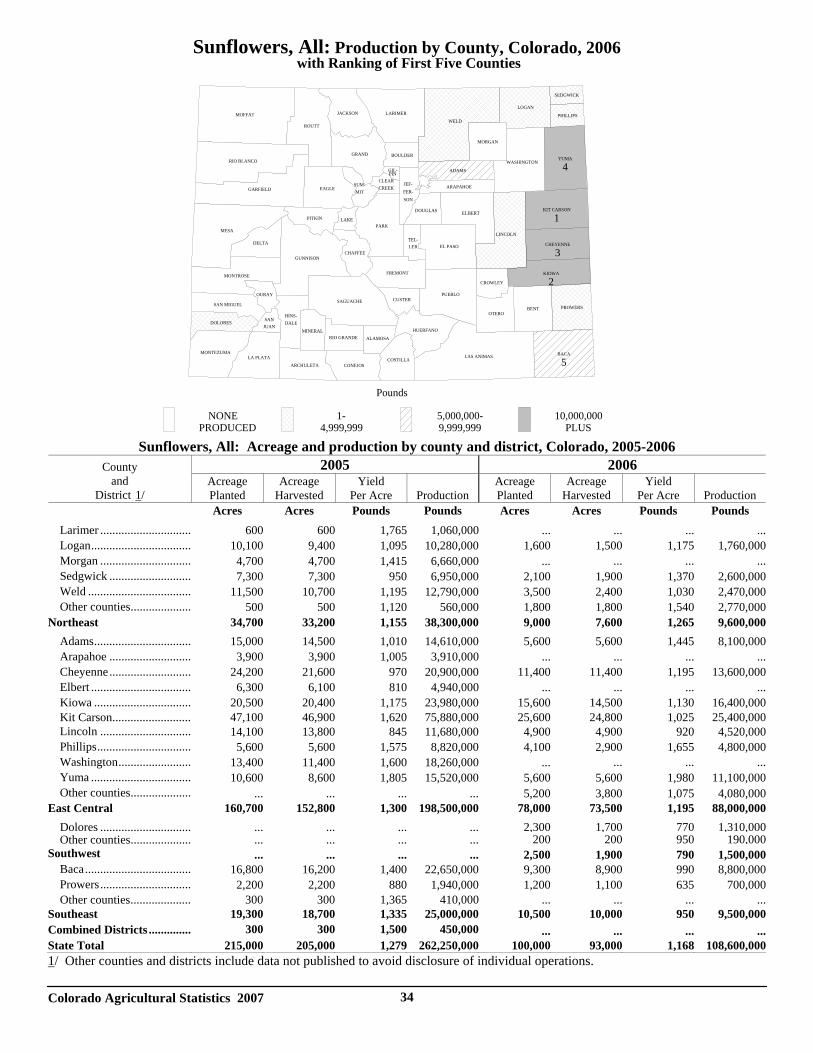
Colorado Agricultural Statistics 2007 34
Sunflowers, All: Production by County, Colorado, 2006 with Ranking of First Five Counties
Sunflowers, All: Acreage and production by county and district, Colorado, 2005-2006 2005 2006 County
and District 1/
Acreage Planted
Acreage Harvested
Yield Per Acre
Production
Acreage Planted
Acreage Harvested
Yield Per Acre
Production
Acres Acres Pounds Pounds Acres Acres Pounds Pounds Larimer .............................. 600 600 1,765 1,060,000 ... ... ... ... Logan................................. 10,100 9,400 1,095 10,280,000 1,600 1,500 1,175 1,760,000 Morgan .............................. 4,700 4,700 1,415 6,660,000 ... ... ... ... Sedgwick ........................... 7,300 7,300 950 6,950,000 2,100 1,900 1,370 2,600,000 Weld .................................. 11,500 10,700 1,195 12,790,000 3,500 2,400 1,030 2,470,000 Other counties.................... 500 500 1,120 560,000 1,800 1,800 1,540 2,770,000Northeast 34,700 33,200 1,155 38,300,000 9,000 7,600 1,265 9,600,000 Adams................................ 15,000 14,500 1,010 14,610,000 5,600 5,600 1,445 8,100,000 Arapahoe ........................... 3,900 3,900 1,005 3,910,000 ... ... ... ... Cheyenne........................... 24,200 21,600 970 20,900,000 11,400 11,400 1,195 13,600,000 Elbert ................................. 6,300 6,100 810 4,940,000 ... ... ... ... Kiowa ................................ 20,500 20,400 1,175 23,980,000 15,600 14,500 1,130 16,400,000 Kit Carson.......................... 47,100 46,900 1,620 75,880,000 25,600 24,800 1,025 25,400,000 Lincoln .............................. 14,100 13,800 845 11,680,000 4,900 4,900 920 4,520,000 Phillips............................... 5,600 5,600 1,575 8,820,000 4,100 2,900 1,655 4,800,000 Washington........................ 13,400 11,400 1,600 18,260,000 ... ... ... ... Yuma ................................. 10,600 8,600 1,805 15,520,000 5,600 5,600 1,980 11,100,000 Other counties....................
...
...
...
... 5,200 3,800 1,075 4,080,000
East Central 160,700 152,800 1,300 198,500,000 78,000 73,500 1,195 88,000,000 Dolores ..............................
...
... ... ... 2,300 1,700 770 1,310,000
Other counties....................
...
... ... ... 200 200 950 190,000Southwest
...
...
...
... 2,500 1,900 790 1,500,000
Baca................................... 16,800 16,200 1,400 22,650,000 9,300 8,900 990 8,800,000 Prowers.............................. 2,200 2,200 880 1,940,000 1,200 1,100 635 700,000 Other counties.................... 300 300 1,365 410,000 ... ... ... ...Southeast 19,300 18,700 1,335 25,000,000 10,500 10,000 950 9,500,000Combined Districts .............. 300 300 1,500 450,000
...
...
...
...
State Total 215,000 205,000 1,279 262,250,000 100,000 93,000 1,168 108,600,0001/ Other counties and districts include data not published to avoid disclosure of individual operations.
Pounds
NONE PRODUCED
1-4,999,999
5,000,000-9,999,999
10,000,000PLUS
ADAMS
ALAMOSA
ARAPAHOE
ARCHULETA
BACA
5
BENT
BOULDER
CHAFFEE
CHEYENNE
3
CLEARCREEK
CONEJOSCOSTILLA
CROWLEY
CUSTER
DELTA
DOLORES
DOUGLAS
EAGLE
ELBERT
EL PASO
FREMONT
GARFIELD
GIL-PIN
GRAND
GUNNISON
HINS-DALE
HUERFANO
JACKSON
JEF-FER-SON
KIOWA
2
KIT CARSON
1LAKE
LA PLATA
LARIMER
LAS ANIMAS
LINCOLN
LOGAN
MESA
MINERAL
MOFFAT
MONTEZUMA
MONTROSE
MORGAN
OTERO
OURAY
PARK
PHILLIPS
PITKIN
PROWERS
PUEBLO
RIO BLANCO
RIO GRANDE
ROUTT
SAGUACHE
SANJUAN
SAN MIGUEL
SEDGWICK
SUM-MIT
TEL-LER
WASHINGTON
WELD
YUMA
4
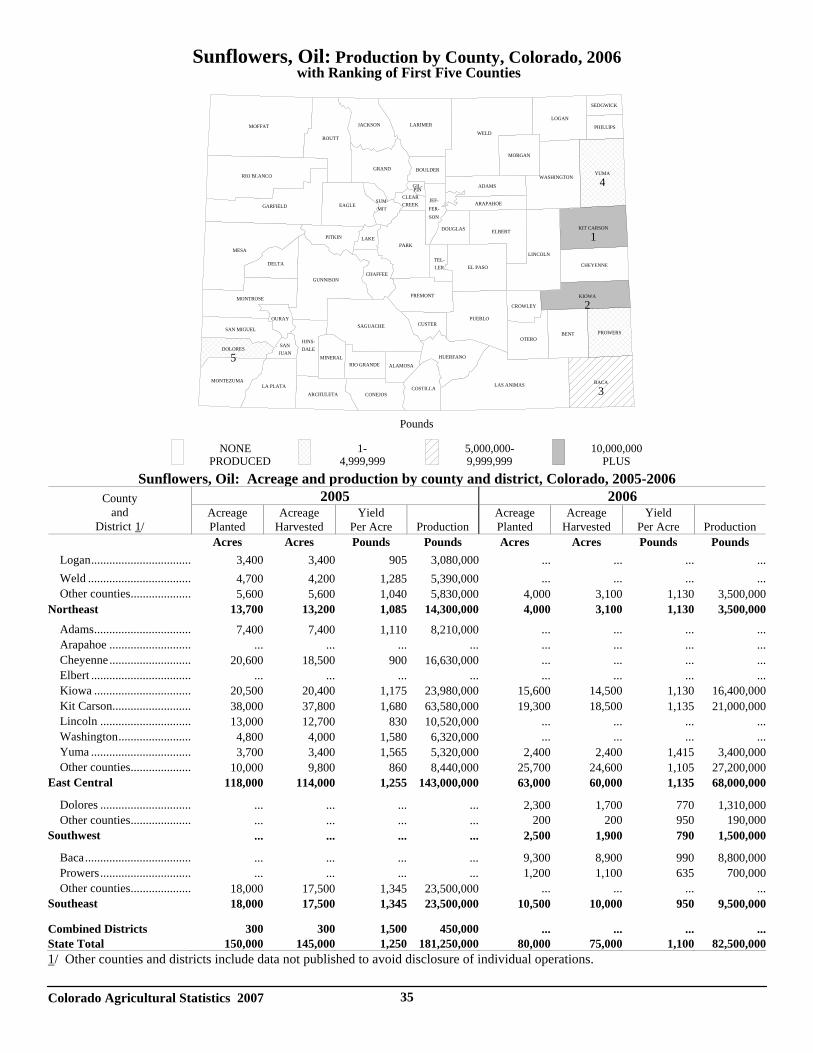
Colorado Agricultural Statistics 2007 35
Sunflowers, Oil: Production by County, Colorado, 2006 with Ranking of First Five Counties
Sunflowers, Oil: Acreage and production by county and district, Colorado, 2005-2006 2005 2006 County
and District 1/
Acreage Planted
Acreage Harvested
Yield Per Acre
Production
Acreage Planted
Acreage Harvested
Yield Per Acre
Production
Acres Acres Pounds Pounds Acres Acres Pounds Pounds Logan................................. 3,400 3,400 905 3,080,000 ... ... ... ... Weld .................................. 4,700 4,200 1,285 5,390,000 ... ... ... ... Other counties.................... 5,600 5,600 1,040 5,830,000 4,000 3,100 1,130 3,500,000Northeast 13,700 13,200 1,085 14,300,000 4,000 3,100 1,130 3,500,000
Adams................................ 7,400 7,400 1,110 8,210,000 ... ... ... ... Arapahoe ........................... ... ... ... ... ... ... ... ... Cheyenne........................... 20,600 18,500 900 16,630,000 ... ... ... ... Elbert ................................. ... ... ... ... ... ... ... ... Kiowa ................................ 20,500 20,400 1,175 23,980,000 15,600 14,500 1,130 16,400,000 Kit Carson.......................... 38,000 37,800 1,680 63,580,000 19,300 18,500 1,135 21,000,000 Lincoln .............................. 13,000 12,700 830 10,520,000 ... ... ... ... Washington........................ 4,800 4,000 1,580 6,320,000 ... ... ... ... Yuma ................................. 3,700 3,400 1,565 5,320,000 2,400 2,400 1,415 3,400,000 Other counties.................... 10,000 9,800 860 8,440,000 25,700 24,600 1,105 27,200,000East Central 118,000 114,000 1,255 143,000,000 63,000 60,000 1,135 68,000,000
Dolores .............................. ... ... ... ... 2,300 1,700 770 1,310,000 Other counties.................... ... ... ... ... 200 200 950 190,000Southwest ... ... ... ... 2,500 1,900 790 1,500,000
Baca................................... ... ... ... ... 9,300 8,900 990 8,800,000 Prowers.............................. ... ... ... ... 1,200 1,100 635 700,000 Other counties.................... 18,000 17,500 1,345 23,500,000 ... ... ... ...Southeast 18,000 17,500 1,345 23,500,000 10,500 10,000 950 9,500,000
Combined Districts 300 300 1,500 450,000 ... ... ... ...State Total 150,000 145,000 1,250 181,250,000 80,000 75,000 1,100 82,500,0001/ Other counties and districts include data not published to avoid disclosure of individual operations.
Pounds
NONE PRODUCED
1-4,999,999
5,000,000-9,999,999
10,000,000PLUS
ADAMS
ALAMOSA
ARAPAHOE
ARCHULETA
BACA
3
BENT
BOULDER
CHAFFEE
CHEYENNE
CLEARCREEK
CONEJOSCOSTILLA
CROWLEY
CUSTER
DELTA
DOLORES
5
DOUGLAS
EAGLE
ELBERT
EL PASO
FREMONT
GARFIELD
GIL-PIN
GRAND
GUNNISON
HINS-DALE
HUERFANO
JACKSON
JEF-FER-SON
KIOWA
2
KIT CARSON
1LAKE
LA PLATA
LARIMER
LAS ANIMAS
LINCOLN
LOGAN
MESA
MINERAL
MOFFAT
MONTEZUMA
MONTROSE
MORGAN
OTERO
OURAY
PARK
PHILLIPS
PITKIN
PROWERS
PUEBLO
RIO BLANCO
RIO GRANDE
ROUTT
SAGUACHE
SANJUAN
SAN MIGUEL
SEDGWICK
SUM-MIT
TEL-LER
WASHINGTON
WELD
YUMA
4
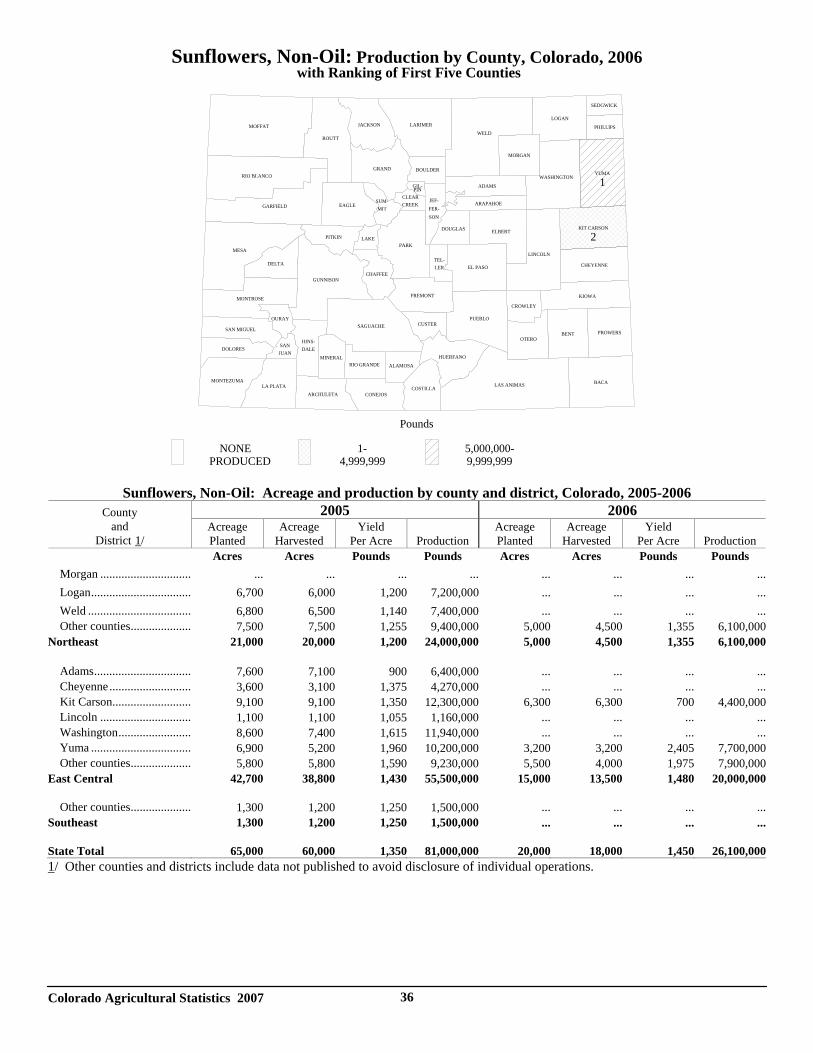
Colorado Agricultural Statistics 2007 36
Sunflowers, Non-Oil: Production by County, Colorado, 2006 with Ranking of First Five Counties
Sunflowers, Non-Oil: Acreage and production by county and district, Colorado, 2005-2006
2005 2006 County and
District 1/ Acreage Planted
Acreage Harvested
Yield Per Acre
Production
Acreage Planted
Acreage Harvested
Yield Per Acre
Production
Acres Acres Pounds Pounds Acres Acres Pounds Pounds Morgan .............................. ... ... ... ... ... ... ... ... Logan................................. 6,700 6,000 1,200 7,200,000 ... ... ... ... Weld .................................. 6,800 6,500 1,140 7,400,000 ... ... ... ... Other counties.................... 7,500 7,500 1,255 9,400,000 5,000 4,500 1,355 6,100,000Northeast
21,000 20,000 1,200 24,000,000 5,000 4,500 1,355 6,100,000
Adams................................ 7,600 7,100 900 6,400,000 ... ... ... ... Cheyenne........................... 3,600 3,100 1,375 4,270,000 ... ... ... ... Kit Carson.......................... 9,100 9,100 1,350 12,300,000 6,300 6,300 700 4,400,000 Lincoln .............................. 1,100 1,100 1,055 1,160,000 ... ... ... ... Washington........................ 8,600 7,400 1,615 11,940,000 ... ... ... ... Yuma ................................. 6,900 5,200 1,960 10,200,000 3,200 3,200 2,405 7,700,000 Other counties.................... 5,800 5,800 1,590 9,230,000 5,500 4,000 1,975 7,900,000East Central
42,700 38,800 1,430 55,500,000 15,000 13,500 1,480 20,000,000
Other counties.................... 1,300 1,200 1,250 1,500,000 ... ... ... ...Southeast
1,300 1,200 1,250 1,500,000 ... ... ... ...
State Total 65,000 60,000 1,350 81,000,000 20,000 18,000 1,450 26,100,0001/ Other counties and districts include data not published to avoid disclosure of individual operations.
Pounds
NONE PRODUCED
1-4,999,999
5,000,000-9,999,999
ADAMS
ALAMOSA
ARAPAHOE
ARCHULETA
BACA
BENT
BOULDER
CHAFFEE
CHEYENNE
CLEARCREEK
CONEJOSCOSTILLA
CROWLEY
CUSTER
DELTA
DOLORES
DOUGLAS
EAGLE
ELBERT
EL PASO
FREMONT
GARFIELD
GIL-PIN
GRAND
GUNNISON
HINS-DALE
HUERFANO
JACKSON
JEF-FER-SON
KIOWA
KIT CARSON
2LAKE
LA PLATA
LARIMER
LAS ANIMAS
LINCOLN
LOGAN
MESA
MINERAL
MOFFAT
MONTEZUMA
MONTROSE
MORGAN
OTERO
OURAY
PARK
PHILLIPS
PITKIN
PROWERS
PUEBLO
RIO BLANCO
RIO GRANDE
ROUTT
SAGUACHE
SANJUAN
SAN MIGUEL
SEDGWICK
SUM-MIT
TEL-LER
WASHINGTON
WELD
YUMA
1
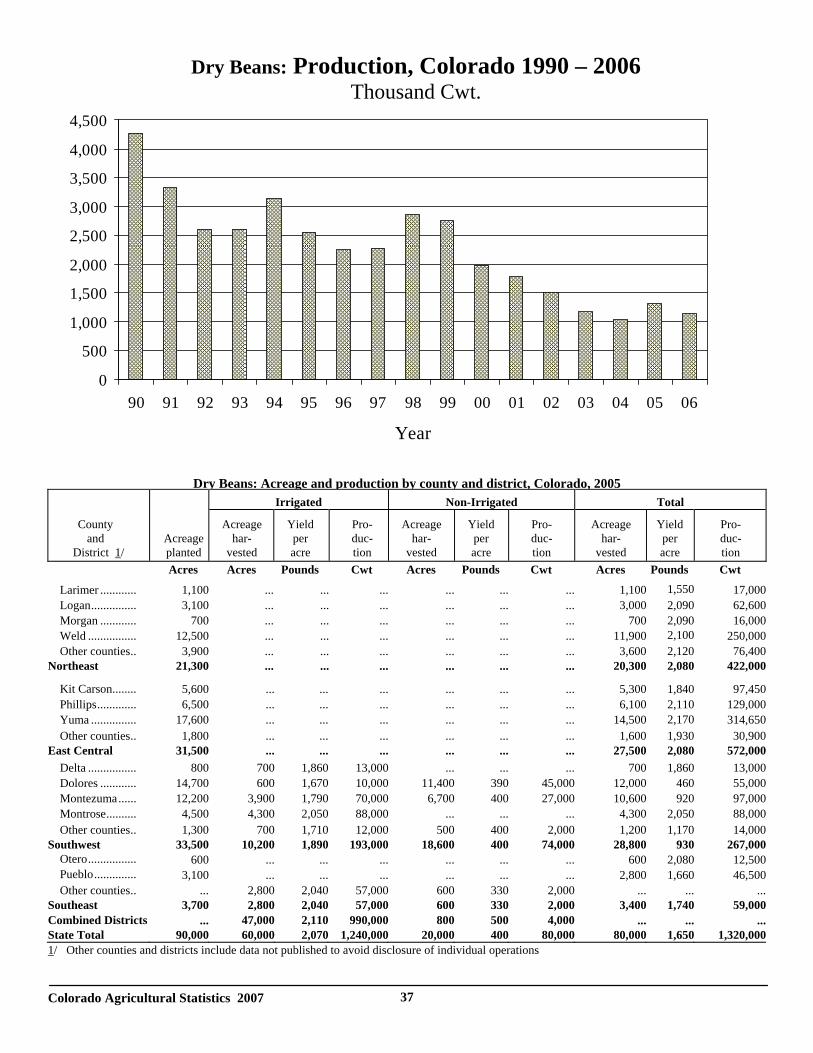
Colorado Agricultural Statistics 2007 37
Dry Beans: Acreage and production by county and district, Colorado, 2005
Irrigated
Non-Irrigated
Total
County and District 1/
Acreage planted
Acreage har- vested
Yield per acre
Pro- duc- tion
Acreage har- vested
Yield per acre
Pro- duc- tion
Acreage har- vested
Yield per acre
Pro- duc- tion
Acres
Acres
Pounds
Cwt
Acres
Pounds
Cwt
Acres
Pounds
Cwt
Larimer ............
1,100
...
...
...
...
...
...
1,100
1,550
17,000
Logan...............
3,100
...
...
...
...
...
...
3,000
2,090
62,600 Morgan ............
700
...
...
...
...
...
...
700
2,090
16,000
Weld ................
12,500
...
...
...
...
...
...
11,900
2,100
250,000 Other counties..
3,900
...
...
...
...
...
... 3,600 2,120 76,400
Northeast
21,300
...
...
...
...
...
...
20,300
2,080
422,000
Kit Carson........
5,600
...
...
...
...
...
...
5,300
1,840
97,450 Phillips.............
6,500
...
...
...
...
...
...
6,100
2,110
129,000
Yuma ...............
17,600
...
...
...
...
...
...
14,500 2,170
314,650 Other counties..
1,800
...
...
...
...
...
... 1,600 1,930 30,900
East Central
31,500
...
...
...
...
...
...
27,500
2,080
572,000 Delta ................
800
700
1,860
13,000
...
...
...
700
1,860
13,000
Dolores ............
14,700
600
1,670
10,000
11,400
390
45,000
12,000
460
55,000 Montezuma......
12,200
3,900
1,790
70,000
6,700
400
27,000
10,600
920
97,000
Montrose..........
4,500
4,300
2,050
88,000
...
...
...
4,300
2,050
88,000 Other counties..
1,300
700
1,710
12,000
500
400
2,000 1,200 1,170 14,000
Southwest
33,500
10,200
1,890
193,000
18,600
400
74,000
28,800
930
267,000 Otero................
600
...
...
...
...
...
...
600
2,080
12,500
Pueblo..............
3,100
...
...
...
...
...
...
2,800
1,660
46,500 Other counties..
...
2,800
2,040
57,000 600
330
2,000
...
...
...
Southeast
3,700
2,800
2,040
57,000
600
330
2,000
3,400
1,740
59,000Combined Districts
... 47,000 2,110 990,000 800 500 4,000
...
...
...
State Total
90,000
60,000
2,070
1,240,000
20,000
400
80,000
80,000
1,650
1,320,0001/ Other counties and districts include data not published to avoid disclosure of individual operations
Dry Beans: Production, Colorado 1990 – 2006 Thousand Cwt.
0
500
1,000
1,500
2,000
2,500
3,000
3,500
4,000
4,500
90 91 92 93 94 95 96 97 98 99 00 01 02 03 04 05 06
Year
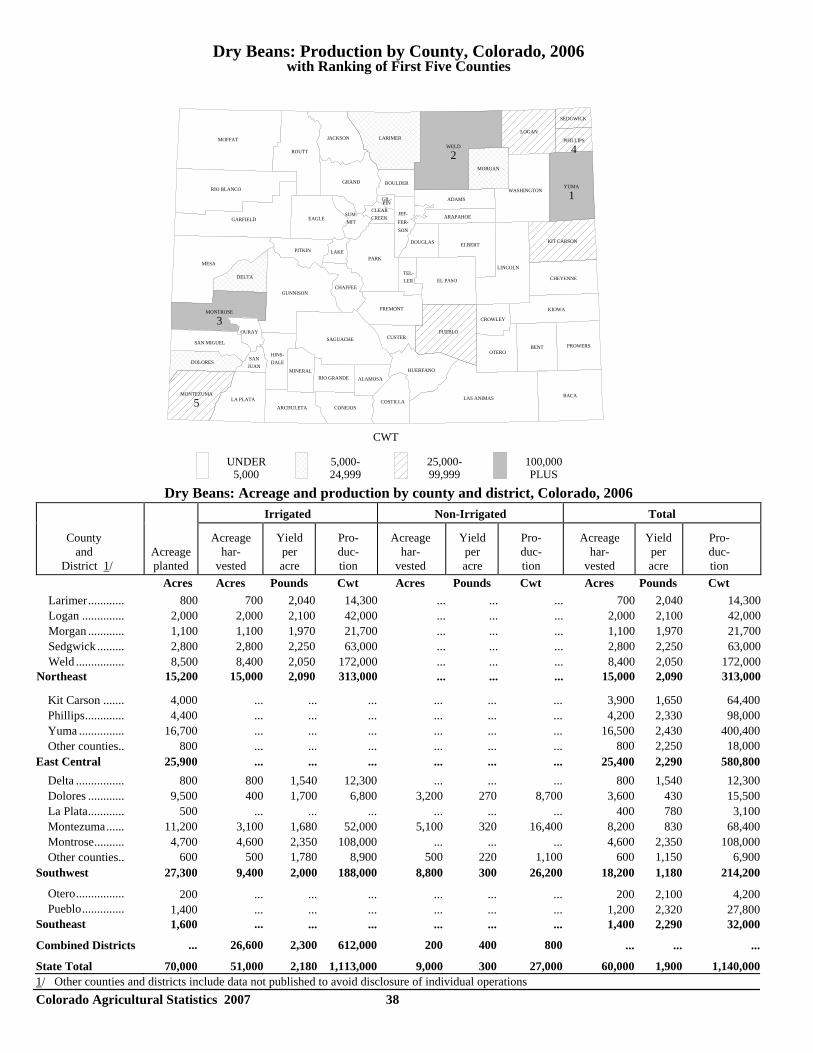
Dry Beans: Production by County, Colorado, 2006 with Ranking of First Five Counties
Dry Beans: Acreage and production by county and district, Colorado, 2006
Irrigated
Non-Irrigated
Total
County and District 1/
Acreage planted
Acreage har- vested
Yield per acre
Pro- duc- tion
Acreage har- vested
Yield per acre
Pro- duc- tion
Acreage har- vested
Yield per acre
Pro- duc- tion
Acres
Acres
Pounds
Cwt
Acres
Pounds
Cwt
Acres
Pounds Cwt
Larimer............
800
700
2,040
14,300
...
...
...
700
2,040
14,300 Logan ..............
2,000
2,000
2,100
42,000
...
...
...
2,000
2,100
42,000
Morgan ............
1,100
1,100
1,970
21,700
...
...
...
1,100
1,970
21,700 Sedgwick .........
2,800
2,800
2,250
63,000
...
...
...
2,800
2,250
63,000
Weld ................
8,500
8,400
2,050
172,000
...
...
...
8,400
2,050
172,000 Northeast
15,200
15,000
2,090
313,000
...
...
...
15,000
2,090
313,000
Kit Carson .......
4,000
...
...
...
...
...
...
3,900
1,650
64,400
Phillips.............
4,400
...
...
...
...
...
...
4,200
2,330
98,000 Yuma ...............
16,700
...
...
...
...
...
...
16,500
2,430
400,400
Other counties..
800
...
...
...
...
...
... 800 2,250 18,000 East Central
25,900
...
...
...
...
...
...
25,400
2,290
580,800
Delta ................
800
800
1,540
12,300
...
...
...
800
1,540
12,300 Dolores ............
9,500
400
1,700
6,800
3,200
270
8,700
3,600
430
15,500
La Plata............
500
...
...
...
...
...
...
400
780
3,100 Montezuma......
11,200
3,100
1,680
52,000
5,100
320
16,400
8,200
830
68,400
Montrose..........
4,700
4,600
2,350
108,000
...
...
...
4,600
2,350
108,000 Other counties.. 600 500 1,780 8,900 500 220 1,100 600 1,150 6,900
Southwest
27,300
9,400
2,000
188,000
8,800
300
26,200
18,200
1,180
214,200
Otero................
200
...
...
...
...
...
...
200
2,100
4,200 Pueblo..............
1,400
...
...
...
...
...
...
1,200
2,320
27,800
Southeast
1,600 ...
...
...
...
...
...
1,400
2,290
32,000 Combined Districts ... 26,600 2,300 612,000 200 400 800
...
...
...
State Total
70,000
51,000
2,180
1,113,000
9,000
300
27,000
60,000
1,900
1,140,000
1/ Other counties and districts include data not published to avoid disclosure of individual operations Colorado Agricultural Statistics 2007 38
CWT
UNDER5,000
5,000-24,999
25,000-99,999
100,000PLUS
ADAMS
ALAMOSA
ARAPAHOE
ARCHULETA
BACA
BENT
BOULDER
CHAFFEE
CHEYENNE
CLEARCREEK
CONEJOSCOSTILLA
CROWLEY
CUSTER
DELTA
DOLORES
DOUGLAS
EAGLE
ELBERT
EL PASO
FREMONT
GARFIELD
GIL-PIN
GRAND
GUNNISON
HINS-DALE
HUERFANO
JACKSON
JEF-FER-SON
KIOWA
KIT CARSON
LAKE
LA PLATA
LARIMER
LAS ANIMAS
LINCOLN
LOGAN
MESA
MINERAL
MOFFAT
MONTEZUMA
5
MONTROSE
3
MORGAN
OTERO
OURAY
PARK
PHILLIPS
4
PITKIN
PROWERS
PUEBLO
RIO BLANCO
RIO GRANDE
ROUTT
SAGUACHE
SANJUAN
SAN MIGUEL
SEDGWICK
SUM-MIT
TEL-LER
WASHINGTON
WELD
2
YUMA
1
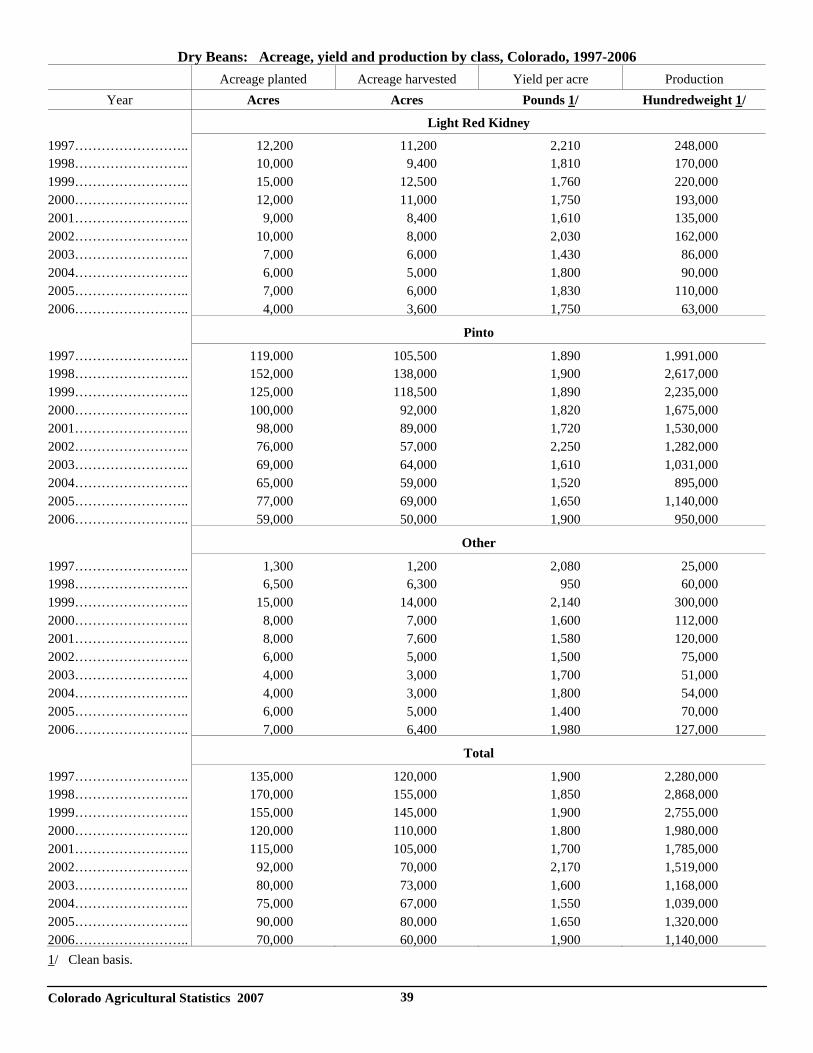
Colorado Agricultural Statistics 2007 39
Dry Beans: Acreage, yield and production by class, Colorado, 1997-2006 Acreage planted Acreage harvested Yield per acre Production
Year Acres Acres Pounds 1/ Hundredweight 1/
Light Red Kidney
1997…………………….. 12,200 11,200 2,210 248,0001998…………………….. 10,000 9,400 1,810 170,0001999…………………….. 15,000 12,500 1,760 220,0002000…………………….. 12,000 11,000 1,750 193,0002001…………………….. 9,000 8,400 1,610 135,0002002…………………….. 10,000 8,000 2,030 162,0002003…………………….. 7,000 6,000 1,430 86,0002004…………………….. 6,000 5,000 1,800 90,0002005…………………….. 7,000 6,000 1,830 110,0002006…………………….. 4,000 3,600 1,750 63,000
Pinto
1997…………………….. 119,000 105,500 1,890 1,991,0001998…………………….. 152,000 138,000 1,900 2,617,0001999…………………….. 125,000 118,500 1,890 2,235,0002000…………………….. 100,000 92,000 1,820 1,675,0002001…………………….. 98,000 89,000 1,720 1,530,0002002…………………….. 76,000 57,000 2,250 1,282,0002003…………………….. 69,000 64,000 1,610 1,031,0002004…………………….. 65,000 59,000 1,520 895,0002005…………………….. 77,000 69,000 1,650 1,140,0002006…………………….. 59,000 50,000 1,900 950,000
Other
1997…………………….. 1,300 1,200 2,080 25,0001998…………………….. 6,500 6,300 950 60,0001999…………………….. 15,000 14,000 2,140 300,0002000…………………….. 8,000 7,000 1,600 112,0002001…………………….. 8,000 7,600 1,580 120,0002002…………………….. 6,000 5,000 1,500 75,0002003…………………….. 4,000 3,000 1,700 51,0002004…………………….. 4,000 3,000 1,800 54,0002005…………………….. 6,000 5,000 1,400 70,0002006…………………….. 7,000 6,400 1,980 127,000
Total
1997…………………….. 135,000 120,000 1,900 2,280,0001998…………………….. 170,000 155,000 1,850 2,868,0001999…………………….. 155,000 145,000 1,900 2,755,0002000…………………….. 120,000 110,000 1,800 1,980,0002001…………………….. 115,000 105,000 1,700 1,785,0002002…………………….. 92,000 70,000 2,170 1,519,0002003…………………….. 80,000 73,000 1,600 1,168,0002004…………………….. 75,000 67,000 1,550 1,039,0002005…………………….. 90,000 80,000 1,650 1,320,0002006…………………….. 70,000 60,000 1,900 1,140,0001/ Clean basis.
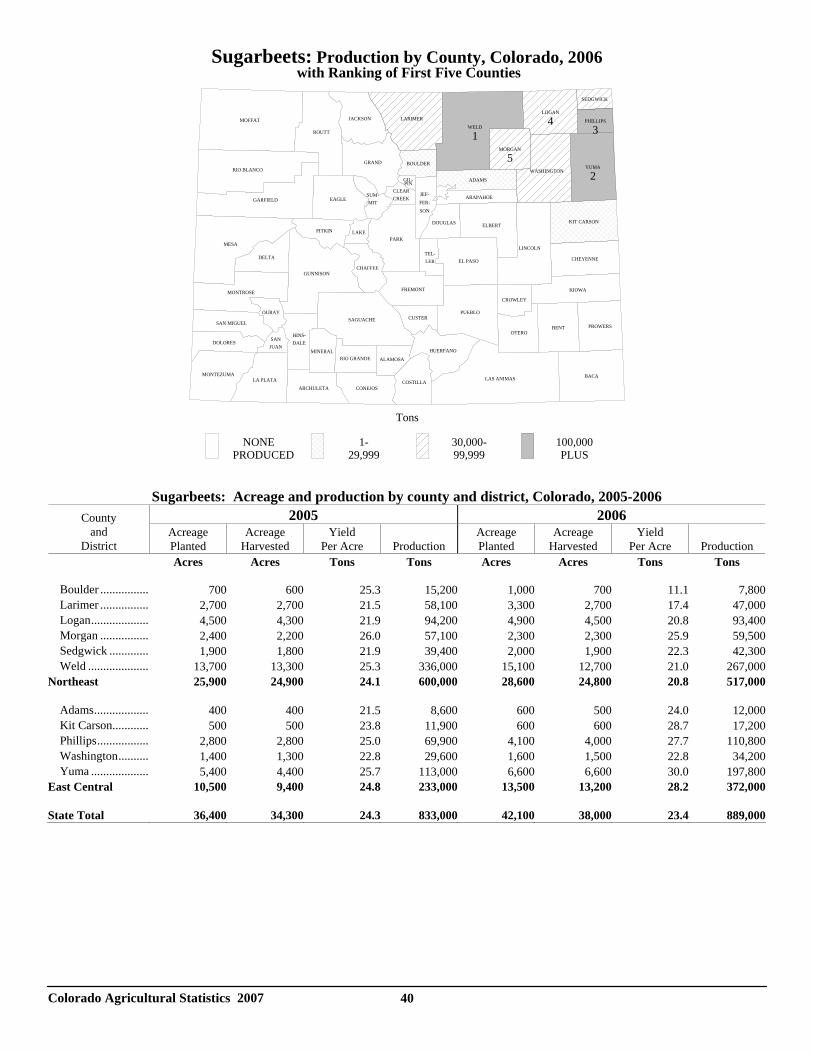
Colorado Agricultural Statistics 2007 40
Sugarbeets: Production by County, Colorado, 2006 with Ranking of First Five Counties
Tons
NONE PRODUCED
1-29,999
30,000-99,999
100,000PLUS
ADAMS
ALAMOSA
ARAPAHOE
ARCHULETA
BACA
BENT
BOULDER
CHAFFEE
CHEYENNE
CLEARCREEK
CONEJOSCOSTILLA
CROWLEY
CUSTER
DELTA
DOLORES
DOUGLAS
EAGLE
ELBERT
EL PASO
FREMONT
GARFIELD
GIL-PIN
GRAND
GUNNISON
HINS-DALE
HUERFANO
JACKSON
JEF-FER-SON
KIOWA
KIT CARSON
LAKE
LA PLATA
LARIMER
LAS ANIMAS
LINCOLN
LOGAN
4
MESA
MINERAL
MOFFAT
MONTEZUMA
MONTROSE
MORGAN
5
OTERO
OURAY
PARK
PHILLIPS
3
PITKIN
PROWERS
PUEBLO
RIO BLANCO
RIO GRANDE
ROUTT
SAGUACHE
SANJUAN
SAN MIGUEL
SEDGWICK
SUM-MIT
TEL-LER
WASHINGTON
WELD
1
YUMA
2
Sugarbeets: Acreage and production by county and district, Colorado, 2005-2006 2005 2006 County
and District
Acreage Planted
Acreage Harvested
Yield Per Acre
Production
Acreage Planted
Acreage Harvested
Yield Per Acre
Production
Acres Acres Tons Tons Acres Acres Tons Tons
Boulder ................. 700 600 25.3 15,200 1,000 700 11.1 7,800 Larimer ................. 2,700 2,700 21.5 58,100 3,300 2,700 17.4 47,000 Logan.................... 4,500 4,300 21.9 94,200 4,900 4,500 20.8 93,400 Morgan ................. 2,400 2,200 26.0 57,100 2,300 2,300 25.9 59,500 Sedgwick .............. 1,900 1,800 21.9 39,400 2,000 1,900 22.3 42,300 Weld ..................... 13,700 13,300 25.3 336,000 15,100 12,700 21.0 267,000Northeast
25,900 24,900 24.1 600,000 28,600 24,800 20.8 517,000
Adams................... 400 400 21.5 8,600 600 500 24.0 12,000 Kit Carson............. 500 500 23.8 11,900 600 600 28.7 17,200 Phillips.................. 2,800 2,800 25.0 69,900 4,100 4,000 27.7 110,800 Washington........... 1,400 1,300 22.8 29,600 1,600 1,500 22.8 34,200 Yuma .................... 5,400 4,400 25.7 113,000 6,600 6,600 30.0 197,800East Central
10,500 9,400 24.8 233,000 13,500 13,200 28.2 372,000
State Total 36,400 34,300 24.3 833,000 42,100 38,000 23.4 889,000
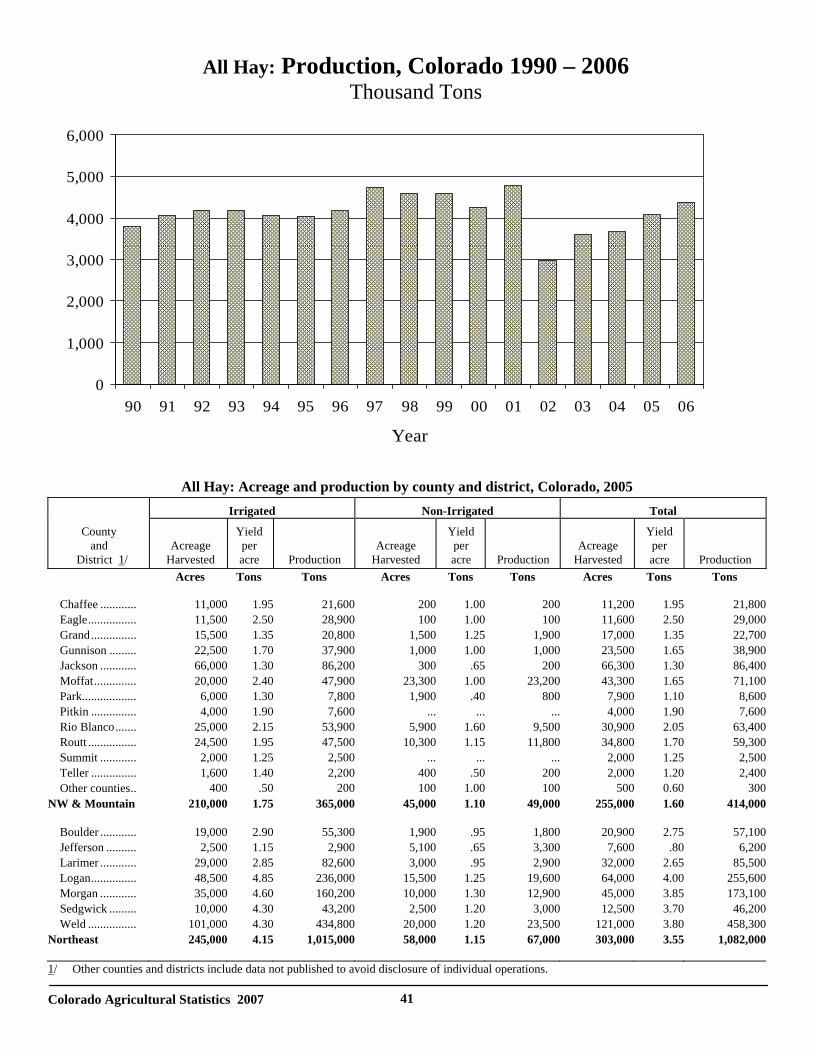
Colorado Agricultural Statistics 2007 41
All Hay: Acreage and production by county and district, Colorado, 2005
Irrigated
Non-Irrigated
Total
County and District 1/
Acreage Harvested
Yield per acre
Production
Acreage Harvested
Yield per acre
Production
Acreage Harvested
Yield per acre
Production
Acres
Tons
Tons
Acres
Tons
Tons
Acres
Tons Tons
Chaffee ............
11,000
1.95
21,600
200
1.00
200
11,200
1.95
21,800
Eagle................
11,500
2.50
28,900
100
1.00
100
11,600
2.50
29,000 Grand...............
15,500
1.35
20,800
1,500
1.25
1,900
17,000
1.35
22,700
Gunnison .........
22,500
1.70
37,900
1,000
1.00
1,000
23,500
1.65
38,900 Jackson ............
66,000
1.30
86,200
300
.65
200
66,300
1.30
86,400
Moffat..............
20,000
2.40
47,900
23,300
1.00
23,200
43,300
1.65
71,100 Park..................
6,000
1.30
7,800
1,900
.40
800
7,900
1.10
8,600
Pitkin ...............
4,000
1.90
7,600
...
...
...
4,000
1.90
7,600 Rio Blanco.......
25,000
2.15
53,900
5,900
1.60
9,500
30,900
2.05
63,400
Routt ................
24,500
1.95
47,500
10,300
1.15
11,800
34,800
1.70
59,300 Summit ............
2,000
1.25
2,500
...
...
...
2,000
1.25
2,500
Teller ...............
1,600
1.40
2,200
400
.50
200
2,000
1.20
2,400 Other counties.. 400 .50 200 100 1.00 100 500 0.60 300
NW & Mountain
210,000
1.75
365,000
45,000
1.10
49,000
255,000
1.60
414,000
Boulder ............
19,000
2.90
55,300
1,900
.95
1,800
20,900
2.75
57,100
Jefferson ..........
2,500
1.15
2,900
5,100
.65
3,300
7,600
.80
6,200 Larimer ............
29,000
2.85
82,600
3,000
.95
2,900
32,000
2.65
85,500
Logan...............
48,500
4.85
236,000
15,500
1.25
19,600
64,000
4.00
255,600 Morgan ............
35,000
4.60
160,200
10,000
1.30
12,900
45,000
3.85
173,100
Sedgwick .........
10,000
4.30
43,200
2,500
1.20
3,000
12,500
3.70
46,200 Weld ................
101,000
4.30
434,800
20,000
1.20
23,500
121,000
3.80
458,300
Northeast
245,000
4.15
1,015,000
58,000
1.15
67,000
303,000
3.55
1,082,000
1/ Other counties and districts include data not published to avoid disclosure of individual operations.
All Hay: Production, Colorado 1990 – 2006 Thousand Tons
0
1,000
2,000
3,000
4,000
5,000
6,000
90 91 92 93 94 95 96 97 98 99 00 01 02 03 04 05 06
Year
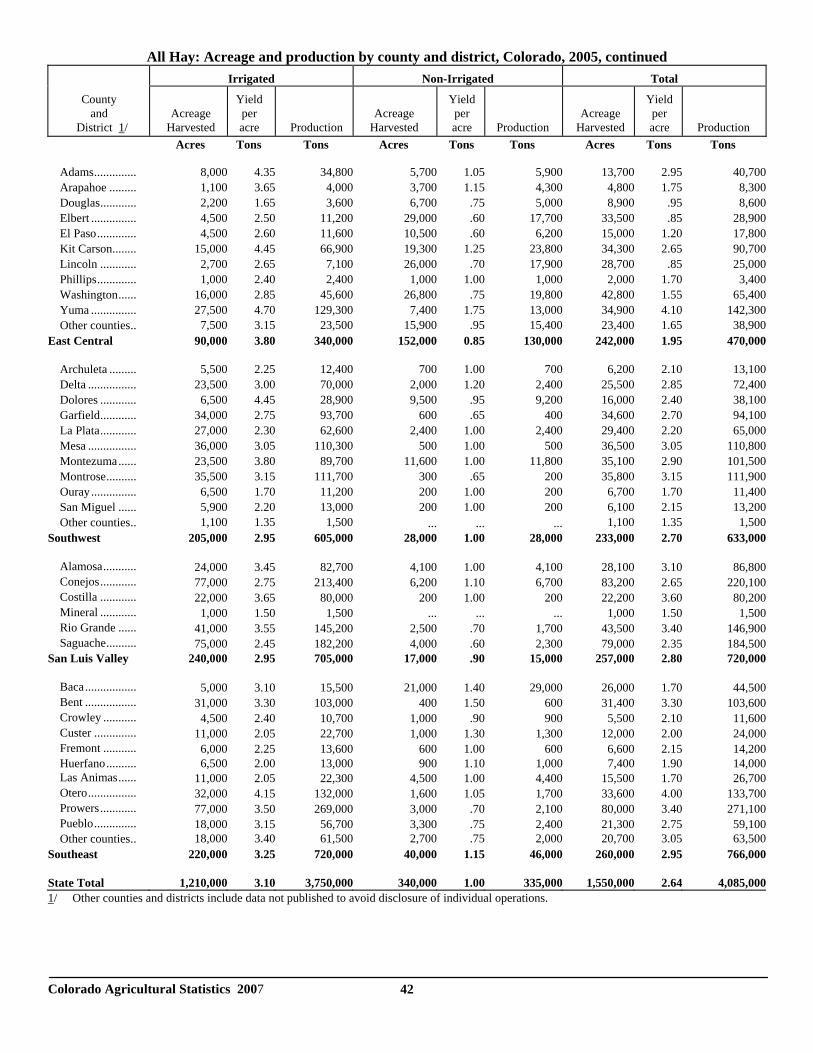
Colorado Agricultural Statistics 2007 42
All Hay: Acreage and production by county and district, Colorado, 2005, continued
Irrigated
Non-Irrigated
Total
County and District 1/
Acreage Harvested
Yield per acre
Production
Acreage Harvested
Yield per acre
Production
Acreage Harvested
Yield per acre
Production
Acres
Tons
Tons
Acres
Tons
Tons
Acres
Tons Tons
Adams..............
8,000
4.35
34,800
5,700
1.05
5,900
13,700
2.95
40,700
Arapahoe .........
1,100
3.65
4,000
3,700
1.15
4,300
4,800
1.75
8,300 Douglas............
2,200
1.65
3,600
6,700
.75
5,000
8,900
.95
8,600
Elbert ...............
4,500
2.50
11,200
29,000
.60
17,700
33,500
.85
28,900 El Paso.............
4,500
2.60
11,600
10,500
.60
6,200
15,000
1.20
17,800
Kit Carson........
15,000
4.45
66,900
19,300
1.25
23,800
34,300
2.65
90,700 Lincoln ............
2,700
2.65
7,100
26,000
.70
17,900
28,700
.85
25,000
Phillips.............
1,000
2.40
2,400
1,000 1.00
1,000
2,000
1.70
3,400
Washington......
16,000
2.85
45,600
26,800
.75
19,800
42,800
1.55
65,400 Yuma ...............
27,500
4.70
129,300
7,400
1.75
13,000
34,900
4.10
142,300
Other counties.. 7,500 3.15 23,500 15,900 .95 15,400 23,400 1.65 38,900 East Central
90,000
3.80
340,000
152,000
0.85
130,000
242,000
1.95
470,000
Archuleta .........
5,500
2.25
12,400
700
1.00
700
6,200
2.10
13,100
Delta ................
23,500 3.00
70,000
2,000
1.20
2,400
25,500
2.85
72,400
Dolores ............
6,500
4.45
28,900
9,500
.95
9,200
16,000
2.40
38,100 Garfield............
34,000
2.75
93,700
600
.65
400
34,600
2.70
94,100
La Plata............
27,000
2.30
62,600
2,400 1.00
2,400
29,400
2.20
65,000
Mesa ................
36,000
3.05
110,300
500 1.00
500
36,500
3.05
110,800
Montezuma......
23,500
3.80
89,700
11,600 1.00
11,800
35,100
2.90
101,500
Montrose..........
35,500
3.15
111,700
300
.65
200
35,800
3.15
111,900 Ouray...............
6,500
1.70
11,200
200
1.00
200
6,700
1.70
11,400
San Miguel ......
5,900
2.20
13,000
200 1.00
200
6,100
2.15
13,200
Other counties.. 1,100 1.35 1,500
...
...
... 1,100 1.35 1,500 Southwest
205,000
2.95
605,000
28,000
1.00
28,000
233,000
2.70
633,000
Alamosa...........
24,000
3.45
82,700
4,100
1.00
4,100
28,100
3.10
86,800
Conejos............
77,000
2.75
213,400
6,200
1.10
6,700
83,200
2.65
220,100 Costilla ............
22,000
3.65
80,000
200
1.00
200
22,200
3.60
80,200
Mineral ............
1,000
1.50
1,500
...
...
...
1,000
1.50
1,500 Rio Grande ......
41,000
3.55
145,200
2,500
.70
1,700
43,500
3.40
146,900
Saguache..........
75,000
2.45
182,200
4,000
.60
2,300
79,000
2.35
184,500 San Luis Valley
240,000
2.95
705,000
17,000
.90
15,000
257,000
2.80
720,000
Baca.................
5,000
3.10
15,500
21,000
1.40
29,000
26,000
1.70
44,500
Bent .................
31,000
3.30
103,000
400
1.50
600
31,400
3.30
103,600 Crowley ...........
4,500
2.40
10,700
1,000
.90
900
5,500
2.10
11,600
Custer ..............
11,000
2.05
22,700
1,000
1.30
1,300
12,000 2.00
24,000
Fremont ...........
6,000
2.25
13,600
600 1.00
600
6,600
2.15
14,200
Huerfano..........
6,500 2.00
13,000 900 1.10 1,000 7,400
1.90 14,000
Las Animas......
11,000
2.05
22,300
4,500 1.00
4,400
15,500
1.70
26,700
Otero................
32,000
4.15
132,000
1,600
1.05
1,700
33,600 4.00
133,700
Prowers............
77,000
3.50
269,000
3,000
.70
2,100
80,000
3.40
271,100 Pueblo..............
18,000
3.15
56,700
3,300
.75
2,400
21,300
2.75
59,100
Other counties.. 18,000 3.40 61,500 2,700 .75 2,000 20,700 3.05 63,500 Southeast
220,000
3.25
720,000
40,000
1.15
46,000
260,000
2.95
766,000
State Total
1,210,000
3.10
3,750,000
340,000
1.00
335,000
1,550,000
2.64
4,085,000
1/ Other counties and districts include data not published to avoid disclosure of individual operations.
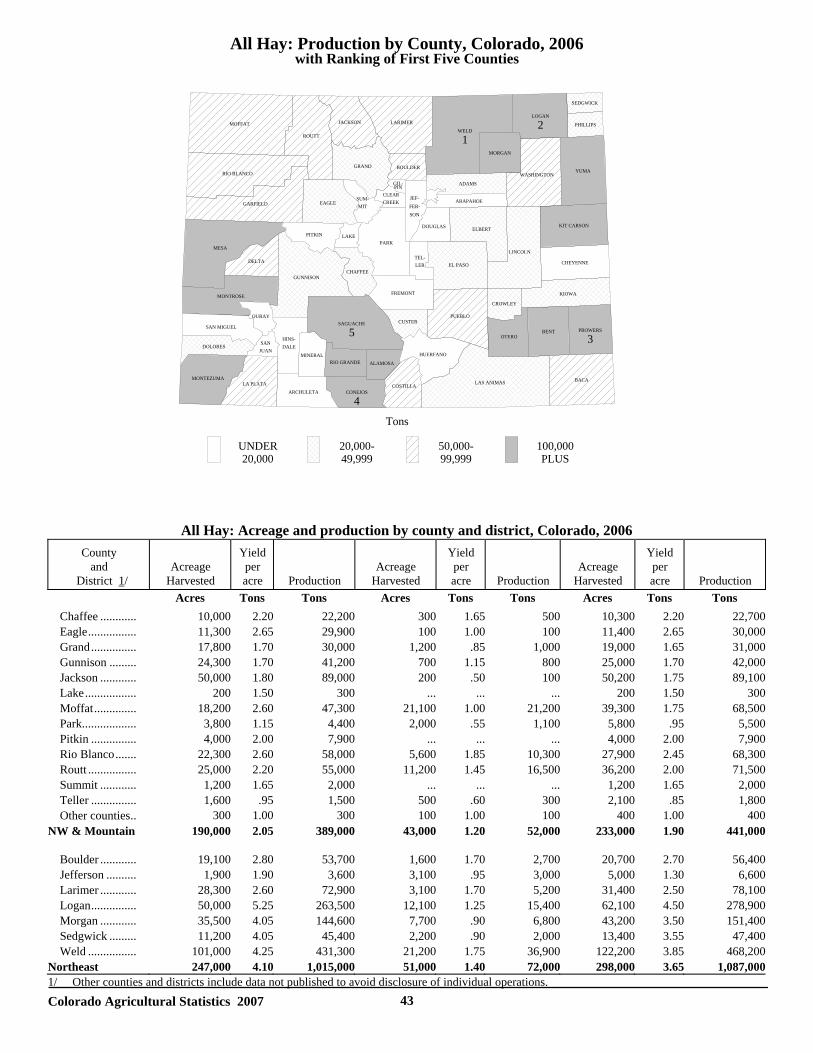
Colorado Agricultural Statistics 2007 43
All Hay: Production by County, Colorado, 2006 with Ranking of First Five Counties
All Hay: Acreage and production by county and district, Colorado, 2006 County and District 1/
Acreage Harvested
Yield per acre
Production
Acreage Harvested
Yield per acre
Production
Acreage Harvested
Yield per acre
Production
Acres
Tons
Tons
Acres
Tons
Tons
Acres
Tons Tons
Chaffee ............
10,000
2.20
22,200
300
1.65
500
10,300
2.20
22,700 Eagle................
11,300
2.65
29,900
100
1.00
100
11,400
2.65
30,000
Grand...............
17,800
1.70
30,000
1,200
.85
1,000
19,000
1.65
31,000 Gunnison .........
24,300
1.70
41,200
700
1.15
800
25,000
1.70
42,000
Jackson ............
50,000
1.80
89,000
200
.50
100
50,200
1.75
89,100 Lake.................
200
1.50
300
...
...
...
200
1.50
300
Moffat..............
18,200
2.60
47,300
21,100
1.00
21,200
39,300
1.75
68,500 Park..................
3,800
1.15
4,400
2,000
.55
1,100
5,800
.95
5,500
Pitkin ...............
4,000 2.00
7,900
...
...
...
4,000
2.00
7,900
Rio Blanco.......
22,300
2.60
58,000
5,600
1.85
10,300
27,900
2.45
68,300 Routt ................
25,000
2.20
55,000
11,200
1.45
16,500
36,200
2.00
71,500
Summit ............
1,200
1.65
2,000
...
...
...
1,200
1.65
2,000 Teller ...............
1,600
.95
1,500
500
.60
300
2,100
.85
1,800
Other counties.. 300 1.00 300 100 1.00 100 400 1.00 400 NW & Mountain
190,000
2.05
389,000
43,000
1.20
52,000
233,000
1.90
441,000
Boulder ............
19,100
2.80
53,700
1,600
1.70
2,700
20,700
2.70
56,400
Jefferson ..........
1,900
1.90
3,600
3,100
.95
3,000
5,000
1.30
6,600 Larimer ............
28,300
2.60
72,900
3,100
1.70
5,200
31,400
2.50
78,100
Logan...............
50,000
5.25
263,500
12,100
1.25
15,400
62,100
4.50
278,900 Morgan ............
35,500
4.05
144,600
7,700
.90
6,800
43,200
3.50
151,400
Sedgwick .........
11,200
4.05
45,400
2,200
.90
2,000
13,400
3.55
47,400 Weld ................
101,000
4.25
431,300
21,200
1.75
36,900
122,200
3.85
468,200
Northeast
247,000
4.10
1,015,000
51,000
1.40
72,000
298,000
3.65
1,087,0001/ Other counties and districts include data not published to avoid disclosure of individual operations.
Tons
UNDER20,000
20,000-49,999
50,000-99,999
100,000PLUS
ADAMS
ALAMOSA
ARAPAHOE
ARCHULETA
BACA
BENT
BOULDER
CHAFFEE
CHEYENNE
CLEARCREEK
CONEJOS
4COSTILLA
CROWLEY
CUSTER
DELTA
DOLORES
DOUGLAS
EAGLE
ELBERT
EL PASO
FREMONT
GARFIELD
GIL-PIN
GRAND
GUNNISON
HINS-DALE
HUERFANO
JACKSON
JEF-FER-SON
KIOWA
KIT CARSON
LAKE
LA PLATA
LARIMER
LAS ANIMAS
LINCOLN
LOGAN
2
MESA
MINERAL
MOFFAT
MONTEZUMA
MONTROSE
MORGAN
OTERO
OURAY
PARK
PHILLIPS
PITKIN
PROWERS
3
PUEBLO
RIO BLANCO
RIO GRANDE
ROUTT
SAGUACHE
5SAN
JUAN
SAN MIGUEL
SEDGWICK
SUM-MIT
TEL-LER
WASHINGTON
WELD
1
YUMA
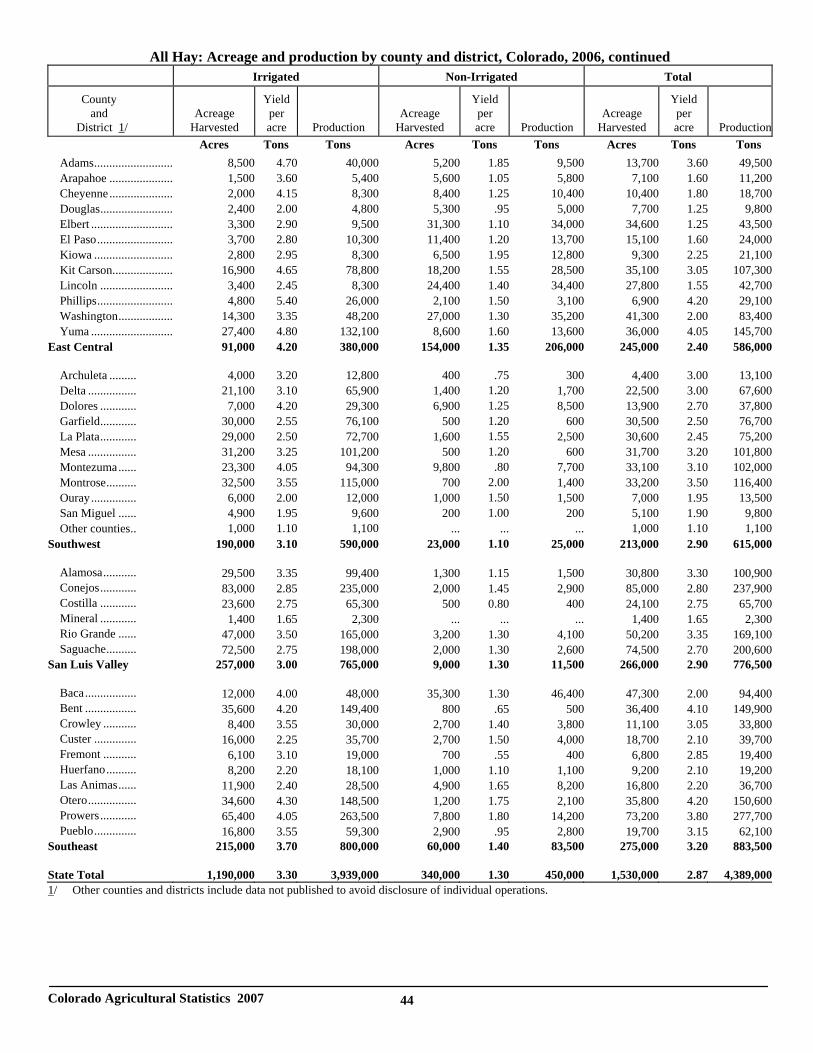
Colorado Agricultural Statistics 2007 44
All Hay: Acreage and production by county and district, Colorado, 2006, continued
Irrigated
Non-Irrigated
Total
County and District 1/
Acreage Harvested
Yield per acre
Production
Acreage Harvested
Yield per acre
Production
Acreage Harvested
Yield per acre
Production
Acres
Tons
Tons
Acres
Tons
Tons
Acres
Tons Tons
Adams..........................
8,500
4.70
40,000
5,200
1.85
9,500
13,700
3.60
49,500 Arapahoe .....................
1,500
3.60
5,400
5,600
1.05
5,800
7,100
1.60
11,200
Cheyenne.....................
2,000
4.15
8,300
8,400
1.25
10,400
10,400
1.80
18,700 Douglas........................
2,400
2.00
4,800
5,300
.95
5,000
7,700
1.25
9,800
Elbert ...........................
3,300
2.90
9,500
31,300
1.10
34,000
34,600
1.25
43,500 El Paso.........................
3,700
2.80
10,300
11,400
1.20
13,700
15,100
1.60
24,000
Kiowa ..........................
2,800
2.95
8,300
6,500
1.95
12,800
9,300
2.25
21,100 Kit Carson....................
16,900
4.65
78,800
18,200
1.55
28,500
35,100
3.05
107,300
Lincoln ........................
3,400
2.45
8,300
24,400
1.40
34,400
27,800
1.55
42,700 Phillips.........................
4,800
5.40
26,000
2,100
1.50
3,100
6,900
4.20
29,100
Washington..................
14,300
3.35
48,200
27,000
1.30
35,200
41,300
2.00
83,400 Yuma ...........................
27,400
4.80
132,100
8,600
1.60
13,600
36,000
4.05
145,700
East Central
91,000
4.20
380,000
154,000
1.35
206,000
245,000
2.40
586,000
Archuleta .........
4,000
3.20
12,800
400
.75
300
4,400
3.00
13,100
Delta ................
21,100
3.10
65,900
1,400 1.20
1,700
22,500
3.00
67,600 Dolores ............
7,000
4.20
29,300
6,900 1.25
8,500
13,900
2.70
37,800
Garfield............
30,000
2.55
76,100
500 1.20
600
30,500
2.50
76,700 La Plata............
29,000
2.50
72,700
1,600 1.55
2,500
30,600
2.45
75,200
Mesa ................
31,200
3.25
101,200
500 1.20
600
31,700
3.20
101,800 Montezuma......
23,300
4.05
94,300
9,800 .80
7,700
33,100
3.10
102,000
Montrose..........
32,500
3.55
115,000
700 2.00
1,400
33,200
3.50
116,400 Ouray...............
6,000
2.00
12,000
1,000 1.50
1,500
7,000
1.95
13,500
San Miguel ......
4,900
1.95
9,600
200 1.00
200
5,100
1.90
9,800 Other counties.. 1,000 1.10 1,100
...
...
... 1,000 1.10 1,100
Southwest
190,000
3.10
590,000
23,000 1.10
25,000
213,000
2.90
615,000
Alamosa...........
29,500
3.35
99,400
1,300
1.15
1,500
30,800
3.30
100,900
Conejos............
83,000
2.85
235,000
2,000
1.45
2,900
85,000
2.80
237,900 Costilla ............
23,600
2.75
65,300
500
0.80
400
24,100
2.75
65,700
Mineral ............
1,400
1.65
2,300
...
...
...
1,400
1.65
2,300 Rio Grande ......
47,000
3.50
165,000
3,200
1.30
4,100
50,200
3.35
169,100
Saguache..........
72,500
2.75
198,000
2,000
1.30
2,600
74,500
2.70
200,600 San Luis Valley
257,000
3.00
765,000
9,000
1.30
11,500
266,000
2.90
776,500
Baca.................
12,000
4.00
48,000
35,300
1.30
46,400
47,300
2.00
94,400
Bent .................
35,600
4.20
149,400
800
.65
500
36,400
4.10
149,900 Crowley ...........
8,400
3.55
30,000
2,700
1.40
3,800
11,100
3.05
33,800
Custer ..............
16,000
2.25
35,700
2,700
1.50
4,000
18,700
2.10
39,700 Fremont ...........
6,100
3.10
19,000
700
.55
400
6,800
2.85
19,400
Huerfano..........
8,200
2.20
18,100
1,000
1.10
1,100
9,200
2.10
19,200 Las Animas......
11,900
2.40
28,500
4,900
1.65
8,200
16,800
2.20
36,700
Otero................
34,600
4.30
148,500
1,200
1.75
2,100
35,800
4.20
150,600 Prowers............
65,400
4.05
263,500
7,800
1.80
14,200
73,200
3.80
277,700
Pueblo..............
16,800
3.55
59,300
2,900
.95
2,800
19,700
3.15
62,100 Southeast
215,000
3.70
800,000
60,000
1.40
83,500
275,000
3.20
883,500
State Total
1,190,000
3.30
3,939,000
340,000
1.30
450,000
1,530,000
2.87
4,389,000
1/ Other counties and districts include data not published to avoid disclosure of individual operations.
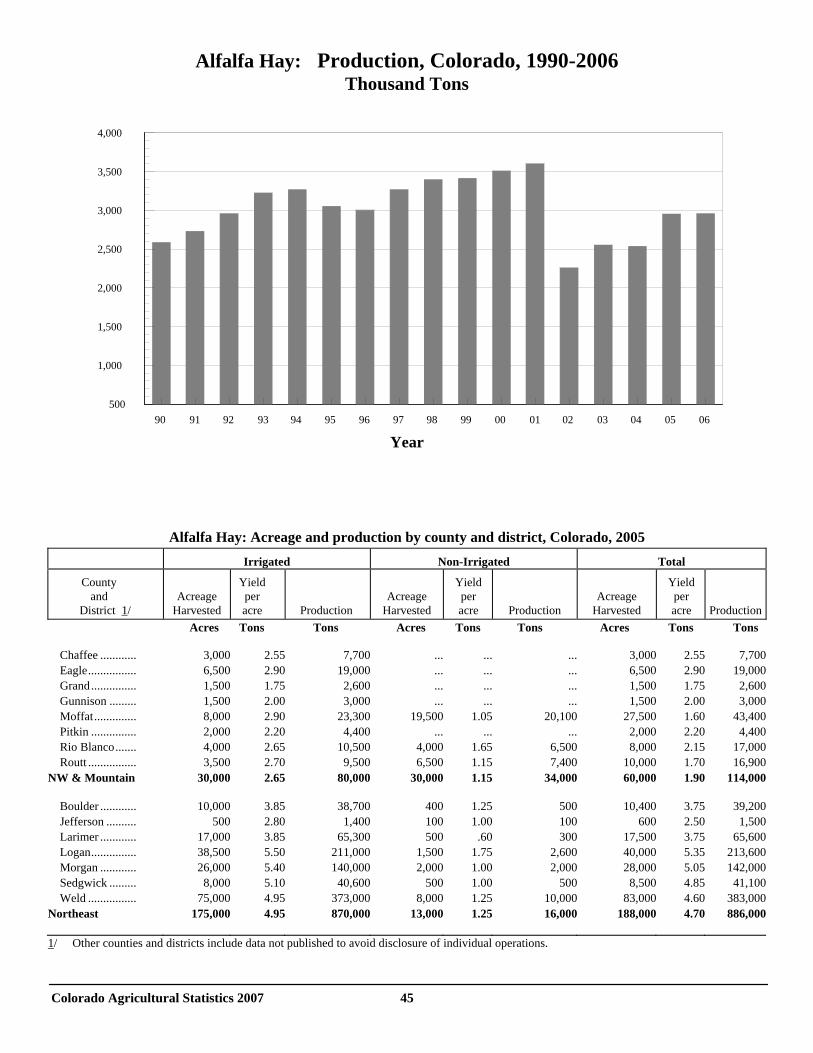
Colorado Agricultural Statistics 2007 45
Alfalfa Hay: Production, Colorado, 1990-2006 Thousand Tons
90 91 92 93 94 95 96 97 98 99 00 01 02 03 04 05 06500
1,000
1,500
2,000
2,500
3,000
3,500
4,000
Year
Alfalfa Hay: Acreage and production by county and district, Colorado, 2005
Irrigated
Non-Irrigated
Total
County and District 1/
Acreage Harvested
Yield per acre
Production
Acreage Harvested
Yield per acre
Production
Acreage Harvested
Yield per acre
Production
Acres
Tons
Tons
Acres
Tons
Tons
Acres
Tons Tons
Chaffee ............
3,000
2.55
7,700
...
...
...
3,000
2.55
7,700
Eagle................
6,500
2.90
19,000
...
...
...
6,500
2.90
19,000 Grand...............
1,500
1.75
2,600
...
...
...
1,500
1.75
2,600
Gunnison .........
1,500
2.00
3,000
...
...
...
1,500
2.00
3,000 Moffat..............
8,000
2.90
23,300
19,500
1.05
20,100
27,500
1.60
43,400
Pitkin ...............
2,000
2.20
4,400
...
...
...
2,000
2.20
4,400 Rio Blanco.......
4,000
2.65
10,500
4,000
1.65
6,500
8,000
2.15
17,000
Routt ................
3,500
2.70
9,500
6,500
1.15
7,400
10,000
1.70
16,900 NW & Mountain
30,000
2.65
80,000
30,000
1.15
34,000
60,000
1.90
114,000
Boulder ............
10,000
3.85
38,700
400
1.25
500
10,400
3.75
39,200
Jefferson ..........
500
2.80
1,400
100
1.00
100
600
2.50
1,500 Larimer ............
17,000
3.85
65,300
500
.60
300
17,500
3.75
65,600
Logan...............
38,500
5.50
211,000
1,500
1.75
2,600
40,000
5.35
213,600 Morgan ............
26,000
5.40
140,000
2,000
1.00
2,000
28,000
5.05
142,000
Sedgwick .........
8,000
5.10
40,600
500
1.00
500
8,500
4.85
41,100 Weld ................
75,000
4.95
373,000
8,000
1.25
10,000
83,000
4.60
383,000
Northeast
175,000
4.95
870,000
13,000
1.25
16,000
188,000
4.70
886,000
1/ Other counties and districts include data not published to avoid disclosure of individual operations.
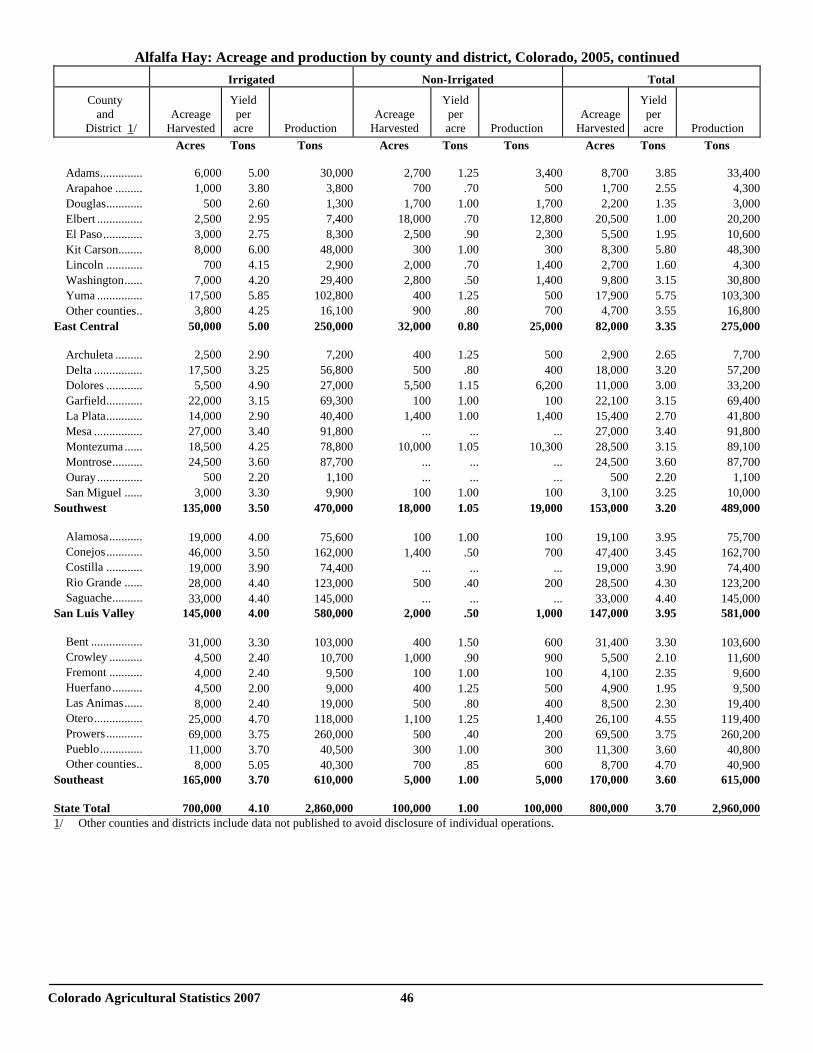
Colorado Agricultural Statistics 2007 46
Alfalfa Hay: Acreage and production by county and district, Colorado, 2005, continued
Irrigated
Non-Irrigated
Total
County and District 1/
Acreage Harvested
Yield per acre
Production
Acreage Harvested
Yield per acre
Production
Acreage Harvested
Yield per acre
Production
Acres
Tons
Tons
Acres
Tons
Tons
Acres
Tons Tons
Adams..............
6,000
5.00
30,000
2,700
1.25
3,400
8,700
3.85
33,400
Arapahoe .........
1,000
3.80
3,800
700
.70
500
1,700
2.55
4,300 Douglas............
500
2.60
1,300
1,700
1.00
1,700
2,200
1.35
3,000
Elbert ...............
2,500
2.95
7,400
18,000
.70
12,800
20,500 1.00
20,200
El Paso.............
3,000
2.75
8,300
2,500
.90
2,300
5,500
1.95
10,600 Kit Carson........
8,000
6.00
48,000
300
1.00
300
8,300
5.80
48,300
Lincoln ............
700
4.15
2,900
2,000
.70
1,400
2,700
1.60
4,300 Washington......
7,000
4.20
29,400
2,800
.50
1,400
9,800
3.15
30,800
Yuma ...............
17,500
5.85
102,800
400
1.25
500
17,900
5.75
103,300 Other counties.. 3,800 4.25 16,100 900 .80 700 4,700 3.55 16,800
East Central
50,000
5.00
250,000
32,000
0.80
25,000
82,000
3.35
275,000
Archuleta .........
2,500
2.90
7,200
400
1.25
500
2,900
2.65
7,700
Delta ................
17,500
3.25
56,800
500
.80
400
18,000
3.20
57,200 Dolores ............
5,500
4.90
27,000
5,500
1.15
6,200
11,000
3.00
33,200
Garfield............
22,000
3.15
69,300
100 1.00
100
22,100
3.15
69,400
La Plata............
14,000
2.90
40,400
1,400 1.00
1,400
15,400
2.70
41,800
Mesa ................
27,000
3.40
91,800
...
...
...
27,000
3.40
91,800 Montezuma......
18,500
4.25
78,800
10,000
1.05
10,300
28,500
3.15
89,100
Montrose..........
24,500
3.60
87,700
...
...
...
24,500
3.60
87,700 Ouray...............
500
2.20
1,100
...
...
...
500
2.20
1,100
San Miguel ......
3,000
3.30
9,900
100 1.00
100
3,100
3.25
10,000
Southwest
135,000
3.50
470,000
18,000
1.05
19,000
153,000
3.20
489,000
Alamosa...........
19,000
4.00
75,600
100
1.00
100
19,100
3.95
75,700
Conejos............
46,000
3.50
162,000
1,400
.50
700
47,400
3.45
162,700 Costilla ............
19,000
3.90
74,400
...
...
...
19,000
3.90
74,400
Rio Grande ......
28,000
4.40
123,000
500
.40
200
28,500
4.30
123,200 Saguache..........
33,000
4.40
145,000
...
...
...
33,000
4.40
145,000
San Luis Valley
145,000
4.00
580,000
2,000
.50
1,000
147,000
3.95
581,000
Bent .................
31,000
3.30
103,000
400
1.50
600
31,400
3.30
103,600
Crowley ...........
4,500
2.40
10,700
1,000
.90
900
5,500
2.10
11,600 Fremont ...........
4,000
2.40
9,500
100
1.00
100
4,100
2.35
9,600
Huerfano..........
4,500 2.00
9,000
400
1.25
500
4,900
1.95
9,500
Las Animas......
8,000
2.40
19,000
500
.80
400
8,500
2.30
19,400 Otero................
25,000
4.70
118,000
1,100
1.25
1,400
26,100
4.55
119,400
Prowers............
69,000
3.75
260,000
500
.40
200
69,500
3.75
260,200 Pueblo..............
11,000
3.70
40,500
300
1.00
300
11,300
3.60
40,800
Other counties.. 8,000 5.05 40,300 700 .85 600 8,700 4.70 40,900 Southeast
165,000
3.70
610,000
5,000
1.00
5,000
170,000
3.60
615,000
State Total
700,000
4.10
2,860,000
100,000
1.00
100,000
800,000
3.70
2,960,000
1/ Other counties and districts include data not published to avoid disclosure of individual operations.
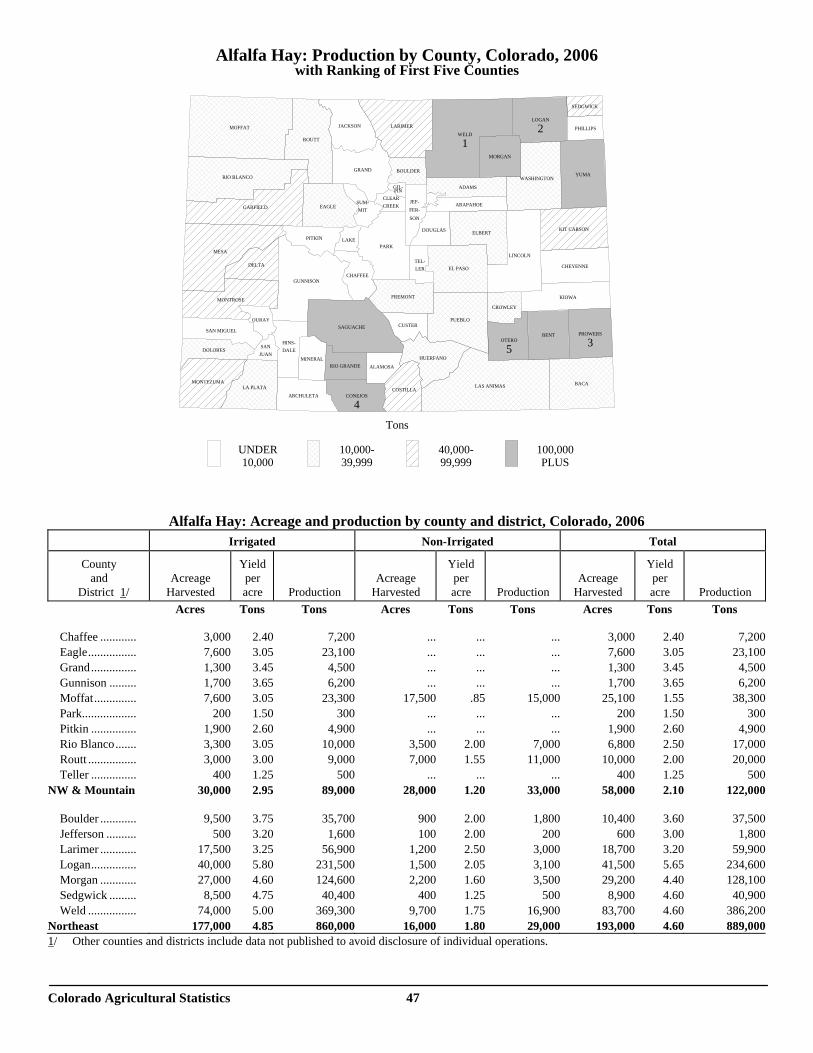
Colorado Agricultural Statistics 47
Alfalfa Hay: Production by County, Colorado, 2006 with Ranking of First Five Counties
Alfalfa Hay: Acreage and production by county and district, Colorado, 2006
Irrigated
Non-Irrigated
Total
County and District 1/
Acreage Harvested
Yield per acre
Production
Acreage Harvested
Yield per acre
Production
Acreage Harvested
Yield per acre
Production
Acres
Tons
Tons
Acres
Tons
Tons
Acres
Tons Tons
Chaffee ............
3,000
2.40
7,200
...
...
...
3,000
2.40
7,200
Eagle................
7,600
3.05
23,100
...
...
...
7,600
3.05
23,100 Grand...............
1,300
3.45
4,500
...
...
...
1,300
3.45
4,500
Gunnison .........
1,700
3.65
6,200
...
...
...
1,700
3.65
6,200 Moffat..............
7,600
3.05
23,300
17,500
.85
15,000
25,100
1.55
38,300
Park..................
200
1.50
300
...
...
...
200
1.50
300 Pitkin ...............
1,900
2.60
4,900
...
...
...
1,900
2.60
4,900
Rio Blanco.......
3,300
3.05
10,000
3,500
2.00
7,000
6,800
2.50
17,000 Routt ................
3,000
3.00
9,000
7,000
1.55
11,000
10,000
2.00
20,000
Teller ...............
400
1.25
500
...
...
...
400
1.25
500 NW & Mountain
30,000
2.95
89,000
28,000
1.20
33,000
58,000
2.10
122,000
Boulder ............
9,500
3.75
35,700
900
2.00
1,800
10,400
3.60
37,500
Jefferson ..........
500
3.20
1,600
100
2.00
200
600
3.00
1,800 Larimer ............
17,500
3.25
56,900
1,200
2.50
3,000
18,700
3.20
59,900
Logan...............
40,000
5.80
231,500
1,500
2.05
3,100
41,500
5.65
234,600 Morgan ............
27,000
4.60
124,600
2,200
1.60
3,500
29,200
4.40
128,100
Sedgwick .........
8,500
4.75
40,400
400
1.25
500
8,900
4.60
40,900 Weld ................
74,000
5.00
369,300
9,700
1.75
16,900
83,700
4.60
386,200
Northeast
177,000
4.85
860,000
16,000
1.80
29,000
193,000
4.60
889,0001/ Other counties and districts include data not published to avoid disclosure of individual operations.
Tons
UNDER10,000
10,000-39,999
40,000-99,999
100,000PLUS
ADAMS
ALAMOSA
ARAPAHOE
ARCHULETA
BACA
BENT
BOULDER
CHAFFEE
CHEYENNE
CLEARCREEK
CONEJOS
4COSTILLA
CROWLEY
CUSTER
DELTA
DOLORES
DOUGLAS
EAGLE
ELBERT
EL PASO
FREMONT
GARFIELD
GIL-PIN
GRAND
GUNNISON
HINS-DALE
HUERFANO
JACKSON
JEF-FER-SON
KIOWA
KIT CARSON
LAKE
LA PLATA
LARIMER
LAS ANIMAS
LINCOLN
LOGAN
2
MESA
MINERAL
MOFFAT
MONTEZUMA
MONTROSE
MORGAN
OTERO
5
OURAY
PARK
PHILLIPS
PITKIN
PROWERS
3
PUEBLO
RIO BLANCO
RIO GRANDE
ROUTT
SAGUACHE
SANJUAN
SAN MIGUEL
SEDGWICK
SUM-MIT
TEL-LER
WASHINGTON
WELD
1
YUMA
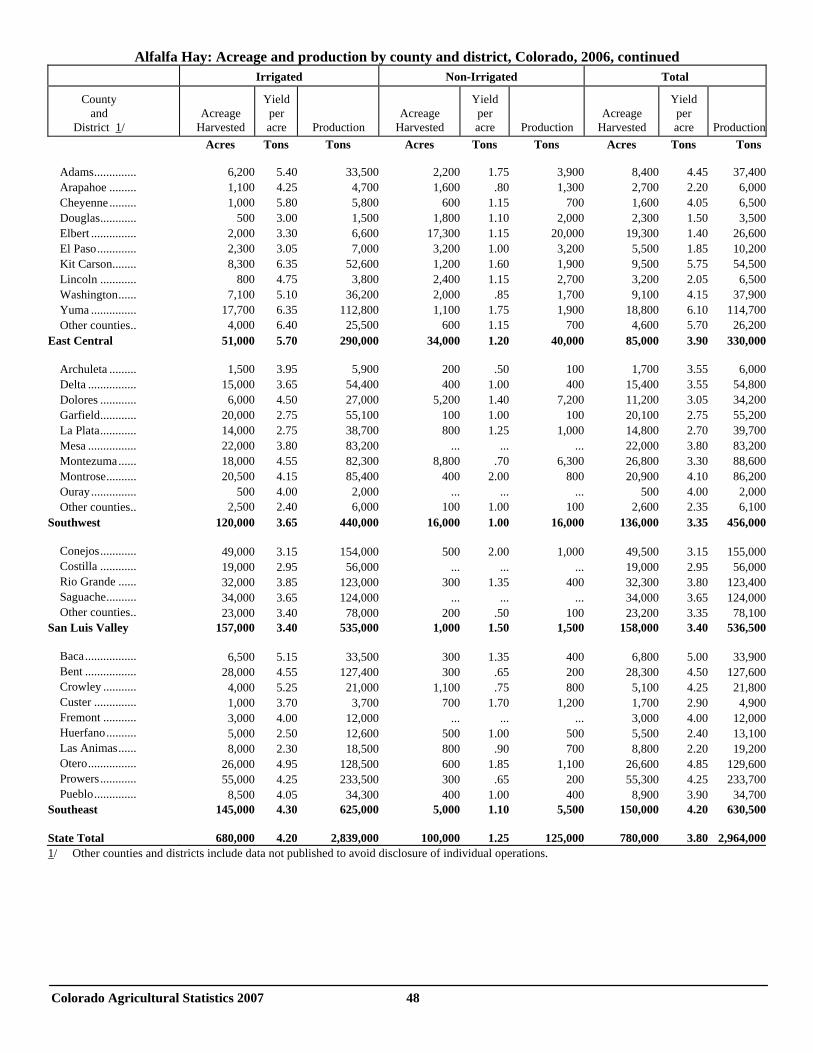
Colorado Agricultural Statistics 2007 48
Alfalfa Hay: Acreage and production by county and district, Colorado, 2006, continued
Irrigated
Non-Irrigated
Total
County and District 1/
Acreage Harvested
Yield per acre
Production
Acreage Harvested
Yield per acre
Production
Acreage Harvested
Yield per acre
Production
Acres
Tons
Tons
Acres
Tons
Tons
Acres
Tons Tons
Adams..............
6,200
5.40
33,500
2,200
1.75
3,900
8,400
4.45
37,400
Arapahoe .........
1,100
4.25
4,700
1,600
.80
1,300
2,700
2.20
6,000 Cheyenne.........
1,000
5.80
5,800
600
1.15
700
1,600
4.05
6,500
Douglas............
500 3.00
1,500
1,800
1.10
2,000
2,300
1.50
3,500
Elbert ...............
2,000
3.30
6,600
17,300
1.15
20,000
19,300
1.40
26,600 El Paso.............
2,300
3.05
7,000
3,200
1.00
3,200
5,500
1.85
10,200
Kit Carson........
8,300
6.35
52,600
1,200
1.60
1,900
9,500
5.75
54,500 Lincoln ............
800
4.75
3,800
2,400
1.15
2,700
3,200
2.05
6,500
Washington......
7,100
5.10
36,200
2,000
.85
1,700
9,100
4.15
37,900 Yuma ...............
17,700
6.35
112,800
1,100
1.75
1,900
18,800
6.10
114,700
Other counties.. 4,000 6.40 25,500 600 1.15 700 4,600 5.70 26,200 East Central
51,000
5.70
290,000
34,000
1.20
40,000
85,000
3.90
330,000
Archuleta .........
1,500
3.95
5,900
200
.50
100
1,700
3.55
6,000
Delta ................
15,000
3.65
54,400
400
1.00
400
15,400
3.55
54,800 Dolores ............
6,000
4.50
27,000
5,200
1.40
7,200
11,200
3.05
34,200
Garfield............
20,000
2.75
55,100
100
1.00
100
20,100
2.75
55,200 La Plata............
14,000
2.75
38,700
800
1.25
1,000
14,800
2.70
39,700
Mesa ................
22,000
3.80
83,200
...
...
...
22,000
3.80
83,200 Montezuma......
18,000
4.55
82,300
8,800
.70
6,300
26,800
3.30
88,600
Montrose..........
20,500
4.15
85,400
400
2.00
800
20,900
4.10
86,200 Ouray...............
500
4.00
2,000
...
...
...
500
4.00
2,000
Other counties.. 2,500 2.40 6,000 100 1.00 100 2,600 2.35 6,100 Southwest
120,000
3.65
440,000
16,000
1.00
16,000
136,000
3.35
456,000
Conejos............
49,000
3.15
154,000
500
2.00
1,000
49,500
3.15
155,000
Costilla ............
19,000
2.95
56,000
...
...
...
19,000
2.95
56,000 Rio Grande ......
32,000
3.85
123,000
300
1.35
400
32,300
3.80
123,400
Saguache..........
34,000
3.65
124,000
...
...
...
34,000
3.65
124,000 Other counties.. 23,000 3.40 78,000 200 .50 100 23,200 3.35 78,100
San Luis Valley
157,000
3.40
535,000
1,000
1.50
1,500
158,000
3.40
536,500
Baca.................
6,500
5.15
33,500
300
1.35
400
6,800
5.00
33,900
Bent .................
28,000
4.55
127,400
300
.65
200
28,300
4.50
127,600 Crowley ...........
4,000
5.25
21,000
1,100
.75
800
5,100
4.25
21,800
Custer ..............
1,000
3.70
3,700
700
1.70
1,200
1,700
2.90
4,900 Fremont ...........
3,000
4.00
12,000
...
...
...
3,000
4.00
12,000
Huerfano..........
5,000
2.50
12,600
500
1.00
500
5,500
2.40
13,100 Las Animas......
8,000
2.30
18,500
800
.90
700
8,800
2.20
19,200
Otero................
26,000
4.95
128,500
600
1.85
1,100
26,600
4.85
129,600 Prowers............
55,000
4.25
233,500
300
.65
200
55,300
4.25
233,700
Pueblo..............
8,500
4.05
34,300
400
1.00 400
8,900
3.90
34,700 Southeast
145,000
4.30
625,000
5,000
1.10
5,500
150,000
4.20
630,500
State Total
680,000
4.20
2,839,000
100,000
1.25
125,000
780,000
3.80
2,964,000
1/ Other counties and districts include data not published to avoid disclosure of individual operations.
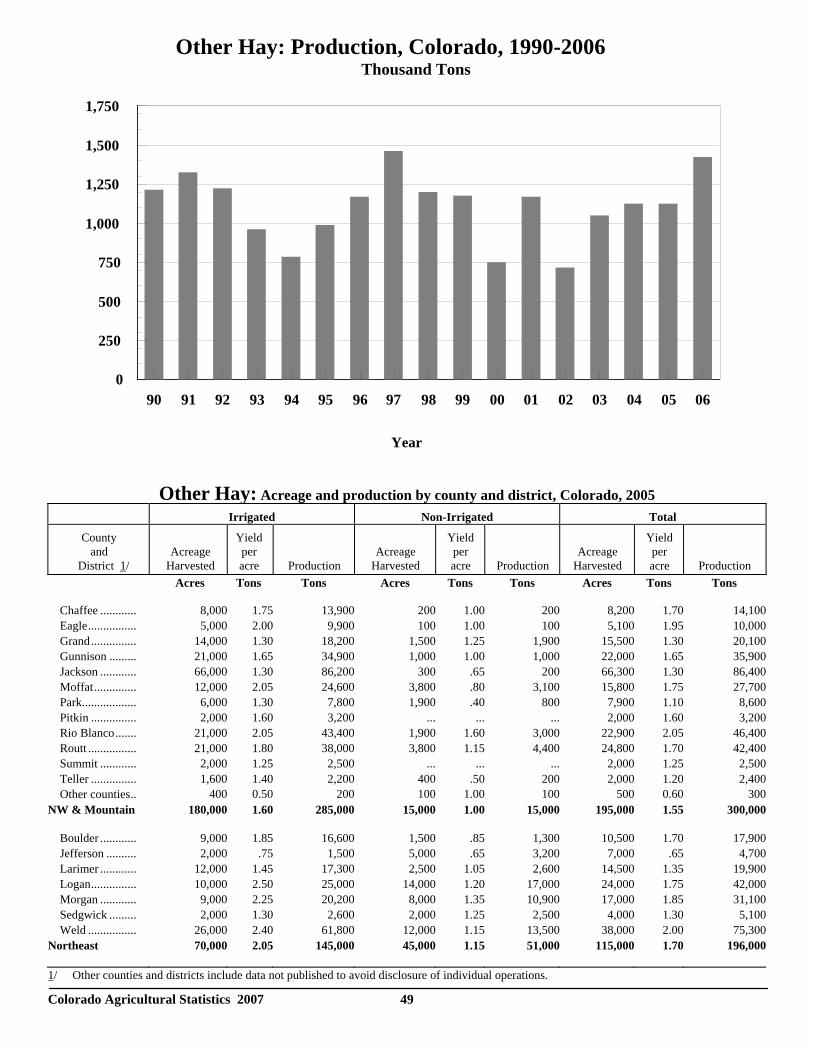
Colorado Agricultural Statistics 2007 49
Other Hay: Acreage and production by county and district, Colorado, 2005
Irrigated
Non-Irrigated
Total
County and District 1/
Acreage Harvested
Yield per acre
Production
Acreage Harvested
Yield per acre
Production
Acreage Harvested
Yield per acre
Production
Acres
Tons
Tons
Acres
Tons
Tons
Acres
Tons Tons
Chaffee ............
8,000
1.75
13,900
200
1.00
200
8,200
1.70
14,100
Eagle................
5,000
2.00
9,900
100
1.00
100
5,100
1.95
10,000 Grand...............
14,000
1.30
18,200
1,500
1.25
1,900
15,500
1.30
20,100
Gunnison .........
21,000
1.65
34,900
1,000
1.00
1,000
22,000
1.65
35,900 Jackson ............
66,000
1.30
86,200
300
.65
200
66,300
1.30
86,400
Moffat..............
12,000
2.05
24,600
3,800
.80
3,100
15,800
1.75
27,700 Park..................
6,000
1.30
7,800
1,900
.40
800
7,900
1.10
8,600
Pitkin ...............
2,000
1.60
3,200
...
...
...
2,000
1.60
3,200 Rio Blanco.......
21,000
2.05
43,400
1,900
1.60
3,000
22,900
2.05
46,400
Routt ................
21,000
1.80
38,000
3,800
1.15
4,400
24,800
1.70
42,400 Summit ............
2,000
1.25
2,500
...
...
...
2,000
1.25
2,500
Teller ...............
1,600
1.40
2,200
400
.50
200
2,000
1.20
2,400 Other counties.. 400 0.50 200 100 1.00 100 500 0.60 300
NW & Mountain
180,000
1.60
285,000
15,000
1.00
15,000
195,000
1.55
300,000
Boulder ............
9,000
1.85
16,600
1,500
.85
1,300
10,500
1.70
17,900
Jefferson ..........
2,000
.75
1,500
5,000
.65
3,200
7,000
.65
4,700 Larimer ............
12,000
1.45
17,300
2,500
1.05
2,600
14,500
1.35
19,900
Logan...............
10,000
2.50
25,000
14,000
1.20
17,000
24,000
1.75
42,000 Morgan ............
9,000
2.25
20,200
8,000
1.35
10,900
17,000
1.85
31,100
Sedgwick .........
2,000
1.30
2,600
2,000
1.25
2,500
4,000
1.30
5,100 Weld ................
26,000
2.40
61,800
12,000
1.15
13,500
38,000
2.00
75,300
Northeast
70,000
2.05
145,000
45,000
1.15
51,000
115,000
1.70
196,000
1/ Other counties and districts include data not published to avoid disclosure of individual operations.
90 91 92 93 94 95 96 97 98 99 00 01 02 03 04 05 060
250
500
750
1,000
1,250
1,500
1,750
Other Hay: Production, Colorado, 1990-2006Thousand Tons
Year
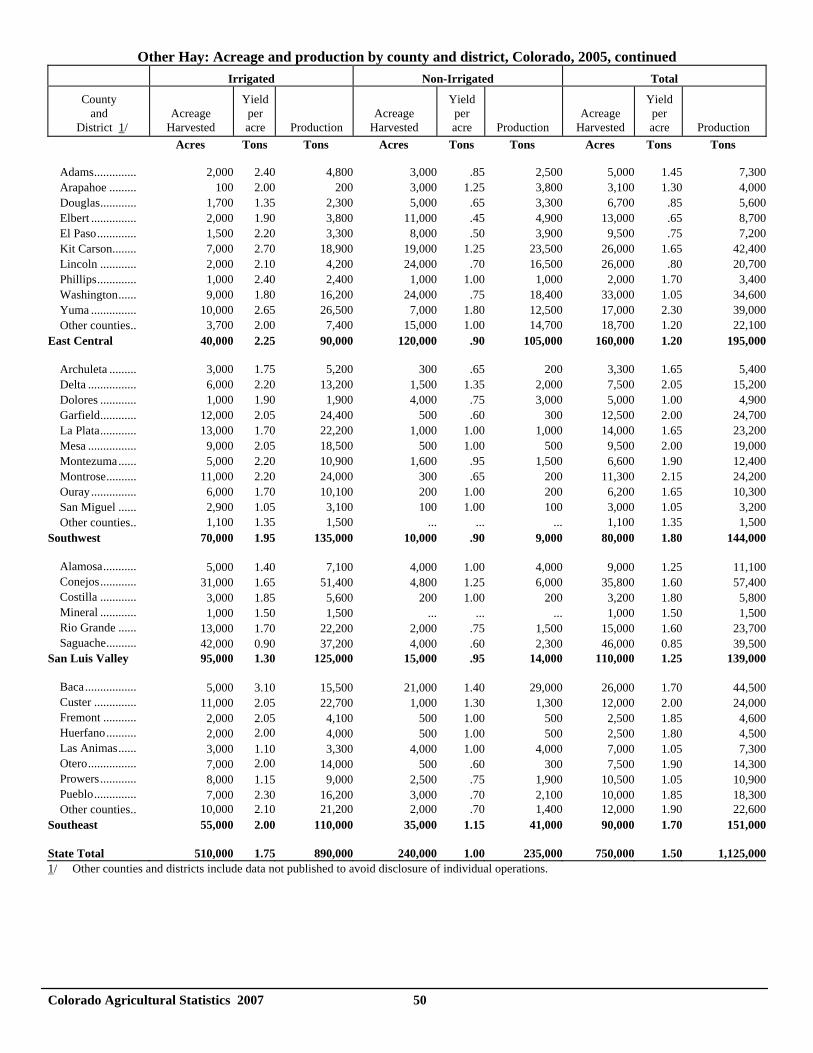
Colorado Agricultural Statistics 2007 50
Other Hay: Acreage and production by county and district, Colorado, 2005, continued
Irrigated
Non-Irrigated
Total
County and District 1/
Acreage Harvested
Yield per acre
Production
Acreage Harvested
Yield per acre
Production
Acreage Harvested
Yield per acre
Production
Acres
Tons
Tons
Acres
Tons
Tons
Acres
Tons Tons
Adams..............
2,000
2.40
4,800
3,000
.85
2,500
5,000
1.45
7,300
Arapahoe .........
100
2.00
200
3,000
1.25
3,800
3,100
1.30
4,000 Douglas............
1,700
1.35
2,300
5,000
.65
3,300
6,700
.85
5,600
Elbert ...............
2,000 1.90
3,800
11,000
.45
4,900
13,000
.65
8,700
El Paso.............
1,500 2.20
3,300
8,000
.50
3,900
9,500
.75
7,200
Kit Carson........
7,000 2.70
18,900
19,000
1.25
23,500
26,000
1.65
42,400
Lincoln ............
2,000 2.10
4,200
24,000
.70
16,500
26,000
.80
20,700
Phillips.............
1,000 2.40
2,400
1,000
1.00
1,000
2,000
1.70
3,400
Washington......
9,000 1.80
16,200
24,000
.75
18,400
33,000
1.05
34,600
Yuma ...............
10,000
2.65
26,500
7,000
1.80
12,500
17,000
2.30
39,000 Other counties.. 3,700 2.00 7,400 15,000 1.00 14,700 18,700 1.20 22,100
East Central
40,000
2.25
90,000
120,000
.90
105,000
160,000
1.20
195,000
Archuleta .........
3,000
1.75
5,200
300
.65
200
3,300
1.65
5,400
Delta ................
6,000 2.20
13,200
1,500
1.35
2,000
7,500
2.05
15,200
Dolores ............
1,000 1.90
1,900
4,000
.75
3,000
5,000
1.00
4,900
Garfield............
12,000
2.05
24,400
500
.60
300
12,500 2.00
24,700
La Plata............
13,000 1.70
22,200
1,000
1.00
1,000
14,000
1.65
23,200
Mesa ................
9,000
2.05
18,500
500 1.00
500
9,500
2.00
19,000
Montezuma......
5,000 2.20
10,900
1,600
.95
1,500
6,600
1.90
12,400
Montrose..........
11,000 2.20
24,000
300
.65
200
11,300
2.15
24,200
Ouray...............
6,000 1.70
10,100
200
1.00
200
6,200
1.65
10,300
San Miguel ......
2,900
1.05
3,100
100 1.00
100
3,000
1.05
3,200
Other counties.. 1,100 1.35 1,500 ... ... ... 1,100 1.35 1,500 Southwest
70,000
1.95
135,000
10,000
.90
9,000
80,000
1.80
144,000
Alamosa...........
5,000
1.40
7,100
4,000
1.00
4,000
9,000
1.25
11,100
Conejos............
31,000
1.65
51,400
4,800
1.25
6,000
35,800
1.60
57,400 Costilla ............
3,000
1.85
5,600
200
1.00
200
3,200
1.80
5,800
Mineral ............
1,000 1.50
1,500
...
...
...
1,000
1.50
1,500
Rio Grande ......
13,000 1.70
22,200
2,000
.75
1,500
15,000
1.60
23,700
Saguache..........
42,000 0.90
37,200
4,000
.60
2,300
46,000
0.85
39,500
San Luis Valley
95,000
1.30
125,000
15,000
.95
14,000
110,000
1.25
139,000
Baca.................
5,000
3.10
15,500
21,000
1.40
29,000
26,000
1.70
44,500
Custer ..............
11,000
2.05
22,700
1,000
1.30
1,300
12,000 2.00
24,000
Fremont ...........
2,000
2.05
4,100
500 1.00
500
2,500
1.85
4,600
Huerfano..........
2,000
2.00
4,000
500 1.00
500
2,500
1.80
4,500
Las Animas......
3,000 1.10
3,300
4,000
1.00
4,000
7,000
1.05
7,300
Otero................
7,000
2.00
14,000
500
.60
300
7,500
1.90
14,300 Prowers............
8,000
1.15
9,000
2,500
.75
1,900
10,500
1.05
10,900
Pueblo..............
7,000 2.30
16,200
3,000
.70
2,100
10,000
1.85
18,300
Other counties.. 10,000 2.10 21,200 2,000 .70 1,400 12,000 1.90 22,600 Southeast
55,000
2.00
110,000
35,000
1.15
41,000
90,000
1.70
151,000
State Total
510,000
1.75
890,000
240,000
1.00
235,000
750,000
1.50
1,125,000
1/ Other counties and districts include data not published to avoid disclosure of individual operations.
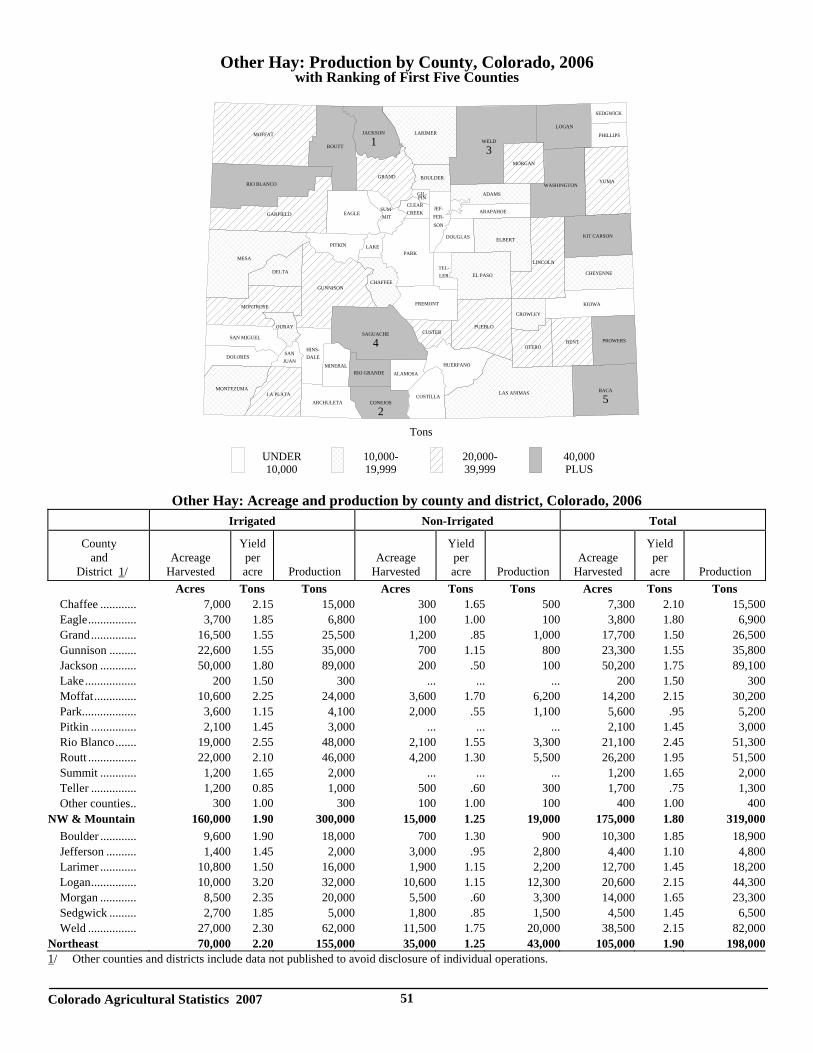
Colorado Agricultural Statistics 2007 51
Other Hay: Production by County, Colorado, 2006
with Ranking of First Five Counties
Other Hay: Acreage and production by county and district, Colorado, 2006
Irrigated
Non-Irrigated
Total County and District 1/
Acreage Harvested
Yield per acre
Production
Acreage Harvested
Yield per acre
Production
Acreage Harvested
Yield per acre
Production
Acres
Tons
Tons
Acres
Tons
Tons
Acres
Tons Tons
Chaffee ............
7,000
2.15
15,000
300
1.65
500
7,300
2.10
15,500 Eagle................
3,700
1.85
6,800
100
1.00
100
3,800
1.80
6,900
Grand...............
16,500
1.55
25,500
1,200
.85
1,000
17,700
1.50
26,500 Gunnison .........
22,600
1.55
35,000
700
1.15
800
23,300
1.55
35,800
Jackson ............
50,000
1.80
89,000
200
.50
100
50,200
1.75
89,100 Lake.................
200
1.50
300
...
...
...
200
1.50
300
Moffat..............
10,600
2.25
24,000
3,600
1.70
6,200
14,200
2.15
30,200 Park..................
3,600
1.15
4,100
2,000
.55
1,100
5,600
.95
5,200
Pitkin ...............
2,100
1.45
3,000
...
...
...
2,100
1.45
3,000 Rio Blanco.......
19,000
2.55
48,000
2,100
1.55
3,300
21,100
2.45
51,300
Routt ................
22,000
2.10
46,000
4,200
1.30
5,500
26,200
1.95
51,500 Summit ............
1,200
1.65
2,000
...
...
...
1,200
1.65
2,000
Teller ...............
1,200
0.85
1,000
500
.60
300
1,700
.75
1,300 Other counties.. 300 1.00 300 100 1.00 100 400 1.00 400
NW & Mountain
160,000
1.90
300,000
15,000
1.25
19,000
175,000
1.80
319,000 Boulder ............
9,600
1.90
18,000
700
1.30
900
10,300
1.85
18,900
Jefferson ..........
1,400
1.45
2,000
3,000
.95
2,800
4,400
1.10
4,800 Larimer ............
10,800
1.50
16,000
1,900
1.15
2,200
12,700
1.45
18,200
Logan...............
10,000
3.20
32,000
10,600
1.15
12,300
20,600
2.15
44,300 Morgan ............
8,500
2.35
20,000
5,500
.60
3,300
14,000
1.65
23,300
Sedgwick .........
2,700
1.85
5,000
1,800
.85
1,500
4,500
1.45
6,500 Weld ................
27,000
2.30
62,000
11,500
1.75
20,000
38,500
2.15
82,000
Northeast
70,000
2.20
155,000
35,000
1.25
43,000
105,000
1.90
198,0001/ Other counties and districts include data not published to avoid disclosure of individual operations.
Tons
UNDER10,000
10,000-19,999
20,000-39,999
40,000PLUS
ADAMS
ALAMOSA
ARAPAHOE
ARCHULETA
BACA
5
BENT
BOULDER
CHAFFEE
CHEYENNE
CLEARCREEK
CONEJOS
2COSTILLA
CROWLEY
CUSTER
DELTA
DOLORES
DOUGLAS
EAGLE
ELBERT
EL PASO
FREMONT
GARFIELD
GIL-PIN
GRAND
GUNNISON
HINS-DALE
HUERFANO
JACKSON
1
JEF-FER-SON
KIOWA
KIT CARSON
LAKE
LA PLATA
LARIMER
LAS ANIMAS
LINCOLN
LOGAN
MESA
MINERAL
MOFFAT
MONTEZUMA
MONTROSE
MORGAN
OTERO
OURAY
PARK
PHILLIPS
PITKIN
PROWERS
PUEBLO
RIO BLANCO
RIO GRANDE
ROUTT
SAGUACHE
4SAN
JUAN
SAN MIGUEL
SEDGWICK
SUM-MIT
TEL-LER
WASHINGTON
WELD
3
YUMA
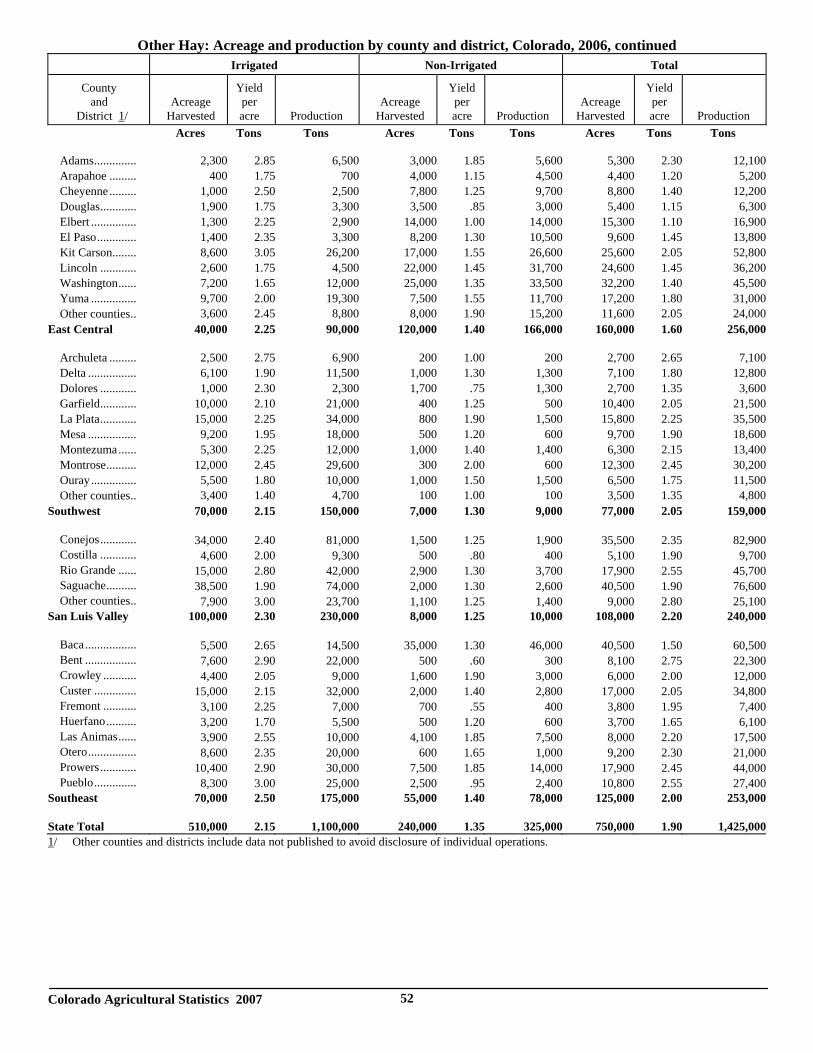
Colorado Agricultural Statistics 2007 52
Other Hay: Acreage and production by county and district, Colorado, 2006, continued
Irrigated
Non-Irrigated
Total
County and District 1/
Acreage Harvested
Yield per acre
Production
Acreage Harvested
Yield per acre
Production
Acreage Harvested
Yield per acre
Production
Acres
Tons
Tons
Acres
Tons
Tons
Acres
Tons Tons
Adams..............
2,300
2.85
6,500
3,000
1.85
5,600
5,300
2.30
12,100
Arapahoe .........
400
1.75
700
4,000
1.15
4,500
4,400
1.20
5,200 Cheyenne.........
1,000
2.50
2,500
7,800
1.25
9,700
8,800
1.40
12,200
Douglas............
1,900
1.75
3,300
3,500
.85
3,000
5,400
1.15
6,300 Elbert ...............
1,300
2.25
2,900
14,000
1.00
14,000
15,300
1.10
16,900
El Paso.............
1,400
2.35
3,300
8,200
1.30
10,500
9,600
1.45
13,800 Kit Carson........
8,600
3.05
26,200
17,000
1.55
26,600
25,600
2.05
52,800
Lincoln ............
2,600
1.75
4,500
22,000
1.45
31,700
24,600
1.45
36,200 Washington......
7,200
1.65
12,000
25,000
1.35
33,500
32,200
1.40
45,500
Yuma ...............
9,700 2.00
19,300
7,500
1.55
11,700
17,200
1.80
31,000
Other counties.. 3,600 2.45 8,800 8,000 1.90 15,200 11,600 2.05 24,000 East Central
40,000
2.25
90,000
120,000
1.40
166,000
160,000
1.60
256,000
Archuleta .........
2,500
2.75
6,900
200
1.00
200
2,700
2.65
7,100
Delta ................
6,100
1.90
11,500
1,000
1.30
1,300
7,100
1.80
12,800 Dolores ............
1,000
2.30
2,300
1,700
.75
1,300
2,700
1.35
3,600
Garfield............
10,000
2.10
21,000
400
1.25
500
10,400
2.05
21,500 La Plata............
15,000
2.25
34,000
800
1.90
1,500
15,800
2.25
35,500
Mesa ................
9,200
1.95
18,000
500
1.20
600
9,700
1.90
18,600 Montezuma......
5,300
2.25
12,000
1,000
1.40
1,400
6,300
2.15
13,400
Montrose..........
12,000
2.45
29,600
300 2.00
600
12,300
2.45
30,200
Ouray...............
5,500
1.80
10,000
1,000
1.50
1,500
6,500
1.75
11,500 Other counties.. 3,400 1.40 4,700 100 1.00 100 3,500 1.35 4,800
Southwest
70,000
2.15
150,000
7,000
1.30
9,000
77,000
2.05
159,000
Conejos............
34,000
2.40
81,000
1,500
1.25
1,900
35,500
2.35
82,900
Costilla ............
4,600 2.00
9,300
500
.80
400
5,100
1.90
9,700
Rio Grande ......
15,000
2.80
42,000
2,900
1.30
3,700
17,900
2.55
45,700 Saguache..........
38,500
1.90
74,000
2,000
1.30
2,600
40,500
1.90
76,600
Other counties.. 7,900 3.00 23,700 1,100 1.25 1,400 9,000 2.80 25,100 San Luis Valley
100,000
2.30
230,000
8,000
1.25
10,000
108,000
2.20
240,000
Baca.................
5,500
2.65
14,500
35,000
1.30
46,000
40,500
1.50
60,500
Bent .................
7,600
2.90
22,000
500
.60
300
8,100
2.75
22,300 Crowley ...........
4,400
2.05
9,000
1,600
1.90
3,000
6,000
2.00
12,000
Custer ..............
15,000
2.15
32,000
2,000
1.40
2,800
17,000
2.05
34,800 Fremont ...........
3,100
2.25
7,000
700
.55
400
3,800
1.95
7,400
Huerfano..........
3,200
1.70
5,500
500
1.20
600
3,700
1.65
6,100 Las Animas......
3,900
2.55
10,000
4,100
1.85
7,500
8,000
2.20
17,500
Otero................
8,600
2.35
20,000
600
1.65
1,000
9,200
2.30
21,000 Prowers............
10,400
2.90
30,000
7,500
1.85
14,000
17,900
2.45
44,000
Pueblo..............
8,300 3.00
25,000
2,500
.95
2,400
10,800
2.55
27,400
Southeast
70,000
2.50
175,000
55,000
1.40
78,000
125,000
2.00
253,000
State Total
510,000
2.15
1,100,000
240,000
1.35
325,000
750,000
1.90
1,425,000
1/ Other counties and districts include data not published to avoid disclosure of individual operations.
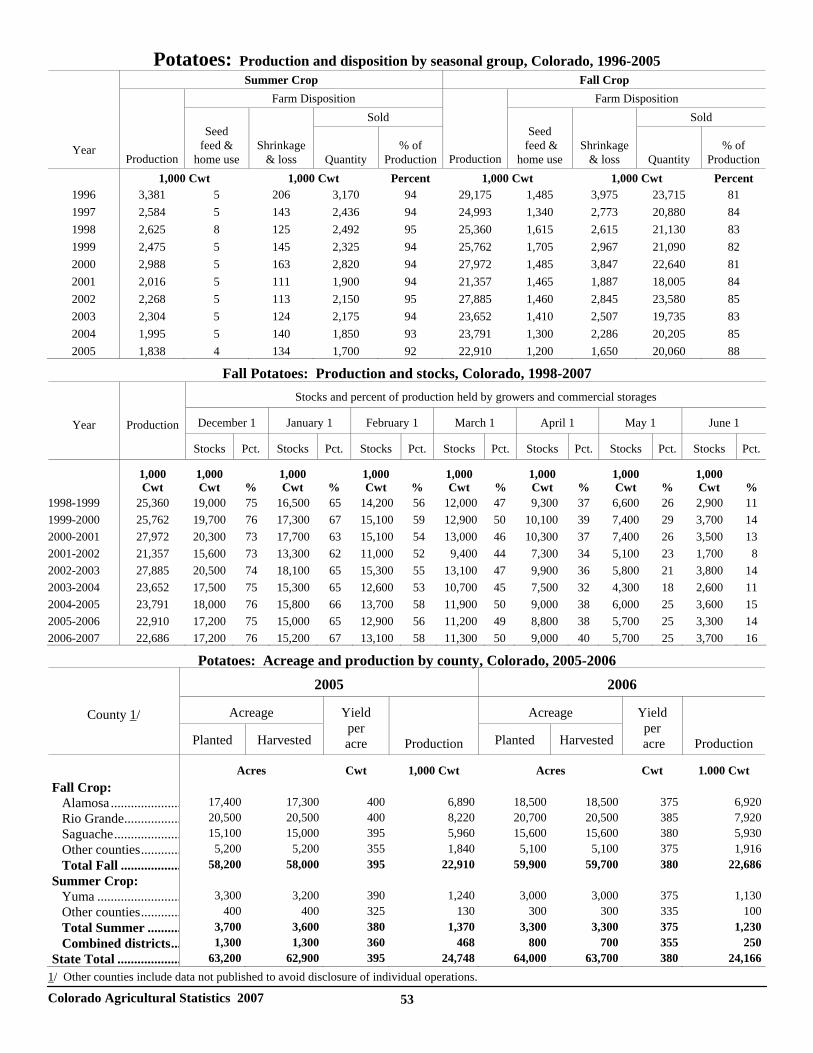
Colorado Agricultural Statistics 2007 53
Potatoes: Production and disposition by seasonal group, Colorado, 1996-2005 Summer Crop Fall Crop
Farm Disposition Farm Disposition Sold Sold
Year
Production
Seed
feed & home use
Shrinkage & loss
Quantity
% of Production
Production
Seed
feed & home use
Shrinkage & loss
Quantity
% of Production
1,000 Cwt 1,000 Cwt Percent 1,000 Cwt 1,000 Cwt Percent1996 3,381 5 206 3,170 94 29,175 1,485 3,975 23,715 81 1997 2,584 5 143 2,436 94 24,993 1,340 2,773 20,880 84 1998 2,625 8 125 2,492 95 25,360 1,615 2,615 21,130 83 1999 2,475 5 145 2,325 94 25,762 1,705 2,967 21,090 82 2000 2,988 5 163 2,820 94 27,972 1,485 3,847 22,640 81 2001 2,016 5 111 1,900 94 21,357 1,465 1,887 18,005 84 2002 2,268 5 113 2,150 95 27,885 1,460 2,845 23,580 85 2003 2,304 5 124 2,175 94 23,652 1,410 2,507 19,735 83 2004 1,995 5 140 1,850 93 23,791 1,300 2,286 20,205 85 2005 1,838 4 134 1,700 92 22,910 1,200 1,650 20,060 88
Fall Potatoes: Production and stocks, Colorado, 1998-2007
Stocks and percent of production held by growers and commercial storages
December 1 January 1 February 1 March 1 April 1 May 1 June 1
Year
Production
Stocks Pct. Stocks Pct. Stocks Pct. Stocks Pct. Stocks Pct. Stocks Pct. Stocks Pct.
1,000 Cwt
1,000 Cwt
%
1,000 Cwt
%
1,000 Cwt
%
1,000 Cwt
%
1,000 Cwt
%
1,000 Cwt
%
1,000 Cwt
%
1998-1999 25,360 19,000 75 16,500 65 14,200 56 12,000 47 9,300 37 6,600 26 2,900 11 1999-2000 25,762 19,700 76 17,300 67 15,100 59 12,900 50 10,100 39 7,400 29 3,700 14 2000-2001 27,972 20,300 73 17,700 63 15,100 54 13,000 46 10,300 37 7,400 26 3,500 13 2001-2002 21,357 15,600 73 13,300 62 11,000 52 9,400 44 7,300 34 5,100 23 1,700 8 2002-2003 27,885 20,500 74 18,100 65 15,300 55 13,100 47 9,900 36 5,800 21 3,800 14 2003-2004 23,652 17,500 75 15,300 65 12,600 53 10,700 45 7,500 32 4,300 18 2,600 11 2004-2005 23,791 18,000 76 15,800 66 13,700 58 11,900 50 9,000 38 6,000 25 3,600 15 2005-2006 22,910 17,200 75 15,000 65 12,900 56 11,200 49 8,800 38 5,700 25 3,300 14 2006-2007 22,686 17,200 76 15,200 67 13,100 58 11,300 50 9,000 40 5,700 25 3,700 16
Potatoes: Acreage and production by county, Colorado, 2005-2006
2005 2006
Acreage Acreage
County 1/
Planted Harvested
Yield per acre
Production Planted Harvested
Yield per
acre
Production
Acres Cwt 1,000 Cwt Acres Cwt 1.000 Cwt Fall Crop: Alamosa ..................... 17,400 17,300 400 6,890 18,500 18,500 375 6,920 Rio Grande................. 20,500 20,500 400 8,220 20,700 20,500 385 7,920 Saguache.................... 15,100 15,000 395 5,960 15,600 15,600 380 5,930 Other counties............ 5,200 5,200 355 1,840 5,100 5,100 375 1,916 Total Fall .................. 58,200 58,000 395 22,910 59,900 59,700 380 22,686Summer Crop: Yuma ......................... 3,300 3,200 390 1,240 3,000 3,000 375 1,130 Other counties............ 400 400 325 130 300 300 335 100 Total Summer .......... 3,700 3,600 380 1,370 3,300 3,300 375 1,230 Combined districts... 1,300 1,300 360 468 800 700 355 250State Total ................... 63,200 62,900 395 24,748 64,000 63,700 380 24,166
1/ Other counties include data not published to avoid disclosure of individual operations.
MISCELLANEOUS
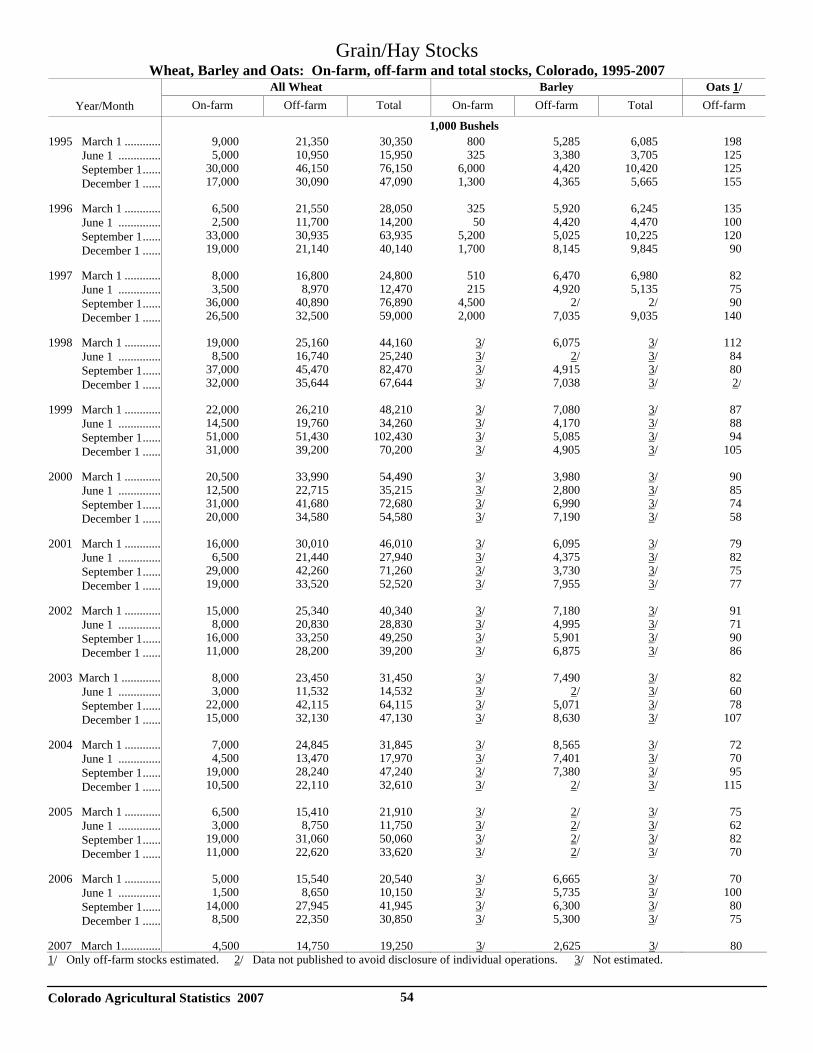
Colorado Agricultural Statistics 2007 54
Grain/Hay Stocks Wheat, Barley and Oats: On-farm, off-farm and total stocks, Colorado, 1995-2007
All Wheat Barley Oats 1/ Year/Month On-farm Off-farm Total On-farm Off-farm Total Off-farm
1,000 Bushels 9,000 21,350 30,350 800 5,285 6,085 1985,000 10,950 15,950 325 3,380 3,705 125
30,000 46,150 76,150 6,000 4,420 10,420 125
1995 March 1 ............ June 1 .............. September 1...... December 1 ...... 17,000 30,090 47,090 1,300 4,365 5,665 155
6,500 21,550 28,050 325 5,920 6,245 1352,500 11,700 14,200 50 4,420 4,470 100
33,000 30,935 63,935 5,200 5,025 10,225 120
1996 March 1 ............ June 1 .............. September 1...... December 1 ...... 19,000 21,140 40,140 1,700 8,145 9,845 90
8,000 16,800 24,800 510 6,470 6,980 823,500 8,970 12,470 215 4,920 5,135 75
36,000 40,890 76,890 4,500 2/ 2/ 90
1997 March 1 ............ June 1 .............. September 1...... December 1 ...... 26,500 32,500 59,000 2,000 7,035 9,035 140
19,000 25,160 44,160 3/ 6,075 3/ 1128,500 16,740 25,240 3/ 2/ 3/ 84
37,000 45,470 82,470 3/ 4,915 3/ 80
1998 March 1 ............ June 1 .............. September 1...... December 1 ...... 32,000 35,644 67,644 3/ 7,038 3/ 2/
22,000 26,210 48,210 3/ 7,080 3/ 8714,500 19,760 34,260 3/ 4,170 3/ 8851,000 51,430 102,430 3/ 5,085 3/ 94
1999 March 1 ............ June 1 .............. September 1...... December 1 ...... 31,000 39,200 70,200 3/ 4,905 3/ 105
20,500 33,990 54,490 3/ 3,980 3/ 9012,500 22,715 35,215 3/ 2,800 3/ 8531,000 41,680 72,680 3/ 6,990 3/ 74
2000 March 1 ............ June 1 .............. September 1...... December 1 ...... 20,000 34,580 54,580 3/ 7,190 3/ 58
16,000 30,010 46,010 3/ 6,095 3/ 796,500 21,440 27,940 3/ 4,375 3/ 82
29,000 42,260 71,260 3/ 3,730 3/ 75
2001 March 1 ............ June 1 .............. September 1...... December 1 ...... 19,000 33,520 52,520 3/ 7,955 3/ 77
15,000 25,340 40,340 3/ 7,180 3/ 918,000 20,830 28,830 3/ 4,995 3/ 71
16,000 33,250 49,250 3/ 5,901 3/ 90
2002 March 1 ............ June 1 .............. September 1...... December 1 ...... 11,000 28,200 39,200 3/ 6,875 3/ 86
8,000 23,450 31,450 3/ 7,490 3/ 823,000 11,532 14,532 3/ 2/ 3/ 60
22,000 42,115 64,115 3/ 5,071 3/ 78
2003 March 1 ............. June 1 .............. September 1...... December 1 ...... 15,000 32,130 47,130 3/ 8,630 3/ 107
7,000 24,845 31,845 3/ 8,565 3/ 724,500 13,470 17,970 3/ 7,401 3/ 70
19,000 28,240 47,240 3/ 7,380 3/ 95
2004 March 1 ............ June 1 .............. September 1...... December 1 ...... 10,500 22,110 32,610 3/ 2/ 3/ 115
6,500 15,410 21,910 3/ 2/ 3/ 753,000 8,750 11,750 3/ 2/ 3/ 62
19,000 31,060 50,060 3/ 2/ 3/ 82
2005 March 1 ............ June 1 .............. September 1...... December 1 ...... 11,000 22,620 33,620 3/ 2/ 3/ 70
5,000 15,540 20,540 3/ 6,665 3/ 701,500 8,650 10,150 3/ 5,735 3/ 100
14,000 27,945 41,945 3/ 6,300 3/ 80
2006 March 1 ............ June 1 .............. September 1...... December 1 ...... 8,500 22,350 30,850 3/ 5,300 3/ 75
2007 March 1............. 4,500 14,750 19,250 3/ 2,625 3/ 801/ Only off-farm stocks estimated. 2/ Data not published to avoid disclosure of individual operations. 3/ Not estimated.
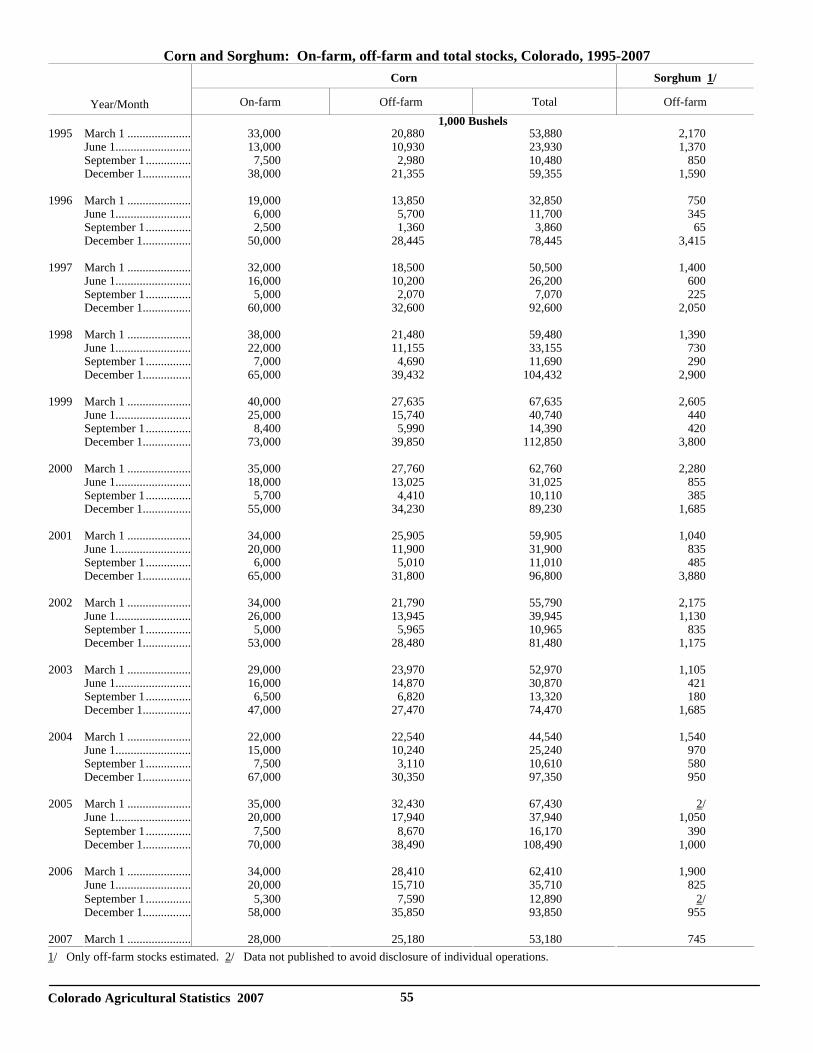
Colorado Agricultural Statistics 2007 55
Corn and Sorghum: On-farm, off-farm and total stocks, Colorado, 1995-2007 Corn Sorghum 1/
Year/Month On-farm Off-farm Total Off-farm
1,000 Bushels 1995 March 1 ..................... 33,000 20,880 53,880 2,170 June 1......................... 13,000 10,930 23,930 1,370 September 1............... 7,500 2,980 10,480 850 December 1................ 38,000 21,355 59,355 1,590 1996 March 1 ..................... 19,000 13,850 32,850 750 June 1......................... 6,000 5,700 11,700 345 September 1............... 2,500 1,360 3,860 65 December 1................ 50,000 28,445 78,445 3,415 1997 March 1 ..................... 32,000 18,500 50,500 1,400 June 1......................... 16,000 10,200 26,200 600 September 1............... 5,000 2,070 7,070 225 December 1................ 60,000 32,600 92,600 2,050 1998 March 1 ..................... 38,000 21,480 59,480 1,390 June 1......................... 22,000 11,155 33,155 730 September 1............... 7,000 4,690 11,690 290 December 1................ 65,000 39,432 104,432 2,900 1999 March 1 ..................... 40,000 27,635 67,635 2,605 June 1......................... 25,000 15,740 40,740 440 September 1............... 8,400 5,990 14,390 420 December 1................ 73,000 39,850 112,850 3,800 2000 March 1 ..................... 35,000 27,760 62,760 2,280 June 1......................... 18,000 13,025 31,025 855 September 1............... 5,700 4,410 10,110 385 December 1................ 55,000 34,230 89,230 1,685 2001 March 1 ..................... 34,000 25,905 59,905 1,040 June 1......................... 20,000 11,900 31,900 835 September 1............... 6,000 5,010 11,010 485 December 1................ 65,000 31,800 96,800 3,880 2002 March 1 ..................... 34,000 21,790 55,790 2,175 June 1......................... 26,000 13,945 39,945 1,130 September 1............... 5,000 5,965 10,965 835 December 1................ 53,000 28,480 81,480 1,175 2003 March 1 ..................... 29,000 23,970 52,970 1,105 June 1......................... 16,000 14,870 30,870 421 September 1............... 6,500 6,820 13,320 180 December 1................ 47,000 27,470 74,470 1,685 2004 March 1 ..................... 22,000 22,540 44,540 1,540 June 1......................... 15,000 10,240 25,240 970 September 1............... 7,500 3,110 10,610 580 December 1................ 67,000 30,350 97,350 950 2005 March 1 ..................... 35,000 32,430 67,430 2/ June 1......................... 20,000 17,940 37,940 1,050 September 1............... 7,500 8,670 16,170 390 December 1................ 70,000 38,490 108,490 1,000 2006 March 1 ..................... 34,000 28,410 62,410 1,900 June 1......................... 20,000 15,710 35,710 825 September 1............... 5,300 7,590 12,890 2/ December 1................ 58,000 35,850 93,850 955 2007 March 1 ..................... 28,000 25,180 53,180 745 1/ Only off-farm stocks estimated. 2/ Data not published to avoid disclosure of individual operations.
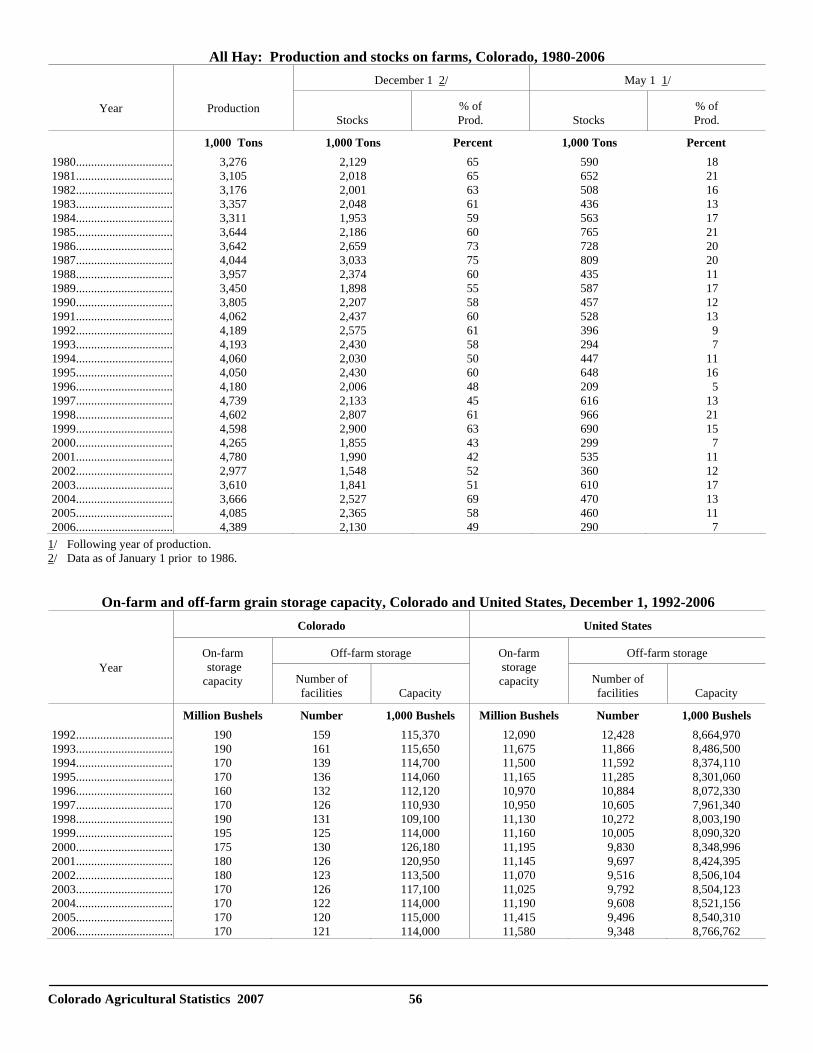
Colorado Agricultural Statistics 2007 56
All Hay: Production and stocks on farms, Colorado, 1980-2006
December 1 2/ May 1 1/
Year
Production Stocks
% of Prod.
Stocks
% of Prod.
1,000 Tons 1,000 Tons Percent 1,000 Tons Percent 1980................................ 3,276 2,129 65 590 18 1981................................ 3,105 2,018 65 652 21 1982................................ 3,176 2,001 63 508 16 1983................................ 3,357 2,048 61 436 13 1984................................ 3,311 1,953 59 563 17 1985................................ 3,644 2,186 60 765 21 1986................................ 3,642 2,659 73 728 20 1987................................ 4,044 3,033 75 809 20 1988................................ 3,957 2,374 60 435 11 1989................................ 3,450 1,898 55 587 17 1990................................ 3,805 2,207 58 457 12 1991................................ 4,062 2,437 60 528 13 1992................................ 4,189 2,575 61 396 9 1993................................ 4,193 2,430 58 294 7 1994................................ 4,060 2,030 50 447 11 1995................................ 4,050 2,430 60 648 16 1996................................ 4,180 2,006 48 209 5 1997................................ 4,739 2,133 45 616 13 1998................................ 4,602 2,807 61 966 21 1999................................ 4,598 2,900 63 690 15 2000................................ 4,265 1,855 43 299 7 2001................................ 4,780 1,990 42 535 11 2002................................ 2,977 1,548 52 360 12 2003................................ 3,610 1,841 51 610 17 2004................................ 3,666 2,527 69 470 13 2005................................ 4,085 2,365 58 460 11 2006................................ 4,389 2,130 49 290 7
1/ Following year of production. 2/ Data as of January 1 prior to 1986. On-farm and off-farm grain storage capacity, Colorado and United States, December 1, 1992-2006
Colorado United States
Off-farm storage Off-farm storage
Year
On-farm storage capacity Number of
facilities
Capacity
On-farm storage capacity Number of
facilities
Capacity
Million Bushels Number 1,000 Bushels Million Bushels Number 1,000 Bushels 1992................................ 190 159 115,370 12,090 12,428 8,664,970 1993................................ 190 161 115,650 11,675 11,866 8,486,500 1994................................ 170 139 114,700 11,500 11,592 8,374,110 1995................................ 170 136 114,060 11,165 11,285 8,301,060 1996................................ 160 132 112,120 10,970 10,884 8,072,330 1997................................ 170 126 110,930 10,950 10,605 7,961,340 1998................................ 190 131 109,100 11,130 10,272 8,003,190 1999................................ 195 125 114,000 11,160 10,005 8,090,320 2000................................ 175 130 126,180 11,195 9,830 8,348,996 2001................................ 180 126 120,950 11,145 9,697 8,424,395 2002................................ 180 123 113,500 11,070 9,516 8,506,104 2003................................ 170 126 117,100 11,025 9,792 8,504,123 2004................................ 170 122 114,000 11,190 9,608 8,521,156 2005................................ 170 120 115,000 11,415 9,496 8,540,310 2006................................ 170 121 114,000 11,580 9,348 8,766,762
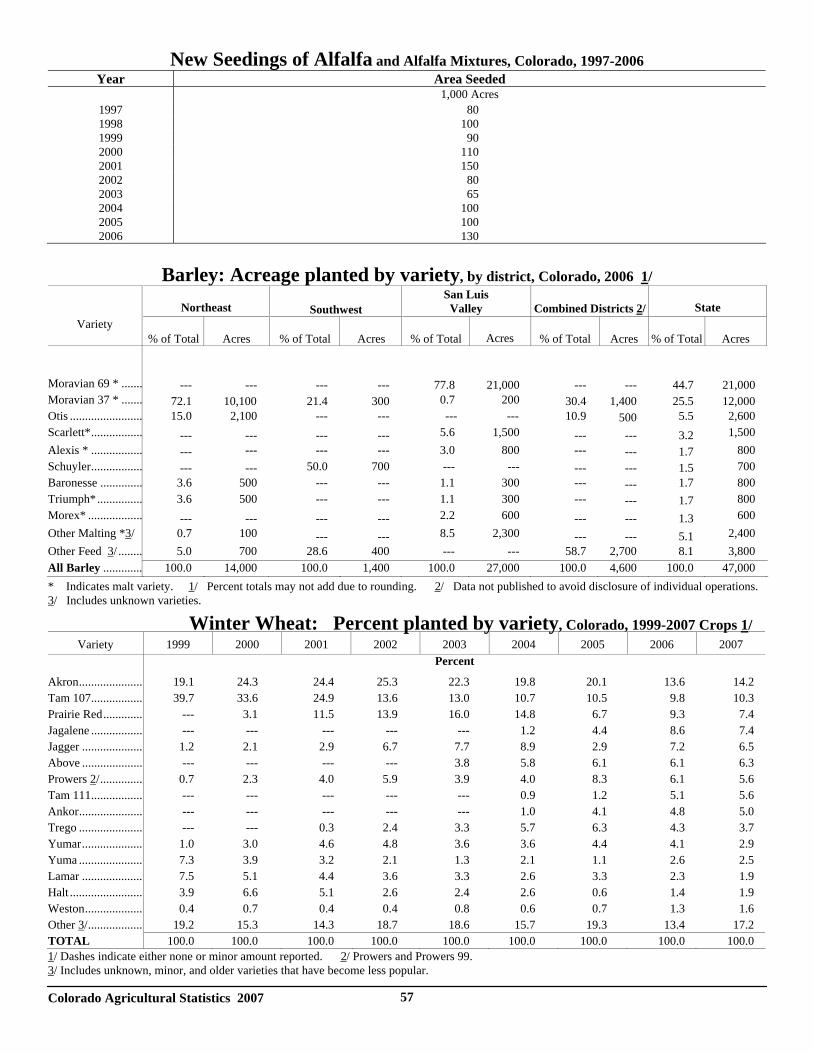
Colorado Agricultural Statistics 2007 57
New Seedings of Alfalfa and Alfalfa Mixtures, Colorado, 1997-2006 Year Area Seeded
1,000 Acres 1997 80 1998 100 1999 90 2000 110 2001 150 2002 80 2003 65 2004 100 2005 100 2006 130
Barley: Acreage planted by variety, by district, Colorado, 2006 1/
Northeast
Southwest
San Luis Valley
Combined Districts 2/
State
Variety % of Total Acres
% of Total Acres % of Total
Acres % of Total
Acres % of Total
Acres
Moravian 69 * ....... --- --- --- --- 77.8 21,000 --- --- 44.7 21,000 Moravian 37 * ....... 72.1 10,100 21.4 300 0.7 200 30.4 1,400 25.5 12,000 Otis ........................ 15.0 2,100 --- --- --- --- 10.9 500 5.5 2,600 Scarlett*................. --- --- --- --- 5.6 1,500 --- --- 3.2 1,500 Alexis * ................. --- --- --- --- 3.0 800 --- --- 1.7 800 Schuyler................. --- --- 50.0 700 --- --- --- --- 1.5 700 Baronesse .............. 3.6 500 --- --- 1.1 300 --- --- 1.7 800 Triumph*............... 3.6 500 --- --- 1.1 300 --- --- 1.7 800 Morex* .................. --- --- --- --- 2.2 600 --- --- 1.3 600 Other Malting *3/ 0.7 100 --- --- 8.5 2,300 --- --- 5.1 2,400 Other Feed 3/ ........ 5.0 700 28.6 400 --- --- 58.7 2,700 8.1 3,800 All Barley ............. 100.0 14,000 100.0 1,400 100.0 27,000 100.0 4,600 100.0 47,000 * Indicates malt variety. 1/ Percent totals may not add due to rounding. 2/ Data not published to avoid disclosure of individual operations. 3/ Includes unknown varieties. Winter Wheat: Percent planted by variety, Colorado, 1999-2007 Crops 1/
Variety 1999 2000 2001 2002 2003 2004 2005 2006 2007 Percent
Akron..................... 19.1 24.3 24.4 25.3 22.3 19.8 20.1 13.6 14.2 Tam 107................. 39.7 33.6 24.9 13.6 13.0 10.7 10.5 9.8 10.3 Prairie Red............. --- 3.1 11.5 13.9 16.0 14.8 6.7 9.3 7.4 Jagalene ................. --- --- --- --- --- 1.2 4.4 8.6 7.4 Jagger .................... 1.2 2.1 2.9 6.7 7.7 8.9 2.9 7.2 6.5 Above .................... --- --- --- --- 3.8 5.8 6.1 6.1 6.3 Prowers 2/.............. 0.7 2.3 4.0 5.9 3.9 4.0 8.3 6.1 5.6 Tam 111................. --- --- --- --- --- 0.9 1.2 5.1 5.6 Ankor..................... --- --- --- --- --- 1.0 4.1 4.8 5.0 Trego ..................... --- --- 0.3 2.4 3.3 5.7 6.3 4.3 3.7 Yumar.................... 1.0 3.0 4.6 4.8 3.6 3.6 4.4 4.1 2.9 Yuma ..................... 7.3 3.9 3.2 2.1 1.3 2.1 1.1 2.6 2.5 Lamar .................... 7.5 5.1 4.4 3.6 3.3 2.6 3.3 2.3 1.9 Halt ........................ 3.9 6.6 5.1 2.6 2.4 2.6 0.6 1.4 1.9 Weston................... 0.4 0.7 0.4 0.4 0.8 0.6 0.7 1.3 1.6 Other 3/.................. 19.2 15.3 14.3 18.7 18.6 15.7 19.3 13.4 17.2 TOTAL 100.0 100.0 100.0 100.0 100.0 100.0 100.0 100.0 100.0 1/ Dashes indicate either none or minor amount reported. 2/ Prowers and Prowers 99. 3/ Includes unknown, minor, and older varieties that have become less popular.
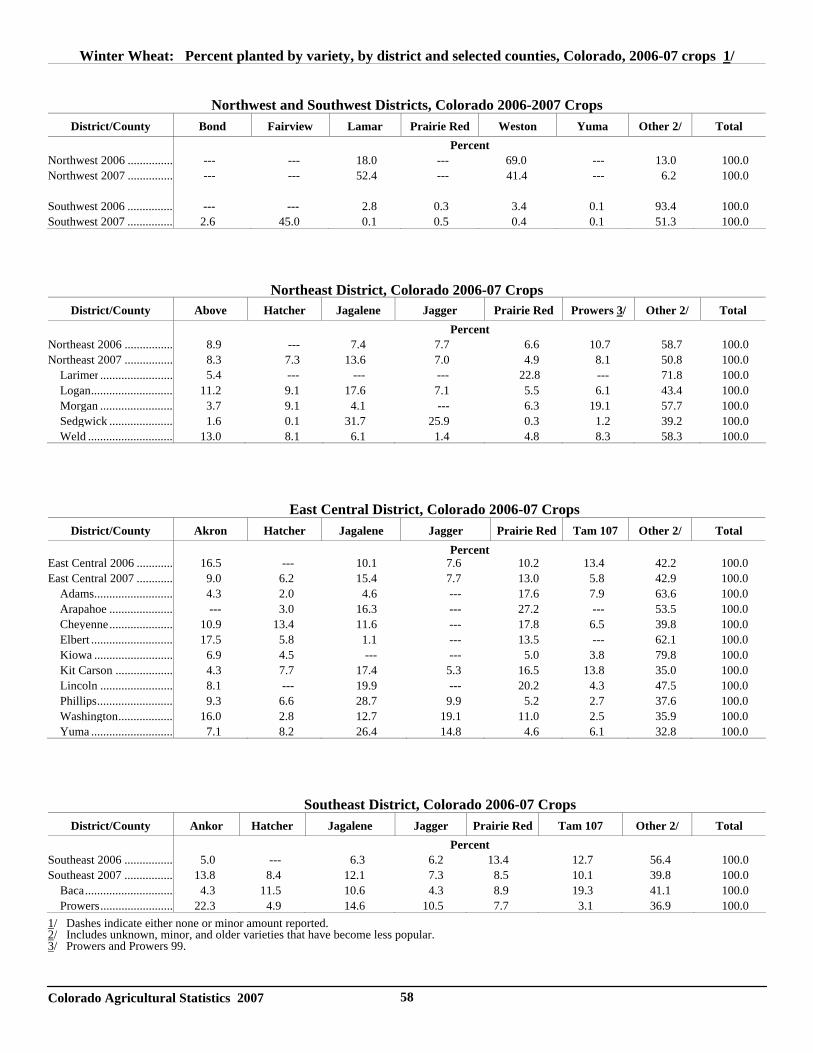
Colorado Agricultural Statistics 2007 58
Winter Wheat: Percent planted by variety, by district and selected counties, Colorado, 2006-07 crops 1/
Northwest and Southwest Districts, Colorado 2006-2007 Crops
District/County Bond Fairview Lamar Prairie Red Weston Yuma Other 2/ Total Percent
Northwest 2006 ............... --- --- 18.0 --- 69.0 --- 13.0 100.0Northwest 2007 ............... --- --- 52.4 --- 41.4 --- 6.2 100.0 Southwest 2006 ............... --- --- 2.8 0.3 3.4 0.1 93.4 100.0Southwest 2007 ............... 2.6 45.0 0.1 0.5 0.4 0.1 51.3 100.0
Northeast District, Colorado 2006-07 Crops
District/County Above Hatcher Jagalene Jagger Prairie Red Prowers 3/ Other 2/ Total Percent
Northeast 2006 ................ 8.9 --- 7.4 7.7 6.6 10.7 58.7 100.0Northeast 2007 ................ 8.3 7.3 13.6 7.0 4.9 8.1 50.8 100.0 Larimer ........................ 5.4 --- --- --- 22.8 --- 71.8 100.0 Logan........................... 11.2 9.1 17.6 7.1 5.5 6.1 43.4 100.0 Morgan ........................ 3.7 9.1 4.1 --- 6.3 19.1 57.7 100.0 Sedgwick ..................... 1.6 0.1 31.7 25.9 0.3 1.2 39.2 100.0 Weld ............................ 13.0 8.1 6.1 1.4 4.8 8.3 58.3 100.0
East Central District, Colorado 2006-07 Crops District/County Akron Hatcher Jagalene Jagger Prairie Red Tam 107 Other 2/ Total
PercentEast Central 2006 ............ 16.5 --- 10.1 7.6 10.2 13.4 42.2 100.0East Central 2007 ............ 9.0 6.2 15.4 7.7 13.0 5.8 42.9 100.0 Adams.......................... 4.3 2.0 4.6 --- 17.6 7.9 63.6 100.0 Arapahoe ..................... --- 3.0 16.3 --- 27.2 --- 53.5 100.0 Cheyenne..................... 10.9 13.4 11.6 --- 17.8 6.5 39.8 100.0 Elbert ........................... 17.5 5.8 1.1 --- 13.5 --- 62.1 100.0 Kiowa .......................... 6.9 4.5 --- --- 5.0 3.8 79.8 100.0 Kit Carson ................... 4.3 7.7 17.4 5.3 16.5 13.8 35.0 100.0 Lincoln ........................ 8.1 --- 19.9 --- 20.2 4.3 47.5 100.0 Phillips......................... 9.3 6.6 28.7 9.9 5.2 2.7 37.6 100.0 Washington.................. 16.0 2.8 12.7 19.1 11.0 2.5 35.9 100.0 Yuma ........................... 7.1 8.2 26.4 14.8 4.6 6.1 32.8 100.0
Southeast District, Colorado 2006-07 Crops District/County Ankor Hatcher Jagalene Jagger Prairie Red Tam 107 Other 2/ Total
PercentSoutheast 2006 ................ 5.0 --- 6.3 6.2 13.4 12.7 56.4 100.0Southeast 2007 ................ 13.8 8.4 12.1 7.3 8.5 10.1 39.8 100.0 Baca............................. 4.3 11.5 10.6 4.3 8.9 19.3 41.1 100.0 Prowers........................ 22.3 4.9 14.6 10.5 7.7 3.1 36.9 100.01/ Dashes indicate either none or minor amount reported. 2/ Includes unknown, minor, and older varieties that have become less popular. 3/ Prowers and Prowers 99.
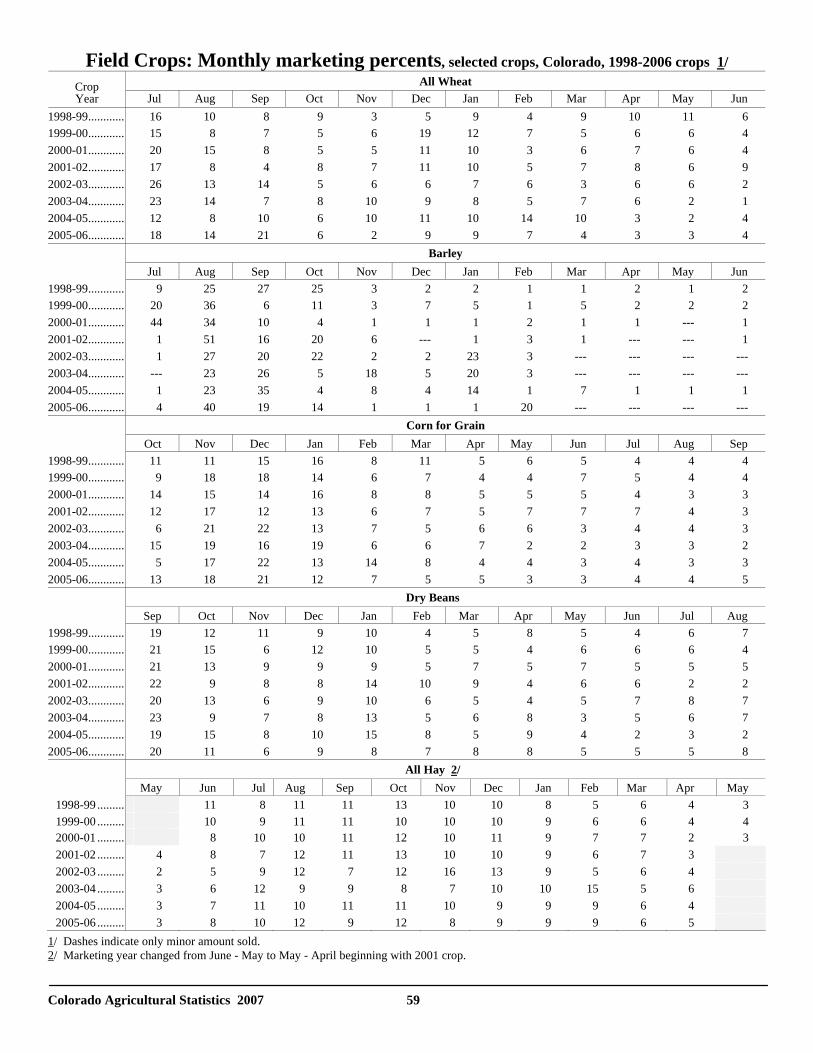
Colorado Agricultural Statistics 2007 59
Field Crops: Monthly marketing percents, selected crops, Colorado, 1998-2006 crops 1/ All Wheat Crop
Year Jul Aug Sep Oct Nov Dec Jan Feb Mar Apr May Jun 1998-99............ 16 10 8 9 3 5 9 4 9 10 11 6 1999-00............ 15 8 7 5 6 19 12 7 5 6 6 4 2000-01............ 20 15 8 5 5 11 10 3 6 7 6 4 2001-02............ 17 8 4 8 7 11 10 5 7 8 6 9 2002-03............ 26 13 14 5 6 6 7 6 3 6 6 2 2003-04............ 23 14 7 8 10 9 8 5 7 6 2 1 2004-05............ 12 8 10 6 10 11 10 14 10 3 2 4 2005-06............ 18 14 21 6 2 9 9 7 4 3 3 4
Barley Jul Aug Sep Oct Nov Dec Jan Feb Mar Apr May Jun
1998-99............ 9 25 27 25 3 2 2 1 1 2 1 2 1999-00............ 20 36 6 11 3 7 5 1 5 2 2 2 2000-01............ 44 34 10 4 1 1 1 2 1 1 --- 1 2001-02............ 1 51 16 20 6 --- 1 3 1 --- --- 1 2002-03............ 1 27 20 22 2 2 23 3 --- --- --- --- 2003-04............ --- 23 26 5 18 5 20 3 --- --- --- --- 2004-05............ 1 23 35 4 8 4 14 1 7 1 1 1 2005-06............ 4 40 19 14 1 1 1 20 --- --- --- ---
Corn for Grain Oct Nov Dec Jan Feb Mar Apr May Jun Jul Aug Sep
1998-99............ 11 11 15 16 8 11 5 6 5 4 4 4 1999-00............ 9 18 18 14 6 7 4 4 7 5 4 4 2000-01............ 14 15 14 16 8 8 5 5 5 4 3 3 2001-02............ 12 17 12 13 6 7 5 7 7 7 4 3 2002-03............ 6 21 22 13 7 5 6 6 3 4 4 3 2003-04............ 15 19 16 19 6 6 7 2 2 3 3 2 2004-05............ 5 17 22 13 14 8 4 4 3 4 3 3 2005-06............ 13 18 21 12 7 5 5 3 3 4 4 5
Dry Beans Sep Oct Nov Dec Jan Feb Mar Apr May Jun Jul Aug
1998-99............ 19 12 11 9 10 4 5 8 5 4 6 7 1999-00............ 21 15 6 12 10 5 5 4 6 6 6 4 2000-01............ 21 13 9 9 9 5 7 5 7 5 5 5 2001-02............ 22 9 8 8 14 10 9 4 6 6 2 2 2002-03............ 20 13 6 9 10 6 5 4 5 7 8 7 2003-04............ 23 9 7 8 13 5 6 8 3 5 6 7 2004-05............ 19 15 8 10 15 8 5 9 4 2 3 2 2005-06............ 20 11 6 9 8 7 8 8 5 5 5 8
All Hay 2/ May Jun Jul Aug Sep Oct Nov Dec Jan Feb Mar Apr May
1998-99 .......... 11 8 11 11 13 10 10 8 5 6 4 3 1999-00 .......... 10 9 11 11 10 10 10 9 6 6 4 4 2000-01 .......... 8 10 10 11 12 10 11 9 7 7 2 3 2001-02 .......... 4 8 7 12 11 13 10 10 9 6 7 3 2002-03 .......... 2 5 9 12 7 12 16 13 9 5 6 4 2003-04 .......... 3 6 12 9 9 8 7 10 10 15 5 6 2004-05 .......... 3 7 11 10 11 11 10 9 9 9 6 4 2005-06 .......... 3 8 10 12 9 12 8 9 9 9 6 5
1/ Dashes indicate only minor amount sold. 2/ Marketing year changed from June - May to May - April beginning with 2001 crop.
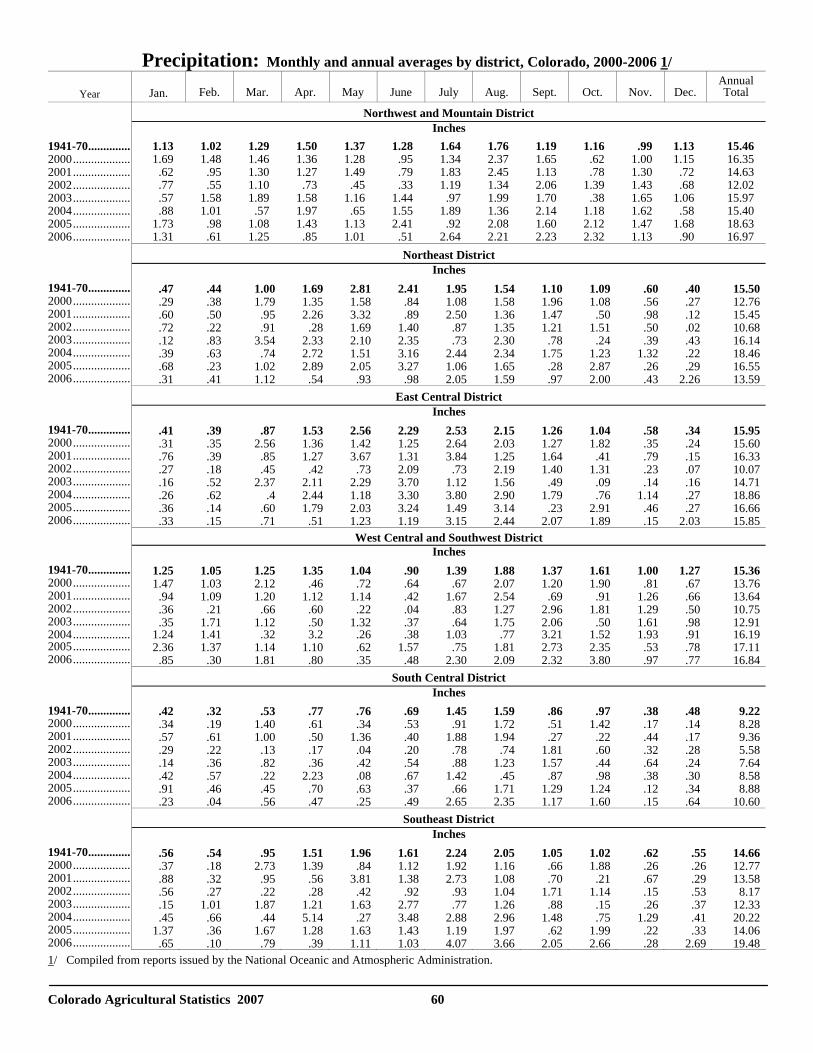
Colorado Agricultural Statistics 2007 60
Precipitation: Monthly and annual averages by district, Colorado, 2000-2006 1/
Year
Jan.
Feb.
Mar.
Apr.
May
June
July
Aug.
Sept.
Oct.
Nov.
Dec. Annual Total
Northwest and Mountain District Inches 1941-70.............. 1.13 1.02 1.29 1.50 1.37 1.28 1.64 1.76 1.19 1.16 .99 1.13 15.46 2000................... 1.69 1.48 1.46 1.36 1.28 .95 1.34 2.37 1.65 .62 1.00 1.15 16.35 2001................... .62 .95 1.30 1.27 1.49 .79 1.83 2.45 1.13 .78 1.30 .72 14.63 2002................... .77 .55 1.10 .73 .45 .33 1.19 1.34 2.06 1.39 1.43 .68 12.02 2003................... .57 1.58 1.89 1.58 1.16 1.44 .97 1.99 1.70 .38 1.65 1.06 15.97 2004................... .88 1.01 .57 1.97 .65 1.55 1.89 1.36 2.14 1.18 1.62 .58 15.40 2005................... 1.73 .98 1.08 1.43 1.13 2.41 .92 2.08 1.60 2.12 1.47 1.68 18.63 2006................... 1.31 .61 1.25 .85 1.01 .51 2.64 2.21 2.23 2.32 1.13 .90 16.97
Northeast District Inches 1941-70.............. .47 .44 1.00 1.69 2.81 2.41 1.95 1.54 1.10 1.09 .60 .40 15.502000................... .29 .38 1.79 1.35 1.58 .84 1.08 1.58 1.96 1.08 .56 .27 12.762001................... .60 .50 .95 2.26 3.32 .89 2.50 1.36 1.47 .50 .98 .12 15.452002................... .72 .22 .91 .28 1.69 1.40 .87 1.35 1.21 1.51 .50 .02 10.682003................... .12 .83 3.54 2.33 2.10 2.35 .73 2.30 .78 .24 .39 .43 16.142004................... .39 .63 .74 2.72 1.51 3.16 2.44 2.34 1.75 1.23 1.32 .22 18.462005................... .68 .23 1.02 2.89 2.05 3.27 1.06 1.65 .28 2.87 .26 .29 16.55 2006................... .31 .41 1.12 .54 .93 .98 2.05 1.59 .97 2.00 .43 2.26 13.59
East Central District Inches 1941-70.............. .41 .39 .87 1.53 2.56 2.29 2.53 2.15 1.26 1.04 .58 .34 15.952000................... .31 .35 2.56 1.36 1.42 1.25 2.64 2.03 1.27 1.82 .35 .24 15.602001................... .76 .39 .85 1.27 3.67 1.31 3.84 1.25 1.64 .41 .79 .15 16.332002................... .27 .18 .45 .42 .73 2.09 .73 2.19 1.40 1.31 .23 .07 10.072003................... .16 .52 2.37 2.11 2.29 3.70 1.12 1.56 .49 .09 .14 .16 14.712004................... .26 .62 .4 2.44 1.18 3.30 3.80 2.90 1.79 .76 1.14 .27 18.862005................... .36 .14 .60 1.79 2.03 3.24 1.49 3.14 .23 2.91 .46 .27 16.66 2006................... .33 .15 .71 .51 1.23 1.19 3.15 2.44 2.07 1.89 .15 2.03 15.85
West Central and Southwest District Inches 1941-70.............. 1.25 1.05 1.25 1.35 1.04 .90 1.39 1.88 1.37 1.61 1.00 1.27 15.362000................... 1.47 1.03 2.12 .46 .72 .64 .67 2.07 1.20 1.90 .81 .67 13.762001................... .94 1.09 1.20 1.12 1.14 .42 1.67 2.54 .69 .91 1.26 .66 13.642002................... .36 .21 .66 .60 .22 .04 .83 1.27 2.96 1.81 1.29 .50 10.752003................... .35 1.71 1.12 .50 1.32 .37 .64 1.75 2.06 .50 1.61 .98 12.912004................... 1.24 1.41 .32 3.2 .26 .38 1.03 .77 3.21 1.52 1.93 .91 16.192005................... 2.36 1.37 1.14 1.10 .62 1.57 .75 1.81 2.73 2.35 .53 .78 17.11 2006................... .85 .30 1.81 .80 .35 .48 2.30 2.09 2.32 3.80 .97 .77 16.84
South Central District Inches 1941-70.............. .42 .32 .53 .77 .76 .69 1.45 1.59 .86 .97 .38 .48 9.222000................... .34 .19 1.40 .61 .34 .53 .91 1.72 .51 1.42 .17 .14 8.282001................... .57 .61 1.00 .50 1.36 .40 1.88 1.94 .27 .22 .44 .17 9.362002................... .29 .22 .13 .17 .04 .20 .78 .74 1.81 .60 .32 .28 5.582003................... .14 .36 .82 .36 .42 .54 .88 1.23 1.57 .44 .64 .24 7.642004................... .42 .57 .22 2.23 .08 .67 1.42 .45 .87 .98 .38 .30 8.582005................... .91 .46 .45 .70 .63 .37 .66 1.71 1.29 1.24 .12 .34 8.88 2006................... .23 .04 .56 .47 .25 .49 2.65 2.35 1.17 1.60 .15 .64 10.60
Southeast District Inches 1941-70.............. .56 .54 .95 1.51 1.96 1.61 2.24 2.05 1.05 1.02 .62 .55 14.662000................... .37 .18 2.73 1.39 .84 1.12 1.92 1.16 .66 1.88 .26 .26 12.772001................... .88 .32 .95 .56 3.81 1.38 2.73 1.08 .70 .21 .67 .29 13.582002................... .56 .27 .22 .28 .42 .92 .93 1.04 1.71 1.14 .15 .53 8.172003................... .15 1.01 1.87 1.21 1.63 2.77 .77 1.26 .88 .15 .26 .37 12.332004................... .45 .66 .44 5.14 .27 3.48 2.88 2.96 1.48 .75 1.29 .41 20.222005................... 1.37 .36 1.67 1.28 1.63 1.43 1.19 1.97 .62 1.99 .22 .33 14.06 2006................... .65 .10 .79 .39 1.11 1.03 4.07 3.66 2.05 2.66 .28 2.69 19.48 1/ Compiled from reports issued by the National Oceanic and Atmospheric Administration.
FRUIT, VEGETABLES AND MISCELLANEOUS
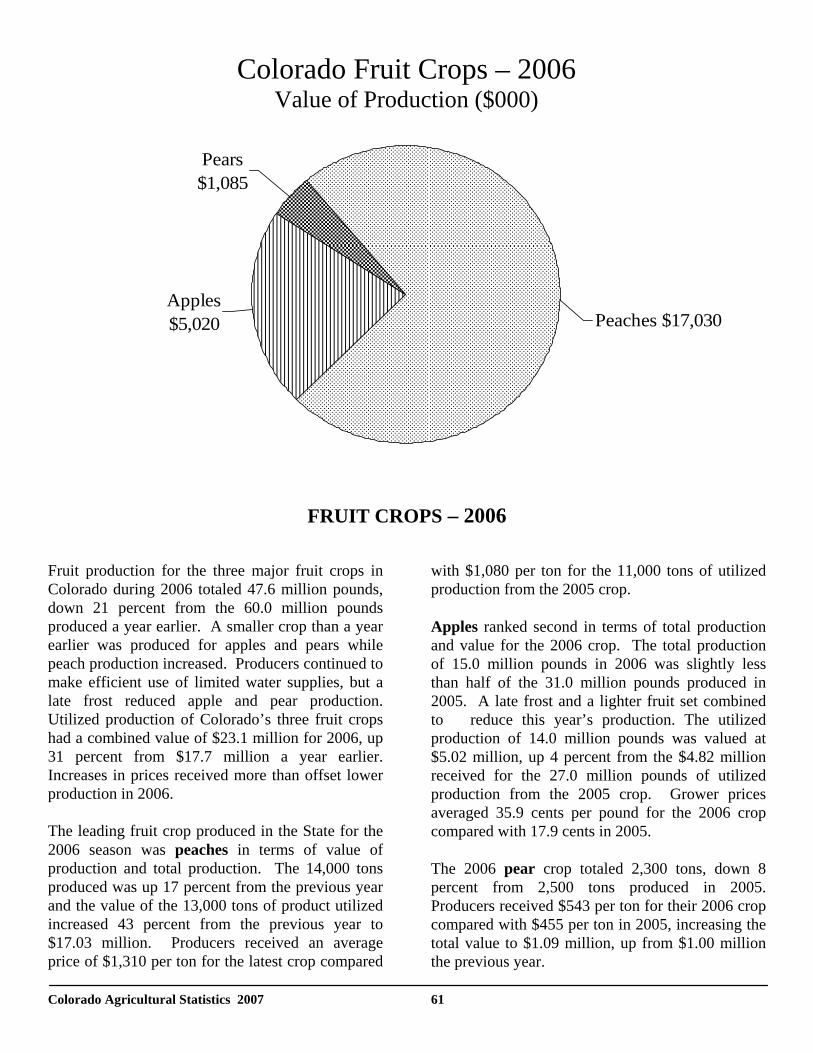
Colorado Agricultural Statistics 2007 61
FRUIT CROPS – 2006
Fruit production for the three major fruit crops in Colorado during 2006 totaled 47.6 million pounds, down 21 percent from the 60.0 million pounds produced a year earlier. A smaller crop than a year earlier was produced for apples and pears while peach production increased. Producers continued to make efficient use of limited water supplies, but a late frost reduced apple and pear production. Utilized production of Colorado’s three fruit crops had a combined value of $23.1 million for 2006, up 31 percent from $17.7 million a year earlier. Increases in prices received more than offset lower production in 2006. The leading fruit crop produced in the State for the 2006 season was peaches in terms of value of production and total production. The 14,000 tons produced was up 17 percent from the previous year and the value of the 13,000 tons of product utilized increased 43 percent from the previous year to $17.03 million. Producers received an average price of $1,310 per ton for the latest crop compared
with $1,080 per ton for the 11,000 tons of utilized production from the 2005 crop. Apples ranked second in terms of total production and value for the 2006 crop. The total production of 15.0 million pounds in 2006 was slightly less than half of the 31.0 million pounds produced in 2005. A late frost and a lighter fruit set combined to reduce this year’s production. The utilized production of 14.0 million pounds was valued at $5.02 million, up 4 percent from the $4.82 million received for the 27.0 million pounds of utilized production from the 2005 crop. Grower prices averaged 35.9 cents per pound for the 2006 crop compared with 17.9 cents in 2005. The 2006 pear crop totaled 2,300 tons, down 8 percent from 2,500 tons produced in 2005. Producers received $543 per ton for their 2006 crop compared with $455 per ton in 2005, increasing the total value to $1.09 million, up from $1.00 million the previous year.
Colorado Fruit Crops – 2006 Value of Production ($000)
Apples$5,020 Peaches $17,030
Pears$1,085
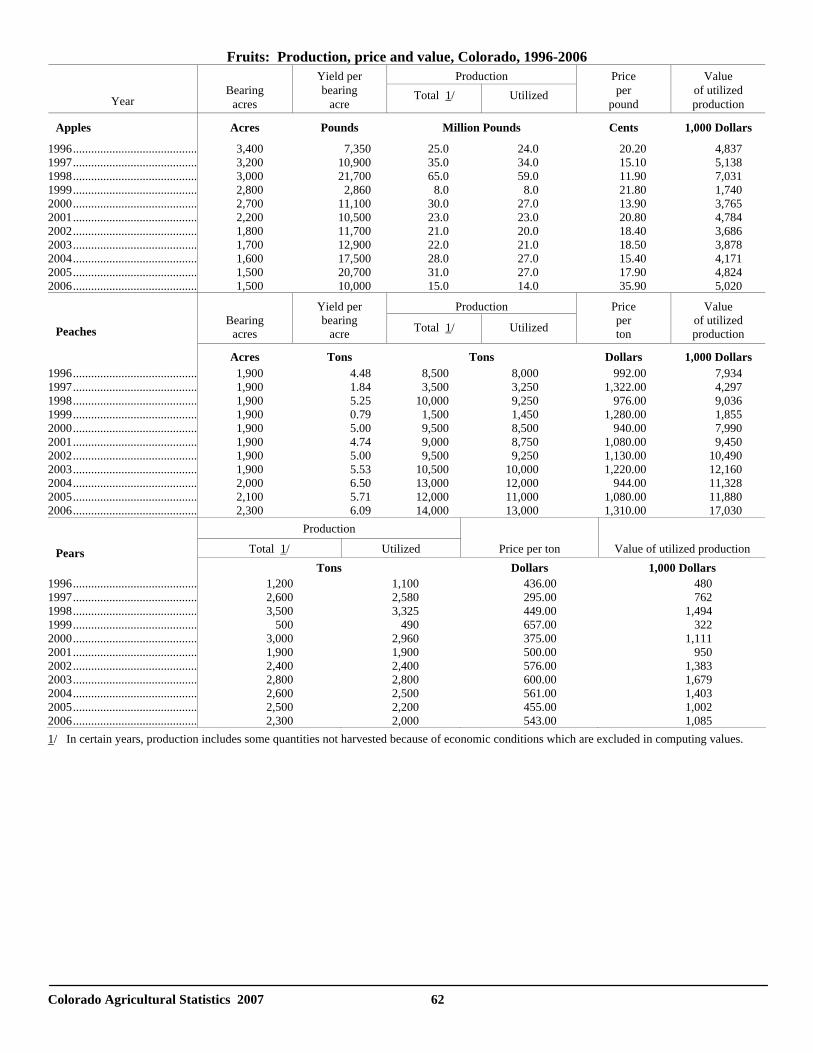
Colorado Agricultural Statistics 2007 62
Fruits: Production, price and value, Colorado, 1996-2006 Production
Year
Bearing
acres
Yield per bearing
acre Total 1/ Utilized
Price per
pound
Value of utilized production
Apples Acres Pounds Million Pounds Cents 1,000 Dollars
1996......................................... 3,400 7,350 25.0 24.0 20.20 4,837 1997......................................... 3,200 10,900 35.0 34.0 15.10 5,138 1998......................................... 3,000 21,700 65.0 59.0 11.90 7,031 1999......................................... 2,800 2,860 8.0 8.0 21.80 1,740 2000......................................... 2,700 11,100 30.0 27.0 13.90 3,765 2001......................................... 2,200 10,500 23.0 23.0 20.80 4,784 2002......................................... 1,800 11,700 21.0 20.0 18.40 3,686 2003......................................... 1,700 12,900 22.0 21.0 18.50 3,878 2004......................................... 1,600 17,500 28.0 27.0 15.40 4,171 2005......................................... 1,500 20,700 31.0 27.0 17.90 4,824 2006......................................... 1,500 10,000 15.0 14.0 35.90 5,020
Production Bearing
acres
Yield per bearing
acre Total 1/ Utilized
Price per ton
Value of utilized production Peaches
Acres Tons Tons Dollars 1,000 Dollars 1996......................................... 1,900 4.48 8,500 8,000 992.00 7,934 1997......................................... 1,900 1.84 3,500 3,250 1,322.00 4,297 1998......................................... 1,900 5.25 10,000 9,250 976.00 9,036 1999......................................... 1,900 0.79 1,500 1,450 1,280.00 1,855 2000......................................... 1,900 5.00 9,500 8,500 940.00 7,990 2001......................................... 1,900 4.74 9,000 8,750 1,080.00 9,450 2002......................................... 1,900 5.00 9,500 9,250 1,130.00 10,490 2003......................................... 1,900 5.53 10,500 10,000 1,220.00 12,160 2004......................................... 2,000 6.50 13,000 12,000 944.00 11,328 2005......................................... 2,100 5.71 12,000 11,000 1,080.00 11,880 2006......................................... 2,300 6.09 14,000 13,000 1,310.00 17,030
Production
Total 1/ Utilized Price per ton Value of utilized production
Pears
Tons Dollars 1,000 Dollars 1996......................................... 1,200 1,100 436.00 480 1997......................................... 2,600 2,580 295.00 762 1998......................................... 3,500 3,325 449.00 1,494 1999......................................... 500 490 657.00 322 2000......................................... 3,000 2,960 375.00 1,111 2001......................................... 1,900 1,900 500.00 950 2002......................................... 2,400 2,400 576.00 1,383 2003......................................... 2,800 2,800 600.00 1,679 2004......................................... 2,600 2,500 561.00 1,403 2005......................................... 2,500 2,200 455.00 1,002 2006......................................... 2,300 2,000 543.00 1,085 1/ In certain years, production includes some quantities not harvested because of economic conditions which are excluded in computing values.
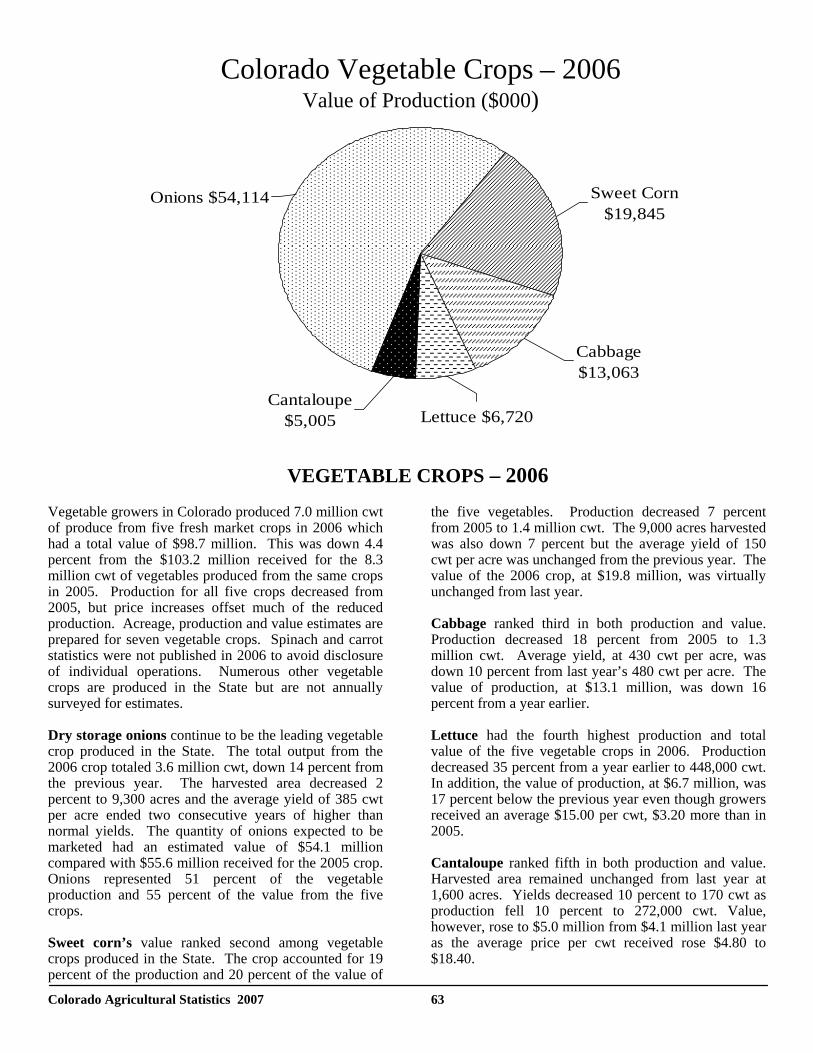
Colorado Agricultural Statistics 2007 63
VEGETABLE CROPS – 2006 Vegetable growers in Colorado produced 7.0 million cwt of produce from five fresh market crops in 2006 which had a total value of $98.7 million. This was down 4.4 percent from the $103.2 million received for the 8.3 million cwt of vegetables produced from the same crops in 2005. Production for all five crops decreased from 2005, but price increases offset much of the reduced production. Acreage, production and value estimates are prepared for seven vegetable crops. Spinach and carrot statistics were not published in 2006 to avoid disclosure of individual operations. Numerous other vegetable crops are produced in the State but are not annually surveyed for estimates. Dry storage onions continue to be the leading vegetable crop produced in the State. The total output from the 2006 crop totaled 3.6 million cwt, down 14 percent from the previous year. The harvested area decreased 2 percent to 9,300 acres and the average yield of 385 cwt per acre ended two consecutive years of higher than normal yields. The quantity of onions expected to be marketed had an estimated value of $54.1 million compared with $55.6 million received for the 2005 crop. Onions represented 51 percent of the vegetable production and 55 percent of the value from the five crops. Sweet corn’s value ranked second among vegetable crops produced in the State. The crop accounted for 19 percent of the production and 20 percent of the value of
the five vegetables. Production decreased 7 percent from 2005 to 1.4 million cwt. The 9,000 acres harvested was also down 7 percent but the average yield of 150 cwt per acre was unchanged from the previous year. The value of the 2006 crop, at $19.8 million, was virtually unchanged from last year. Cabbage ranked third in both production and value. Production decreased 18 percent from 2005 to 1.3 million cwt. Average yield, at 430 cwt per acre, was down 10 percent from last year’s 480 cwt per acre. The value of production, at $13.1 million, was down 16 percent from a year earlier. Lettuce had the fourth highest production and total value of the five vegetable crops in 2006. Production decreased 35 percent from a year earlier to 448,000 cwt. In addition, the value of production, at $6.7 million, was 17 percent below the previous year even though growers received an average $15.00 per cwt, $3.20 more than in 2005. Cantaloupe ranked fifth in both production and value. Harvested area remained unchanged from last year at 1,600 acres. Yields decreased 10 percent to 170 cwt as production fell 10 percent to 272,000 cwt. Value, however, rose to $5.0 million from $4.1 million last year as the average price per cwt received rose $4.80 to $18.40.
Colorado Vegetable Crops – 2006 Value of Production ($000)
Onions $54,114 Sweet Corn $19,845
Cabbage $13,063
Lettuce $6,720Cantaloupe
$5,005
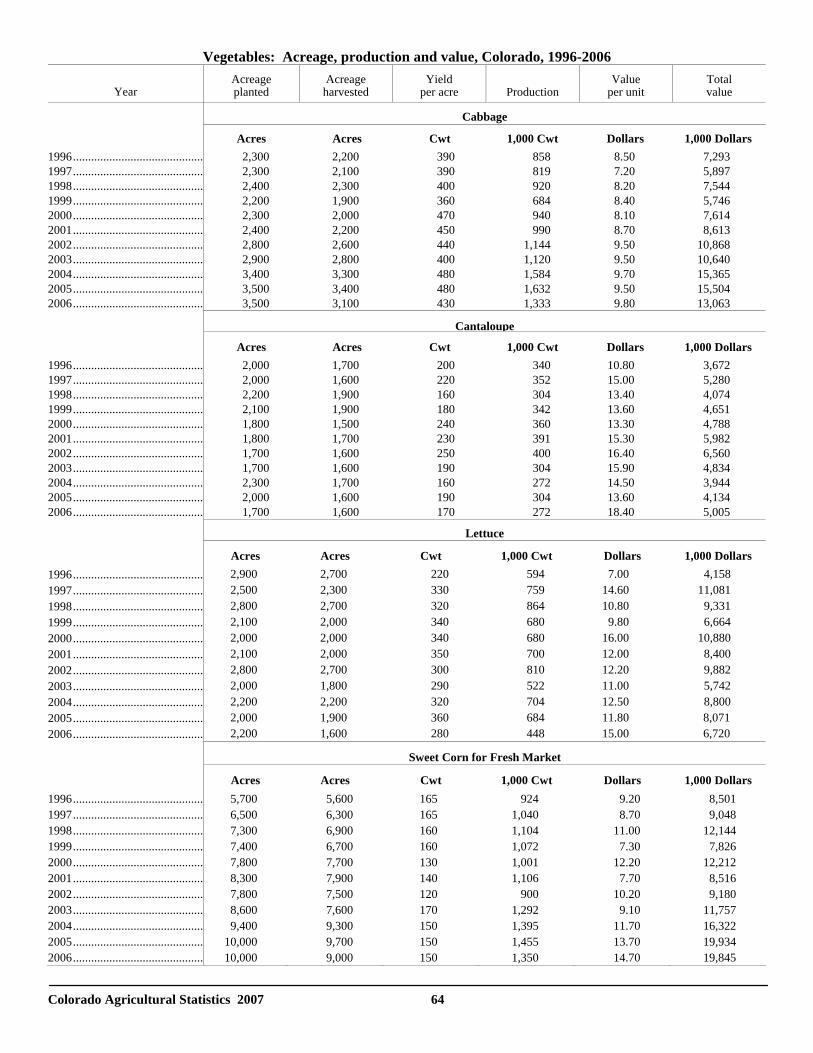
Colorado Agricultural Statistics 2007 64
Vegetables: Acreage, production and value, Colorado, 1996-2006
Year Acreage planted
Acreage harvested
Yield per acre
Production
Value per unit
Total value
Cabbage
Acres Acres Cwt 1,000 Cwt Dollars 1,000 Dollars 1996........................................... 2,300 2,200 390 858 8.50 7,293 1997........................................... 2,300 2,100 390 819 7.20 5,897 1998........................................... 2,400 2,300 400 920 8.20 7,544 1999........................................... 2,200 1,900 360 684 8.40 5,746 2000........................................... 2,300 2,000 470 940 8.10 7,614 2001........................................... 2,400 2,200 450 990 8.70 8,613 2002........................................... 2,800 2,600 440 1,144 9.50 10,868 2003........................................... 2,900 2,800 400 1,120 9.50 10,640 2004........................................... 3,400 3,300 480 1,584 9.70 15,365 2005........................................... 3,500 3,400 480 1,632 9.50 15,504 2006........................................... 3,500 3,100 430 1,333 9.80 13,063
Cantaloupe
Acres Acres Cwt 1,000 Cwt Dollars 1,000 Dollars 1996........................................... 2,000 1,700 200 340 10.80 3,672 1997........................................... 2,000 1,600 220 352 15.00 5,280 1998........................................... 2,200 1,900 160 304 13.40 4,074 1999........................................... 2,100 1,900 180 342 13.60 4,651 2000........................................... 1,800 1,500 240 360 13.30 4,788 2001........................................... 1,800 1,700 230 391 15.30 5,982 2002........................................... 1,700 1,600 250 400 16.40 6,560 2003........................................... 1,700 1,600 190 304 15.90 4,834 2004........................................... 2,300 1,700 160 272 14.50 3,944 2005........................................... 2,000 1,600 190 304 13.60 4,134 2006........................................... 1,700 1,600 170 272 18.40 5,005
Lettuce
Acres Acres Cwt 1,000 Cwt Dollars 1,000 Dollars 1996........................................... 2,900 2,700 220 594 7.00 4,158 1997........................................... 2,500 2,300 330 759 14.60 11,081 1998........................................... 2,800 2,700 320 864 10.80 9,331 1999........................................... 2,100 2,000 340 680 9.80 6,664 2000........................................... 2,000 2,000 340 680 16.00 10,880 2001........................................... 2,100 2,000 350 700 12.00 8,400 2002........................................... 2,800 2,700 300 810 12.20 9,882 2003........................................... 2,000 1,800 290 522 11.00 5,742 2004........................................... 2,200 2,200 320 704 12.50 8,800 2005........................................... 2,000 1,900 360 684 11.80 8,071 2006........................................... 2,200 1,600 280 448 15.00 6,720
Sweet Corn for Fresh Market
Acres Acres Cwt 1,000 Cwt Dollars 1,000 Dollars 1996........................................... 5,700 5,600 165 924 9.20 8,501 1997........................................... 6,500 6,300 165 1,040 8.70 9,048 1998........................................... 7,300 6,900 160 1,104 11.00 12,144 1999........................................... 7,400 6,700 160 1,072 7.30 7,826 2000........................................... 7,800 7,700 130 1,001 12.20 12,212 2001........................................... 8,300 7,900 140 1,106 7.70 8,516 2002........................................... 7,800 7,500 120 900 10.20 9,180 2003........................................... 8,600 7,600 170 1,292 9.10 11,757 2004........................................... 9,400 9,300 150 1,395 11.70 16,322 2005........................................... 10,000 9,700 150 1,455 13.70 19,934 2006........................................... 10,000 9,000 150 1,350 14.70 19,845
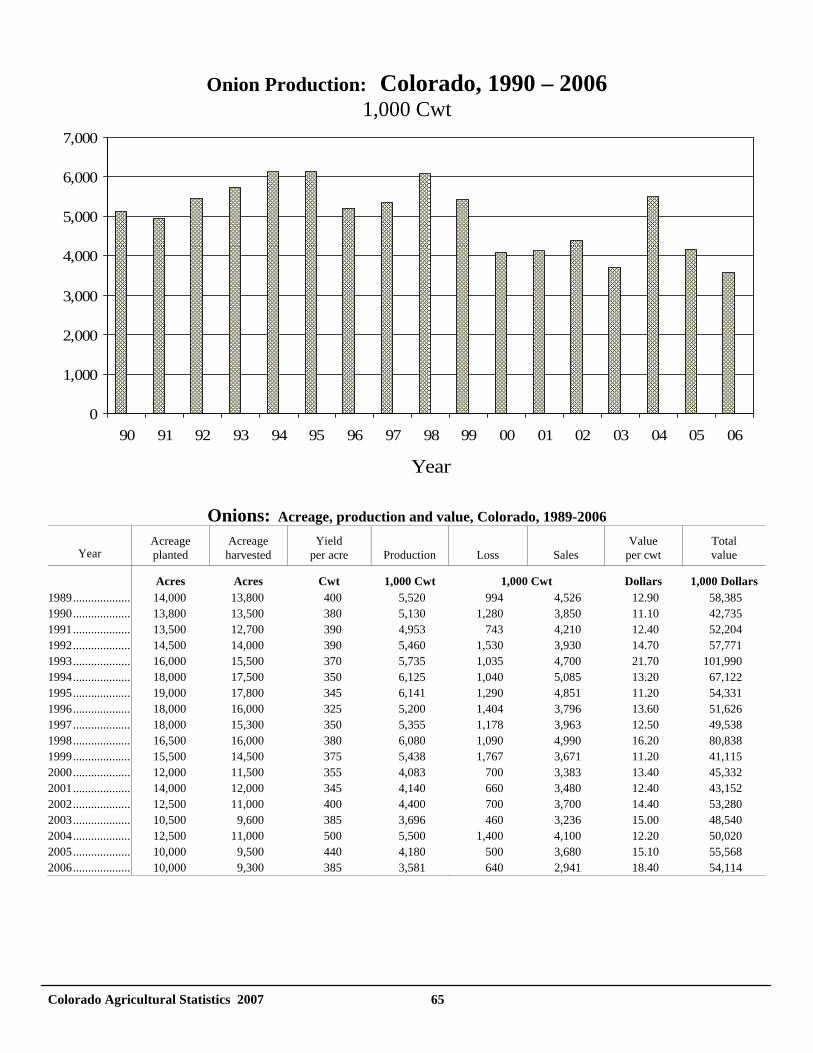
Colorado Agricultural Statistics 2007 65
Onions: Acreage, production and value, Colorado, 1989-2006
Year
Acreage planted
Acreage harvested
Yield per acre
Production
Loss
Sales
Value per cwt
Total value
Acres Acres Cwt 1,000 Cwt 1,000 Cwt Dollars 1,000 Dollars 1989................... 14,000 13,800 400 5,520 994 4,526 12.90 58,385 1990................... 13,800 13,500 380 5,130 1,280 3,850 11.10 42,735 1991................... 13,500 12,700 390 4,953 743 4,210 12.40 52,204 1992................... 14,500 14,000 390 5,460 1,530 3,930 14.70 57,771 1993................... 16,000 15,500 370 5,735 1,035 4,700 21.70 101,990 1994................... 18,000 17,500 350 6,125 1,040 5,085 13.20 67,122 1995................... 19,000 17,800 345 6,141 1,290 4,851 11.20 54,331 1996................... 18,000 16,000 325 5,200 1,404 3,796 13.60 51,626 1997................... 18,000 15,300 350 5,355 1,178 3,963 12.50 49,538 1998................... 16,500 16,000 380 6,080 1,090 4,990 16.20 80,838 1999................... 15,500 14,500 375 5,438 1,767 3,671 11.20 41,115 2000................... 12,000 11,500 355 4,083 700 3,383 13.40 45,332 2001................... 14,000 12,000 345 4,140 660 3,480 12.40 43,152 2002................... 12,500 11,000 400 4,400 700 3,700 14.40 53,280 2003................... 10,500 9,600 385 3,696 460 3,236 15.00 48,540 2004................... 12,500 11,000 500 5,500 1,400 4,100 12.20 50,020 2005................... 10,000 9,500 440 4,180 500 3,680 15.10 55,568 2006................... 10,000 9,300 385 3,581 640 2,941 18.40 54,114
Onion Production: Colorado, 1990 – 2006 1,000 Cwt
0
1,000
2,000
3,000
4,000
5,000
6,000
7,000
90 91 92 93 94 95 96 97 98 99 00 01 02 03 04 05 06
Year
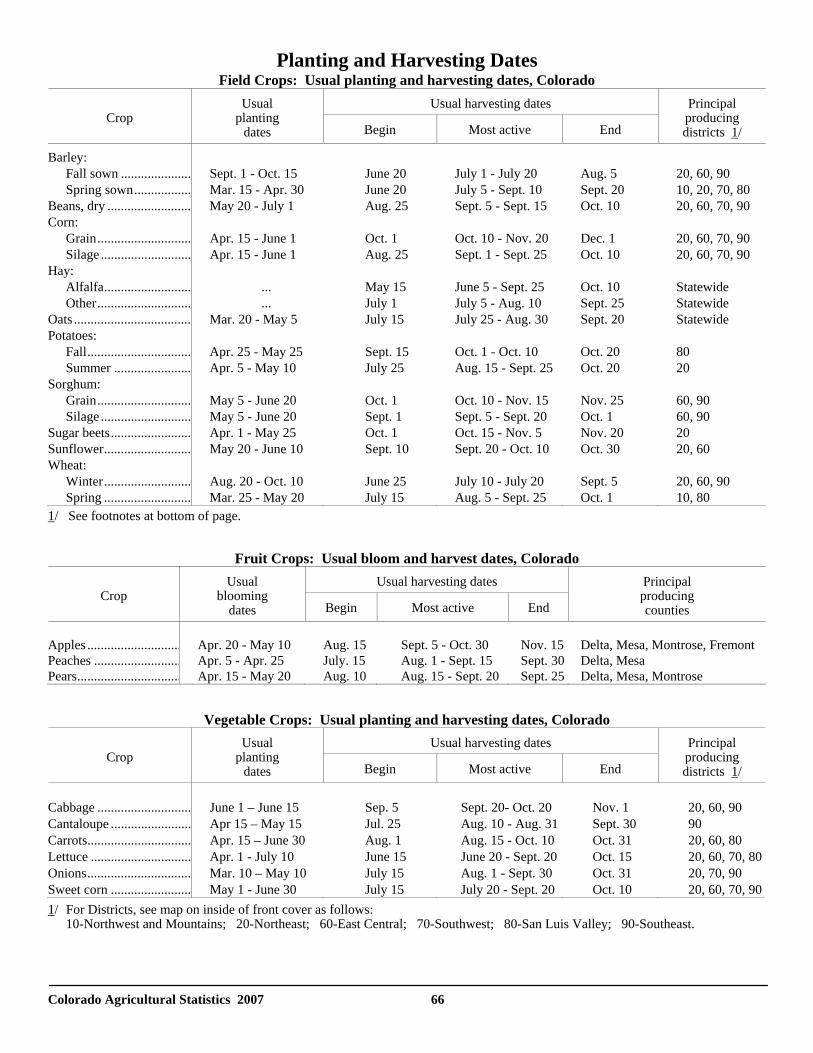
Colorado Agricultural Statistics 2007 66
Planting and Harvesting Dates Field Crops: Usual planting and harvesting dates, Colorado
Usual harvesting dates Crop
Usual planting
dates Begin Most active End
Principal producing districts 1/
Barley: Fall sown ..................... Sept. 1 - Oct. 15 June 20 July 1 - July 20 Aug. 5 20, 60, 90 Spring sown................. Mar. 15 - Apr. 30 June 20 July 5 - Sept. 10 Sept. 20 10, 20, 70, 80 Beans, dry ......................... May 20 - July 1 Aug. 25 Sept. 5 - Sept. 15 Oct. 10 20, 60, 70, 90 Corn: Grain............................ Apr. 15 - June 1 Oct. 1 Oct. 10 - Nov. 20 Dec. 1 20, 60, 70, 90 Silage ........................... Apr. 15 - June 1 Aug. 25 Sept. 1 - Sept. 25 Oct. 10 20, 60, 70, 90 Hay: Alfalfa.......................... ... May 15 June 5 - Sept. 25 Oct. 10 Statewide Other............................ ... July 1 July 5 - Aug. 10 Sept. 25 Statewide Oats ................................... Mar. 20 - May 5 July 15 July 25 - Aug. 30 Sept. 20 Statewide Potatoes: Fall............................... Apr. 25 - May 25 Sept. 15 Oct. 1 - Oct. 10 Oct. 20 80 Summer ....................... Apr. 5 - May 10 July 25 Aug. 15 - Sept. 25 Oct. 20 20 Sorghum: Grain............................ May 5 - June 20 Oct. 1 Oct. 10 - Nov. 15 Nov. 25 60, 90 Silage ........................... May 5 - June 20 Sept. 1 Sept. 5 - Sept. 20 Oct. 1 60, 90 Sugar beets........................ Apr. 1 - May 25 Oct. 1 Oct. 15 - Nov. 5 Nov. 20 20 Sunflower.......................... May 20 - June 10 Sept. 10 Sept. 20 - Oct. 10 Oct. 30 20, 60 Wheat: Winter.......................... Aug. 20 - Oct. 10 June 25 July 10 - July 20 Sept. 5 20, 60, 90 Spring .......................... Mar. 25 - May 20 July 15 Aug. 5 - Sept. 25 Oct. 1 10, 80 1/ See footnotes at bottom of page.
Fruit Crops: Usual bloom and harvest dates, Colorado Usual harvesting dates
Crop Usual
blooming dates Begin Most active End
Principal producing counties
Apples ............................ Apr. 20 - May 10 Aug. 15 Sept. 5 - Oct. 30 Nov. 15 Delta, Mesa, Montrose, Fremont Peaches .......................... Apr. 5 - Apr. 25 July. 15 Aug. 1 - Sept. 15 Sept. 30 Delta, Mesa Pears............................... Apr. 15 - May 20 Aug. 10 Aug. 15 - Sept. 20 Sept. 25 Delta, Mesa, Montrose
Vegetable Crops: Usual planting and harvesting dates, Colorado
Usual harvesting dates Crop
Usual planting
dates Begin Most active End
Principal producing districts 1/
Cabbage ............................ June 1 – June 15 Sep. 5 Sept. 20- Oct. 20 Nov. 1 20, 60, 90 Cantaloupe ........................ Apr 15 – May 15 Jul. 25 Aug. 10 - Aug. 31 Sept. 30 90 Carrots............................... Apr. 15 – June 30 Aug. 1 Aug. 15 - Oct. 10 Oct. 31 20, 60, 80 Lettuce .............................. Apr. 1 - July 10 June 15 June 20 - Sept. 20 Oct. 15 20, 60, 70, 80Onions............................... Mar. 10 – May 10 July 15 Aug. 1 - Sept. 30 Oct. 31 20, 70, 90 Sweet corn ........................ May 1 - June 30 July 15 July 20 - Sept. 20 Oct. 10 20, 60, 70, 90 1/ For Districts, see map on inside of front cover as follows: 10-Northwest and Mountains; 20-Northeast; 60-East Central; 70-Southwest; 80-San Luis Valley; 90-Southeast.
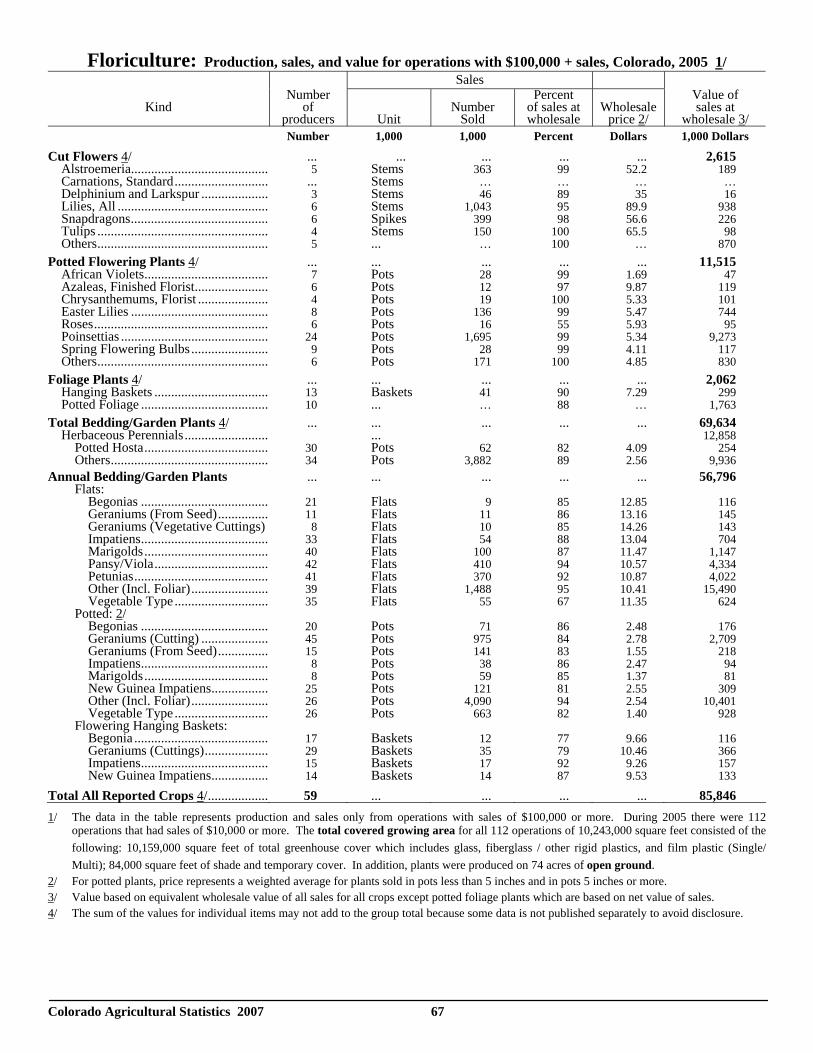
Colorado Agricultural Statistics 2007 67
Floriculture: Production, sales, and value for operations with $100,000 + sales, Colorado, 2005 1/ Sales
Kind Number
of producers
Unit
Number
Sold
Percent of sales at wholesale
Wholesale
price 2/
Value of sales at
wholesale 3/ Number 1,000 1,000 Percent Dollars 1,000 Dollars
Cut Flowers 4/ ... ... ... ... ... 2,615 Alstroemeria......................................... 5 Stems 363 99 52.2 189 Carnations, Standard............................ ... Stems … … … … Delphinium and Larkspur .................... 3 Stems 46 89 35 16 Lilies, All ............................................. 6 Stems 1,043 95 89.9 938 Snapdragons......................................... 6 Spikes 399 98 56.6 226 Tulips ................................................... 4 Stems 150 100 65.5 98 Others................................................... 5 ... … 100 … 870 Potted Flowering Plants 4/ ... ... ... ... ... 11,515 African Violets..................................... 7 Pots 28 99 1.69 47 Azaleas, Finished Florist...................... 6 Pots 12 97 9.87 119 Chrysanthemums, Florist ..................... 4 Pots 19 100 5.33 101 Easter Lilies ......................................... 8 Pots 136 99 5.47 744 Roses.................................................... 6 Pots 16 55 5.93 95 Poinsettias ............................................ 24 Pots 1,695 99 5.34 9,273 Spring Flowering Bulbs ....................... 9 Pots 28 99 4.11 117 Others................................................... 6 Pots 171 100 4.85 830 Foliage Plants 4/ ... ... ... ... ... 2,062 Hanging Baskets .................................. 13 Baskets 41 90 7.29 299 Potted Foliage ...................................... 10 ... … 88 … 1,763 Total Bedding/Garden Plants 4/ ... ... ... ... ... 69,634 Herbaceous Perennials......................... ... 12,858 Potted Hosta..................................... 30 Pots 62 82 4.09 254 Others............................................... 34 Pots 3,882 89 2.56 9,936 Annual Bedding/Garden Plants ... ... ... ... ... 56,796 Flats: Begonias ...................................... 21 Flats 9 85 12.85 116 Geraniums (From Seed)............... 11 Flats 11 86 13.16 145 Geraniums (Vegetative Cuttings) 8 Flats 10 85 14.26 143 Impatiens...................................... 33 Flats 54 88 13.04 704 Marigolds..................................... 40 Flats 100 87 11.47 1,147 Pansy/Viola.................................. 42 Flats 410 94 10.57 4,334 Petunias........................................ 41 Flats 370 92 10.87 4,022 Other (Incl. Foliar)....................... 39 Flats 1,488 95 10.41 15,490 Vegetable Type............................ 35 Flats 55 67 11.35 624 Potted: 2/ Begonias ...................................... 20 Pots 71 86 2.48 176 Geraniums (Cutting) .................... 45 Pots 975 84 2.78 2,709 Geraniums (From Seed)............... 15 Pots 141 83 1.55 218 Impatiens...................................... 8 Pots 38 86 2.47 94 Marigolds..................................... 8 Pots 59 85 1.37 81 New Guinea Impatiens................. 25 Pots 121 81 2.55 309 Other (Incl. Foliar)....................... 26 Pots 4,090 94 2.54 10,401 Vegetable Type............................ 26 Pots 663 82 1.40 928 Flowering Hanging Baskets: Begonia ........................................ 17 Baskets 12 77 9.66 116 Geraniums (Cuttings)................... 29 Baskets 35 79 10.46 366 Impatiens...................................... 15 Baskets 17 92 9.26 157 New Guinea Impatiens................. 14 Baskets 14 87 9.53 133
Total All Reported Crops 4/.................. 59 ... ... ... ... 85,846 1/ The data in the table represents production and sales only from operations with sales of $100,000 or more. During 2005 there were 112
operations that had sales of $10,000 or more. The total covered growing area for all 112 operations of 10,243,000 square feet consisted of the following: 10,159,000 square feet of total greenhouse cover which includes glass, fiberglass / other rigid plastics, and film plastic (Single/ Multi); 84,000 square feet of shade and temporary cover. In addition, plants were produced on 74 acres of open ground.
2/ For potted plants, price represents a weighted average for plants sold in pots less than 5 inches and in pots 5 inches or more. 3/ Value based on equivalent wholesale value of all sales for all crops except potted foliage plants which are based on net value of sales. 4/ The sum of the values for individual items may not add to the group total because some data is not published separately to avoid disclosure.
FARM INCOME AND PRICES
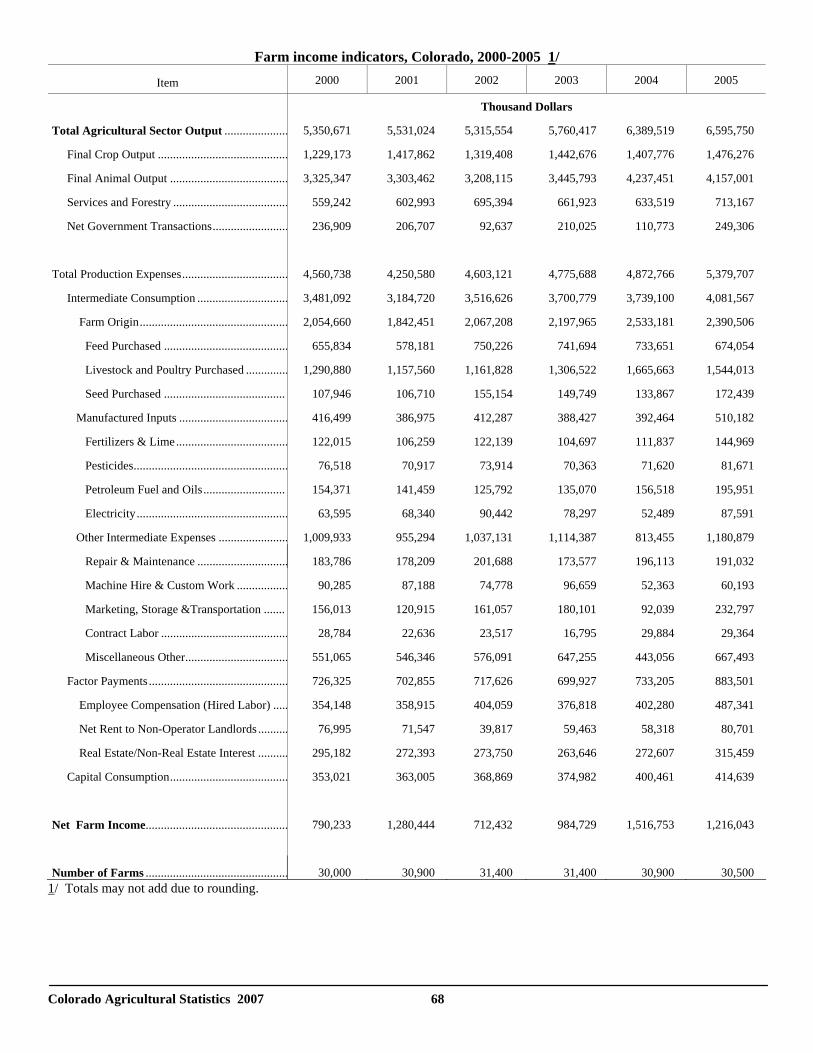
Colorado Agricultural Statistics 2007 68
Farm income indicators, Colorado, 2000-2005 1/
Item 2000 2001 2002 2003 2004 2005
Thousand Dollars
Total Agricultural Sector Output ..................... 5,350,671 5,531,024 5,315,554 5,760,417 6,389,519 6,595,750
Final Crop Output ........................................... 1,229,173 1,417,862 1,319,408 1,442,676 1,407,776 1,476,276
Final Animal Output ....................................... 3,325,347 3,303,462 3,208,115 3,445,793 4,237,451 4,157,001
Services and Forestry ...................................... 559,242 602,993 695,394 661,923 633,519 713,167
Net Government Transactions......................... 236,909 206,707 92,637 210,025 110,773 249,306
Total Production Expenses................................... 4,560,738 4,250,580 4,603,121 4,775,688 4,872,766 5,379,707
Intermediate Consumption .............................. 3,481,092 3,184,720 3,516,626 3,700,779 3,739,100 4,081,567
Farm Origin................................................. 2,054,660 1,842,451 2,067,208 2,197,965 2,533,181 2,390,506
Feed Purchased ......................................... 655,834 578,181 750,226 741,694 733,651 674,054
Livestock and Poultry Purchased .............. 1,290,880 1,157,560 1,161,828 1,306,522 1,665,663 1,544,013
Seed Purchased ........................................ 107,946 106,710 155,154 149,749 133,867 172,439
Manufactured Inputs .................................... 416,499 386,975 412,287 388,427 392,464 510,182
Fertilizers & Lime..................................... 122,015 106,259 122,139 104,697 111,837 144,969
Pesticides................................................... 76,518 70,917 73,914 70,363 71,620 81,671
Petroleum Fuel and Oils........................... 154,371 141,459 125,792 135,070 156,518 195,951
Electricity.................................................. 63,595 68,340 90,442 78,297 52,489 87,591
Other Intermediate Expenses ....................... 1,009,933 955,294 1,037,131 1,114,387 813,455 1,180,879
Repair & Maintenance .............................. 183,786 178,209 201,688 173,577 196,113 191,032
Machine Hire & Custom Work ................. 90,285 87,188 74,778 96,659 52,363 60,193
Marketing, Storage &Transportation ....... 156,013 120,915 161,057 180,101 92,039 232,797
Contract Labor .......................................... 28,784 22,636 23,517 16,795 29,884 29,364
Miscellaneous Other.................................. 551,065 546,346 576,091 647,255 443,056 667,493
Factor Payments .............................................. 726,325 702,855 717,626 699,927 733,205 883,501
Employee Compensation (Hired Labor) ..... 354,148 358,915 404,059 376,818 402,280 487,341
Net Rent to Non-Operator Landlords .......... 76,995 71,547 39,817 59,463 58,318 80,701
Real Estate/Non-Real Estate Interest .......... 295,182 272,393 273,750 263,646 272,607 315,459
Capital Consumption....................................... 353,021 363,005 368,869 374,982 400,461 414,639
Net Farm Income............................................... 790,233 1,280,444 712,432 984,729 1,516,753 1,216,043
Number of Farms ............................................... 30,000 30,900 31,400 31,400 30,900 30,500 1/ Totals may not add due to rounding.
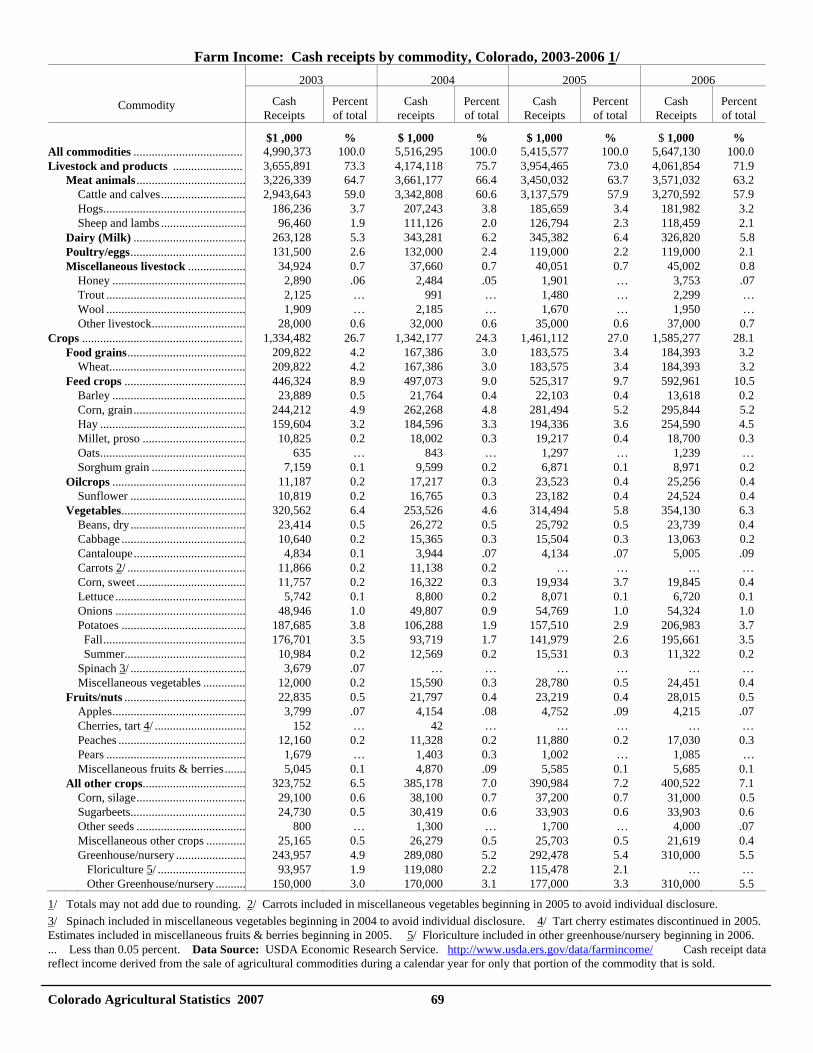
Colorado Agricultural Statistics 2007 69
Farm Income: Cash receipts by commodity, Colorado, 2003-2006 1/ 2003 2004 2005 2006
Commodity Cash
Receipts Percent of total
Cash receipts
Percent of total
Cash Receipts
Percent of total
Cash Receipts
Percent of total
$1 ,000 % $ 1,000 % $ 1,000 % $ 1,000 %All commodities .................................... 4,990,373 100.0 5,516,295 100.0 5,415,577 100.0 5,647,130 100.0 Livestock and products ....................... 3,655,891 73.3 4,174,118 75.7 3,954,465 73.0 4,061,854 71.9 Meat animals .................................... 3,226,339 64.7 3,661,177 66.4 3,450,032 63.7 3,571,032 63.2 Cattle and calves............................ 2,943,643 59.0 3,342,808 60.6 3,137,579 57.9 3,270,592 57.9 Hogs............................................... 186,236 3.7 207,243 3.8 185,659 3.4 181,982 3.2 Sheep and lambs ............................ 96,460 1.9 111,126 2.0 126,794 2.3 118,459 2.1 Dairy (Milk) ..................................... 263,128 5.3 343,281 6.2 345,382 6.4 326,820 5.8 Poultry/eggs...................................... 131,500 2.6 132,000 2.4 119,000 2.2 119,000 2.1 Miscellaneous livestock ................... 34,924 0.7 37,660 0.7 40,051 0.7 45,002 0.8 Honey ............................................ 2,890 .06 2,484 .05 1,901 … 3,753 .07 Trout .............................................. 2,125 … 991 … 1,480 … 2,299 … Wool .............................................. 1,909 … 2,185 … 1,670 … 1,950 … Other livestock............................... 28,000 0.6 32,000 0.6 35,000 0.6 37,000 0.7 Crops ..................................................... 1,334,482 26.7 1,342,177 24.3 1,461,112 27.0 1,585,277 28.1 Food grains....................................... 209,822 4.2 167,386 3.0 183,575 3.4 184,393 3.2 Wheat............................................. 209,822 4.2 167,386 3.0 183,575 3.4 184,393 3.2 Feed crops ........................................ 446,324 8.9 497,073 9.0 525,317 9.7 592,961 10.5 Barley ............................................ 23,889 0.5 21,764 0.4 22,103 0.4 13,618 0.2 Corn, grain..................................... 244,212 4.9 262,268 4.8 281,494 5.2 295,844 5.2 Hay ................................................ 159,604 3.2 184,596 3.3 194,336 3.6 254,590 4.5 Millet, proso .................................. 10,825 0.2 18,002 0.3 19,217 0.4 18,700 0.3 Oats................................................ 635 … 843 … 1,297 … 1,239 … Sorghum grain ............................... 7,159 0.1 9,599 0.2 6,871 0.1 8,971 0.2 Oilcrops ............................................ 11,187 0.2 17,217 0.3 23,523 0.4 25,256 0.4 Sunflower ...................................... 10,819 0.2 16,765 0.3 23,182 0.4 24,524 0.4 Vegetables......................................... 320,562 6.4 253,526 4.6 314,494 5.8 354,130 6.3 Beans, dry ...................................... 23,414 0.5 26,272 0.5 25,792 0.5 23,739 0.4 Cabbage ......................................... 10,640 0.2 15,365 0.3 15,504 0.3 13,063 0.2 Cantaloupe..................................... 4,834 0.1 3,944 .07 4,134 .07 5,005 .09 Carrots 2/ ....................................... 11,866 0.2 11,138 0.2 … … … … Corn, sweet .................................... 11,757 0.2 16,322 0.3 19,934 3.7 19,845 0.4 Lettuce ........................................... 5,742 0.1 8,800 0.2 8,071 0.1 6,720 0.1 Onions ........................................... 48,946 1.0 49,807 0.9 54,769 1.0 54,324 1.0 Potatoes ......................................... 187,685 3.8 106,288 1.9 157,510 2.9 206,983 3.7 Fall............................................... 176,701 3.5 93,719 1.7 141,979 2.6 195,661 3.5 Summer........................................ 10,984 0.2 12,569 0.2 15,531 0.3 11,322 0.2 Spinach 3/ ...................................... 3,679 .07 … … … … … … Miscellaneous vegetables .............. 12,000 0.2 15,590 0.3 28,780 0.5 24,451 0.4 Fruits/nuts ........................................ 22,835 0.5 21,797 0.4 23,219 0.4 28,015 0.5 Apples............................................ 3,799 .07 4,154 .08 4,752 .09 4,215 .07 Cherries, tart 4/ .............................. 152 … 42 … … … … … Peaches .......................................... 12,160 0.2 11,328 0.2 11,880 0.2 17,030 0.3 Pears .............................................. 1,679 … 1,403 0.3 1,002 … 1,085 … Miscellaneous fruits & berries....... 5,045 0.1 4,870 .09 5,585 0.1 5,685 0.1 All other crops.................................. 323,752 6.5 385,178 7.0 390,984 7.2 400,522 7.1 Corn, silage.................................... 29,100 0.6 38,100 0.7 37,200 0.7 31,000 0.5 Sugarbeets...................................... 24,730 0.5 30,419 0.6 33,903 0.6 33,903 0.6 Other seeds .................................... 800 … 1,300 … 1,700 … 4,000 .07 Miscellaneous other crops ............. 25,165 0.5 26,279 0.5 25,703 0.5 21,619 0.4 Greenhouse/nursery ....................... 243,957 4.9 289,080 5.2 292,478 5.4 310,000 5.5 Floriculture 5/ ............................. 93,957 1.9 119,080 2.2 115,478 2.1 … … Other Greenhouse/nursery .......... 150,000 3.0 170,000 3.1 177,000 3.3 310,000 5.5 1/ Totals may not add due to rounding. 2/ Carrots included in miscellaneous vegetables beginning in 2005 to avoid individual disclosure. 3/ Spinach included in miscellaneous vegetables beginning in 2004 to avoid individual disclosure. 4/ Tart cherry estimates discontinued in 2005. Estimates included in miscellaneous fruits & berries beginning in 2005. 5/ Floriculture included in other greenhouse/nursery beginning in 2006. ... Less than 0.05 percent. Data Source: USDA Economic Research Service. http://www.usda.ers.gov/data/farmincome/ Cash receipt data reflect income derived from the sale of agricultural commodities during a calendar year for only that portion of the commodity that is sold.
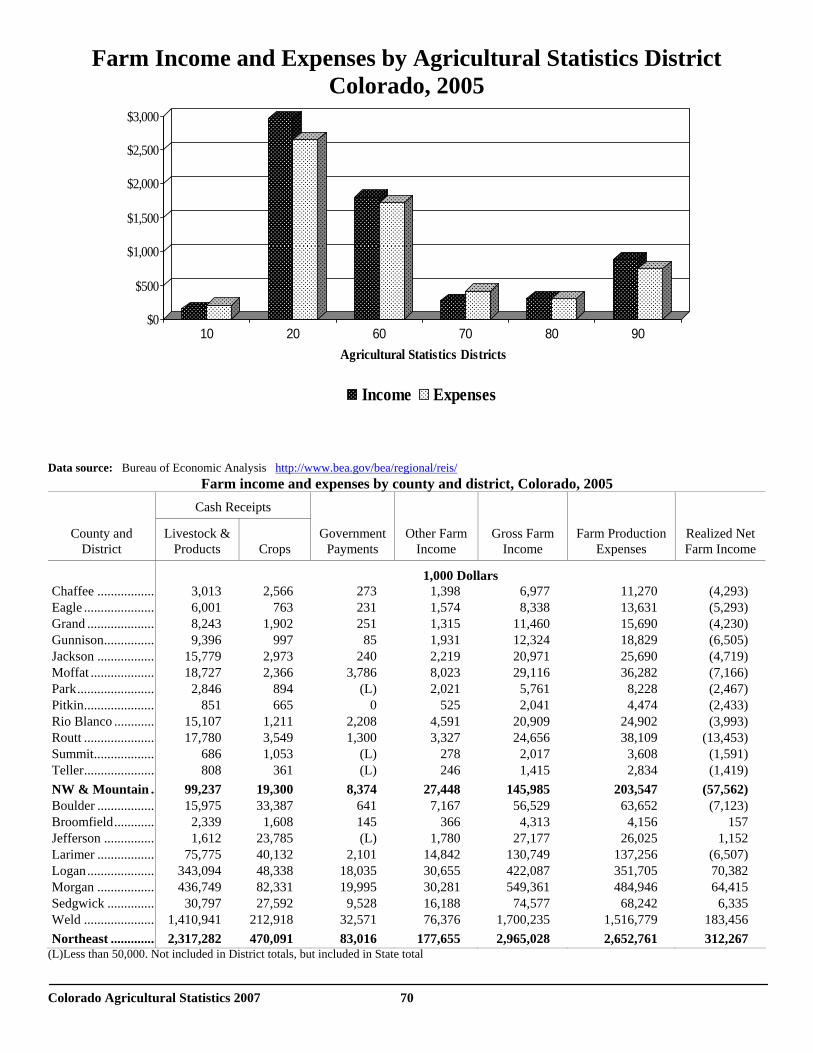
Colorado Agricultural Statistics 2007 70
Data source: Bureau of Economic Analysis http://www.bea.gov/bea/regional/reis/
Farm income and expenses by county and district, Colorado, 2005 Cash Receipts
County and District
Livestock & Products
Crops
Government Payments
Other Farm Income
Gross Farm Income
Farm Production Expenses
Realized Net Farm Income
1,000 Dollars Chaffee .................. 3,013 2,566 273 1,398 6,977 11,270 (4,293) Eagle ...................... 6,001 763 231 1,574 8,338 13,631 (5,293) Grand ..................... 8,243 1,902 251 1,315 11,460 15,690 (4,230) Gunnison................ 9,396 997 85 1,931 12,324 18,829 (6,505) Jackson .................. 15,779 2,973 240 2,219 20,971 25,690 (4,719) Moffat .................... 18,727 2,366 3,786 8,023 29,116 36,282 (7,166) Park........................ 2,846 894 (L) 2,021 5,761 8,228 (2,467) Pitkin...................... 851 665 0 525 2,041 4,474 (2,433) Rio Blanco ............. 15,107 1,211 2,208 4,591 20,909 24,902 (3,993) Routt ...................... 17,780 3,549 1,300 3,327 24,656 38,109 (13,453) Summit................... 686 1,053 (L) 278 2,017 3,608 (1,591) Teller...................... 808 361 (L) 246 1,415 2,834 (1,419) NW & Mountain .. 99,237 19,300 8,374 27,448 145,985 203,547 (57,562) Boulder .................. 15,975 33,387 641 7,167 56,529 63,652 (7,123) Broomfield............. 2,339 1,608 145 366 4,313 4,156 157 Jefferson ................ 1,612 23,785 (L) 1,780 27,177 26,025 1,152 Larimer .................. 75,775 40,132 2,101 14,842 130,749 137,256 (6,507) Logan..................... 343,094 48,338 18,035 30,655 422,087 351,705 70,382 Morgan .................. 436,749 82,331 19,995 30,281 549,361 484,946 64,415 Sedgwick ............... 30,797 27,592 9,528 16,188 74,577 68,242 6,335 Weld ...................... 1,410,941 212,918 32,571 76,376 1,700,235 1,516,779 183,456 Northeast .............. 2,317,282 470,091 83,016 177,655 2,965,028 2,652,761 312,267
(L)Less than 50,000. Not included in District totals, but included in State total
$0
$500
$1,000
$1,500
$2,000
$2,500
$3,000
10 20 60 70 80 90Agricultural Statistics Districts
Income Expenses
Farm Income and Expenses by Agricultural Statistics District Colorado, 2005
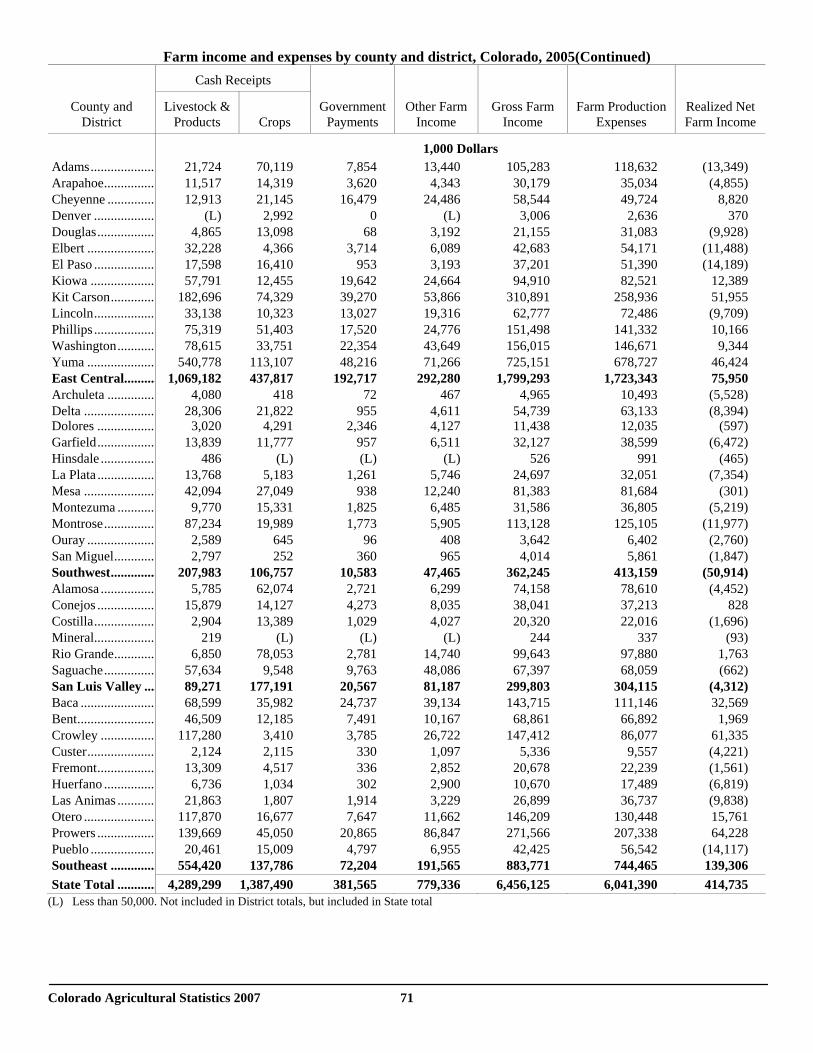
Colorado Agricultural Statistics 2007 71
Farm income and expenses by county and district, Colorado, 2005(Continued) Cash Receipts
County and District
Livestock & Products
Crops
Government Payments
Other Farm Income
Gross Farm Income
Farm Production Expenses
Realized Net Farm Income
1,000 Dollars Adams.................... 21,724 70,119 7,854 13,440 105,283 118,632 (13,349) Arapahoe................ 11,517 14,319 3,620 4,343 30,179 35,034 (4,855) Cheyenne ............... 12,913 21,145 16,479 24,486 58,544 49,724 8,820 Denver ................... (L) 2,992 0 (L) 3,006 2,636 370 Douglas.................. 4,865 13,098 68 3,192 21,155 31,083 (9,928) Elbert ..................... 32,228 4,366 3,714 6,089 42,683 54,171 (11,488) El Paso ................... 17,598 16,410 953 3,193 37,201 51,390 (14,189) Kiowa .................... 57,791 12,455 19,642 24,664 94,910 82,521 12,389 Kit Carson.............. 182,696 74,329 39,270 53,866 310,891 258,936 51,955 Lincoln................... 33,138 10,323 13,027 19,316 62,777 72,486 (9,709) Phillips ................... 75,319 51,403 17,520 24,776 151,498 141,332 10,166 Washington............ 78,615 33,751 22,354 43,649 156,015 146,671 9,344 Yuma ..................... 540,778 113,107 48,216 71,266 725,151 678,727 46,424 East Central.......... 1,069,182 437,817 192,717 292,280 1,799,293 1,723,343 75,950 Archuleta ............... 4,080 418 72 467 4,965 10,493 (5,528) Delta ...................... 28,306 21,822 955 4,611 54,739 63,133 (8,394)Dolores .................. 3,020 4,291 2,346 4,127 11,438 12,035 (597) Garfield.................. 13,839 11,777 957 6,511 32,127 38,599 (6,472) Hinsdale ................. 486 (L) (L) (L) 526 991 (465) La Plata .................. 13,768 5,183 1,261 5,746 24,697 32,051 (7,354) Mesa ...................... 42,094 27,049 938 12,240 81,383 81,684 (301) Montezuma ............ 9,770 15,331 1,825 6,485 31,586 36,805 (5,219) Montrose................ 87,234 19,989 1,773 5,905 113,128 125,105 (11,977) Ouray ..................... 2,589 645 96 408 3,642 6,402 (2,760) San Miguel............. 2,797 252 360 965 4,014 5,861 (1,847) Southwest.............. 207,983 106,757 10,583 47,465 362,245 413,159 (50,914) Alamosa ................. 5,785 62,074 2,721 6,299 74,158 78,610 (4,452) Conejos .................. 15,879 14,127 4,273 8,035 38,041 37,213 828 Costilla................... 2,904 13,389 1,029 4,027 20,320 22,016 (1,696) Mineral................... 219 (L) (L) (L) 244 337 (93) Rio Grande............. 6,850 78,053 2,781 14,740 99,643 97,880 1,763 Saguache................ 57,634 9,548 9,763 48,086 67,397 68,059 (662) San Luis Valley .... 89,271 177,191 20,567 81,187 299,803 304,115 (4,312) Baca ....................... 68,599 35,982 24,737 39,134 143,715 111,146 32,569 Bent........................ 46,509 12,185 7,491 10,167 68,861 66,892 1,969 Crowley ................. 117,280 3,410 3,785 26,722 147,412 86,077 61,335 Custer..................... 2,124 2,115 330 1,097 5,336 9,557 (4,221) Fremont.................. 13,309 4,517 336 2,852 20,678 22,239 (1,561) Huerfano ................ 6,736 1,034 302 2,900 10,670 17,489 (6,819) Las Animas ............ 21,863 1,807 1,914 3,229 26,899 36,737 (9,838) Otero ...................... 117,870 16,677 7,647 11,662 146,209 130,448 15,761 Prowers .................. 139,669 45,050 20,865 86,847 271,566 207,338 64,228 Pueblo .................... 20,461 15,009 4,797 6,955 42,425 56,542 (14,117) Southeast .............. 554,420 137,786 72,204 191,565 883,771 744,465 139,306 State Total ............ 4,289,299 1,387,490 381,565 779,336 6,456,125 6,041,390 414,735
(L) Less than 50,000. Not included in District totals, but included in State total
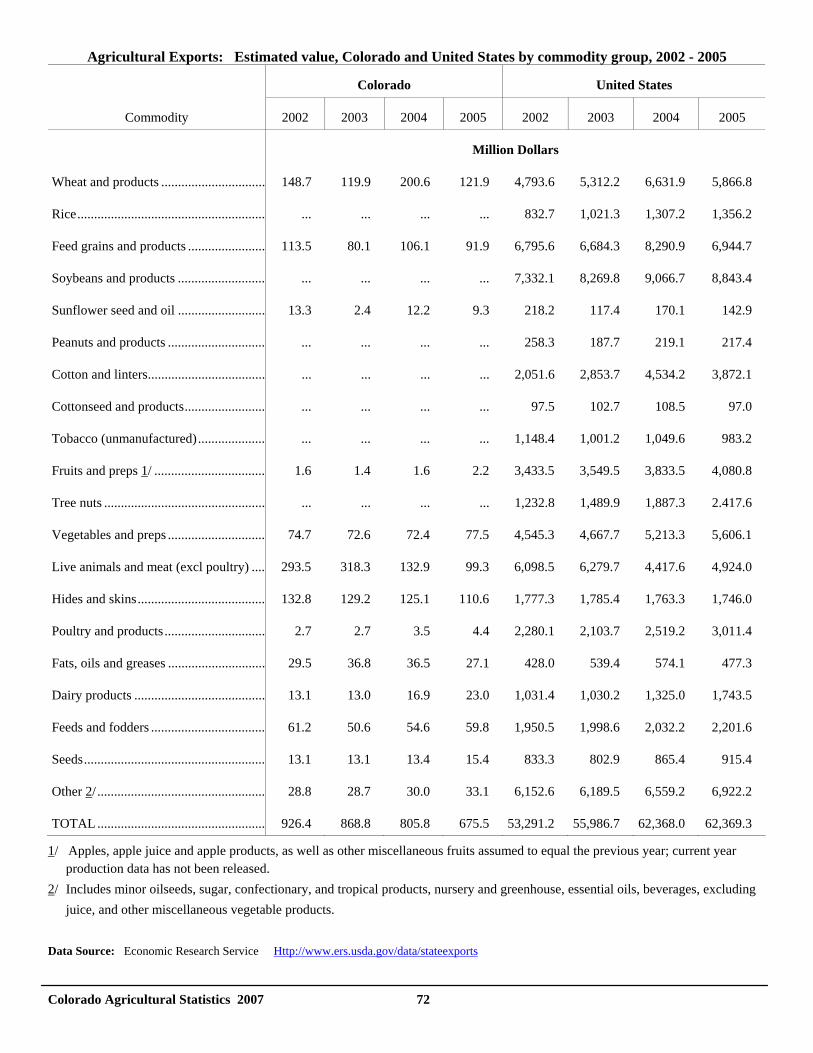
Colorado Agricultural Statistics 2007 72
Agricultural Exports: Estimated value, Colorado and United States by commodity group, 2002 - 2005
Colorado United States
Commodity 2002 2003 2004 2005 2002 2003 2004 2005
Million Dollars
Wheat and products ............................... 148.7 119.9 200.6 121.9 4,793.6 5,312.2 6,631.9 5,866.8
Rice........................................................ ... ... ... ... 832.7 1,021.3 1,307.2 1,356.2
Feed grains and products ....................... 113.5 80.1 106.1 91.9 6,795.6 6,684.3 8,290.9 6,944.7
Soybeans and products .......................... ... ... ... ... 7,332.1 8,269.8 9,066.7 8,843.4
Sunflower seed and oil .......................... 13.3 2.4 12.2 9.3 218.2 117.4 170.1 142.9
Peanuts and products ............................. ... ... ... ... 258.3 187.7 219.1 217.4
Cotton and linters................................... ... ... ... ... 2,051.6 2,853.7 4,534.2 3,872.1
Cottonseed and products........................ ... ... ... ... 97.5 102.7 108.5 97.0
Tobacco (unmanufactured).................... ... ... ... ... 1,148.4 1,001.2 1,049.6 983.2
Fruits and preps 1/ ................................. 1.6 1.4 1.6 2.2 3,433.5 3,549.5 3,833.5 4,080.8
Tree nuts ................................................ ... ... ... ... 1,232.8 1,489.9 1,887.3 2.417.6
Vegetables and preps ............................. 74.7 72.6 72.4 77.5 4,545.3 4,667.7 5,213.3 5,606.1
Live animals and meat (excl poultry) .... 293.5 318.3 132.9 99.3 6,098.5 6,279.7 4,417.6 4,924.0
Hides and skins...................................... 132.8 129.2 125.1 110.6 1,777.3 1,785.4 1,763.3 1,746.0
Poultry and products.............................. 2.7 2.7 3.5 4.4 2,280.1 2,103.7 2,519.2 3,011.4
Fats, oils and greases ............................. 29.5 36.8 36.5 27.1 428.0 539.4 574.1 477.3
Dairy products ....................................... 13.1 13.0 16.9 23.0 1,031.4 1,030.2 1,325.0 1,743.5
Feeds and fodders .................................. 61.2 50.6 54.6 59.8 1,950.5 1,998.6 2,032.2 2,201.6
Seeds...................................................... 13.1 13.1 13.4 15.4 833.3 802.9 865.4 915.4
Other 2/ .................................................. 28.8 28.7 30.0 33.1 6,152.6 6,189.5 6,559.2 6,922.2
TOTAL .................................................. 926.4 868.8 805.8 675.5 53,291.2 55,986.7 62,368.0 62,369.3
1/ Apples, apple juice and apple products, as well as other miscellaneous fruits assumed to equal the previous year; current year production data has not been released.
2/ Includes minor oilseeds, sugar, confectionary, and tropical products, nursery and greenhouse, essential oils, beverages, excluding juice, and other miscellaneous vegetable products.
Data Source: Economic Research Service Http://www.ers.usda.gov/data/stateexports
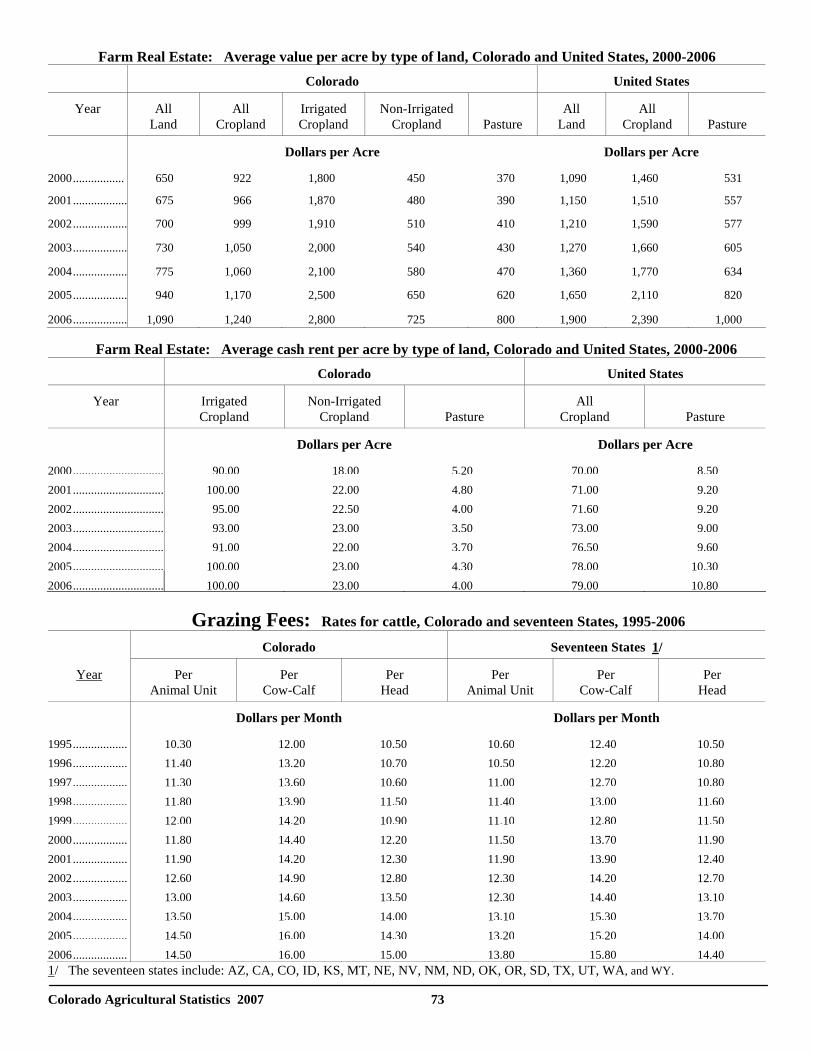
Colorado Agricultural Statistics 2007 73
Farm Real Estate: Average value per acre by type of land, Colorado and United States, 2000-2006 Colorado United States
Year All Land
All Cropland
Irrigated Cropland
Non-Irrigated Cropland
Pasture
All Land
All Cropland
Pasture
Dollars per Acre Dollars per Acre
2000................. 650 922 1,800 450 370 1,090 1,460 531
2001.................. 675 966 1,870 480 390 1,150 1,510 557
2002.................. 700 999 1,910 510 410 1,210 1,590 577
2003.................. 730 1,050 2,000 540 430 1,270 1,660 605
2004.................. 775 1,060 2,100 580 470 1,360 1,770 634
2005.................. 940 1,170 2,500 650 620 1,650 2,110 820
2006.................. 1,090 1,240 2,800 725 800 1,900 2,390 1,000
Farm Real Estate: Average cash rent per acre by type of land, Colorado and United States, 2000-2006 Colorado United States
Year Irrigated Cropland
Non-Irrigated Cropland
Pasture
All Cropland
Pasture
Dollars per Acre Dollars per Acre
2000.............................. 90.00 18.00 5.20 70.00 8.502001.............................. 100.00 22.00 4.80 71.00 9.202002.............................. 95.00 22.50 4.00 71.60 9.202003.............................. 93.00 23.00 3.50 73.00 9.002004.............................. 91.00 22.00 3.70 76.50 9.602005.............................. 100.00 23.00 4.30 78.00 10.302006.............................. 100.00 23.00 4.00 79.00 10.80
Grazing Fees: Rates for cattle, Colorado and seventeen States, 1995-2006
Colorado Seventeen States 1/
Year Per Animal Unit
Per Cow-Calf
Per Head
Per Animal Unit
Per Cow-Calf
Per Head
Dollars per Month Dollars per Month
1995.................. 10.30 12.00 10.50 10.60 12.40 10.501996.................. 11.40 13.20 10.70 10.50 12.20 10.801997.................. 11.30 13.60 10.60 11.00 12.70 10.801998.................. 11.80 13.90 11.50 11.40 13.00 11.601999.................. 12.00 14.20 10.90 11.10 12.80 11.502000.................. 11.80 14.40 12.20 11.50 13.70 11.902001.................. 11.90 14.20 12.30 11.90 13.90 12.402002.................. 12.60 14.90 12.80 12.30 14.20 12.702003.................. 13.00 14.60 13.50 12.30 14.40 13.102004.................. 13.50 15.00 14.00 13.10 15.30 13.702005.................. 14.50 16.00 14.30 13.20 15.20 14.002006.................. 14.50 16.00 15.00 13.80 15.80 14.40 1/ The seventeen states include: AZ, CA, CO, ID, KS, MT, NE, NV, NM, ND, OK, OR, SD, TX, UT, WA, and WY.
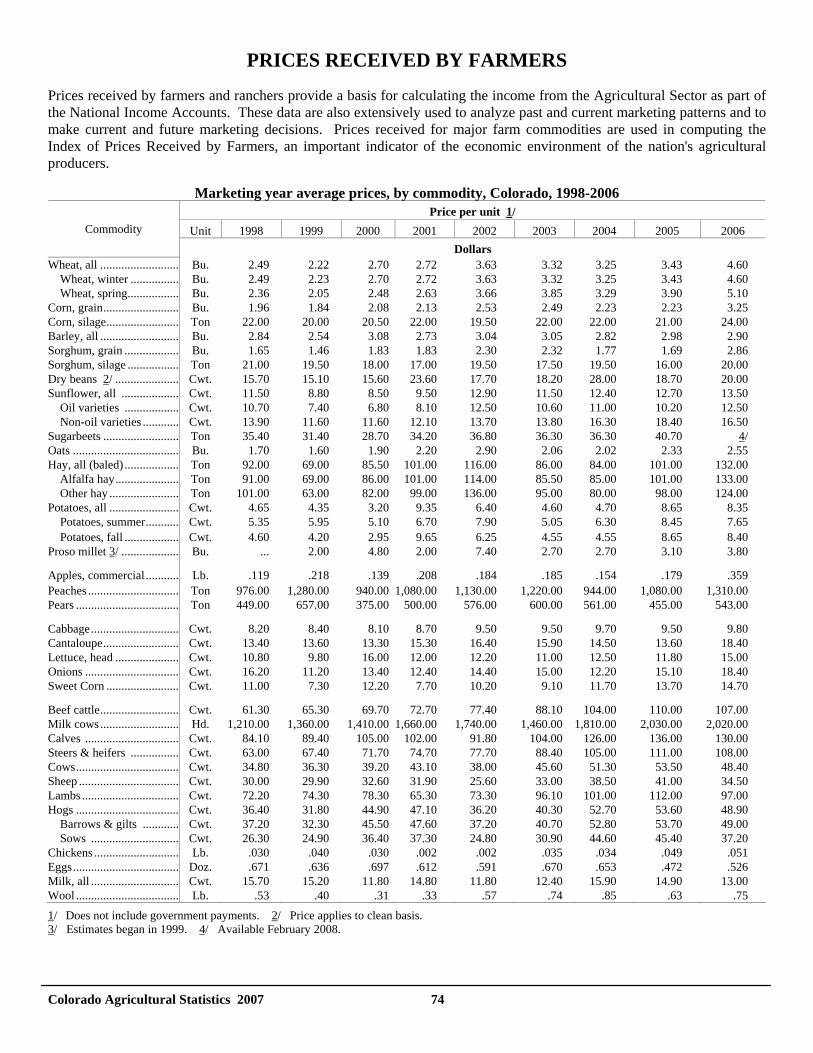
Colorado Agricultural Statistics 2007 74
PRICES RECEIVED BY FARMERS
Prices received by farmers and ranchers provide a basis for calculating the income from the Agricultural Sector as part of the National Income Accounts. These data are also extensively used to analyze past and current marketing patterns and to make current and future marketing decisions. Prices received for major farm commodities are used in computing the Index of Prices Received by Farmers, an important indicator of the economic environment of the nation's agricultural producers.
Marketing year average prices, by commodity, Colorado, 1998-2006 Price per unit 1/
Commodity Unit 1998 1999 2000 2001 2002 2003 2004 2005 2006 Dollars
Wheat, all .......................... Bu. 2.49 2.22 2.70 2.72 3.63 3.32 3.25 3.43 4.60 Wheat, winter ................ Bu. 2.49 2.23 2.70 2.72 3.63 3.32 3.25 3.43 4.60 Wheat, spring................. Bu. 2.36 2.05 2.48 2.63 3.66 3.85 3.29 3.90 5.10 Corn, grain......................... Bu. 1.96 1.84 2.08 2.13 2.53 2.49 2.23 2.23 3.25 Corn, silage........................ Ton 22.00 20.00 20.50 22.00 19.50 22.00 22.00 21.00 24.00 Barley, all .......................... Bu. 2.84 2.54 3.08 2.73 3.04 3.05 2.82 2.98 2.90 Sorghum, grain .................. Bu. 1.65 1.46 1.83 1.83 2.30 2.32 1.77 1.69 2.86 Sorghum, silage ................. Ton 21.00 19.50 18.00 17.00 19.50 17.50 19.50 16.00 20.00 Dry beans 2/ ..................... Cwt. 15.70 15.10 15.60 23.60 17.70 18.20 28.00 18.70 20.00 Sunflower, all ................... Cwt. 11.50 8.80 8.50 9.50 12.90 11.50 12.40 12.70 13.50 Oil varieties .................. Cwt. 10.70 7.40 6.80 8.10 12.50 10.60 11.00 10.20 12.50 Non-oil varieties ............ Cwt. 13.90 11.60 11.60 12.10 13.70 13.80 16.30 18.40 16.50 Sugarbeets ......................... Ton 35.40 31.40 28.70 34.20 36.80 36.30 36.30 40.70 4/ Oats ................................... Bu. 1.70 1.60 1.90 2.20 2.90 2.06 2.02 2.33 2.55 Hay, all (baled) .................. Ton 92.00 69.00 85.50 101.00 116.00 86.00 84.00 101.00 132.00 Alfalfa hay..................... Ton 91.00 69.00 86.00 101.00 114.00 85.50 85.00 101.00 133.00 Other hay ....................... Ton 101.00 63.00 82.00 99.00 136.00 95.00 80.00 98.00 124.00 Potatoes, all ....................... Cwt. 4.65 4.35 3.20 9.35 6.40 4.60 4.70 8.65 8.35 Potatoes, summer........... Cwt. 5.35 5.95 5.10 6.70 7.90 5.05 6.30 8.45 7.65 Potatoes, fall .................. Cwt. 4.60 4.20 2.95 9.65 6.25 4.55 4.55 8.65 8.40 Proso millet 3/ ................... Bu. ... 2.00 4.80 2.00 7.40 2.70 2.70 3.10 3.80
Apples, commercial ........... Lb. .119 .218 .139 .208 .184 .185 .154 .179 .359 Peaches .............................. Ton 976.00 1,280.00 940.00 1,080.00 1,130.00 1,220.00 944.00 1,080.00 1,310.00 Pears .................................. Ton 449.00 657.00 375.00 500.00 576.00 600.00 561.00 455.00 543.00
Cabbage............................. Cwt. 8.20 8.40 8.10 8.70 9.50 9.50 9.70 9.50 9.80 Cantaloupe......................... Cwt. 13.40 13.60 13.30 15.30 16.40 15.90 14.50 13.60 18.40 Lettuce, head ..................... Cwt. 10.80 9.80 16.00 12.00 12.20 11.00 12.50 11.80 15.00 Onions ............................... Cwt. 16.20 11.20 13.40 12.40 14.40 15.00 12.20 15.10 18.40 Sweet Corn ........................ Cwt. 11.00 7.30 12.20 7.70 10.20 9.10 11.70 13.70 14.70
Beef cattle.......................... Cwt. 61.30 65.30 69.70 72.70 77.40 88.10 104.00 110.00 107.00 Milk cows.......................... Hd. 1,210.00 1,360.00 1,410.00 1,660.00 1,740.00 1,460.00 1,810.00 2,030.00 2,020.00 Calves ............................... Cwt. 84.10 89.40 105.00 102.00 91.80 104.00 126.00 136.00 130.00 Steers & heifers ................ Cwt. 63.00 67.40 71.70 74.70 77.70 88.40 105.00 111.00 108.00 Cows.................................. Cwt. 34.80 36.30 39.20 43.10 38.00 45.60 51.30 53.50 48.40 Sheep ................................. Cwt. 30.00 29.90 32.60 31.90 25.60 33.00 38.50 41.00 34.50 Lambs ................................ Cwt. 72.20 74.30 78.30 65.30 73.30 96.10 101.00 112.00 97.00 Hogs .................................. Cwt. 36.40 31.80 44.90 47.10 36.20 40.30 52.70 53.60 48.90 Barrows & gilts ............ Cwt. 37.20 32.30 45.50 47.60 37.20 40.70 52.80 53.70 49.00 Sows ............................. Cwt. 26.30 24.90 36.40 37.30 24.80 30.90 44.60 45.40 37.20 Chickens ............................ Lb. .030 .040 .030 .002 .002 .035 .034 .049 .051 Eggs................................... Doz. .671 .636 .697 .612 .591 .670 .653 .472 .526 Milk, all ............................. Cwt. 15.70 15.20 11.80 14.80 11.80 12.40 15.90 14.90 13.00 Wool .................................. Lb. .53 .40 .31 .33 .57 .74 .85 .63 .75 1/ Does not include government payments. 2/ Price applies to clean basis. 3/ Estimates began in 1999. 4/ Available February 2008.
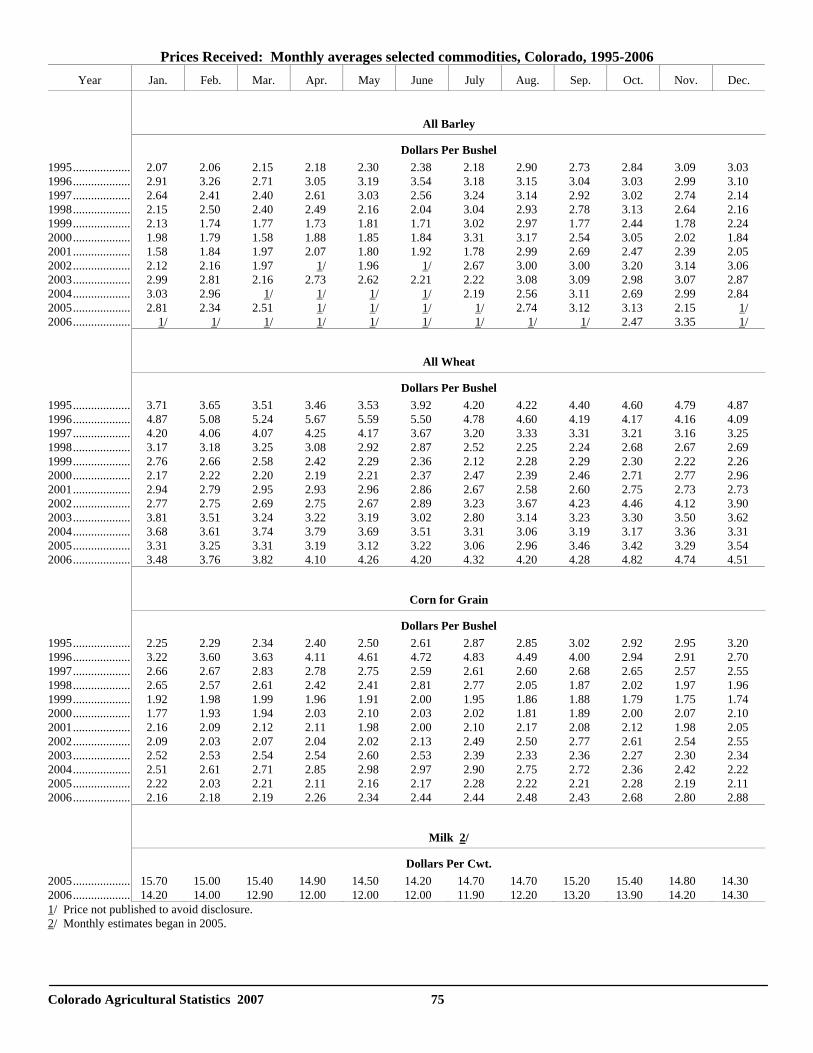
Colorado Agricultural Statistics 2007 75
Prices Received: Monthly averages selected commodities, Colorado, 1995-2006 Year Jan. Feb. Mar. Apr. May June July Aug. Sep. Oct. Nov. Dec.
All Barley
Dollars Per Bushel 1995................... 2.07 2.06 2.15 2.18 2.30 2.38 2.18 2.90 2.73 2.84 3.09 3.03 1996................... 2.91 3.26 2.71 3.05 3.19 3.54 3.18 3.15 3.04 3.03 2.99 3.10 1997................... 2.64 2.41 2.40 2.61 3.03 2.56 3.24 3.14 2.92 3.02 2.74 2.14 1998................... 2.15 2.50 2.40 2.49 2.16 2.04 3.04 2.93 2.78 3.13 2.64 2.16 1999................... 2.13 1.74 1.77 1.73 1.81 1.71 3.02 2.97 1.77 2.44 1.78 2.24 2000................... 1.98 1.79 1.58 1.88 1.85 1.84 3.31 3.17 2.54 3.05 2.02 1.84 2001................... 1.58 1.84 1.97 2.07 1.80 1.92 1.78 2.99 2.69 2.47 2.39 2.05 2002................... 2.12 2.16 1.97 1/ 1.96 1/ 2.67 3.00 3.00 3.20 3.14 3.06 2003................... 2.99 2.81 2.16 2.73 2.62 2.21 2.22 3.08 3.09 2.98 3.07 2.87 2004................... 3.03 2.96 1/ 1/ 1/ 1/ 2.19 2.56 3.11 2.69 2.99 2.84 2005................... 2.81 2.34 2.51 1/ 1/ 1/ 1/ 2.74 3.12 3.13 2.15 1/ 2006................... 1/ 1/ 1/ 1/ 1/ 1/ 1/ 1/ 1/ 2.47 3.35 1/
All Wheat
Dollars Per Bushel 1995................... 3.71 3.65 3.51 3.46 3.53 3.92 4.20 4.22 4.40 4.60 4.79 4.87 1996................... 4.87 5.08 5.24 5.67 5.59 5.50 4.78 4.60 4.19 4.17 4.16 4.09 1997................... 4.20 4.06 4.07 4.25 4.17 3.67 3.20 3.33 3.31 3.21 3.16 3.25 1998................... 3.17 3.18 3.25 3.08 2.92 2.87 2.52 2.25 2.24 2.68 2.67 2.69 1999................... 2.76 2.66 2.58 2.42 2.29 2.36 2.12 2.28 2.29 2.30 2.22 2.26 2000................... 2.17 2.22 2.20 2.19 2.21 2.37 2.47 2.39 2.46 2.71 2.77 2.96 2001................... 2.94 2.79 2.95 2.93 2.96 2.86 2.67 2.58 2.60 2.75 2.73 2.73 2002................... 2.77 2.75 2.69 2.75 2.67 2.89 3.23 3.67 4.23 4.46 4.12 3.90 2003................... 3.81 3.51 3.24 3.22 3.19 3.02 2.80 3.14 3.23 3.30 3.50 3.62 2004................... 3.68 3.61 3.74 3.79 3.69 3.51 3.31 3.06 3.19 3.17 3.36 3.31 2005................... 3.31 3.25 3.31 3.19 3.12 3.22 3.06 2.96 3.46 3.42 3.29 3.54 2006................... 3.48 3.76 3.82 4.10 4.26 4.20 4.32 4.20 4.28 4.82 4.74 4.51
Corn for Grain
Dollars Per Bushel 1995................... 2.25 2.29 2.34 2.40 2.50 2.61 2.87 2.85 3.02 2.92 2.95 3.20 1996................... 3.22 3.60 3.63 4.11 4.61 4.72 4.83 4.49 4.00 2.94 2.91 2.70 1997................... 2.66 2.67 2.83 2.78 2.75 2.59 2.61 2.60 2.68 2.65 2.57 2.55 1998................... 2.65 2.57 2.61 2.42 2.41 2.81 2.77 2.05 1.87 2.02 1.97 1.96 1999................... 1.92 1.98 1.99 1.96 1.91 2.00 1.95 1.86 1.88 1.79 1.75 1.74 2000................... 1.77 1.93 1.94 2.03 2.10 2.03 2.02 1.81 1.89 2.00 2.07 2.10 2001................... 2.16 2.09 2.12 2.11 1.98 2.00 2.10 2.17 2.08 2.12 1.98 2.05 2002................... 2.09 2.03 2.07 2.04 2.02 2.13 2.49 2.50 2.77 2.61 2.54 2.55 2003................... 2.52 2.53 2.54 2.54 2.60 2.53 2.39 2.33 2.36 2.27 2.30 2.34 2004................... 2.51 2.61 2.71 2.85 2.98 2.97 2.90 2.75 2.72 2.36 2.42 2.22 2005................... 2.22 2.03 2.21 2.11 2.16 2.17 2.28 2.22 2.21 2.28 2.19 2.11 2006................... 2.16 2.18 2.19 2.26 2.34 2.44 2.44 2.48 2.43 2.68 2.80 2.88
Milk 2/
Dollars Per Cwt. 2005................... 15.70 15.00 15.40 14.90 14.50 14.20 14.70 14.70 15.20 15.40 14.80 14.30 2006................... 14.20 14.00 12.90 12.00 12.00 12.00 11.90 12.20 13.20 13.90 14.20 14.30 1/ Price not published to avoid disclosure. 2/ Monthly estimates began in 2005.
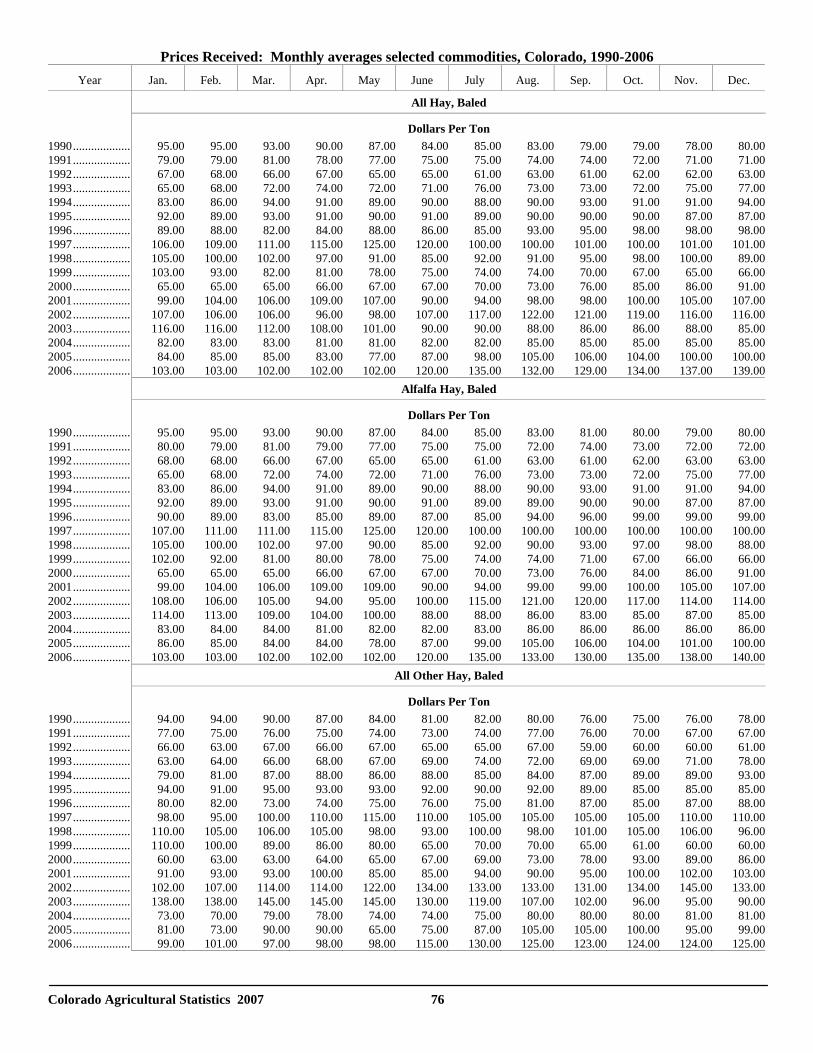
Colorado Agricultural Statistics 2007 76
Prices Received: Monthly averages selected commodities, Colorado, 1990-2006 Year Jan. Feb. Mar. Apr. May June July Aug. Sep. Oct. Nov. Dec.
All Hay, Baled
Dollars Per Ton 1990................... 95.00 95.00 93.00 90.00 87.00 84.00 85.00 83.00 79.00 79.00 78.00 80.001991................... 79.00 79.00 81.00 78.00 77.00 75.00 75.00 74.00 74.00 72.00 71.00 71.001992................... 67.00 68.00 66.00 67.00 65.00 65.00 61.00 63.00 61.00 62.00 62.00 63.001993................... 65.00 68.00 72.00 74.00 72.00 71.00 76.00 73.00 73.00 72.00 75.00 77.001994................... 83.00 86.00 94.00 91.00 89.00 90.00 88.00 90.00 93.00 91.00 91.00 94.001995................... 92.00 89.00 93.00 91.00 90.00 91.00 89.00 90.00 90.00 90.00 87.00 87.001996................... 89.00 88.00 82.00 84.00 88.00 86.00 85.00 93.00 95.00 98.00 98.00 98.001997................... 106.00 109.00 111.00 115.00 125.00 120.00 100.00 100.00 101.00 100.00 101.00 101.001998................... 105.00 100.00 102.00 97.00 91.00 85.00 92.00 91.00 95.00 98.00 100.00 89.001999................... 103.00 93.00 82.00 81.00 78.00 75.00 74.00 74.00 70.00 67.00 65.00 66.002000................... 65.00 65.00 65.00 66.00 67.00 67.00 70.00 73.00 76.00 85.00 86.00 91.002001................... 99.00 104.00 106.00 109.00 107.00 90.00 94.00 98.00 98.00 100.00 105.00 107.002002................... 107.00 106.00 106.00 96.00 98.00 107.00 117.00 122.00 121.00 119.00 116.00 116.002003................... 116.00 116.00 112.00 108.00 101.00 90.00 90.00 88.00 86.00 86.00 88.00 85.002004................... 82.00 83.00 83.00 81.00 81.00 82.00 82.00 85.00 85.00 85.00 85.00 85.002005................... 84.00 85.00 85.00 83.00 77.00 87.00 98.00 105.00 106.00 104.00 100.00 100.002006................... 103.00 103.00 102.00 102.00 102.00 120.00 135.00 132.00 129.00 134.00 137.00 139.00
Alfalfa Hay, Baled
Dollars Per Ton 1990................... 95.00 95.00 93.00 90.00 87.00 84.00 85.00 83.00 81.00 80.00 79.00 80.001991................... 80.00 79.00 81.00 79.00 77.00 75.00 75.00 72.00 74.00 73.00 72.00 72.001992................... 68.00 68.00 66.00 67.00 65.00 65.00 61.00 63.00 61.00 62.00 63.00 63.001993................... 65.00 68.00 72.00 74.00 72.00 71.00 76.00 73.00 73.00 72.00 75.00 77.001994................... 83.00 86.00 94.00 91.00 89.00 90.00 88.00 90.00 93.00 91.00 91.00 94.001995................... 92.00 89.00 93.00 91.00 90.00 91.00 89.00 89.00 90.00 90.00 87.00 87.001996................... 90.00 89.00 83.00 85.00 89.00 87.00 85.00 94.00 96.00 99.00 99.00 99.001997................... 107.00 111.00 111.00 115.00 125.00 120.00 100.00 100.00 100.00 100.00 100.00 100.001998................... 105.00 100.00 102.00 97.00 90.00 85.00 92.00 90.00 93.00 97.00 98.00 88.001999................... 102.00 92.00 81.00 80.00 78.00 75.00 74.00 74.00 71.00 67.00 66.00 66.002000................... 65.00 65.00 65.00 66.00 67.00 67.00 70.00 73.00 76.00 84.00 86.00 91.002001................... 99.00 104.00 106.00 109.00 109.00 90.00 94.00 99.00 99.00 100.00 105.00 107.002002................... 108.00 106.00 105.00 94.00 95.00 100.00 115.00 121.00 120.00 117.00 114.00 114.002003................... 114.00 113.00 109.00 104.00 100.00 88.00 88.00 86.00 83.00 85.00 87.00 85.002004................... 83.00 84.00 84.00 81.00 82.00 82.00 83.00 86.00 86.00 86.00 86.00 86.002005................... 86.00 85.00 84.00 84.00 78.00 87.00 99.00 105.00 106.00 104.00 101.00 100.002006................... 103.00 103.00 102.00 102.00 102.00 120.00 135.00 133.00 130.00 135.00 138.00 140.00
All Other Hay, Baled
Dollars Per Ton 1990................... 94.00 94.00 90.00 87.00 84.00 81.00 82.00 80.00 76.00 75.00 76.00 78.001991................... 77.00 75.00 76.00 75.00 74.00 73.00 74.00 77.00 76.00 70.00 67.00 67.001992................... 66.00 63.00 67.00 66.00 67.00 65.00 65.00 67.00 59.00 60.00 60.00 61.001993................... 63.00 64.00 66.00 68.00 67.00 69.00 74.00 72.00 69.00 69.00 71.00 78.001994................... 79.00 81.00 87.00 88.00 86.00 88.00 85.00 84.00 87.00 89.00 89.00 93.001995................... 94.00 91.00 95.00 93.00 93.00 92.00 90.00 92.00 89.00 85.00 85.00 85.001996................... 80.00 82.00 73.00 74.00 75.00 76.00 75.00 81.00 87.00 85.00 87.00 88.001997................... 98.00 95.00 100.00 110.00 115.00 110.00 105.00 105.00 105.00 105.00 110.00 110.001998................... 110.00 105.00 106.00 105.00 98.00 93.00 100.00 98.00 101.00 105.00 106.00 96.001999................... 110.00 100.00 89.00 86.00 80.00 65.00 70.00 70.00 65.00 61.00 60.00 60.002000................... 60.00 63.00 63.00 64.00 65.00 67.00 69.00 73.00 78.00 93.00 89.00 86.002001................... 91.00 93.00 93.00 100.00 85.00 85.00 94.00 90.00 95.00 100.00 102.00 103.002002................... 102.00 107.00 114.00 114.00 122.00 134.00 133.00 133.00 131.00 134.00 145.00 133.002003................... 138.00 138.00 145.00 145.00 145.00 130.00 119.00 107.00 102.00 96.00 95.00 90.002004................... 73.00 70.00 79.00 78.00 74.00 74.00 75.00 80.00 80.00 80.00 81.00 81.002005................... 81.00 73.00 90.00 90.00 65.00 75.00 87.00 105.00 105.00 100.00 95.00 99.002006................... 99.00 101.00 97.00 98.00 98.00 115.00 130.00 125.00 123.00 124.00 124.00 125.00
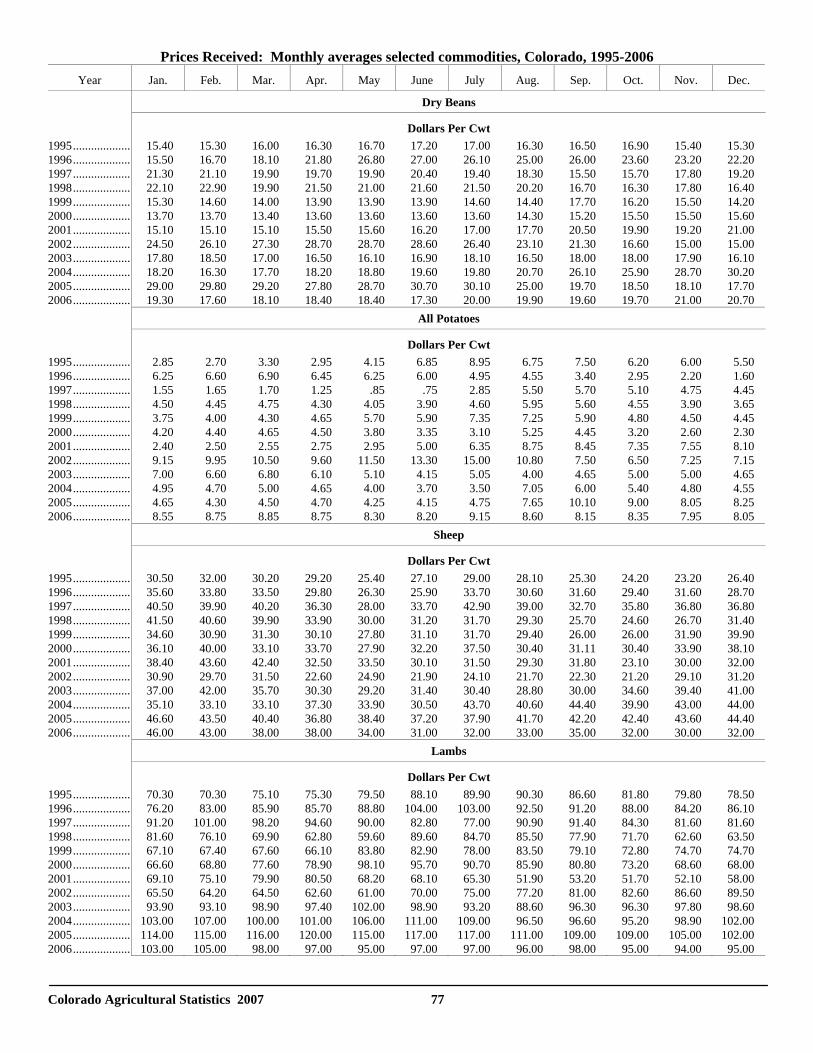
Colorado Agricultural Statistics 2007 77
Prices Received: Monthly averages selected commodities, Colorado, 1995-2006 Year Jan. Feb. Mar. Apr. May June July Aug. Sep. Oct. Nov. Dec.
Dry Beans
Dollars Per Cwt 1995................... 15.40 15.30 16.00 16.30 16.70 17.20 17.00 16.30 16.50 16.90 15.40 15.30 1996................... 15.50 16.70 18.10 21.80 26.80 27.00 26.10 25.00 26.00 23.60 23.20 22.20 1997................... 21.30 21.10 19.90 19.70 19.90 20.40 19.40 18.30 15.50 15.70 17.80 19.20 1998................... 22.10 22.90 19.90 21.50 21.00 21.60 21.50 20.20 16.70 16.30 17.80 16.40 1999................... 15.30 14.60 14.00 13.90 13.90 13.90 14.60 14.40 17.70 16.20 15.50 14.20 2000................... 13.70 13.70 13.40 13.60 13.60 13.60 13.60 14.30 15.20 15.50 15.50 15.60 2001................... 15.10 15.10 15.10 15.50 15.60 16.20 17.00 17.70 20.50 19.90 19.20 21.00 2002................... 24.50 26.10 27.30 28.70 28.70 28.60 26.40 23.10 21.30 16.60 15.00 15.00 2003................... 17.80 18.50 17.00 16.50 16.10 16.90 18.10 16.50 18.00 18.00 17.90 16.10 2004................... 18.20 16.30 17.70 18.20 18.80 19.60 19.80 20.70 26.10 25.90 28.70 30.20 2005................... 29.00 29.80 29.20 27.80 28.70 30.70 30.10 25.00 19.70 18.50 18.10 17.70 2006................... 19.30 17.60 18.10 18.40 18.40 17.30 20.00 19.90 19.60 19.70 21.00 20.70
All Potatoes
Dollars Per Cwt 1995................... 2.85 2.70 3.30 2.95 4.15 6.85 8.95 6.75 7.50 6.20 6.00 5.50 1996................... 6.25 6.60 6.90 6.45 6.25 6.00 4.95 4.55 3.40 2.95 2.20 1.60 1997................... 1.55 1.65 1.70 1.25 .85 .75 2.85 5.50 5.70 5.10 4.75 4.45 1998................... 4.50 4.45 4.75 4.30 4.05 3.90 4.60 5.95 5.60 4.55 3.90 3.65 1999................... 3.75 4.00 4.30 4.65 5.70 5.90 7.35 7.25 5.90 4.80 4.50 4.45 2000................... 4.20 4.40 4.65 4.50 3.80 3.35 3.10 5.25 4.45 3.20 2.60 2.30 2001................... 2.40 2.50 2.55 2.75 2.95 5.00 6.35 8.75 8.45 7.35 7.55 8.10 2002................... 9.15 9.95 10.50 9.60 11.50 13.30 15.00 10.80 7.50 6.50 7.25 7.15 2003................... 7.00 6.60 6.80 6.10 5.10 4.15 5.05 4.00 4.65 5.00 5.00 4.65 2004................... 4.95 4.70 5.00 4.65 4.00 3.70 3.50 7.05 6.00 5.40 4.80 4.55 2005................... 4.65 4.30 4.50 4.70 4.25 4.15 4.75 7.65 10.10 9.00 8.05 8.25 2006................... 8.55 8.75 8.85 8.75 8.30 8.20 9.15 8.60 8.15 8.35 7.95 8.05
Sheep
Dollars Per Cwt 1995................... 30.50 32.00 30.20 29.20 25.40 27.10 29.00 28.10 25.30 24.20 23.20 26.40 1996................... 35.60 33.80 33.50 29.80 26.30 25.90 33.70 30.60 31.60 29.40 31.60 28.70 1997................... 40.50 39.90 40.20 36.30 28.00 33.70 42.90 39.00 32.70 35.80 36.80 36.80 1998................... 41.50 40.60 39.90 33.90 30.00 31.20 31.70 29.30 25.70 24.60 26.70 31.40 1999................... 34.60 30.90 31.30 30.10 27.80 31.10 31.70 29.40 26.00 26.00 31.90 39.90 2000................... 36.10 40.00 33.10 33.70 27.90 32.20 37.50 30.40 31.11 30.40 33.90 38.10 2001................... 38.40 43.60 42.40 32.50 33.50 30.10 31.50 29.30 31.80 23.10 30.00 32.00 2002................... 30.90 29.70 31.50 22.60 24.90 21.90 24.10 21.70 22.30 21.20 29.10 31.20 2003................... 37.00 42.00 35.70 30.30 29.20 31.40 30.40 28.80 30.00 34.60 39.40 41.00 2004................... 35.10 33.10 33.10 37.30 33.90 30.50 43.70 40.60 44.40 39.90 43.00 44.00 2005................... 46.60 43.50 40.40 36.80 38.40 37.20 37.90 41.70 42.20 42.40 43.60 44.40 2006................... 46.00 43.00 38.00 38.00 34.00 31.00 32.00 33.00 35.00 32.00 30.00 32.00
Lambs
Dollars Per Cwt 1995................... 70.30 70.30 75.10 75.30 79.50 88.10 89.90 90.30 86.60 81.80 79.80 78.50 1996................... 76.20 83.00 85.90 85.70 88.80 104.00 103.00 92.50 91.20 88.00 84.20 86.10 1997................... 91.20 101.00 98.20 94.60 90.00 82.80 77.00 90.90 91.40 84.30 81.60 81.60 1998................... 81.60 76.10 69.90 62.80 59.60 89.60 84.70 85.50 77.90 71.70 62.60 63.50 1999................... 67.10 67.40 67.60 66.10 83.80 82.90 78.00 83.50 79.10 72.80 74.70 74.70 2000................... 66.60 68.80 77.60 78.90 98.10 95.70 90.70 85.90 80.80 73.20 68.60 68.00 2001................... 69.10 75.10 79.90 80.50 68.20 68.10 65.30 51.90 53.20 51.70 52.10 58.00 2002................... 65.50 64.20 64.50 62.60 61.00 70.00 75.00 77.20 81.00 82.60 86.60 89.50 2003................... 93.90 93.10 98.90 97.40 102.00 98.90 93.20 88.60 96.30 96.30 97.80 98.60 2004................... 103.00 107.00 100.00 101.00 106.00 111.00 109.00 96.50 96.60 95.20 98.90 102.00 2005................... 114.00 115.00 116.00 120.00 115.00 117.00 117.00 111.00 109.00 109.00 105.00 102.00 2006................... 103.00 105.00 98.00 97.00 95.00 97.00 97.00 96.00 98.00 95.00 94.00 95.00
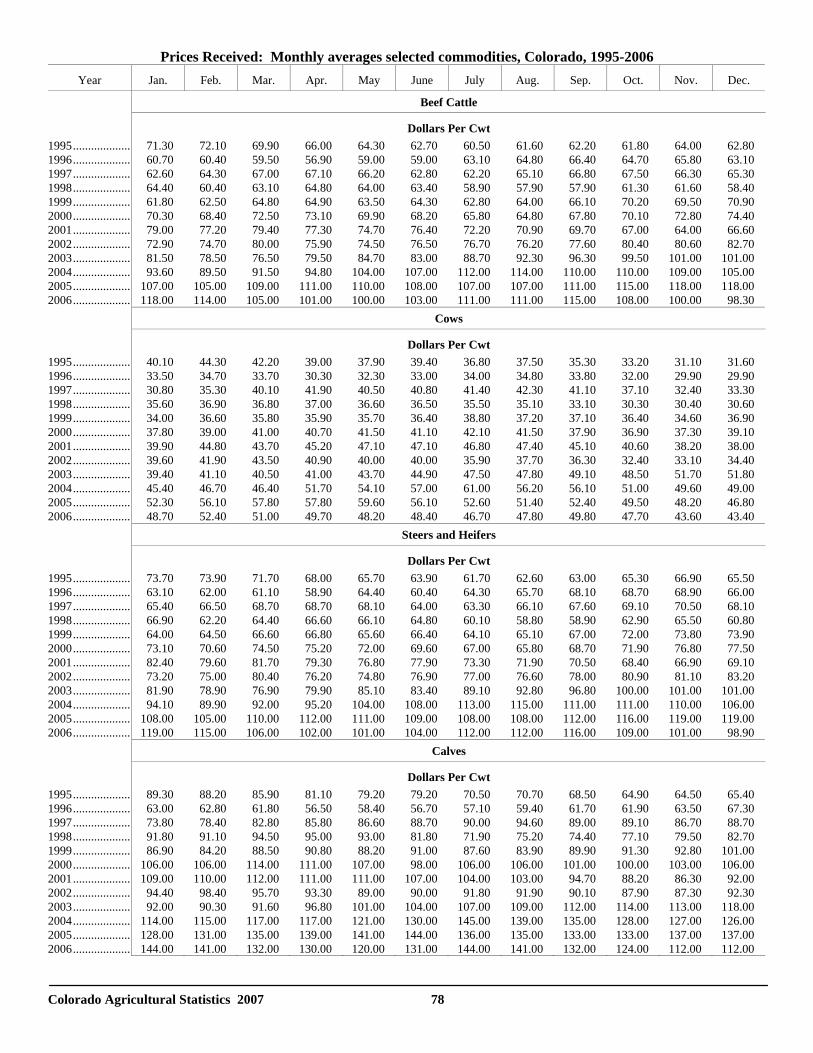
Colorado Agricultural Statistics 2007 78
Prices Received: Monthly averages selected commodities, Colorado, 1995-2006 Year Jan. Feb. Mar. Apr. May June July Aug. Sep. Oct. Nov. Dec.
Beef Cattle
Dollars Per Cwt 1995................... 71.30 72.10 69.90 66.00 64.30 62.70 60.50 61.60 62.20 61.80 64.00 62.80 1996................... 60.70 60.40 59.50 56.90 59.00 59.00 63.10 64.80 66.40 64.70 65.80 63.10 1997................... 62.60 64.30 67.00 67.10 66.20 62.80 62.20 65.10 66.80 67.50 66.30 65.30 1998................... 64.40 60.40 63.10 64.80 64.00 63.40 58.90 57.90 57.90 61.30 61.60 58.40 1999................... 61.80 62.50 64.80 64.90 63.50 64.30 62.80 64.00 66.10 70.20 69.50 70.90 2000................... 70.30 68.40 72.50 73.10 69.90 68.20 65.80 64.80 67.80 70.10 72.80 74.40 2001................... 79.00 77.20 79.40 77.30 74.70 76.40 72.20 70.90 69.70 67.00 64.00 66.60 2002................... 72.90 74.70 80.00 75.90 74.50 76.50 76.70 76.20 77.60 80.40 80.60 82.70 2003................... 81.50 78.50 76.50 79.50 84.70 83.00 88.70 92.30 96.30 99.50 101.00 101.00 2004................... 93.60 89.50 91.50 94.80 104.00 107.00 112.00 114.00 110.00 110.00 109.00 105.00 2005................... 107.00 105.00 109.00 111.00 110.00 108.00 107.00 107.00 111.00 115.00 118.00 118.00 2006................... 118.00 114.00 105.00 101.00 100.00 103.00 111.00 111.00 115.00 108.00 100.00 98.30
Cows
Dollars Per Cwt 1995................... 40.10 44.30 42.20 39.00 37.90 39.40 36.80 37.50 35.30 33.20 31.10 31.60 1996................... 33.50 34.70 33.70 30.30 32.30 33.00 34.00 34.80 33.80 32.00 29.90 29.90 1997................... 30.80 35.30 40.10 41.90 40.50 40.80 41.40 42.30 41.10 37.10 32.40 33.30 1998................... 35.60 36.90 36.80 37.00 36.60 36.50 35.50 35.10 33.10 30.30 30.40 30.60 1999................... 34.00 36.60 35.80 35.90 35.70 36.40 38.80 37.20 37.10 36.40 34.60 36.90 2000................... 37.80 39.00 41.00 40.70 41.50 41.10 42.10 41.50 37.90 36.90 37.30 39.10 2001................... 39.90 44.80 43.70 45.20 47.10 47.10 46.80 47.40 45.10 40.60 38.20 38.00 2002................... 39.60 41.90 43.50 40.90 40.00 40.00 35.90 37.70 36.30 32.40 33.10 34.40 2003................... 39.40 41.10 40.50 41.00 43.70 44.90 47.50 47.80 49.10 48.50 51.70 51.80 2004................... 45.40 46.70 46.40 51.70 54.10 57.00 61.00 56.20 56.10 51.00 49.60 49.00 2005................... 52.30 56.10 57.80 57.80 59.60 56.10 52.60 51.40 52.40 49.50 48.20 46.80 2006................... 48.70 52.40 51.00 49.70 48.20 48.40 46.70 47.80 49.80 47.70 43.60 43.40
Steers and Heifers
Dollars Per Cwt 1995................... 73.70 73.90 71.70 68.00 65.70 63.90 61.70 62.60 63.00 65.30 66.90 65.50 1996................... 63.10 62.00 61.10 58.90 64.40 60.40 64.30 65.70 68.10 68.70 68.90 66.00 1997................... 65.40 66.50 68.70 68.70 68.10 64.00 63.30 66.10 67.60 69.10 70.50 68.10 1998................... 66.90 62.20 64.40 66.60 66.10 64.80 60.10 58.80 58.90 62.90 65.50 60.80 1999................... 64.00 64.50 66.60 66.80 65.60 66.40 64.10 65.10 67.00 72.00 73.80 73.90 2000................... 73.10 70.60 74.50 75.20 72.00 69.60 67.00 65.80 68.70 71.90 76.80 77.50 2001................... 82.40 79.60 81.70 79.30 76.80 77.90 73.30 71.90 70.50 68.40 66.90 69.10 2002................... 73.20 75.00 80.40 76.20 74.80 76.90 77.00 76.60 78.00 80.90 81.10 83.20 2003................... 81.90 78.90 76.90 79.90 85.10 83.40 89.10 92.80 96.80 100.00 101.00 101.00 2004................... 94.10 89.90 92.00 95.20 104.00 108.00 113.00 115.00 111.00 111.00 110.00 106.00 2005................... 108.00 105.00 110.00 112.00 111.00 109.00 108.00 108.00 112.00 116.00 119.00 119.00 2006................... 119.00 115.00 106.00 102.00 101.00 104.00 112.00 112.00 116.00 109.00 101.00 98.90
Calves
Dollars Per Cwt 1995................... 89.30 88.20 85.90 81.10 79.20 79.20 70.50 70.70 68.50 64.90 64.50 65.40 1996................... 63.00 62.80 61.80 56.50 58.40 56.70 57.10 59.40 61.70 61.90 63.50 67.30 1997................... 73.80 78.40 82.80 85.80 86.60 88.70 90.00 94.60 89.00 89.10 86.70 88.70 1998................... 91.80 91.10 94.50 95.00 93.00 81.80 71.90 75.20 74.40 77.10 79.50 82.70 1999................... 86.90 84.20 88.50 90.80 88.20 91.00 87.60 83.90 89.90 91.30 92.80 101.00 2000................... 106.00 106.00 114.00 111.00 107.00 98.00 106.00 106.00 101.00 100.00 103.00 106.00 2001................... 109.00 110.00 112.00 111.00 111.00 107.00 104.00 103.00 94.70 88.20 86.30 92.00 2002................... 94.40 98.40 95.70 93.30 89.00 90.00 91.80 91.90 90.10 87.90 87.30 92.30 2003................... 92.00 90.30 91.60 96.80 101.00 104.00 107.00 109.00 112.00 114.00 113.00 118.00 2004................... 114.00 115.00 117.00 117.00 121.00 130.00 145.00 139.00 135.00 128.00 127.00 126.00 2005................... 128.00 131.00 135.00 139.00 141.00 144.00 136.00 135.00 133.00 133.00 137.00 137.00 2006................... 144.00 141.00 132.00 130.00 120.00 131.00 144.00 141.00 132.00 124.00 112.00 112.00
LIVESTOCK AND POULTRY
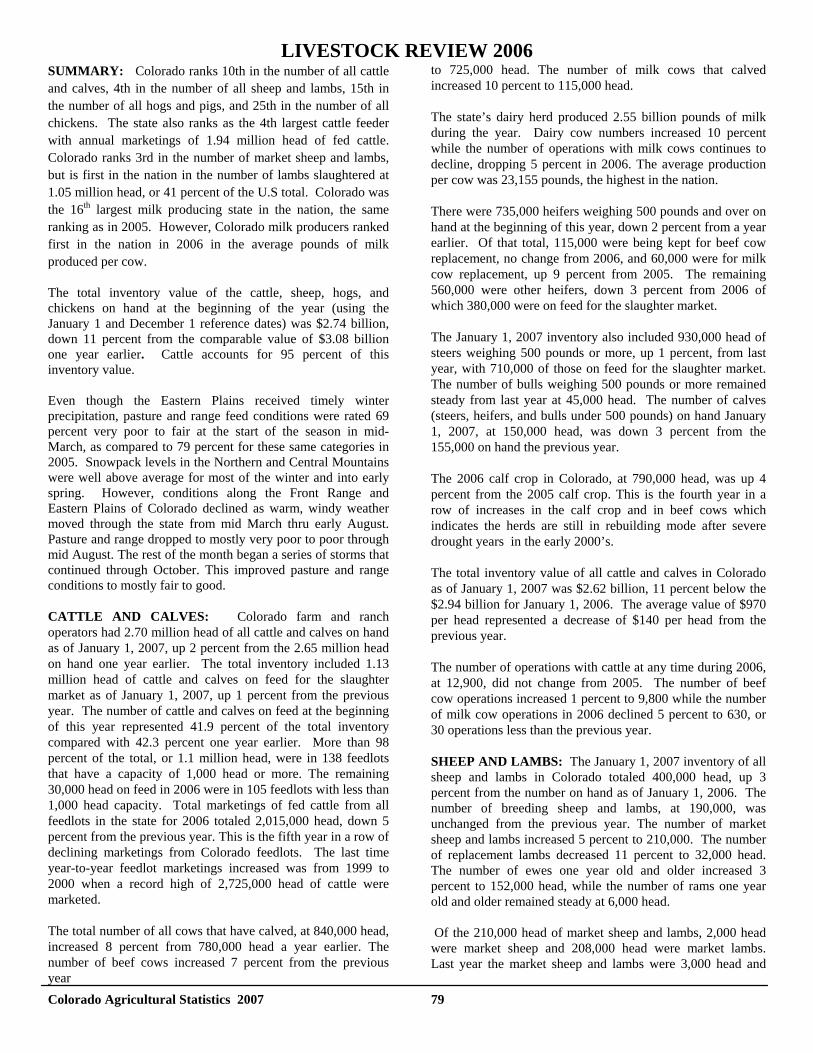
Colorado Agricultural Statistics 2007 79
LIVESTOCK REVIEW 2006SUMMARY: Colorado ranks 10th in the number of all cattle and calves, 4th in the number of all sheep and lambs, 15th in the number of all hogs and pigs, and 25th in the number of all chickens. The state also ranks as the 4th largest cattle feeder with annual marketings of 1.94 million head of fed cattle. Colorado ranks 3rd in the number of market sheep and lambs, but is first in the nation in the number of lambs slaughtered at 1.05 million head, or 41 percent of the U.S total. Colorado was the 16th largest milk producing state in the nation, the same ranking as in 2005. However, Colorado milk producers ranked first in the nation in 2006 in the average pounds of milk produced per cow. The total inventory value of the cattle, sheep, hogs, and chickens on hand at the beginning of the year (using the January 1 and December 1 reference dates) was $2.74 billion, down 11 percent from the comparable value of $3.08 billion one year earlier. Cattle accounts for 95 percent of this inventory value. Even though the Eastern Plains received timely winter precipitation, pasture and range feed conditions were rated 69 percent very poor to fair at the start of the season in mid-March, as compared to 79 percent for these same categories in 2005. Snowpack levels in the Northern and Central Mountains were well above average for most of the winter and into early spring. However, conditions along the Front Range and Eastern Plains of Colorado declined as warm, windy weather moved through the state from mid March thru early August. Pasture and range dropped to mostly very poor to poor through mid August. The rest of the month began a series of storms that continued through October. This improved pasture and range conditions to mostly fair to good. CATTLE AND CALVES: Colorado farm and ranch operators had 2.70 million head of all cattle and calves on hand as of January 1, 2007, up 2 percent from the 2.65 million head on hand one year earlier. The total inventory included 1.13 million head of cattle and calves on feed for the slaughter market as of January 1, 2007, up 1 percent from the previous year. The number of cattle and calves on feed at the beginning of this year represented 41.9 percent of the total inventory compared with 42.3 percent one year earlier. More than 98 percent of the total, or 1.1 million head, were in 138 feedlots that have a capacity of 1,000 head or more. The remaining 30,000 head on feed in 2006 were in 105 feedlots with less than 1,000 head capacity. Total marketings of fed cattle from all feedlots in the state for 2006 totaled 2,015,000 head, down 5 percent from the previous year. This is the fifth year in a row of declining marketings from Colorado feedlots. The last time year-to-year feedlot marketings increased was from 1999 to 2000 when a record high of 2,725,000 head of cattle were marketed. The total number of all cows that have calved, at 840,000 head, increased 8 percent from 780,000 head a year earlier. The number of beef cows increased 7 percent from the previous year
to 725,000 head. The number of milk cows that calved increased 10 percent to 115,000 head. The state’s dairy herd produced 2.55 billion pounds of milk during the year. Dairy cow numbers increased 10 percent while the number of operations with milk cows continues to decline, dropping 5 percent in 2006. The average production per cow was 23,155 pounds, the highest in the nation. There were 735,000 heifers weighing 500 pounds and over on hand at the beginning of this year, down 2 percent from a year earlier. Of that total, 115,000 were being kept for beef cow replacement, no change from 2006, and 60,000 were for milk cow replacement, up 9 percent from 2005. The remaining 560,000 were other heifers, down 3 percent from 2006 of which 380,000 were on feed for the slaughter market. The January 1, 2007 inventory also included 930,000 head of steers weighing 500 pounds or more, up 1 percent, from last year, with 710,000 of those on feed for the slaughter market. The number of bulls weighing 500 pounds or more remained steady from last year at 45,000 head. The number of calves (steers, heifers, and bulls under 500 pounds) on hand January 1, 2007, at 150,000 head, was down 3 percent from the 155,000 on hand the previous year. The 2006 calf crop in Colorado, at 790,000 head, was up 4 percent from the 2005 calf crop. This is the fourth year in a row of increases in the calf crop and in beef cows which indicates the herds are still in rebuilding mode after severe drought years in the early 2000’s. The total inventory value of all cattle and calves in Colorado as of January 1, 2007 was $2.62 billion, 11 percent below the $2.94 billion for January 1, 2006. The average value of $970 per head represented a decrease of $140 per head from the previous year. The number of operations with cattle at any time during 2006, at 12,900, did not change from 2005. The number of beef cow operations increased 1 percent to 9,800 while the number of milk cow operations in 2006 declined 5 percent to 630, or 30 operations less than the previous year. SHEEP AND LAMBS: The January 1, 2007 inventory of all sheep and lambs in Colorado totaled 400,000 head, up 3 percent from the number on hand as of January 1, 2006. The number of breeding sheep and lambs, at 190,000, was unchanged from the previous year. The number of market sheep and lambs increased 5 percent to 210,000. The number of replacement lambs decreased 11 percent to 32,000 head. The number of ewes one year old and older increased 3 percent to 152,000 head, while the number of rams one year old and older remained steady at 6,000 head. Of the 210,000 head of market sheep and lambs, 2,000 head were market sheep and 208,000 head were market lambs. Last year the market sheep and lambs were 3,000 head and
Colorado Agricultural Statistics 2007 80
197,000 head, respectively. There were 1,000 lambs weighing less than 65 pounds this year, 2,000 less than last year; 20,000 were in the 65-84 pound weight group, up 11,000 from the previous year; 37,000 weighed 85-105 pounds compared with 40,000 last year; and 150,000 weighed over 105 pounds compared with the 145,000 head in this weight group on January 1, 2006. The 2006 lamb crop, at 190,000 head, was up 9 percent from the 2005 lamb crop of 175,000. There were 1,600 operations with sheep or lambs in Colorado during 2006, no change from the previous year or from 2004. Wool production in Colorado during 2006 totaled 2.60 million pounds, down 2 percent from the 2.65 million pounds produced in 2005. The number of all sheep and lambs shorn, at 380,000 head, was down 10 percent from 420,000 head shorn a year earlier, and down 3 percent from 2004. The value of wool production for 2006 totaled $1.95 million, up 17 percent from a year earlier as producers received 75 cents per pound of wool sold compared with 63 cents per pound the previous year and 85 cents during 2004. The January 1, 2007 inventory value of all sheep and lambs in Colorado was estimated at $49.60 million, down 7 percent from a year earlier. The overall average value per head for all sheep and lambs was $124.00 per head, $12.00 per head lower than a year earlier. HOGS AND PIGS: Colorado’s inventory of all hogs and pigs as of December 1, 2006 totaled 830,000 head, down 2 percent from a year earlier. The latest inventory consisted of 155,000 breeding hogs and pigs, up 7 percent from the 145,000 on hand one year earlier and up 11 percent from 2004. The number of market hogs and pigs, at 675,000, decreased 4 percent from the previous year. The 2006 pig crop in Colorado totaled 2.92 million head, up 6 percent from the 2005 pig crop. Sows farrowed during 2006 totaled 329,000, up 5 percent from last year. The average litter size of 8.88 pigs in 2006 was up from 8.74 a year earlier. There were 750 operations with hogs in Colorado during 2006, no change from the previous year. Similar to last year, 94 percent of the hogs in Colorado are being raised by 2 percent of the operations. The December 1, 2006 inventory value of all hogs and pigs was $68.1 million, a 6 percent decrease from the 2005 value. The average value of $82.00 per head was $3.00 per head below the previous year. GOATS: Estimates for state inventory totals began on January 1, 2005. Since then, Colorado has seen a 47 percent increase in total goat inventory to a January 1, 2007 inventory of 44,000 head. The number of angora goats in 2007 has remained constant from 2005 and 2006 at 1,000 head. Milk goats, at 8,000 head, increased by 1,000 head from 2006. Meat goats, however, have seen a 17 percent increase in inventory from 2006 with a January 1, 2007 meat goat inventory of 35,000 head.
CHICKENS AND EGGS: The all chicken inventory in Colorado as of December 1, 2006 totaled 4.60 million birds, down 1 percent from the 4.65 million on hand one year earlier. The number of layers decreased 5 percent from the previous year to 3.74 million. The total inventory also included 792,000 pullets less than 20 weeks of age (up 21 percent from December 1, 2005). The remaining inventory of 69,000 other chickens represented an increase of 5 percent from the previous year. During the period December 1, 2005 through November 30, 2006, Colorado’s laying flocks produced 1.08 billion eggs, up 1 percent from the 1.07 billion eggs produced during the comparable period a year earlier. The value of production from eggs produced in 2006 totaled $47.45 million, or 52.6 cents per dozen, compared to $42.14 million, or 47.2 cents per dozen in 2005. The number of layers averaged 3.77 million for the year, down 1 percent from 3.81 million layers during the same period a year earlier. The annual average laying rate last year was 288 eggs per layer compared with 281 eggs per layer one year earlier. The December 1, 2006 inventory value of all chickens was estimated at $8.27 million, down 11 percent from $9.31 million a year earlier. The average value per bird, at $1.80, was down from $2.00 on December 1, 2005. BEES AND HONEY: The number of colonies in Colorado during 2006 increased 29 percent from a year earlier to 32,000. The total honey production of 2.70 million pounds for 2006 was 38 percent higher than the 1.96 million pounds produced a year earlier. The yield per colony increased from 70 pounds per colony in 2005 to 75 pounds per colony in 2006. The total value of the 2006 honey crop was $3.75 million, up 97 percent from $1.90 million the previous year. The average price received for the 2006 crop was $1.39 per pound, compared with $0.97 per pound received for the 2005 crop. December 15, 2006 honey stocks of 1.46 million pounds were up 62 percent from 902,000 pounds a year earlier. TROUT: Thirteen operations in Colorado sold trout for the direct consumer market during 2006, while 23 operations in the state raised trout to sell for restoration, conservation and recreational purposes. Direct trout sales totaled $2.30 million, up sharply from the $1.48 million sold in 2005. The recreational market distributed trout valued at $4.92 million, down 6 percent from 2005. The total value of the trout sold during 2006 was $7.22 million, up 8 percent from the comparable value of $6.69 million a year earlier. There were 1.67 million pounds of fish of all sizes distributed during 2006, which had an average value of $2.95 per pound compared with 1.47 million pounds distributed during 2005 at an average of $3.55 per pound.
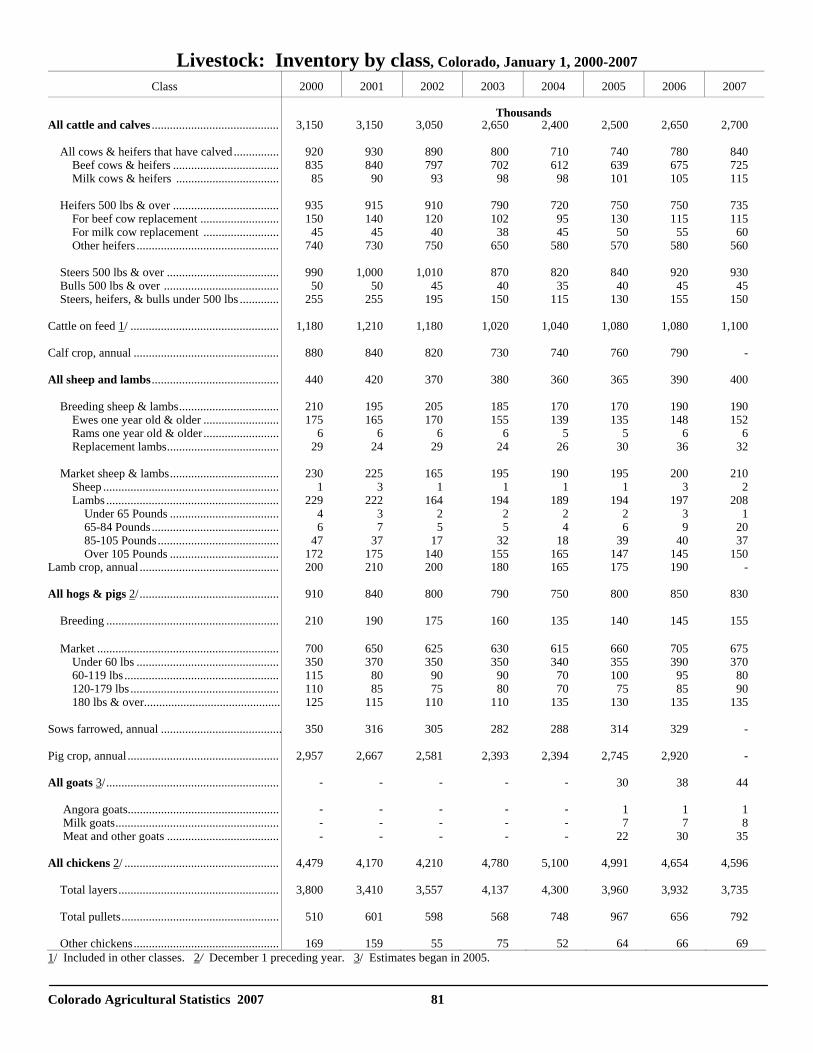
Colorado Agricultural Statistics 2007 81
Livestock: Inventory by class, Colorado, January 1, 2000-2007 Class 2000 2001 2002 2003 2004 2005 2006 2007
ThousandsAll cattle and calves .......................................... 3,150 3,150 3,050 2,650 2,400 2,500 2,650 2,700 All cows & heifers that have calved ............... 920 930 890 800 710 740 780 840 Beef cows & heifers ................................... 835 840 797 702 612 639 675 725 Milk cows & heifers .................................. 85 90 93 98 98 101 105 115 Heifers 500 lbs & over ................................... 935 915 910 790 720 750 750 735 For beef cow replacement .......................... 150 140 120 102 95 130 115 115 For milk cow replacement ......................... 45 45 40 38 45 50 55 60 Other heifers ............................................... 740 730 750 650 580 570 580 560 Steers 500 lbs & over ..................................... 990 1,000 1,010 870 820 840 920 930 Bulls 500 lbs & over ...................................... 50 50 45 40 35 40 45 45 Steers, heifers, & bulls under 500 lbs ............. 255 255 195 150 115 130 155 150 Cattle on feed 1/ ................................................. 1,180 1,210 1,180 1,020 1,040 1,080 1,080 1,100 Calf crop, annual ................................................ 880 840 820 730 740 760 790 - All sheep and lambs.......................................... 440 420 370 380 360 365 390 400 Breeding sheep & lambs................................. 210 195 205 185 170 170 190 190 Ewes one year old & older ......................... 175 165 170 155 139 135 148 152 Rams one year old & older ......................... 6 6 6 6 5 5 6 6 Replacement lambs..................................... 29 24 29 24 26 30 36 32 Market sheep & lambs.................................... 230 225 165 195 190 195 200 210 Sheep .......................................................... 1 3 1 1 1 1 3 2 Lambs ......................................................... 229 222 164 194 189 194 197 208 Under 65 Pounds .................................... 4 3 2 2 2 2 3 1 65-84 Pounds.......................................... 6 7 5 5 4 6 9 20 85-105 Pounds ........................................ 47 37 17 32 18 39 40 37 Over 105 Pounds .................................... 172 175 140 155 165 147 145 150Lamb crop, annual .............................................. 200 210 200 180 165 175 190 - All hogs & pigs 2/ ..............................................
910
840
800
790
750
800
850
830
Breeding ......................................................... 210 190 175 160 135 140 145 155 Market ............................................................ 700 650 625 630 615 660 705 675 Under 60 lbs ............................................... 350 370 350 350 340 355 390 370 60-119 lbs ................................................... 115 80 90 90 70 100 95 80 120-179 lbs ................................................. 110 85 75 80 70 75 85 90 180 lbs & over............................................. 125 115 110 110 135 130 135 135 Sows farrowed, annual ........................................ 350 316 305 282 288 314 329 - Pig crop, annual .................................................. 2,957 2,667 2,581 2,393 2,394 2,745 2,920 - All goats 3/......................................................... - - - - - 30 38 44 Angora goats.................................................. - - - - - 1 1 1 Milk goats...................................................... - - - - - 7 7 8 Meat and other goats ..................................... - - - - - 22 30 35 All chickens 2/ ................................................... 4,479 4,170 4,210 4,780 5,100 4,991 4,654 4,596 Total layers..................................................... 3,800 3,410 3,557 4,137 4,300 3,960 3,932 3,735 Total pullets....................................................
510
601
598
568
748
967
656
792
Other chickens................................................
169
159
55
75
52
64
66
69
1/ Included in other classes. 2/ December 1 preceding year. 3/ Estimates began in 2005.
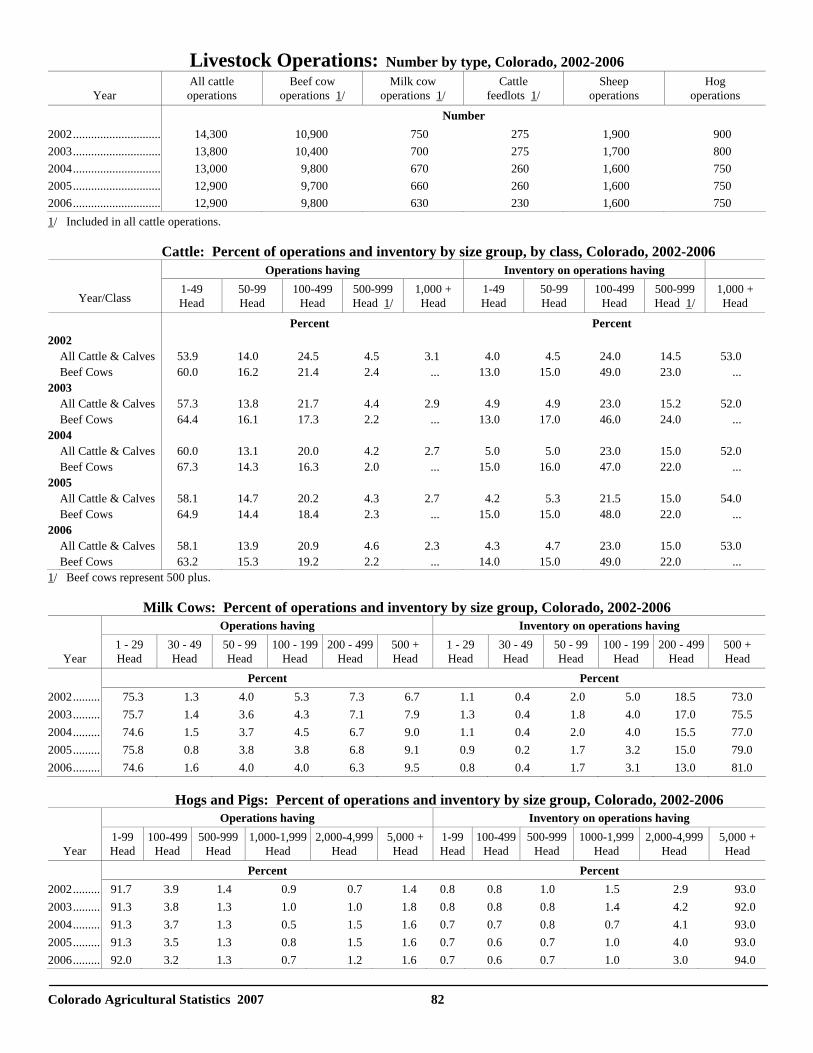
Colorado Agricultural Statistics 2007 82
Livestock Operations: Number by type, Colorado, 2002-2006
Year All cattle operations
Beef cow operations 1/
Milk cow operations 1/
Cattle feedlots 1/
Sheep operations
Hog operations
Number 2002............................. 14,300 10,900 750 275 1,900 900 2003............................. 13,800 10,400 700 275 1,700 800 2004............................. 13,000 9,800 670 260 1,600 750 2005............................. 12,900 9,700 660 260 1,600 750 2006............................. 12,900 9,800 630 230 1,600 750 1/ Included in all cattle operations. Cattle: Percent of operations and inventory by size group, by class, Colorado, 2002-2006
Operations having Inventory on operations having
Year/Class 1-49 Head
50-99 Head
100-499 Head
500-999 Head 1/
1,000 + Head
1-49 Head
50-99 Head
100-499 Head
500-999 Head 1/
1,000 + Head
Percent Percent 2002 All Cattle & Calves 53.9 14.0 24.5 4.5 3.1 4.0 4.5 24.0 14.5 53.0 Beef Cows 60.0 16.2 21.4 2.4 ... 13.0 15.0 49.0 23.0 ... 2003 All Cattle & Calves 57.3 13.8 21.7 4.4 2.9 4.9 4.9 23.0 15.2 52.0 Beef Cows 64.4 16.1 17.3 2.2 ... 13.0 17.0 46.0 24.0 ... 2004 All Cattle & Calves 60.0 13.1 20.0 4.2 2.7 5.0 5.0 23.0 15.0 52.0 Beef Cows 67.3 14.3 16.3 2.0 ... 15.0 16.0 47.0 22.0 ... 2005 All Cattle & Calves 58.1 14.7 20.2 4.3 2.7 4.2 5.3 21.5 15.0 54.0 Beef Cows 64.9 14.4 18.4 2.3 ... 15.0 15.0 48.0 22.0 ... 2006 All Cattle & Calves 58.1 13.9 20.9 4.6 2.3 4.3 4.7 23.0 15.0 53.0 Beef Cows 63.2 15.3 19.2 2.2 ... 14.0 15.0 49.0 22.0 ... 1/ Beef cows represent 500 plus.
Milk Cows: Percent of operations and inventory by size group, Colorado, 2002-2006 Operations having Inventory on operations having
Year 1 - 29 Head
30 - 49 Head
50 - 99 Head
100 - 199 Head
200 - 499 Head
500 + Head
1 - 29 Head
30 - 49 Head
50 - 99 Head
100 - 199 Head
200 - 499 Head
500 + Head
Percent Percent 2002......... 75.3 1.3 4.0 5.3 7.3 6.7 1.1 0.4 2.0 5.0 18.5 73.0 2003......... 75.7 1.4 3.6 4.3 7.1 7.9 1.3 0.4 1.8 4.0 17.0 75.5 2004......... 74.6 1.5 3.7 4.5 6.7 9.0 1.1 0.4 2.0 4.0 15.5 77.0 2005......... 75.8 0.8 3.8 3.8 6.8 9.1 0.9 0.2 1.7 3.2 15.0 79.0 2006......... 74.6 1.6 4.0 4.0 6.3 9.5 0.8 0.4 1.7 3.1 13.0 81.0 Hogs and Pigs: Percent of operations and inventory by size group, Colorado, 2002-2006 Operations having Inventory on operations having
Year
1-99 Head
100-499 Head
500-999 Head
1,000-1,999 Head
2,000-4,999Head
5,000 + Head
1-99 Head
100-499Head
500-999 Head
1000-1,999 Head
2,000-4,999 Head
5,000 + Head
Percent Percent 2002......... 91.7 3.9 1.4 0.9 0.7 1.4 0.8 0.8 1.0 1.5 2.9 93.0 2003......... 91.3 3.8 1.3 1.0 1.0 1.8 0.8 0.8 0.8 1.4 4.2 92.0 2004......... 91.3 3.7 1.3 0.5 1.5 1.6 0.7 0.7 0.8 0.7 4.1 93.0 2005......... 91.3 3.5 1.3 0.8 1.5 1.6 0.7 0.6 0.7 1.0 4.0 93.0 2006......... 92.0 3.2 1.3 0.7 1.2 1.6 0.7 0.6 0.7 1.0 3.0 94.0
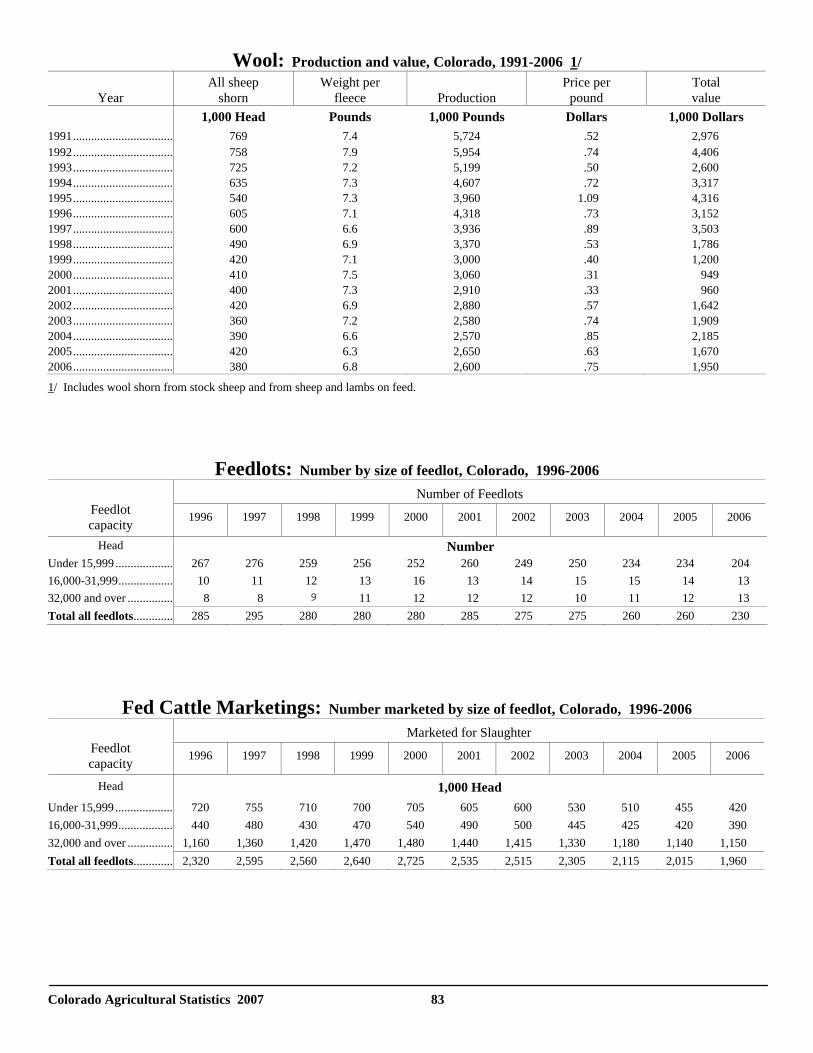
Colorado Agricultural Statistics 2007 83
Wool: Production and value, Colorado, 1991-2006 1/
Year All sheep
shorn Weight per
fleece
Production Price per
pound Total value
1,000 Head Pounds 1,000 Pounds Dollars 1,000 Dollars 1991................................. 769 7.4 5,724 .52 2,976 1992................................. 758 7.9 5,954 .74 4,406 1993................................. 725 7.2 5,199 .50 2,600 1994................................. 635 7.3 4,607 .72 3,317 1995................................. 540 7.3 3,960 1.09 4,316 1996................................. 605 7.1 4,318 .73 3,152 1997................................. 600 6.6 3,936 .89 3,503 1998................................. 490 6.9 3,370 .53 1,786 1999................................. 420 7.1 3,000 .40 1,200 2000................................. 410 7.5 3,060 .31 949 2001................................. 400 7.3 2,910 .33 960 2002................................. 420 6.9 2,880 .57 1,642 2003................................. 360 7.2 2,580 .74 1,909 2004................................. 390 6.6 2,570 .85 2,185 2005................................. 420 6.3 2,650 .63 1,670 2006................................. 380 6.8 2,600 .75 1,950 1/ Includes wool shorn from stock sheep and from sheep and lambs on feed.
Feedlots: Number by size of feedlot, Colorado, 1996-2006 Number of Feedlots
Feedlot capacity 1996 1997 1998 1999 2000 2001 2002 2003 2004 2005 2006
Head Number Under 15,999 ................... 267 276 259 256 252 260 249 250 234 234 204 16,000-31,999.................. 10 11 12 13 16 13 14 15 15 14 13 32,000 and over ............... 8 8 9 11 12 12 12 10 11 12 13 Total all feedlots............. 285 295 280 280 280 285 275 275 260 260 230
Fed Cattle Marketings: Number marketed by size of feedlot, Colorado, 1996-2006 Marketed for Slaughter
Feedlot capacity 1996 1997 1998 1999 2000 2001 2002 2003 2004 2005 2006
Head 1,000 Head Under 15,999 ................... 720 755 710 700 705 605 600 530 510 455 420 16,000-31,999.................. 440 480 430 470 540 490 500 445 425 420 390 32,000 and over ............... 1,160 1,360 1,420 1,470 1,480 1,440 1,415 1,330 1,180 1,140 1,150 Total all feedlots............. 2,320 2,595 2,560 2,640 2,725 2,535 2,515 2,305 2,115 2,015 1,960
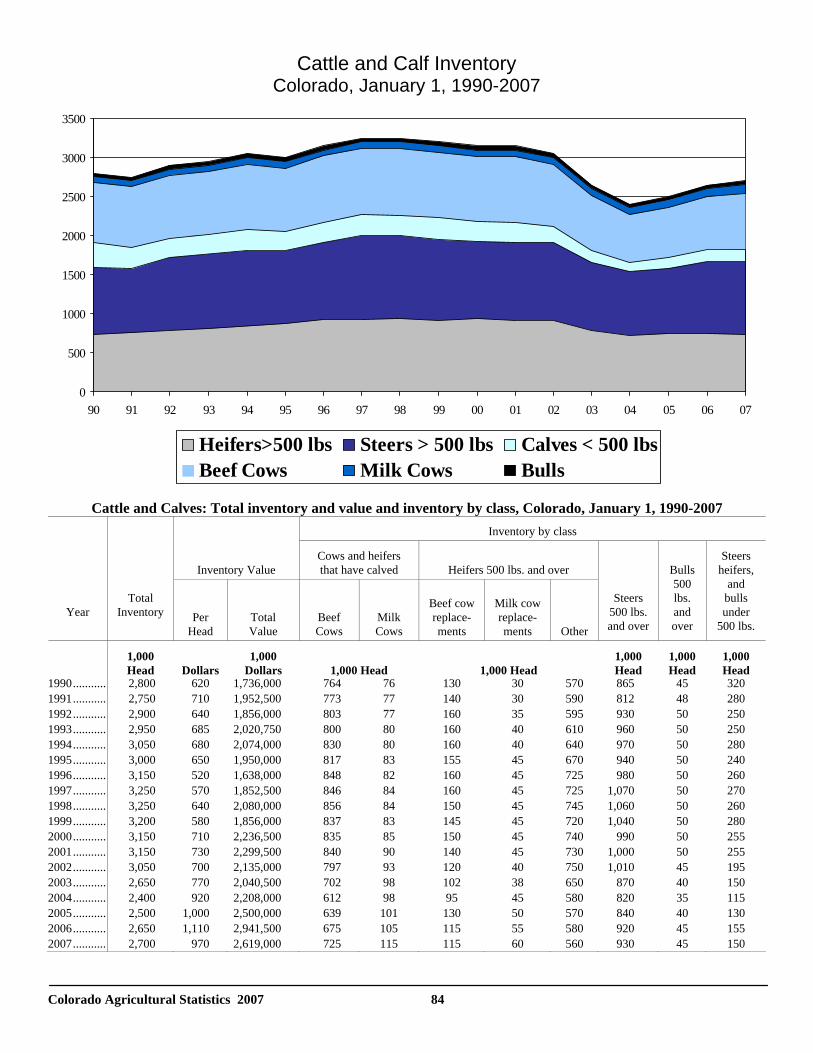
Colorado Agricultural Statistics 2007 84
Cattle and Calves: Total inventory and value and inventory by class, Colorado, January 1, 1990-2007
Inventory by class
Inventory Value
Cows and heifers that have calved
Heifers 500 lbs. and over
Year
Total Inventory
Per
Head Total Value
Beef Cows
Milk Cows
Beef cow replace-ments
Milk cow replace-ments
Other
Steers 500 lbs. and over
Bulls 500 lbs. and over
Steers heifers,
and bulls under
500 lbs.
1,000 Head
Dollars
1,000 Dollars
1,000 Head
1,000 Head
1,000 Head
1,000 Head
1,000 Head
1990........... 2,800 620 1,736,000 764 76 130 30 570 865 45 320 1991........... 2,750 710 1,952,500 773 77 140 30 590 812 48 280 1992........... 2,900 640 1,856,000 803 77 160 35 595 930 50 250 1993........... 2,950 685 2,020,750 800 80 160 40 610 960 50 250 1994........... 3,050 680 2,074,000 830 80 160 40 640 970 50 280 1995........... 3,000 650 1,950,000 817 83 155 45 670 940 50 240 1996........... 3,150 520 1,638,000 848 82 160 45 725 980 50 260 1997........... 3,250 570 1,852,500 846 84 160 45 725 1,070 50 270 1998........... 3,250 640 2,080,000 856 84 150 45 745 1,060 50 260 1999........... 3,200 580 1,856,000 837 83 145 45 720 1,040 50 280 2000........... 3,150 710 2,236,500 835 85 150 45 740 990 50 255 2001........... 3,150 730 2,299,500 840 90 140 45 730 1,000 50 255 2002........... 3,050 700 2,135,000 797 93 120 40 750 1,010 45 195 2003........... 2,650 770 2,040,500 702 98 102 38 650 870 40 150 2004........... 2,400 920 2,208,000 612 98 95 45 580 820 35 115 2005........... 2,500 1,000 2,500,000 639 101 130 50 570 840 40 130 2006........... 2,650 1,110 2,941,500 675 105 115 55 580 920 45 155 2007........... 2,700 970 2,619,000 725 115 115 60 560 930 45 150
Cattle and Calf InventoryColorado, January 1, 1990-2007
0
500
1000
1500
2000
2500
3000
3500
90 91 92 93 94 95 96 97 98 99 00 01 02 03 04 05 06 07
Heifers>500 lbs Steers > 500 lbs Calves < 500 lbsBeef Cows Milk Cows Bulls
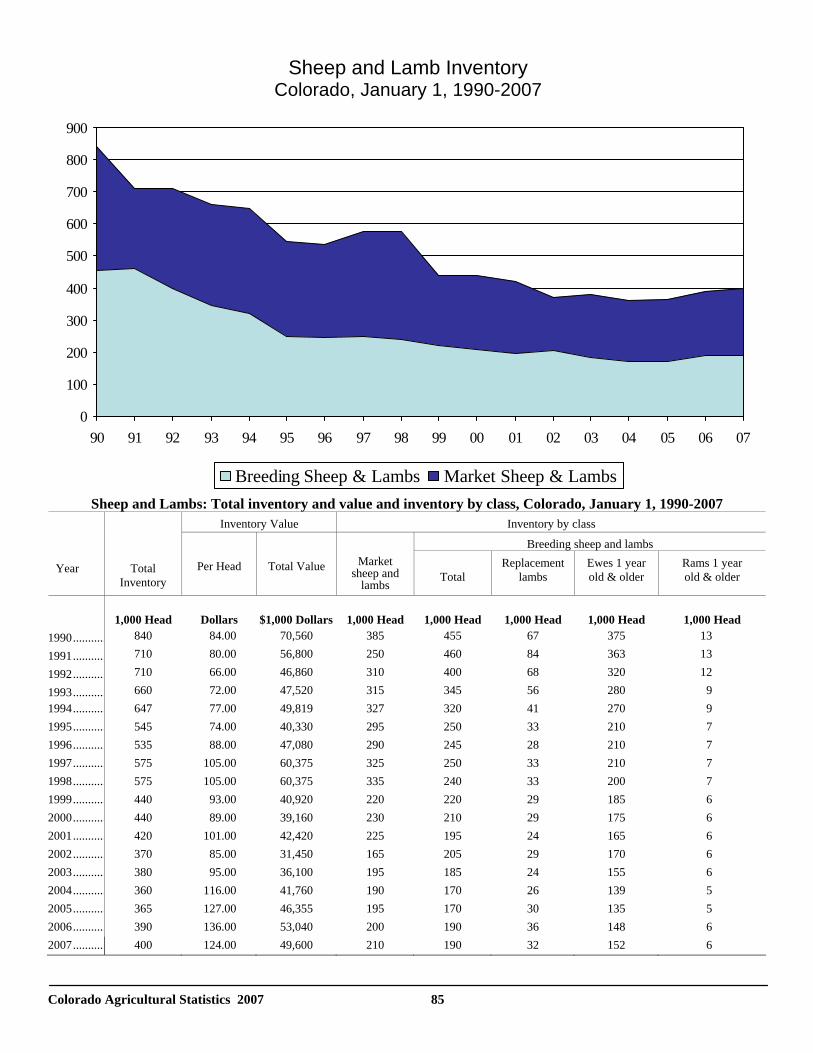
Colorado Agricultural Statistics 2007 85
Sheep and Lambs: Total inventory and value and inventory by class, Colorado, January 1, 1990-2007
Inventory Value Inventory by class
Breeding sheep and lambs
Year
Total Inventory
Per Head
Total Value
Market sheep and
lambs
Total
Replacement lambs
Ewes 1 year old & older
Rams 1 year old & older
1,000 Head Dollars $1,000 Dollars 1,000 Head 1,000 Head 1,000 Head 1,000 Head 1,000 Head
1990........... 840 84.00 70,560 385 455 67 375 13
1991........... 710 80.00 56,800 250 460 84 363 13
1992........... 710 66.00 46,860 310 400 68 320 12
1993........... 660 72.00 47,520 315 345 56 280 9 1994........... 647 77.00 49,819 327 320 41 270 9 1995........... 545 74.00 40,330 295 250 33 210 7 1996........... 535 88.00 47,080 290 245 28 210 7 1997........... 575 105.00 60,375 325 250 33 210 7 1998........... 575 105.00 60,375 335 240 33 200 7 1999........... 440 93.00 40,920 220 220 29 185 6 2000........... 440 89.00 39,160 230 210 29 175 6 2001........... 420 101.00 42,420 225 195 24 165 6 2002........... 370 85.00 31,450 165 205 29 170 6 2003........... 380 95.00 36,100 195 185 24 155 6 2004........... 360 116.00 41,760 190 170 26 139 5 2005........... 365 127.00 46,355 195 170 30 135 5 2006........... 390 136.00 53,040 200 190 36 148 6 2007........... 400 124.00 49,600 210 190 32 152 6
Sheep and Lamb InventoryColorado, January 1, 1990-2007
0
100
200
300
400
500
600
700
800
900
90 91 92 93 94 95 96 97 98 99 00 01 02 03 04 05 06 07
Breeding Sheep & Lambs Market Sheep & Lambs
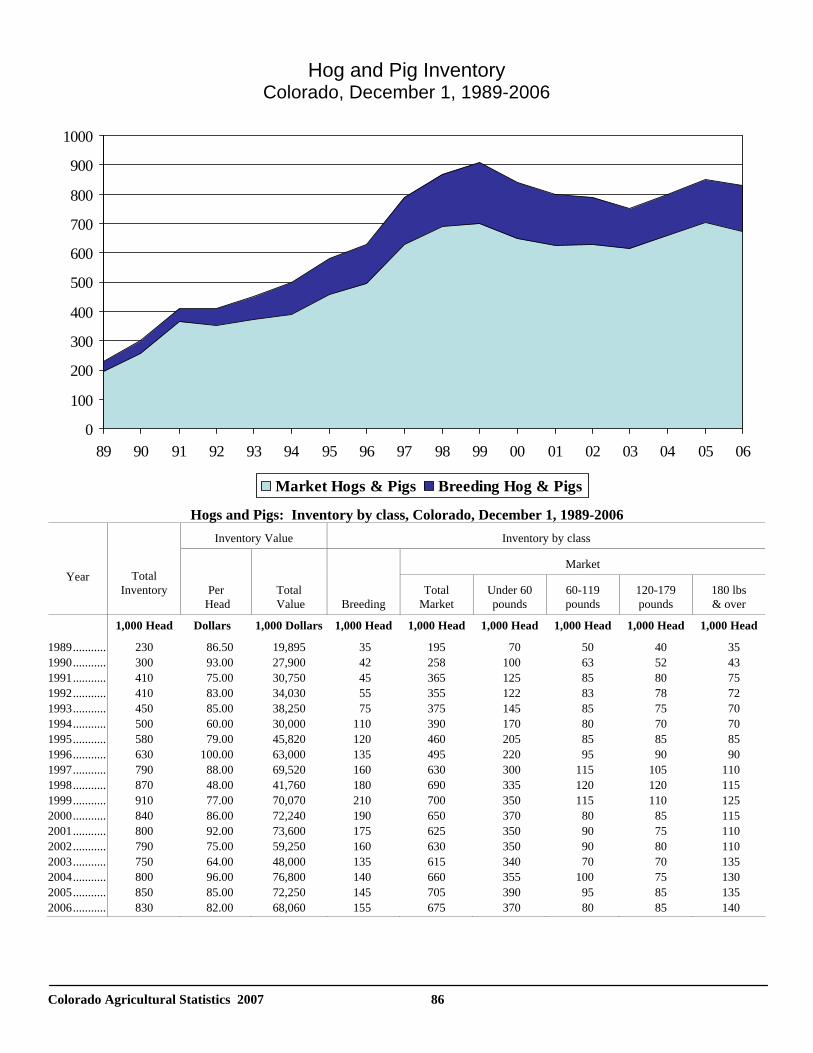
Colorado Agricultural Statistics 2007 86
Hogs and Pigs: Inventory by class, Colorado, December 1, 1989-2006
Inventory Value Inventory by class
Market Year
Total
Inventory
Per Head
Total Value
Breeding
Total Market
Under 60 pounds
60-119 pounds
120-179 pounds
180 lbs & over
1,000 Head Dollars 1,000 Dollars 1,000 Head 1,000 Head 1,000 Head 1,000 Head 1,000 Head 1,000 Head
1989........... 230 86.50 19,895 35 195 70 50 40 35 1990........... 300 93.00 27,900 42 258 100 63 52 43 1991........... 410 75.00 30,750 45 365 125 85 80 75 1992........... 410 83.00 34,030 55 355 122 83 78 72 1993........... 450 85.00 38,250 75 375 145 85 75 70 1994........... 500 60.00 30,000 110 390 170 80 70 70 1995........... 580 79.00 45,820 120 460 205 85 85 85 1996........... 630 100.00 63,000 135 495 220 95 90 90 1997........... 790 88.00 69,520 160 630 300 115 105 110 1998........... 870 48.00 41,760 180 690 335 120 120 115 1999........... 910 77.00 70,070 210 700 350 115 110 125 2000........... 840 86.00 72,240 190 650 370 80 85 115 2001........... 800 92.00 73,600 175 625 350 90 75 110 2002........... 790 75.00 59,250 160 630 350 90 80 110 2003........... 750 64.00 48,000 135 615 340 70 70 135 2004........... 800 96.00 76,800 140 660 355 100 75 130 2005........... 850 85.00 72,250 145 705 390 95 85 135 2006........... 830 82.00 68,060 155 675 370 80 85 140
Hog and Pig Inventory Colorado, December 1, 1989-2006
0
100
200
300
400
500
600
700
800
900
1000
89 90 91 92 93 94 95 96 97 98 99 00 01 02 03 04 05 06
Market Hogs & Pigs Breeding Hog & Pigs
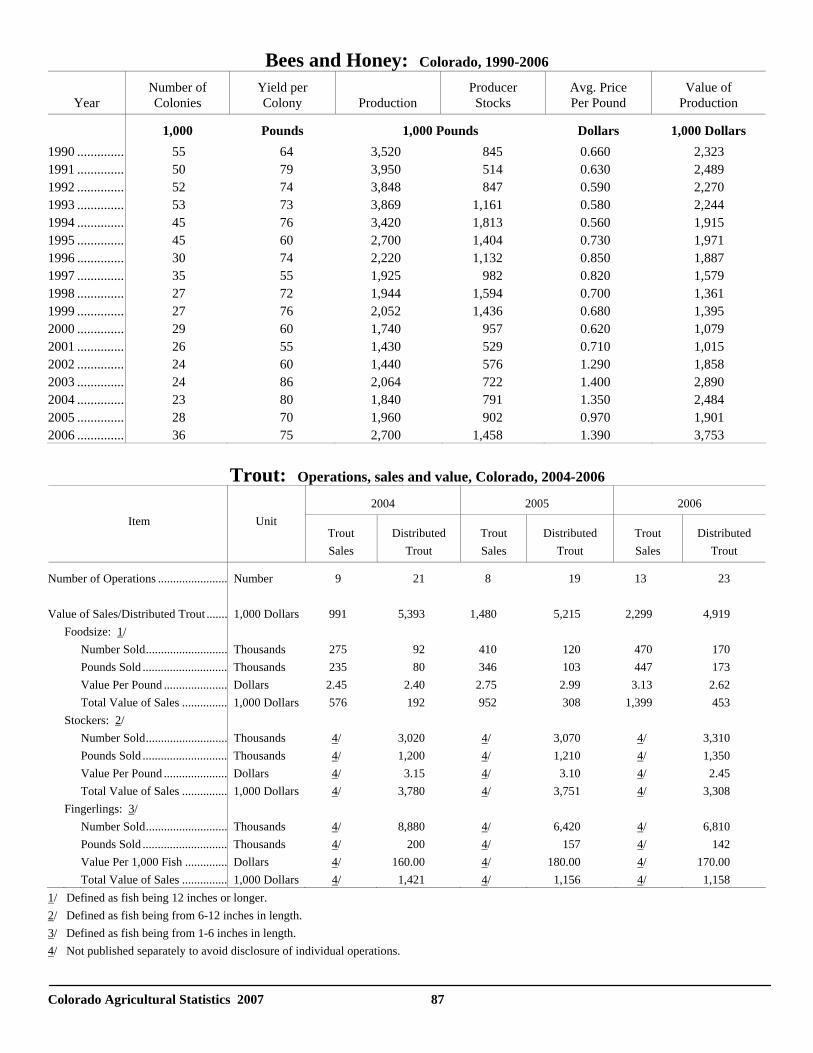
Colorado Agricultural Statistics 2007 87
Bees and Honey: Colorado, 1990-2006
Year
Number of Colonies
Yield per Colony
Production
Producer Stocks
Avg. Price Per Pound
Value of Production
1,000 Pounds 1,000 Pounds Dollars 1,000 Dollars 1990 .............. 55 64 3,520 845 0.660 2,323 1991 .............. 50 79 3,950 514 0.630 2,489 1992 .............. 52 74 3,848 847 0.590 2,270 1993 .............. 53 73 3,869 1,161 0.580 2,244 1994 .............. 45 76 3,420 1,813 0.560 1,915 1995 .............. 45 60 2,700 1,404 0.730 1,971 1996 .............. 30 74 2,220 1,132 0.850 1,887 1997 .............. 35 55 1,925 982 0.820 1,579 1998 .............. 27 72 1,944 1,594 0.700 1,361 1999 .............. 27 76 2,052 1,436 0.680 1,395 2000 .............. 29 60 1,740 957 0.620 1,079 2001 .............. 26 55 1,430 529 0.710 1,015 2002 .............. 24 60 1,440 576 1.290 1,858 2003 .............. 24 86 2,064 722 1.400 2,890 2004 .............. 23 80 1,840 791 1.350 2,484 2005 .............. 28 70 1,960 902 0.970 1,901 2006 .............. 36 75 2,700 1,458 1.390 3,753 Trout: Operations, sales and value, Colorado, 2004-2006
2004 2005 2006 Item
Unit
Trout Sales
Distributed Trout
Trout Sales
Distributed Trout
Trout Sales
Distributed Trout
Number of Operations ....................... Number 9 21 8 19 13 23 Value of Sales/Distributed Trout ....... 1,000 Dollars 991 5,393 1,480 5,215 2,299 4,919 Foodsize: 1/ Number Sold........................... Thousands 275 92 410 120 470 170 Pounds Sold ............................ Thousands 235 80 346 103 447 173 Value Per Pound ..................... Dollars 2.45 2.40 2.75 2.99 3.13 2.62 Total Value of Sales ............... 1,000 Dollars 576 192 952 308 1,399 453 Stockers: 2/ Number Sold........................... Thousands 4/ 3,020 4/ 3,070 4/ 3,310 Pounds Sold ............................ Thousands 4/ 1,200 4/ 1,210 4/ 1,350 Value Per Pound ..................... Dollars 4/ 3.15 4/ 3.10 4/ 2.45 Total Value of Sales ............... 1,000 Dollars 4/ 3,780 4/ 3,751 4/ 3,308 Fingerlings: 3/ Number Sold........................... Thousands 4/ 8,880 4/ 6,420 4/ 6,810 Pounds Sold ............................ Thousands 4/ 200 4/ 157 4/ 142 Value Per 1,000 Fish .............. Dollars 4/ 160.00 4/ 180.00 4/ 170.00 Total Value of Sales ............... 1,000 Dollars 4/ 1,421 4/ 1,156 4/ 1,158 1/ Defined as fish being 12 inches or longer. 2/ Defined as fish being from 6-12 inches in length. 3/ Defined as fish being from 1-6 inches in length. 4/ Not published separately to avoid disclosure of individual operations.
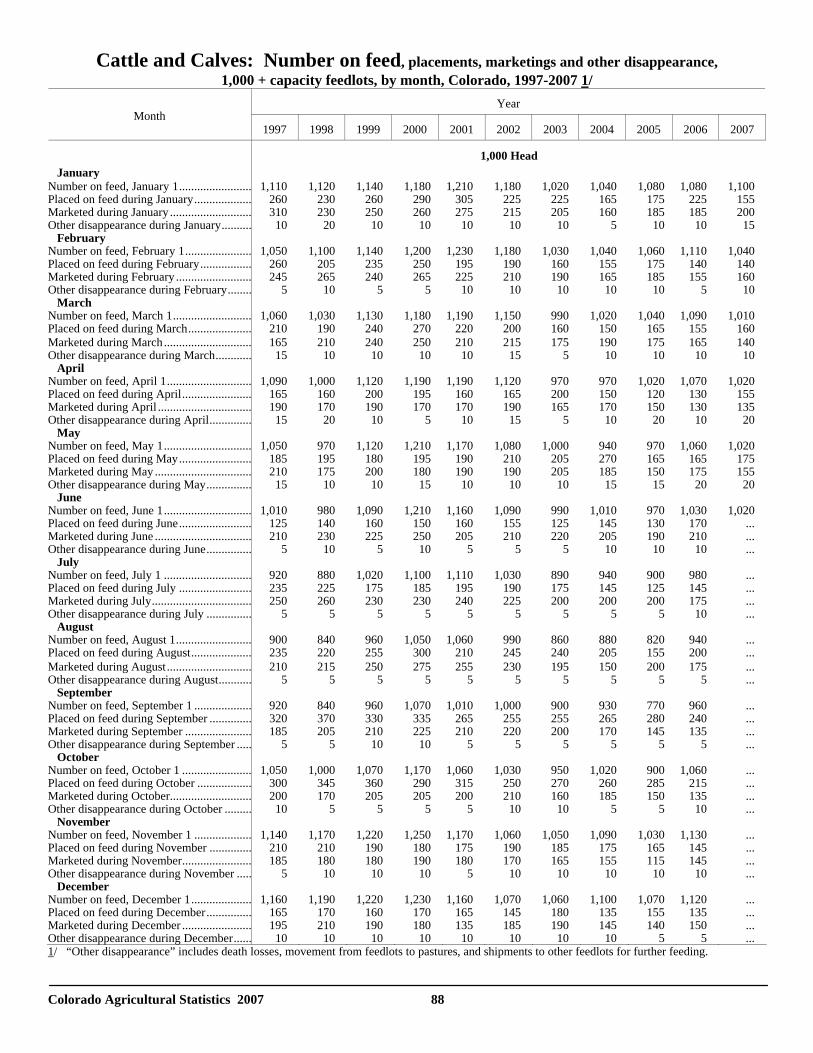
Colorado Agricultural Statistics 2007 88
Cattle and Calves: Number on feed, placements, marketings and other disappearance, 1,000 + capacity feedlots, by month, Colorado, 1997-2007 1/
Year Month
1997 1998 1999 2000 2001 2002 2003 2004 2005 2006 2007
1,000 Head January Number on feed, January 1........................ 1,110 1,120 1,140 1,180 1,210 1,180 1,020 1,040 1,080 1,080 1,100 Placed on feed during January................... 260 230 260 290 305 225 225 165 175 225 155 Marketed during January ........................... 310 230 250 260 275 215 205 160 185 185 200 Other disappearance during January.......... 10 20 10 10 10 10 10 5 10 10 15 February Number on feed, February 1...................... 1,050 1,100 1,140 1,200 1,230 1,180 1,030 1,040 1,060 1,110 1,040 Placed on feed during February................. 260 205 235 250 195 190 160 155 175 140 140 Marketed during February ......................... 245 265 240 265 225 210 190 165 185 155 160 Other disappearance during February........ 5 10 5 5 10 10 10 10 10 5 10 March Number on feed, March 1.......................... 1,060 1,030 1,130 1,180 1,190 1,150 990 1,020 1,040 1,090 1,010 Placed on feed during March..................... 210 190 240 270 220 200 160 150 165 155 160 Marketed during March............................. 165 210 240 250 210 215 175 190 175 165 140 Other disappearance during March............ 15 10 10 10 10 15 5 10 10 10 10 April Number on feed, April 1............................ 1,090 1,000 1,120 1,190 1,190 1,120 970 970 1,020 1,070 1,020 Placed on feed during April....................... 165 160 200 195 160 165 200 150 120 130 155 Marketed during April ............................... 190 170 190 170 170 190 165 170 150 130 135 Other disappearance during April.............. 15 20 10 5 10 15 5 10 20 10 20 May Number on feed, May 1............................. 1,050 970 1,120 1,210 1,170 1,080 1,000 940 970 1,060 1,020 Placed on feed during May........................ 185 195 180 195 190 210 205 270 165 165 175 Marketed during May ................................ 210 175 200 180 190 190 205 185 150 175 155 Other disappearance during May............... 15 10 10 15 10 10 10 15 15 20 20 June Number on feed, June 1............................. 1,010 980 1,090 1,210 1,160 1,090 990 1,010 970 1,030 1,020 Placed on feed during June........................ 125 140 160 150 160 155 125 145 130 170 ... Marketed during June ................................ 210 230 225 250 205 210 220 205 190 210 ... Other disappearance during June............... 5 10 5 10 5 5 5 10 10 10 ... July Number on feed, July 1 ............................. 920 880 1,020 1,100 1,110 1,030 890 940 900 980 ... Placed on feed during July ........................ 235 225 175 185 195 190 175 145 125 145 ... Marketed during July................................. 250 260 230 230 240 225 200 200 200 175 ... Other disappearance during July ............... 5 5 5 5 5 5 5 5 5 10 ... August Number on feed, August 1......................... 900 840 960 1,050 1,060 990 860 880 820 940 ... Placed on feed during August.................... 235 220 255 300 210 245 240 205 155 200 ... Marketed during August............................ 210 215 250 275 255 230 195 150 200 175 ... Other disappearance during August........... 5 5 5 5 5 5 5 5 5 5 ... September Number on feed, September 1 ................... 920 840 960 1,070 1,010 1,000 900 930 770 960 ... Placed on feed during September .............. 320 370 330 335 265 255 255 265 280 240 ... Marketed during September ...................... 185 205 210 225 210 220 200 170 145 135 ... Other disappearance during September ..... 5 5 10 10 5 5 5 5 5 5 ... October Number on feed, October 1 ....................... 1,050 1,000 1,070 1,170 1,060 1,030 950 1,020 900 1,060 ... Placed on feed during October .................. 300 345 360 290 315 250 270 260 285 215 ... Marketed during October........................... 200 170 205 205 200 210 160 185 150 135 ... Other disappearance during October ......... 10 5 5 5 5 10 10 5 5 10 ... November Number on feed, November 1 ................... 1,140 1,170 1,220 1,250 1,170 1,060 1,050 1,090 1,030 1,130 ... Placed on feed during November .............. 210 210 190 180 175 190 185 175 165 145 ... Marketed during November....................... 185 180 180 190 180 170 165 155 115 145 ... Other disappearance during November ..... 5 10 10 10 5 10 10 10 10 10 ... December Number on feed, December 1.................... 1,160 1,190 1,220 1,230 1,160 1,070 1,060 1,100 1,070 1,120 ... Placed on feed during December............... 165 170 160 170 165 145 180 135 155 135 ... Marketed during December ....................... 195 210 190 180 135 185 190 145 140 150 ... Other disappearance during December...... 10 10 10 10 10 10 10 10 5 5 ... 1/ “Other disappearance” includes death losses, movement from feedlots to pastures, and shipments to other feedlots for further feeding.
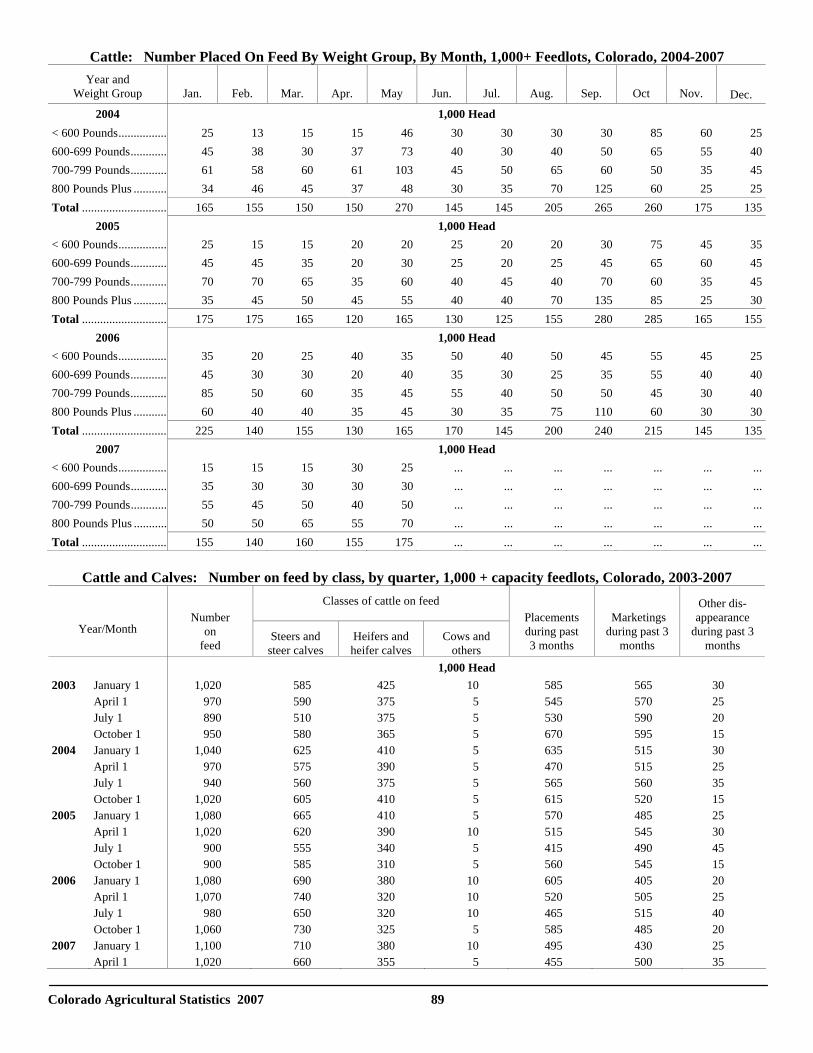
Colorado Agricultural Statistics 2007 89
Cattle: Number Placed On Feed By Weight Group, By Month, 1,000+ Feedlots, Colorado, 2004-2007 Year and
Weight Group
Jan.
Feb.
Mar.
Apr.
May
Jun.
Jul.
Aug.
Sep.
Oct
Nov.
Dec. 2004 1,000 Head
< 600 Pounds................ 25 13 15 15 46 30 30 30 30 85 60 25600-699 Pounds............ 45 38 30 37 73 40 30 40 50 65 55 40700-799 Pounds............ 61 58 60 61 103 45 50 65 60 50 35 45800 Pounds Plus ........... 34 46 45 37 48 30 35 70 125 60 25 25Total ............................ 165 155 150 150 270 145 145 205 265 260 175 135
2005 1,000 Head < 600 Pounds................ 25 15 15 20 20 25 20 20 30 75 45 35600-699 Pounds............ 45 45 35 20 30 25 20 25 45 65 60 45700-799 Pounds............ 70 70 65 35 60 40 45 40 70 60 35 45800 Pounds Plus ........... 35 45 50 45 55 40 40 70 135 85 25 30Total ............................ 175 175 165 120 165 130 125 155 280 285 165 155
2006 1,000 Head < 600 Pounds................ 35 20 25 40 35 50 40 50 45 55 45 25600-699 Pounds............ 45 30 30 20 40 35 30 25 35 55 40 40700-799 Pounds............ 85 50 60 35 45 55 40 50 50 45 30 40800 Pounds Plus ........... 60 40 40 35 45 30 35 75 110 60 30 30Total ............................ 225 140 155 130 165 170 145 200 240 215 145 135
2007 1,000 Head < 600 Pounds................ 15 15 15 30 25 ... ... ... ... ... ... ...600-699 Pounds............ 35 30 30 30 30 ... ... ... ... ... ... ...700-799 Pounds............ 55 45 50 40 50 ... ... ... ... ... ... ...800 Pounds Plus ........... 50 50 65 55 70 ... ... ... ... ... ... ...Total ............................ 155 140 160 155 175 ... ... ... ... ... ... ...
Cattle and Calves: Number on feed by class, by quarter, 1,000 + capacity feedlots, Colorado, 2003-2007
Classes of cattle on feed
Year/Month
Number
on feed
Steers and steer calves
Heifers and heifer calves
Cows and others
Placements during past 3 months
Marketings during past 3
months
Other dis-appearance
during past 3 months
1,000 Head 2003 January 1 1,020 585 425 10 585 565 30
April 1 970 590 375 5 545 570 25 July 1 890 510 375 5 530 590 20
October 1 950 580 365 5 670 595 15 2004 January 1 1,040 625 410 5 635 515 30
April 1 970 575 390 5 470 515 25 July 1 940 560 375 5 565 560 35
October 1 1,020 605 410 5 615 520 15 2005 January 1 1,080 665 410 5 570 485 25
April 1 1,020 620 390 10 515 545 30 July 1 900 555 340 5 415 490 45
October 1 900 585 310 5 560 545 15 2006 January 1 1,080 690 380 10 605 405 20
April 1 1,070 740 320 10 520 505 25July 1 980 650 320 10 465 515 40
October 1 1,060 730 325 5 585 485 202007 January 1 1,100 710 380 10 495 430 25 April 1 1,020 660 355 5 455 500 35
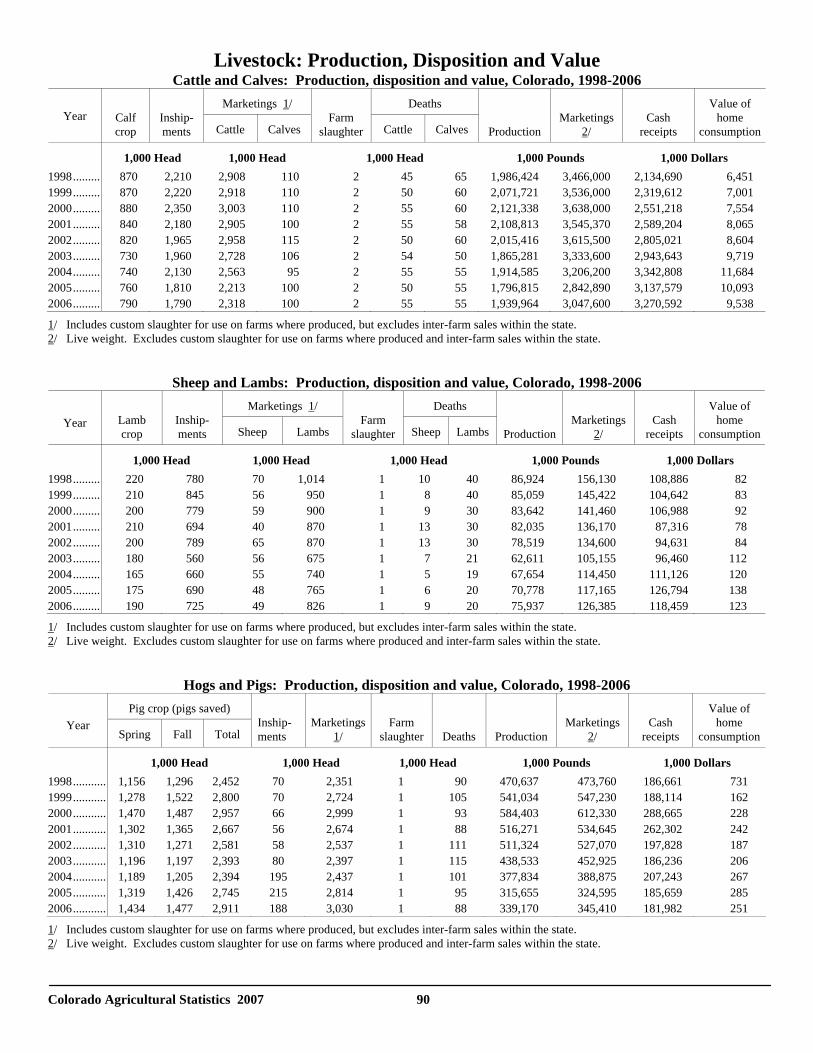
Colorado Agricultural Statistics 2007 90
Livestock: Production, Disposition and Value Cattle and Calves: Production, disposition and value, Colorado, 1998-2006
Marketings 1/ Deaths Year
Calf crop
Inship- ments Cattle Calves
Farm
slaughter Cattle Calves
Production
Marketings
2/
Cash
receipts
Value of home
consumption
1,000 Head 1,000 Head 1,000 Head 1,000 Pounds 1,000 Dollars 1998......... 870 2,210 2,908 110 2 45 65 1,986,424 3,466,000 2,134,690 6,451 1999......... 870 2,220 2,918 110 2 50 60 2,071,721 3,536,000 2,319,612 7,001 2000......... 880 2,350 3,003 110 2 55 60 2,121,338 3,638,000 2,551,218 7,554 2001......... 840 2,180 2,905 100 2 55 58 2,108,813 3,545,370 2,589,204 8,065 2002......... 820 1,965 2,958 115 2 50 60 2,015,416 3,615,500 2,805,021 8,604 2003......... 730 1,960 2,728 106 2 54 50 1,865,281 3,333,600 2,943,643 9,719 2004......... 740 2,130 2,563 95 2 55 55 1,914,585 3,206,200 3,342,808 11,684 2005......... 760 1,810 2,213 100 2 50 55 1,796,815 2,842,890 3,137,579 10,093 2006......... 790 1,790 2,318 100 2 55 55 1,939,964 3,047,600 3,270,592 9,538 1/ Includes custom slaughter for use on farms where produced, but excludes inter-farm sales within the state. 2/ Live weight. Excludes custom slaughter for use on farms where produced and inter-farm sales within the state.
Sheep and Lambs: Production, disposition and value, Colorado, 1998-2006 Marketings 1/ Deaths
Year
Lamb crop
Inship- ments Sheep Lambs
Farm
slaughter Sheep Lambs
Production
Marketings
2/
Cash
receipts
Value of home
consumption
1,000 Head 1,000 Head 1,000 Head 1,000 Pounds 1,000 Dollars 1998......... 220 780 70 1,014 1 10 40 86,924 156,130 108,886 82 1999......... 210 845 56 950 1 8 40 85,059 145,422 104,642 83 2000......... 200 779 59 900 1 9 30 83,642 141,460 106,988 92 2001......... 210 694 40 870 1 13 30 82,035 136,170 87,316 78 2002......... 200 789 65 870 1 13 30 78,519 134,600 94,631 84 2003......... 180 560 56 675 1 7 21 62,611 105,155 96,460 112 2004......... 165 660 55 740 1 5 19 67,654 114,450 111,126 120 2005......... 175 690 48 765 1 6 20 70,778 117,165 126,794 138 2006......... 190 725 49 826 1 9 20 75,937 126,385 118,459 123 1/ Includes custom slaughter for use on farms where produced, but excludes inter-farm sales within the state. 2/ Live weight. Excludes custom slaughter for use on farms where produced and inter-farm sales within the state.
Hogs and Pigs: Production, disposition and value, Colorado, 1998-2006 Pig crop (pigs saved)
Year Spring Fall Total
Inship- ments
Marketings
1/
Farm
slaughter
Deaths
Production
Marketings
2/
Cash
receipts
Value of home
consumption
1,000 Head 1,000 Head 1,000 Head 1,000 Pounds 1,000 Dollars 1998........... 1,156 1,296 2,452 70 2,351 1 90 470,637 473,760 186,661 731 1999........... 1,278 1,522 2,800 70 2,724 1 105 541,034 547,230 188,114 162 2000........... 1,470 1,487 2,957 66 2,999 1 93 584,403 612,330 288,665 228 2001........... 1,302 1,365 2,667 56 2,674 1 88 516,271 534,645 262,302 242 2002........... 1,310 1,271 2,581 58 2,537 1 111 511,324 527,070 197,828 187 2003........... 1,196 1,197 2,393 80 2,397 1 115 438,533 452,925 186,236 206 2004........... 1,189 1,205 2,394 195 2,437 1 101 377,834 388,875 207,243 267 2005........... 1,319 1,426 2,745 215 2,814 1 95 315,655 324,595 185,659 285 2006........... 1,434 1,477 2,911 188 3,030 1 88 339,170 345,410 181,982 251 1/ Includes custom slaughter for use on farms where produced, but excludes inter-farm sales within the state. 2/ Live weight. Excludes custom slaughter for use on farms where produced and inter-farm sales within the state.
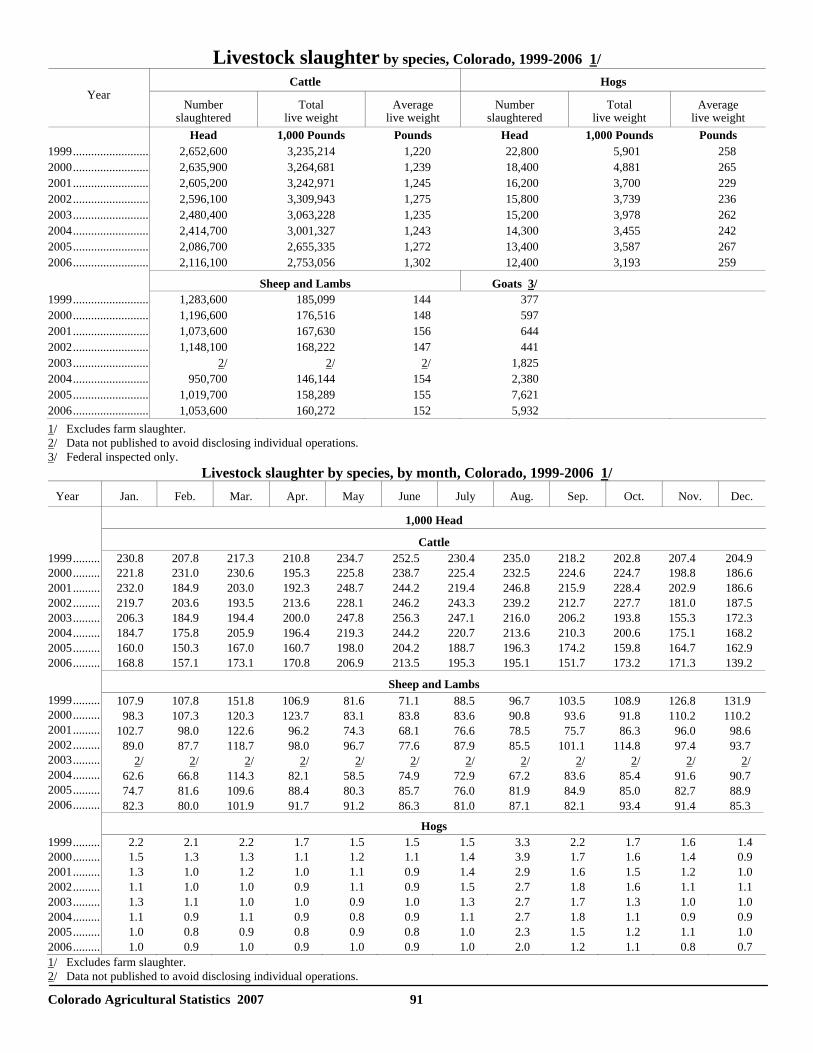
Colorado Agricultural Statistics 2007 91
Livestock slaughter by species, Colorado, 1999-2006 1/ Cattle Hogs
Year Number
slaughtered Total
live weight Average
live weight Number
slaughtered Total
live weight Average
live weight Head 1,000 Pounds Pounds Head 1,000 Pounds Pounds
1999......................... 2,652,600 3,235,214 1,220 22,800 5,901 258 2000......................... 2,635,900 3,264,681 1,239 18,400 4,881 265 2001......................... 2,605,200 3,242,971 1,245 16,200 3,700 229 2002......................... 2,596,100 3,309,943 1,275 15,800 3,739 236 2003......................... 2,480,400 3,063,228 1,235 15,200 3,978 262 2004......................... 2,414,700 3,001,327 1,243 14,300 3,455 242 2005......................... 2,086,700 2,655,335 1,272 13,400 3,587 267 2006......................... 2,116,100 2,753,056 1,302 12,400 3,193 259
Sheep and Lambs Goats 3/ 1999......................... 1,283,600 185,099 144 377 2000......................... 1,196,600 176,516 148 597 2001......................... 1,073,600 167,630 156 644 2002......................... 1,148,100 168,222 147 441 2003......................... 2/ 2/ 2/ 1,825 2004......................... 950,700 146,144 154 2,380 2005......................... 1,019,700 158,289 155 7,621 2006......................... 1,053,600 160,272 152 5,932 1/ Excludes farm slaughter. 2/ Data not published to avoid disclosing individual operations. 3/ Federal inspected only.
Livestock slaughter by species, by month, Colorado, 1999-2006 1/ Year Jan. Feb. Mar. Apr. May June July Aug. Sep. Oct. Nov. Dec.
1,000 Head
Cattle 1999......... 230.8 207.8 217.3 210.8 234.7 252.5 230.4 235.0 218.2 202.8 207.4 204.9 2000......... 221.8 231.0 230.6 195.3 225.8 238.7 225.4 232.5 224.6 224.7 198.8 186.6 2001......... 232.0 184.9 203.0 192.3 248.7 244.2 219.4 246.8 215.9 228.4 202.9 186.6 2002......... 219.7 203.6 193.5 213.6 228.1 246.2 243.3 239.2 212.7 227.7 181.0 187.5 2003......... 206.3 184.9 194.4 200.0 247.8 256.3 247.1 216.0 206.2 193.8 155.3 172.3 2004......... 184.7 175.8 205.9 196.4 219.3 244.2 220.7 213.6 210.3 200.6 175.1 168.2 2005......... 160.0 150.3 167.0 160.7 198.0 204.2 188.7 196.3 174.2 159.8 164.7 162.9 2006......... 168.8 157.1 173.1 170.8 206.9 213.5 195.3 195.1 151.7 173.2 171.3 139.2
Sheep and Lambs 1999......... 107.9 107.8 151.8 106.9 81.6 71.1 88.5 96.7 103.5 108.9 126.8 131.9 2000......... 98.3 107.3 120.3 123.7 83.1 83.8 83.6 90.8 93.6 91.8 110.2 110.2 2001......... 102.7 98.0 122.6 96.2 74.3 68.1 76.6 78.5 75.7 86.3 96.0 98.6 2002......... 89.0 87.7 118.7 98.0 96.7 77.6 87.9 85.5 101.1 114.8 97.4 93.7 2003......... 2/ 2/ 2/ 2/ 2/ 2/ 2/ 2/ 2/ 2/ 2/ 2/ 2004......... 62.6 66.8 114.3 82.1 58.5 74.9 72.9 67.2 83.6 85.4 91.6 90.7 2005......... 74.7 81.6 109.6 88.4 80.3 85.7 76.0 81.9 84.9 85.0 82.7 88.9 2006......... 82.3 80.0 101.9 91.7 91.2 86.3 81.0 87.1 82.1 93.4 91.4 85.3
Hogs 1999......... 2.2 2.1 2.2 1.7 1.5 1.5 1.5 3.3 2.2 1.7 1.6 1.4 2000......... 1.5 1.3 1.3 1.1 1.2 1.1 1.4 3.9 1.7 1.6 1.4 0.9 2001......... 1.3 1.0 1.2 1.0 1.1 0.9 1.4 2.9 1.6 1.5 1.2 1.0 2002......... 1.1 1.0 1.0 0.9 1.1 0.9 1.5 2.7 1.8 1.6 1.1 1.1 2003......... 1.3 1.1 1.0 1.0 0.9 1.0 1.3 2.7 1.7 1.3 1.0 1.0 2004......... 1.1 0.9 1.1 0.9 0.8 0.9 1.1 2.7 1.8 1.1 0.9 0.9 2005......... 1.0 0.8 0.9 0.8 0.9 0.8 1.0 2.3 1.5 1.2 1.1 1.0 2006......... 1.0 0.9 1.0 0.9 1.0 0.9 1.0 2.0 1.2 1.1 0.8 0.7 1/ Excludes farm slaughter. 2/ Data not published to avoid disclosing individual operations.
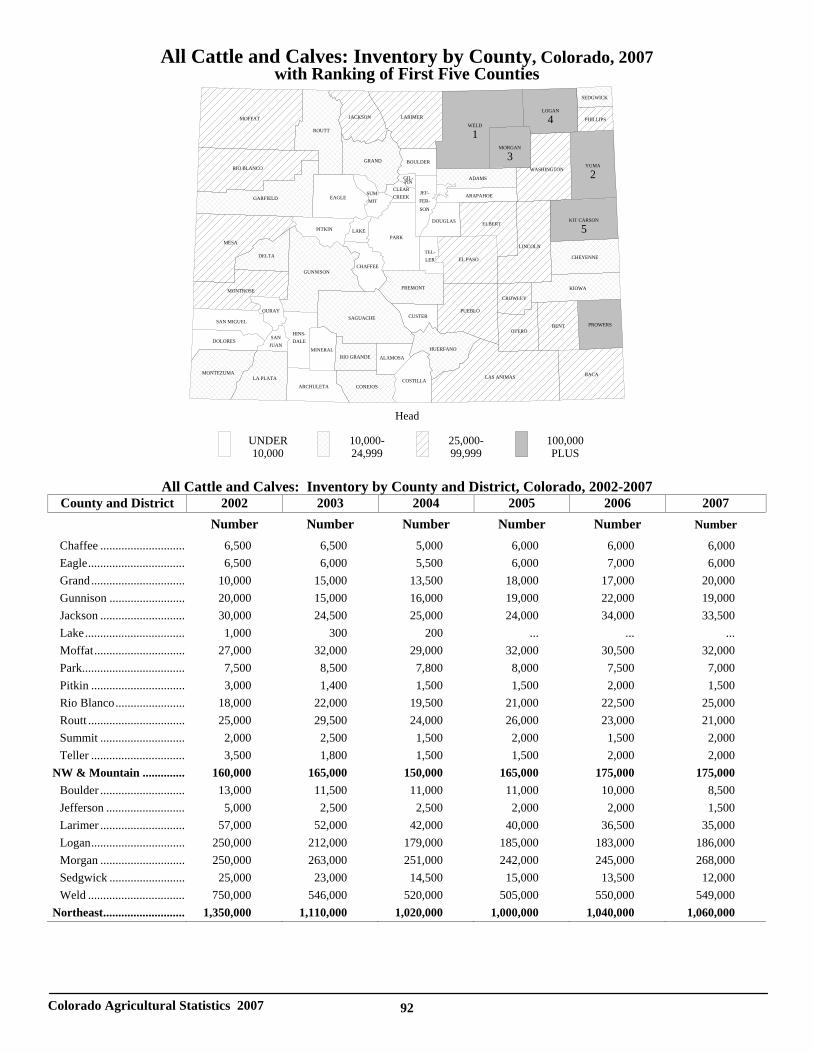
Colorado Agricultural Statistics 2007 92
All Cattle and Calves: Inventory by County, Colorado, 2007 with Ranking of First Five Counties
Head
UNDER10,000
10,000-24,999
25,000-99,999
100,000PLUS
ADAMS
ALAMOSA
ARAPAHOE
ARCHULETA
BACA
BENT
BOULDER
CHAFFEE
CHEYENNE
CLEARCREEK
CONEJOSCOSTILLA
CROWLEY
CUSTER
DELTA
DOLORES
DOUGLAS
EAGLE
ELBERT
EL PASO
FREMONT
GARFIELD
GIL-PIN
GRAND
GUNNISON
HINS-DALE
HUERFANO
JACKSON
JEF-FER-SON
KIOWA
KIT CARSON
5LAKE
LA PLATA
LARIMER
LAS ANIMAS
LINCOLN
LOGAN
4
MESA
MINERAL
MOFFAT
MONTEZUMA
MONTROSE
MORGAN
3
OTERO
OURAY
PARK
PHILLIPS
PITKIN
PROWERS
PUEBLO
RIO BLANCO
RIO GRANDE
ROUTT
SAGUACHE
SANJUAN
SAN MIGUEL
SEDGWICK
SUM-MIT
TEL-LER
WASHINGTON
WELD
1
YUMA
2
All Cattle and Calves: Inventory by County and District, Colorado, 2002-2007 County and District 2002 2003 2004 2005 2006 2007
Number Number Number Number Number Number
Chaffee ............................ 6,500 6,500 5,000 6,000 6,000 6,000 Eagle................................ 6,500 6,000 5,500 6,000 7,000 6,000 Grand............................... 10,000 15,000 13,500 18,000 17,000 20,000 Gunnison ......................... 20,000 15,000 16,000 19,000 22,000 19,000 Jackson ............................ 30,000 24,500 25,000 24,000 34,000 33,500 Lake................................. 1,000 300 200 ... ... ... Moffat.............................. 27,000 32,000 29,000 32,000 30,500 32,000 Park.................................. 7,500 8,500 7,800 8,000 7,500 7,000 Pitkin ............................... 3,000 1,400 1,500 1,500 2,000 1,500 Rio Blanco....................... 18,000 22,000 19,500 21,000 22,500 25,000 Routt ................................ 25,000 29,500 24,000 26,000 23,000 21,000 Summit ............................ 2,000 2,500 1,500 2,000 1,500 2,000 Teller ............................... 3,500 1,800 1,500 1,500 2,000 2,000
NW & Mountain .............. 160,000 165,000 150,000 165,000 175,000 175,000 Boulder ............................ 13,000 11,500 11,000 11,000 10,000 8,500 Jefferson .......................... 5,000 2,500 2,500 2,000 2,000 1,500 Larimer ............................ 57,000 52,000 42,000 40,000 36,500 35,000 Logan............................... 250,000 212,000 179,000 185,000 183,000 186,000 Morgan ............................ 250,000 263,000 251,000 242,000 245,000 268,000 Sedgwick ......................... 25,000 23,000 14,500 15,000 13,500 12,000 Weld ................................ 750,000 546,000 520,000 505,000 550,000 549,000
Northeast........................... 1,350,000 1,110,000 1,020,000 1,000,000 1,040,000 1,060,000
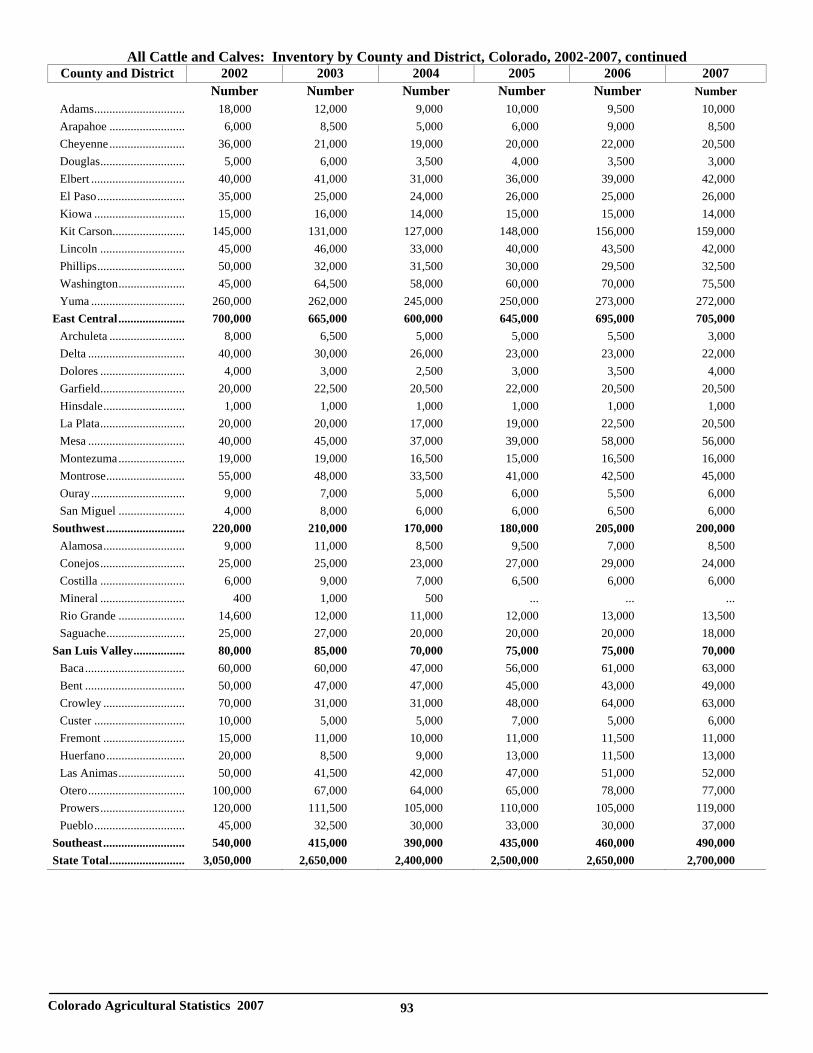
Colorado Agricultural Statistics 2007 93
All Cattle and Calves: Inventory by County and District, Colorado, 2002-2007, continued County and District 2002 2003 2004 2005 2006 2007
Number Number Number Number Number Number Adams.............................. 18,000 12,000 9,000 10,000 9,500 10,000 Arapahoe ......................... 6,000 8,500 5,000 6,000 9,000 8,500 Cheyenne......................... 36,000 21,000 19,000 20,000 22,000 20,500 Douglas............................ 5,000 6,000 3,500 4,000 3,500 3,000 Elbert ............................... 40,000 41,000 31,000 36,000 39,000 42,000 El Paso............................. 35,000 25,000 24,000 26,000 25,000 26,000 Kiowa .............................. 15,000 16,000 14,000 15,000 15,000 14,000 Kit Carson........................ 145,000 131,000 127,000 148,000 156,000 159,000 Lincoln ............................ 45,000 46,000 33,000 40,000 43,500 42,000 Phillips............................. 50,000 32,000 31,500 30,000 29,500 32,500 Washington...................... 45,000 64,500 58,000 60,000 70,000 75,500 Yuma ............................... 260,000 262,000 245,000 250,000 273,000 272,000
East Central...................... 700,000 665,000 600,000 645,000 695,000 705,000 Archuleta ......................... 8,000 6,500 5,000 5,000 5,500 3,000 Delta ................................ 40,000 30,000 26,000 23,000 23,000 22,000 Dolores ............................ 4,000 3,000 2,500 3,000 3,500 4,000 Garfield............................ 20,000 22,500 20,500 22,000 20,500 20,500 Hinsdale........................... 1,000 1,000 1,000 1,000 1,000 1,000 La Plata............................ 20,000 20,000 17,000 19,000 22,500 20,500 Mesa ................................ 40,000 45,000 37,000 39,000 58,000 56,000 Montezuma...................... 19,000 19,000 16,500 15,000 16,500 16,000 Montrose.......................... 55,000 48,000 33,500 41,000 42,500 45,000 Ouray............................... 9,000 7,000 5,000 6,000 5,500 6,000 San Miguel ...................... 4,000 8,000 6,000 6,000 6,500 6,000
Southwest.......................... 220,000 210,000 170,000 180,000 205,000 200,000 Alamosa........................... 9,000 11,000 8,500 9,500 7,000 8,500 Conejos............................ 25,000 25,000 23,000 27,000 29,000 24,000 Costilla ............................ 6,000 9,000 7,000 6,500 6,000 6,000 Mineral ............................ 400 1,000 500 ... ... ... Rio Grande ...................... 14,600 12,000 11,000 12,000 13,000 13,500 Saguache.......................... 25,000 27,000 20,000 20,000 20,000 18,000
San Luis Valley................. 80,000 85,000 70,000 75,000 75,000 70,000 Baca................................. 60,000 60,000 47,000 56,000 61,000 63,000 Bent ................................. 50,000 47,000 47,000 45,000 43,000 49,000 Crowley ........................... 70,000 31,000 31,000 48,000 64,000 63,000 Custer .............................. 10,000 5,000 5,000 7,000 5,000 6,000 Fremont ........................... 15,000 11,000 10,000 11,000 11,500 11,000 Huerfano.......................... 20,000 8,500 9,000 13,000 11,500 13,000 Las Animas...................... 50,000 41,500 42,000 47,000 51,000 52,000 Otero................................ 100,000 67,000 64,000 65,000 78,000 77,000 Prowers............................ 120,000 111,500 105,000 110,000 105,000 119,000 Pueblo.............................. 45,000 32,500 30,000 33,000 30,000 37,000
Southeast........................... 540,000 415,000 390,000 435,000 460,000 490,000 State Total......................... 3,050,000 2,650,000 2,400,000 2,500,000 2,650,000 2,700,000
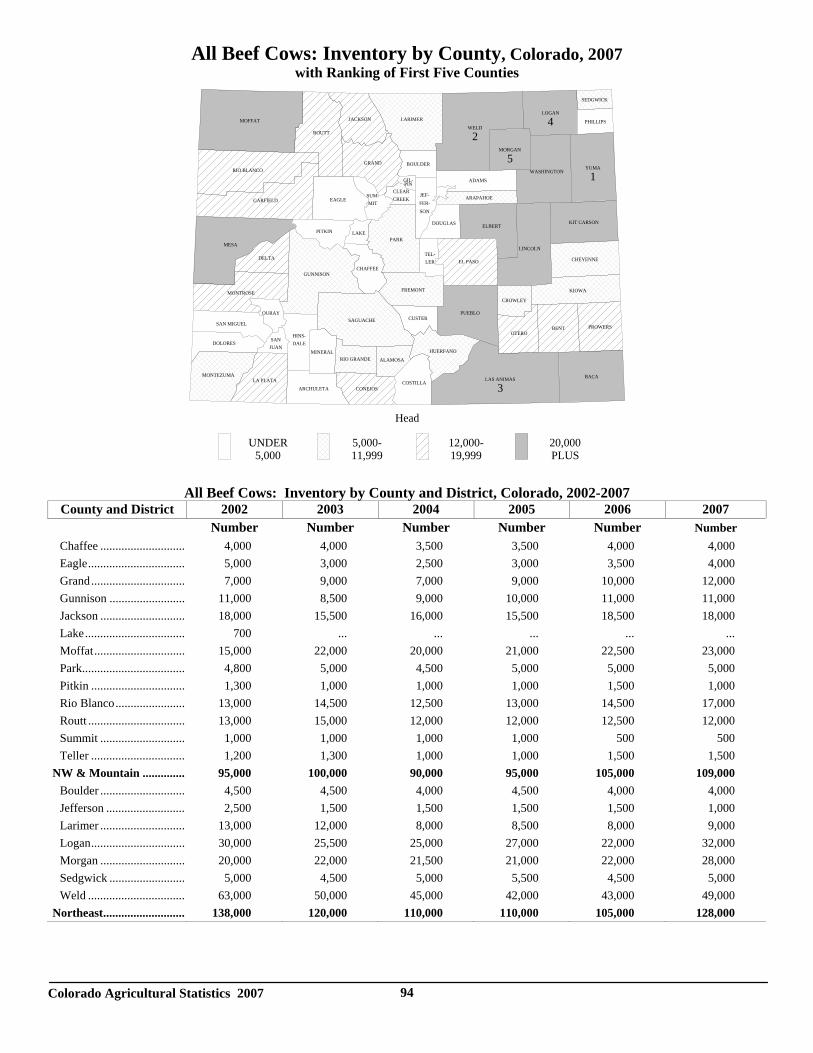
Colorado Agricultural Statistics 2007
94
All Beef Cows: Inventory by County, Colorado, 2007 with Ranking of First Five Counties
Head
UNDER5,000
5,000-11,999
12,000-19,999
20,000PLUS
ADAMS
ALAMOSA
ARAPAHOE
ARCHULETA
BACA
BENT
BOULDER
CHAFFEE
CHEYENNE
CLEARCREEK
CONEJOSCOSTILLA
CROWLEY
CUSTER
DELTA
DOLORES
DOUGLAS
EAGLE
ELBERT
EL PASO
FREMONT
GARFIELD
GIL-PIN
GRAND
GUNNISON
HINS-DALE
HUERFANO
JACKSON
JEF-FER-SON
KIOWA
KIT CARSON
LAKE
LA PLATA
LARIMER
LAS ANIMAS
3
LINCOLN
LOGAN
4
MESA
MINERAL
MOFFAT
MONTEZUMA
MONTROSE
MORGAN
5
OTERO
OURAY
PARK
PHILLIPS
PITKIN
PROWERS
PUEBLO
RIO BLANCO
RIO GRANDE
ROUTT
SAGUACHE
SANJUAN
SAN MIGUEL
SEDGWICK
SUM-MIT
TEL-LER
WASHINGTON
WELD
2
YUMA
1
All Beef Cows: Inventory by County and District, Colorado, 2002-2007 County and District 2002 2003 2004 2005 2006 2007
Number Number Number Number Number Number Chaffee ............................ 4,000 4,000 3,500 3,500 4,000 4,000 Eagle................................ 5,000 3,000 2,500 3,000 3,500 4,000 Grand............................... 7,000 9,000 7,000 9,000 10,000 12,000 Gunnison ......................... 11,000 8,500 9,000 10,000 11,000 11,000 Jackson ............................ 18,000 15,500 16,000 15,500 18,500 18,000 Lake................................. 700 ... ... ... ... ... Moffat.............................. 15,000 22,000 20,000 21,000 22,500 23,000 Park.................................. 4,800 5,000 4,500 5,000 5,000 5,000 Pitkin ............................... 1,300 1,000 1,000 1,000 1,500 1,000 Rio Blanco....................... 13,000 14,500 12,500 13,000 14,500 17,000 Routt ................................ 13,000 15,000 12,000 12,000 12,500 12,000 Summit ............................ 1,000 1,000 1,000 1,000 500 500 Teller ............................... 1,200 1,300 1,000 1,000 1,500 1,500
NW & Mountain .............. 95,000 100,000 90,000 95,000 105,000 109,000 Boulder ............................ 4,500 4,500 4,000 4,500 4,000 4,000 Jefferson .......................... 2,500 1,500 1,500 1,500 1,500 1,000 Larimer ............................ 13,000 12,000 8,000 8,500 8,000 9,000 Logan............................... 30,000 25,500 25,000 27,000 22,000 32,000 Morgan ............................ 20,000 22,000 21,500 21,000 22,000 28,000 Sedgwick ......................... 5,000 4,500 5,000 5,500 4,500 5,000 Weld ................................ 63,000 50,000 45,000 42,000 43,000 49,000
Northeast........................... 138,000 120,000 110,000 110,000 105,000 128,000
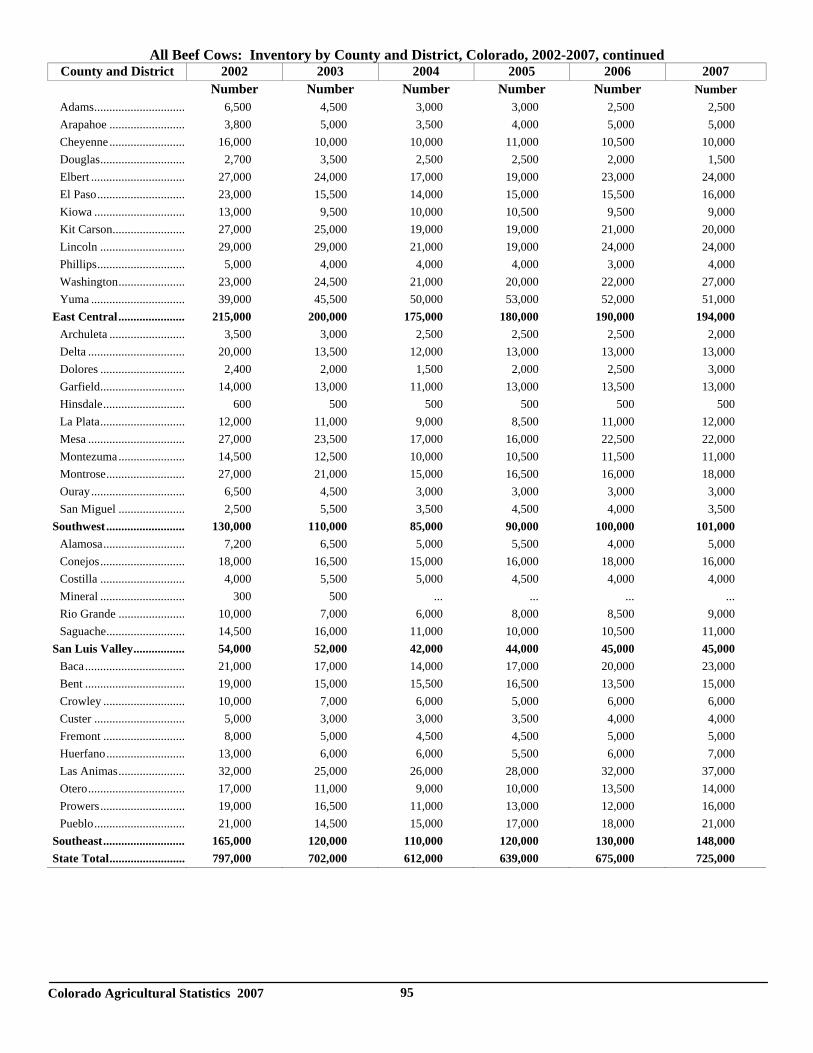
Colorado Agricultural Statistics 2007
95
All Beef Cows: Inventory by County and District, Colorado, 2002-2007, continued County and District 2002 2003 2004 2005 2006 2007
Number Number Number Number Number Number Adams.............................. 6,500 4,500 3,000 3,000 2,500 2,500 Arapahoe ......................... 3,800 5,000 3,500 4,000 5,000 5,000 Cheyenne......................... 16,000 10,000 10,000 11,000 10,500 10,000 Douglas............................ 2,700 3,500 2,500 2,500 2,000 1,500 Elbert ............................... 27,000 24,000 17,000 19,000 23,000 24,000 El Paso............................. 23,000 15,500 14,000 15,000 15,500 16,000 Kiowa .............................. 13,000 9,500 10,000 10,500 9,500 9,000 Kit Carson........................ 27,000 25,000 19,000 19,000 21,000 20,000 Lincoln ............................ 29,000 29,000 21,000 19,000 24,000 24,000 Phillips............................. 5,000 4,000 4,000 4,000 3,000 4,000 Washington...................... 23,000 24,500 21,000 20,000 22,000 27,000 Yuma ............................... 39,000 45,500 50,000 53,000 52,000 51,000
East Central...................... 215,000 200,000 175,000 180,000 190,000 194,000 Archuleta ......................... 3,500 3,000 2,500 2,500 2,500 2,000 Delta ................................ 20,000 13,500 12,000 13,000 13,000 13,000 Dolores ............................ 2,400 2,000 1,500 2,000 2,500 3,000 Garfield............................ 14,000 13,000 11,000 13,000 13,500 13,000 Hinsdale........................... 600 500 500 500 500 500 La Plata............................ 12,000 11,000 9,000 8,500 11,000 12,000 Mesa ................................ 27,000 23,500 17,000 16,000 22,500 22,000 Montezuma...................... 14,500 12,500 10,000 10,500 11,500 11,000 Montrose.......................... 27,000 21,000 15,000 16,500 16,000 18,000 Ouray............................... 6,500 4,500 3,000 3,000 3,000 3,000 San Miguel ...................... 2,500 5,500 3,500 4,500 4,000 3,500
Southwest.......................... 130,000 110,000 85,000 90,000 100,000 101,000 Alamosa........................... 7,200 6,500 5,000 5,500 4,000 5,000 Conejos............................ 18,000 16,500 15,000 16,000 18,000 16,000 Costilla ............................ 4,000 5,500 5,000 4,500 4,000 4,000 Mineral ............................ 300 500 ... ... ... ... Rio Grande ...................... 10,000 7,000 6,000 8,000 8,500 9,000 Saguache.......................... 14,500 16,000 11,000 10,000 10,500 11,000
San Luis Valley................. 54,000 52,000 42,000 44,000 45,000 45,000 Baca................................. 21,000 17,000 14,000 17,000 20,000 23,000 Bent ................................. 19,000 15,000 15,500 16,500 13,500 15,000 Crowley ........................... 10,000 7,000 6,000 5,000 6,000 6,000 Custer .............................. 5,000 3,000 3,000 3,500 4,000 4,000 Fremont ........................... 8,000 5,000 4,500 4,500 5,000 5,000 Huerfano.......................... 13,000 6,000 6,000 5,500 6,000 7,000 Las Animas...................... 32,000 25,000 26,000 28,000 32,000 37,000 Otero................................ 17,000 11,000 9,000 10,000 13,500 14,000 Prowers............................ 19,000 16,500 11,000 13,000 12,000 16,000 Pueblo.............................. 21,000 14,500 15,000 17,000 18,000 21,000
Southeast........................... 165,000 120,000 110,000 120,000 130,000 148,000 State Total......................... 797,000 702,000 612,000 639,000 675,000 725,000
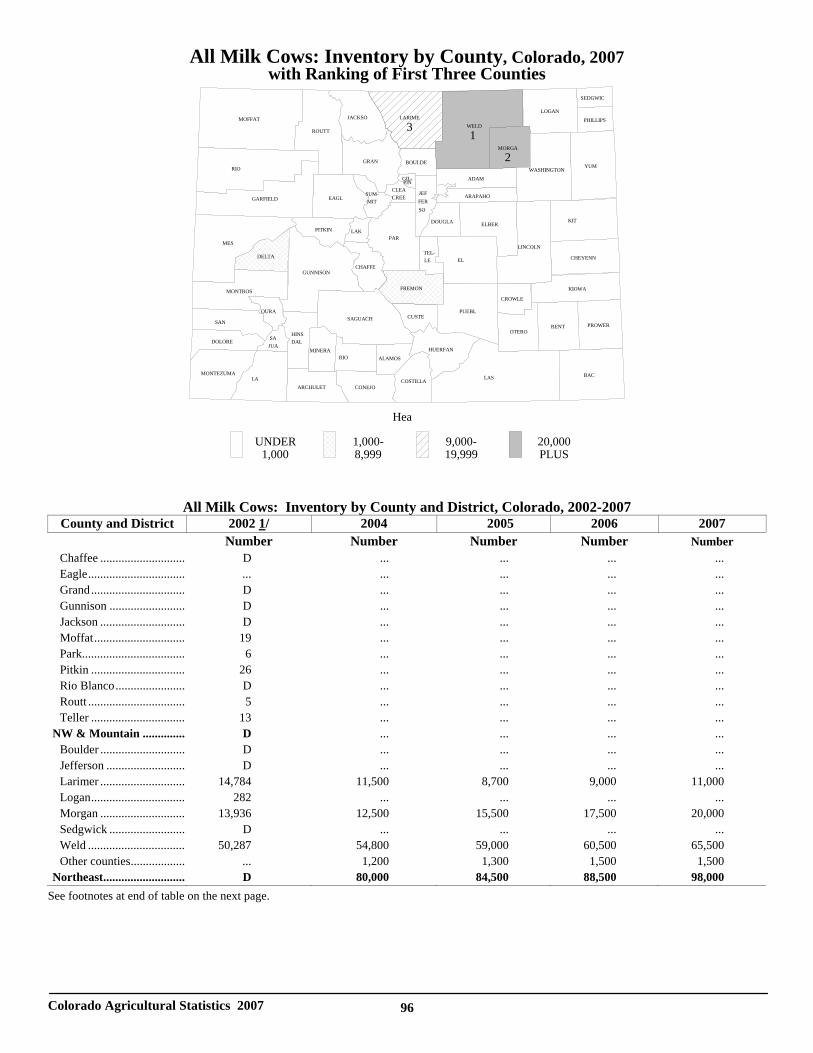
Colorado Agricultural Statistics 2007 96
All Milk Cows: Inventory by County, Colorado, 2007 with Ranking of First Three Counties
All Milk Cows: Inventory by County and District, Colorado, 2002-2007 County and District 2002 1/ 2004 2005 2006 2007
Number Number Number Number Number Chaffee ............................ D ... ... ... ... Eagle................................ ... ... ... ... ... Grand............................... D ... ... ... ... Gunnison ......................... D ... ... ... ... Jackson ............................ D ... ... ... ... Moffat.............................. 19 ... ... ... ... Park.................................. 6 ... ... ... ... Pitkin ............................... 26 ... ... ... ... Rio Blanco....................... D ... ... ... ... Routt ................................ 5 ... ... ... ... Teller ............................... 13 ... ... ... ...
NW & Mountain .............. D ... ... ... ... Boulder ............................ D ... ... ... ... Jefferson .......................... D ... ... ... ... Larimer ............................ 14,784 11,500 8,700 9,000 11,000 Logan............................... 282 ... ... ... ... Morgan ............................ 13,936 12,500 15,500 17,500 20,000 Sedgwick ......................... D ... ... ... ... Weld ................................ 50,287 54,800 59,000 60,500 65,500 Other counties.................. ... 1,200 1,300 1,500 1,500
Northeast........................... D 80,000 84,500 88,500 98,000 See footnotes at end of table on the next page.
Hea
UNDER 1,000
1,000-8,999
9,000-19,999
20,000 PLUS
ADAM
ALAMOS
ARAPAHO
ARCHULET
BAC
BENT
BOULDE
CHAFFE
CHEYENN
CLEACREE
CONEJOCOSTILLA
CROWLE
CUSTE
DELTA
DOLORE
DOUGLA
EAGL
ELBER
EL
FREMON
GARFIELD GIL-PIN
GRAN
GUNNISON
HINSDAL
HUERFAN
JACKSO
JEFFERSO
KIOWA
KIT
LAK
LA
LARIME
3
LAS
LINCOLN
LOGAN
MES
MINERA
MOFFAT
MONTEZUMA
MONTROS
MORGA
2
OTERO
OURA
PAR
PHILLIPS
PITKIN
PROWER
PUEBL
RIO
RIO
ROUTT
SAGUACH
SAJUA
SAN
SEDGWIC
SUM-MIT
TEL-LE
WASHINGTON
WELD
1
YUM
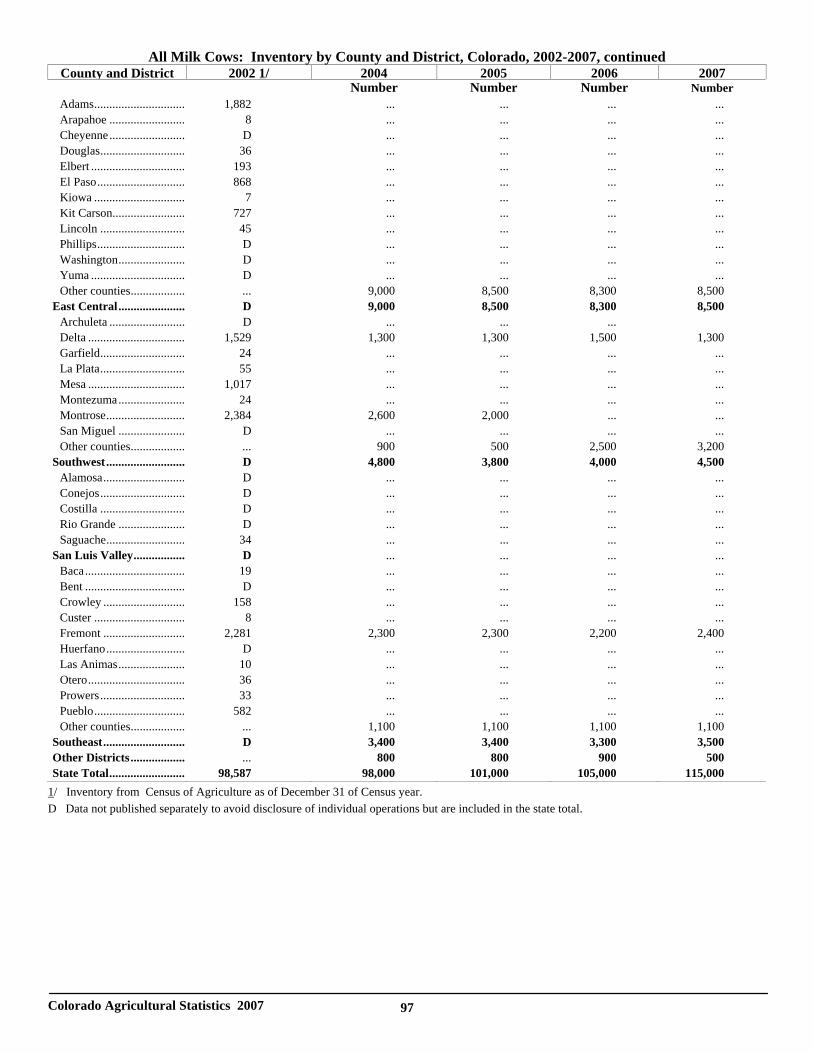
Colorado Agricultural Statistics 2007 97
All Milk Cows: Inventory by County and District, Colorado, 2002-2007, continued County and District 2002 1/ 2004 2005 2006 2007
Number Number Number Number Adams.............................. 1,882 ... ... ... ... Arapahoe ......................... 8 ... ... ... ... Cheyenne......................... D ... ... ... ... Douglas............................ 36 ... ... ... ... Elbert ............................... 193 ... ... ... ... El Paso............................. 868 ... ... ... ... Kiowa .............................. 7 ... ... ... ... Kit Carson........................ 727 ... ... ... ... Lincoln ............................ 45 ... ... ... ... Phillips............................. D ... ... ... ... Washington...................... D ... ... ... ... Yuma ............................... D ... ... ... ... Other counties.................. ... 9,000 8,500 8,300 8,500
East Central...................... D 9,000 8,500 8,300 8,500 Archuleta ......................... D ... ... ... Delta ................................ 1,529 1,300 1,300 1,500 1,300 Garfield............................ 24 ... ... ... ... La Plata............................ 55 ... ... ... ... Mesa ................................ 1,017 ... ... ... ... Montezuma...................... 24 ... ... ... ... Montrose.......................... 2,384 2,600 2,000 ... ... San Miguel ...................... D ... ... ... ... Other counties.................. ... 900 500 2,500 3,200
Southwest.......................... D 4,800 3,800 4,000 4,500 Alamosa........................... D ... ... ... ... Conejos............................ D ... ... ... ... Costilla ............................ D ... ... ... ... Rio Grande ...................... D ... ... ... ... Saguache.......................... 34 ... ... ... ...
San Luis Valley................. D ... ... ... ... Baca................................. 19 ... ... ... ... Bent ................................. D ... ... ... ... Crowley ........................... 158 ... ... ... ... Custer .............................. 8 ... ... ... ... Fremont ........................... 2,281 2,300 2,300 2,200 2,400 Huerfano.......................... D ... ... ... ... Las Animas...................... 10 ... ... ... ... Otero................................ 36 ... ... ... ... Prowers............................ 33 ... ... ... ... Pueblo.............................. 582 ... ... ... ... Other counties.................. ... 1,100 1,100 1,100 1,100
Southeast........................... D 3,400 3,400 3,300 3,500 Other Districts.................. ... 800 800 900 500 State Total......................... 98,587 98,000 101,000 105,000 115,000
1/ Inventory from Census of Agriculture as of December 31 of Census year. D Data not published separately to avoid disclosure of individual operations but are included in the state total.
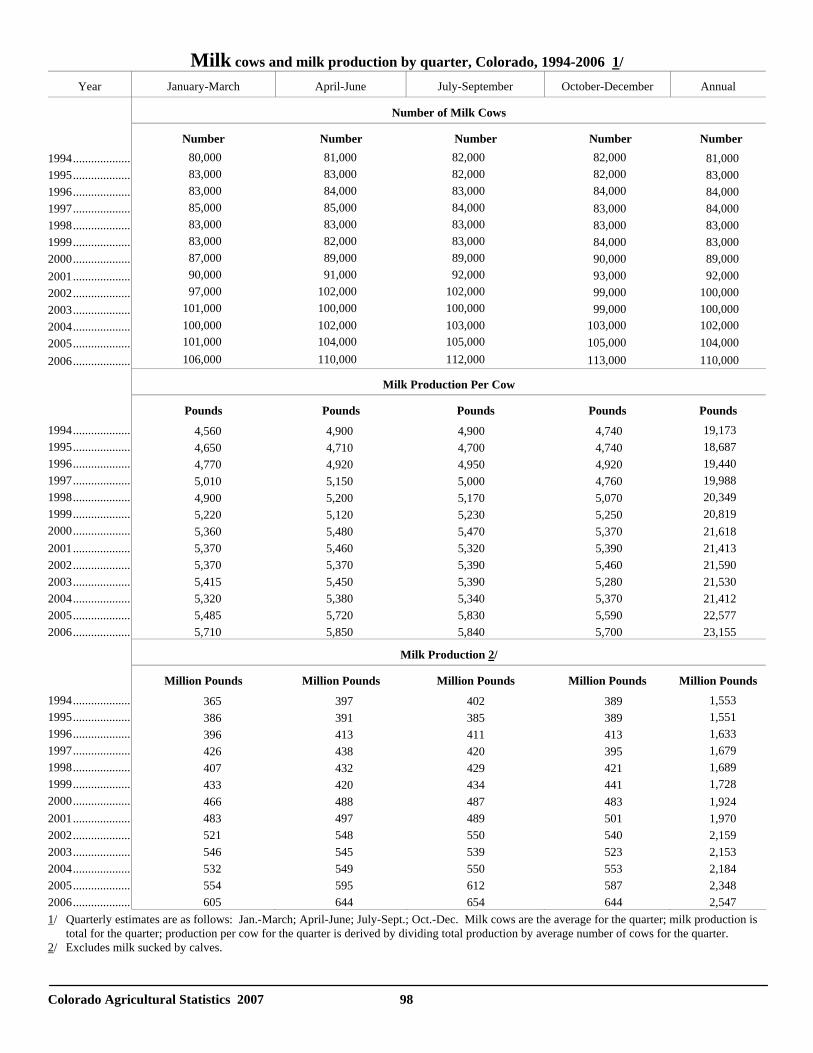
Colorado Agricultural Statistics 2007 98
Milk cows and milk production by quarter, Colorado, 1994-2006 1/ Year January-March April-June July-September October-December Annual
Number of Milk Cows
Number Number Number Number Number 1994................... 80,000 81,000 82,000 82,000 81,000 1995................... 83,000 83,000 82,000 82,000 83,000 1996................... 83,000 84,000 83,000 84,000 84,000 1997................... 85,000 85,000 84,000 83,000 84,000 1998................... 83,000 83,000 83,000 83,000 83,000 1999................... 83,000 82,000 83,000 84,000 83,000 2000................... 87,000 89,000 89,000 90,000 89,000 2001................... 90,000 91,000 92,000 93,000 92,000 2002................... 97,000 102,000 102,000 99,000 100,000 2003................... 101,000 100,000 100,000 99,000 100,000 2004................... 100,000 102,000 103,000 103,000 102,000 2005................... 101,000 104,000 105,000 105,000 104,000 2006................... 106,000 110,000 112,000 113,000 110,000
Milk Production Per Cow
Pounds Pounds Pounds Pounds Pounds 1994................... 4,560 4,900 4,900 4,740 19,173 1995................... 4,650 4,710 4,700 4,740 18,687 1996................... 4,770 4,920 4,950 4,920 19,440 1997................... 5,010 5,150 5,000 4,760 19,988 1998................... 4,900 5,200 5,170 5,070 20,349 1999................... 5,220 5,120 5,230 5,250 20,819 2000................... 5,360 5,480 5,470 5,370 21,618 2001................... 5,370 5,460 5,320 5,390 21,413 2002................... 5,370 5,370 5,390 5,460 21,590 2003................... 5,415 5,450 5,390 5,280 21,530 2004................... 5,320 5,380 5,340 5,370 21,412 2005................... 5,485 5,720 5,830 5,590 22,577 2006................... 5,710 5,850 5,840 5,700 23,155
Milk Production 2/
Million Pounds Million Pounds Million Pounds Million Pounds Million Pounds 1994................... 365 397 402 389 1,553 1995................... 386 391 385 389 1,551 1996................... 396 413 411 413 1,633 1997................... 426 438 420 395 1,679 1998................... 407 432 429 421 1,689 1999................... 433 420 434 441 1,728 2000................... 466 488 487 483 1,924 2001................... 483 497 489 501 1,970 2002................... 521 548 550 540 2,159 2003................... 546 545 539 523 2,153 2004................... 532 549 550 553 2,184 2005................... 554 595 612 587 2,348 2006................... 605 644 654 644 2,547 1/ Quarterly estimates are as follows: Jan.-March; April-June; July-Sept.; Oct.-Dec. Milk cows are the average for the quarter; milk production is
total for the quarter; production per cow for the quarter is derived by dividing total production by average number of cows for the quarter. 2/ Excludes milk sucked by calves.
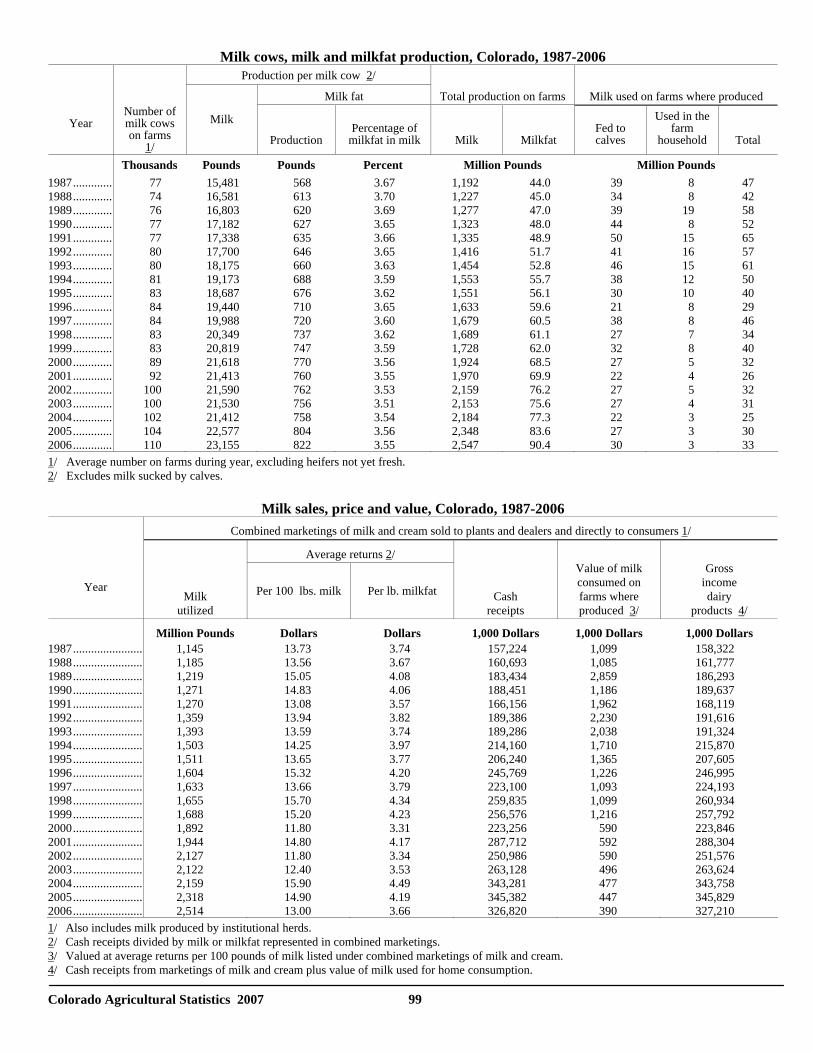
Colorado Agricultural Statistics 2007 99
Milk cows, milk and milkfat production, Colorado, 1987-2006 Production per milk cow 2/
Milk fat Total production on farms Milk used on farms where produced
Year
Number of milk cows on farms
1/
Milk
Production
Percentage of
milkfat in milk
Milk
Milkfat
Fed to calves
Used in the farm
household
Total
Thousands Pounds Pounds Percent Million Pounds Million Pounds 1987............. 77 15,481 568 3.67 1,192 44.0 39 8 47 1988............. 74 16,581 613 3.70 1,227 45.0 34 8 42 1989............. 76 16,803 620 3.69 1,277 47.0 39 19 58 1990............. 77 17,182 627 3.65 1,323 48.0 44 8 52 1991............. 77 17,338 635 3.66 1,335 48.9 50 15 65 1992............. 80 17,700 646 3.65 1,416 51.7 41 16 57 1993............. 80 18,175 660 3.63 1,454 52.8 46 15 61 1994............. 81 19,173 688 3.59 1,553 55.7 38 12 50 1995............. 83 18,687 676 3.62 1,551 56.1 30 10 40 1996............. 84 19,440 710 3.65 1,633 59.6 21 8 29 1997............. 84 19,988 720 3.60 1,679 60.5 38 8 46 1998............. 83 20,349 737 3.62 1,689 61.1 27 7 34 1999............. 83 20,819 747 3.59 1,728 62.0 32 8 40 2000............. 89 21,618 770 3.56 1,924 68.5 27 5 32 2001............. 92 21,413 760 3.55 1,970 69.9 22 4 26 2002............. 100 21,590 762 3.53 2,159 76.2 27 5 32 2003............. 100 21,530 756 3.51 2,153 75.6 27 4 31 2004............. 102 21,412 758 3.54 2,184 77.3 22 3 25 2005............. 104 22,577 804 3.56 2,348 83.6 27 3 302006............. 110 23,155 822 3.55 2,547 90.4 30 3 33 1/ Average number on farms during year, excluding heifers not yet fresh. 2/ Excludes milk sucked by calves.
Milk sales, price and value, Colorado, 1987-2006 Combined marketings of milk and cream sold to plants and dealers and directly to consumers 1/
Average returns 2/
Year
Milk utilized
Per 100 lbs. milk
Per lb. milkfat
Cash receipts
Value of milk consumed on farms where produced 3/
Gross
income dairy
products 4/
Million Pounds Dollars Dollars 1,000 Dollars 1,000 Dollars 1,000 Dollars 1987....................... 1,145 13.73 3.74 157,224 1,099 158,322 1988....................... 1,185 13.56 3.67 160,693 1,085 161,777 1989....................... 1,219 15.05 4.08 183,434 2,859 186,293 1990....................... 1,271 14.83 4.06 188,451 1,186 189,637 1991....................... 1,270 13.08 3.57 166,156 1,962 168,119 1992....................... 1,359 13.94 3.82 189,386 2,230 191,616 1993....................... 1,393 13.59 3.74 189,286 2,038 191,324 1994....................... 1,503 14.25 3.97 214,160 1,710 215,870 1995....................... 1,511 13.65 3.77 206,240 1,365 207,605 1996....................... 1,604 15.32 4.20 245,769 1,226 246,995 1997....................... 1,633 13.66 3.79 223,100 1,093 224,193 1998....................... 1,655 15.70 4.34 259,835 1,099 260,934 1999....................... 1,688 15.20 4.23 256,576 1,216 257,792 2000....................... 1,892 11.80 3.31 223,256 590 223,846 2001....................... 1,944 14.80 4.17 287,712 592 288,304 2002....................... 2,127 11.80 3.34 250,986 590 251,576 2003....................... 2,122 12.40 3.53 263,128 496 263,624 2004....................... 2,159 15.90 4.49 343,281 477 343,758 2005....................... 2,318 14.90 4.19 345,382 447 345,8292006....................... 2,514 13.00 3.66 326,820 390 327,210 1/ Also includes milk produced by institutional herds. 2/ Cash receipts divided by milk or milkfat represented in combined marketings. 3/ Valued at average returns per 100 pounds of milk listed under combined marketings of milk and cream. 4/ Cash receipts from marketings of milk and cream plus value of milk used for home consumption.
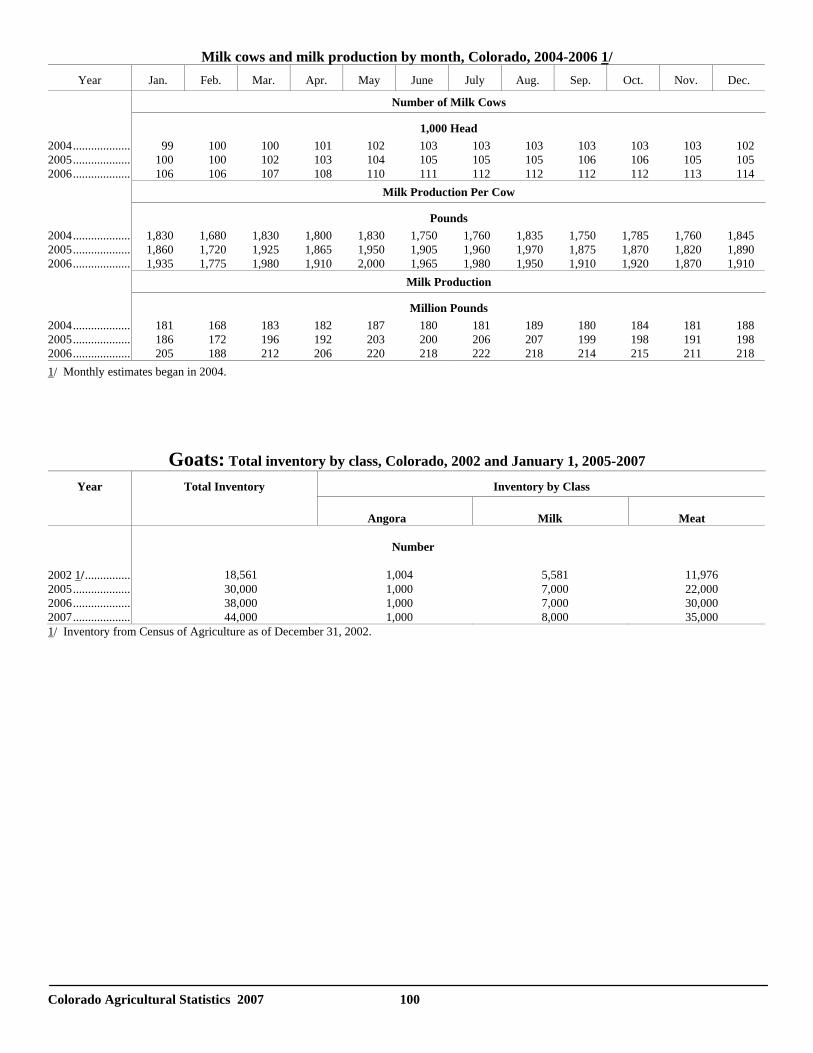
Colorado Agricultural Statistics 2007 100
Milk cows and milk production by month, Colorado, 2004-2006 1/ Year Jan. Feb. Mar. Apr. May June July Aug. Sep. Oct. Nov. Dec.
Number of Milk Cows
1,000 Head 2004................... 99 100 100 101 102 103 103 103 103 103 103 102 2005................... 100 100 102 103 104 105 105 105 106 106 105 105 2006................... 106 106 107 108 110 111 112 112 112 112 113 114
Milk Production Per Cow
Pounds 2004................... 1,830 1,680 1,830 1,800 1,830 1,750 1,760 1,835 1,750 1,785 1,760 1,845 2005................... 1,860 1,720 1,925 1,865 1,950 1,905 1,960 1,970 1,875 1,870 1,820 1,890 2006................... 1,935 1,775 1,980 1,910 2,000 1,965 1,980 1,950 1,910 1,920 1,870 1,910
Milk Production
Million Pounds 2004................... 181 168 183 182 187 180 181 189 180 184 181 188 2005................... 186 172 196 192 203 200 206 207 199 198 191 198 2006................... 205 188 212 206 220 218 222 218 214 215 211 218 1/ Monthly estimates began in 2004.
Goats: Total inventory by class, Colorado, 2002 and January 1, 2005-2007
Year Total Inventory Inventory by Class
Angora
Milk
Meat
Number 2002 1/............... 18,561 1,004 5,581 11,976 2005................... 30,000 1,000 7,000 22,000 2006................... 38,000 1,000 7,000 30,000 2007................... 44,000 1,000 8,000 35,000 1/ Inventory from Census of Agriculture as of December 31, 2002.
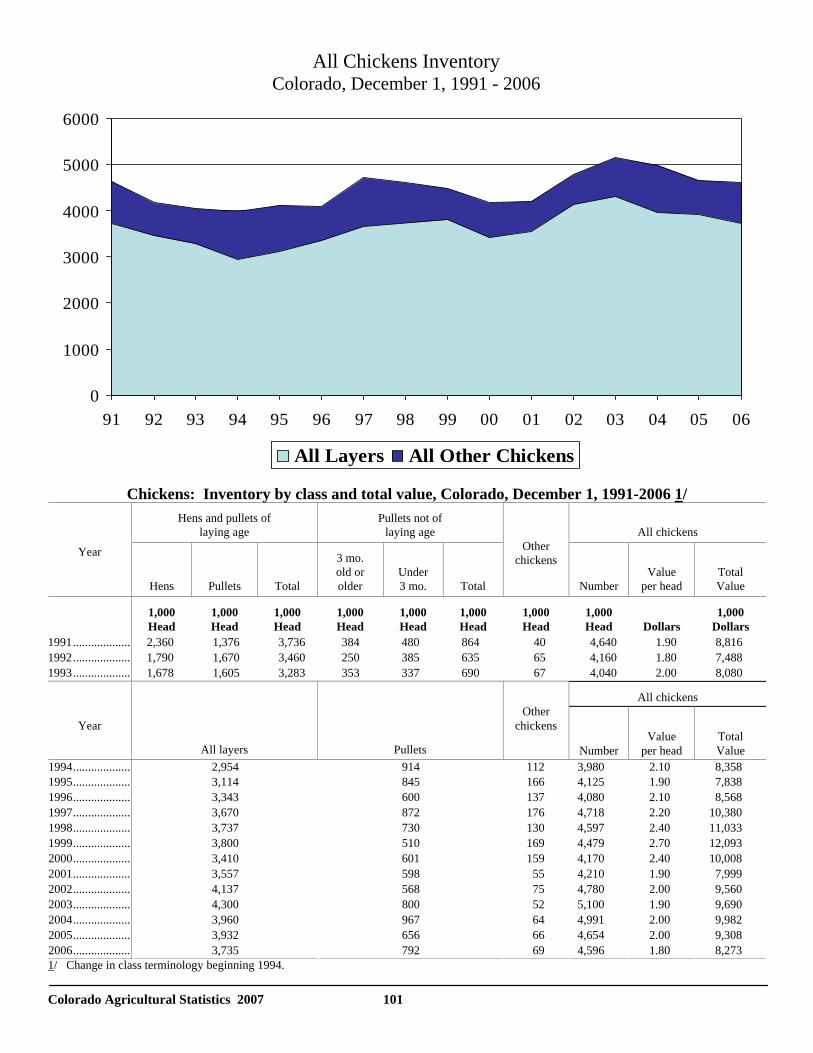
Colorado Agricultural Statistics 2007 101
Chickens: Inventory by class and total value, Colorado, December 1, 1991-2006 1/
Hens and pullets of laying age
Pullets not of laying age
All chickens
Year
Hens
Pullets
Total
3 mo. old or older
Under 3 mo.
Total
Other chickens
Number
Value
per head
Total Value
1,000 Head
1,000 Head
1,000 Head
1,000 Head
1,000 Head
1,000 Head
1,000 Head
1,000 Head
Dollars
1,000 Dollars
1991................... 2,360 1,376 3,736 384 480 864 40 4,640 1.90 8,816 1992................... 1,790 1,670 3,460 250 385 635 65 4,160 1.80 7,488 1993................... 1,678 1,605 3,283 353 337 690 67 4,040 2.00 8,080
All chickens
Year
All layers
Pullets
Other
chickens
Number
Value
per head
Total Value
1994................... 2,954 914 112 3,980 2.10 8,358 1995................... 3,114 845 166 4,125 1.90 7,838 1996................... 3,343 600 137 4,080 2.10 8,568 1997................... 3,670 872 176 4,718 2.20 10,380 1998................... 3,737 730 130 4,597 2.40 11,033 1999................... 3,800 510 169 4,479 2.70 12,093 2000................... 3,410 601 159 4,170 2.40 10,008 2001................... 3,557 598 55 4,210 1.90 7,999 2002................... 4,137 568 75 4,780 2.00 9,560 2003................... 4,300 800 52 5,100 1.90 9,690 2004................... 3,960 967 64 4,991 2.00 9,982 2005................... 3,932 656 66 4,654 2.00 9,308 2006................... 3,735
792 69 4,596 1.80 8,273 1/ Change in class terminology beginning 1994.
All Chickens InventoryColorado, December 1, 1991 - 2006
0
1000
2000
3000
4000
5000
6000
91 92 93 94 95 96 97 98 99 00 01 02 03 04 05 06
All Layers All Other Chickens
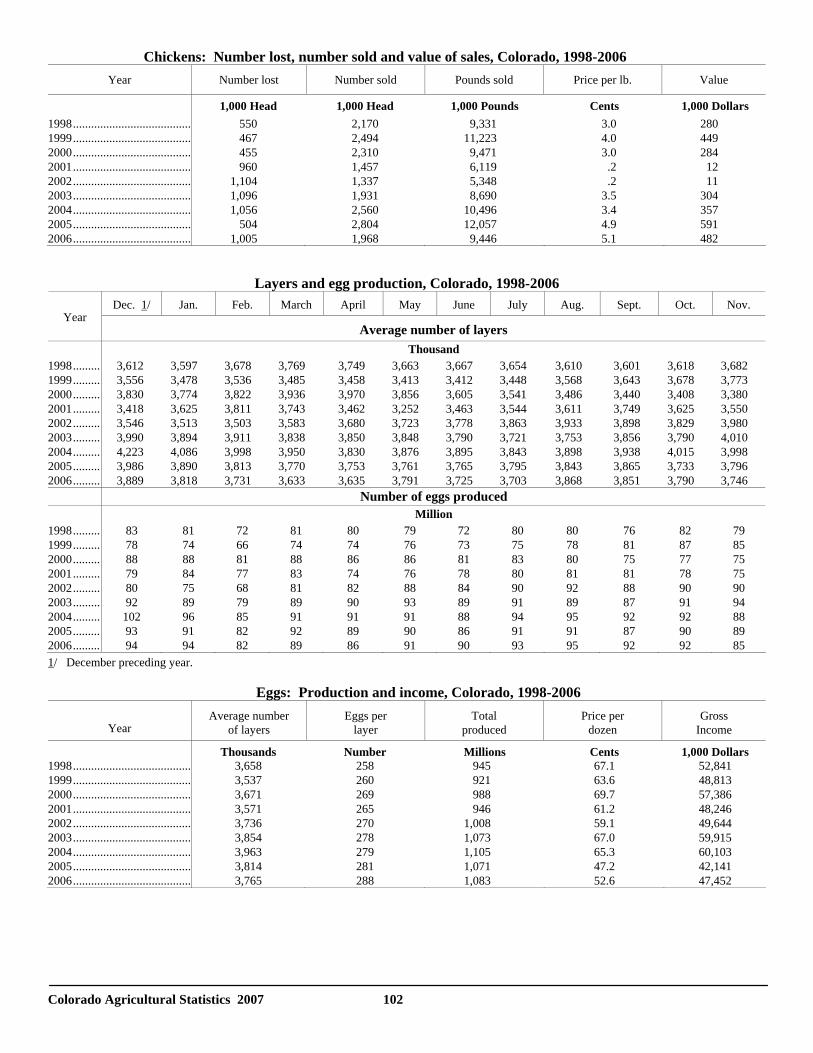
Colorado Agricultural Statistics 2007 102
Chickens: Number lost, number sold and value of sales, Colorado, 1998-2006 Year Number lost Number sold Pounds sold Price per lb. Value
1,000 Head 1,000 Head 1,000 Pounds Cents 1,000 Dollars 1998....................................... 550 2,170 9,331 3.0 280 1999....................................... 467 2,494 11,223 4.0 449 2000....................................... 455 2,310 9,471 3.0 284 2001....................................... 960 1,457 6,119 .2 12 2002....................................... 1,104 1,337 5,348 .2 11 2003....................................... 1,096 1,931 8,690 3.5 304 2004....................................... 1,056 2,560 10,496 3.4 357 2005....................................... 504 2,804 12,057 4.9 591 2006....................................... 1,005 1,968 9,446 5.1 482
Layers and egg production, Colorado, 1998-2006 Dec. 1/ Jan. Feb. March April May June July Aug. Sept. Oct. Nov.
Year Average number of layers
Thousand 1998......... 3,612 3,597 3,678 3,769 3,749 3,663 3,667 3,654 3,610 3,601 3,618 3,682 1999......... 3,556 3,478 3,536 3,485 3,458 3,413 3,412 3,448 3,568 3,643 3,678 3,773 2000......... 3,830 3,774 3,822 3,936 3,970 3,856 3,605 3,541 3,486 3,440 3,408 3,380 2001......... 3,418 3,625 3,811 3,743 3,462 3,252 3,463 3,544 3,611 3,749 3,625 3,550 2002......... 3,546 3,513 3,503 3,583 3,680 3,723 3,778 3,863 3,933 3,898 3,829 3,980 2003......... 3,990 3,894 3,911 3,838 3,850 3,848 3,790 3,721 3,753 3,856 3,790 4,010 2004......... 4,223 4,086 3,998 3,950 3,830 3,876 3,895 3,843 3,898 3,938 4,015 3,998 2005......... 3,986 3,890 3,813 3,770 3,753 3,761 3,765 3,795 3,843 3,865 3,733 3,7962006......... 3,889 3,818 3,731 3,633 3,635 3,791 3,725 3,703 3,868 3,851 3,790 3,746 Number of eggs produced Million 1998......... 83 81 72 81 80 79 72 80 80 76 82 79 1999......... 78 74 66 74 74 76 73 75 78 81 87 85 2000......... 88 88 81 88 86 86 81 83 80 75 77 75 2001......... 79 84 77 83 74 76 78 80 81 81 78 75 2002......... 80 75 68 81 82 88 84 90 92 88 90 90 2003......... 92 89 79 89 90 93 89 91 89 87 91 94 2004......... 102 96 85 91 91 91 88 94 95 92 92 88 2005......... 93 91 82 92 89 90 86 91 91 87 90 892006......... 94 94 82 89 86 91 90 93 95 92 92 85 1/ December preceding year. Eggs: Production and income, Colorado, 1998-2006
Year
Average number of layers
Eggs per layer
Total produced
Price per dozen
Gross Income
Thousands Number Millions Cents 1,000 Dollars 1998....................................... 3,658 258 945 67.1 52,841 1999....................................... 3,537 260 921 63.6 48,813 2000....................................... 3,671 269 988 69.7 57,386 2001....................................... 3,571 265 946 61.2 48,246 2002....................................... 3,736 270 1,008 59.1 49,644 2003....................................... 3,854 278 1,073 67.0 59,915 2004....................................... 3,963 279 1,105 65.3 60,103 2005....................................... 3,814 281 1,071 47.2 42,141 2006....................................... 3,765 288 1,083 52.6 47,452
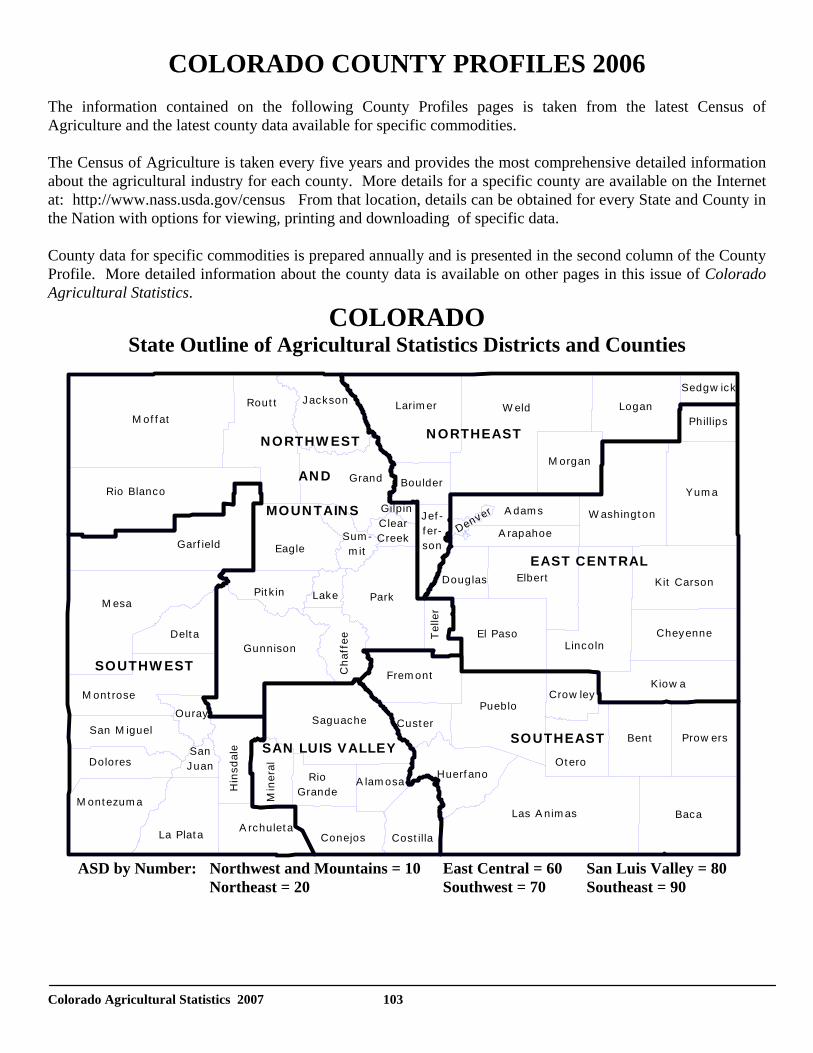
Colorado Agricultural Statistics 2007 103
COLORADO COUNTY PROFILES 2006 The information contained on the following County Profiles pages is taken from the latest Census of Agriculture and the latest county data available for specific commodities. The Census of Agriculture is taken every five years and provides the most comprehensive detailed information about the agricultural industry for each county. More details for a specific county are available on the Internet at: http://www.nass.usda.gov/census From that location, details can be obtained for every State and County in the Nation with options for viewing, printing and downloading of specific data. County data for specific commodities is prepared annually and is presented in the second column of the County Profile. More detailed information about the county data is available on other pages in this issue of Colorado Agricultural Statistics.
COLORADO State Outline of Agricultural Statistics Districts and Counties
ASD by Number: Northwest and Mountains = 10 East Central = 60 San Luis Valley = 80 Northeast = 20 Southwest = 70 Southeast = 90
EAST CEN TRAL
N ORTHW EST
AN D
MOUN TAIN S
SOUTHW EST
N ORTHEAST
SOUTHEASTSAN LUIS VALLEY
ClearCreek
GilpinJef -f er-son
Boulder
Denver
Douglas
Grand
Kit Carson
Sum -m it
Las A nim as
Min
eral
RioGrandeH
insd
ale
A lam osa
Conejos Cost illa
Rout t Jackson
EagleGarf ield
Rio Blanco
Tel
ler
Pueblo
Cha
ffee
Lake
Ouray
SanJuan
San M iguel
A rapahoe
A dam s W ashingt on
Elbert
W eldLarim er
Kiow a
Lincoln
Otero
M ont rose
Delt a
Dolores
M ontezum a
La Plat a
M esa
A rchuletaBaca
Bent
Cheyenne
Crow ley
Cust er
El Paso
Frem ont
Gunnison
Huerf ano
LoganM of f at
M organ
Park
Phillips
Pit k in
Prow ersSaguache
Sedgw ick
Yum a
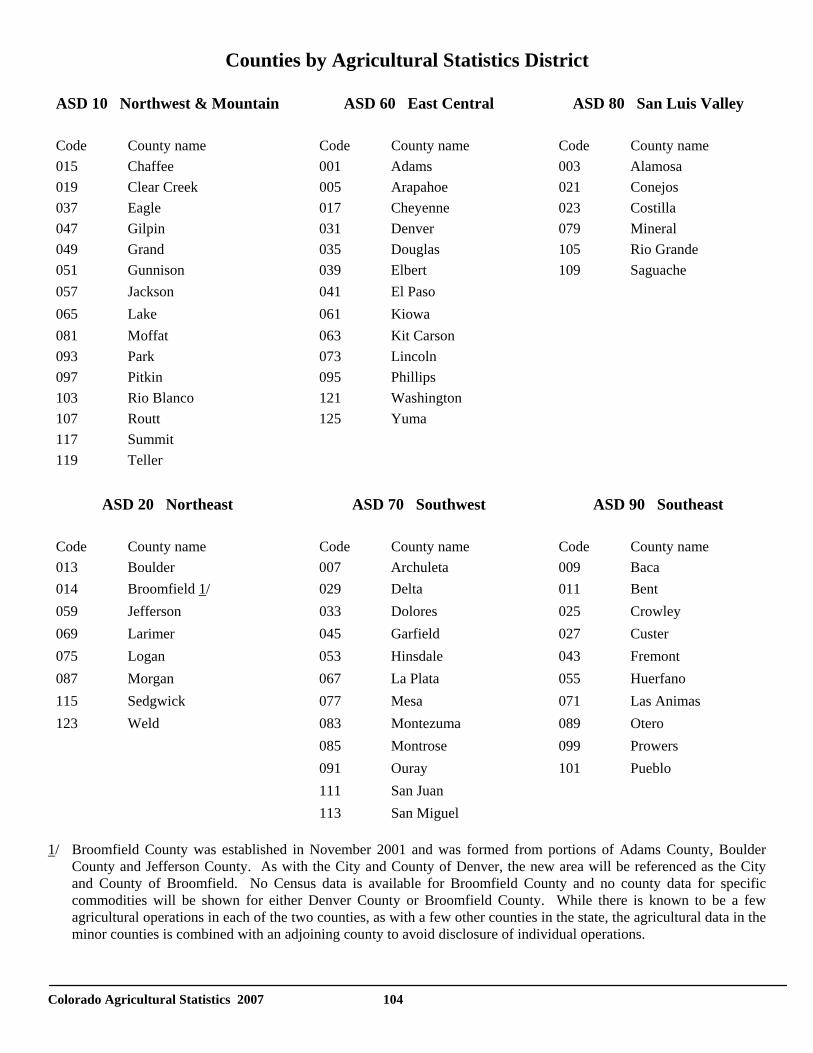
Colorado Agricultural Statistics 2007 104
Counties by Agricultural Statistics District ASD 10 Northwest & Mountain ASD 60 East Central ASD 80 San Luis Valley
Code County name Code County name Code County name 015 Chaffee 001 Adams 003 Alamosa 019 Clear Creek 005 Arapahoe 021 Conejos 037 Eagle 017 Cheyenne 023 Costilla 047 Gilpin 031 Denver 079 Mineral 049 Grand 035 Douglas 105 Rio Grande 051 Gunnison 039 Elbert 109 Saguache 057 Jackson 041 El Paso 065 Lake 061 Kiowa 081 Moffat 063 Kit Carson 093 Park 073 Lincoln 097 Pitkin 095 Phillips 103 Rio Blanco 121 Washington 107 Routt 125 Yuma 117 Summit 119 Teller
ASD 20 Northeast ASD 70 Southwest ASD 90 Southeast
Code County name Code County name Code County name 013 Boulder 007 Archuleta 009 Baca 014 Broomfield 1/ 029 Delta 011 Bent 059 Jefferson 033 Dolores 025 Crowley 069 Larimer 045 Garfield 027 Custer 075 Logan 053 Hinsdale 043 Fremont 087 Morgan 067 La Plata 055 Huerfano 115 Sedgwick 077 Mesa 071 Las Animas 123 Weld 083 Montezuma 089 Otero 085 Montrose 099 Prowers 091 Ouray 101 Pueblo 111 San Juan 113 San Miguel
1/ Broomfield County was established in November 2001 and was formed from portions of Adams County, Boulder
County and Jefferson County. As with the City and County of Denver, the new area will be referenced as the City and County of Broomfield. No Census data is available for Broomfield County and no county data for specific commodities will be shown for either Denver County or Broomfield County. While there is known to be a few agricultural operations in each of the two counties, as with a few other counties in the state, the agricultural data in the minor counties is combined with an adjoining county to avoid disclosure of individual operations.
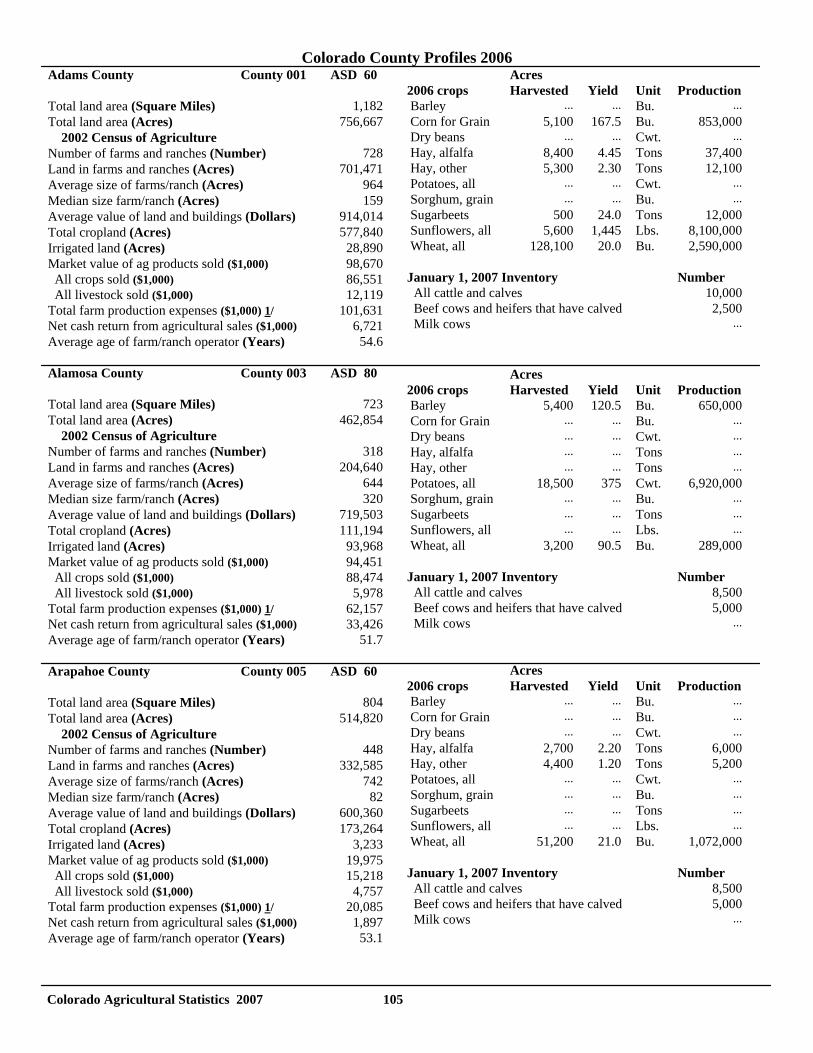
Colorado Agricultural Statistics 2007 105
Colorado County Profiles 2006 Adams County County 001 ASD 60 Total land area (Square Miles) 1,182 Total land area (Acres) 756,667 2002 Census of Agriculture Number of farms and ranches (Number) 728 Land in farms and ranches (Acres) 701,471 Average size of farms/ranch (Acres) 964 Median size farm/ranch (Acres) 159 Average value of land and buildings (Dollars) 914,014 Total cropland (Acres) 577,840 Irrigated land (Acres) 28,890 Market value of ag products sold ($1,000) 98,670 All crops sold ($1,000) 86,551 All livestock sold ($1,000) 12,119 Total farm production expenses ($1,000) 1/ 101,631 Net cash return from agricultural sales ($1,000) 6,721 Average age of farm/ranch operator (Years) 54.6 Alamosa County County 003 ASD 80 Total land area (Square Miles) 723 Total land area (Acres) 462,854 2002 Census of Agriculture Number of farms and ranches (Number) 318 Land in farms and ranches (Acres) 204,640 Average size of farms/ranch (Acres) 644 Median size farm/ranch (Acres) 320 Average value of land and buildings (Dollars) 719,503 Total cropland (Acres) 111,194 Irrigated land (Acres) 93,968 Market value of ag products sold ($1,000) 94,451 All crops sold ($1,000) 88,474 All livestock sold ($1,000) 5,978 Total farm production expenses ($1,000) 1/ 62,157 Net cash return from agricultural sales ($1,000) 33,426 Average age of farm/ranch operator (Years) 51.7 Arapahoe County County 005 ASD 60 Total land area (Square Miles) 804 Total land area (Acres) 514,820 2002 Census of Agriculture Number of farms and ranches (Number) 448 Land in farms and ranches (Acres) 332,585 Average size of farms/ranch (Acres) 742 Median size farm/ranch (Acres) 82 Average value of land and buildings (Dollars) 600,360 Total cropland (Acres) 173,264 Irrigated land (Acres) 3,233 Market value of ag products sold ($1,000) 19,975 All crops sold ($1,000) 15,218 All livestock sold ($1,000) 4,757 Total farm production expenses ($1,000) 1/ 20,085 Net cash return from agricultural sales ($1,000) 1,897 Average age of farm/ranch operator (Years) 53.1
Acres 2006 crops Harvested Yield Unit Production Barley ... ... Bu. ... Corn for Grain 5,100 167.5 Bu. 853,000 Dry beans ... ... Cwt. ... Hay, alfalfa 8,400 4.45 Tons 37,400 Hay, other 5,300 2.30 Tons 12,100 Potatoes, all ... ... Cwt. ... Sorghum, grain ... ... Bu. ... Sugarbeets 500 24.0 Tons 12,000 Sunflowers, all 5,600 1,445 Lbs. 8,100,000 Wheat, all 128,100 20.0 Bu. 2,590,000 January 1, 2007 Inventory Number All cattle and calves 10,000 Beef cows and heifers that have calved 2,500 Milk cows ... Acres 2006 crops Harvested Yield Unit Production Barley 5,400 120.5 Bu. 650,000 Corn for Grain ... ... Bu. ... Dry beans ... ... Cwt. ... Hay, alfalfa ... ... Tons ... Hay, other ... ... Tons ... Potatoes, all 18,500 375 Cwt. 6,920,000 Sorghum, grain ... ... Bu. ... Sugarbeets ... ... Tons ... Sunflowers, all ... ... Lbs. ... Wheat, all 3,200 90.5 Bu. 289,000 January 1, 2007 Inventory Number All cattle and calves 8,500 Beef cows and heifers that have calved 5,000 Milk cows ... Acres 2006 crops Harvested Yield Unit Production Barley ... ... Bu. ... Corn for Grain ... ... Bu. ... Dry beans ... ... Cwt. ... Hay, alfalfa 2,700 2.20 Tons 6,000 Hay, other 4,400 1.20 Tons 5,200 Potatoes, all ... ... Cwt. ... Sorghum, grain ... ... Bu. ... Sugarbeets ... ... Tons ... Sunflowers, all ... ... Lbs. ... Wheat, all 51,200 21.0 Bu. 1,072,000 January 1, 2007 Inventory Number All cattle and calves 8,500 Beef cows and heifers that have calved 5,000 Milk cows ...
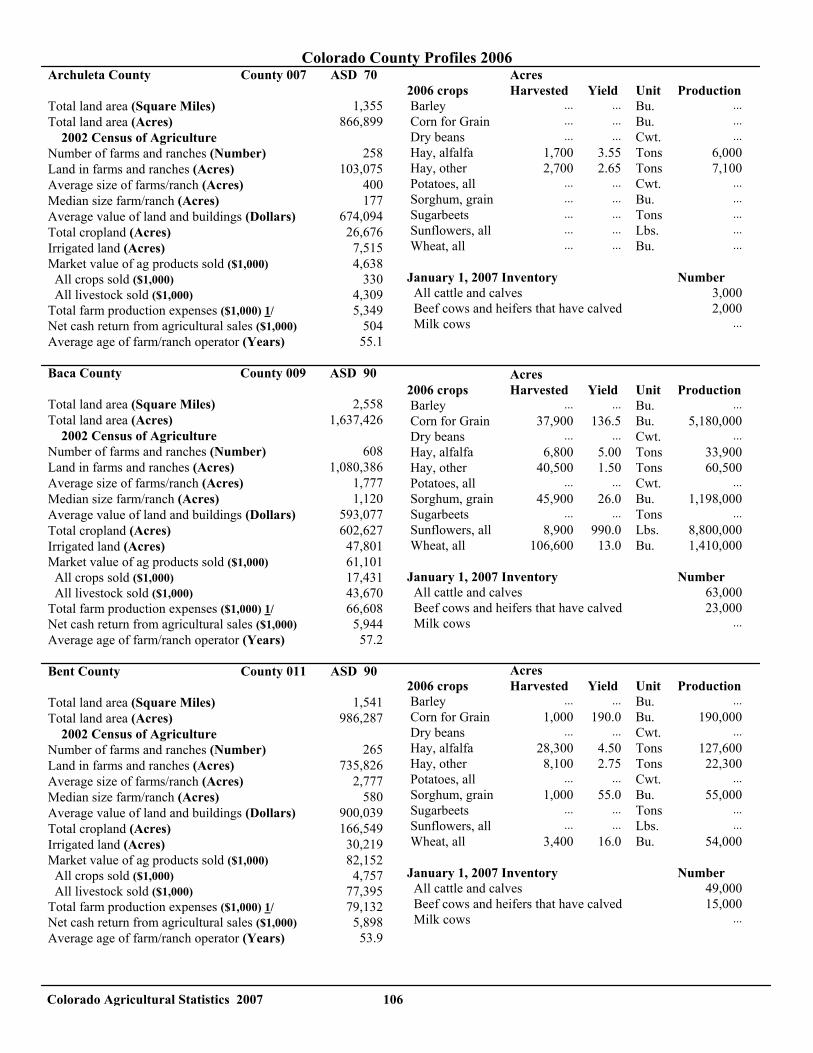
Colorado Agricultural Statistics 2007 106
Colorado County Profiles 2006 Archuleta County County 007 ASD 70 Total land area (Square Miles) 1,355 Total land area (Acres) 866,899 2002 Census of Agriculture Number of farms and ranches (Number) 258 Land in farms and ranches (Acres) 103,075 Average size of farms/ranch (Acres) 400 Median size farm/ranch (Acres) 177 Average value of land and buildings (Dollars) 674,094 Total cropland (Acres) 26,676 Irrigated land (Acres) 7,515 Market value of ag products sold ($1,000) 4,638 All crops sold ($1,000) 330 All livestock sold ($1,000) 4,309 Total farm production expenses ($1,000) 1/ 5,349 Net cash return from agricultural sales ($1,000) 504 Average age of farm/ranch operator (Years) 55.1 Baca County County 009 ASD 90 Total land area (Square Miles) 2,558 Total land area (Acres) 1,637,426 2002 Census of Agriculture Number of farms and ranches (Number) 608 Land in farms and ranches (Acres) 1,080,386 Average size of farms/ranch (Acres) 1,777 Median size farm/ranch (Acres) 1,120 Average value of land and buildings (Dollars) 593,077 Total cropland (Acres) 602,627 Irrigated land (Acres) 47,801 Market value of ag products sold ($1,000) 61,101 All crops sold ($1,000) 17,431 All livestock sold ($1,000) 43,670 Total farm production expenses ($1,000) 1/ 66,608 Net cash return from agricultural sales ($1,000) 5,944 Average age of farm/ranch operator (Years) 57.2 Bent County County 011 ASD 90 Total land area (Square Miles) 1,541 Total land area (Acres) 986,287 2002 Census of Agriculture Number of farms and ranches (Number) 265 Land in farms and ranches (Acres) 735,826 Average size of farms/ranch (Acres) 2,777 Median size farm/ranch (Acres) 580 Average value of land and buildings (Dollars) 900,039 Total cropland (Acres) 166,549 Irrigated land (Acres) 30,219 Market value of ag products sold ($1,000) 82,152 All crops sold ($1,000) 4,757 All livestock sold ($1,000) 77,395 Total farm production expenses ($1,000) 1/ 79,132 Net cash return from agricultural sales ($1,000) 5,898 Average age of farm/ranch operator (Years) 53.9
Acres 2006 crops Harvested Yield Unit Production Barley ... ... Bu. ... Corn for Grain ... ... Bu. ... Dry beans ... ... Cwt. ... Hay, alfalfa 1,700 3.55 Tons 6,000 Hay, other 2,700 2.65 Tons 7,100 Potatoes, all ... ... Cwt. ... Sorghum, grain ... ... Bu. ... Sugarbeets ... ... Tons ... Sunflowers, all ... ... Lbs. ... Wheat, all ... ... Bu. ... January 1, 2007 Inventory Number All cattle and calves 3,000 Beef cows and heifers that have calved 2,000 Milk cows ... Acres 2006 crops Harvested Yield Unit Production Barley ... ... Bu. ... Corn for Grain 37,900 136.5 Bu. 5,180,000 Dry beans ... ... Cwt. ... Hay, alfalfa 6,800 5.00 Tons 33,900 Hay, other 40,500 1.50 Tons 60,500 Potatoes, all ... ... Cwt. ... Sorghum, grain 45,900 26.0 Bu. 1,198,000 Sugarbeets ... ... Tons ... Sunflowers, all 8,900 990.0 Lbs. 8,800,000 Wheat, all 106,600 13.0 Bu. 1,410,000 January 1, 2007 Inventory Number All cattle and calves 63,000 Beef cows and heifers that have calved 23,000 Milk cows ... Acres 2006 crops Harvested Yield Unit Production Barley ... ... Bu. ... Corn for Grain 1,000 190.0 Bu. 190,000 Dry beans ... ... Cwt. ... Hay, alfalfa 28,300 4.50 Tons 127,600 Hay, other 8,100 2.75 Tons 22,300 Potatoes, all ... ... Cwt. ... Sorghum, grain 1,000 55.0 Bu. 55,000 Sugarbeets ... ... Tons ... Sunflowers, all ... ... Lbs. ... Wheat, all 3,400 16.0 Bu. 54,000 January 1, 2007 Inventory Number All cattle and calves 49,000 Beef cows and heifers that have calved 15,000 Milk cows ...
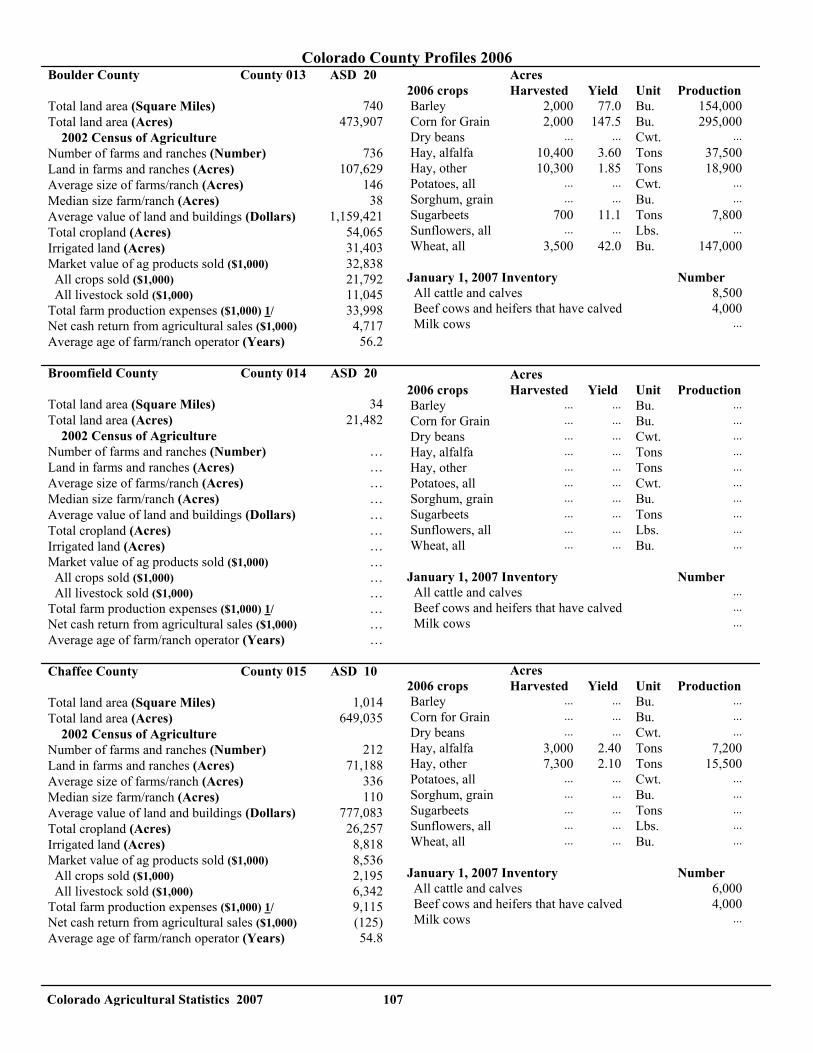
Colorado Agricultural Statistics 2007 107
Colorado County Profiles 2006 Boulder County County 013 ASD 20 Total land area (Square Miles) 740 Total land area (Acres) 473,907 2002 Census of Agriculture Number of farms and ranches (Number) 736 Land in farms and ranches (Acres) 107,629 Average size of farms/ranch (Acres) 146 Median size farm/ranch (Acres) 38 Average value of land and buildings (Dollars) 1,159,421 Total cropland (Acres) 54,065 Irrigated land (Acres) 31,403 Market value of ag products sold ($1,000) 32,838 All crops sold ($1,000) 21,792 All livestock sold ($1,000) 11,045 Total farm production expenses ($1,000) 1/ 33,998 Net cash return from agricultural sales ($1,000) 4,717 Average age of farm/ranch operator (Years) 56.2 Broomfield County County 014 ASD 20 Total land area (Square Miles) 34 Total land area (Acres) 21,482 2002 Census of Agriculture Number of farms and ranches (Number) … Land in farms and ranches (Acres) … Average size of farms/ranch (Acres) … Median size farm/ranch (Acres) … Average value of land and buildings (Dollars) … Total cropland (Acres) … Irrigated land (Acres) … Market value of ag products sold ($1,000) … All crops sold ($1,000) … All livestock sold ($1,000) … Total farm production expenses ($1,000) 1/ … Net cash return from agricultural sales ($1,000) … Average age of farm/ranch operator (Years) … Chaffee County County 015 ASD 10 Total land area (Square Miles) 1,014 Total land area (Acres) 649,035 2002 Census of Agriculture Number of farms and ranches (Number) 212 Land in farms and ranches (Acres) 71,188 Average size of farms/ranch (Acres) 336 Median size farm/ranch (Acres) 110 Average value of land and buildings (Dollars) 777,083 Total cropland (Acres) 26,257 Irrigated land (Acres) 8,818 Market value of ag products sold ($1,000) 8,536 All crops sold ($1,000) 2,195 All livestock sold ($1,000) 6,342 Total farm production expenses ($1,000) 1/ 9,115 Net cash return from agricultural sales ($1,000) (125) Average age of farm/ranch operator (Years) 54.8
Acres 2006 crops Harvested Yield Unit Production Barley 2,000 77.0 Bu. 154,000 Corn for Grain 2,000 147.5 Bu. 295,000 Dry beans ... ... Cwt. ... Hay, alfalfa 10,400 3.60 Tons 37,500 Hay, other 10,300 1.85 Tons 18,900 Potatoes, all ... ... Cwt. ... Sorghum, grain ... ... Bu. ... Sugarbeets 700 11.1 Tons 7,800 Sunflowers, all ... ... Lbs. ... Wheat, all 3,500 42.0 Bu. 147,000 January 1, 2007 Inventory Number All cattle and calves 8,500 Beef cows and heifers that have calved 4,000 Milk cows ... Acres 2006 crops Harvested Yield Unit Production Barley ... ... Bu. ... Corn for Grain ... ... Bu. ... Dry beans ... ... Cwt. ... Hay, alfalfa ... ... Tons ... Hay, other ... ... Tons ... Potatoes, all ... ... Cwt. ... Sorghum, grain ... ... Bu. ... Sugarbeets ... ... Tons ... Sunflowers, all ... ... Lbs. ... Wheat, all ... ... Bu. ... January 1, 2007 Inventory Number All cattle and calves ... Beef cows and heifers that have calved ... Milk cows ... Acres 2006 crops Harvested Yield Unit Production Barley ... ... Bu. ... Corn for Grain ... ... Bu. ... Dry beans ... ... Cwt. ... Hay, alfalfa 3,000 2.40 Tons 7,200 Hay, other 7,300 2.10 Tons 15,500 Potatoes, all ... ... Cwt. ... Sorghum, grain ... ... Bu. ... Sugarbeets ... ... Tons ... Sunflowers, all ... ... Lbs. ... Wheat, all ... ... Bu. ... January 1, 2007 Inventory Number All cattle and calves 6,000 Beef cows and heifers that have calved 4,000 Milk cows ...
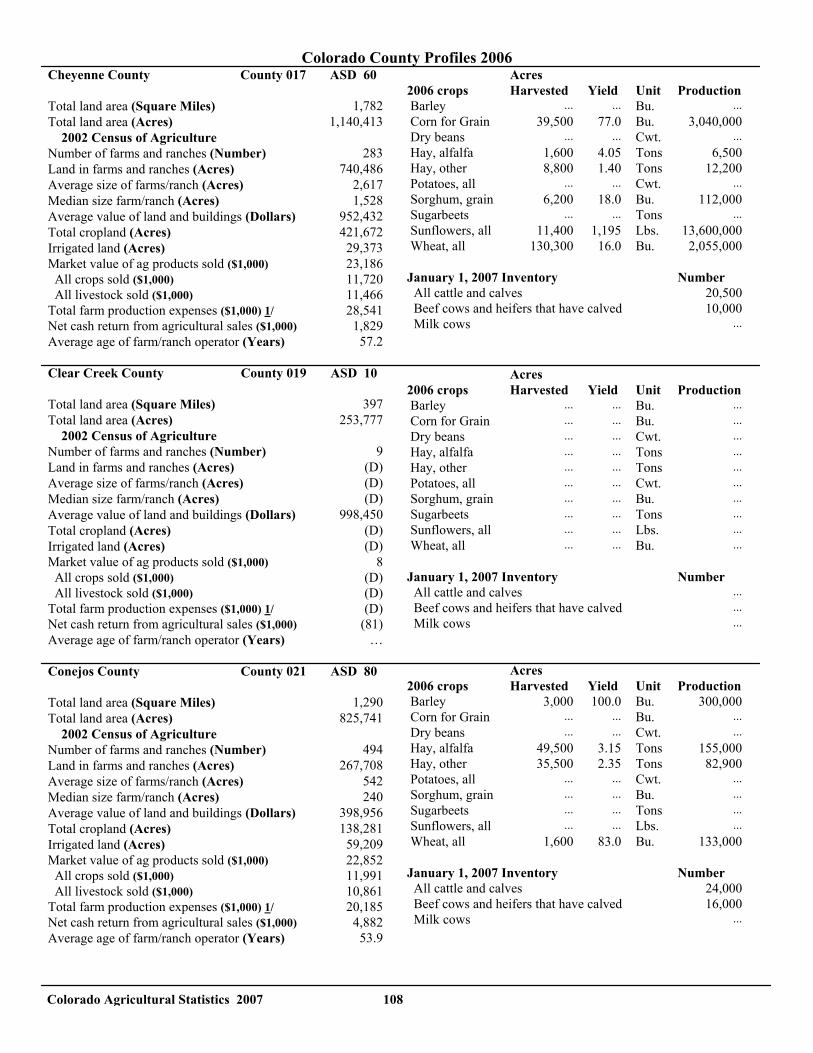
Colorado Agricultural Statistics 2007 108
Colorado County Profiles 2006 Cheyenne County County 017 ASD 60 Total land area (Square Miles) 1,782 Total land area (Acres) 1,140,413 2002 Census of Agriculture Number of farms and ranches (Number) 283 Land in farms and ranches (Acres) 740,486 Average size of farms/ranch (Acres) 2,617 Median size farm/ranch (Acres) 1,528 Average value of land and buildings (Dollars) 952,432 Total cropland (Acres) 421,672 Irrigated land (Acres) 29,373 Market value of ag products sold ($1,000) 23,186 All crops sold ($1,000) 11,720 All livestock sold ($1,000) 11,466 Total farm production expenses ($1,000) 1/ 28,541 Net cash return from agricultural sales ($1,000) 1,829 Average age of farm/ranch operator (Years) 57.2 Clear Creek County County 019 ASD 10 Total land area (Square Miles) 397 Total land area (Acres) 253,777 2002 Census of Agriculture Number of farms and ranches (Number) 9 Land in farms and ranches (Acres) (D) Average size of farms/ranch (Acres) (D) Median size farm/ranch (Acres) (D) Average value of land and buildings (Dollars) 998,450 Total cropland (Acres) (D) Irrigated land (Acres) (D) Market value of ag products sold ($1,000) 8 All crops sold ($1,000) (D) All livestock sold ($1,000) (D) Total farm production expenses ($1,000) 1/ (D) Net cash return from agricultural sales ($1,000) (81) Average age of farm/ranch operator (Years) … Conejos County County 021 ASD 80 Total land area (Square Miles) 1,290 Total land area (Acres) 825,741 2002 Census of Agriculture Number of farms and ranches (Number) 494 Land in farms and ranches (Acres) 267,708 Average size of farms/ranch (Acres) 542 Median size farm/ranch (Acres) 240 Average value of land and buildings (Dollars) 398,956 Total cropland (Acres) 138,281 Irrigated land (Acres) 59,209 Market value of ag products sold ($1,000) 22,852 All crops sold ($1,000) 11,991 All livestock sold ($1,000) 10,861 Total farm production expenses ($1,000) 1/ 20,185 Net cash return from agricultural sales ($1,000) 4,882 Average age of farm/ranch operator (Years) 53.9
Acres 2006 crops Harvested Yield Unit Production Barley ... ... Bu. ... Corn for Grain 39,500 77.0 Bu. 3,040,000 Dry beans ... ... Cwt. ... Hay, alfalfa 1,600 4.05 Tons 6,500 Hay, other 8,800 1.40 Tons 12,200 Potatoes, all ... ... Cwt. ... Sorghum, grain 6,200 18.0 Bu. 112,000 Sugarbeets ... ... Tons ... Sunflowers, all 11,400 1,195 Lbs. 13,600,000 Wheat, all 130,300 16.0 Bu. 2,055,000 January 1, 2007 Inventory Number All cattle and calves 20,500 Beef cows and heifers that have calved 10,000 Milk cows ... Acres 2006 crops Harvested Yield Unit Production Barley ... ... Bu. ... Corn for Grain ... ... Bu. ... Dry beans ... ... Cwt. ... Hay, alfalfa ... ... Tons ... Hay, other ... ... Tons ... Potatoes, all ... ... Cwt. ... Sorghum, grain ... ... Bu. ... Sugarbeets ... ... Tons ... Sunflowers, all ... ... Lbs. ... Wheat, all ... ... Bu. ... January 1, 2007 Inventory Number All cattle and calves ... Beef cows and heifers that have calved ... Milk cows ... Acres 2006 crops Harvested Yield Unit Production Barley 3,000 100.0 Bu. 300,000 Corn for Grain ... ... Bu. ... Dry beans ... ... Cwt. ... Hay, alfalfa 49,500 3.15 Tons 155,000 Hay, other 35,500 2.35 Tons 82,900 Potatoes, all ... ... Cwt. ... Sorghum, grain ... ... Bu. ... Sugarbeets ... ... Tons ... Sunflowers, all ... ... Lbs. ... Wheat, all 1,600 83.0 Bu. 133,000 January 1, 2007 Inventory Number All cattle and calves 24,000 Beef cows and heifers that have calved 16,000 Milk cows ...

Colorado Agricultural Statistics 2007 109
Colorado County Profiles 2006 Costilla County County 023 ASD 80 Total land area (Square Miles) 1,229 Total land area (Acres) 786,801 2002 Census of Agriculture Number of farms and ranches (Number) 205 Land in farms and ranches (Acres) 354,067 Average size of farms/ranch (Acres) 1,727 Median size farm/ranch (Acres) 170 Average value of land and buildings (Dollars) 846,998 Total cropland (Acres) 69,789 Irrigated land (Acres) 34,866 Market value of ag products sold ($1,000) 26,245 All crops sold ($1,000) 22,598 All livestock sold ($1,000) 3,647 Total farm production expenses ($1,000) 1/ 17,846 Net cash return from agricultural sales ($1,000) 10,119 Average age of farm/ranch operator (Years) 53.7 Crowley County County 003 ASD 80 Total land area (Square Miles) 800 Total land area (Acres) 512,170 2002 Census of Agriculture Number of farms and ranches (Number) 217 Land in farms and ranches (Acres) 375,413 Average size of farms/ranch (Acres) 1,730 Median size farm/ranch (Acres) 540 Average value of land and buildings (Dollars) 459,908 Total cropland (Acres) 54,563 Irrigated land (Acres) 6,156 Market value of ag products sold ($1,000) 53,384 All crops sold ($1,000) 1,616 All livestock sold ($1,000) 51,768 Total farm production expenses ($1,000) 1/ 49,540 Net cash return from agricultural sales ($1,000) 5,501 Average age of farm/ranch operator (Years) 56.7 Custer County County 027 ASD 90 Total land area (Square Miles) 739 Total land area (Acres) 473,112 2002 Census of Agriculture Number of farms and ranches (Number) 158 Land in farms and ranches (Acres) 121,882 Average size of farms/ranch (Acres) 771 Median size farm/ranch (Acres) 308 Average value of land and buildings (Dollars) 1,184,505 Total cropland (Acres) 30,781 Irrigated land (Acres) 3,487 Market value of ag products sold ($1,000) 2,741 All crops sold ($1,000) 275 All livestock sold ($1,000) 2,466 Total farm production expenses ($1,000) 1/ 2,994 Net cash return from agricultural sales ($1,000) 78 Average age of farm/ranch operator (Years) 57.8
Acres 2005 crops Harvested Yield Unit Production Barley 1,600 147.0 Bu. 235,000 Corn for Grain ... ... Bu. ... Dry beans ... ... Cwt. ... Hay, alfalfa 19,000 2.95 Tons 56,000 Hay, other 5,100 1.90 Tons 9,700 Potatoes, all ... ... Cwt. ... Sorghum, grain ... ... Bu. ... Sugarbeets ... ... Tons ... Sunflowers, all ... ... Lbs. ... Wheat, all 500 108.0 Bu. 54,000 January 1, 2007 Inventory Number All cattle and calves 6,000 Beef cows and heifers that have calved 4,000 Milk cows ... Acres 2006 crops Harvested Yield Unit Production Barley ... ... Bu. ... Corn for Grain ... ... Bu. ... Dry beans ... ... Cwt. ... Hay, alfalfa 5,100 4.25 Tons 21,800 Hay, other 6,000 2.00 Tons 12,000 Potatoes, all ... ... Cwt. ... Sorghum, grain 2,500 29.5 Bu. 74,000 Sugarbeets ... ... Tons ... Sunflowers, all ... ... Lbs. ... Wheat, all ... ... Bu. ... January 1, 2007 Inventory Number All cattle and calves 63,000 Beef cows and heifers that have calved 6,000 Milk cows ... Acres 2006 crops Harvested Yield Unit Production Barley ... ... Bu. ... Corn for Grain ... ... Bu. ... Dry beans ... ... Cwt. ... Hay, alfalfa 1,700 2.90 Tons 4,900 Hay, other 17,000 2.05 Tons 34,800 Potatoes, all ... ... Cwt. ... Sorghum, grain ... ... Bu. ... Sugarbeets ... ... Tons ... Sunflowers, all ... ... Lbs. ... Wheat, all ... ... Bu. ... January 1, 2007 Inventory Number All cattle and calves 6,000 Beef cows and heifers that have calved 4,000 Milk cows ...
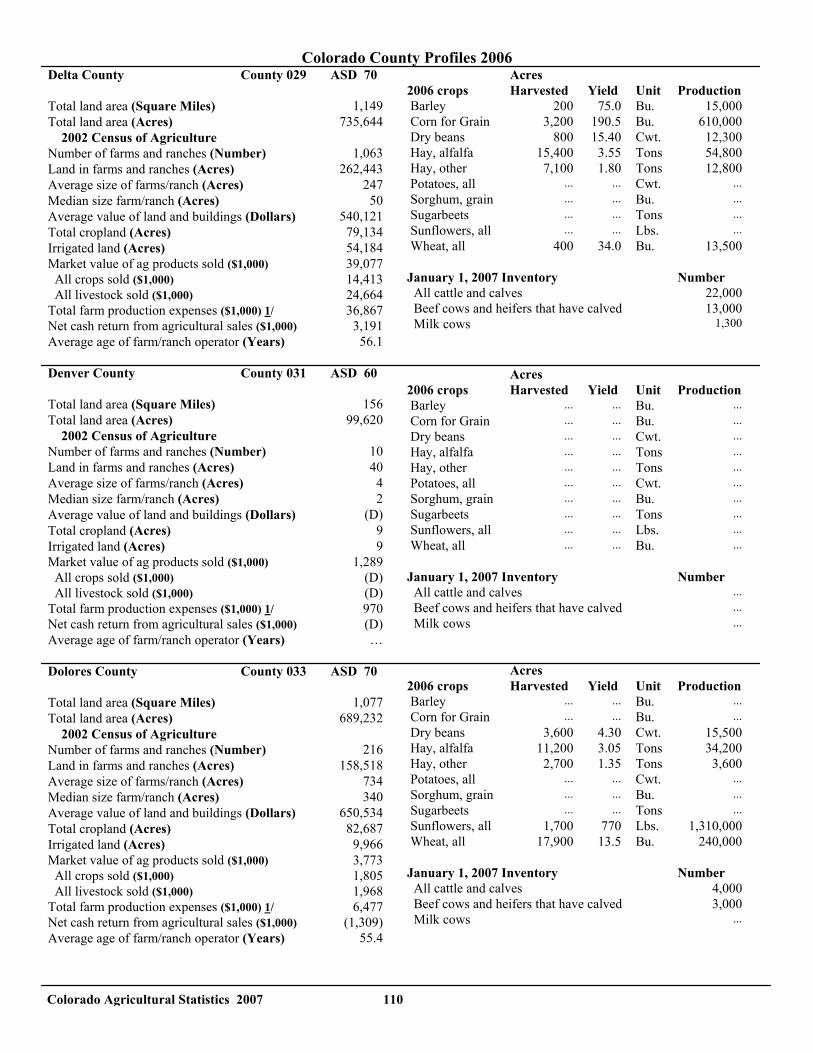
Colorado Agricultural Statistics 2007 110
Colorado County Profiles 2006 Delta County County 029 ASD 70 Total land area (Square Miles) 1,149 Total land area (Acres) 735,644 2002 Census of Agriculture Number of farms and ranches (Number) 1,063 Land in farms and ranches (Acres) 262,443 Average size of farms/ranch (Acres) 247 Median size farm/ranch (Acres) 50 Average value of land and buildings (Dollars) 540,121 Total cropland (Acres) 79,134 Irrigated land (Acres) 54,184 Market value of ag products sold ($1,000) 39,077 All crops sold ($1,000) 14,413 All livestock sold ($1,000) 24,664 Total farm production expenses ($1,000) 1/ 36,867 Net cash return from agricultural sales ($1,000) 3,191 Average age of farm/ranch operator (Years) 56.1 Denver County County 031 ASD 60 Total land area (Square Miles) 156 Total land area (Acres) 99,620 2002 Census of Agriculture Number of farms and ranches (Number) 10 Land in farms and ranches (Acres) 40 Average size of farms/ranch (Acres) 4 Median size farm/ranch (Acres) 2 Average value of land and buildings (Dollars) (D) Total cropland (Acres) 9 Irrigated land (Acres) 9 Market value of ag products sold ($1,000) 1,289 All crops sold ($1,000) (D) All livestock sold ($1,000) (D) Total farm production expenses ($1,000) 1/ 970 Net cash return from agricultural sales ($1,000) (D) Average age of farm/ranch operator (Years) … Dolores County County 033 ASD 70 Total land area (Square Miles) 1,077 Total land area (Acres) 689,232 2002 Census of Agriculture Number of farms and ranches (Number) 216 Land in farms and ranches (Acres) 158,518 Average size of farms/ranch (Acres) 734 Median size farm/ranch (Acres) 340 Average value of land and buildings (Dollars) 650,534 Total cropland (Acres) 82,687 Irrigated land (Acres) 9,966 Market value of ag products sold ($1,000) 3,773 All crops sold ($1,000) 1,805 All livestock sold ($1,000) 1,968 Total farm production expenses ($1,000) 1/ 6,477 Net cash return from agricultural sales ($1,000) (1,309) Average age of farm/ranch operator (Years) 55.4
Acres 2006 crops Harvested Yield Unit Production Barley 200 75.0 Bu. 15,000 Corn for Grain 3,200 190.5 Bu. 610,000 Dry beans 800 15.40 Cwt. 12,300 Hay, alfalfa 15,400 3.55 Tons 54,800 Hay, other 7,100 1.80 Tons 12,800 Potatoes, all ... ... Cwt. ... Sorghum, grain ... ... Bu. ... Sugarbeets ... ... Tons ... Sunflowers, all ... ... Lbs. ... Wheat, all 400 34.0 Bu. 13,500 January 1, 2007 Inventory Number All cattle and calves 22,000 Beef cows and heifers that have calved 13,000 Milk cows 1,300 Acres 2006 crops Harvested Yield Unit Production Barley ... ... Bu. ... Corn for Grain ... ... Bu. ... Dry beans ... ... Cwt. ... Hay, alfalfa ... ... Tons ... Hay, other ... ... Tons ... Potatoes, all ... ... Cwt. ... Sorghum, grain ... ... Bu. ... Sugarbeets ... ... Tons ... Sunflowers, all ... ... Lbs. ... Wheat, all ... ... Bu. ... January 1, 2007 Inventory Number All cattle and calves ... Beef cows and heifers that have calved ... Milk cows ... Acres 2006 crops Harvested Yield Unit Production Barley ... ... Bu. ... Corn for Grain ... ... Bu. ... Dry beans 3,600 4.30 Cwt. 15,500 Hay, alfalfa 11,200 3.05 Tons 34,200 Hay, other 2,700 1.35 Tons 3,600 Potatoes, all ... ... Cwt. ... Sorghum, grain ... ... Bu. ... Sugarbeets ... ... Tons ... Sunflowers, all 1,700 770 Lbs. 1,310,000 Wheat, all 17,900 13.5 Bu. 240,000 January 1, 2007 Inventory Number All cattle and calves 4,000 Beef cows and heifers that have calved 3,000 Milk cows ...
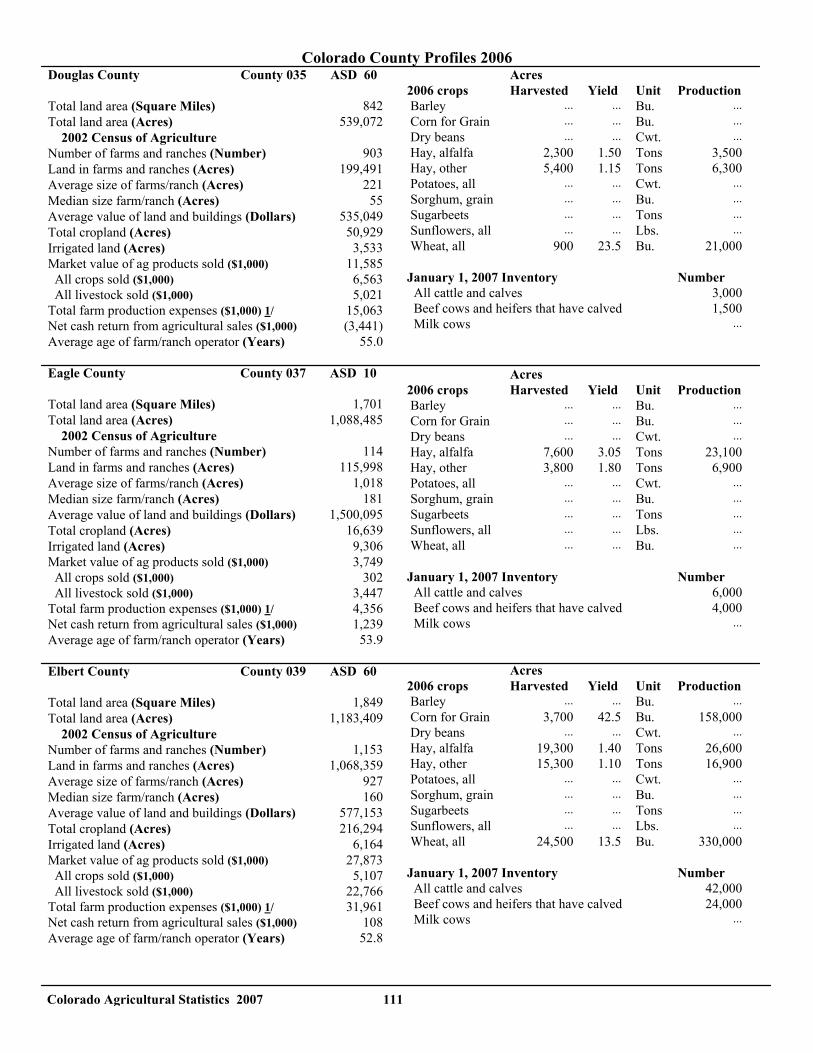
Colorado Agricultural Statistics 2007 111
Colorado County Profiles 2006 Douglas County County 035 ASD 60 Total land area (Square Miles) 842 Total land area (Acres) 539,072 2002 Census of Agriculture Number of farms and ranches (Number) 903 Land in farms and ranches (Acres) 199,491 Average size of farms/ranch (Acres) 221 Median size farm/ranch (Acres) 55 Average value of land and buildings (Dollars) 535,049 Total cropland (Acres) 50,929 Irrigated land (Acres) 3,533 Market value of ag products sold ($1,000) 11,585 All crops sold ($1,000) 6,563 All livestock sold ($1,000) 5,021 Total farm production expenses ($1,000) 1/ 15,063 Net cash return from agricultural sales ($1,000) (3,441) Average age of farm/ranch operator (Years) 55.0 Eagle County County 037 ASD 10 Total land area (Square Miles) 1,701 Total land area (Acres) 1,088,485 2002 Census of Agriculture Number of farms and ranches (Number) 114 Land in farms and ranches (Acres) 115,998 Average size of farms/ranch (Acres) 1,018 Median size farm/ranch (Acres) 181 Average value of land and buildings (Dollars) 1,500,095 Total cropland (Acres) 16,639 Irrigated land (Acres) 9,306 Market value of ag products sold ($1,000) 3,749 All crops sold ($1,000) 302 All livestock sold ($1,000) 3,447 Total farm production expenses ($1,000) 1/ 4,356 Net cash return from agricultural sales ($1,000) 1,239 Average age of farm/ranch operator (Years) 53.9 Elbert County County 039 ASD 60 Total land area (Square Miles) 1,849 Total land area (Acres) 1,183,409 2002 Census of Agriculture Number of farms and ranches (Number) 1,153 Land in farms and ranches (Acres) 1,068,359 Average size of farms/ranch (Acres) 927 Median size farm/ranch (Acres) 160 Average value of land and buildings (Dollars) 577,153 Total cropland (Acres) 216,294 Irrigated land (Acres) 6,164 Market value of ag products sold ($1,000) 27,873 All crops sold ($1,000) 5,107 All livestock sold ($1,000) 22,766 Total farm production expenses ($1,000) 1/ 31,961 Net cash return from agricultural sales ($1,000) 108 Average age of farm/ranch operator (Years) 52.8
Acres 2006 crops Harvested Yield Unit Production Barley ... ... Bu. ... Corn for Grain ... ... Bu. ... Dry beans ... ... Cwt. ... Hay, alfalfa 2,300 1.50 Tons 3,500 Hay, other 5,400 1.15 Tons 6,300 Potatoes, all ... ... Cwt. ... Sorghum, grain ... ... Bu. ... Sugarbeets ... ... Tons ... Sunflowers, all ... ... Lbs. ... Wheat, all 900 23.5 Bu. 21,000 January 1, 2007 Inventory Number All cattle and calves 3,000 Beef cows and heifers that have calved 1,500 Milk cows ... Acres 2006 crops Harvested Yield Unit Production Barley ... ... Bu. ... Corn for Grain ... ... Bu. ... Dry beans ... ... Cwt. ... Hay, alfalfa 7,600 3.05 Tons 23,100 Hay, other 3,800 1.80 Tons 6,900 Potatoes, all ... ... Cwt. ... Sorghum, grain ... ... Bu. ... Sugarbeets ... ... Tons ... Sunflowers, all ... ... Lbs. ... Wheat, all ... ... Bu. ... January 1, 2007 Inventory Number All cattle and calves 6,000 Beef cows and heifers that have calved 4,000 Milk cows ... Acres 2006 crops Harvested Yield Unit Production Barley ... ... Bu. ... Corn for Grain 3,700 42.5 Bu. 158,000 Dry beans ... ... Cwt. ... Hay, alfalfa 19,300 1.40 Tons 26,600 Hay, other 15,300 1.10 Tons 16,900 Potatoes, all ... ... Cwt. ... Sorghum, grain ... ... Bu. ... Sugarbeets ... ... Tons ... Sunflowers, all ... ... Lbs. ... Wheat, all 24,500 13.5 Bu. 330,000 January 1, 2007 Inventory Number All cattle and calves 42,000 Beef cows and heifers that have calved 24,000 Milk cows ...
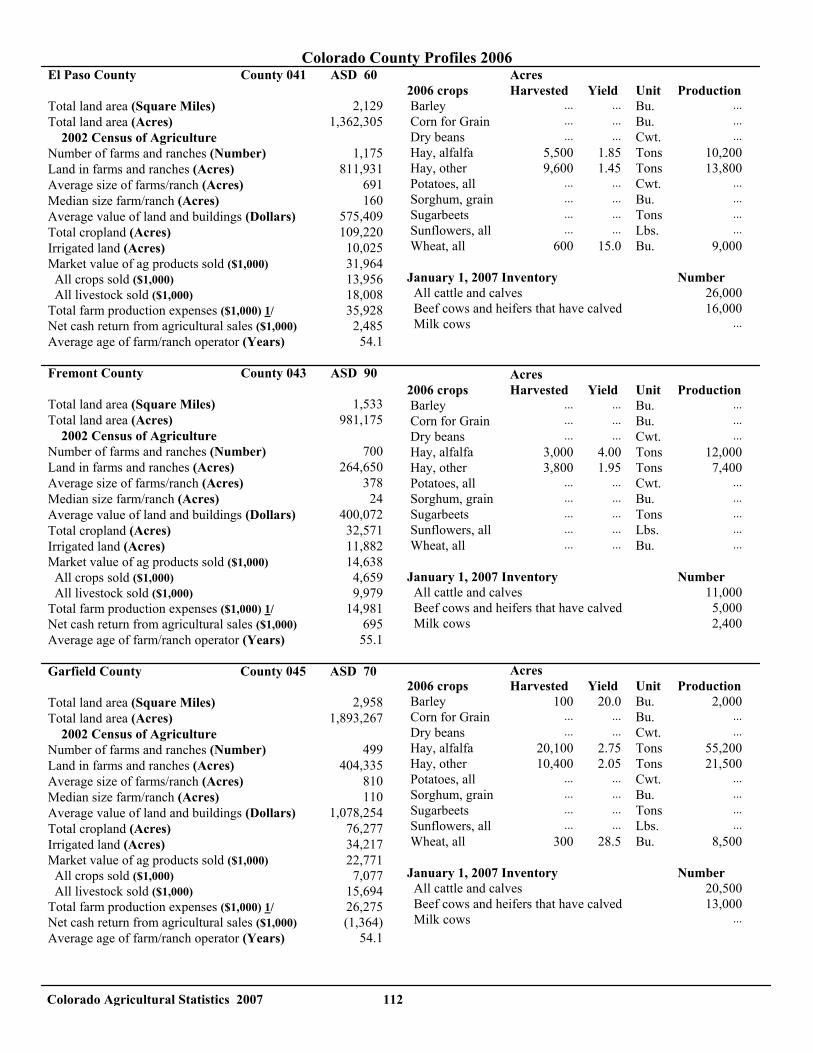
Colorado Agricultural Statistics 2007 112
Colorado County Profiles 2006 El Paso County County 041 ASD 60 Total land area (Square Miles) 2,129 Total land area (Acres) 1,362,305 2002 Census of Agriculture Number of farms and ranches (Number) 1,175 Land in farms and ranches (Acres) 811,931 Average size of farms/ranch (Acres) 691 Median size farm/ranch (Acres) 160 Average value of land and buildings (Dollars) 575,409 Total cropland (Acres) 109,220 Irrigated land (Acres) 10,025 Market value of ag products sold ($1,000) 31,964 All crops sold ($1,000) 13,956 All livestock sold ($1,000) 18,008 Total farm production expenses ($1,000) 1/ 35,928 Net cash return from agricultural sales ($1,000) 2,485 Average age of farm/ranch operator (Years) 54.1 Fremont County County 043 ASD 90 Total land area (Square Miles) 1,533 Total land area (Acres) 981,175 2002 Census of Agriculture Number of farms and ranches (Number) 700 Land in farms and ranches (Acres) 264,650 Average size of farms/ranch (Acres) 378 Median size farm/ranch (Acres) 24 Average value of land and buildings (Dollars) 400,072 Total cropland (Acres) 32,571 Irrigated land (Acres) 11,882 Market value of ag products sold ($1,000) 14,638 All crops sold ($1,000) 4,659 All livestock sold ($1,000) 9,979 Total farm production expenses ($1,000) 1/ 14,981 Net cash return from agricultural sales ($1,000) 695 Average age of farm/ranch operator (Years) 55.1 Garfield County County 045 ASD 70 Total land area (Square Miles) 2,958 Total land area (Acres) 1,893,267 2002 Census of Agriculture Number of farms and ranches (Number) 499 Land in farms and ranches (Acres) 404,335 Average size of farms/ranch (Acres) 810 Median size farm/ranch (Acres) 110 Average value of land and buildings (Dollars) 1,078,254 Total cropland (Acres) 76,277 Irrigated land (Acres) 34,217 Market value of ag products sold ($1,000) 22,771 All crops sold ($1,000) 7,077 All livestock sold ($1,000) 15,694 Total farm production expenses ($1,000) 1/ 26,275 Net cash return from agricultural sales ($1,000) (1,364) Average age of farm/ranch operator (Years) 54.1
Acres 2006 crops Harvested Yield Unit Production Barley ... ... Bu. ... Corn for Grain ... ... Bu. ... Dry beans ... ... Cwt. ... Hay, alfalfa 5,500 1.85 Tons 10,200 Hay, other 9,600 1.45 Tons 13,800 Potatoes, all ... ... Cwt. ... Sorghum, grain ... ... Bu. ... Sugarbeets ... ... Tons ... Sunflowers, all ... ... Lbs. ... Wheat, all 600 15.0 Bu. 9,000 January 1, 2007 Inventory Number All cattle and calves 26,000 Beef cows and heifers that have calved 16,000 Milk cows ... Acres 2006 crops Harvested Yield Unit Production Barley ... ... Bu. ... Corn for Grain ... ... Bu. ... Dry beans ... ... Cwt. ... Hay, alfalfa 3,000 4.00 Tons 12,000 Hay, other 3,800 1.95 Tons 7,400 Potatoes, all ... ... Cwt. ... Sorghum, grain ... ... Bu. ... Sugarbeets ... ... Tons ... Sunflowers, all ... ... Lbs. ... Wheat, all ... ... Bu. ... January 1, 2007 Inventory Number All cattle and calves 11,000 Beef cows and heifers that have calved 5,000 Milk cows 2,400 Acres 2006 crops Harvested Yield Unit Production Barley 100 20.0 Bu. 2,000 Corn for Grain ... ... Bu. ... Dry beans ... ... Cwt. ... Hay, alfalfa 20,100 2.75 Tons 55,200 Hay, other 10,400 2.05 Tons 21,500 Potatoes, all ... ... Cwt. ... Sorghum, grain ... ... Bu. ... Sugarbeets ... ... Tons ... Sunflowers, all ... ... Lbs. ... Wheat, all 300 28.5 Bu. 8,500 January 1, 2007 Inventory Number All cattle and calves 20,500 Beef cows and heifers that have calved 13,000 Milk cows ...

Colorado Agricultural Statistics 2007 113
Colorado County Profiles 2006 Gilpin County County 047 ASD 10 Total land area (Square Miles) 150 Total land area (Acres) 96,094 2002 Census of Agriculture Number of farms and ranches (Number) 26 Land in farms and ranches (Acres) 6,045 Average size of farms/ranch (Acres) 233 Median size farm/ranch (Acres) 154 Average value of land and buildings (Dollars) 934,244 Total cropland (Acres) 270 Irrigated land (Acres) … Market value of ag products sold ($1,000) 213 All crops sold ($1,000) (D) All livestock sold ($1,000) (D) Total farm production expenses ($1,000) 1/ 348 Net cash return from agricultural sales ($1,000) (94) Average age of farm/ranch operator (Years) 55.6 Grand County County 049 ASD 10 Total land area (Square Miles) 1,869 Total land area (Acres) 1,195,857 2002 Census of Agriculture Number of farms and ranches (Number) 173 Land in farms and ranches (Acres) 219,598 Average size of farms/ranch (Acres) 1,269 Median size farm/ranch (Acres) 350 Average value of land and buildings (Dollars) 1,521,147 Total cropland (Acres) 49,667 Irrigated land (Acres) 35,492 Market value of ag products sold ($1,000) 7,293 All crops sold ($1,000) 1,072 All livestock sold ($1,000) 6,221 Total farm production expenses ($1,000) 1/ 9,831 Net cash return from agricultural sales ($1,000) (1,467) Average age of farm/ranch operator (Years) 54.8 Gunnison County County 051 ASD 10 Total land area (Square Miles) 3,259 Total land area (Acres) 2,085,900 2002 Census of Agriculture Number of farms and ranches (Number) 186 Land in farms and ranches (Acres) 165,488 Average size of farms/ranch (Acres) 890 Median size farm/ranch (Acres) 320 Average value of land and buildings (Dollars) 1,467,593 Total cropland (Acres) 58,608 Irrigated land (Acres) 41,219 Market value of ag products sold ($1,000) 9,139 All crops sold ($1,000) 982 All livestock sold ($1,000) 8,157 Total farm production expenses ($1,000) 1/ 8,089 Net cash return from agricultural sales ($1,000) 1,669 Average age of farm/ranch operator (Years) 53.1
Acres 2006 crops Harvested Yield Unit Production Barley ... ... Bu. ... Corn for Grain ... ... Bu. ... Dry beans ... ... Cwt. ... Hay, alfalfa ... ... Tons ... Hay, other ... ... Tons ... Potatoes, all ... ... Cwt. ... Sorghum, grain ... ... Bu. ... Sugarbeets ... ... Tons ... Sunflowers, all ... ... Lbs. ... Wheat, all ... ... Bu. ... January 1, 2007 Inventory Number All cattle and calves ... Beef cows and heifers that have calved ... Milk cows ... Acres 2006 crops Harvested Yield Unit Production Barley ... ... Bu. ... Corn for Grain ... ... Bu. ... Dry beans ... ... Cwt. ... Hay, alfalfa 1,300 3.45 Tons 4,500 Hay, other 17,700 1.50 Tons 26,500 Potatoes, all ... ... Cwt. ... Sorghum, grain ... ... Bu. ... Sugarbeets ... ... Tons ... Sunflowers, all ... ... Lbs. ... Wheat, all ... ... Bu. ... January 1, 2007 Inventory Number All cattle and calves 20,000 Beef cows and heifers that have calved 12,000 Milk cows ... Acres 2006 crops Harvested Yield Unit Production Barley ... ... Bu. ... Corn for Grain ... ... Bu. ... Dry beans ... ... Cwt. ... Hay, alfalfa 1,700 3.65 Tons 6,200 Hay, other 23,300 1.55 Tons 35,800 Potatoes, all ... ... Cwt. ... Sorghum, grain ... ... Bu. ... Sugarbeets ... ... Tons ... Sunflowers, all ... ... Lbs. ... Wheat, all ... ... Bu. ... January 1, 2007 Inventory Number All cattle and calves 19,000 Beef cows and heifers that have calved 11,000 Milk cows ...
Colorado Agricultural Statistics 2007 114
Colorado County Profiles 2006 Hinsdale County County 053 ASD 70 Total land area (Square Miles) 1,123 Total land area (Acres) 718,946 2002 Census of Agriculture Number of farms and ranches (Number) 19 Land in farms and ranches (Acres) 8,681 Average size of farms/ranch (Acres) 457 Median size farm/ranch (Acres) 281 Average value of land and buildings (Dollars) 1,167,571 Total cropland (Acres) 4,197 Irrigated land (Acres) 1,549 Market value of ag products sold ($1,000) 315 All crops sold ($1,000) (D) All livestock sold ($1,000) (D) Total farm production expenses ($1,000) 1/ 683 Net cash return from agricultural sales ($1,000) (333) Average age of farm/ranch operator (Years) 54.4 Huerfano County County 055 ASD 90 Total land area (Square Miles) 1,592 Total land area (Acres) 1,019,116 2002 Census of Agriculture Number of farms and ranches (Number) 292 Land in farms and ranches (Acres) 608,002 Average size of farms/ranch (Acres) 2,082 Median size farm/ranch (Acres) 680 Average value of land and buildings (Dollars) 875,538 Total cropland (Acres) 60,191 Irrigated land (Acres) 6,381 Market value of ag products sold ($1,000) 7,612 All crops sold ($1,000) 285 All livestock sold ($1,000) 7,327 Total farm production expenses ($1,000) 1/ 6,231 Net cash return from agricultural sales ($1,000) 1,116 Average age of farm/ranch operator (Years) 58.6 Jackson County County 057 ASD 10 Total land area (Square Miles) 1,620 Total land area (Acres) 1,036,639 2002 Census of Agriculture Number of farms and ranches (Number) 89 Land in farms and ranches (Acres) 437,630 Average size of farms/ranch (Acres) 4,917 Median size farm/ranch (Acres) 2,000 Average value of land and buildings (Dollars) 2,513,501 Total cropland (Acres) 107,946 Irrigated land (Acres) 54,870 Market value of ag products sold ($1,000) 15,883 All crops sold ($1,000) 880 All livestock sold ($1,000) 15,003 Total farm production expenses ($1,000) 1/ 13,090 Net cash return from agricultural sales ($1,000) 4,355 Average age of farm/ranch operator (Years) 54.5
Acres 2006 crops Harvested Yield Unit Production Barley ... ... Bu. ... Corn for Grain ... ... Bu. ... Dry beans ... ... Cwt. ... Hay, alfalfa ... ... Tons ... Hay, other ... ... Tons ... Potatoes, all ... ... Cwt. ... Sorghum, grain ... ... Bu. ... Sugarbeets ... ... Tons ... Sunflowers, all ... ... Lbs. ... Wheat, all ... ... Bu. ... January 1, 2007 Inventory Number All cattle and calves 1,000 Beef cows and heifers that have calved 500 Milk cows ... Acres 2006 crops Harvested Yield Unit Production Barley ... ... Bu. ... Corn for Grain ... ... Bu. ... Dry beans ... ... Cwt. ... Hay, alfalfa 5,500 2.40 Tons 13,100 Hay, other 3,700 1.65 Tons 6,100 Potatoes, all ... ... Cwt. ... Sorghum, grain ... ... Bu. ... Sugarbeets ... ... Tons ... Sunflowers, all ... ... Lbs. ... Wheat, all ... ... Bu. ... January 1, 2007 Inventory Number All cattle and calves 13,000 Beef cows and heifers that have calved 7,000 Milk cows ... Acres 2006 crops Harvested Yield Unit Production Barley ... ... Bu. ... Corn for Grain ... ... Bu. ... Dry beans ... ... Cwt. ... Hay, alfalfa ... ... Tons ... Hay, other 50,200 1.75 Tons 89,100 Potatoes, all ... ... Cwt. ... Sorghum, grain ... ... Bu. ... Sugarbeets ... ... Tons ... Sunflowers, all ... ... Lbs. ... Wheat, all ... ... Bu. ... January 1, 2007 Inventory Number All cattle and calves 33,500 Beef cows and heifers that have calved 18,000 Milk cows ...
Colorado Agricultural Statistics 2007 115
Colorado County Profiles 2006 Jefferson County County 059 ASD 20 Total land area (Square Miles) 773 Total land area (Acres) 494,624 2002 Census of Agriculture Number of farms and ranches (Number) 457 Land in farms and ranches (Acres) 90,366 Average size of farms/ranch (Acres) 198 Median size farm/ranch (Acres) 35 Average value of land and buildings (Dollars) 752,195 Total cropland (Acres) 18,527 Irrigated land (Acres) 1,646 Market value of ag products sold ($1,000) 20,498 All crops sold ($1,000) 18,502 All livestock sold ($1,000) 1,996 Total farm production expenses ($1,000) 1/ 27,002 Net cash return from agricultural sales ($1,000) 6,568 Average age of farm/ranch operator (Years) 55.1 Kiowa County County 061 ASD 60 Total land area (Square Miles) 1,786 Total land area (Acres) 1,142,976 2002 Census of Agriculture Number of farms and ranches (Number) 357 Land in farms and ranches (Acres) 896,772 Average size of farms/ranch (Acres) 2,512 Median size farm/ranch (Acres) 1,280 Average value of land and buildings (Dollars) 724,365 Total cropland (Acres) 498,188 Irrigated land (Acres) 3,606 Market value of ag products sold ($1,000) 18,984 All crops sold ($1,000) (D) All livestock sold ($1,000) (D) Total farm production expenses ($1,000) 1/ 28,651 Net cash return from agricultural sales ($1,000) 944 Average age of farm/ranch operator (Years) 55.2 Kit Carson County County 063 ASD 60 Total land area (Square Miles) 2,162 Total land area (Acres) 1,383,956 2002 Census of Agriculture Number of farms and ranches (Number) 678 Land in farms and ranches (Acres) 1,247,181 Average size of farms/ranch (Acres) 1,840 Median size farm/ranch (Acres) 1,112 Average value of land and buildings (Dollars) 815,335 Total cropland (Acres) 849,670 Irrigated land (Acres) 136,762 Market value of ag products sold ($1,000) 205,554 All crops sold ($1,000) 40,362 All livestock sold ($1,000) 165,192 Total farm production expenses ($1,000) 1/ 217,385 Net cash return from agricultural sales ($1,000) 3,392 Average age of farm/ranch operator (Years) 54.3
Acres 2006 crops Harvested Yield Unit Production Barley ... ... Bu. ... Corn for Grain ... ... Bu. ... Dry beans ... ... Cwt. ... Hay, alfalfa 600 3.00 Tons 1,800 Hay, other 4,400 1.10 Tons 4,800 Potatoes, all ... ... Cwt. ... Sorghum, grain ... ... Bu. ... Sugarbeets ... ... Tons ... Sunflowers, all ... ... Lbs. ... Wheat, all ... ... Bu. ... January 1, 2007 Inventory Number All cattle and calves 1,500 Beef cows and heifers that have calved 1,000 Milk cows ... Acres 2006 crops Harvested Yield Unit Production Barley ... ... Bu. ... Corn for Grain 13,200 43.5 Bu. 575,000 Dry beans ... ... Cwt. ... Hay, alfalfa ... ... Tons ... Hay, other ... ... Tons ... Potatoes, all ... ... Cwt. ... Sorghum, grain 35,000 23.0 Bu. 809,000 Sugarbeets ... ... Tons ... Sunflowers, all 14,500 1,130 Lbs. 16,400,000 Wheat, all 171,600 20.0 Bu. 3,433,000 January 1, 2007 Inventory Number All cattle and calves 14,000 Beef cows and heifers that have calved 9,000 Milk cows ... Acres 2006 crops Harvested Yield Unit Production Barley ... ... Bu. ... Corn for Grain 154,500 121.0 Bu. 18,725,000 Dry beans 3,900 16.50 Cwt. 64,400 Hay, alfalfa 9,500 5.75 Tons 54,500 Hay, other 25,600 2.05 Tons 52,800 Potatoes, all ... ... Cwt. ... Sorghum, grain 2,400 32.0 Bu. 77,000 Sugarbeets 600 28.7 Tons 17,200 Sunflowers, all 24,800 1,025 Lbs. 25,400,000 Wheat, all 216,700 21.5 Bu. 4,645,000 January 1, 2007 Inventory Number All cattle and calves 159,000 Beef cows and heifers that have calved 20,000 Milk cows ...
Colorado Agricultural Statistics 2007 116
Colorado County Profiles 2006 Lake County County 065 ASD 10 Total land area (Square Miles) 384 Total land area (Acres) 245,475 2002 Census of Agriculture Number of farms and ranches (Number) 34 Land in farms and ranches (Acres) 17,253 Average size of farms/ranch (Acres) 507 Median size farm/ranch (Acres) 268 Average value of land and buildings (Dollars) 668,095 Total cropland (Acres) 3,936 Irrigated land (Acres) 516 Market value of ag products sold ($1,000) 365 All crops sold ($1,000) (D) All livestock sold ($1,000) (D) Total farm production expenses ($1,000) 1/ 743 Net cash return from agricultural sales ($1,000) (144) Average age of farm/ranch operator (Years) 55.2 La Plata County County 067 ASD 70 Total land area (Square Miles) 1,700 Total land area (Acres) 1,088,284 2002 Census of Agriculture Number of farms and ranches (Number) 923 Land in farms and ranches (Acres) 562,664 Average size of farms/ranch (Acres) 610 Median size farm/ranch (Acres) 100 Average value of land and buildings (Dollars) 646,727 Total cropland (Acres) 111,609 Irrigated land (Acres) 66,651 Market value of ag products sold ($1,000) 15,962 All crops sold ($1,000) 3,899 All livestock sold ($1,000) 12,063 Total farm production expenses ($1,000) 1/ 17,441 Net cash return from agricultural sales ($1,000) 2,671 Average age of farm/ranch operator (Years) 54.9 Larimer County County 069 ASD 20 Total land area (Square Miles) 2,632 Total land area (Acres) 1,684,320 2002 Census of Agriculture Number of farms and ranches (Number) 1,564 Land in farms and ranches (Acres) 521,599 Average size of farms/ranch (Acres) 334 Median size farm/ranch (Acres) 40 Average value of land and buildings (Dollars) 778,424 Total cropland (Acres) 139,895 Irrigated land (Acres) 58,837 Market value of ag products sold ($1,000) 101,096 All crops sold ($1,000) 32,944 All livestock sold ($1,000) 68,153 Total farm production expenses ($1,000) 1/ 103,680 Net cash return from agricultural sales ($1,000) 124 Average age of farm/ranch operator (Years) 52.9
Acres 2006 crops Harvested Yield Unit Production Barley ... ... Bu. ... Corn for Grain ... ... Bu. ... Dry beans ... ... Cwt. ... Hay, alfalfa ... ... Tons ... Hay, other 200 1.50 Tons 300 Potatoes, all ... ... Cwt. ... Sorghum, grain ... ... Bu. ... Sugarbeets ... ... Tons ... Sunflowers, all ... ... Lbs. ... Wheat, all ... ... Bu. ... January 1, 2007 Inventory Number All cattle and calves ... Beef cows and heifers that have calved ... Milk cows ... Acres 2006 crops Harvested Yield Unit Production Barley ... ... Bu. ... Corn for Grain ... ... Bu. ... Dry beans 400 7.80 Cwt. 3,100 Hay, alfalfa 14,800 2.70 Tons 39,700 Hay, other 15,800 2.25 Tons 35,500 Potatoes, all ... ... Cwt. ... Sorghum, grain ... ... Bu. ... Sugarbeets ... ... Tons ... Sunflowers, all ... ... Lbs. ... Wheat, all 1,700 14.0 Bu. 24,000 January 1, 2007 Inventory Number All cattle and calves 20,500 Beef cows and heifers that have calved 12,000 Milk cows ... Acres 2006 crops Harvested Yield Unit Production Barley 1,400 58.5 Bu. 82,000 Corn for Grain 4,000 137.5 Bu. 550,000 Dry beans 700 20.40 Cwt. 14,300 Hay, alfalfa 18,700 3.20 Tons 59,900 Hay, other 12,700 1.45 Tons 18,200 Potatoes, all ... ... Cwt. ... Sorghum, grain ... ... Bu. ... Sugarbeets 2,700 17.4 Tons 47,000 Sunflowers, all ... ... Lbs. ... Wheat, all 3,800 29.0 Bu. 111,000 January 1, 2007 Inventory Number All cattle and calves 35,000 Beef cows and heifers that have calved 9,000 Milk cows 11,000
Colorado Agricultural Statistics 2007 117
Colorado County Profiles 2006 Las Animas County County 071 ASD 90 Total land area (Square Miles) 4,773 Total land area (Acres) 3,045,893 2002 Census of Agriculture Number of farms and ranches (Number) 567 Land in farms and ranches (Acres) 2,304,766 Average size of farms/ranch (Acres) 4,065 Median size farm/ranch (Acres) 1,000 Average value of land and buildings (Dollars) 988,107 Total cropland (Acres) 202,528 Irrigated land (Acres) 5,333 Market value of ag products sold ($1,000) 20,887 All crops sold ($1,000) 761 All livestock sold ($1,000) 20,126 Total farm production expenses ($1,000) 1/ 20,477 Net cash return from agricultural sales ($1,000) 1,798 Average age of farm/ranch operator (Years) 57.6 Lincoln County County 073 ASD 60 Total land area (Square Miles) 2,585 Total land area (Acres) 1,654,532 2002 Census of Agriculture Number of farms and ranches (Number) 455 Land in farms and ranches (Acres) 1,428,404 Average size of farms/ranch (Acres) 3,139 Median size farm/ranch (Acres) 1,497 Average value of land and buildings (Dollars) 807,513 Total cropland (Acres) 488,304 Irrigated land (Acres) 12,849 Market value of ag products sold ($1,000) 35,609 All crops sold ($1,000) 12,013 All livestock sold ($1,000) 23,596 Total farm production expenses ($1,000) 1/ 38,980 Net cash return from agricultural sales ($1,000) 4,829 Average age of farm/ranch operator (Years) 55.6 Logan County County 075 ASD 20 Total land area (Square Miles) 1,845 Total land area (Acres) 1,180,999 2002 Census of Agriculture Number of farms and ranches (Number) 930 Land in farms and ranches (Acres) 1,111,135 Average size of farms/ranch (Acres) 1,195 Median size farm/ranch (Acres) 608 Average value of land and buildings (Dollars) 643,347 Total cropland (Acres) 570,050 Irrigated land (Acres) 110,569 Market value of ag products sold ($1,000) 350,053 All crops sold ($1,000) 37,734 All livestock sold ($1,000) 312,320 Total farm production expenses ($1,000) 1/ 354,792 Net cash return from agricultural sales ($1,000) 5,092 Average age of farm/ranch operator (Years) 52.8
Acres 2006 crops Harvested Yield Unit Production Barley ... ... Bu. ... Corn for Grain ... ... Bu. ... Dry beans ... ... Cwt. ... Hay, alfalfa 8,800 2.20 Tons 19,200 Hay, other 8,000 2.20 Tons 17,500 Potatoes, all ... ... Cwt. ... Sorghum, grain ... ... Bu. ... Sugarbeets ... ... Tons ... Sunflowers, all ... ... Lbs. ... Wheat, all 800 17.0 Bu. 13,500 January 1, 2007 Inventory Number All cattle and calves 52,000 Beef cows and heifers that have calved 37,000 Milk cows ... Acres 2006 crops Harvested Yield Unit Production Barley ... ... Bu. ... Corn for Grain 11,400 64.0 Bu. 732,000 Dry beans ... ... Cwt. ... Hay, alfalfa 3,200 2.05 Tons 6,500 Hay, other 24,600 1.45 Tons 36,200 Potatoes, all ... ... Cwt. ... Sorghum, grain 2,600 9.0 Bu. 24,000 Sugarbeets ... ... Tons ... Sunflowers, all 4,900 920 Lbs. 4,520,000 Wheat, all 101,600 19.0 Bu. 1,924,000 January 1, 2007 Inventory Number All cattle and calves 42,000 Beef cows and heifers that have calved 24,000 Milk cows ... Acres 2006 crops Harvested Yield Unit Production Barley ... ... Bu. ... Corn for Grain 60,500 130.0 Bu. 7,880,000 Dry beans 2,000 21.00 Cwt. 42,000 Hay, alfalfa 41,500 5.65 Tons 234,600 Hay, other 20,600 2.15 Tons 44,300 Potatoes, all ... ... Cwt. ... Sorghum, grain 300 43.5 Bu. 13,000 Sugarbeets 4,500 20.8 Tons 93,400 Sunflowers, all 1,500 1,175 Lbs. 1,760,000 Wheat, all 122,500 21.0 Bu. 2,565,000 January 1, 2007 Inventory Number All cattle and calves 186,000 Beef cows and heifers that have calved 32,000 Milk cows ...
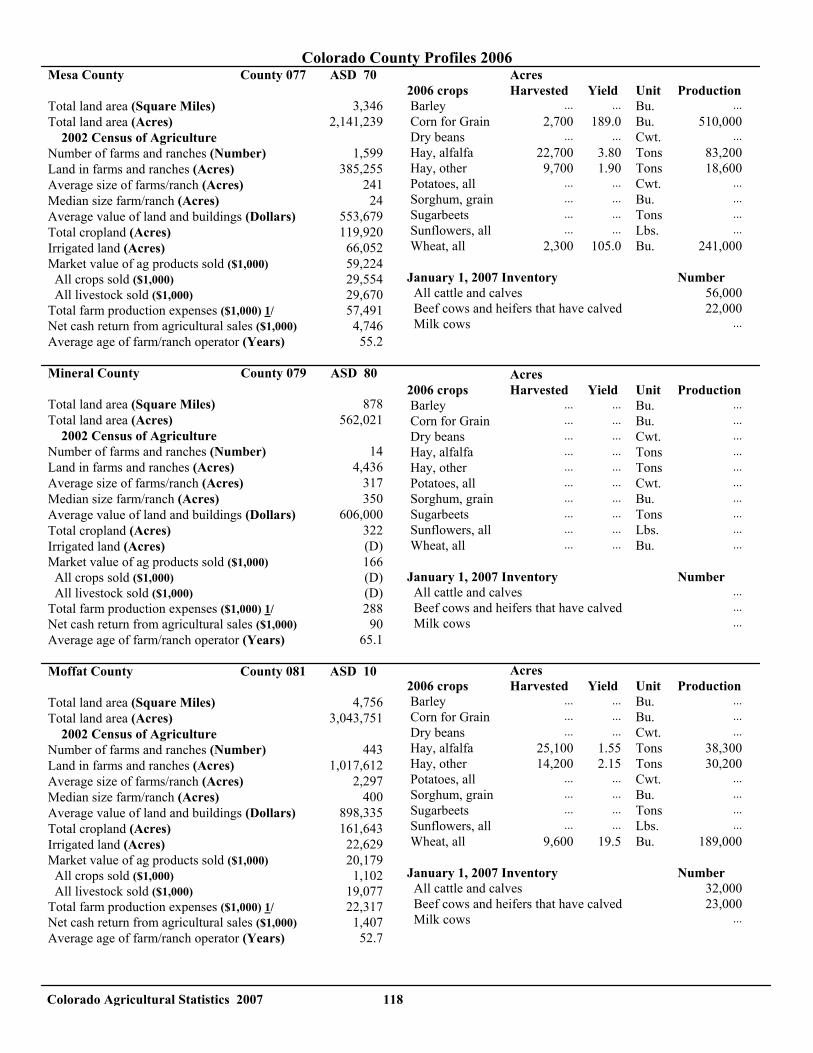
Colorado Agricultural Statistics 2007 118
Colorado County Profiles 2006 Mesa County County 077 ASD 70 Total land area (Square Miles) 3,346 Total land area (Acres) 2,141,239 2002 Census of Agriculture Number of farms and ranches (Number) 1,599 Land in farms and ranches (Acres) 385,255 Average size of farms/ranch (Acres) 241 Median size farm/ranch (Acres) 24 Average value of land and buildings (Dollars) 553,679 Total cropland (Acres) 119,920 Irrigated land (Acres) 66,052 Market value of ag products sold ($1,000) 59,224 All crops sold ($1,000) 29,554 All livestock sold ($1,000) 29,670 Total farm production expenses ($1,000) 1/ 57,491 Net cash return from agricultural sales ($1,000) 4,746 Average age of farm/ranch operator (Years) 55.2 Mineral County County 079 ASD 80 Total land area (Square Miles) 878 Total land area (Acres) 562,021 2002 Census of Agriculture Number of farms and ranches (Number) 14 Land in farms and ranches (Acres) 4,436 Average size of farms/ranch (Acres) 317 Median size farm/ranch (Acres) 350 Average value of land and buildings (Dollars) 606,000 Total cropland (Acres) 322 Irrigated land (Acres) (D) Market value of ag products sold ($1,000) 166 All crops sold ($1,000) (D) All livestock sold ($1,000) (D) Total farm production expenses ($1,000) 1/ 288 Net cash return from agricultural sales ($1,000) 90 Average age of farm/ranch operator (Years) 65.1 Moffat County County 081 ASD 10 Total land area (Square Miles) 4,756 Total land area (Acres) 3,043,751 2002 Census of Agriculture Number of farms and ranches (Number) 443 Land in farms and ranches (Acres) 1,017,612 Average size of farms/ranch (Acres) 2,297 Median size farm/ranch (Acres) 400 Average value of land and buildings (Dollars) 898,335 Total cropland (Acres) 161,643 Irrigated land (Acres) 22,629 Market value of ag products sold ($1,000) 20,179 All crops sold ($1,000) 1,102 All livestock sold ($1,000) 19,077 Total farm production expenses ($1,000) 1/ 22,317 Net cash return from agricultural sales ($1,000) 1,407 Average age of farm/ranch operator (Years) 52.7
Acres 2006 crops Harvested Yield Unit Production Barley ... ... Bu. ... Corn for Grain 2,700 189.0 Bu. 510,000 Dry beans ... ... Cwt. ... Hay, alfalfa 22,700 3.80 Tons 83,200 Hay, other 9,700 1.90 Tons 18,600 Potatoes, all ... ... Cwt. ... Sorghum, grain ... ... Bu. ... Sugarbeets ... ... Tons ... Sunflowers, all ... ... Lbs. ... Wheat, all 2,300 105.0 Bu. 241,000 January 1, 2007 Inventory Number All cattle and calves 56,000 Beef cows and heifers that have calved 22,000 Milk cows ... Acres 2006 crops Harvested Yield Unit Production Barley ... ... Bu. ... Corn for Grain ... ... Bu. ... Dry beans ... ... Cwt. ... Hay, alfalfa ... ... Tons ... Hay, other ... ... Tons ... Potatoes, all ... ... Cwt. ... Sorghum, grain ... ... Bu. ... Sugarbeets ... ... Tons ... Sunflowers, all ... ... Lbs. ... Wheat, all ... ... Bu. ... January 1, 2007 Inventory Number All cattle and calves ... Beef cows and heifers that have calved ... Milk cows ... Acres 2006 crops Harvested Yield Unit Production Barley ... ... Bu. ... Corn for Grain ... ... Bu. ... Dry beans ... ... Cwt. ... Hay, alfalfa 25,100 1.55 Tons 38,300 Hay, other 14,200 2.15 Tons 30,200 Potatoes, all ... ... Cwt. ... Sorghum, grain ... ... Bu. ... Sugarbeets ... ... Tons ... Sunflowers, all ... ... Lbs. ... Wheat, all 9,600 19.5 Bu. 189,000 January 1, 2007 Inventory Number All cattle and calves 32,000 Beef cows and heifers that have calved 23,000 Milk cows ...

Colorado Agricultural Statistics 2007 119
Colorado County Profiles 2006 Montezuma County County 083 ASD 70 Total land area (Square Miles) 2,036 Total land area (Acres) 1,302,912 2002 Census of Agriculture Number of farms and ranches (Number) 829 Land in farms and ranches (Acres) 818,677 Average size of farms/ranch (Acres) 988 Median size farm/ranch (Acres) 105 Average value of land and buildings (Dollars) 536,563 Total cropland (Acres) 118,944 Irrigated land (Acres) 48,703 Market value of ag products sold ($1,000) 14,521 All crops sold ($1,000) 6,463 All livestock sold ($1,000) 8,058 Total farm production expenses ($1,000) 1/ 18,586 Net cash return from agricultural sales ($1,000) (2,661) Average age of farm/ranch operator (Years) 56.0 Montrose County County 085 ASD 70 Total land area (Square Miles) 2,246 Total land area (Acres) 1,437,712 2002 Census of Agriculture Number of farms and ranches (Number) 915 Land in farms and ranches (Acres) 334,747 Average size of farms/ranch (Acres) 366 Median size farm/ranch (Acres) 73 Average value of land and buildings (Dollars) 497,854 Total cropland (Acres) 106,613 Irrigated land (Acres) 75,459 Market value of ag products sold ($1,000) 57,991 All crops sold ($1,000) 21,039 All livestock sold ($1,000) 36,952 Total farm production expenses ($1,000) 1/ 46,368 Net cash return from agricultural sales ($1,000) 15,237 Average age of farm/ranch operator (Years) 55.1 Morgan County County 087 ASD 70 Total land area (Square Miles) 1,294 Total land area (Acres) 828,048 2002 Census of Agriculture Number of farms and ranches (Number) 761 Land in farms and ranches (Acres) 757,946 Average size of farms/ranch (Acres) 996 Median size farm/ranch (Acres) 385 Average value of land and buildings (Dollars) 810,693 Total cropland (Acres) 384,284 Irrigated land (Acres) 133,513 Market value of ag products sold ($1,000) 447,963 All crops sold ($1,000) 62,626 All livestock sold ($1,000) 385,337 Total farm production expenses ($1,000) 1/ 434,832 Net cash return from agricultural sales ($1,000) 18,627 Average age of farm/ranch operator (Years) 52.9
Acres 2006 crops Harvested Yield Unit Production Barley ... ... Bu. ... Corn for Grain 1,500 168.0 Bu. 252,000 Dry beans 8,200 8.30 Cwt. 68,400 Hay, alfalfa 26,800 3.30 Tons 88,600 Hay, other 6,300 2.15 Tons 13,400 Potatoes, all ... ... Cwt. ... Sorghum, grain ... ... Bu. ... Sugarbeets ... ... Tons ... Sunflowers, all ... ... Lbs. ... Wheat, all 5,000 20.5 Bu. 103,000 January 1, 2007 Inventory Number All cattle and calves 16,000 Beef cows and heifers that have calved 11,000 Milk cows ... Acres 2006 crops Harvested Yield Unit Production Barley 500 90.0 Bu. 45,000 Corn for Grain 5,500 180.0 Bu. 990,000 Dry beans 4,600 23.50 Cwt. 108,000 Hay, alfalfa 20,900 4.10 Tons 86,200 Hay, other 12,300 2.45 Tons 30,200 Potatoes, all ... ... Cwt. ... Sorghum, grain ... ... Bu. ... Sugarbeets ... ... Tons ... Sunflowers, all ... ... Lbs. ... Wheat, all 300 73.5 Bu. 22,000 January 1, 2007 Inventory Number All cattle and calves 45,000 Beef cows and heifers that have calved 18,000 Milk cows ... Acres 2006 crops Harvested Yield Unit Production Barley ... ... Bu. ... Corn for Grain 47,300 198.0 Bu. 9,360,000 Dry beans 1,100 19.70 Cwt. 21,700 Hay, alfalfa 29,200 4.40 Tons 128,100 Hay, other 14,000 1.65 Tons 23,300 Potatoes, all ... ... Cwt. ... Sorghum, grain ... ... Bu. ... Sugarbeets 2,300 25.9 Tons 59,500 Sunflowers, all ... ... Lbs. ... Wheat, all 58,600 33.5 Bu. 1,972,000 January 1, 2007 Inventory Number All cattle and calves 268,000 Beef cows and heifers that have calved 28,000 Milk cows 20,000
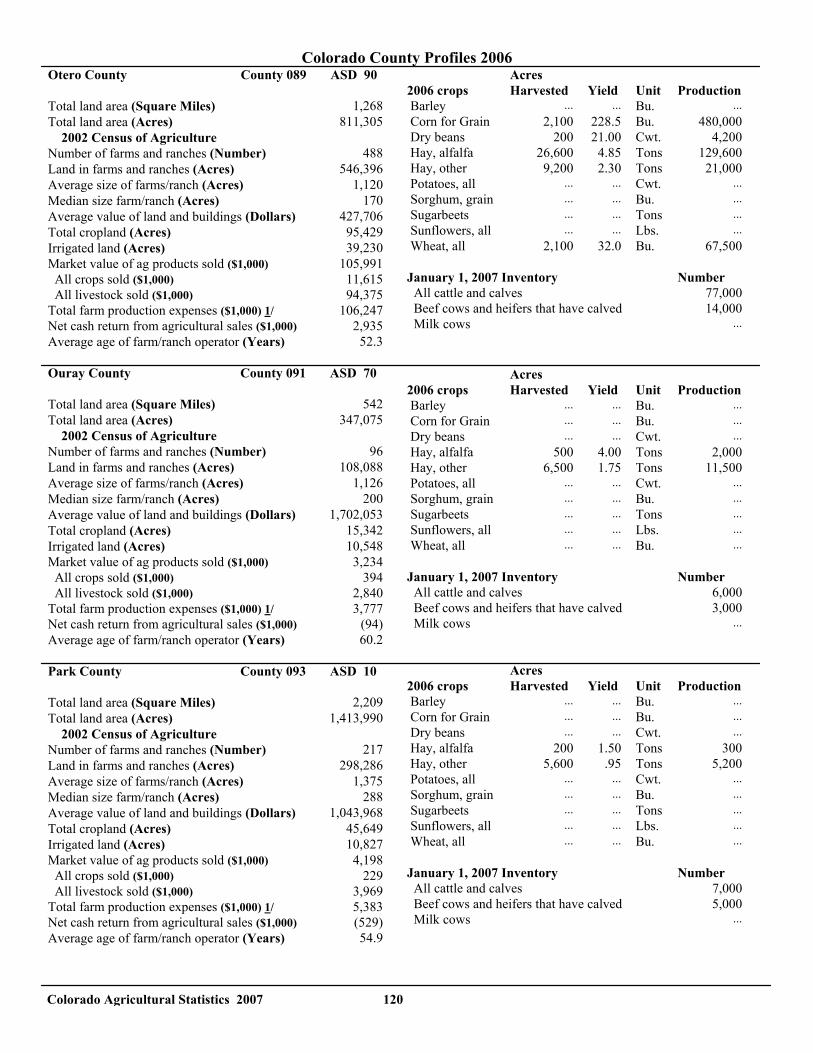
Colorado Agricultural Statistics 2007 120
Colorado County Profiles 2006 Otero County County 089 ASD 90 Total land area (Square Miles) 1,268 Total land area (Acres) 811,305 2002 Census of Agriculture Number of farms and ranches (Number) 488 Land in farms and ranches (Acres) 546,396 Average size of farms/ranch (Acres) 1,120 Median size farm/ranch (Acres) 170 Average value of land and buildings (Dollars) 427,706 Total cropland (Acres) 95,429 Irrigated land (Acres) 39,230 Market value of ag products sold ($1,000) 105,991 All crops sold ($1,000) 11,615 All livestock sold ($1,000) 94,375 Total farm production expenses ($1,000) 1/ 106,247 Net cash return from agricultural sales ($1,000) 2,935 Average age of farm/ranch operator (Years) 52.3 Ouray County County 091 ASD 70 Total land area (Square Miles) 542 Total land area (Acres) 347,075 2002 Census of Agriculture Number of farms and ranches (Number) 96 Land in farms and ranches (Acres) 108,088 Average size of farms/ranch (Acres) 1,126 Median size farm/ranch (Acres) 200 Average value of land and buildings (Dollars) 1,702,053 Total cropland (Acres) 15,342 Irrigated land (Acres) 10,548 Market value of ag products sold ($1,000) 3,234 All crops sold ($1,000) 394 All livestock sold ($1,000) 2,840 Total farm production expenses ($1,000) 1/ 3,777 Net cash return from agricultural sales ($1,000) (94) Average age of farm/ranch operator (Years) 60.2 Park County County 093 ASD 10 Total land area (Square Miles) 2,209 Total land area (Acres) 1,413,990 2002 Census of Agriculture Number of farms and ranches (Number) 217 Land in farms and ranches (Acres) 298,286 Average size of farms/ranch (Acres) 1,375 Median size farm/ranch (Acres) 288 Average value of land and buildings (Dollars) 1,043,968 Total cropland (Acres) 45,649 Irrigated land (Acres) 10,827 Market value of ag products sold ($1,000) 4,198 All crops sold ($1,000) 229 All livestock sold ($1,000) 3,969 Total farm production expenses ($1,000) 1/ 5,383 Net cash return from agricultural sales ($1,000) (529) Average age of farm/ranch operator (Years) 54.9
Acres 2006 crops Harvested Yield Unit Production Barley ... ... Bu. ... Corn for Grain 2,100 228.5 Bu. 480,000 Dry beans 200 21.00 Cwt. 4,200 Hay, alfalfa 26,600 4.85 Tons 129,600 Hay, other 9,200 2.30 Tons 21,000 Potatoes, all ... ... Cwt. ... Sorghum, grain ... ... Bu. ... Sugarbeets ... ... Tons ... Sunflowers, all ... ... Lbs. ... Wheat, all 2,100 32.0 Bu. 67,500 January 1, 2007 Inventory Number All cattle and calves 77,000 Beef cows and heifers that have calved 14,000 Milk cows ... Acres 2006 crops Harvested Yield Unit Production Barley ... ... Bu. ... Corn for Grain ... ... Bu. ... Dry beans ... ... Cwt. ... Hay, alfalfa 500 4.00 Tons 2,000 Hay, other 6,500 1.75 Tons 11,500 Potatoes, all ... ... Cwt. ... Sorghum, grain ... ... Bu. ... Sugarbeets ... ... Tons ... Sunflowers, all ... ... Lbs. ... Wheat, all ... ... Bu. ... January 1, 2007 Inventory Number All cattle and calves 6,000 Beef cows and heifers that have calved 3,000 Milk cows ... Acres 2006 crops Harvested Yield Unit Production Barley ... ... Bu. ... Corn for Grain ... ... Bu. ... Dry beans ... ... Cwt. ... Hay, alfalfa 200 1.50 Tons 300 Hay, other 5,600 .95 Tons 5,200 Potatoes, all ... ... Cwt. ... Sorghum, grain ... ... Bu. ... Sugarbeets ... ... Tons ... Sunflowers, all ... ... Lbs. ... Wheat, all ... ... Bu. ... January 1, 2007 Inventory Number All cattle and calves 7,000 Beef cows and heifers that have calved 5,000 Milk cows ...

Colorado Agricultural Statistics 2007 121
Colorado County Profiles 2006 Phillips County County 001 ASD 60 Total land area (Square Miles) 688 Total land area (Acres) 440,517 2002 Census of Agriculture Number of farms and ranches (Number) 334 Land in farms and ranches (Acres) 470,837 Average size of farms/ranch (Acres) 1,410 Median size farm/ranch (Acres) 1,000 Average value of land and buildings (Dollars) 967,807 Total cropland (Acres) 387,974 Irrigated land (Acres) 83,905 Market value of ag products sold ($1,000) 89,282 All crops sold ($1,000) 43,250 All livestock sold ($1,000) 46,032 Total farm production expenses ($1,000) 1/ 83,394 Net cash return from agricultural sales ($1,000) 13,313 Average age of farm/ranch operator (Years) 53.4 Pitkin County County 003 ASD 80 Total land area (Square Miles) 970 Total land area (Acres) 621,036 2002 Census of Agriculture Number of farms and ranches (Number) 84 Land in farms and ranches (Acres) 23,872 Average size of farms/ranch (Acres) 284 Median size farm/ranch (Acres) 75 Average value of land and buildings (Dollars) 1,656,060 Total cropland (Acres) 4,913 Irrigated land (Acres) 6,374 Market value of ag products sold ($1,000) 754 All crops sold ($1,000) 218 All livestock sold ($1,000) 536 Total farm production expenses ($1,000) 1/ 3,174 Net cash return from agricultural sales ($1,000) (2,277) Average age of farm/ranch operator (Years) 56.1 Prowers County County 005 ASD 60 Total land area (Square Miles) 1,645 Total land area (Acres) 1,053,037 2002 Census of Agriculture Number of farms and ranches (Number) 531 Land in farms and ranches (Acres) 861,778 Average size of farms/ranch (Acres) 1,623 Median size farm/ranch (Acres) 640 Average value of land and buildings (Dollars) 690,699 Total cropland (Acres) 533,069 Irrigated land (Acres) 94,175 Market value of ag products sold ($1,000) 182,545 All crops sold ($1,000) 27,524 All livestock sold ($1,000) 155,051 Total farm production expenses ($1,000) 1/ 182,192 Net cash return from agricultural sales ($1,000) 8,467 Average age of farm/ranch operator (Years) 53.3
Acres 2006 crops Harvested Yield Unit Production Barley ... ... Bu. ... Corn for Grain 93,000 141.0 Bu. 13,095,000 Dry beans 4,200 23.30 Cwt. 98,000 Hay, alfalfa ... ... Tons ... Hay, other ... ... Tons ... Potatoes, all ... ... Cwt. ... Sorghum, grain ... ... Bu. ... Sugarbeets 4,000 27.7 Tons 110,800 Sunflowers, all 2,900 1,655 Lbs. 4,800,000 Wheat, all 87,900 20.0 Bu. 1,748,000 January 1, 2007 Inventory Number All cattle and calves 32,500 Beef cows and heifers that have calved 4,000 Milk cows ... Acres 2006 crops Harvested Yield Unit Production Barley ... ... Bu. ... Corn for Grain ... ... Bu. ... Dry beans ... ... Cwt. ... Hay, alfalfa 1,900 2.60 Tons 4,900 Hay, other 2,100 1.45 Tons 3,000 Potatoes, all ... ... Cwt. ... Sorghum, grain ... ... Bu. ... Sugarbeets ... ... Tons ... Sunflowers, all ... ... Lbs. ... Wheat, all ... ... Bu. ... January 1, 2007 Inventory Number All cattle and calves 1,500 Beef cows and heifers that have calved 1,000 Milk cows ... Acres 2006 crops Harvested Yield Unit Production Barley ... ... Bu. ... Corn for Grain 8,100 145.0 Bu. 1,174,000 Dry beans ... ... Cwt. ... Hay, alfalfa 55,300 4.25 Tons 233,700 Hay, other 17,900 2.45 Tons 44,000 Potatoes, all ... ... Cwt. ... Sorghum, grain ... ... Bu. ... Sugarbeets ... ... Tons ... Sunflowers, all 1,100 635 Lbs. 700,000 Wheat, all 100,700 22.0 Bu. 2,200,000 January 1, 2007 Inventory Number All cattle and calves 119,000 Beef cows and heifers that have calved 16,000 Milk cows ...

Colorado Agricultural Statistics 2007 122
Colorado County Profiles 2006 Pueblo County County 101 ASD 90 Total land area (Square Miles) 2,397 Total land area (Acres) 1,533,931 2002 Census of Agriculture Number of farms and ranches (Number) 801 Land in farms and ranches (Acres) 774,352 Average size of farms/ranch (Acres) 967 Median size farm/ranch (Acres) 175 Average value of land and buildings (Dollars) 626,878 Total cropland (Acres) 117,556 Irrigated land (Acres) 24,734 Market value of ag products sold ($1,000) 41,652 All crops sold ($1,000) 11,081 All livestock sold ($1,000) 30,571 Total farm production expenses ($1,000) 1/ 43,504 Net cash return from agricultural sales ($1,000) 5,788 Average age of farm/ranch operator (Years) 55.5 Rio Blanco County County 103 ASD 10 Total land area (Square Miles) 3,226 Total land area (Acres) 2,064,791 2002 Census of Agriculture Number of farms and ranches (Number) 245 Land in farms and ranches (Acres) 376,509 Average size of farms/ranch (Acres) 1,537 Median size farm/ranch (Acres) 305 Average value of land and buildings (Dollars) 1,207,896 Total cropland (Acres) 73,167 Irrigated land (Acres) 23,239 Market value of ag products sold ($1,000) 12,921 All crops sold ($1,000) 1,111 All livestock sold ($1,000) 11,810 Total farm production expenses ($1,000) 1/ 14,035 Net cash return from agricultural sales ($1,000) 2,081 Average age of farm/ranch operator (Years) 56.5 Rio Grande County County 105 ASD 80 Total land area (Square Miles) 913 Total land area (Acres) 584,382 2002 Census of Agriculture Number of farms and ranches (Number) 344 Land in farms and ranches (Acres) 170,999 Average size of farms/ranch (Acres) 497 Median size farm/ranch (Acres) 280 Average value of land and buildings (Dollars) 899,346 Total cropland (Acres) 110,868 Irrigated land (Acres) 89,241 Market value of ag products sold ($1,000) 74,483 All crops sold ($1,000) 68,833 All livestock sold ($1,000) 5,650 Total farm production expenses ($1,000) 1/ 53,789 Net cash return from agricultural sales ($1,000) 25,647 Average age of farm/ranch operator (Years) 54.2
Acres 2006 crops Harvested Yield Unit Production Barley ... ... Bu. ... Corn for Grain 1,500 204.5 Bu. 307,000 Dry beans 1,200 23.20 Cwt. 27,800 Hay, alfalfa 8,900 3.90 Tons 34,700 Hay, other 10,800 2.55 Tons 27,400 Potatoes, all ... ... Cwt. ... Sorghum, grain ... ... Bu. ... Sugarbeets ... ... Tons ... Sunflowers, all ... ... Lbs. ... Wheat, all 1,100 21.0 Bu. 23,000 January 1, 2007 Inventory Number All cattle and calves 37,000 Beef cows and heifers that have calved 21,000 Milk cows ... Acres 2006 crops Harvested Yield Unit Production Barley ... ... Bu. ... Corn for Grain ... ... Bu. ... Dry beans ... ... Cwt. ... Hay, alfalfa 6,800 2.50 Tons 17,000 Hay, other 21,100 2.45 Tons 51,300 Potatoes, all ... ... Cwt. ... Sorghum, grain ... ... Bu. ... Sugarbeets ... ... Tons ... Sunflowers, all ... ... Lbs. ... Wheat, all ... ... Bu. ...
January 1, 2007 Inventory Number All cattle and calves 25,000 Beef cows and heifers that have calved 17,000 Milk cows ... Acres 2006 crops Harvested Yield Unit Production Barley 7,800 157.0 Bu. 1,225,000 Corn for Grain ... ... Bu. ... Dry beans ... ... Cwt. ... Hay, alfalfa 32,300 3.80 Tons 123,400 Hay, other 17,900 2.55 Tons 45,700 Potatoes, all 20,500 385 Cwt. 7,920,000 Sorghum, grain ... ... Bu. ... Sugarbeets ... ... Tons ... Sunflowers, all ... ... Lbs. ... Wheat, all 3,200 112.0 Bu. 359,000 January 1, 2007 Inventory Number All cattle and calves 13,500 Beef cows and heifers that have calved 9,000 Milk cows ...
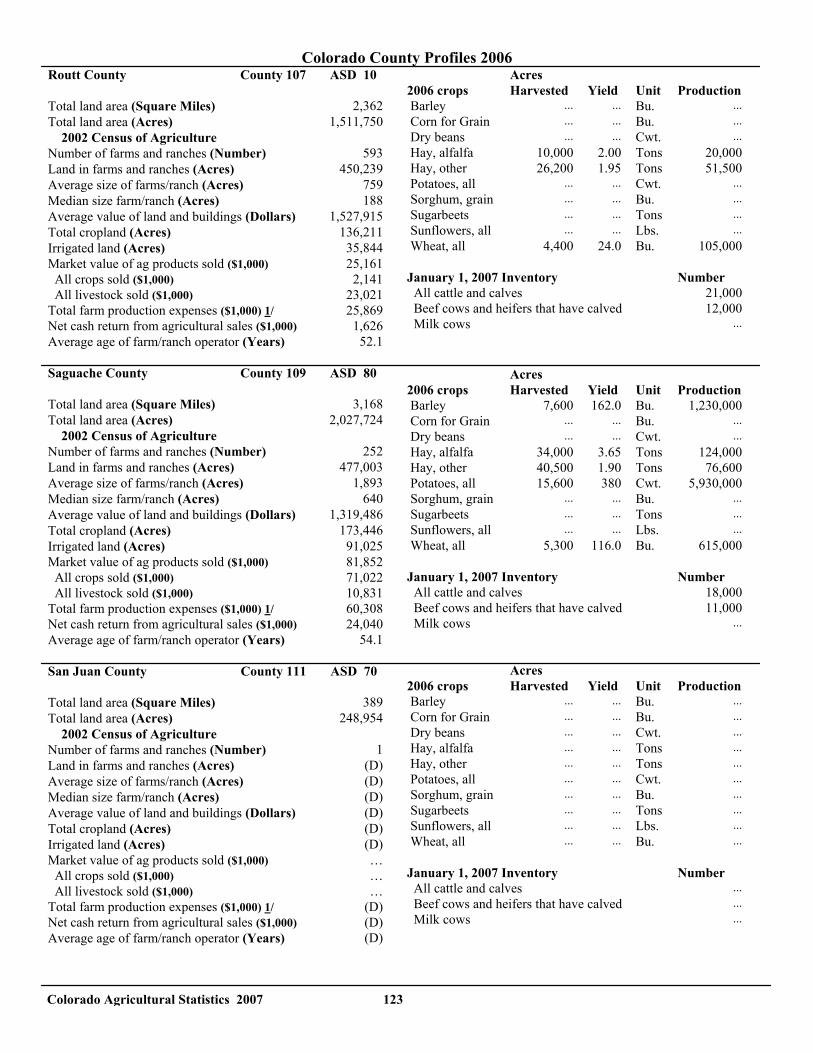
Colorado Agricultural Statistics 2007 123
Colorado County Profiles 2006 Routt County County 107 ASD 10 Total land area (Square Miles) 2,362 Total land area (Acres) 1,511,750 2002 Census of Agriculture Number of farms and ranches (Number) 593 Land in farms and ranches (Acres) 450,239 Average size of farms/ranch (Acres) 759 Median size farm/ranch (Acres) 188 Average value of land and buildings (Dollars) 1,527,915 Total cropland (Acres) 136,211 Irrigated land (Acres) 35,844 Market value of ag products sold ($1,000) 25,161 All crops sold ($1,000) 2,141 All livestock sold ($1,000) 23,021 Total farm production expenses ($1,000) 1/ 25,869 Net cash return from agricultural sales ($1,000) 1,626 Average age of farm/ranch operator (Years) 52.1 Saguache County County 109 ASD 80 Total land area (Square Miles) 3,168 Total land area (Acres) 2,027,724 2002 Census of Agriculture Number of farms and ranches (Number) 252 Land in farms and ranches (Acres) 477,003 Average size of farms/ranch (Acres) 1,893 Median size farm/ranch (Acres) 640 Average value of land and buildings (Dollars) 1,319,486 Total cropland (Acres) 173,446 Irrigated land (Acres) 91,025 Market value of ag products sold ($1,000) 81,852 All crops sold ($1,000) 71,022 All livestock sold ($1,000) 10,831 Total farm production expenses ($1,000) 1/ 60,308 Net cash return from agricultural sales ($1,000) 24,040 Average age of farm/ranch operator (Years) 54.1 San Juan County County 111 ASD 70 Total land area (Square Miles) 389 Total land area (Acres) 248,954 2002 Census of Agriculture Number of farms and ranches (Number) 1 Land in farms and ranches (Acres) (D) Average size of farms/ranch (Acres) (D) Median size farm/ranch (Acres) (D) Average value of land and buildings (Dollars) (D) Total cropland (Acres) (D) Irrigated land (Acres) (D) Market value of ag products sold ($1,000) … All crops sold ($1,000) … All livestock sold ($1,000) … Total farm production expenses ($1,000) 1/ (D) Net cash return from agricultural sales ($1,000) (D) Average age of farm/ranch operator (Years) (D)
Acres 2006 crops Harvested Yield Unit Production Barley ... ... Bu. ... Corn for Grain ... ... Bu. ... Dry beans ... ... Cwt. ... Hay, alfalfa 10,000 2.00 Tons 20,000 Hay, other 26,200 1.95 Tons 51,500 Potatoes, all ... ... Cwt. ... Sorghum, grain ... ... Bu. ... Sugarbeets ... ... Tons ... Sunflowers, all ... ... Lbs. ... Wheat, all 4,400 24.0 Bu. 105,000 January 1, 2007 Inventory Number All cattle and calves 21,000 Beef cows and heifers that have calved 12,000 Milk cows ... Acres 2006 crops Harvested Yield Unit Production Barley 7,600 162.0 Bu. 1,230,000 Corn for Grain ... ... Bu. ... Dry beans ... ... Cwt. ... Hay, alfalfa 34,000 3.65 Tons 124,000 Hay, other 40,500 1.90 Tons 76,600 Potatoes, all 15,600 380 Cwt. 5,930,000 Sorghum, grain ... ... Bu. ... Sugarbeets ... ... Tons ... Sunflowers, all ... ... Lbs. ... Wheat, all 5,300 116.0 Bu. 615,000 January 1, 2007 Inventory Number All cattle and calves 18,000 Beef cows and heifers that have calved 11,000 Milk cows ... Acres 2006 crops Harvested Yield Unit Production Barley ... ... Bu. ... Corn for Grain ... ... Bu. ... Dry beans ... ... Cwt. ... Hay, alfalfa ... ... Tons ... Hay, other ... ... Tons ... Potatoes, all ... ... Cwt. ... Sorghum, grain ... ... Bu. ... Sugarbeets ... ... Tons ... Sunflowers, all ... ... Lbs. ... Wheat, all ... ... Bu. ... January 1, 2007 Inventory Number All cattle and calves ... Beef cows and heifers that have calved ... Milk cows ...
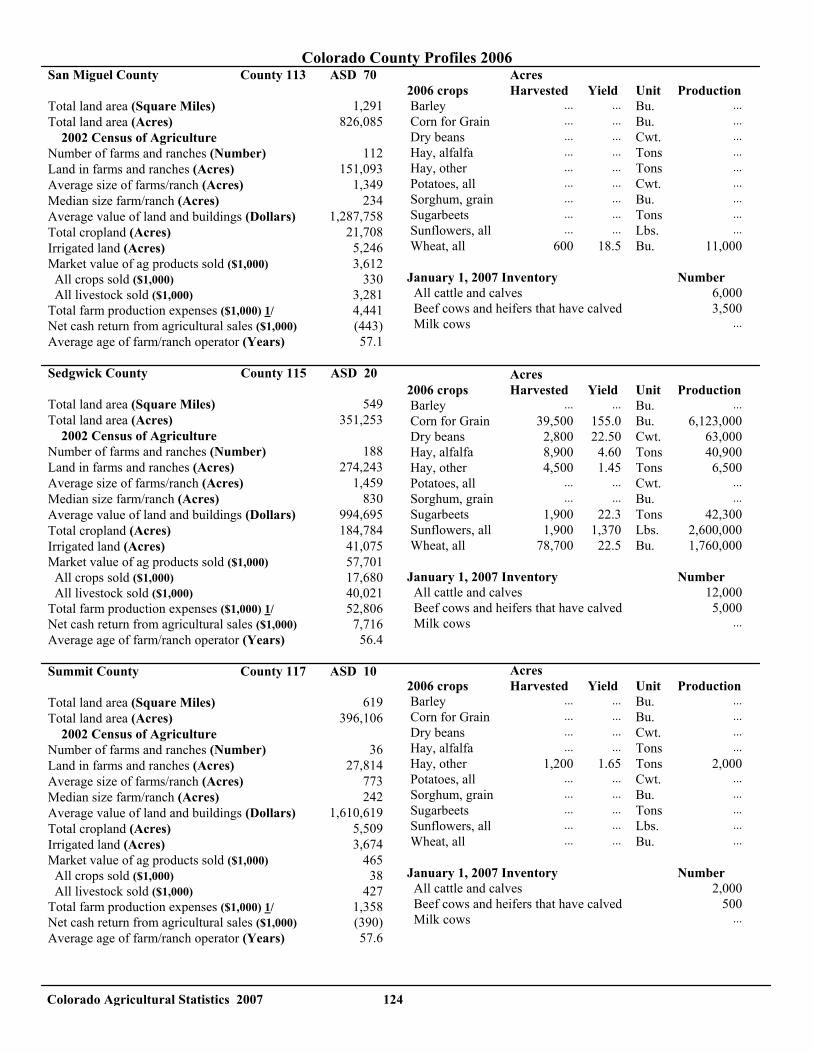
Colorado Agricultural Statistics 2007 124
Colorado County Profiles 2006 San Miguel County County 113 ASD 70 Total land area (Square Miles) 1,291 Total land area (Acres) 826,085 2002 Census of Agriculture Number of farms and ranches (Number) 112 Land in farms and ranches (Acres) 151,093 Average size of farms/ranch (Acres) 1,349 Median size farm/ranch (Acres) 234 Average value of land and buildings (Dollars) 1,287,758 Total cropland (Acres) 21,708 Irrigated land (Acres) 5,246 Market value of ag products sold ($1,000) 3,612 All crops sold ($1,000) 330 All livestock sold ($1,000) 3,281 Total farm production expenses ($1,000) 1/ 4,441 Net cash return from agricultural sales ($1,000) (443) Average age of farm/ranch operator (Years) 57.1 Sedgwick County County 115 ASD 20 Total land area (Square Miles) 549 Total land area (Acres) 351,253 2002 Census of Agriculture Number of farms and ranches (Number) 188 Land in farms and ranches (Acres) 274,243 Average size of farms/ranch (Acres) 1,459 Median size farm/ranch (Acres) 830 Average value of land and buildings (Dollars) 994,695 Total cropland (Acres) 184,784 Irrigated land (Acres) 41,075 Market value of ag products sold ($1,000) 57,701 All crops sold ($1,000) 17,680 All livestock sold ($1,000) 40,021 Total farm production expenses ($1,000) 1/ 52,806 Net cash return from agricultural sales ($1,000) 7,716 Average age of farm/ranch operator (Years) 56.4 Summit County County 117 ASD 10 Total land area (Square Miles) 619 Total land area (Acres) 396,106 2002 Census of Agriculture Number of farms and ranches (Number) 36 Land in farms and ranches (Acres) 27,814 Average size of farms/ranch (Acres) 773 Median size farm/ranch (Acres) 242 Average value of land and buildings (Dollars) 1,610,619 Total cropland (Acres) 5,509 Irrigated land (Acres) 3,674 Market value of ag products sold ($1,000) 465 All crops sold ($1,000) 38 All livestock sold ($1,000) 427 Total farm production expenses ($1,000) 1/ 1,358 Net cash return from agricultural sales ($1,000) (390) Average age of farm/ranch operator (Years) 57.6
Acres 2006 crops Harvested Yield Unit Production Barley ... ... Bu. ... Corn for Grain ... ... Bu. ... Dry beans ... ... Cwt. ... Hay, alfalfa ... ... Tons ... Hay, other ... ... Tons ... Potatoes, all ... ... Cwt. ... Sorghum, grain ... ... Bu. ... Sugarbeets ... ... Tons ... Sunflowers, all ... ... Lbs. ... Wheat, all 600 18.5 Bu. 11,000 January 1, 2007 Inventory Number All cattle and calves 6,000 Beef cows and heifers that have calved 3,500 Milk cows ... Acres 2006 crops Harvested Yield Unit Production Barley ... ... Bu. ... Corn for Grain 39,500 155.0 Bu. 6,123,000 Dry beans 2,800 22.50 Cwt. 63,000 Hay, alfalfa 8,900 4.60 Tons 40,900 Hay, other 4,500 1.45 Tons 6,500 Potatoes, all ... ... Cwt. ... Sorghum, grain ... ... Bu. ... Sugarbeets 1,900 22.3 Tons 42,300 Sunflowers, all 1,900 1,370 Lbs. 2,600,000 Wheat, all 78,700 22.5 Bu. 1,760,000 January 1, 2007 Inventory Number All cattle and calves 12,000 Beef cows and heifers that have calved 5,000 Milk cows ... Acres 2006 crops Harvested Yield Unit Production Barley ... ... Bu. ... Corn for Grain ... ... Bu. ... Dry beans ... ... Cwt. ... Hay, alfalfa ... ... Tons ... Hay, other 1,200 1.65 Tons 2,000 Potatoes, all ... ... Cwt. ... Sorghum, grain ... ... Bu. ... Sugarbeets ... ... Tons ... Sunflowers, all ... ... Lbs. ... Wheat, all ... ... Bu. ... January 1, 2007 Inventory Number All cattle and calves 2,000 Beef cows and heifers that have calved 500 Milk cows ...
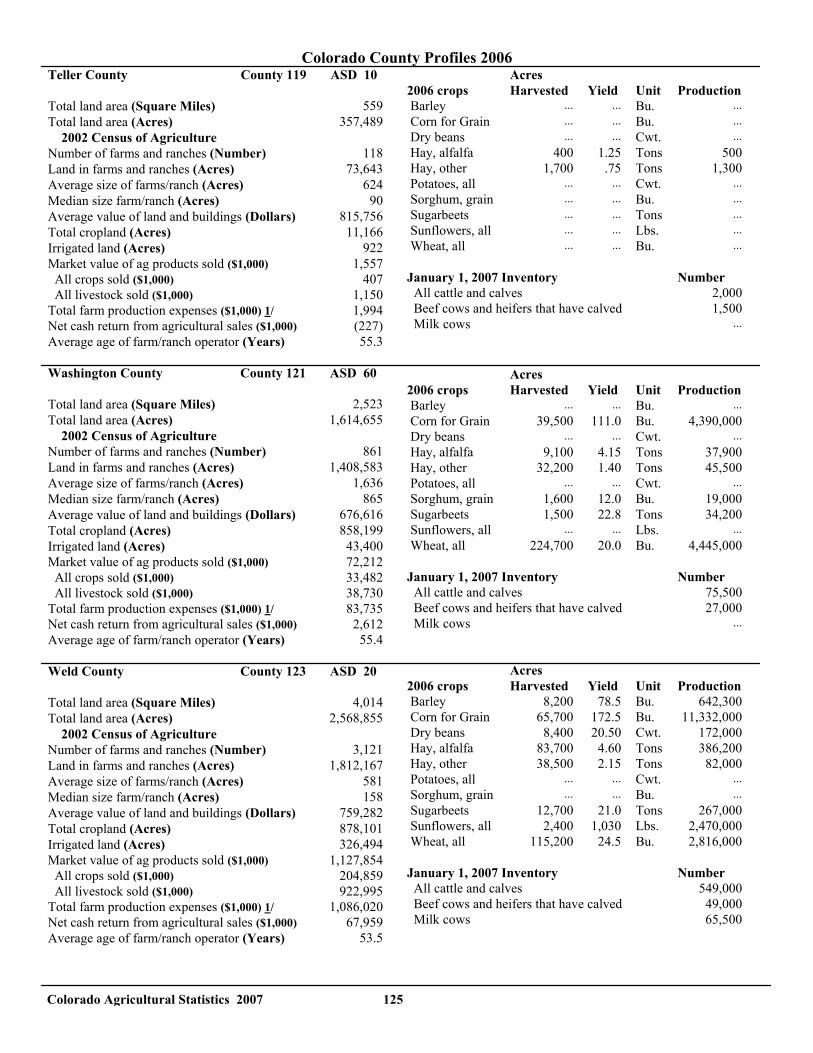
Colorado Agricultural Statistics 2007 125
Colorado County Profiles 2006 Teller County County 119 ASD 10 Total land area (Square Miles) 559 Total land area (Acres) 357,489 2002 Census of Agriculture Number of farms and ranches (Number) 118 Land in farms and ranches (Acres) 73,643 Average size of farms/ranch (Acres) 624 Median size farm/ranch (Acres) 90 Average value of land and buildings (Dollars) 815,756 Total cropland (Acres) 11,166 Irrigated land (Acres) 922 Market value of ag products sold ($1,000) 1,557 All crops sold ($1,000) 407 All livestock sold ($1,000) 1,150 Total farm production expenses ($1,000) 1/ 1,994 Net cash return from agricultural sales ($1,000) (227) Average age of farm/ranch operator (Years) 55.3 Washington County County 121 ASD 60 Total land area (Square Miles) 2,523 Total land area (Acres) 1,614,655 2002 Census of Agriculture Number of farms and ranches (Number) 861 Land in farms and ranches (Acres) 1,408,583 Average size of farms/ranch (Acres) 1,636 Median size farm/ranch (Acres) 865 Average value of land and buildings (Dollars) 676,616 Total cropland (Acres) 858,199 Irrigated land (Acres) 43,400 Market value of ag products sold ($1,000) 72,212 All crops sold ($1,000) 33,482 All livestock sold ($1,000) 38,730 Total farm production expenses ($1,000) 1/ 83,735 Net cash return from agricultural sales ($1,000) 2,612 Average age of farm/ranch operator (Years) 55.4 Weld County County 123 ASD 20 Total land area (Square Miles) 4,014 Total land area (Acres) 2,568,855 2002 Census of Agriculture Number of farms and ranches (Number) 3,121 Land in farms and ranches (Acres) 1,812,167 Average size of farms/ranch (Acres) 581 Median size farm/ranch (Acres) 158 Average value of land and buildings (Dollars) 759,282 Total cropland (Acres) 878,101 Irrigated land (Acres) 326,494 Market value of ag products sold ($1,000) 1,127,854 All crops sold ($1,000) 204,859 All livestock sold ($1,000) 922,995 Total farm production expenses ($1,000) 1/ 1,086,020 Net cash return from agricultural sales ($1,000) 67,959 Average age of farm/ranch operator (Years) 53.5
Acres 2006 crops Harvested Yield Unit Production Barley ... ... Bu. ... Corn for Grain ... ... Bu. ... Dry beans ... ... Cwt. ... Hay, alfalfa 400 1.25 Tons 500 Hay, other 1,700 .75 Tons 1,300 Potatoes, all ... ... Cwt. ... Sorghum, grain ... ... Bu. ... Sugarbeets ... ... Tons ... Sunflowers, all ... ... Lbs. ... Wheat, all ... ... Bu. ...
January 1, 2007 Inventory Number All cattle and calves 2,000 Beef cows and heifers that have calved 1,500 Milk cows ... Acres 2006 crops Harvested Yield Unit Production Barley ... ... Bu. ... Corn for Grain 39,500 111.0 Bu. 4,390,000 Dry beans ... ... Cwt. ... Hay, alfalfa 9,100 4.15 Tons 37,900 Hay, other 32,200 1.40 Tons 45,500 Potatoes, all ... ... Cwt. ... Sorghum, grain 1,600 12.0 Bu. 19,000 Sugarbeets 1,500 22.8 Tons 34,200 Sunflowers, all ... ... Lbs. ... Wheat, all 224,700 20.0 Bu. 4,445,000
January 1, 2007 Inventory Number All cattle and calves 75,500 Beef cows and heifers that have calved 27,000 Milk cows ... Acres 2006 crops Harvested Yield Unit Production Barley 8,200 78.5 Bu. 642,300 Corn for Grain 65,700 172.5 Bu. 11,332,000 Dry beans 8,400 20.50 Cwt. 172,000 Hay, alfalfa 83,700 4.60 Tons 386,200 Hay, other 38,500 2.15 Tons 82,000 Potatoes, all ... ... Cwt. ... Sorghum, grain ... ... Bu. ... Sugarbeets 12,700 21.0 Tons 267,000 Sunflowers, all 2,400 1,030 Lbs. 2,470,000 Wheat, all 115,200 24.5 Bu. 2,816,000 January 1, 2007 Inventory Number All cattle and calves 549,000 Beef cows and heifers that have calved 49,000 Milk cows 65,500
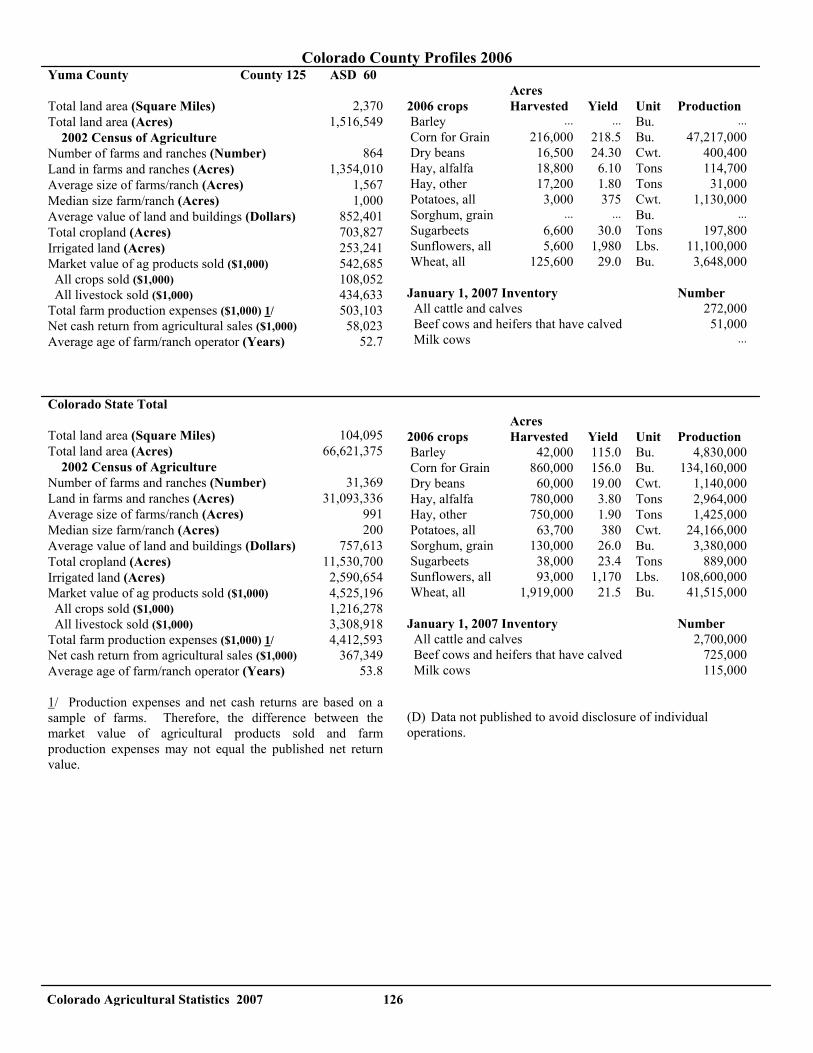
Colorado Agricultural Statistics 2007 126
Colorado County Profiles 2006 Yuma County County 125 ASD 60 Total land area (Square Miles) 2,370 Total land area (Acres) 1,516,549 2002 Census of Agriculture Number of farms and ranches (Number) 864 Land in farms and ranches (Acres) 1,354,010 Average size of farms/ranch (Acres) 1,567 Median size farm/ranch (Acres) 1,000 Average value of land and buildings (Dollars) 852,401 Total cropland (Acres) 703,827 Irrigated land (Acres) 253,241 Market value of ag products sold ($1,000) 542,685 All crops sold ($1,000) 108,052 All livestock sold ($1,000) 434,633 Total farm production expenses ($1,000) 1/ 503,103 Net cash return from agricultural sales ($1,000) 58,023 Average age of farm/ranch operator (Years) 52.7 Colorado State Total Total land area (Square Miles) 104,095 Total land area (Acres) 66,621,375 2002 Census of Agriculture Number of farms and ranches (Number) 31,369 Land in farms and ranches (Acres) 31,093,336 Average size of farms/ranch (Acres) 991 Median size farm/ranch (Acres) 200 Average value of land and buildings (Dollars) 757,613 Total cropland (Acres) 11,530,700 Irrigated land (Acres) 2,590,654 Market value of ag products sold ($1,000) 4,525,196 All crops sold ($1,000) 1,216,278 All livestock sold ($1,000) 3,308,918 Total farm production expenses ($1,000) 1/ 4,412,593 Net cash return from agricultural sales ($1,000) 367,349 Average age of farm/ranch operator (Years) 53.8 1/ Production expenses and net cash returns are based on a sample of farms. Therefore, the difference between the market value of agricultural products sold and farm production expenses may not equal the published net return value.
Acres 2006 crops Harvested Yield Unit Production Barley ... ... Bu. ... Corn for Grain 216,000 218.5 Bu. 47,217,000 Dry beans 16,500 24.30 Cwt. 400,400 Hay, alfalfa 18,800 6.10 Tons 114,700 Hay, other 17,200 1.80 Tons 31,000 Potatoes, all 3,000 375 Cwt. 1,130,000 Sorghum, grain ... ... Bu. ... Sugarbeets 6,600 30.0 Tons 197,800 Sunflowers, all 5,600 1,980 Lbs. 11,100,000 Wheat, all 125,600 29.0 Bu. 3,648,000 January 1, 2007 Inventory Number All cattle and calves 272,000 Beef cows and heifers that have calved 51,000 Milk cows ... Acres 2006 crops Harvested Yield Unit Production Barley 42,000 115.0 Bu. 4,830,000 Corn for Grain 860,000 156.0 Bu. 134,160,000 Dry beans 60,000 19.00 Cwt. 1,140,000 Hay, alfalfa 780,000 3.80 Tons 2,964,000 Hay, other 750,000 1.90 Tons 1,425,000 Potatoes, all 63,700 380 Cwt. 24,166,000 Sorghum, grain 130,000 26.0 Bu. 3,380,000 Sugarbeets 38,000 23.4 Tons 889,000 Sunflowers, all 93,000 1,170 Lbs. 108,600,000 Wheat, all 1,919,000 21.5 Bu. 41,515,000 January 1, 2007 Inventory Number All cattle and calves 2,700,000 Beef cows and heifers that have calved 725,000 Milk cows 115,000 (D) Data not published to avoid disclosure of individual operations.
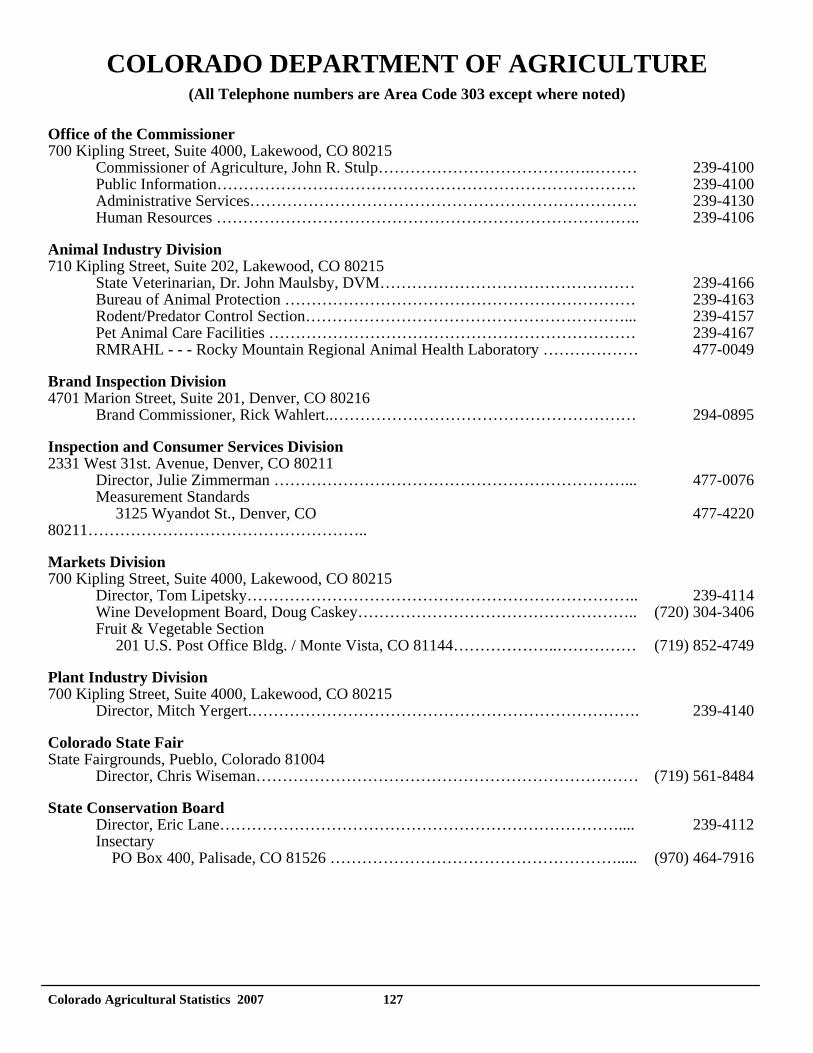
Colorado Agricultural Statistics 2007 127
COLORADO DEPARTMENT OF AGRICULTURE (All Telephone numbers are Area Code 303 except where noted)
Office of the Commissioner 700 Kipling Street, Suite 4000, Lakewood, CO 80215 Commissioner of Agriculture, John R. Stulp………………………………….……… 239-4100 Public Information……………………………………………………………………. 239-4100 Administrative Services………………………………………………………………. 239-4130 Human Resources …………………………………………………………………….. 239-4106 Animal Industry Division 710 Kipling Street, Suite 202, Lakewood, CO 80215 State Veterinarian, Dr. John Maulsby, DVM………………………………………… 239-4166 Bureau of Animal Protection ………………………………………………………… 239-4163 Rodent/Predator Control Section……………………………………………………... 239-4157 Pet Animal Care Facilities …………………………………………………………… 239-4167 RMRAHL - - - Rocky Mountain Regional Animal Health Laboratory ……………… 477-0049 Brand Inspection Division 4701 Marion Street, Suite 201, Denver, CO 80216 Brand Commissioner, Rick Wahlert..………………………………………………… 294-0895 Inspection and Consumer Services Division 2331 West 31st. Avenue, Denver, CO 80211 Director, Julie Zimmerman …………………………………………………………... 477-0076 Measurement Standards 3125 Wyandot St., Denver, CO 80211……………………………………………..
477-4220
Markets Division 700 Kipling Street, Suite 4000, Lakewood, CO 80215 Director, Tom Lipetsky……………………………………………………………….. 239-4114 Wine Development Board, Doug Caskey…………………………………………….. (720) 304-3406 Fruit & Vegetable Section 201 U.S. Post Office Bldg. / Monte Vista, CO 81144………………..…………… (719) 852-4749 Plant Industry Division 700 Kipling Street, Suite 4000, Lakewood, CO 80215 Director, Mitch Yergert.………………………………………………………………. 239-4140 Colorado State Fair State Fairgrounds, Pueblo, Colorado 81004 Director, Chris Wiseman……………………………………………………………… (719) 561-8484 State Conservation Board Director, Eric Lane………………………………………………………………….... 239-4112 Insectary PO Box 400, Palisade, CO 81526 ………………………………………………..... (970) 464-7916
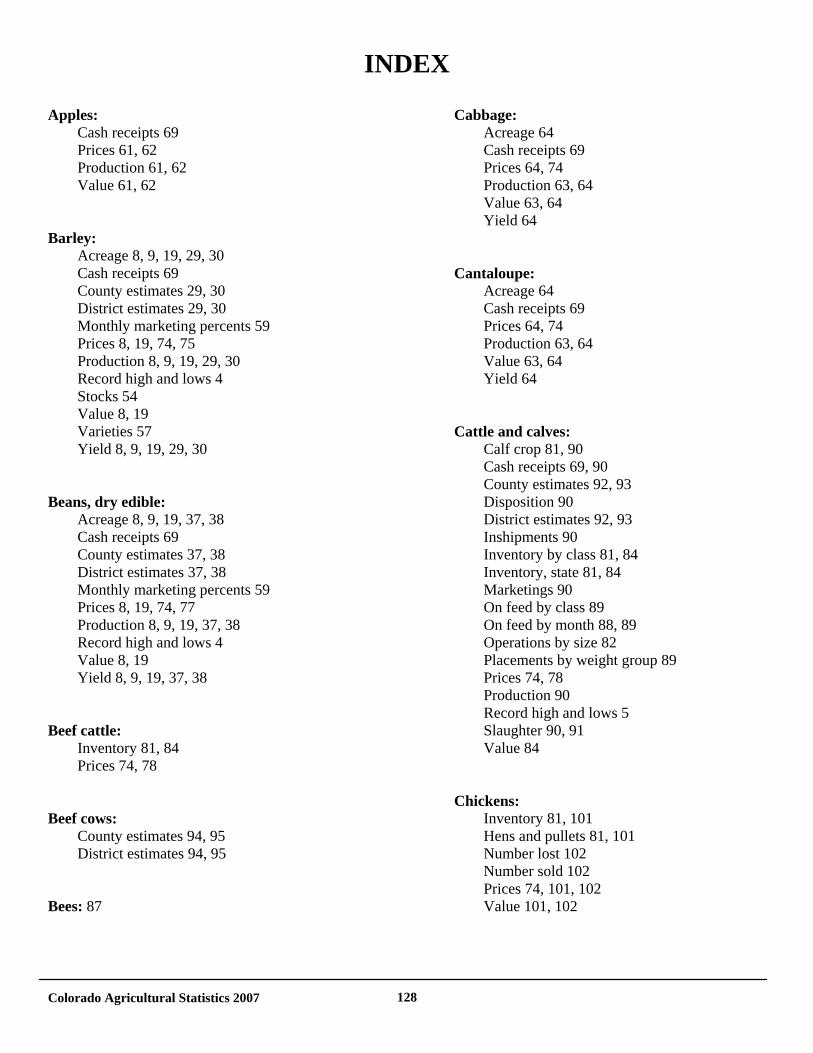
Colorado Agricultural Statistics 2007 128
INDEX
Apples: Cash receipts 69 Prices 61, 62 Production 61, 62 Value 61, 62 Barley: Acreage 8, 9, 19, 29, 30 Cash receipts 69 County estimates 29, 30 District estimates 29, 30 Monthly marketing percents 59 Prices 8, 19, 74, 75 Production 8, 9, 19, 29, 30 Record high and lows 4 Stocks 54 Value 8, 19 Varieties 57 Yield 8, 9, 19, 29, 30 Beans, dry edible: Acreage 8, 9, 19, 37, 38 Cash receipts 69 County estimates 37, 38 District estimates 37, 38 Monthly marketing percents 59 Prices 8, 19, 74, 77 Production 8, 9, 19, 37, 38 Record high and lows 4 Value 8, 19 Yield 8, 9, 19, 37, 38 Beef cattle: Inventory 81, 84 Prices 74, 78 Beef cows: County estimates 94, 95 District estimates 94, 95 Bees: 87
Cabbage: Acreage 64 Cash receipts 69 Prices 64, 74 Production 63, 64 Value 63, 64 Yield 64 Cantaloupe: Acreage 64 Cash receipts 69 Prices 64, 74 Production 63, 64 Value 63, 64 Yield 64 Cattle and calves: Calf crop 81, 90 Cash receipts 69, 90 County estimates 92, 93 Disposition 90 District estimates 92, 93 Inshipments 90 Inventory by class 81, 84 Inventory, state 81, 84 Marketings 90 On feed by class 89 On feed by month 88, 89 Operations by size 82 Placements by weight group 89 Prices 74, 78 Production 90 Record high and lows 5 Slaughter 90, 91 Value 84 Chickens: Inventory 81, 101 Hens and pullets 81, 101 Number lost 102 Number sold 102 Prices 74, 101, 102 Value 101, 102
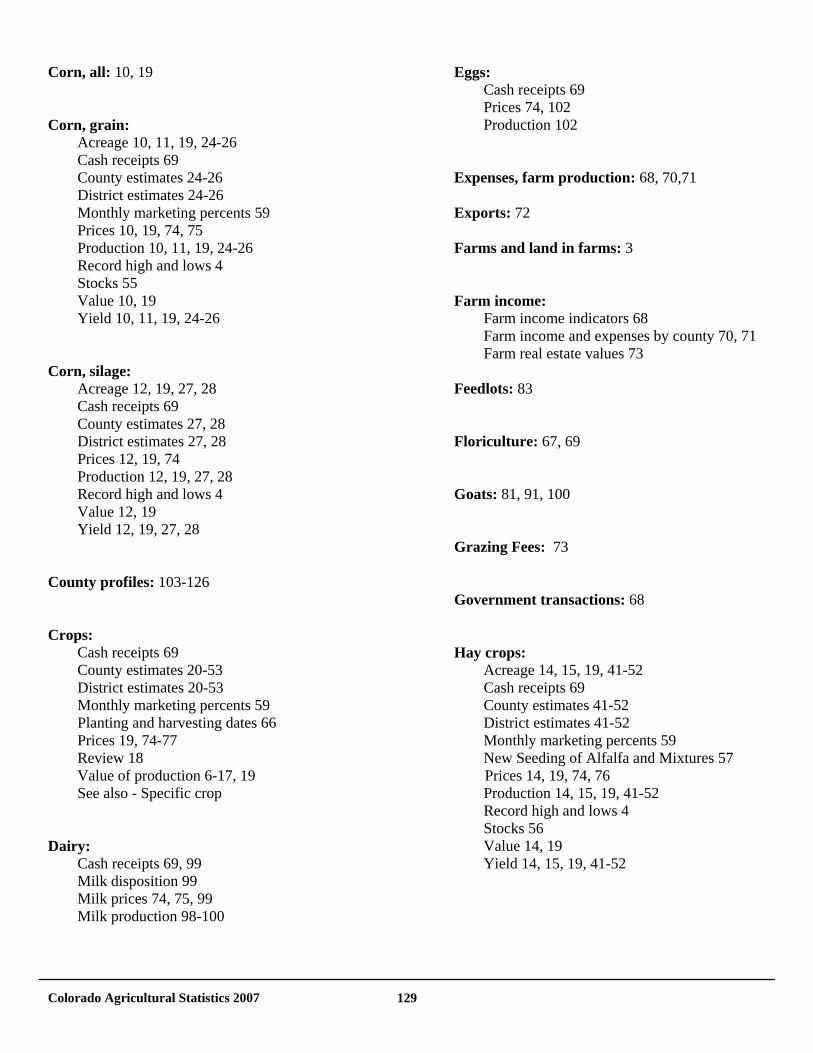
Colorado Agricultural Statistics 2007 129
Corn, all: 10, 19 Corn, grain: Acreage 10, 11, 19, 24-26 Cash receipts 69 County estimates 24-26 District estimates 24-26 Monthly marketing percents 59 Prices 10, 19, 74, 75 Production 10, 11, 19, 24-26 Record high and lows 4 Stocks 55 Value 10, 19 Yield 10, 11, 19, 24-26 Corn, silage: Acreage 12, 19, 27, 28 Cash receipts 69 County estimates 27, 28 District estimates 27, 28 Prices 12, 19, 74 Production 12, 19, 27, 28 Record high and lows 4 Value 12, 19 Yield 12, 19, 27, 28 County profiles: 103-126 Crops: Cash receipts 69 County estimates 20-53 District estimates 20-53 Monthly marketing percents 59 Planting and harvesting dates 66 Prices 19, 74-77 Review 18 Value of production 6-17, 19 See also - Specific crop Dairy: Cash receipts 69, 99 Milk disposition 99 Milk prices 74, 75, 99 Milk production 98-100
Eggs: Cash receipts 69 Prices 74, 102 Production 102 Expenses, farm production: 68, 70,71 Exports: 72 Farms and land in farms: 3 Farm income: Farm income indicators 68 Farm income and expenses by county 70, 71
Farm real estate values 73
Feedlots: 83 Floriculture: 67, 69 Goats: 81, 91, 100 Grazing Fees: 73 Government transactions: 68 Hay crops: Acreage 14, 15, 19, 41-52 Cash receipts 69 County estimates 41-52 District estimates 41-52 Monthly marketing percents 59 New Seeding of Alfalfa and Mixtures 57 Prices 14, 19, 74, 76 Production 14, 15, 19, 41-52 Record high and lows 4 Stocks 56 Value 14, 19 Yield 14, 15, 19, 41-52
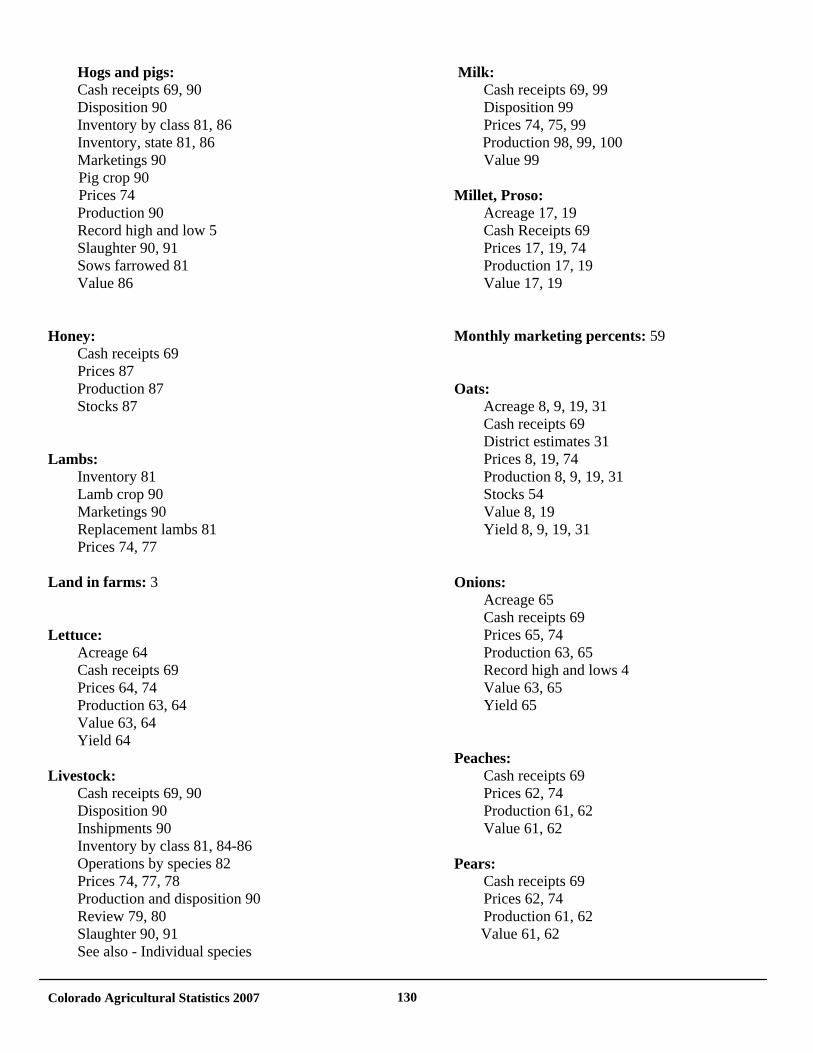
Colorado Agricultural Statistics 2007 130
Hogs and pigs: Cash receipts 69, 90 Disposition 90 Inventory by class 81, 86 Inventory, state 81, 86 Marketings 90 Pig crop 90 Prices 74 Production 90 Record high and low 5 Slaughter 90, 91 Sows farrowed 81 Value 86 Honey: Cash receipts 69 Prices 87 Production 87 Stocks 87 Lambs: Inventory 81 Lamb crop 90 Marketings 90 Replacement lambs 81 Prices 74, 77 Land in farms: 3 Lettuce: Acreage 64 Cash receipts 69 Prices 64, 74 Production 63, 64 Value 63, 64 Yield 64 Livestock: Cash receipts 69, 90 Disposition 90 Inshipments 90 Inventory by class 81, 84-86 Operations by species 82 Prices 74, 77, 78 Production and disposition 90 Review 79, 80 Slaughter 90, 91 See also - Individual species
Milk: Cash receipts 69, 99 Disposition 99 Prices 74, 75, 99
Production 98, 99, 100 Value 99 Millet, Proso: Acreage 17, 19 Cash Receipts 69 Prices 17, 19, 74 Production 17, 19 Value 17, 19 Monthly marketing percents: 59 Oats: Acreage 8, 9, 19, 31 Cash receipts 69 District estimates 31 Prices 8, 19, 74 Production 8, 9, 19, 31 Stocks 54 Value 8, 19 Yield 8, 9, 19, 31 Onions: Acreage 65 Cash receipts 69 Prices 65, 74 Production 63, 65 Record high and lows 4 Value 63, 65 Yield 65 Peaches: Cash receipts 69 Prices 62, 74 Production 61, 62 Value 61, 62 Pears: Cash receipts 69 Prices 62, 74 Production 61, 62 Value 61, 62
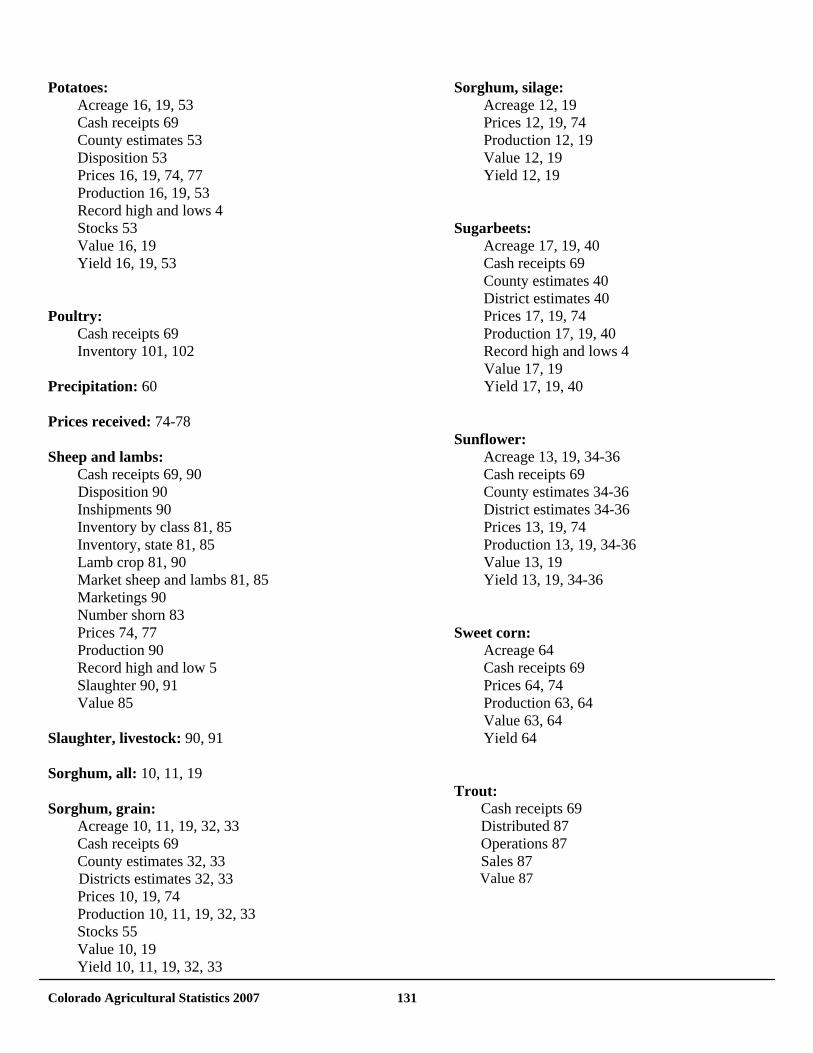
Colorado Agricultural Statistics 2007 131
Potatoes: Acreage 16, 19, 53 Cash receipts 69 County estimates 53 Disposition 53 Prices 16, 19, 74, 77 Production 16, 19, 53 Record high and lows 4 Stocks 53 Value 16, 19 Yield 16, 19, 53 Poultry: Cash receipts 69 Inventory 101, 102 Precipitation: 60 Prices received: 74-78 Sheep and lambs: Cash receipts 69, 90 Disposition 90 Inshipments 90 Inventory by class 81, 85 Inventory, state 81, 85 Lamb crop 81, 90 Market sheep and lambs 81, 85 Marketings 90 Number shorn 83 Prices 74, 77 Production 90 Record high and low 5 Slaughter 90, 91 Value 85 Slaughter, livestock: 90, 91 Sorghum, all: 10, 11, 19 Sorghum, grain: Acreage 10, 11, 19, 32, 33 Cash receipts 69 County estimates 32, 33 Districts estimates 32, 33 Prices 10, 19, 74 Production 10, 11, 19, 32, 33 Stocks 55 Value 10, 19 Yield 10, 11, 19, 32, 33
Sorghum, silage: Acreage 12, 19 Prices 12, 19, 74 Production 12, 19 Value 12, 19 Yield 12, 19 Sugarbeets: Acreage 17, 19, 40 Cash receipts 69 County estimates 40 District estimates 40 Prices 17, 19, 74 Production 17, 19, 40 Record high and lows 4 Value 17, 19 Yield 17, 19, 40 Sunflower: Acreage 13, 19, 34-36 Cash receipts 69 County estimates 34-36 District estimates 34-36 Prices 13, 19, 74 Production 13, 19, 34-36 Value 13, 19 Yield 13, 19, 34-36 Sweet corn: Acreage 64 Cash receipts 69 Prices 64, 74 Production 63, 64 Value 63, 64 Yield 64 Trout: Cash receipts 69 Distributed 87 Operations 87 Sales 87 Value 87
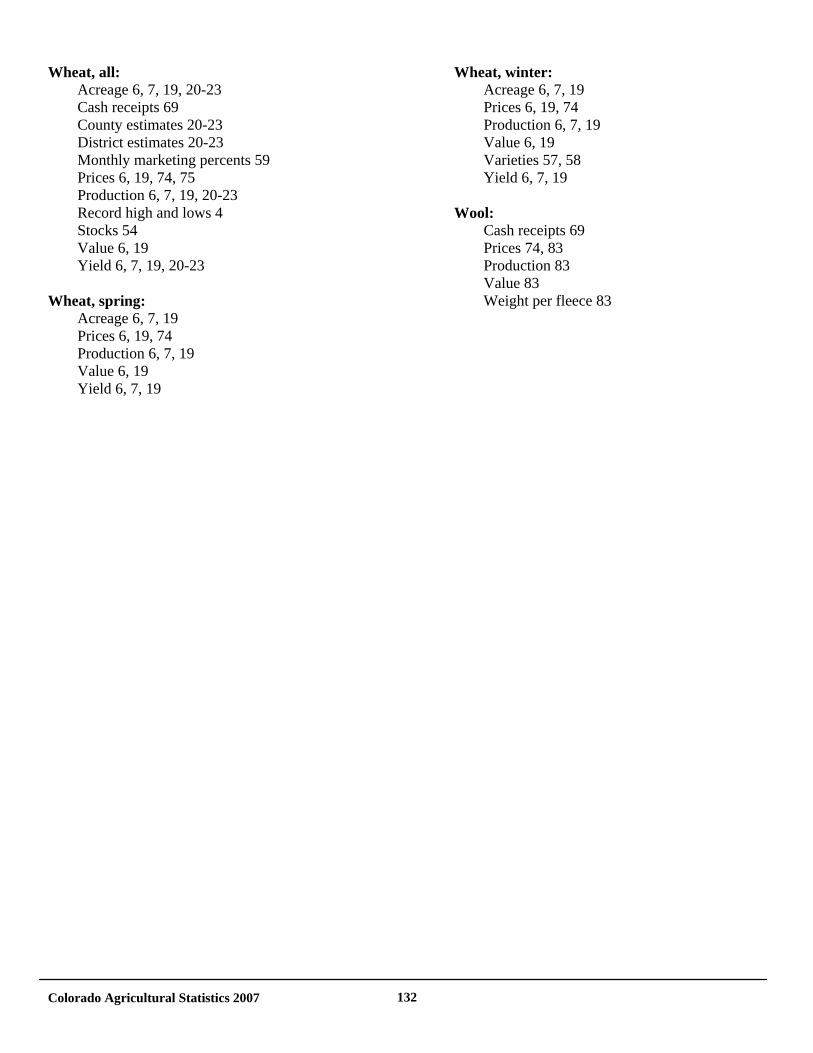
Colorado Agricultural Statistics 2007 132
Wheat, all: Acreage 6, 7, 19, 20-23 Cash receipts 69 County estimates 20-23 District estimates 20-23 Monthly marketing percents 59 Prices 6, 19, 74, 75 Production 6, 7, 19, 20-23 Record high and lows 4 Stocks 54 Value 6, 19 Yield 6, 7, 19, 20-23 Wheat, spring: Acreage 6, 7, 19 Prices 6, 19, 74 Production 6, 7, 19 Value 6, 19 Yield 6, 7, 19
Wheat, winter: Acreage 6, 7, 19 Prices 6, 19, 74 Production 6, 7, 19 Value 6, 19 Varieties 57, 58 Yield 6, 7, 19 Wool: Cash receipts 69 Prices 74, 83 Production 83 Value 83 Weight per fleece 83