Embed Size (px)
Citation preview
RESEARCH ARTICLE Open Access
Color vision varies more among populationsthan among species of live-bearing fishfrom South AmericaBenjamin A. Sandkam1*, C. Megan Young1, Frances Margaret Walker Breden2, Godfrey R. Bourne3
and Felix Breden1
Abstract
Background: Sensory Bias models for the evolution of mate preference place a great emphasis on the role ofsensory system variation in mate preferences. However, the extent to which sensory systems vary across- versuswithin-species remains largely unknown. Here we assessed whether color vision varies in natural locations whereguppies (Poecilia reticulata) and their two closest relatives, Poecilia parae and Poecilia picta, occur in extreme sympatryand school together. All three species base mate preferences on male coloration but differ in the colors preferred.
Results: Measuring opsin gene expression, we found that within sympatric locations these species have similarcolor vision and that color vision differed more across populations of conspecifics. In addition, all three speciesdiffer across populations in the frequency of the same opsin coding polymorphism that influences visual tuning.
Conclusions: Together, this shows sensory systems vary considerably across populations and supports the possibilitythat sensory system variation is involved in population divergence of mate preference.
Keywords: Mate choice, Opsin, Guppy, Poeciliidae, Sensory bias, Population divergence
BackgroundPopulation divergence is widely accepted as a precursorto speciation [1], and can occur rapidly due to sexualselection via changes in mate preference [2]. Manyhypotheses have attempted to explain the drivers behindchanges in mate preference, which fall into two generalcategories— indirect models, such as Fisher’s runawayand good genes, or direct models such as Sensory Bias(reviewed in [3, 4]). Sensory Bias models emphasize therole of sensory system variation in driving divergence inmate preferences [5–9]. However, the extent to which sen-sory systems vary across- versus within-species remainslargely unknown. Describing where the variation in sen-sory systems is partitioned is important for research aimedat directly testing such models of population divergence inmate choice.
Guppies have been a valuable model for studies of theevolution of female mate preferences based on visualsignals for nearly 100 years (reviewed in [10, 11]). Re-cently, P. reticulata has been shown to vary in the tuningof color vision across populations in a manner that corre-lates with female mate preferences on the island ofTrinidad [12]. In contrast to Trinidad, populations of gup-pies from mainland South America frequently occur in ex-treme sympatry and commonly school with two of theirclosest relatives, Poecilia picta and P. parae [13–14].These species occupy similar ecological niches and havehighly similar morphometrics, with the largest differencesbetween species being male coloration [13, 15–17]. In allthree species, female mate preferences largely rely on malevisual cues, yet the male traits preferred by femalesdiffer across species [13, 15, 18, 19]. Males of P. reti-culata have highly variable numbers and colors ofspots on their body [13, 20, 21]. In P. parae, malesoccur in one of five discreet Y-linked morphs: threeuni-color morphs (with color pattern dominated by ahorizontal stripe that is either: red, yellow, or blue),
* Correspondence: [email protected] of Biological Sciences, Simon Fraser University, 8888 UniversityDrive, Burnaby V5A 1S6 BC, CanadaFull list of author information is available at the end of the article
© 2015 Sandkam et al. Open Access This article is distributed under the terms of the Creative Commons Attribution 4.0International License (http://creativecommons.org/licenses/by/4.0/), which permits unrestricted use, distribution, andreproduction in any medium, provided you give appropriate credit to the original author(s) and the source, provide a link tothe Creative Commons license, and indicate if changes were made. The Creative Commons Public Domain Dedication waiver(http://creativecommons.org/publicdomain/zero/1.0/) applies to the data made available in this article, unless otherwise stated.
Sandkam et al. BMC Evolutionary Biology (2015) 15:225 DOI 10.1186/s12862-015-0501-3
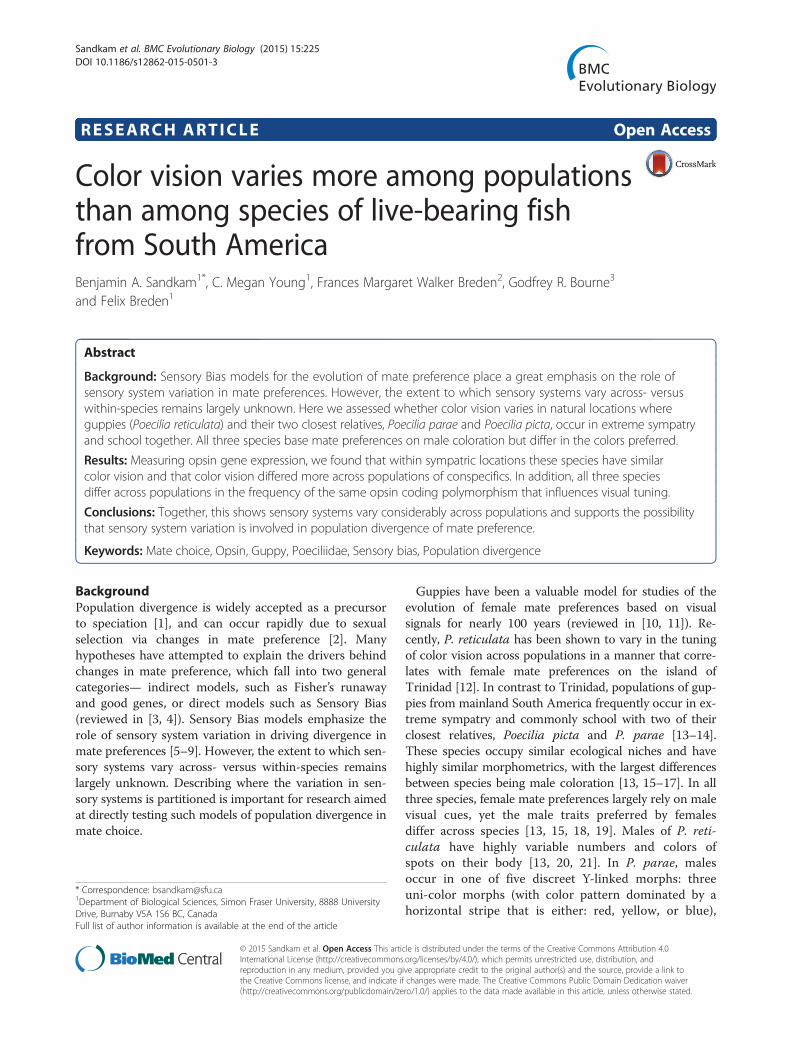
one female mimic morph (colored like the female andengaging in sneak copulations), and one large, aggres-sive morph (with vertical dark bars and most of itscoloration on the caudal fin) [15, 22]. Males of P.picta all have an orange stripe on their caudal fin andyellow bands on their dorsal fin [13]. While most males ofP. picta have no additional color, some males occur as amorph with red running diffusely throughout the entirebody, although this red coloration doesn’t strongly influ-ence mating [17] (see Fig. 1 for pictures of the malemorphs of all three species). While males occasionally per-form courtship displays for heterospecific females, fe-male P. picta do not accept heterospecific males asmates [13, 16, 23]. The variable role of color in fe-male mate choice [24, 25], high similarity in nicheand morphology, and occurrence in sympatry makethese species, P. reticulata, P. picta, P. parae, an ex-cellent system with which to examine whether colorvision varies more across species or populations.Color vision is accomplished by comparing the signals
from different cone cells in the retina, which are max-imally tuned to different wavelengths of light [26]. Thewavelength at which a cone cell maximally detects lightis primarily determined by the transmembrane proteinexpressed, called an opsin [27, 28]. P. reticulata, P. picta,and P. parae have an astounding nine cone opsin pro-teins, among the highest for vertebrates [29–31]. Eachcone opsin is coded by a single gene which is groupedand named for the range of light they detect: SWS1(SWS1, short wavelength-sensitive) detects ultra-violet;SWS2A and SWS2B (SWS2, short wavelength sensitive2) detect blues and purples; RH2-1 and RH2-2 (RH2,rhodopsin-like) detect greens; and LWS-1, LWS-2,LWS-3, and LWS-R (LWS, long wavelength-sensitive)detect reds and oranges [30–33].Differences in tuning of color vision can occur through
changes in either gene sequence or expression (reviewed
in [34]). Guppies have been shown to vary in tuning ofcolor vision across populations through both differencesin the frequency of an allele known to affect tuning ofLWS-1 [12, 33] and also differences in opsin expressionprofiles [12]. Opsin expression profiles provide an esti-mate of cone cell proportions in the retina and therebyoffer an excellent measure of the allocation of an individ-ual’s color vision repertoire to different cone cell types[12, 35–40]. Guppy populations with stronger female pref-erences for males with more red/orange coloration havehigher expression of LWS opsins [12].Here, we examined whether there is more variation in
visual tuning within species or across species. The oc-currence of multiple sympatric locations of the threeclosely related species P. parae, P. picta, and P. reticu-lata on mainland South America allows us to examinedifferences in visual tuning of all three species from thesame environment in a replicated manner across popula-tions. By examining visual tuning of each species acrossmultiple locations we are able to assess the variability ofopsin expression across populations and compare this tospecies differences.
MethodsSample collectionWe sampled Poecilia parae, P. picta, and P. reticulatafrom four sympatric locations within Guyana between10:00 and 16:00 in June-July 2010 (see Additional file 1for map and Additional file 2: Table S1 of GPS coordi-nates). One sympatric location (Seawall Trench) wassampled on two days. Efforts were made to collect fiveadult males and five adult females of each species atevery location; however not all species were present atthe same density within locations resulting in smallersample sizes for some collections (see Additional file 2:Table S1 of sample sizes of each species and population).P. bifurca is a close relative of P. reticulata, P. picta, and
Fig. 1 Male morphs of the three sympatric species
Sandkam et al. BMC Evolutionary Biology (2015) 15:225 Page 2 of 11
P. parae but does not occur sympatrically. Opsin expres-sion for one population of P. bifurca (~79 km from clos-est sympatric location sampled) is reported here only asa qualitative comparison and is not included in statisticalanalyses. All four species occur in similar environments;small drainage ditches of Guyana that are usually only afew meters wide and less than a meter deep [13]. Adultmales show pronounced species specific coloration,while females are all grey with minor differences in blackpatterning around the urogenital opening; these traitsallow us to rapidly perform visual identification of spe-cies and sex [41]. Sampling followed the protocols ofSandkam et al. [12]. Briefly, adult fish were caught withdip nets— individuals were rapidly sacrificed in an over-dose of MS-222, measured and photographed. We im-mediately removed eyes and made a small puncture tofacilitate complete penetration of RNAlater® StabilizationSolution (Life Technologies™). Both eyes from an indi-vidual were placed into a vial of RNAlater® and kept onice for 24 h, to allow tissue to be saturated per manufac-turer’s recommendation. After 24 h, we transferred thevials to liquid nitrogen. The vials were removed fromliquid nitrogen just prior to being placed in checkedbaggage and flown to Simon Fraser University where weplaced them in a −20 °C freezer until RNA extraction.Time spent at room temperature totaled less than 24 hand fell well under the one-week maximum suggestedby manufacturer. The bodies of individuals sampledwere placed in tubes of 95 % EtOH buffered with EDTAand kept at −20 °C until DNA extraction.
qPCR assay designTo measure opsin expression, we designed qPCR assaysfollowing the methods of Sandkam et al. [12]. We modi-fied the primers reported in Sandkam et al. for P. reticu-lata, such that one set of qPCR assays could be usedacross all four species. Sequences from P. reticulata, P.picta, P. parae, and P. bifurca were aligned and viewedusing SeqMan Pro (Lasergene 8.0; DNASTAR, Madison,WI). We designed probe based PrimeTime® qPCR assays(IDT® Technologies) in regions of conserved sequencesuch that there were no SNPs between any of the fourspecies for all of the primer/probe assays. Assays weredesigned to be specific for each of the nine opsins, onerhodopsin (RH1), and three housekeeping genes (betaactin (B-actin); cytochrome c oxidase subunit I (COI);myosin heavy chain (Myosin HC)). Whenever possible,primers spanned intron-exon boundaries. Each assayconsisted of a forward primer, reverse primer and 5’ FAMlabeled probe with both 3’ Iowa Black® and internal ZEN™quenchers (IDT® Technologies) (see Additional file 2:Table S2 of primer/probe sequences and product length).Assay specificity for each species was verified by the pres-ence of a single band when running PCR products on an
agarose gel. Within each species, LWS-1 and LWS-Rassays resulted in products of the same size, while LWS-1and LWS-3 loci are similar in sequence. To ensure thatLWS-1, LWS-3, and LWS-R were truly locus specificassays, we measured the pairwise covariance of these threeassays on the final relative(hk) data set (described below)using R v3.0.2. If assays were binding to non-specifictargets we would expect to see large positive covariancesbetween assays. We found no substantial covariance inany of the four species between either LWS-1 and LWS-R(covariance: P. reticulata, −9*10−6; P. parae, 0.0011; P.picta, −0.001; P. bifurca, −0.0028) or LWS-1 and LWS-3(covariance: P. reticulata, −1*10−6; P. parae, 0.0066; P.picta, 0.0004; P. bifurca, 0.0059), demonstrating locus spe-cificity of the LWS assays.We determined the relative PCR efficiency (Ei) for
each assay as in Sandkam et al. [12], using four gBlocks®Gene Fragments (synthetic double stranded, sequence-verified genomic blocks made by IDT® Technologies).gBlocks® were designed on sequence from P. reticulataand contained sequence for each of the genes beingassayed from 20 bp upstream of the forward primer to20 bp downstream of the reverse primer. To ensureequal proportions of each gene when calculating relativeefficiency, we adjusted the length of each opsin gBlocks®to 728 bp by adding upstream and downstream sequencefrom the first and last opsin. There were less than sevenSNPs per gene across the four species in regions spannedby the assays and none of these differences occurred inprimer/probe sites. Relative primer efficiencies calculatedusing these constructs were used for all four species. Geneorder in the gBlocks® was randomized: gBlock® 1 con-tained LWS-1, RH1, SWS1, LWS-R; gBlock® 2 containedSWS2B, LWS-3, RH2-2; gBlock® 3 contained LWS-2,SWS2A, RH2-1; and gBlock® 4 contained B-actin, COI,Myosin-HC. The 4 gBlocks® were mixed in equal propor-tions and brought to a concentration of 0.001 ng/μl result-ing in a control with equal ratios of all the opsin andhousekeeping genes. We ran six replicates of each assayusing 4.5 μl of the control. The relative primer efficiencies(Ei) were then calculated following Carleton and Kocher[42] using the equation:
1þ 1ð ÞCtHigh1þ Eið ÞCti ¼ 1
such that CtHigh is the critical threshold of the opsinwith the highest expression (lowest Ct value) and Cti isthe critical threshold for opsin i. The mean relativeefficiency and standard error was calculated across thesix replicates (see Additional file 2: Table S2 of assayefficiencies).The SWS2A assay had the highest relative efficiency
and was used to measure absolute efficiency. A thousand
Sandkam et al. BMC Evolutionary Biology (2015) 15:225 Page 3 of 11
fold serial dilution was made of a random sample of P.picta. Three replicates of qPCR were performed on eachconcentration using the SWS2A assay. The absolute effi-ciency of SWS2A was found using the slope of ln (concen-tration) plotted on Ct such that ESWS2A = e− slope − 1. Theabsolute efficiencies of the other primer/probes were de-termined following Fuller et al. [43] using the equation:
absolute Ei ¼ relative Ei � absolute ESWS2Að Þ=relative ESWS2A
Sample processing and analyses for opsin expressionSample processing followed Sandkam et al. [12]. Weplaced both eyes from one individual in 600 uL of TRI-zol® reagent (Life Technologies™) and ground them witha 1.5 mL RNase-free Kontes® Pellet Pestle Grinder (Kim-ble Chase). Solution was then run through an Ambion®Homogenizer (Life Technologies™) to reduce viscosity.We extracted RNA following the manufacturer’s instruc-tions using PureLink® RNA Mini Kits with the additionof on column treatments with PureLink® DNase (LifeTechnologies™) to eliminate any potential genomic con-tamination during qPCR. To verify quality of extractedRNA we ran a subset of samples on an Experion Bioana-lyzer. RNA concentrations were adjusted to 50 ng/uLusing UltraPure™ DNase/RNase-Free Distilled Water(Life Technologies™). For each sample 500 ng RNA wasreverse transcribed using a High Capacity cDNA ReverseTranscription Kit with RNase Inhibitor (Life Technolo-gies™) following manufacturer’s instructions. cDNA sam-ples were diluted roughly 20-fold using UltraPure™DNase/RNase-Free Distilled Water (Life Technologies™)for use in qPCR reactions. Triplicate qPCR reactionswere run on each individual for the nine opsins, onerhodopsin, and three housekeeping genes using theqPCR probe based assays described above. We ran all 39reactions for each individual simultaneously on the same384 well plate in addition to negative controls (Ultra-Pure™ water) for each assay. Each 10 uL reaction con-sisted of: 5 uL Brilliant III Ultra-Fast qPCR Master Mix(Agilent Technologies), 0.5 uL FAM labeled assay (de-scribed above) and 4.5 uL sample. We set up all reac-tions on ice and the plates were briefly spun downbefore being run on an Applied Biosystems® 7900HTqPCR machine (Life Technologies™). PCR conditionswere as follows: 95 °C for 3:00 followed by 40 cycles of95 °C for 0:05, 60 °C for 0:15. The standard deviation ofthe triplicate reactions was taken and when >2, outlierswere removed (comprising only 5 % of the 5538 reac-tions for this study).We assessed differences in color vision by calculating
the proportion of total opsin expression (Tall) made up ofeach opsin (Ti) following Fuller et al. [43] and Carletonand Kocher [42] with the following equation:
Ti
Tall¼
1= 1þ Eið ÞCti� �� �
X1= 1þ Eið ÞCti
� �� �
where Ei is the mean primer/probe efficiency of assay i andCti is the mean critical cycle number for gene i (expressionof the nine opsins adds to one for each individual).We assessed differences in regulation of the nine cone
opsins and one rhodopsin genes by comparing expres-sion relative to housekeeping genes (THouse). To controlfor random variation in housekeeping gene expression,we took the average of three housekeeping genes [44].We calculated measures following Sandkam et al. [12]using the equation:
Ti
THouse� ¼
1= 1þ Eið ÞCti� �
X1= 1þ EHouseð ÞCtHouse
� �� �=3
� �
where EHouse is the primer/probe efficiency for a house-keeping gene and CtHouse is the critical cycle number forthat gene.This resulted in each individual having two measures
for each opsin: the proportion of total opsin expressionmade up by that opsin (proportional), and relative tohousekeeping genes (relative(hk)). As opsins are themajor differentiating character of cone cell types, andcolor vision is accomplished by comparing the signal fromdifferent cone cell types, proportional measures of opsinexpression provide a measure of color vision [43, 45]. Dif-ferences in regulation of individual opsins comparedto overall gene transcription are revealed by relati-ve(hk) measures of opsin expression, whereas overallgene activity is measured as the mean of the threehousekeeping genes [12, 45].
LWS-1 A/S allele frequencyVariation in visual systems across species or populationscan also occur through differences in the frequency ofpolymorphisms known to alter tuning of the visual pig-ments. Only LWS-1 is known to possess a polymorph-ism that alters spectral tuning in P. parae, P. picta, or P.reticulata [12, 30, 33]. The key difference between thesealleles is the presence of either a serine or alanine as theamino acid at the position that corresponds to residue180 in human M/LWS opsins (termed ‘LWS-1 (180 Ser)’and ‘LWS-1 (180 Ala)’ respectively). This polymorphismcan result in a change of tuning of the LWS-1 opsin pro-tein by up to 7 nm [30, 33]. To determine species andpopulation frequencies of the LWS-1 (180 Ala) andLWS-1 (180 Ser) polymorphism we extracted genomicDNA from tail tissue of the same individuals we used for
Sandkam et al. BMC Evolutionary Biology (2015) 15:225 Page 4 of 11
expression analyses using a DNeasy blood and tissue kit(Qiagen). We generated PCR products using 5’ and 3’UTR-specific primers of the LWS-1 locus. Internalsequencing primers were used directly on PCR productsto generate chromatograms, spanning part of exon 2and all of exon 3, at Molecular Cloning Laboratories(McLab, San Francisco, CA) (see Additional file 2: TableS3 of primer sequences). We viewed and analyzed thesequencing chromatograms using SeqMan Pro (LASER-GENE 8.0; DNASTAR, Madison, WI). For each individ-ual, we determined if the 180 amino acid residue waseither a serine, alanine or heterozygous. We calculatedgenotype and allele frequencies for each species in eachlocation. FST values based on the frequency of alleleswith a serine at amino acid position 180 were calculatedtwo ways; between species within the same location, andwithin species across populations. FST values were calcu-lated as in Sandkam et al. [12], using:
FST ¼ var Sð Þ�S � 1−�Sð Þ
where var(S) is the variance of the frequency of the serineallele, either across species (within locations) or acrosspopulations (within species), and �S is the frequency of theserine allele in either the location or species (respectively).
Statistical analyses of opsin expressionDo species and/or populations differ in color vision?To test whether closely related sympatric species differin either proportional or relative(hk) measures of opsinexpression profiles, we ran MANOVAs with the levelsfor each of the nine cone opsins log transformed andtreated as dependent variables. Sex was nested withinSpecies and since Locations were sampled at differenttimes of the day, which can impact opsin expression[12], we further nested Species within Location. All ex-pression data were analyzed using R v3.0.2 [46].Sex had no main or interaction effect (Table 1). There
are no differences between sexes in opsin expression of
natural guppy populations on Trinidad [12], nor foropsin expression in most other species in which it hasbeen examined (such as stickleback (Gasterosteus acu-leatus) [47], and killifish (Lucania goodei) [48]). There-fore we pooled sexes for all of the following analyses.
Does opsin expression differ more by species or locations?Akaike Information Criterion (AIC) scores were calcu-lated by Species, Location, or a Species*Location inter-action to determine the ability of models built on thesefactors to explain variation in proportional expressionfor each of the opsin genes.
How do species differ in color vision?To better understand differences in color vision acrossspecies within the same location, we ran independentANOVAs by Species on data subset by Location. Opsinsthat significantly differed in ANOVAs were followed upwith a Tukey test to determine which of the species con-tributed to the significant effects.
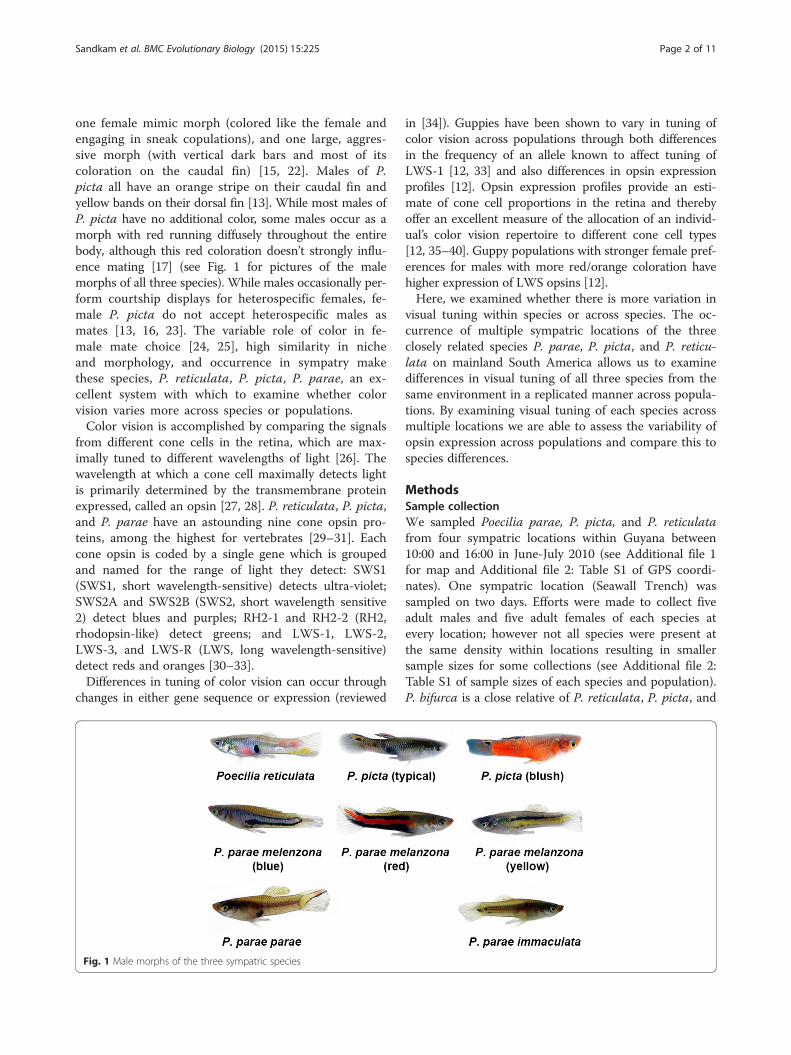
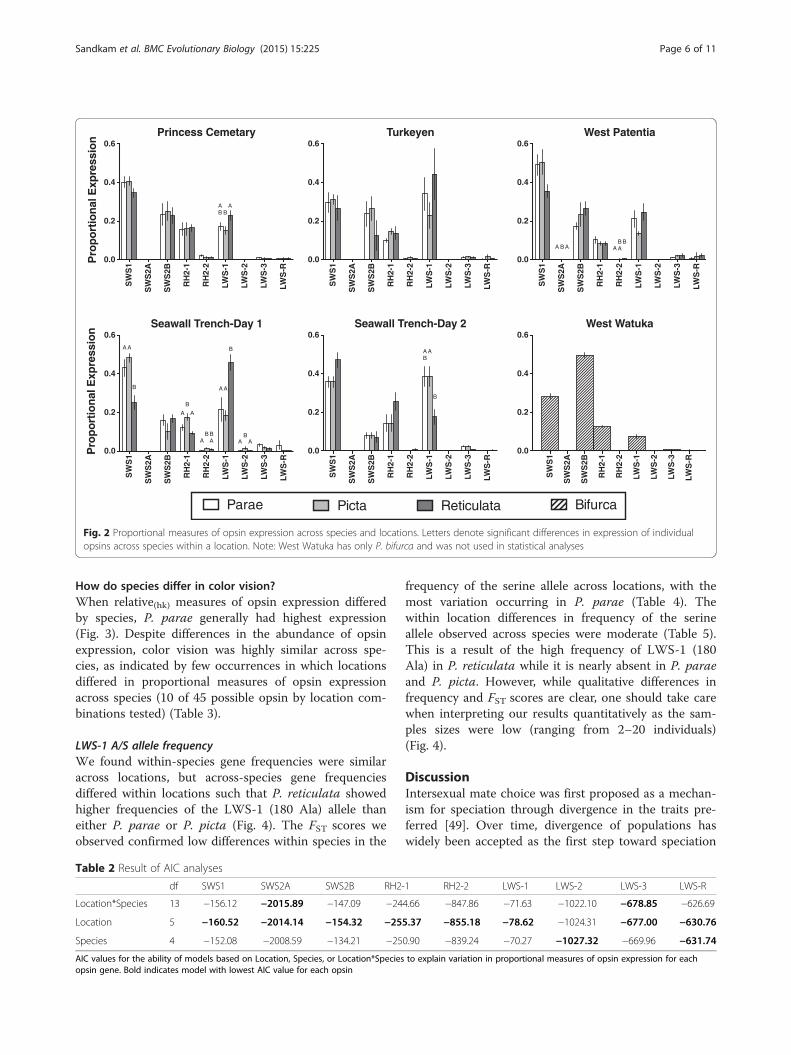
ResultsDo species and/or populations differ in color vision?Across all locations and species SWS2A, RH2-2, LWS-2,LWS-3, and LWS-R showed rather low levels of expres-sion compared to other opsin genes (Figs. 1, 2). The mostabundant opsin expressed was either SWS1 or LWS-1 butvaried across locations and species (Fig. 2). MANOVAsrevealed that color vision, as measured by differences inopsin expression, varied significantly within species acrosspopulations and within locations across species (Table 1).However, expression profiles did not vary by sex (nestedin species-in locations) for either proportional (F12,109 =1.1275, P = 0.1872) or relative(hk) (F12,109 = 0.977, P =0.5490) measures.
Does opsin expression differ more by species or location?We found opsin expression to vary significantly by Loca-tion and Species nested within Location. To determine ifSpecies, Location or a Location*Species interaction bestexplained variation in proportional expression we calcu-lated AIC scores. Location alone best explained variationin SWS1, SWS2B, RH2-1, RH2-2, and LWS-1 (Table 2).Location and Location*Species explained the variationequally well for SWS2A and LWS-3, as seen by AICscores differing by less than 2 for these two models inboth genes. Location and Species explained variation ofLWS-R equally well with AIC scores within 1 for thesetwo models. Only for LWS-2 did Species best explainvariation in opsin expression (Table 2). Overall, wefound that variation in color vision, as measured byopsin expression, was better explained by Location thanby Species.
Table 1 Results of MANOVA on opsin expression profiles asproportional and relative(hk) measures
Proportional Relative(hk)
Loc F(3,109) 7.13 5.87
P <0.0001 <0.0001
Sp(Loc) F(8,109) 1.61 2.04
P 0.0014 <0.0001
Sx(Sp(Loc)) F(12,109) 1.13 0.98
P 0.1872 0.5490
Loc, Location; Sp(Loc), Species nested in Location; Sx(Sp(Loc)), Sex nested inSpecies, nested in Location. Bold indicates P < 0.05
Sandkam et al. BMC Evolutionary Biology (2015) 15:225 Page 5 of 11
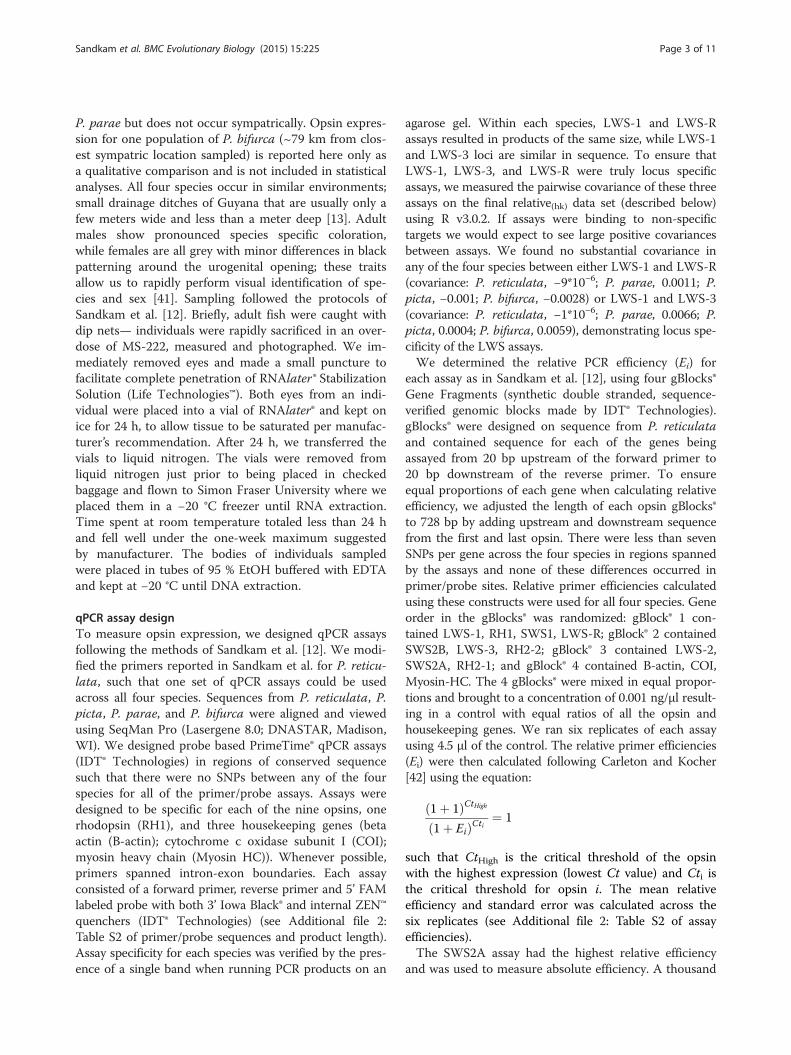
How do species differ in color vision?When relative(hk) measures of opsin expression differedby species, P. parae generally had highest expression(Fig. 3). Despite differences in the abundance of opsinexpression, color vision was highly similar across spe-cies, as indicated by few occurrences in which locationsdiffered in proportional measures of opsin expressionacross species (10 of 45 possible opsin by location com-binations tested) (Table 3).
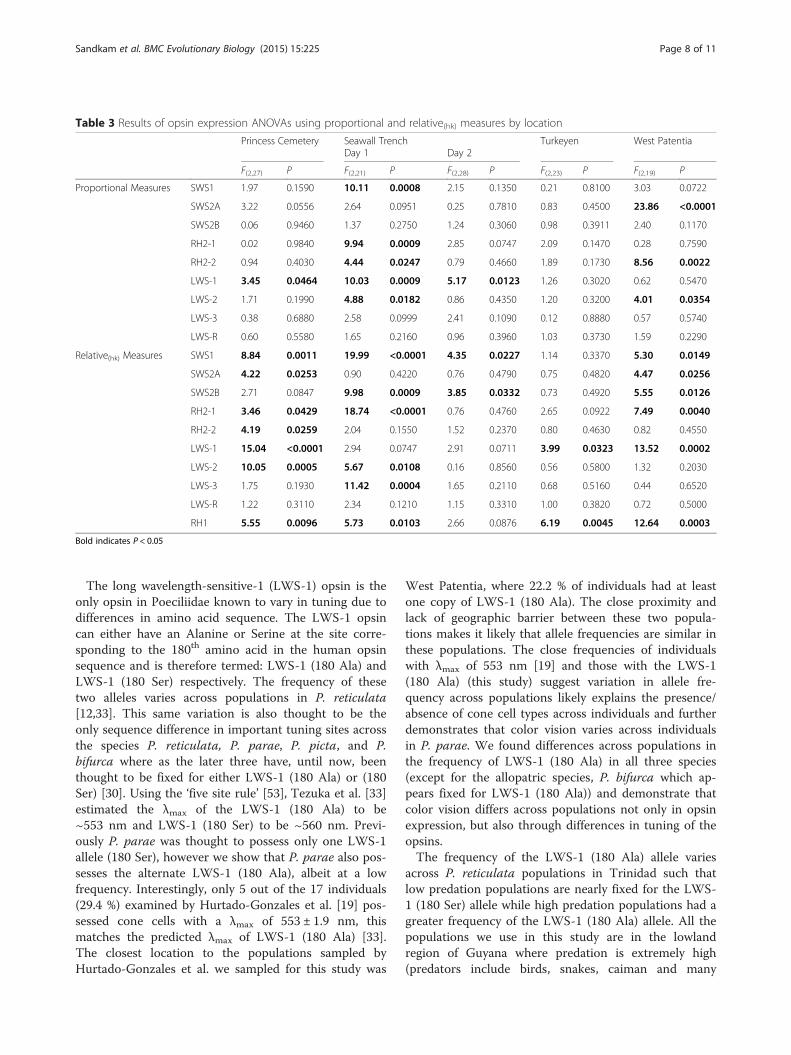
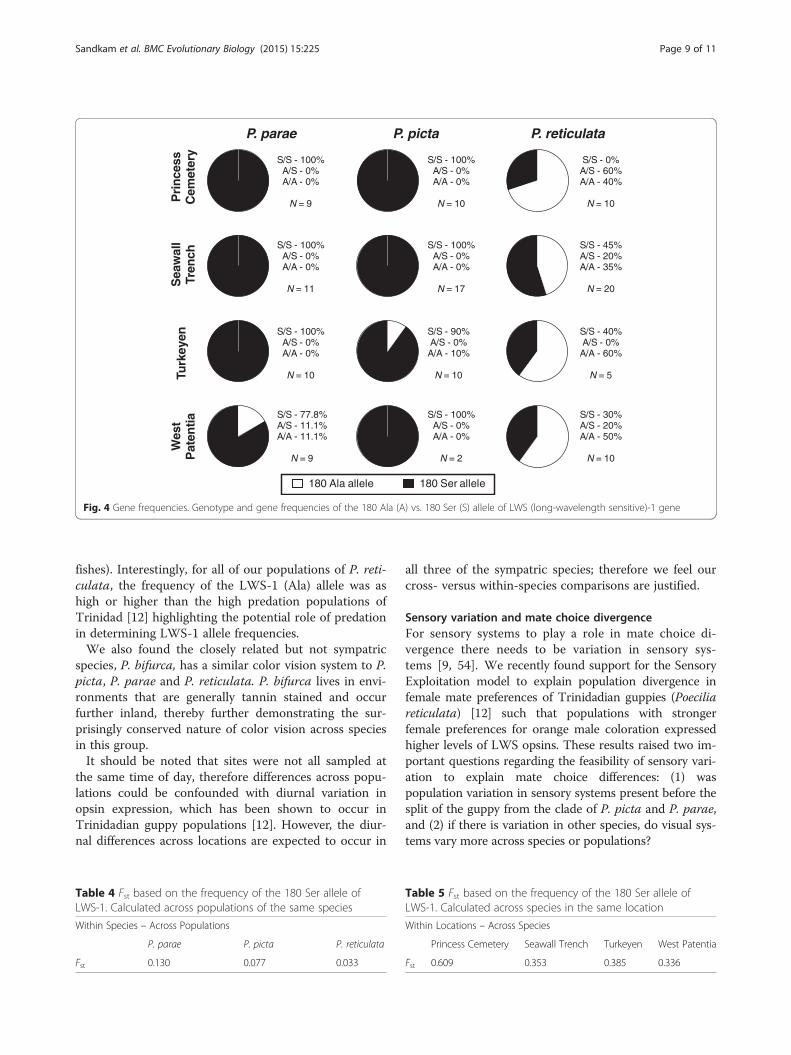
LWS-1 A/S allele frequencyWe found within-species gene frequencies were similaracross locations, but across-species gene frequenciesdiffered within locations such that P. reticulata showedhigher frequencies of the LWS-1 (180 Ala) allele thaneither P. parae or P. picta (Fig. 4). The FST scores weobserved confirmed low differences within species in the
frequency of the serine allele across locations, with themost variation occurring in P. parae (Table 4). Thewithin location differences in frequency of the serineallele observed across species were moderate (Table 5).This is a result of the high frequency of LWS-1 (180Ala) in P. reticulata while it is nearly absent in P. paraeand P. picta. However, while qualitative differences infrequency and FST scores are clear, one should take carewhen interpreting our results quantitatively as the sam-ples sizes were low (ranging from 2–20 individuals)(Fig. 4).
DiscussionIntersexual mate choice was first proposed as a mechan-ism for speciation through divergence in the traits pre-ferred [49]. Over time, divergence of populations haswidely been accepted as the first step toward speciation
SW
S1
SW
S2A
SW
S2B
RH
2-1
RH
2-2
LWS
-1
LWS
-2
LWS
-3
LWS
-R
0.0
0.2
0.4
0.6
Pro
po
rtio
nal
Exp
ress
ion
Princess Cemetary
AB
AB
SW
S1
SW
S2A
SW
S2B
RH
2-1
RH
2-2
LWS
-1
LWS
-2
LWS
-3
LWS
-R
0.0
0.2
0.4
0.6Seawall Trench-Day 1
Pro
po
rtio
nal
Exp
ress
ion
A A
B
A AB
AA
B
A A
B
AB B
A
SW
S1
SW
S2A
SW
S2B
RH
2-1
RH
2-2
LWS
-1
LWS
-2
LWS
-3
LWS
-R
0.0
0.2
0.4
0.6West Patentia
A AB ABA
B
SW
S1
SW
S2A
SW
S2B
RH
2-1
RH
2-2
LWS
-1
LWS
-2
LWS
-3
LWS
-R
0.0
0.2
0.4
0.6Turkeyen
SW
S1
SW
S2A
SW
S2B
RH
2-1
RH
2-2
LWS
-1
LWS
-2
LWS
-3
LWS
-R
0.0
0.2
0.4
0.6Seawall Trench-Day 2
AB
A
B
SW
S1
SW
S2A
SW
S2B
RH
2-1
RH
2-2
LWS
-1
LWS
-2
LWS
-3
LWS
-R
0.0
0.2
0.4
0.6West Watuka
Parae Picta Reticulata Bifurca
Fig. 2 Proportional measures of opsin expression across species and locations. Letters denote significant differences in expression of individualopsins across species within a location. Note: West Watuka has only P. bifurca and was not used in statistical analyses
Table 2 Result of AIC analyses
df SWS1 SWS2A SWS2B RH2-1 RH2-2 LWS-1 LWS-2 LWS-3 LWS-R
Location*Species 13 −156.12 −2015.89 −147.09 −244.66 −847.86 −71.63 −1022.10 −678.85 −626.69
Location 5 −160.52 −2014.14 −154.32 −255.37 −855.18 −78.62 −1024.31 −677.00 −630.76
Species 4 −152.08 −2008.59 −134.21 −250.90 −839.24 −70.27 −1027.32 −669.96 −631.74
AIC values for the ability of models based on Location, Species, or Location*Species to explain variation in proportional measures of opsin expression for eachopsin gene. Bold indicates model with lowest AIC value for each opsin
Sandkam et al. BMC Evolutionary Biology (2015) 15:225 Page 6 of 11

[1]. Therefore, understanding the factors involved inpopulation divergence of mate choice has far reachingimplications to many fields including animal behaviorand evolutionary biology. Sensory Bias models for theevolution of mate preference place a strong emphasis onthe role of sensory system variation in mate preferences[5–9]. However, the extent to which sensory systemsvary across, versus within, species remains largely un-known. Here we describe variation in color vision acrossthree closely related sympatrically occurring species. Wefound that color vision varies across populations butdoes not vary consistently between species across loca-tions. Below we describe the variation we found and dis-cuss our findings in the framework of mate choiceevolution.
Color vision differs across populations within speciesVisual systems are classically thought to show low to novariation across individuals within a species, especiallywhen color vision is modeled in the context of matechoice (such as [19, 50–52]). Yet color vision can varythrough differences in the abundance of different conecell types, amino acid sequences of the opsin proteins,or neural processing of signals from the eyes [34]. Opsinexpression profiles provide an estimate of the ratio of
cone cells expressing different opsins in the eyes, whichcan impact color vision [12, 34, 42, 43]. We present thefirst study of opsin expression in P. bifurca, P. parae andP. picta, and one of the few to carefully compare withinversus between species color vision in similar environ-ments. We demonstrate that color vision in these spe-cies, and sympatric P. reticulata, likely differs acrosspopulations through differences in opsin expression, andcould differ through frequency of an alternative aminoacid sequence.Color vision of P. parae from nearby Guyanan popula-
tions has recently been explored using microspectropho-tometry (MSP) to identify the peak wavelengthsensitivity (λmax) of the cone cells [19]. While P. paraepossess nine opsin genes, Hurtado-Gonzales and col-leagues only found seven cone cell types across individ-uals. This can be explained by the low-to-no expressionof both SWS2A and LWS-2 we found, emphasizing theimportant role of expression in tuning the visual system.While our measures of opsin gene expression provideinsight to differences in color vision, it is possible thatthe exact cone cell proportions could differ frommeasures of proportional RNA expression throughdifferences in non-transcriptional control such as trans-lation rates.
SW
S1
SW
S2A
SW
S2B
RH
2-1
RH
2-2
LWS
-1
LWS
-2
LWS
-3
LWS
-R
0.00
0.05
0.10
0.15
0.20Princess Cemetary
Rel
ativ
e (hk)
Exp
ress
ion
AB
C
BA A
A A
B
AB
AB
A AB B
A AB B
SW
S1
SW
S2A
SW
S2B
RH
2-1
RH
2-2
LWS
-1
LWS
-2
LWS
-3
LWS
-R
0.0
0.2
0.4
0.6Seawall Trench-Day 1
Rel
ativ
e (hk)
Exp
ress
ion
AB
AA
B B
A
BBA
B B
A
B B
SW
S1
SW
S2A
SW
S2B
RH
2-1
RH
2-2
LWS
-1
LWS
-2
LWS
-3
LWS
-R
0.0
0.1
0.2
0.3
0.4
0.5Turkeyen
A ABB
SW
S1
SW
S2A
SW
S2B
RH
2-1
RH
2-2
LWS
-1
LWS
-2
LWS
-3
LWS
-R
0.0
0.2
0.4
0.6
0.8Seawall Trench-Day 2
A ABB
SW
S1
SW
S2A
SW
S2B
RH
2-1
RH
2-2
LWS
-1
LWS
-2
LWS
-3
LWS
-R
0.0
0.2
0.4
0.6
0.8West Patentia
A
B B
A AB B
A AB B
A AB B A A
B B
SW
S1
SW
S2A
SW
S2B
RH
2-1
RH
2-2
LWS
-1
LWS
-2
LWS
-3
LWS
-R
0
1
2
3
4
5West Watuka
Parae Picta Reticulata Bifurca
Fig. 3 Relative(hk) measures of opsin expression across species and locations. Letters denote significant differences in expression of individualopsins across species within a location. Note: West Watuka has only P. bifurca and was not used in statistical analyses
Sandkam et al. BMC Evolutionary Biology (2015) 15:225 Page 7 of 11
The long wavelength-sensitive-1 (LWS-1) opsin is theonly opsin in Poeciliidae known to vary in tuning due todifferences in amino acid sequence. The LWS-1 opsincan either have an Alanine or Serine at the site corre-sponding to the 180th amino acid in the human opsinsequence and is therefore termed: LWS-1 (180 Ala) andLWS-1 (180 Ser) respectively. The frequency of thesetwo alleles varies across populations in P. reticulata[12,33]. This same variation is also thought to be theonly sequence difference in important tuning sites acrossthe species P. reticulata, P. parae, P. picta, and P.bifurca where as the later three have, until now, beenthought to be fixed for either LWS-1 (180 Ala) or (180Ser) [30]. Using the ‘five site rule’ [53], Tezuka et al. [33]estimated the λmax of the LWS-1 (180 Ala) to be~553 nm and LWS-1 (180 Ser) to be ~560 nm. Previ-ously P. parae was thought to possess only one LWS-1allele (180 Ser), however we show that P. parae also pos-sesses the alternate LWS-1 (180 Ala), albeit at a lowfrequency. Interestingly, only 5 out of the 17 individuals(29.4 %) examined by Hurtado-Gonzales et al. [19] pos-sessed cone cells with a λmax of 553 ± 1.9 nm, thismatches the predicted λmax of LWS-1 (180 Ala) [33].The closest location to the populations sampled byHurtado-Gonzales et al. we sampled for this study was
West Patentia, where 22.2 % of individuals had at leastone copy of LWS-1 (180 Ala). The close proximity andlack of geographic barrier between these two popula-tions makes it likely that allele frequencies are similar inthese populations. The close frequencies of individualswith λmax of 553 nm [19] and those with the LWS-1(180 Ala) (this study) suggest variation in allele fre-quency across populations likely explains the presence/absence of cone cell types across individuals and furtherdemonstrates that color vision varies across individualsin P. parae. We found differences across populations inthe frequency of LWS-1 (180 Ala) in all three species(except for the allopatric species, P. bifurca which ap-pears fixed for LWS-1 (180 Ala)) and demonstrate thatcolor vision differs across populations not only in opsinexpression, but also through differences in tuning of theopsins.The frequency of the LWS-1 (180 Ala) allele varies
across P. reticulata populations in Trinidad such thatlow predation populations are nearly fixed for the LWS-1 (180 Ser) allele while high predation populations had agreater frequency of the LWS-1 (180 Ala) allele. All thepopulations we use in this study are in the lowlandregion of Guyana where predation is extremely high(predators include birds, snakes, caiman and many
Table 3 Results of opsin expression ANOVAs using proportional and relative(hk) measures by location
Princess Cemetery Seawall Trench Turkeyen West PatentiaDay 1 Day 2
F(2,27) P F(2,21) P F(2,28) P F(2,23) P F(2,19) P
Proportional Measures SWS1 1.97 0.1590 10.11 0.0008 2.15 0.1350 0.21 0.8100 3.03 0.0722
SWS2A 3.22 0.0556 2.64 0.0951 0.25 0.7810 0.83 0.4500 23.86 <0.0001
SWS2B 0.06 0.9460 1.37 0.2750 1.24 0.3060 0.98 0.3911 2.40 0.1170
RH2-1 0.02 0.9840 9.94 0.0009 2.85 0.0747 2.09 0.1470 0.28 0.7590
RH2-2 0.94 0.4030 4.44 0.0247 0.79 0.4660 1.89 0.1730 8.56 0.0022
LWS-1 3.45 0.0464 10.03 0.0009 5.17 0.0123 1.26 0.3020 0.62 0.5470
LWS-2 1.71 0.1990 4.88 0.0182 0.86 0.4350 1.20 0.3200 4.01 0.0354
LWS-3 0.38 0.6880 2.58 0.0999 2.41 0.1090 0.12 0.8880 0.57 0.5740
LWS-R 0.60 0.5580 1.65 0.2160 0.96 0.3960 1.03 0.3730 1.59 0.2290
Relative(hk) Measures SWS1 8.84 0.0011 19.99 <0.0001 4.35 0.0227 1.14 0.3370 5.30 0.0149
SWS2A 4.22 0.0253 0.90 0.4220 0.76 0.4790 0.75 0.4820 4.47 0.0256
SWS2B 2.71 0.0847 9.98 0.0009 3.85 0.0332 0.73 0.4920 5.55 0.0126
RH2-1 3.46 0.0429 18.74 <0.0001 0.76 0.4760 2.65 0.0922 7.49 0.0040
RH2-2 4.19 0.0259 2.04 0.1550 1.52 0.2370 0.80 0.4630 0.82 0.4550
LWS-1 15.04 <0.0001 2.94 0.0747 2.91 0.0711 3.99 0.0323 13.52 0.0002
LWS-2 10.05 0.0005 5.67 0.0108 0.16 0.8560 0.56 0.5800 1.32 0.2030
LWS-3 1.75 0.1930 11.42 0.0004 1.65 0.2110 0.68 0.5160 0.44 0.6520
LWS-R 1.22 0.3110 2.34 0.1210 1.15 0.3310 1.00 0.3820 0.72 0.5000
RH1 5.55 0.0096 5.73 0.0103 2.66 0.0876 6.19 0.0045 12.64 0.0003
Bold indicates P < 0.05
Sandkam et al. BMC Evolutionary Biology (2015) 15:225 Page 8 of 11
fishes). Interestingly, for all of our populations of P. reti-culata, the frequency of the LWS-1 (Ala) allele was ashigh or higher than the high predation populations ofTrinidad [12] highlighting the potential role of predationin determining LWS-1 allele frequencies.We also found the closely related but not sympatric
species, P. bifurca, has a similar color vision system to P.picta, P. parae and P. reticulata. P. bifurca lives in envi-ronments that are generally tannin stained and occurfurther inland, thereby further demonstrating the sur-prisingly conserved nature of color vision across speciesin this group.It should be noted that sites were not all sampled at
the same time of day, therefore differences across popu-lations could be confounded with diurnal variation inopsin expression, which has been shown to occur inTrinidadian guppy populations [12]. However, the diur-nal differences across locations are expected to occur in
all three of the sympatric species; therefore we feel ourcross- versus within-species comparisons are justified.
Sensory variation and mate choice divergenceFor sensory systems to play a role in mate choice di-vergence there needs to be variation in sensory sys-tems [9, 54]. We recently found support for the SensoryExploitation model to explain population divergence infemale mate preferences of Trinidadian guppies (Poeciliareticulata) [12] such that populations with strongerfemale preferences for orange male coloration expressedhigher levels of LWS opsins. These results raised two im-portant questions regarding the feasibility of sensory vari-ation to explain mate choice differences: (1) waspopulation variation in sensory systems present before thesplit of the guppy from the clade of P. picta and P. parae,and (2) if there is variation in other species, do visual sys-tems vary more across species or populations?
Table 4 Fst based on the frequency of the 180 Ser allele ofLWS-1. Calculated across populations of the same species
Within Species – Across Populations
P. parae P. picta P. reticulata
Fst 0.130 0.077 0.033
Table 5 Fst based on the frequency of the 180 Ser allele ofLWS-1. Calculated across species in the same location
Within Locations – Across Species
Princess Cemetery Seawall Trench Turkeyen West Patentia
Fst 0.609 0.353 0.385 0.336
180 Ala allele 180 Ser allele
P. parae P. picta P. reticulata
Pri
nce
ssC
emet
ery
Sea
wal
lTr
ench
Turk
eyen
Wes
tP
aten
tia
S/S - 100%A/S - 0%A/A - 0%
N = 9
S/S - 100%A/S - 0%A/A - 0%
N = 10
S/S - 0%A/S - 60%A/A - 40%
N = 10
S/S - 100%A/S - 0%A/A - 0%
N = 11
S/S - 100%A/S - 0%A/A - 0%
N = 17
S/S - 45%A/S - 20%A/A - 35%
N = 20
S/S - 100%A/S - 0%A/A - 0%
N = 10
S/S - 90%A/S - 0%
A/A - 10%
N = 10
S/S - 40%A/S - 0%
A/A - 60%
N = 5
S/S - 77.8%A/S - 11.1%A/A - 11.1%
N = 9
S/S - 100%A/S - 0%A/A - 0%
N = 2
S/S - 30%A/S - 20%A/A - 50%
N = 10
Fig. 4 Gene frequencies. Genotype and gene frequencies of the 180 Ala (A) vs. 180 Ser (S) allele of LWS (long-wavelength sensitive)-1 gene
Sandkam et al. BMC Evolutionary Biology (2015) 15:225 Page 9 of 11
We found visual systems do vary in both opsin geneexpression and LWS-1 allele frequency across popula-tions of P. parae, P. picta, and P. reticulata on main-land South America. Although these three speciesoccur in such extreme sympatry that they frequentlyschool together, they exhibit female preferences formales with different color traits [13, 18, 55]. All threeof these species are known to vary in the frequency oftheir respective different male morphs across popula-tions (P. parae [19], P. picta [17], P. reticulata [56]). Itwill be especially interesting for future work to deter-mine if the variation we found in visual systems acrosspopulations correlates with differences in mate choice.As more species are shown to vary in sensory systems
across populations (e.g. Bluefin killifish [43], cichlids [57],stickleback [58], sand goby [59], pied flycatchers [60], gup-pies [12]), Sensory Bias models become a more likely can-didate to explain divergence in mate preferences acrossspecies. This raises the question of whether differences inmate preference across species are maintained throughconsistent differences in their peripheral sensory systems.We found variation in color vision, as measured by opsinexpression, is better explained by location than by speciesfor most of the opsins, showing no consistent differencesacross species. Our data suggest mate preferences arelikely maintained at another level of preference (such ashigher order processing). However, we did find that thefrequency of the LWS-1 (180 Ala) allele not only differsacross populations, but also across species. This raises thepossibility that the minor tuning differences between theLWS-1 (180 Ala) and LWS-1 (180 Ser) alleles could alsoplay a role in mate choice differences across species. It willbe interesting for future work in these species to investi-gate the correlation between color preference and geno-type to further our understanding of visual tuning andmate preference.
ConclusionWe show that color vision, as measured by opsin ex-pression, differs more across populations of the samespecies than across species in the same location. Thesedifferences provide support for Sensory Bias models toexplain population divergence in mate preference sincethese models rely on sensory system differences acrosspopulations. Opsin expression did not differ consist-ently between species across locations, suggesting spe-cies level differences in mate preference are likelymaintained at levels of higher order processing.
Ethics StatementAll work was approved by Simon Fraser UniversityAnimal Care under protocol 982B-06 and the Environ-mental Protection Agency of Guyana under permit #120710 BR 135.
Availability of Supporting Data
– All expression data and R files with statisticalanalyses are available on the Dryad DigitalRepository: http://dx.doi.org/10.5061/dryad.s0054.
– LWS-1 sequences are available on GenBank(accession numbers: KT905869 - KT905998).
Additional files
Additional file 1: Figure S1. Map of field sites in Guyana. (Availableunder a Creative Commons license). (PDF 1766 kb)
Additional file 2: Table S1. Supplementary Tables. (PDF 60 kb)
Abbreviationsλmax: Peak Wavelength sensitivity of a cone cell; AIC: Akaike informationcriterion; B-actin: Beta actin; COI: Cytochrome C oxidase subunit I; LWS: Longwavelength sensitive; MSP: Microspectrophotometry; Myosin HC: Myosinheavy chain; RH2: Rhodopsin-like; SWS: Short wavelength sensitive.
Competing interestsThe authors declare that they have no competing interests.
Authors’ contributionsBAS and FB conceived and designed the project and wrote the manuscript.BAS, GRB, FMWB and FB conducted fieldwork. BAS designed assays andconducted all qPCR work. CMY sequenced all LWS-1 loci.
AcknowledgementsWe wish to thank Orrin Clarke, Selwin France, and Joyce Wade for assistance inthe field; Dr. William Davidson and Dr. Krzysztof Lubieniecki for use of their qPCRmachine at Simon Fraser University; and CEIBA Biological Centre for hosting usduring fieldwork. We thank Dr. Nadia Aubin-Horth and two anonymous reviewerswith Axios Review for insightful feedback on the manuscript. We acknowledgethe Guyana EPA for issuing research permit # 120710 BR 135. This work wassupported by NSERC discovery Grant #138178 to FB, and an AnonymousFoundation grant to GRB for field research in Guyana.
Author details1Department of Biological Sciences, Simon Fraser University, 8888 UniversityDrive, Burnaby V5A 1S6 BC, Canada. 2School of Interactive Arts andTechnology, Simon Fraser University, 8888 University Drive, Burnaby V5A 1S6BC, Canada. 3Department of Biology, University of Missouri-St. Louis, 1University Blvd., 103 Research Building, St. Louis 63121 MO, USA.
Received: 29 September 2015 Accepted: 30 September 2015
References1. Coyne JA, Orr HA. Speciation. Sunderland: Sinauer Associates; 2004.2. Panhuis TM, Butlin R, Zuk M, Tregenza T. Sexual selection and speciation.
Trends Ecol Evol. 2001;16:364–71.3. Andersson MB, Simmons LW. Sexual selection and mate choice. Trends Ecol
Evol. 2006;21:296–302.4. Kuijper B, Pen I, Weissing FJ. A guide to sexual selection theory. Annu Rev
Ecol Evol S. 2012;43:287–311.5. Ryan MJ, Rand AS. Sexual selection and signal evolution: The ghost of
biases past. Philos T Roy Soc B. 1993;340:187–95.6. Basolo AL, Endler JA. Sensory Biases and the evolution of sensory systems.
Trends Ecol Evol. 1995;10:489.7. Endler JA, Basolo AL. Sensory ecology, receiver biases and sexual selection.
Trends Ecol Evol. 1998;13:415–20.8. Boughman JW. How sensory drive can promote speciation. Trends Ecol
Evol. 2002;17:571–7.9. Ryan MJ, Cummings ME. Perceptual biases and mate choice. Annu Rev Ecol
Evol S. 2013;44:437–59.
Sandkam et al. BMC Evolutionary Biology (2015) 15:225 Page 10 of 11

10. Houde AE. Sex, color, and mate choice in guppies. Princeton: PrincetonUniversity Press; 1997.
11. Magurran AE, Ecology E. The Trinidadian guppy. New York: OxfordUniversity Press; 2005.
12. Sandkam B, Young CM, Breden F. Beauty in the eyes of the beholders:colour vision is tuned to mate preference in the Trinidadian guppy(Poecilia reticulata). Mol Ecol. 2015;24:596–609.
13. Liley NR. Ethological isolating mechanisms in four sympatric species ofpoeciliid fishes. Behaviour. 1965;13(Suppl):1–197.
14. Breden F, Ptacek MB, Rashed M, Taphorn D, Figueiredo CA. Molecularphylogeny of the live-bearing fish genus Poecilia (Cyprinodontiformes:Poeciliidae). Mol Phylogenet Evol. 1999;12:95–104.
15. Lindholm AK, Brooks R, Breden F. Extreme polymorphism in a Y-linkedsexually selected trait. Heredity. 2004;92:156–62.
16. Magurran AE, Ramnarine I. Evolution of mate discrimination in a fish. CurrBiol. 2005;15:R867.
17. Lindholm AK, Sandkam BA, Pohl K, Breden F. Poecilia picta, a close relativeto the guppy, exhibits red male coloration polymorphism: a system forphylogenetic comparisons. PLoS ONE - In revision.
18. Haskins CP, Haskins EF. The role of sexual selection as an isolatingmechanism in three species of poeciliid fishes. Evolution. 1949;3:160–9.
19. Hurtado-Gonzales JL, Loew ER, Uy JAC. Variation in the visual habitat maymediate the maintenance of color polymorphism in a poeciliid fish. PLoSONE. 2014;9:e101497.
20. Haskins CP, Haskins EF, McLaughlin JJA, Hewitt RE. Hewitt. Polymorphismand population structure in Lebistes reticulatus, an ecological study. In: W. F.Blair, editor. Vertebrate Speciation.1961. p. 320–395.
21. Luyten PH, Liley NR. Geographic variation in the sexual behaviour of theguppy, Poecilia reticulata (Peters). Behaviour. 1985. doi:10.2307/4534480.
22. Hurtado-Gonzales JL, Uy JAC. Alternative mating strategies may favour thepersistence of a genetically based colour polymorphism in a pentamorphicfish. Anim Behav. 2009;77:1187–94.
23. Magurran AE, Ramnarine IW. Learned mate recognition and reproductiveisolation in guppies. Anim Behav. 2004;67:1077–82.
24. Rodd FH, Hughes KA, Grether GF, Baril CT. A possible non-sexual origin of matepreference: are male guppies mimicking fruit? P R Soc B. 2002;269:475–81.
25. Bourne GR, Watson LC. Receiver-bias implicated in the nonsexual origin offemale mate choice in the pentamorphic fish Poecilia parae Eigenmann,1894. AACL Bioflux. 2009;2:299–317.
26. Gegenfurtner KR, Sharpe LT. Color vision: from genes to perception.Cambridge: Cambridge University Press; 1999.
27. Yokoyama S. Molecular evolution of vertebrate visual pigments. Prog RetinEye Res. 2000;19:385–420.
28. Yokoyama S. Molecular evolution of color vision in vertebrates. Gene.2002;300:69–78.
29. Hoffmann M, Tripathi N, Henz SR, Lindholm AK, Weigel D, Breden F, et al.Opsin gene duplication and diversification in the guppy, a model for sexualselection. P R Soc B. 2007;274:33–42.
30. Ward MN, Churcher AM, Dick KJ, Laver CR, Owens GL, Polack MD, et al. Themolecular basis of color vision in colorful fish: Four Long Wave-Sensitive(LWS) opsins in guppies (Poecilia reticulata) are defined by amino acidsubstitutions at key functional sites. BMC Evol Biol. 2008;8:210.
31. Watson CT, Gray SM, Hoffmann M, Lubieniecki KP, Joy JB, Sandkam BA, et al.Gene duplication and divergence of long wavelength-sensitive opsin genesin the Guppy, Poecilia reticulata. J Mol Evol. 2011;72:240–52.
32. Sandkam BA, Joy JB, Watson CT, Gonzalez-Bendiksen P, Gabor CR,Breden F. Hybridization leads to sensory repertoire expansion in agynogenetic fish, the Amazon Molly (Poecilia formosa): a test of thehybrid-sensory expansion hypothesis. Evolution. 2012;67:120–30.
33. Tezuka A, Kasagi S, Van Oosterhout C, McMullan M, Iwasaki WM, Kasai D,et al. Divergent selection for opsin gene variation in guppy (Poeciliareticulata) populations of Trinidad and Tobago. Heredity. 2014;113:381–9.
34. Horth L. Sensory genes and mate choice: Evidence that duplications,mutations, and adaptive evolution alter variation in mating cue genes andtheir receptors. Genomics. 2007;90:159–75.
35. Fuller RC, Fleishman LJ, Leal M, Travis J, Loew ER. Intraspecific variation inretinal cone distribution in the bluefin killifish, Lucania goodei. J CompPhysiol A. 2003;189:609–16.
36. Fuller RC, Travis J. Genetics, lighting environment, and heritable responsesto lighting environment affect male color morph expression in bluefinkillifish, Lucania goodei. Evolution. 2004;58:1086–98.
37. Cheng CL, Flamarique IN. Opsin expression: new mechanism formodulating colour vision. Nature. 2004;428:279.
38. Cheng CL, Flamarique IN. Chromatic organization of cone photoreceptors inthe retina of rainbow trout: single cones irreversibly switch from UV (SWS1)to blue (SWS2) light sensitive opsin during natural development. J Exp Bio.2007;210:4123–35.
39. Parry JWL, Carleton KL, Spady TC, Carboo A, Hunt DM, Bowmaker JK. Mixand match color vision: tuning spectral sensitivity by differential opsin geneexpression in Lake Malawi cichlids. Curr Biol. 2005;15:1734–9.
40. Shand J, Davies WL, Thomas N, Balmer L, Cowing JA, Pointer M, et al. Theinfluence of ontogeny and light environment on the expression of visualpigment opsins in the retina of the black bream, Acanthopagrus butcheri.J Exp Biol. 2008;211:1495–503.
41. Rosen DE, Bailey RM. The Poeciliid fishes (Cyprinodontiformes), theirstructure, zoogeography, and systematics. Bulletin of the America Museumof Natural History. 1963;126:1–176.
42. Carleton KL, Kocher TD. Cone opsin genes of African cichlid fishes: tuningspectral sensitivity by differential gene expression. Mol Biol Evol.2001;18:1540–50.
43. Fuller RC, Carleton KL, Fadool JM, Spady TC, Travis J. Population variation inopsin expression in the bluefin killifish, Lucania goodei: a real-time PCRstudy. J Comp Physiol A. 2004;190:147–54.
44. Vandesompele, J, De Preter K, Pattyn F, Poppe B, Van Roy N, De Paepe A,Speleman F. Accurate normalization of real-time quantitative RT-PCR databy geometric averaging of multiple internal control genes. Genome Biol.2002;3: RESEARCH0034. http://www.genomebiology.com/content/3/7/RESEARCH0034.
45. Fuller RC, Claricoates KM. Rapid light-induced shifts in opsin expression:finding new opsins, discerning mechanisms of change, and implications forvisual sensitivity. Mol Ecol. 2011;20:3321–35.
46. R Development Core Team. R: A language and environment for statisticalcomputing. R Foundation for Statistical Computing, Vienna, Austria. 2014.
47. Boulcott P, Braithwaite VA. Colour perception in three-spined sticklebacks:sexes are not so different after all. Evol Ecol. 2006;21:601–11.
48. Johnson AM, Stanis S, Fuller RC. Diurnal lighting patterns and habitat alteropsin expression and colour preferences in a killifish. P R Soc B.2013;280:20130796.
49. Darwin C. The descent of man and selection in relation to sex. London:John Murray; 1871.
50. Endler JA. Variation in the appearance of guppy color patterns to guppiesand their predators under different visual conditions. Vision Res.1991;31:587–608.
51. Kemp DJ, Reznick DN, Grether GF, Endler JA. Predicting the direction ofornament evolution in Trinidadian guppies (Poecilia reticulata). P R Soc B.2009;276:4335–43.
52. Cole GL, Endler JA. Variable environmental effects on a multicomponentsexually selected trait. Am Nat. 2015;185:452–68.
53. Yokoyama S, Radlwimmer FB. The “five-sites” rule and the evolution of redand green color vision in mammals. Mol Biol Evol. 1998;15:560–7.
54. Ryan MJ. Sexual selection, sensory systems and sensory exploitation. OxfordSurv Evol Biol. 1990;7:157–95.
55. Bourne GR, Breden F, Allen TC. Females prefer carotenoid colored males asmates in the pentamorphic livebearing fish, Poecilia parae.Naturwissenschaften. 2003;90:402–5.
56. Alexander HJ, Taylor JS, Wu SST, Breden F. Parallel evolution and vicariancein the guppy (Poecilia reticulata) over multiple spatial and temporal scales.Evolution. 2006;60:2352–69.
57. Smith AR, D’Annunzio L, Smith AE, Sharma A, Hofmann CM, Marshall NJ,et al. Intraspecific cone opsin expression variation in the cichlids of LakeMalawi. Mol Ecol. 2010;20:299–310.
58. Flamarique IN, Cheng CL, Bergstrom C, Reimchen TE. Pronounced heritablevariation and limited phenotypic plasticity in visual pigments and opsinexpression of threespine stickleback photoreceptors. J Exp Biol.2013;216:656–67.
59. Larmuseau MHD, Raeymaekers JAM, Ruddick KG, Van Houdt JKJ, VolckaertFAM. To see in different seas: spatial variation in the rhodopsin gene of thesand goby (Pomatoschistus minutus). Mol Ecol. 2009;18:4227–39.
60. Lehtonen PK, Laaksonen T, Artemyev AV, Belskii E, Berg PR, Both C, et al.Candidate genes for colour and vision exhibit signals of selection across thepied flycatcher (Ficedula hypoleuca) breeding range. Heredity.2011;108:431–40.
Sandkam et al. BMC Evolutionary Biology (2015) 15:225 Page 11 of 11