Embed Size (px)
Citation preview
HAL Id: hal-00891077https://hal.archives-ouvertes.fr/hal-00891077
Submitted on 1 Jan 1993
HAL is a multi-disciplinary open accessarchive for the deposit and dissemination of sci-entific research documents, whether they are pub-lished or not. The documents may come fromteaching and research institutions in France orabroad, or from public or private research centers.
L’archive ouverte pluridisciplinaire HAL, estdestinée au dépôt et à la diffusion de documentsscientifiques de niveau recherche, publiés ou non,émanant des établissements d’enseignement et derecherche français ou étrangers, des laboratoirespublics ou privés.
Color vision and color choice behavior of the honey beeW Backhaus
To cite this version:W Backhaus. Color vision and color choice behavior of the honey bee. Apidologie, Springer Verlag,1993, 24 (3), pp.309-331. �hal-00891077�
Review article
Color vision and color choice behaviorof the honey bee
W Backhaus
Institüt für Neurobiologie, Freie Universität Berlin, Königin-Luise-Str 28-30, 1 000 Berlin 33, Germany
(Received 29 October 1992; accepted 22 April 1993)
Summary — A general introduction to color vision in honeybees has been presented. Documentingthe current state of research in this field, the theory of color vision and color choice behavior of thehoneybee has been reviewed. Several tests of the predictions of the theory for behavioral and elec-trophysiological experiments have been presented. The properties of color memory have been de-rived. A complete neuronal interpretation of the color theory has been given. The decision-makingprocess has been discussed with respect to the fluctuations in the neuronal network. In specifically-designed experiments, the information provided by the color vision system has been combined withthe information from other perceptual systems in color choice behavior. Respective extensions of thecolor theory for the bee have been discussed.
Apis mellifera / honey bees / color vision / choice behavior / perception / psychophysics / elec-trophysiology
INTRODUCTION
Honey bees (Apis mellifera L) collect thenectar and the pollen of flowers as foodfor their colony. When performing this
task, honeybees show flower constancy;ie, as Aristotle already mentioned (Gohlke,1951-1961), individual honeybees exclu-sively visit flowers of the same species aslong as nectar is provided. However, hon-eybees are not specialized to forage onspecific flower species. They are general-ists, ie they are able to learn the color andother cues (eg odor and form) of all kindsof flowers. The color of the corolla is used
by the bee as a cue for identifying flowersof the currently visited species from afar.
The odor cue can be used by the bee onlyto confirm that a given flower belongs tothe correct species if the bee is close to
the flower. Thus the better the bee is ableto discriminate the colors of different flow-er species from their respective back-
grounds, and from each other from a dis-tance, the higher the intake of nectar andpollen for the bee colony.
How can such a small animal performthis sophisticated color discrimination andcolor identification task? This question cannow broadly be answered in physiologicaland psychological terms on the basis of acomplete color theory for the honeybeedeveloped by the present author andwhich will be reviewed in this article.
The generalistic foraging behavior ofthe bee (see above) permits color trainingexperiments. Individual bees can betrained to visit color plates by rewardingthem with sucrose solution. In tests, alte-native color plates can be presented in ad-dition to the known plate. During the unre-warded tests, which may last up to 4 min,the experimental bee searches across theexperimental arrangement for a reward. Itvisits the different color plates according totheir similarity to the known plate. Thus theplates which appear most similar to theknown plate to the bee are visited less of-ten; plates which appear to be more differ-ent from the known plate are visited lessoften. The choices can easily be countedby the experimenter. Each test is followedby a training session in which the bee isfed again, thus reinforcing its prior training.The experimental bee takes the sucrosesolution immediately to the hive then re-
turns directly to the experiment within afew minutes with an empty stomach, look-ing highly motivated for the next reward.
Karl von Frisch (1914) was the first todemonstrate in behavioral experiments ofthis kind that bees possess a true colorsense. He demonstrated that honeybeesare able to distinguish a blue-colored card-board from a series of cardboards which
appeared grey to the human eye. Sincethis pioneering work, color vision in honey-bees has been extensively investigated inmore sophisticated experiments. KarlDaumer (1956), a student of Karl von
Frisch, performed color training experi-ments with bees in which he systematical-ly investigated which mixtures of 3 mono-chromatic lights appear indistinguishableto the bee. He showed that bees must be
trichromats, ie that 3 different photorecep-tor types (UV,B,G) contribute to the colorvision system of the bee. Von Helversen(1972) measured discrimination of mono-chromatic lights in terms of a completewavelength discrimination function. Wave-
length discrimination is best around400 nm and also 490 nm. Menzel (1981)measured the thresholds for chromatic/achromatic vision in color training experi-ments with achromatic light and monochro-matic lights exclusively varied in intensityover 12 log-units which covers the entirerange from dark to bright daylight.
Neuronal color coding was also investi-gated by intracellular recording techniques.Since the first recordings of Autrum andvon Zwehl (1964), spectral sensitivities ofthe photoreceptors in honeybees havebeen repeatedly measured with increasingaccuracy. Menzel et al (1986) measuredthe spectral sensitivity functions of the pho-toreceptors intracellularly with high accura-cy with the help of a fast spectral scanmethod. This method allowed measure-
ment of the entire spectral sensitivity func-tion of a photoreceptor in 4-nm steps in therange of 300-696 nm within 16 s. Sincethe receptor potential was kept (light-clamped) at low excitation values, themeasurements were not disturbed by ad-aptation effects. These light clamp spectralsensitivity measurements are suitable for
physiological simulation purposes. In addi-tion, examples of spectral sensitivities of
monopolar cells have been measured
(Menzel, 1974; de Souza et al, 1992). Kienand Menzel (1977a,b) recorded 3 main
types of color coding interneurons from theoptic lobe: 1) broad band neurons whichhave a broad spectral sensitivity; 2) narrowband neurons which respond exclusively tospecific monochromatic lights; and 3) coloropponent coding neurons, which show ex-citation (increase of the resting spike fre-quency) to monochromatic lights of certainwavelength ranges and inhibition (de-crease in resting spike frequency) to otherwavelength ranges. Two subtypes of thelatter neuron type were found: a) neuronswhich respond only to changes in light in-tensity (phasic neurons); or b) neurons
whose response to a steady light intensity
is sustained (tonic neurons). The neuronsmost likely to be essential for color visionwere the tonic color opponent neurons,
and they were most extensively studied.Only 2 different types of such opponentcoding neurons were found (see below).
Although the brain of the honeybee is
much simpler than the human brain it nev-
ertheless possesses ca 850 000 neurons,half of which are visual (Hertel and Ma-ronde, 1987). The color vision system ofthe bee thus cannot be understood from
electrophysiological and neuroanatomicalstudies alone. Nevertheless, it was sus-
pected by the author that the representa-tion of the world in the bee brain follows a
quite simple logic, comparable to that in
humans, and thus might be structurallysimilar to our own. So the author con-
ceived the idea to apply theoretical meth-ods from psychology, especially psycho-physics, to the results of speciallydesigned behavioral experiments with hon-eybees, and to design relatively simple butnevertheless physiologically adequatemodels of the neuronal color coding sys-tem of the bee. This approach bridged thegap between electrophysiology and behav-ioral biology. The result was a comprehen-sive theory of color vision and color choicebehavior of the honeybee which has with-stood rigorous testing. This theory will bedeveloped step by step in the followingchapters. Since the color theory for the
bee was derived using the methods of hu-man psychophysics, a short introduction toperceptual psychology is given in the nextsection for non-specialists.
Human psychophysics
Human perception represents the stimuli ofthe outer world internally in terms of quali-tatively different perceptual attributes. Thenumber of attributes or perceptual dimen-sions depends on the sensory system (mo-
dality). In the case of human color vision,the color stimuli are represented internallyas color sensations (color) which consist of6 unique (elementary) color sensations:
blue-, yellow-, red-, green-, black- and
whiteness (Hering, 1905) in different pro-
portions which also constitute the 3 per-ceptual attributes, hue, saturation (the op-posite of whiteness), and brightness (egWyszecki and Stiles, 1982). Since the per-ceptual attributes differ qualitatively fromeach other, they will never be confused.Two different stimuli which affect the same
modality (eg color vision) are distinguisha-ble due to differences in the quantities ofthe perceptual attributes. Psychophysicalinvestigations have shown that the extentof individual (one-dimensional) perceptualattributes is adequately described by linearscales, ie the quantity of a perceptual at-tribute is well represented by certain val-ues (numbers) on the respective scales.Since the attributes are qualitatively differ-ent from each other, a mathematical de-
scription of the structure of perception is
obtained by combining the scales orthogo-nally to each other in order to build the ba-sis for a metric space. The mathematical
concept of metric spaces turned out to bevery useful for a more detailed determina-
tion of the structure of perception. In stimu-lus discrimination experiments, for exam-
ple, the total subjective difference between2 stimuli can be easily judged. The subjectis then asked whether a stimulus is differ-
ent from a standard stimulus or not. In an-
other type of experiment (similarity experi-ment), the person is asked which one of 2test stimuli is more similar to a third (stan-dard) stimulus. Analysis of the results ofboth types of experiments showed that thetotal subjective difference between 2 stim-uli can simply be derived by a combinationrule from the differences in the amounts of
the specific attributes. In the case of hu-
man color vision, for example, this rule is
identical to the theorem of Pythagoras (Eu-
clidean metric). That is, the total color dif-ference between 2 color stimuli is just cal-culated as the square root of the sum ofthe squared differences in the values rep-resenting the stimuli on the separatescales (eg Sixtl, 1982).
The psychological concept of perceptual spaces
More mathematically speaking, the struc-ture of perception is well represented bymetric spaces (perceptual spaces). Thesespaces are spanned by the orthogonallyarranged scales, also called the dimen-sions of the perceptual space. Psycho-physicists have found that perception inhumans is in general adequately de-scribed by perceptual spaces possessingthe general class of Minkowski metrics (egAhrens, 1974). The subjective difference dbetween 2 stimuli S is derived from the dif-ferences in the respective scale values X,where D is the number of scales (dimen-sions) and m is the Minkowski parameter:
Minkowski metrics include as special cas-es the Euclidean metric (m = 2, shortestline, ie straight line in space), the city-block metric (m = 1, eg length of a walkingpath in a city with an equally spaced rec-tangular network of streets as in Manhat-tan, New York) and the dominance metric(m-->∞, only the greatest of the differenc-es on the scales contributes to the total dif-ference between 2 stimuli S).
Scaling methods
Multidimensional scaling analysis (Torger-son, 1958; Kruskal, 1964a,b) permits the
determination of the number of dimensionsand the metric of a perceptual space. Foreach parameter combination for the num-ber of dimensions D and the Minkowski pa-rameter m, the scale values of the stimuliare varied by special numerical proce-dures. The procedure determines the scalevalues which allow the best possible repro-duction of the measured choice percentag-es. The lowest number of dimensions Dwhich gives an acceptable fit and the Min-kowski parameter m, which gives the bestfit for this number of dimensions, deter-mine the perceptual space.
THE PERCEPTUAL COLOR SPACEOF THE HONEYBEE
The scaling methods for human perception(see above) were applied by the author tothe choice percentages of honeybeesmeasured in color similarity experiments.This does not mean that bees are necessar-
ily supposed to possess conscious colorsensations. As becomes obvious from the
concept of perceptual color spaces (seeabove), this only supposes that color per-ception in bees is structurally comparable tocolor perception in humans. The results ofthe multidimensional scaling analysisshowed that this supposition holds for thehoneybee. In a first step, the author showedby statistical analysis (Monte-Carlo simula-tion) of measured choice percentages withrespect to measured error bars that thechoices obtained from the bee are accu-rate enough for MDS analysis (Backhausand Menzel, 1984). On the basis of this re-sult, the author suggested color similarityexperiments specifically designed for MDSanalysis of measured choice percentagesso as to determine the perceptual color
space of the bee. According to the methodof triads (Torgerson, 1958), the measure-ments (a sketch of the experimental ar-
rangement is shown in figure 1) were per-
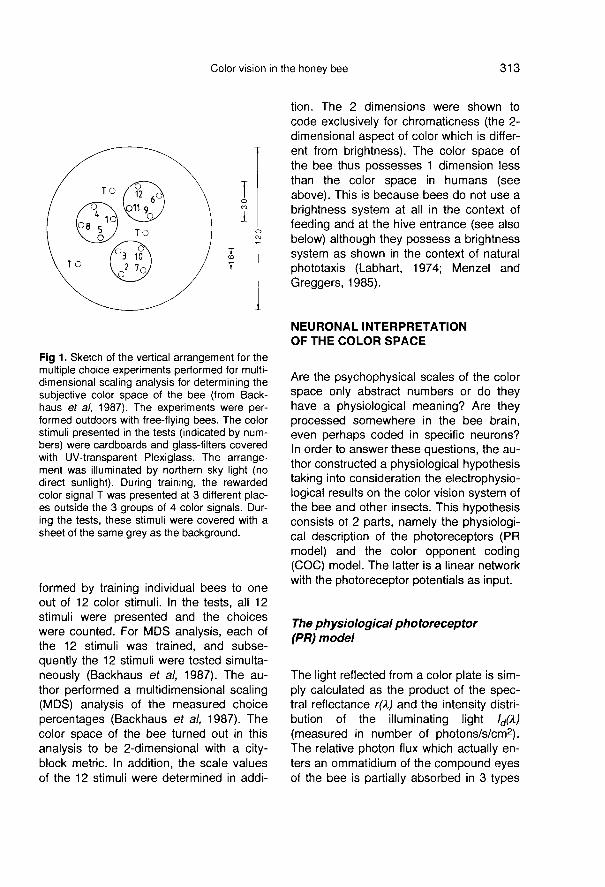
formed by training individual bees to oneout of 12 color stimuli. In the tests, all 12 stimuli were presented and the choiceswere counted. For MDS analysis, each ofthe 12 stimuli was trained, and subse-
quently the 12 stimuli were tested simulta-neously (Backhaus et al, 1987). The au-thor performed a multidimensional scaling(MDS) analysis of the measured choice
percentages (Backhaus et al, 1987). Thecolor space of the bee turned out in this
analysis to be 2-dimensional with a city-block metric. In addition, the scale valuesof the 12 stimuli were determined in addi-
tion. The 2 dimensions were shown to
code exclusively for chromaticness (the 2-dimensional aspect of color which is differ-ent from brightness). The color space ofthe bee thus possesses 1 dimension lessthan the color space in humans (seeabove). This is because bees do not use abrightness system at all in the context of
feeding and at the hive entrance (see alsobelow) although they possess a brightnesssystem as shown in the context of naturalphototaxis (Labhart, 1974; Menzel and
Greggers, 1985).
NEURONAL INTERPRETATIONOF THE COLOR SPACE
Are the psychophysical scales of the colorspace only abstract numbers or do theyhave a physiological meaning? Are theyprocessed somewhere in the bee brain,even perhaps coded in specific neurons?In order to answer these questions, the au-thor constructed a physiological hypothesistaking into consideration the electrophysio-logical results on the color vision system ofthe bee and other insects. This hypothesisconsists of 2 parts, namely the physiologi-cal description of the photoreceptors (PRmodel) and the color opponent coding(COC) model. The latter is a linear networkwith the photoreceptor potentials as input.
The physiological photoreceptor(PR) model
The light reflected from a color plate is sim-ply calculated as the product of the spec-tral reflectance r(λ) and the intensity distri-bution of the illuminating light Id(λ)(measured in number of photons/s/cm2).The relative photon flux which actually en-ters an ommatidium of the compound eyesof the bee is partially absorbed in 3 types
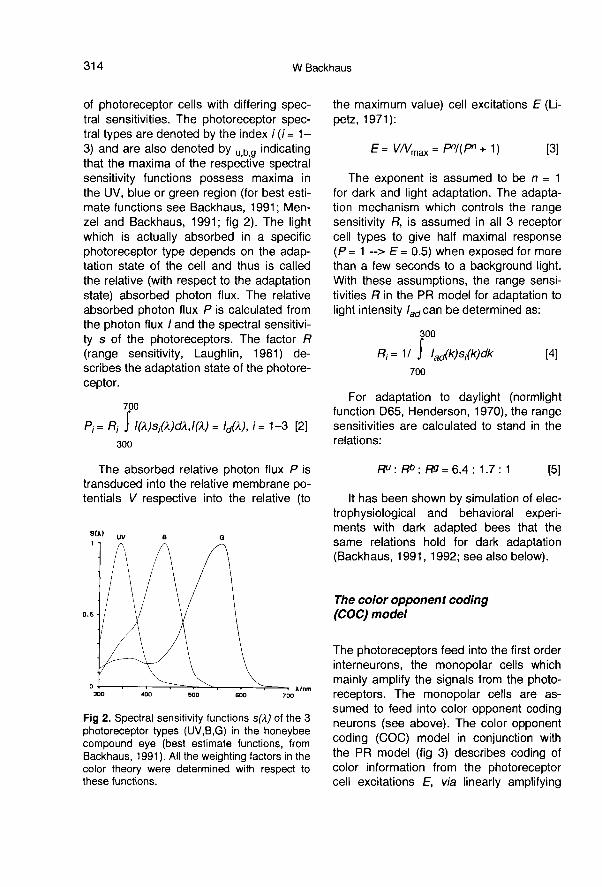
of photoreceptor cells with differing spec-tral sensitivities. The photoreceptor spec-tral types are denoted by the index i (i = 1-3) and are also denoted by u,b,g indicatingthat the maxima of the respective spectralsensitivity functions possess maxima inthe UV, blue or green region (for best esti-mate functions see Backhaus, 1991; Men-zel and Backhaus, 1991; fig 2). The lightwhich is actually absorbed in a specificphotoreceptor type depends on the adap-tation state of the cell and thus is calledthe relative (with respect to the adaptationstate) absorbed photon flux. The relativeabsorbed photon flux P is calculated fromthe photon flux / and the spectral sensitivi-ty s of the photoreceptors. The factor R(range sensitivity, Laughlin, 1981) de-scribes the adaptation state of the photore-ceptor.
The absorbed relative photon flux P istransduced into the relative membrane po-tentials V respective into the relative (to
the maximum value) cell excitations E (Li-petz, 1971):
The exponent is assumed to be n = 1
for dark and light adaptation. The adapta-tion mechanism which controls the rangesensitivity R, is assumed in all 3 receptorcell types to give half maximal response(P = 1 --> E = 0.5) when exposed for morethan a few seconds to a background light.With these assumptions, the range sensi-tivities R in the PR model for adaptation tolight intensity Iad can be determined as:
For adaptation to daylight (normlightfunction D65, Henderson, 1970), the rangesensitivities are calculated to stand in therelations:
It has been shown by simulation of elec-trophysiological and behavioral experi-ments with dark adapted bees that thesame relations hold for dark adaptation(Backhaus, 1991, 1992; see also below).
The color opponent coding(COC) model
The photoreceptors feed into the first orderinterneurons, the monopolar cells which
mainly amplify the signals from the photo-receptors. The monopolar cells are as-
sumed to feed into color opponent codingneurons (see above). The color opponentcoding (COC) model in conjunction withthe PR model (fig 3) describes coding ofcolor information from the photoreceptorcell excitations E, via linearly amplifying
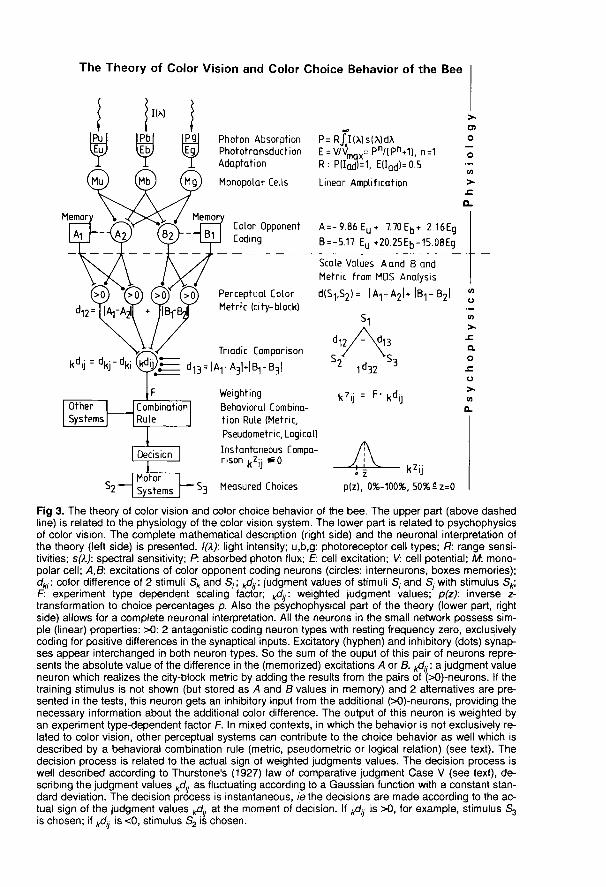
tonic monopolar cells, by 2 linear oppo-nent coding neuron types A and B (Back-haus, 1987, 1988a, 1991):
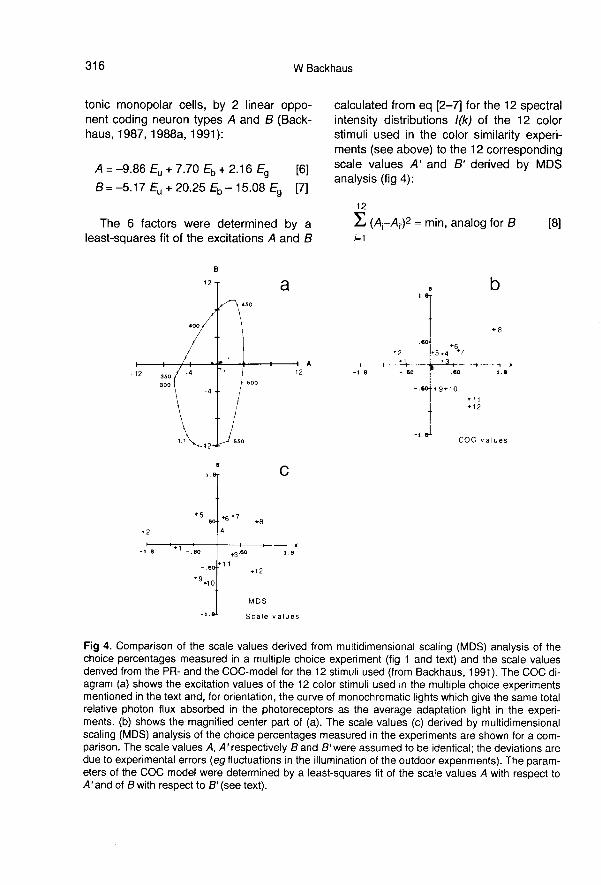
The 6 factors were determined by aleast-squares fit of the excitations A and B
calculated from eq [2-7] for the 12 spectralintensity distributions I(k) of the 12 colorstimuli used in the color similarity experi-ments (see above) to the 12 correspondingscale values A’ and B’ derived by MDSanalysis (fig 4):
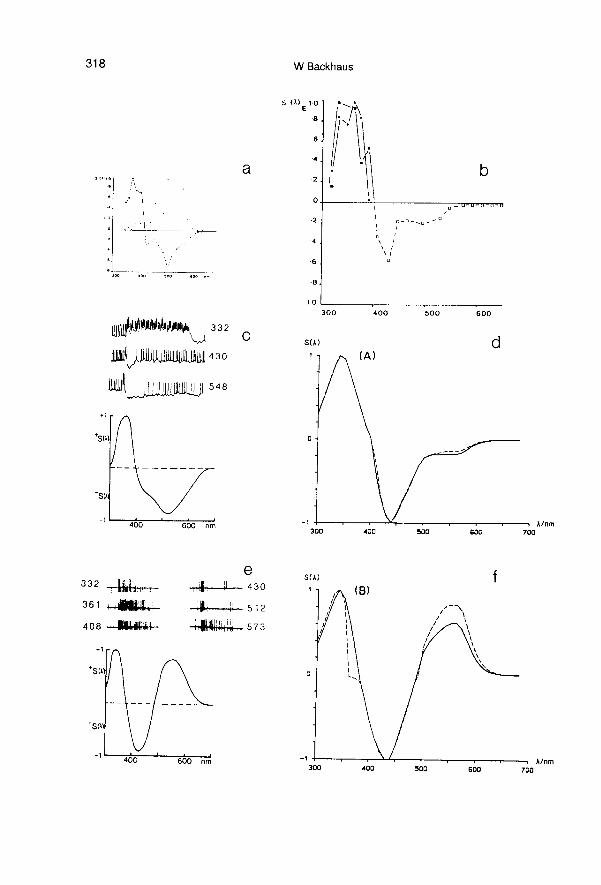
Neither the magnitude nor the sign ofthe 6 weighting factors (numbers in eq [6,7] were preset. Nevertheless, the signs ofthese factors were determined to be identi-
cal, and the magnitudes are very close tothose of the 2 types of tonic color oppo-nent coding neurons (Type A: UV-B+G+,Type B: UV-B+G-) exclusively found by in-tracellular recording from the optic lobes ofthe bee brain (Kien and Menzel, 1977b). Asimulation of the electrophysiologicalmeasurements of the spectral sensitivity ofthe color opponent coding neurons A and Bshows a close correspondence to the meas-ured spectral sensitivities (see fig 5). Thisshows that the MDS-scales are not merelymathematical constructs, but are identical tothe excitations of the 2 types of color oppo-nent coding cells in the bee’s brain.
THE PSYCHOPHYSICAL (MDS) MODEL
Since the MDS scale values were shownto be identical to the excitations of the col-or opponent coding neurons A and B, thechoice percentages can be calculated forany stimulus whose spectral intensity dis-tribution is known. All that is necessary isfirst to calculate the excitations A and B ac-
cording to the COC model in conjuctionwith the PR model (eq [2-7]) and then tocontinue with the calculations according tothe psychophysical (MDS) model used in
the MDS analysis. With this psychophysi-cal extension to the physiological hypothe-sis, the color difference d between 2 stimu-li S1 and S2 can be derived directly via thecity-block metric from the excitations A andB in the 2 types of color opponent codingneurons instead of scale values obtained
by MDS analysis:
Color differences can be directly meas-ured in color discrimination experiments. In
such experiments, the bee is 1 color stimu-lus and in the tests this stimulus is present-ed simultaneously with an alternative colorstimulus. In color similarity experiments,the trained stimulus Sk is not presented inthe tests. According to the method of triads(Torgerson, 1958), only the 2 alternativesS1 and S2 are shown, both of which are dif-ferent from the trained stimulus. The 2 col-or differences d12 = d(S1,S2) and d = d(S1S2) between the trained color stimulusS1 and the 2 alternatives S2 and S3 are
subtracted from each other in order to givethe judgment values 1d23 which reads in
general notation:
In the case of color difference experi-ments (dkj = 0) the judgment value kdij is
simply the color difference dki between the
training stimulus Sk and the alternative Si.
THE MODEL OF COLOR CHOICEBEHAVIOR (CCB)
In the model of color choice behavior
(CCB) the judgment values kdij are scaled
by an experiment-type-dependent factor Fin order to give so-called z-values (Back-haus, 1992):
F is a global scaling factor which gaugesthe judgment values with respect to themaximum choice percentage obtained
(87-100%) in the respective experiment(see below). From z-values, the choice
probabilities p are directly derived by in-
verse z-(probability) transformation (Tor-gerson, 1958). This can either be per-formed by looking up the respective p(z)values in a table (eg Torgerson, 1958). Orthe transformation can be calculated in a
good approximation (after Zielinski, 1978)by:
This allows us to predict with eq [2-12]measurable color choice percentages (p x100%) exclusively from the spectral inten-sity distribution of the stimuli with the ex-periment-type-dependent factor F as the
only open parameter in the entire theory. Itis obvious from eq [11,12] that this factor isjust a scaling factor and has no influenceon the general form of the choice-
percentage functions.
It turned out (see examples below) thatthe results are sufficiently accurate, if the
spectral intensity distributions (spectral in-
tensity distribution times reflectance of thestimuli) are measured in 4-nm steps and if
the integrals are approximated by the sumof the results of the multiplications per-formed for the 4-nm intervals. In the caseof multiple color discrimination experi-ments, in the tests several alternatives are
presented in addition to the trained stimu-lus. In the case of multiple color similarityexperiments, many alternatives which all
differ from the training stimulus are shownin the tests. Dual choice proportions, asmeasured in color discrimination or triadiccolor similarity experiments, can also beobtained from the choice frequenciesmeasured in the corresponding type of
multiple choice experiment. Since beeschose the color stimuli statistically inde-
pendently (von Helversen, 1972; Dittrich,1992), the choice probabilities for each 2color stimuli can be directly calculated fromthe choice frequencies obtained in multiplechoice experiments (Guilford, 1937; Back-haus et al, 1987):
Multiple choice experiments allow us to ob-tain almost the same information as dualchoice experiments but in much less time.The complete measurement of the similari-ty relations between 12 stimuli would need660 dual choice experiments, whereas
only 12 multiple choice experiments haveto be performed to obtain all the dualchoice percentages. The only disadvan-tage of the latter method is that not all ofthe derived choice percentages are statisti-
cally independent, because the same
choice frequencies are used several timesin different combinations. This preventsthe application of tests of significance tothe whole set of derived dual choice per-centages. However, the predicted and themeasured choice percentages can be pair-wise compared with each other and testedfor significant differences.
Determination of the experiment-type-dependent scaling factor
The experiment-type-dependent scalingfactor F, the only open parameter in theentire theory, can be determined for bestfit of the predicted to the measured choicepercentages. For this purpose it is conven-ient to calculate first the regression line
(eg Sachs, 1976) between the predictedjudgment values d (eq [10]) and the meas-ured choice percentages p transformed bythe inverse of eq [12] with F = 1 (z-transformation) given here for the reader’sconvenience when applying the color theo-ry to measured data:
The experiment type-dependent factor Fcan be read off directly as the steepnessparameter determined by linear regressionanalysis of the measured z(p)-values (eq[14]) with respect to the predicted d-values(eq [10]). The multiplication of the predict-ed d-values by this factor F gives the pre-dicted z-values (eq [11]). It has to be point-ed out that scaling of the d-values by Fdoes not change the correlation coefficientbetween the predicted and the measuredvalues. However, the steepness parame-ter becomes unity indicating the best fit be-tween the predicted and the measuredchoice percentages is obtained and thusthe proper factor F is determined.
SIMULATIONS OF BEHAVIORALAND ELECTROPHYSIOLOGICALEXPERIMENTS
The hypotheses of color vision and colorchoice behavior of the bee presented allowus to calculate predictions for behavioral aswell as for electrophysiological experiments.This has been done for several critical ex-
periments in order to test the hypotheses.
The Bezold-Brücke effect existsin the bee as predicted
Intensity differences do not explicity con-tribute to the total color difference (eq [2-9]. However, color difference depends indi-rectly on intensity, because the nonlineari-ty of the photoreceptors does not allow fora coding of chromaticness totally indepen-dent of changes in intensity. Thus, it wasshown by the author that intensity-dependent color shifts (the Bezold-Brückeeffect) must also occur in the color visionsystem of the honeybee. The analysisshowed that the 3 gain values of eq [6] andeq [7] each add up to zero. This finding im-plies that if the phototransduction processfollowed a logarithmic function, the color vi-sion mechanisms would code chromatic-ness totally independently of intensitychanges (Backhaus, 1991). This findingmight be of special interest from the eco-logical and evolutionary point of view sincethe phototransduction process is indeedwell approximated by a logarithmic func-tion over = 1 log-unit about the adaptationintensity. If the bee is looking at natural
scenary (eg flowers on grass) the Bezold-Brücke effect is indeed minimal. Since thetransduction function does not exactly fol-low a logarithmic function (eq [2]), the Be-zold-Brücke effect must be greatest wherethe deviations are greatest, namely at veryhigh and very low light intensities (Back-
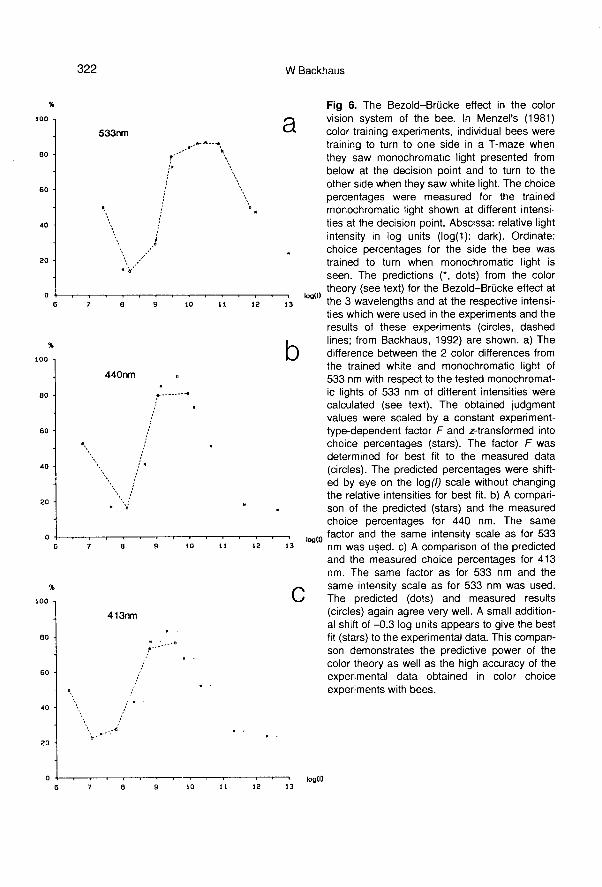
haus, 1991), ie the more unnatural the vis-ual task. The magnitude and the course ofthe Bezold-Brücke color shifts with respectto changes in light intensity is very sensi-tive to the values of the weighting factorsof the color opponent coding (COC) sys-tem. Thus the comparison of the predic-tions for the Bezold-Brücke effect for the
bee (Backhaus, 1991) with experimentalresults are the most critical test for the ex-istence of color opponent coding in bees.
Evidence that the Bezold-Brücke effectdoes indeed exist in bees was provided bytheoretical investigations (Backhaus, 1992)of the results of an experiment (Menzel,1981) which was performed much earlierfor completely different purposes, namelyfor the determination of the behavioral
thresholds of achromatic and chromatic vi-sion. In these experiments, individual beeswere trained to turn to one side in a T-
maze if they saw a white light at the deci-sion point and to turn to the other side if
they saw a monochromatic light. In the
tests, the monochromatic light was shownat different intensities. In figure 6 the
choice percentages of the bee for the sidefor the learned color are drawn over the in-
tensity of the training monochromatic lightpresent at the decision point during thetests. At very low intensities, below the ab-solute threshold of the photoreceptors, thebee does not see any light at all (see be-low) and thus walks randomly in the T-
maze (50% : 50%). At low intensities (1 logunit above threshold) the bee’s choices in-dicate that the monochromatic light ap-
pears achromatic to the bee. At medium in-
tensities (3 log units above threshold), thebee shows that the monchromatic light ap-pears chromatic as during training. At high-er intensities (> 5 log units above thresh-old), the monochromatic light appearsonce again to be achromatic to the bee.Figure 6 shows a comparison of the pre-dictions (stars and dots) for the Bezold-
Brücke effect with the measured results
(dashed lines, circles). In all 3 cases (413,440 and 533 nm) the fit is striking.
In Menzel’s (1981) experiments, the
bees discriminate a trained monochromatic
light of a certain wavelength from an alter-native of the same wavelength at differentintensities. The striking fit of the predictedto the measured choice percentages con-clusively shows that honeybees do not usea brightness system for intensity discrimi-nation experiments even where the intensi-ty range covers the entire physiologicallyrelevant range from dark (log(I) = 0, nomeasurable effect of light) to 12 relative
log-intensity units which compares with
bright daylight. This result has been re-
cently confirmed by a simulation (Brandt etal, 1993) of a behavioral experiment of vonHelversen (1972) in which he determinedthe threshold sensitivity function (313 -666 nm) covering almost the entire wave-length range visible to the bee over an in-tensity range comparable with that testedin Menzel’s (1981) experiment.
These results clearly demonstrate thatin general care must be taken if sensory
systems are postulated to exist in an or-
ganism for operational reasons alone. Thereactions of an organism to light intensitydifferences do not demonstrate conclusive-
ly that a brightness system is involved in
light discrimination. The reaction might bedue solely to intensity-dependent chromat-icness changes (Bezold-Brücke effect) asis the case in the honeybee.
Additional tests
Several further behavioral and electro-
physiological experiments were simulated.The scaling factor F was determined foreach experiment type (see above). All oth-er parameters had the constant values asdescribed above (eq [2-13]; fig 3). The re-sults of the following behavioral and elec-trophysiological experiments were quanti-
tatively predicted and tested by compari-son with the respective experimental data.All the predictions were confirmed by theexperimental results given below. Thus thehypotheses of the author on color visionand color choice behavior of the beeachieved the status of a theory:Behavior: 1) color discrimination and colorsimilarity with respect to the training stimuliin dual and multiple choice experiments(Backhaus et al, 1987; Dittrich and Back-
haus, 1991); 2) Bezold-Brücke color shifts(quantitatively predicted by Backhaus
(1991) shown to exist by a comparison ofthe results of Menzel’s (1981) experimentswith the results of a simulation of these ex-
periments by Backhaus (1992)); 3) the
wavelength-discrimination function (com-parison of the results of von Helversen’s
(1972) experiments with the results of asimulation of these experiments (Backhaus,1991); 4) the threshold spectral sensitivityfunction (measured by von Helversen,1972; simulated by Brandt et al, 1993) mul-tiple choice experiments with chromaticallyfiltered illumination, where color constancyholds and even where color constancy fails(Brandt et al, 1989); 6) experiments withneighboring color stimuli, where color shiftsoccurred by color induction (measurementsand simulation by Dittrich, 1992). Thus bothcolor induction and color constancy is ex-
plained in bees as being exclusively due toadaptation in the photoreceptors.Electrophysiology: 7) the form of the re-
sponse/log(I)-functions of tonic color oppo-nent coding neurons (measurements byKien and Menzel, 1977a; Hertel, 1980;simulations by Backhaus, 1991); 8) spec-tral sensitivity-functions of tonic color oppo-nent coding neurons (measurements byKien and Menzel, 1977b; spectral sensitivi-ty functions derived in Menzel and Back-
haus, 1989; simulations by Backhaus,1991; see fig 5).
The close fit of observation to theory im-plicity confirms that: 1) the bee does not
use a brightness system in color trainingexperiments; 2) the MDS scale values areactually coded in 2 classes of neurons inthe bee brain; 3) the photoreceptors showabout half of the maximum response when
exposed to an adapting light; 4) the ratiosof the receptors’ range of sensitivities Rare identical for dark adaptation and for ad-aptation to daylight (Backhaus, 1992); 5) inthe case of adaptation to achromatic light,the range of sensitivities R adapt indepen-dently of each other; 6) transduction in thephotoreceptors is nonlinear; 7) on the oth-er hand, color opponent coding is linear; 8)the perceptual color difference can be de-rived via the city-block metric from the exci-tations of the 2 types of color opponentcoding neurons; 9) color similarity judg-ments in triadic experiments are performedby a comparison (subtraction) of the 2 colordifferences between the training stimulusand the alternatives; 10) the judgment val-ues are weighted by an experiment- type-dependent factor F; 11) the fluctuations inthe judgment values are constant, ie Thur-stone’s (1927) law of comparative judg-ment, case V holds; 12) the choice processis instantaneous; 13) the choice percentag-es can be derived from the weighted judg-ment values by z-transformation.
COLOR MEMORIES
As mentioned in the introduction, honey-bees learn the color of the corolla of the
currently visited flower species which ena-bles flower constancy during foraging.Likewise, in color similarity experiments inwhich the training stimulus is not present inthe tests, the information on the trainingcolor stimuli must be stored in memory forthe determination of the color differencesthat are most important for the choice be-havior (see above). As demonstrated, thecolor theory for the honeybee describesthe results of this type of experiment very
well. It is even possible to derive from thistheory information on the organization ofthe color memory in the bee: 1) since noinformation on the intensity of the colorstimuli is used in the choice behavior (seeabove), it appears very unlikely that the 3excitation values of the photoreceptors willbe stored in 3 independent memories.Since the photoreceptors provide informa-tion only on the intensity of the light stimu-li, color information would have to be cal-culated via opponent color coding neuronsbefore each comparison, which would bevery uneconomic with respect to the num-ber of neuronal circuits needed; 2) on theother hand, the information on the trainedcolor cannot be stored as only one value.This is because the separate informationof the 2 scale values A and B would belost in this case and both the scale valuesare always needed for the determination ofthe color difference d between 2 stimuli S
(see eq [3]). Thus it appears to be most
likely that the information on a learned col-or, namely the 2 excitation values A and B,is stored separately in 2 independentmemories (A1 and B1). These 2 memorieshave to be associated with each other inorder to allow recall of the 2 values that
belong to a specific stimulus. This type ofmemory organization allows straightfor-ward determination of the color differences
d12 and d13 between the learned color (A1and B1) and eg 2 alternative colors (A2, A3and B2, B3) (see fig 3).
NEURONAL INTERPRETATIONOF THE COLOR THEORY
The color theory (eq [1-14]) for the honey-bee allows a complete neuronal interpreta-tion (fig 3) by a small number of neuronswith simple (linear) properties, not only forthe parts which were derived mainly fromphysiology (PR and COC models) but alsofor the psychophysical parts (MDS model).
Neuronal interpretationof the city-block-metric
The absolute values in the differences ofthe excitations A and B cannot be deter-mined by a single neuron. But 2 neuronswith zero resting frequency can easily de-rive this measure. These neurons code ex-
clusively positive differences of the synap-tical input. This is because neurons withzero resting frequency can only respondby rising (>0) and not with lowering theirspike frequency. The individual (>0)-neurons of such a pair appear to have ex-changed excitatory and inhibitory synap-ses (fig 3). The sum of their respective out-puts provides the absolute differences inthe excitation values A and B. This sum is
provided by the judgment-value-neuron kdijwhich thus realizes the city-block metric.
The neuronal interpretationof the judgment values
In the triadic color similarity experiments(see above), the judgement value neuron
kdij must get inhibitory input from additional(>0)-neurons, that provide the informationon the color difference from the trainingcolor stimulus to the second alternative.The difference between the 2 color differ-ences is performed via inhibitory and excit-atory input from the (>0)-neurons. Sincethe judgment values can be either positiveor negative, this neuron must possess aresting frequency comparable to that of thecolor opponent coding neurons.
Neuronal fluctuationsand the decision process
The judgment process in triadic experi-ments (see above) implicite in the MDS-model (Thurstone’s (1927) law of compara-
tive judgment, case V; Torgerson, 1958)can be described as follows: the 2 color
differences, between the trained stimulusand the 2 alternatives, show fluctuationswhich are statistically independent of eachother, and are described by Gaussianfunctions with equal standard deviations.The difference between 2 color differencesthat is coded in the judgment value neuronshows fluctuations that are also Gaussian-distributed with a constant SD. The latterfluctuations might be caused by the con-stant fluctuations from the (>0)-neurons,might be due to the intrinsic fluctuations ofthe judgment value neuron itself, or
caused by a combination of both. The deci-sion process is instantaneous, ie the stimu-li are chosen according to the actual signof the weighted judgment value at the mo-ment of decision. If this value is > zero, 1
of the 2 alternatives is chosen, if this valueis <0, the other alternative is chosen (seefig 3). The decision process is indeed welldescribed by the simple z-transformation(see above). From all this it follows that thefluctuations at least in the judgment valueneuron (kdij), and also in the (>0)-neuronsif their contribution is significant, must beindependent of their actual excitations.This is only possible if the intrinsic fluctua-tions in these neurons are much greaterthan the fluctuations in previous neuronsand the photoreceptors. This conclusion isin agreement with the earlier finding of theauthor that the SD of the fluctuations deter-mined for the choice behavior of the bee isca 39-fold larger than the SD of the fluctua-tions determined for photoreceptors (Back-haus and Menzel, 1987).
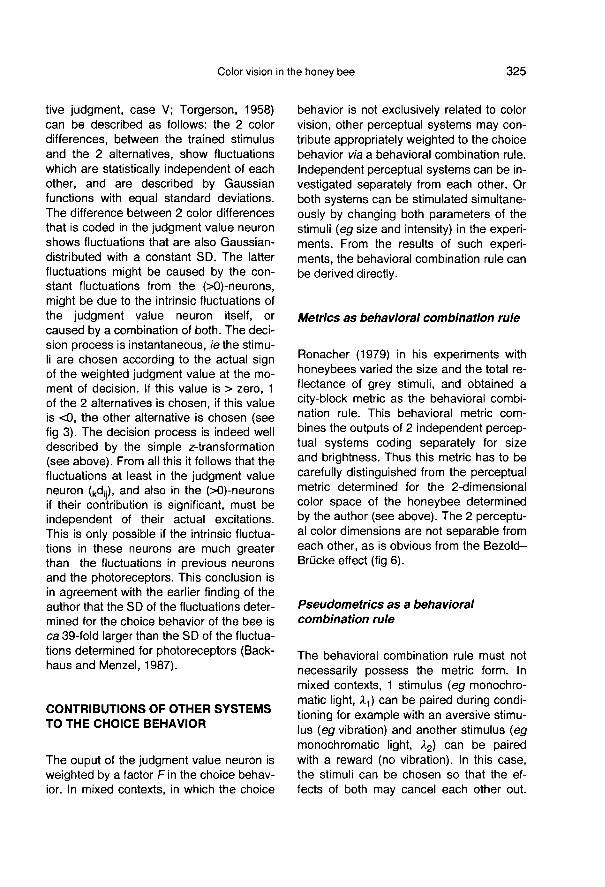
CONTRIBUTIONS OF OTHER SYSTEMSTO THE CHOICE BEHAVIOR
The ouput of the judgment value neuron isweighted by a factor F in the choice behav-ior. In mixed contexts, in which the choice
behavior is not exclusively related to colorvision, other perceptual systems may con-tribute appropriately weighted to the choicebehavior via a behavioral combination rule.
Independent perceptual systems can be in-vestigated separately from each other. Orboth systems can be stimulated simultane-ously by changing both parameters of thestimuli (eg size and intensity) in the experi-ments. From the results of such experi-ments, the behavioral combination rule canbe derived directly.
Metrics as behavioral combination rule
Ronacher (1979) in his experiments withhoneybees varied the size and the total re-flectance of grey stimuli, and obtained acity-block metric as the behavioral combi-nation rule. This behavioral metric com-bines the outputs of 2 independent percep-tual systems coding separately for sizeand brightness. Thus this metric has to becarefully distinguished from the perceptualmetric determined for the 2-dimensionalcolor space of the honeybee determinedby the author (see above). The 2 perceptu-al color dimensions are not separable fromeach other, as is obvious from the Bezold-Brücke effect (fig 6).
Pseudometrics as a behavioralcombination rule
The behavioral combination rule must not
necessarily possess the metric form. In
mixed contexts, 1 stimulus (eg monochro-matic light, λ1) can be paired during condi-tioning for example with an aversive stimu-lus (eg vibration) and another stimulus (egmonochromatic light, λ2) can be pairedwith a reward (no vibration). In this case,the stimuli can be chosen so that the ef-fects of both may cancel each other out.

Since one of the stimuli is attractive andthe other causes aversive behavior in this
case, the subjective differences in the 2stimuli do not add in the choice behavior,but also contribute differences with a neg-ative sign. The combination rule is called apseudo-metric in this case, because themetric axiom of additivity is not fulfilled.Such a mixed context was used in the ex-
periments of Hernandez de Salomon andSpatz (1983) who measured wavelengthdiscrimination in the fruitly. If the conceptof perceptual spaces holds for the color vi-sion system of the fruitfly, one would ex-pect the overall choice behavior to follow apseudometric. Similar conditions are ex-
pected for the honeybee in mixed contextsin which, for example, color vision and
photoaxis are combined.
Logical relations as a behavioralcombination rule
In addition to the experiments mentionedabove (fig 6), Menzel performed further ex-periments (1981, his fig 2) with monochro-matic light of 533 nm in which the individu-al bee (3 bees in total) was trained to darkinstead of to white light. For intensitiesabove the absolute threshold of the photo-receptors, the choice percentages meas-ured in the dark experiments are veryclose to those measured in the white ex-
periments shown in figure 6a. In the whiteexperiments, the bee showed the same re-sponse as to the trained bright white light,to an intensity of the 533 nm light justabove the absolute threshold of the photo-receptors. These results are expectedfrom the color theory, because the colorspace of the bee is 2-dimensional, andthus the bee cannot distinguish betweendark and white light in ordinary color train-ing experiments (see above). But at verylow light intensities, below the absolutethreshold of the photoreceptors, the meas-
ured choice percentages show a great dif-ference. In the dark experiments, the beeturned as expected to the side for achro-matic light when the intensity of the 533-nm light was below the absolute threshold.But in the white experiments the beewalked randomly (50%:50%) in this case
(see fig 6a). The bee obviously used, inaddition to color vision, a perceptual sys-tem which allows the bee to distinguishdark from lights which are achromatic forthe color coding system. Obviously, thisadditional perceptual system does not con-tribute to the total subjective difference.Otherwise the predictions from the colortheory would not hold as precisely as theydo for intensities above the absolutethreshold. Thus the information from theadditional system must be logically relatedto the color choice behavior of the bee.
We suspect the additional system to bea form vision system. In the white experi-ments, the bee was trained to bright whiteand 533-nm light, and was never rewardedwhen the T-maze was dark. So the bee
might have learned the rectangular form ofthe stimulus at the decision point to indi-cate that the food sources in the experi-mental setup provide a reward. Thus thebee chooses the sides of the T-maze ac-
cording to the chromaticness of the light atthe decision point, only if the light is suffi-
ciently intense so that the form of the lightis visible to the bee. If the form is not visi-ble because the light intensity is too low,the bee does not care about chromatic-ness at all and thus walks randomly in thiscase. In the dark experiments, the form ofthe light at the decision point had no spe-cial meaning. The bee was trained to 533-nm light of a rectangular form and to
achromatic dark which had no bounds be-cause the rest of the T-maze was alsodark. Thus information from the form vision
system had no special meaning to the beein these experiments and thus had no influ-ence on the choice behavior.
From these results and further theoreti-cal considerations, it is hypothesized thatthe behavioral combination rule accordingto which information from different percep-tual systems is combined in the choice be-havior of honeybees and other insects is ametric, a pseudometric or a logical relation.These relations can now be best studied in
bees, because the theory of color visionand color choice behavior describes and
already explains a major part of the totalchoice behavior in experiments with stimuliwhich affect the color vision system andother perceptual systems simultaneously.The effects of the other systems on thechoice behavior can be studied directlyfrom the deviations of the measuredchoice percentages from the predictionsfor pure color vision.
OUTLOOK
The author’s color theory presented heredescribes and explains the color vision andthe color choice behavior of the honeybeewith high precision. The color theory is
physiologically adequate, in that it explainsnot only the results obtained under artificialexperimental conditions (see above) butalso color vision during natural foraging onflowers. Although color vision and color
choice behavior of the bee is mostly ac-counted for by the color theory, some top-ics remain to be investigated, ie: 1) adapta-tion: the color theory assumes
independent adaptation of the 3 photore-ceptor types as in the case for adaptationto achromatic lights (see above). For mon-ochromatic adapting light, the adaptationmechanisms in the photoreceptors in be-havioral color induction experiments turnedout to be slightly coupled (Dittrich, 1992).Although monochromatic lights do not oc-cur in the natural environment of the bee,the results of these experiments commendmore specific investigations of the several
adaptation processes, which are known tobe due to eye optics as well as to the
transduction process in the photoreceptorsof the compound eye of the bee (Staven-ga, 1979); 2) the color theory describescolor vision of the bee exclusively for
steady states. As shown above, this is in-
deed sufficient to explain ordinary color vi-sion under experimental as well as undernatural conditions. Nevertheless, for a
complete physiological understanding of
the neuronal color coding, it is necessaryto extend the color theory by measuringand modeling the temporal properties of
the photoreceptors and interneurons; 3)the differences in learning speed of mono-chromatic lights, as determined in behav-
ioral experiments by Menzel (1967), re-
main to be explained by the color theory;4) the theory does not assume anythingabout the existence of color sensations in
bees. From this it cannot be concludedthat color sensations do not occur in the
bee. The first results of double training ex-periments, in which 2 color stimuli were
trained simultaneously (Backhaus and
Kratzsch, 1993), clearly demonstrate thatthe bee is able to perform color similarityjudgments different from the judgment typedescribed above. Thus, these results can-not be explained by the color theory. Rath-er, the results support the idea that beeshave color sensations composed of uniquecolors (Backhaus, 1988b, 1991, 1992) justas in humans (see above). Thus both theo-retical and empirical investigations of thecolor vision system of the honeybee will becontinued.
ACKNOWLEDGMENTS
I would like to thank M Giurfa and anonymousreferees for helpful comments on the manu-
script, P Maher for proof-reading of the Englishtext, and A Klawitter for photo-technical assis-tance.
Résumé — Vision des couleurs et com-
portement de choix des couleurs chezl’abeille, Apis mellifera L. La théorie descouleurs développée par l’auteur pourl’abeille décrit très bien la vision et le com-
portement de choix des couleurs. La théo-rie consiste en 5 modèles qui interagis-sent : 1) le modèle physiologique (PR) desphotorécepteurs. 2) le modèle physiologi-que de codage opposé des couleurs
(COC). Celui-ci décrit le codage de lachromaticité (aspect bidimensionnel de lacouleur qui est différent de la brillance) par2 types de neurones codant en opposé li-néairement. Un système de codage de labrillance n’est pas nécessaire parce quel’abeille ignore les différences d’intensitédans les expériences de dressage à lacouleur. L’espace coloré subjectif del’abeille est bidimensionnel, comme lemontre l’analyse multidimensionnelle despourcentages de choix des couleurs. 3) Lemodèle psychophysique (MDS) de la per-ception des couleurs, qui décrit l’espacecoloré. 4) Le modèle psychophysique(MDS) des jugements de similarité descouleurs. 5) Le modèle du comportementde choix des couleurs (CCB). La théoriedes couleurs chez l’abeille a subi avecsuccès tous les tests critiques de compor-tement et d’électrophysiologie faits jusqu’àprésent. Puisque la théorie est correcte dupoint de vue physiologique, elle expliquela vision des couleurs chez l’abeille dansdes dispositifs expérimentaux artificielsaussi bien que dans l’environnement natu-rel au cours des vols de butinage. La théo-rie permet une interprétation neuronale
complète, y compris de la partie psycho-physique, par des neurones aux propriétéssimples. La mémoire des couleurs com-prend probablement 2 parties indépendan-tes. Chaque couleur apprise est vraisem-blablement stockée sous la forme des 2valeurs d’excitation des 2 neurones codanten opposé les couleurs. De plus, la théoriedes couleurs s’est montrée utile pour com-
prendre les résultats des expériences danslesquelles la vision des couleurs était sti-mulée simultanément avec d’autres moda-lités (par exemple, la vision des formes).L’hypothèse selon laquelle l’information
concernant les différents stimuli est traitée
séparément décrit bien les systèmes indivi-duels de perception. L’information fourniepar les systèmes individuels de perceptionest combinée, dans le comportement dedécision, selon les règles des combinai-sons comportementales (relation métrique,pseudo-métrique ou logique).
vision des couleurs / comportement dechoix / perception / psychophysique /
électrophysiologie
Zusammenfassung — Farbensehen undFarbwahlverhalten der Honigbiene, Apismellifera L. Das Farbensehen und dasFarbwahlverhalten der Honigbiene wirdsehr genau durch die vom Author ent-
wickelte Farbtheorie für die Honigbiene be-schrieben. Die Theorie besteht aus fünf zu-sammenwirkenden Modellen: 1) Dem phy-siologischen (PR) Model der Photorezepto-ren; 2) dem physiologischen gegenfarben-kodierenden (COC) Modell. Dieses Modellbeschreibt die Farbart (den zweidimensio-nalen Aspekt einer Farbe, der von der Hel-ligkeit verschieden ist) durch zwei linear
gegenfarbenkodierende Neu-ronentypen.Ein helligkeitskodierendes System wirdnicht benötigt, weil die Bienen Intensitäts-unterschiede in Farbdressurexperimentenignoriert. Der subjektive Farbraum der Ho-nigbiene ist zweidimensional, wie die multi-dimensionale Skalierungsanalyse (MDS)von Farbwahlprozenten zeigte. Ferner 3)aus dem psychophysischen (MDS) Modellder Farbwahrnehmung, das den Farbraumbeschreibt; 4) aus dem psychophysischenModel des Farbähnlichkeitsurteils und 5)aus dem (CCB) Modell des Farb-wahlverhaltens. Die Farbtheorie für die Ho-
nigbiene hat bisland alle kritischen verhal-tensanalytischen und elektrophysiologi-schen Tests bestanden. Da die Theorie
physiologisch adäquat ist, beschreibt siedas Farbensehen der Biene in künstlichen
experimentellen Apparaturen sowie wäh-rend der Sammelflüge in natürlicher Umge-bung. Die Theorie erlaubt eine vollständigeneuronale Interpretation, auch des psycho-physischen Teils, durch Neuronen mit ein-fachen Eigenschaften. Das Gedächtnis derBiene für Farben dürfte aus zwei unabhän-
gigen Teilen bestehen. Jede gelernteFarbe wird wahrscheinlich in Form der Er-
regungs-werte der zwei gegenfarbkodie-renden Neuronen gespeichert. Überdiesstellte sich die Farbtheorie sehr als nütz-lich heraus, für das Verständnis der Ergeb-nisse von Experimenten, in denen das Far-bensehen gleichzeitig mit anderen Modali-täten (zB Formensehen) stimuliert wird.
Die einzelnen Wahrnehmungssystemewerden bestens unter der Voraussetzungbeschrieben, daß sie die Information überReinzunterschiede unabhängig voneinan-der verarbeiten. Die von den einzelnen
Wahrnehmungssysteme zur Verfügungstehende Information wird im Entschei-
dungsverhalten gemäß Verhaltens-
Kombinationsregeln (Metrik, Pseudometrikoder logische Relation) verrechnet.
Farbensehen / Wahlverhalten / Wahr-
nehmung / Elektrophysiologie / Psycho-physik
REFERENCES
Ahrens HJ (1974) Multimensionale Skalierung.Methodik, Theorie und empirische Gültigkeitmit Anwendungen aus der differentiellen Psy-chologie und Sozialpsychologie. Beltz Ver-
lag, Weiheim
Autrum H, Zwehl V von (1964) Die spektraleEmpfindlichkeit einzelner Sehzellen des Bie-nenauges. Z Vgl Physiol 48, 357-384
Backhaus W (1987) Color vision in bees: similar-ity measures and metric scales of the percep-tual space. Dissertation, Freie UniversitätBerlin. Mikroedition, ISBN 3-89349-650-5.
Verlag der Deutschen Hochschulschriften,Egelsbach (1993)
Backhaus W (1988a) Color difference and coloropponency in bees. In: Sense Organs. Inter-faces between Environment and Behaviour.In: Proc 16th Göttingen Neurobiol Conf (El-sner N, Barth FG, eds) Thieme, Stuttgart, 219
Backhaus W (1988b) Opponent color codingand color perception in bees. In: Anais daXVIII Reuniao Anual de Psicologia (das Gra-cas de Souza et al, eds) Sociedade de Psich-ologia, Ribeirao Preto, 123-126 (In: Back-haus W (1987) Color vision in honeybeesand other insects. Habilitation thesis, FreieUniversität Berlin, 1992; Mikroedition, ISBN3-89349-648-3. Verlag der Deutschen
Hochschulschriften, Egelsbach (1993))Backhaus W (1991) Color opponent coding in
the visual system of the honeybee. VisionRes 31, 1381-1397
Backhaus W (1992) The Bezold-Brücke effectin the color vision system of the honeybee.Vision Res 32, 1425-1431
Backhaus W, Kratzsch D (1993) Unique-colorsin color vision of the honeybee? In: Gene-Brain-Behavior. Proc 21st Göttingen Neuro-biol Conf (Elsner N, Heisenberg M, eds)Thieme, Stuttgart 39, 830
Backhaus W, Menzel R (1984) Multidimensionalscaling of the color space of honeybees(Bestimmung der Farbwahrmehmungs-komponenten bei Bienen durch Multidimen-sionale Skalierung). Verh Dtsch Zool Ges 77,230
Backhaus W, Menzel R (1987) Color distancederived from a receptor model for color visionin the honeybee. Biol Cybernet 55, 321-331
Backhaus W, Menzel R, Kreißl S (1987) Multidi-mensional scaling of color similarity in bees.Biol Cybern 56, 293-304
Brandt R, Backhaus W, Dittrich M, Janetzki C,Menzel R (1989) Colour vision in bees: oppo-nent coding and choice behavior. In: Dynam-ics and Plasticity in Neuronal Systems. Proc17th Göttingen Neurobiol Conf (Elsner N,Singer W, eds) Thieme, Stuttgart, 100
Brandt R, Backhaus W, Dittrich M, Menzel R(1993) Simulation of threshold spectral sensi-
tivity according to the color theory for the
honeybee. In: Gene — Brain — Behavior. Proc21st Göttingen Neurobiol Conf (Elsner N,Heisenberg M, eds) Thieme, Stuttgart, 374
Daumer K (1956) Reizmetrische Untersuchun-gen des Farbensehens der Bienen. Z VglPhysiol38, 413-478
Dittrich M (1992) Vision in the honeybee: colorinduction. Dissertation, Freie Universität Ber-lin
Dittrich M, Backhaus W (1991) Frequentingtimes for color stimuli agree with predictionsof the colour theory for the honeybee. In:
Synapse-Transmission Modulation. Proc19th Göttingen Neurobiol Conf (Elsner N,Penzlin H, eds) Thieme, Stuttgart, 561
Frisch K von (1914) Der Farbensinn und For-mensinn der Biene. Jb Abt Allg Zool Physiol37, 1-238
Gohlke P, ed (1951-1961) Aristoteles. DieLehrschriften, 8.1 Tierkunde. Schoeningh,Paderborn
Guilford JP (1937) Scale values derived fromthe method of choices. Psychometrika 2,139-150
Helversen O von (1972) Zur spektralen Unter-schiedsempfindlichkeit der Honigbiene.J Comp Physiol A, 80, 439-472
Henderson ST (1970) Daylight and its Spec-trum. Hilger, London
Hering E (1905) Grundzüge einer Theorie vomLichtsinn. Leipzig Engelmann (Outlines of aTheory of the Light Sense) (Hurvich LM,Jameson D, transl) Harvard Univ Press,Cambridge, MA (1964)
Hernandez de Salomon C, Spatz HC (1983)Colour vision in Drosophila melanogaster:wavelength discrimination. J Comp Physiol150, 31-37
Hertel H (1980) Chromatic properties of identi-fied neurons in the optic lobes of the bee.J Comp Physiol 137, 215-231
Hertel H, Maronde U (1987) Processing of visu-al information in the honeybee brain. In: Neu-robiology and Behavior of Honeybees (Men-zel R, Mercer A, eds) Springer, Berlin, 141-157
Kien J, Menzel R (1977a) Chromatic propertiesof neurons in the optic lobes of the bee. I.Broad band neurons. J Comp Physiol A 113,17-34
Kien J, Menzel R (1977b) Chromatic propertiesof neurons in the optic lobes of the bee. II.Narrow band colour opponent neurons.
J Comp Physiol A, 113, 35-53Kruskal JB (1964a) Multidimensional scaling by
optimizing goodness of fit to a nonmetric hy-pothesis. Psychometrika 29, 1-29
Kruskal JB (1964b) Nonmetric multidimensionalscaling: a numerical method. Psychometrika29, 115-131
Labhart T (1974) Behavioral analysis of light in-tensity discrimination and spectral sensitivityin the honeybee, Apis mellifera. J CompPhysiol 95, 203-216
Laughlin SB (1981) Neural principles in the pe-ripheral visual systems of invertebrates. In:Handbook of Sensory Physiology (Autrum H,ed) Springer, Berlin, vol VII/6B, 133-280
Lipetz LE (1971) The relation of physiologicaland psychophysical aspect of sensory inten-sity. In: Handbook of Sensory Physiology(Loewenstein WR, ed) Springer, Berlin, vol I,191-225
Menzel R (1967) Untersuchungen zum Erlernenvon Spektralfarben durch die Honigbiene,Apis mellifica. Z Vgl Physiol 56, 22-62
Menzel R (1974) Spectral sensitivity of monopo-lar cells in the bee lamina. J Comp Physiol93, 337-346
Menzel R (1981) Achromatic vision in the honey-bee at low intensities. J Comp Physiol A,141, 389-393
Menzel R, Backhaus W (1989) Color vision in
honeybees: phenomena and physiologicalmechanisms. In: Facets of Vision (StavengaDG, Hardie RC, eds) Springer, Berlin, 281-297
Menzel R, Backhaus W (1991) Colour vision ininsects. In: Vision and Visual Dysfunction(Cronly-Dillon, ed) vol 6; The Perception ofColour (Gouras P, ed) Macmillan, London,chap 14, 262-293
Menzel R, Greggers U (1985) Natural phototaxisand its relationship to colour vision in honey-bees. J Comp Physiol 157, 311-321
Menzel R, Ventura DF, Hertel H, de Souza JM,Greggers U (1986) Spectral sensitivity of
photoreceptors in insect compound eyes:comparison of species and methods. J CompPhysiol A, 158, 165-177

Ronacher B (1979) Äquivalenz zwischenGrößen- und Helligkeitsunterschieden im
Rahmen der visuellen Wahrnehmung der
Honigbiene. Biol Cybern 32, 63-75Sachs L (1976) Statistische Methoden. Spring-
er, Berlin
Sixtl F (1982) Meßmethoden der Psychologie.Theoretische Grundlagen und Probleme, 2.überarbeitete und erweiterte Auflage. Beltz
Verlag, WeinheimSouza JM de, Hertel H, Ventura DF, Menzel R
(1992) Response properties of stained mono-polar cells in the honeybee lamina. J CompPhysiol A 170, 267-274
Stavenga DG (1979) Pseudopupils of com-
pound eyes. In: Handbook of Sensory Physi-ology: Vision in Invertebrates (Autrum H, ed)vol VII/6A, Springer, Berlin, 357-439
Thurstone LL (1927) A law of comparative judg-ment. Psychol Rev 34, 273-286
Torgerson WS (1958) Theory and Methods ofScaling. Wiley, New York
Wyszecki G, Stiles WS (1982) Color Science.Concepts and Methods, Quantitative Dataand Formulae. Wiley, New York, 2nd ed
Zielinski R (1978) Erzeugung von Zufallszahlen,Programmierung und Test auf Digitalrech-nern. Deutsch Verlag, Frankfurt am Main


![[PPT]Honey Bee Anatomy & Biology - Illinois State Universitywenning/HIBA/Workshop PPTs/Honey Bee... · Web viewHoney Bee Apis mellifera Anatomy & Biology Honey Bee External Anatomy](https://img.pdfslide.us/doc/110x75/5b0a09fe7f8b9aba628b8dcf/ppthoney-bee-anatomy-biology-illinois-state-wenninghibaworkshop-pptshoney.jpg)