Embed Size (px)
Citation preview
DIVISION S-10-WETLAND SOILS
Color Index for Identifying Hydric Conditions for Seasonally Saturated Mollisolsin Minnesota
James A. Thompson and James C. Bell*
ABSTRACTThe thick surface accumulations of organic matter in Mollisols
confound the possibility of recognizing soil morphological featuressuch as redoximorphic features that indicate seasonally saturated andreduced soils. The most obvious morphological change in the soilacross Mollisol hydrosequences in Minnesota is the thickening anddarkening of the A horizon(s). Our purpose is to quantify this trendacross the landscape and examine its correlation with duration ofsaturated and/or reducing conditions for distinguishing between hydricand nonhydric Mollisols. We examined trends in soil morphology andsoil organic C in conjunction with hydrologic monitoring data acrossthree Mollisol hydrosequences. We defined a new color index that isa function of the thickness and color of the A horizon(s) of Mollisolsof three hillslopes in Minnesota. Coefficients of correlation (r) betweenthis index and duration of saturated and reducing conditions at variousdepths in these Mollisols are as high as 0.69. This index is also linearlyrelated to organic C content of the A horizon(s) of a single hillslopewith a coefficient of correlation of 0.98. This index may be useful foridentifying and delineating hydric soils and may be employed to exam-ine soil C storage at a landscape scale; however, specific relationshipswill vary considerably with soil parent material and climate.
THE NATIONAL COMMITTEE on Characterization ofWetlands has identified the development of scientifi-
cally based field indicators of hydric soils as an arearequiring further study (National Research Council,1995, p. 79-131). The depth to the seasonally high watertable in soils is commonly indicated by the depth tovarious soil morphologic features. Potential soil morpho-logical indicators of seasonally saturated and reducingconditions include low-chroma colors below the A hori-zon, organic soils, histic epipedons, Fe-Mn concretions,and presence of H2S (Environmental Laboratory, 1987).The specific morphological characteristics that indicatesaturated and reducing conditions vary with climate,vegetation, hydrology, parent material, and soil age.Megonigal et al. (1993) accurately differentiated betweenhydric and nonhydric soils in wetland forests of thesoutheastern USA using indicators of low-chroma colorsbelow the A horizon and histic or cumulic epipedons.Evans and Franzmeier (1986) related differences in soilsaturation and O2 depletion to differences in the chromaof the soil matrix, redox concentrations and depletions,and ped coats in glacial toposequences in Indiana. InMassachusetts, Pickering and Veneman (1984) observedlow-chroma matrix colors, redox concentrations, andredox depletions associated with zones of extended soil
Department of Soil, Water, and Climate, Univ. of Minnesota, 439 BorlaugHall, 1991 Upper Buford Circle, St. Paul, MN 55108. Received 11 Sept.1995. ""Corresponding author ([email protected]).
Published in Soil Sci. Soc. Am. J. 60:1979-1988 (1996).
saturation during the growing season. Similar resultswere found in Wisconsin (Veneman et al., 1976), Texas(Vepraskas and Wilding, 1983), Ohio (Zobek and Rit-chie, 1984), North Dakota (Knuteson et al., 1989), andFlorida (Hurt and Puckett, 1992).
For soils with thick surface accumulations of organicmatter (e.g., Mollisols), the morphologic features associ-ated with transformations and translocations of Fe andMn due to biochemical reduction can be masked in theupper portions of the soil profile by organic ped andparticle coatings (Parker et al., 1985). These organicaccumulations are frequently a direct result of the satu-rated and reducing conditions that inhibit organic matteroxidation. Therefore, the thickness and darkness of sur-face horizons characterized by organic matter accumula-tion are frequently a function of soil saturation. Relation-ships between soil morphology and soil hydrology inMollisol landscapes have not been studied in significantdetail. In Iowa, James and Fenton (1993) and Khan andFenton (1994) have reported on the hydrologic regimesof several Mollisol catenas. Their results indicate mixedsuccess in associating observed redoximorphic featureswith depths to the seasonally high water table. Bell et al.(1995) examined a Mollisol toposequence in southeasternMinnesota and found that redoximorphic features basedon transformation and depletion of Fe and Mn werepoorly expressed in the upper 30 cm for seasonallysaturated Mollisols. They observed that changes in Ahorizon thickness and A and B horizon color along thecatena from well to poorly drained soils were more usefulindicators for distinguishing soils subject to differentdurations of saturated and reducing conditions in theupper 30 cm (Bell et al., 1995).
In west-central Minnesota, saturated and reducing con-ditions are expressed by a variety of morphologies, in-cluding high-chroma redox concentrations in a low-chroma matrix, low-chroma redox depletions in ahigh-chroma matrix, Mn and Fe concentrations, and Fepore linings along root channels. The type of redoximor-phic features that indicate the presence of a seasonallyhigh water table in these soils varies among differentlandscape positions. The thick surface accumulations oforganic matter confound the possibility of recognizinglandscape-scale trends in the distributions of redoximor-phic features based on transformations and translocationsof Fe and Mn. When overthickened (>30 cm thick) Ahorizons are present, it is necessary to look directly
Abbreviations: Cl, C2, color indexes computed from Eq. [2] and [3],respectively; PDI, profile darkness index; RR, redness rating.
1979
1980 SOIL SCI. SOC. AM. J., VOL. 60, NOVEMBER-DECEMBER 1996
below the A horizon and examine the B horizon forevidence of saturation and reduction (EnvironmentalLaboratory, 1987; Soil Survey Staff, 1994).
Soil color indexes are an alternative means of quantify-ing the differences in soil morphology resulting fromsaturated and reducing conditions. These indexes com-bine multiple characteristics of a horizon or profile.Torrent et al. (1980, 1983) described the Redness Rating(RR), a function of Munsell hue, value, and chroma,and used it to examine differences in hematite contentof soil. Evans and Franzmeier (1988) introduced thechroma (Cl) and hue + chroma (C2) color indexes forexamining variation in soil color with changes indurationof saturated and reducing conditions in Indiana Alfisols.These indexes are calculated from Munsell chroma (andhue) of the soil matrix, redox concentrations and deple-tions, and argillans, each weighted by their relative abun-dance.
Soil color is strongly affected by Fe mineralogy(Schwertmann, 1993), and RR has been shown to varywith the Fe mineralogy of the soil (Torrent et al., 1980,1983). Similarly, Cl and C2 reflect the changes in soilmorphology related to changes in Fe mineralogy undersaturated and reducing conditions. Both Cl and C2 arehighly correlated with duration of saturation, durationof low O2 levels (<5 mg kg"1), and soil water Oa contentfor certain Indiana soils (Evans and Franzmeier, 1988).Megonigal et al. (1993) also found that Cl was highlycorrelated with duration of saturated and reducing condi-tions at a depth of 30 cm in several South Carolina soils.Evans and Franzmeier (1988) and Megonigal etal. (1993)used the Cl and C2 indexes in soil landscapes dominatedby Alfisols. The applicability of these indexes to prairielandscapes dominated by Mollisols is largely unknown.Furthermore, the most distinct soil morphologic propertyin these prairie landscapes is the presence of a mollic
epipedon, characterized by a thick accumulation of humi-fied organic material. None of these three color indexesconsider organic matter accumulation in wet soil environ-ments as a dominant process affecting soil morphologyalong soil hydrosequences.
Our objective was to develop and test a soil color indexthat quantifies the morphological differences, presumablydue to differences in the duration of saturated and reduc-ing conditions, among soils from a Mollisol topo-sequence. The components of this index vary due todifferences in the expression of soil genetic processesand soil hydrology. The process we used to develop thisindex is an example of how we must utilize informationother than the commonly used redoximorphic featuresto identify hydric soil conditions.
MATERIALS AND METHODSData from multiple study sites were incorporated in the
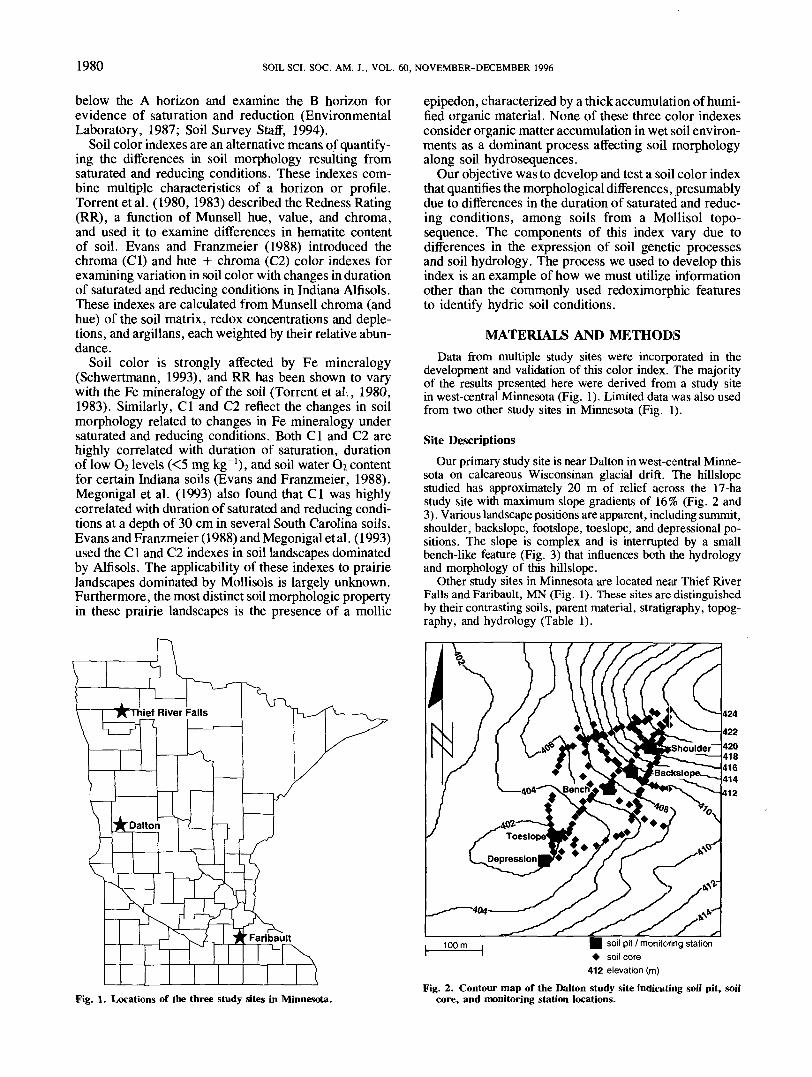
development and validation of this color index. The majorityof the results presented here were derived from a study sitein west-central Minnesota (Fig. 1). Limited data was also usedfrom two other study sites in Minnesota (Fig. 1).
Site DescriptionsOur primary study site is near Dalton in west-central Minne-
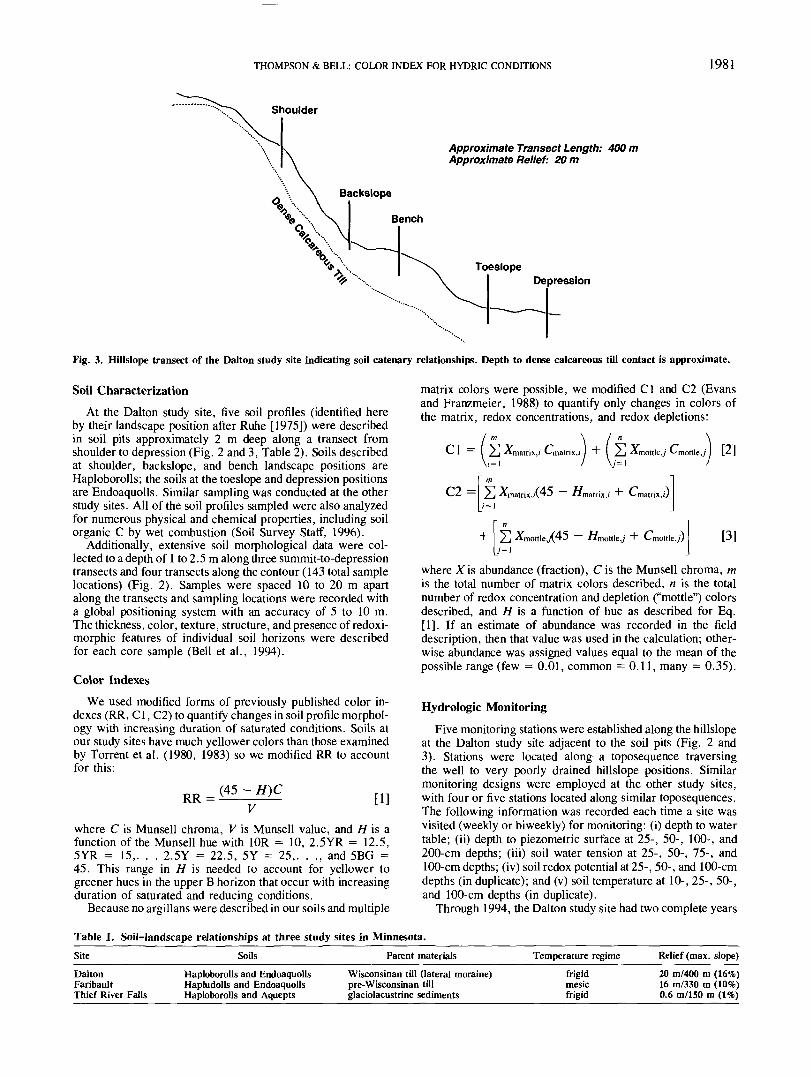
sota on calcareous Wisconsinan glacial drift. The hillslopestudied has approximately 20 m of relief across the 17-hastudy site with maximum slope gradients of 16% (Fig. 2 and3). Various landscape positions are apparent, including summit,shoulder, backslope, footslope, toeslope, and depressional po-sitions. The slope is complex and is interrupted by a smallbench-like feature (Fig. 3) that influences both the hydrologyand morphology of this hillslope.
Other study sites in Minnesota are located near Thief RiverFalls and Faribault, MN (Fig. 1). These sites are distinguishedby their contrasting soils, parent material, stratigraphy, topog-raphy, and hydrology (Table 1).
I 100m I soil pit / monitoring station• soil core
412 elevation (m)
Fig. 1. Locations of the three study sites in Minnesota.Fig. 2. Contour map of the Dalton study site indicating soil pit, soil
core, and monitoring station locations.
THOMPSON & BELL: COLOR INDEX FOR HYDRIC CONDITIONS 1981
Shoulder
Approximate Transect Length: 400 mApproximate Relief: 20 m
Depression
Fig. 3. Hillslope transect of the Dalton study site indicating soil catenary relationships. Depth to dense calcareous till contact is approximate.
Soil CharacterizationAt the Dalton study site, five soil profiles (identified here
by their landscape position after Ruhe [1975]) were describedin soil pits approximately 2 m deep along a transect fromshoulder to depression (Fig. 2 and 3, Table 2). Soils describedat shoulder, backslope, and bench landscape positions areHaploborolls; the soils at the toeslope and depression positionsare Endoaquolls. Similar sampling was conducted at the otherstudy sites. All of the soil profiles sampled were also analyzedfor numerous physical and chemical properties, including soilorganic C by wet combustion (Soil Survey Staff, 1996).
Additionally, extensive soil morphological data were col-lected to a depth of 1 to 2.5 m along three summit-to-depressiontransects and four transects along the contour (143 total samplelocations) (Fig. 2). Samples were spaced 10 to 20 m apartalong the transects and sampling locations were recorded witha global positioning system with an accuracy of 5 to 10 m.The thickness, color, texture, structure, and presence of redoxi-morphic features of individual soil horizons were describedfor each core sample (Bell et al., 1994).
Color IndexesWe used modified forms of previously published color in-
dexes (RR, Cl, C2) to quantify changes in soil profile morphol-ogy with increasing duration of saturated conditions. Soils atour study sites have much yellower colors than those examinedby Torrent et al. (1980, 1983) so we modified RR to accountfor this:
RR = (45 - H)C[1]
where C is Munsell chroma, V is Munsell value, and H is afunction of the Munsell hue with 10R = 10, 2.5YR = 12.5,SYR = 15,. . . 2.5Y = 22.5, 5Y = 25,. . ., and 5BG =45. This range in H is needed to account for yellower togreener hues in the upper B horizon that occur with increasingduration of saturated and reducing conditions.
Because no argillans were described in our soils and multiple
matrix colors were possible, we modified Cl and C2 (Evansand Franzmeier, 1988) to quantify only changes in colors ofthe matrix, redox concentrations, and redox depletions:
-V-l =
C2 =
C .mottleJ 1.2 J
/ j -"matrix,A.4O **matrix,< ~"~ ^matrix,//
"mottlej ~T Cmottlej) [3]
where Xis abundance (fraction), Cis the Munsell chroma, mis the total number of matrix colors described, n is the totalnumber of redox concentration and depletion ("mottle") colorsdescribed, and H is a function of hue as described for Eq.[1]. If an estimate of abundance was recorded in the fielddescription, then that value was used in the calculation; other-wise abundance was assigned values equal to the mean of thepossible range (few = 0.01, common = 0.11, many = 0.35).
Hydrologic MonitoringFive monitoring stations were established along the hillslope
at the Dalton study site adjacent to the soil pits (Fig. 2 and3). Stations were located along a toposequence traversingthe well to very poorly drained hillslope positions. Similarmonitoring designs were employed at the other study sites,with four or five stations located along similar toposequences.The following information was recorded each time a site wasvisited (weekly or biweekly) for monitoring: (i) depth to watertable; (ii) depth to piezometric surface at 25-, 50-, 100-, and200-cm depths; (iii) soil water tension at 25-, 50-, 75-, and100-cm depths; (iv) soil redox potential at 25-, 50-, and 100-cmdepths (in duplicate); and (v) soil temperature at 10-, 25-, 50-,and 100-cm depths (in duplicate).
Through 1994, the Dalton study site had two complete years
Table 1. Soil-landscape relationships at three study sites in Minnesota.
Site
DaltonFaribaultThief River Falls
Soils
Haploborolls and EndoaquollsHapludolls and EndoaquollsHaploborolls and Aquepts
Parent materials
Wisconsinan till (lateral moraine)pre-Wisconsinan tillglaciolacustrine sediments
Temperature regime
frigidmesicfrigid
Relief (max. slope)
20 m/400 m (16%)16 m/330 m (10%)0.6 m/150 m (1%)
1982 SOIL SCI. SOC. AM. J., VOL. 60, NOVEMBER-DECEMBER 1996
Table 2. Summary of monitoring data at the Dalton study site during 1993 and 1994.
Landscape position
ShoulderBackslopeBenchToeslopeDepression
Son family
Fine-loamy, mixed Udorthentic HaploborollFine-loamy, mixed, Udic HaploborollFine-loamy, mixed, Pachic HaploborollFine, montmoriflonitic, frigid, Cumulic EndoaquollFine, montmorillonitic, frigid, Cumulic Endoaquoll
Duration saturatedat 25 (and 50) cmt
0(0)0(0)0(0)
16 (28)28 (35)
Duration water tablewithin 25 (and 50) cmt
0(0)0(0)0(0)
28 (28)32 (35)
Duration redox potentialbelow 300 mV at 25 (and 50)
cm§
N/A1N/A0 (N/A)
13 (12)20 (15)
t Based on depth to piezometric surface readings from 25 (and 50) cm piezometers read at 2-wk intervals; percentage of time based on number of daysinclusive between consecutive readings all of which were below piezometric surface (soil water pressure head >0 cm) at 25 (or 50) cm divided by totalnumber of days in monitoring period.| Based on depth to water table readings from 300-cm wells read at 2-wk intervals; percentage of time based on number of days inclusive between consecutive
readings all of which were below water table at 25 (or 50) cm divided by total number of days in monitoring period.§ Based on electrode potential readings from 25 (and 50) cm Pt electrodes read at 2-wk intervals; percentage of time based on number of days inclusive
between consecutive readings all of which were below 300 mV at 25 (or 50) cm divided by total number of days in monitoring period.1 No Pt electrode data available for this depth or station.
of monitoring data collected; three complete years of datawere available for the Faribault and Thief River Falls studysites.
From these monitoring data from the Dalton, Faribault, andThief River Falls study sites, the duration of time below thewater table, saturated conditions (soil water pressure head >0cm), and reducing conditions (Eh <300 mV) both annuallyand during the growing season (soil temperature >5°C) werecalculated for various depths in the soil. The duration oftime below the water table was based on well data, saturatedconditions on piezometer data, reducing conditions on cor-rected Pt electrode data, and growing season on thermocoupledata.
Significance TestingCorrelation and regression analyses were performed on these
data. Coefficients of correlation were tested for being signifi-cantly different from zero (H0: r = 0) using a two-tailed testfor independence of bivariate normal populations (Neter etal., 1989, p. 530-531). Regression coefficients were testedfor being significantly different from zero (H0: b = 0) usinga two-tailed test of linear association (Neter et al., 1989, p.69-70).
RESULTS AND DISCUSSIONSoil Hydrology
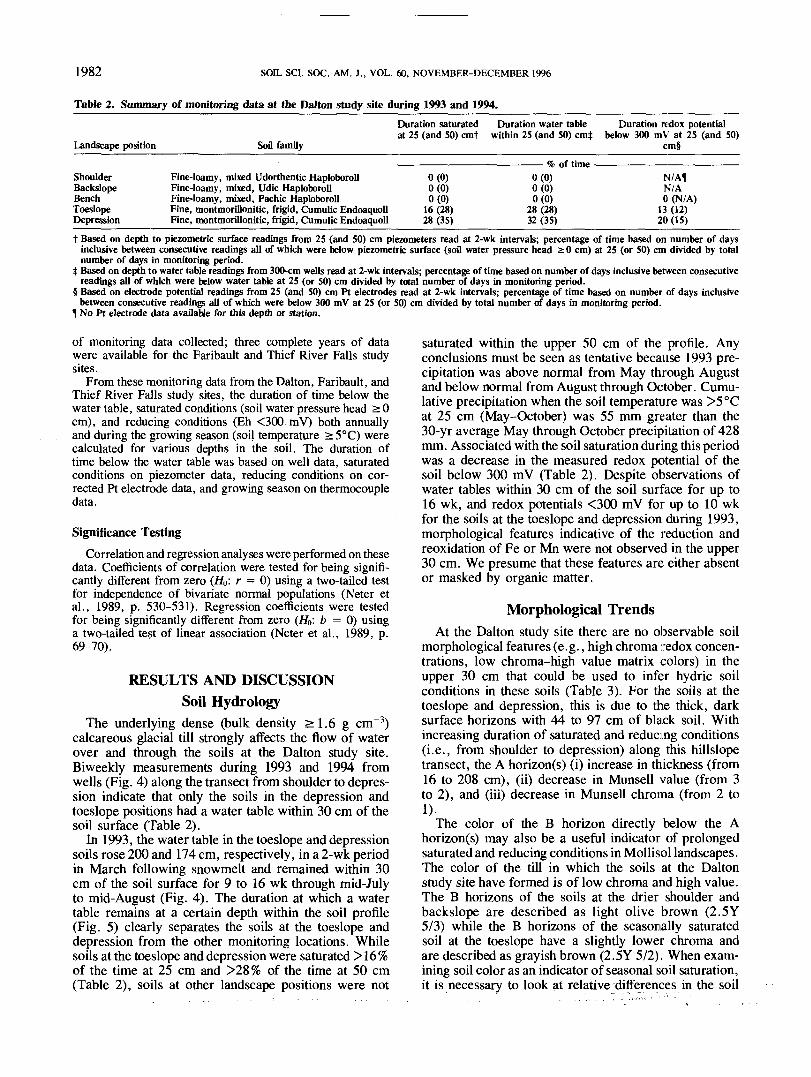
The underlying dense (bulk density >1.6 g cm"3)calcareous glacial till strongly affects the flow of waterover and through the soils at the Dalton study site.Biweekly measurements during 1993 and 1994 fromwells (Fig. 4) along the transect from shoulder to depres-sion indicate that only the soils in the depression andtoeslope positions had a water table within 30 cm of thesoil surface (Table 2).
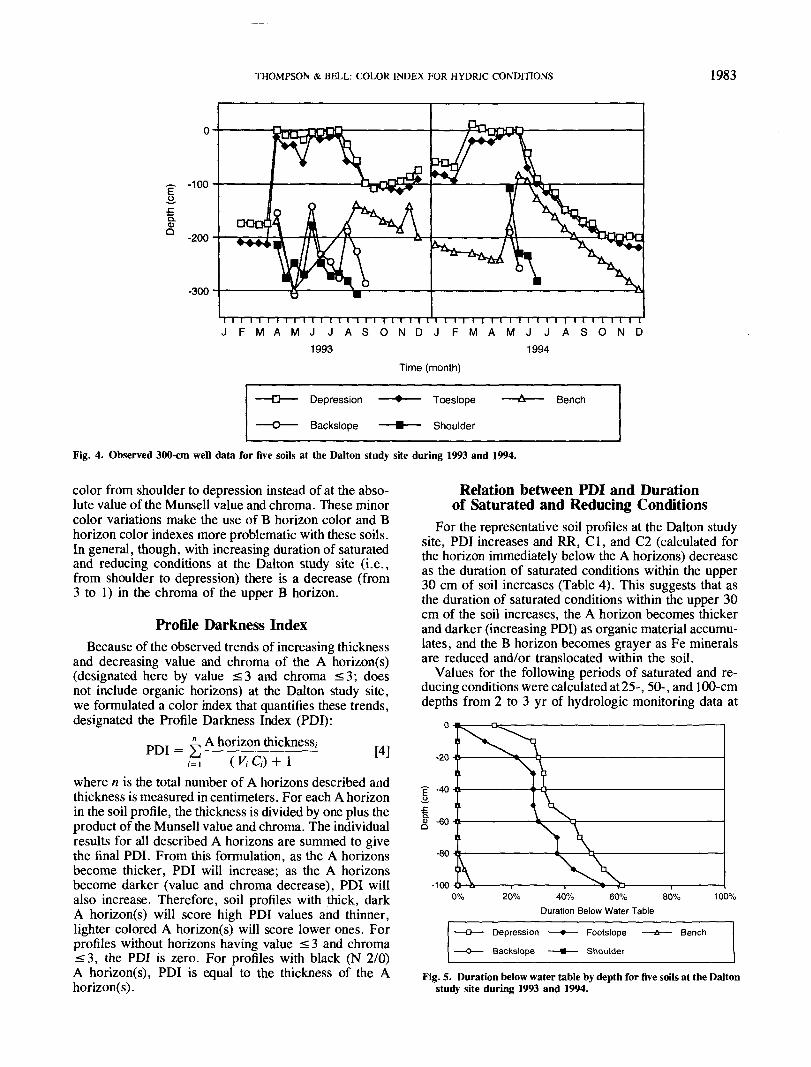
In 1993, the water table in the toeslope and depressionsoils rose 200 and 174 cm, respectively, in a 2-wk periodin March following snowmelt and remained within 30cm of the soil surface for 9 to 16 wk through mid-Julyto mid-August (Fig. 4). The duration at which a watertable remains at a certain depth within the soil profile(Fig. 5) clearly separates the soils at the toeslope anddepression from the other monitoring locations. Whilesoils at the toeslope and depression were saturated >16%of the time at 25 cm and >28% of the time at 50 cm(Table 2), soils at other landscape positions were not
saturated within the upper 50 cm of the profile. Anyconclusions must be seen as tentative because 1993 pre-cipitation was above normal from May through Augustand below normal from August through October. Cumu-lative precipitation when the soil temperature was >5°Cat 25 cm (May-October) was 55 mm greater than the30-yr average May through October precipitation of 428mm. Associated with the soil saturation during this periodwas a decrease in the measured redox potential of thesoil below 300 mV (Table 2). Despite observations ofwater tables within 30 cm of the soil surface for up to16 wk, and redox potentials <300 mV for up to 10 wkfor the soils at the toeslope and depression during 1993,morphological features indicative of the reduction andreoxidation of Fe or Mn were not observed in the upper30 cm. We presume that these features are either absentor masked by organic matter.
Morphological TrendsAt the Dalton study site there are no observable soil
morphological features (e.g., high chroma redox concen-trations, low chroma-high value matrix colors) in theupper 30 cm that could be used to infer hydric soilconditions in these soils (Table 3). For the soils at thetoeslope and depression, this is due to the thick, darksurface horizons with 44 to 97 cm of black soil. Withincreasing duration of saturated and reducing conditions(i.e., from shoulder to depression) along this hillslopetransect, the A horizon(s) (i) increase in thickness (from16 to 208 cm), (ii) decrease in Munsell value (from 3to 2), and (iii) decrease in Munsell chroma (from 2 to1).
The color of the B horizon directly below the Ahorizon(s) may also be a useful indicator of prolongedsaturated and reducing conditions in Mollisol landscapes.The color of the till in which the soils at the Daltonstudy site have formed is of low chroma and high value.The B horizons of the soils at the drier shoulder andbackslope are described as light olive brown (2.5Y5/3) while the B horizons of the seasonally saturatedsoil at the toeslope have a slightly lower chroma andare described as grayish brown (2.5Y 5/2). When exam-ining soil color as an indicator of seasonal soil saturation,it is necessary to look at relative differences in the soil
THOMPSON & BELL: COLOR INDEX FOR HYDRIC CONDITIONS 1983
-300
i i i n i i i i ri r in i i i i t i i i i i i n i i i \\ \\ i i i i i i nr \ i \J F M A M J J A S O N D J F M A M J J A S O N D
1993 1994
Time (month)
— n —— Depression — <
— O —— Backslope — 1
> —— Toeslope —
• —— Shoulder
•A —— Bench
Fig. 4. Observed 300-cm well data for five soils at the Dalton study site during 1993 and 1994.
color from shoulder to depression instead of at the abso-lute value of the Munsell value and chroma. These minorcolor variations make the use of B horizon color and Bhorizon color indexes more problematic with these soils.In general, though, with increasing duration of saturatedand reducing conditions at the Dalton study site (i.e.,from shoulder to depression) there is a decrease (from3 to 1) in the chroma of the upper B horizon.
Profile Darkness IndexBecause of the observed trends of increasing thickness
and decreasing value and chroma of the A horizon(s)(designated here by value <3 and chroma <3; doesnot include organic horizons) at the Dalton study site,we formulated a color index that quantifies these trends,designated the Profile Darkness Index (PDI):
, A horizon thickness,I ( V, Q + 1 [4]
where n is the total number of A horizons described andthickness is measured in centimeters. For each A horizonin the soil profile, the thickness is divided by one plus theproduct of the Munsell value and chroma. The individualresults for all described A horizons are summed to givethe final PDI. From this formulation, as the A horizonsbecome thicker, PDI will increase; as the A horizonsbecome darker (value and chroma decrease), PDI willalso increase. Therefore, soil profiles with thick, darkA horizon(s) will score high PDI values and thinner,lighter colored A horizon(s) will score lower ones. Forprofiles without horizons having value < 3 and chroma<3, the PDI is zero. For profiles with black (N 2/0)A horizon(s), PDI is equal to the thickness of the Ahorizon(s).
Relation between PDI and Durationof Saturated and Reducing Conditions
For the representative soil profiles at the Dalton studysite, PDI increases and RR, Cl, and C2 (calculated forthe horizon immediately below the A horizons) decreaseas the duration of saturated conditions within the upper30 cm of soil increases (Table 4). This suggests that asthe duration of saturated conditions within the upper 30cm of the soil increases, the A horizon becomes thickerand darker (increasing PDI) as organic material accumu-lates, and the B horizon becomes grayer as Fe mineralsare reduced and/or translocated within the soil.
Values for the following periods of saturated and re-ducing conditions were calculated at 25-, 50-, and 100-cmdepths from 2 to 3 yr of hydrologic monitoring data at
-10020% 40% 60% 80%
Duration Below Water Table100%
DepressionBackslope
FootslopeShoulder
Bench
Fig. 5. Duration below water table by depth for five soils at the Daltonstudy site during 1993 and 1994.
1984 SOIL SCI. SOC. AM. J., VOL. 60, NOVEMBER-DECEMBER 1996
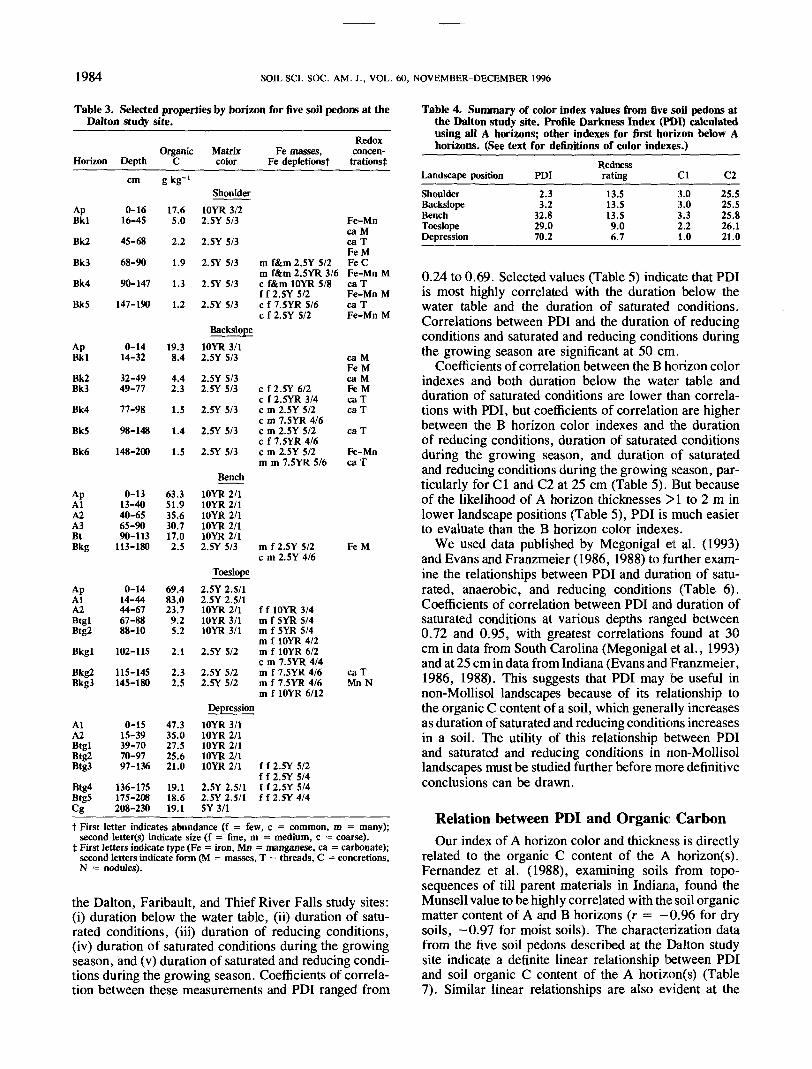
Table 3. Selected properties by horizon for five soil pedons at theDalton study site.
Horizon
ApBkl
Bkl
Bk3
Bk4
Bk5
ApBkl
Bk2Bk3
Bk4
Bk5
Bk6
ApAlA2A3BtBkg
ApAlA2BtglBtg2
Bkgl
Bkg2Bkg3
AlA2BtglBtg2Btg3
Btg4BtgSCg
Depth
cm
0-1616-45
45-68
68-90
90-147
147-190
0-1414-32
32-4949-77
77-98
98-148
148-200
0-1313-4040-6565-9090-113
113-180
0-1414-4444-6767-8888-10
102-115
115-145145-180
0-1515-3939-7070-9797-136
136-175175-208208-230
OrganicC
gkg-'
17.65.0
2.2
1.9
1.3
1.2
19.38.4
4.42.3
1.5
1.4
1.5
63.351.935.630.717.02.5
69.483.023.79.25.2
2.1
2.32.5
47.335.027.525.621.0
19.118.619.1
Matrixcolor
Shoulder10YR 3/22.5Y 5/3
2.5Y 5/3
2.5Y 5/3
2.5Y 5/3
2.5Y 5/3
Backslope10YR 3/12.5Y 5/3
2.5Y 5/32.5Y 5/3
2.5Y 5/3
2.5Y 5/3
2.5Y 5/3
Bench10YR 2/110YR 2/110YR 2/110YR 2/110YR 2/12.5Y 5/3
Toeslope2.5Y 2.5/12.5Y 2.5/110YR 2/110YR 3/110YR 3/1
2.5Y 5/2
2.5Y 5/22.5Y 5/2
Depression10YR 3/110YR 2/110YR 2/110YR 2/110YR 2/1
2.5Y 2.5/12.5Y 2.5/1SY3/1
Fe masses,Fe depletionst
m f&m 2.5Y 5/2m f&m 2.5YR 3/6c f&m 10YR 5/8f f 2.5Y5/2c f 7.5YR 5/6c f 2.5Y 5/2
c f 2.5Y 6/2c f 2.5YR 3/4c m 2.5Y 5/2c m 7.5YR 4/6c m 2.5Y 5/2c f 7.5YR 4/6c m 2.5Y 5/2m m 7. SYR 5/6
m f 2.5Y 5/2c m 2.5Y 4/6
f f 10YR 3/4m f SYR 5/4m f SYR 5/4m f 10YR 4/2m f 10YR 6/2c m 7.5YR 4/4m f 7.5YR 4/6m f 7.5YR 4/6m f 10YR 6/12
f f 2.5Y 5/2f f 2.5Y 5/4f f 2.5Y 5/4f f 2.5Y 4/4
Redoxconcen-trationst
Fe-Mnca McaTFeMFeCFe-Mn McaTFe-Mn Mca TFe-Mn M
ca MFeMca MFeMcaTcaT
caT
Fe-MncaT
FeM
caTMnN
Table 4. Summary of color index values from five soil pedons atthe Dalton study site. Profile Darkness Index (PDI) calculatedusing all A horizons; other indexes for first horizon below Ahorizons. (See text for definitions of color indexes.)
t First letter indicates abundance (f = few, c = common, m = many);second letter(s) indicate size (f = fine, m = medium, c = coarse).
t First letters indicate type (Fe = iron, Mn = manganese, ca = carbonate);second letters indicate form (M = masses, T = threads, C = concretions,N = nodules).
the Dalton, Faribault, and Thief River Falls study sites:(i) duration below the water table, (ii) duration of satu-rated conditions, (iii) duration of reducing conditions,(iv) duration of saturated conditions during the growingseason, and (v) duration of saturated and reducing condi-tions during the growing season. Coefficients of correla-tion between these measurements and PDI ranged from
Landscape position
ShoulderBackslopeBenchToeslopeDepression
PDI
2.33.2
32.829.070.2
Rednessrating
13.513.513.59.06.7
Cl
3.03.03.32.21.0
C2
25.525.525.826.121.0
0.24 to 0.69. Selected values (Table 5) indicate that PDIis most highly correlated with the duration below thewater table and the duration of saturated conditions.Correlations between PDI and the duration of reducingconditions and saturated and reducing conditions duringthe growing season are significant at 50 cm.
Coefficients of correlation between the B horizon colorindexes and both duration below the water table andduration of saturated conditions are lower than correla-tions with PDI, but coefficients of correlation are higherbetween the B horizon color indexes and the durationof reducing conditions, duration of saturated conditionsduring the growing season, and duration of saturatedand reducing conditions during the growing season, par-ticularly for Cl and C2 at 25 cm (Table 5). But becauseof the likelihood of A horizon thicknesses >1 to 2 m inlower landscape positions (Table 5), PDI is much easierto evaluate than the B horizon color indexes.
We used data published by Megonigal et al. (1993)and Evans and Franzmeier (1986, 1988) to further exam-ine the relationships between PDI and duration of satu-rated, anaerobic, and reducing conditions (Table 6).Coefficients of correlation between PDI and duration ofsaturated conditions at various depths ranged between0.72 and 0.95, with greatest correlations found at 30cm in data from South Carolina (Megonigal et al., 1993)and at 25 cm in data from Indiana (Evans and Franzmeier,1986, 1988). This suggests that PDI may be useful innon-Mollisol landscapes because of its relationship tothe organic C content of a soil, which generally increasesas duration of saturated and reducing conditions increasesin a soil. The utility of this relationship between PDIand saturated and reducing conditions in non-Mollisollandscapes must be studied further before more definitiveconclusions can be drawn.
Relation between PDI and Organic CarbonOur index of A horizon color and thickness is directly
related to the organic C content of the A horizon(s).Fernandez et al. (1988), examining soils from topo-sequences of till parent materials in Indiana, found theMunsell value to be highly correlated with the soil organicmatter content of A and B horizons (r = - 0.96 for drysoils, —0.97 for moist soils). The characterization datafrom the five soil pedons described at the Dalton studysite indicate a definite linear relationship between PDIand soil organic C content of the A horizon(s) (Table7). Similar linear relationships are also evident at the
THOMPSON & BELL: COLOR INDEX FOR HYDRIC CONDITIONS 1985
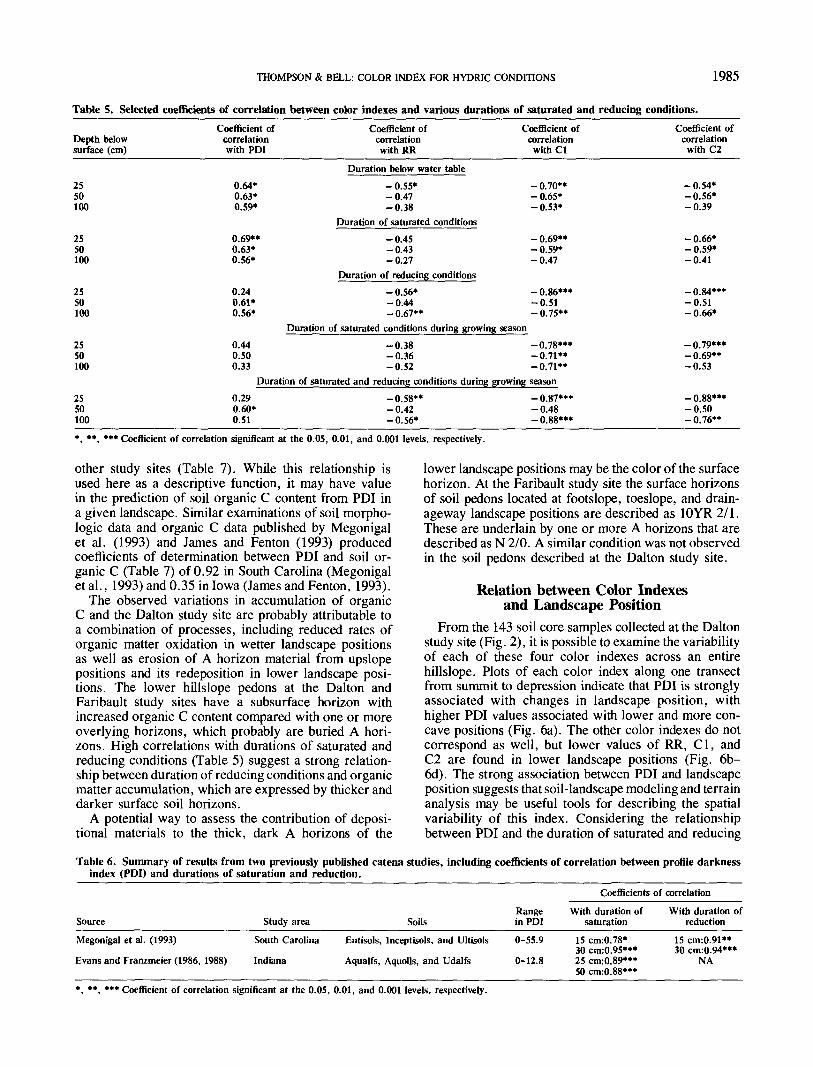
Table 5. Selected coefficients of correlation between color indexes and various durations of saturated and reducing conditions.
Depth belowsurface (cm)
Coefficient ofcorrelationwith PDI
Coefficient ofcorrelationwithRR
Coefficient ofcorrelation
with Cl
Coefficient ofcorrelation
with C2
2550100
2550100
2550100
2550100
2550100
Duration below water table0.64* -0.55* -0.70**0.63* -0.47 -0.65*0.59* - 0.38 - 0.53*
Duration of saturated conditions0.69** -0.45 -0.69**0.63* -0.43 -0.59*0.56* - 0.27 - 0.47
Duration of reducing conditions0.24 -0.56* -0.86***0.61* -0.44 -0.510.56* - 0.67** - 0.75**
Duration of saturated conditions during growing season0.44 -0.38 -0.78***0.50 -0.36 -0.71**0.33 -0.52 -0.71**
Duration of saturated and reducing conditions during growing season0.290.60*0.51
-0.58**-0.42-0.56*
-0.87***-0.48-0.88***
- 0.54*- 0.56*-0.39
-0.66*- 0.59*-0.41
-0.84***-0.51- 0.66*
-0.79***- 0.69**-0.53
-0.88***-0.50- 0.76**
*, *** Coefficient of correlation significant at the 0.05, 0.01, and 0.001 levels, respectively.
other study sites (Table 7). While this relationship isused here as a descriptive function, it may have valuein the prediction of soil organic C content from PDI ina given landscape. Similar examinations of soil morpho-logic data and organic C data published by Megonigalet al. (1993) and James and Fenton (1993) producedcoefficients of determination between PDI and soil or-ganic C (Table 7) of 0.92 in South Carolina (Megonigalet al., 1993) and 0.35 in Iowa (James and Fenton, 1993).
The observed variations in accumulation of organicC and the Dalton study site are probably attributable toa combination of processes, including reduced rates oforganic matter oxidation in wetter landscape positionsas well as erosion of A horizon material from upslopepositions and its redeposition in lower landscape posi-tions. The lower hillslope pedons at the Dalton andFaribault study sites have a subsurface horizon withincreased organic C content compared with one or moreoverlying horizons, which probably are buried A hori-zons. High correlations with durations of saturated andreducing conditions (Table 5) suggest a strong relation-ship between duration of reducing conditions and organicmatter accumulation, which are expressed by thicker anddarker surface soil horizons.
A potential way to assess the contribution of deposi-tional materials to the thick, dark A horizons of the
lower landscape positions may be the color of the surfacehorizon. At the Faribault study site the surface horizonsof soil pedons located at footslope, toeslope, and drain-ageway landscape positions are described as 10YR 2/1.These are underlain by one or more A horizons that aredescribed as N 2/0. A similar condition was not observedin the soil pedons described at the Dalton study site.
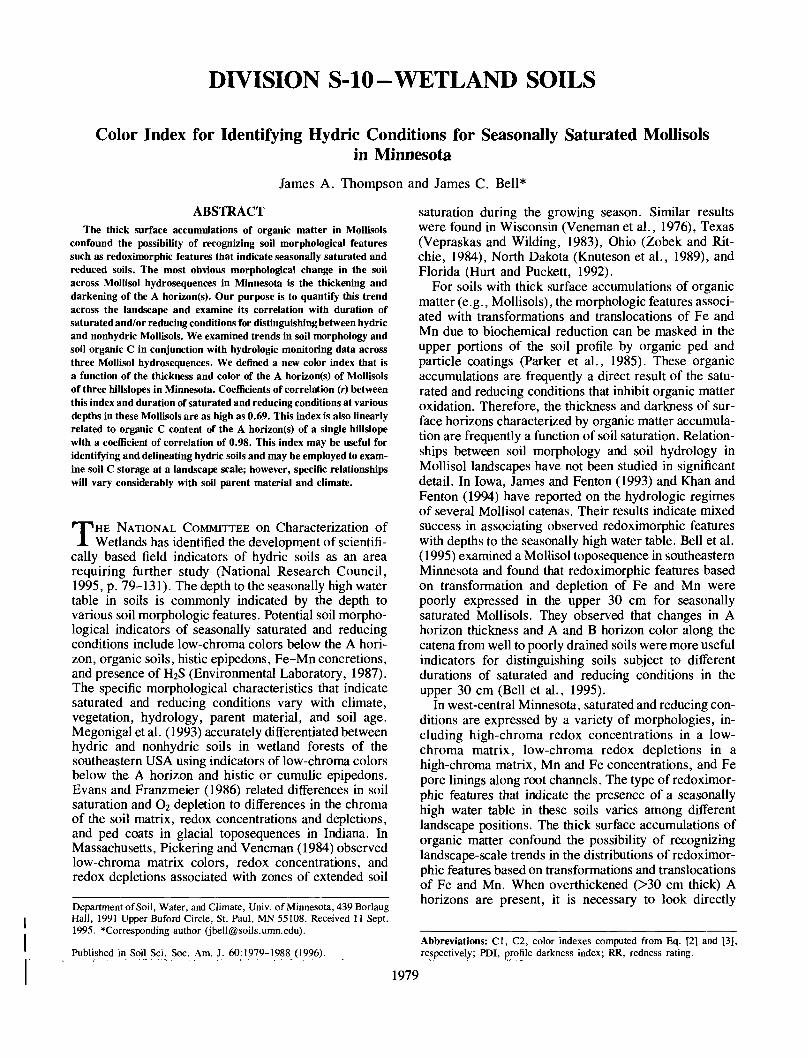
Relation between Color Indexesand Landscape Position
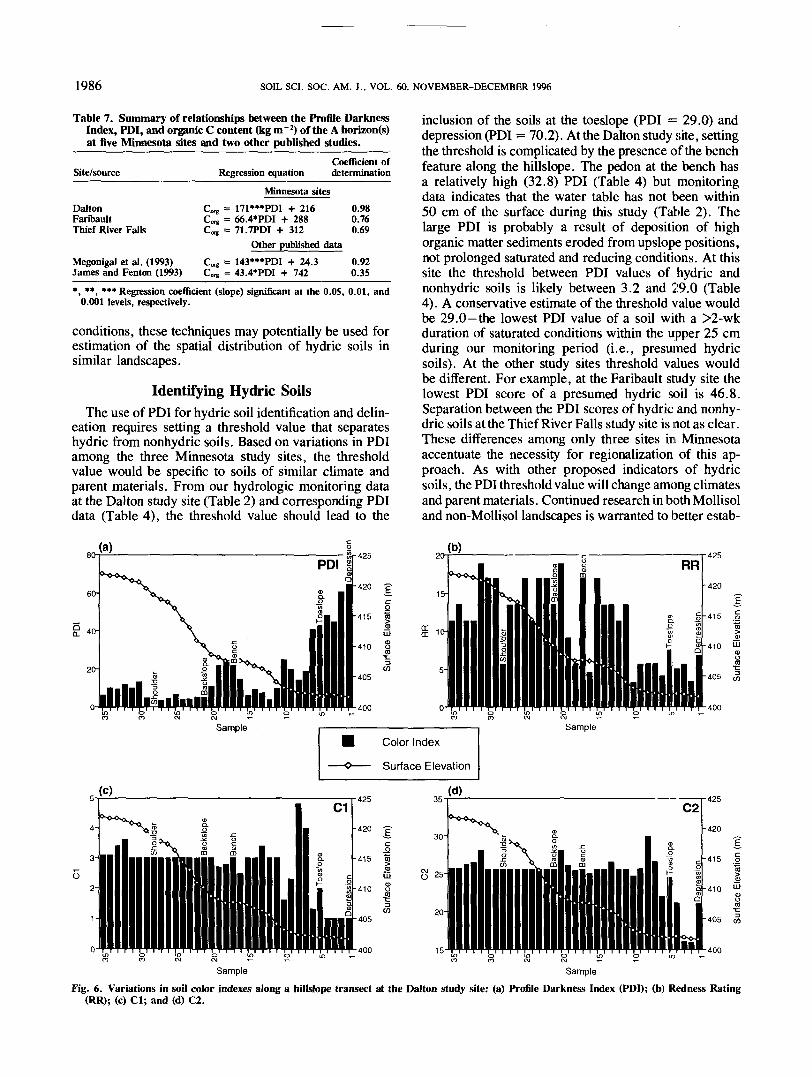
From the 143 soil core samples collected at the Daltonstudy site (Fig. 2), it is possible to examine the variabilityof each of these four color indexes across an entirehillslope. Plots of each color index along one transectfrom summit to depression indicate that PDI is stronglyassociated with changes in landscape position, withhigher PDI values associated with lower and more con-cave positions (Fig. 6a). The other color indexes do notcorrespond as well, but lower values of RR, Cl, andC2 are found in lower landscape positions (Fig. 6b-6d). The strong association between PDI and landscapeposition suggests that soil-landscape modeling and terrainanalysis may be useful tools for describing the spatialvariability of this index. Considering the relationshipbetween PDI and the duration of saturated and reducing
Table 6. Summary of results from two previously published catena studies, including coefficients of correlation between profile darknessindex (PDI) and durations of saturation and reduction. ___ ____ __ ________ ___
Coefficients of correlation
Source
Megonigal et al. (1993)
Evans and Franzmeier (1986, 1988)
Study area
South Carolina
Indiana
Soils
Entisols, Inceptisols, and Ultisols
Aqualfs, Aquolls, and Udalfs
Rangein PDI0-55.9
0-12.8
With duration ofsaturation
15 cm:0.78*30 cm:0.95***25 cm:0.89***50 cm:0.88***
With duration ofreduction
15 cm:0.91**30 cm:0.94***
NA
*, **, *** Coefficient of correlation significant at the 0.05, 0.01, and 0.001 levels, respectively.
1986 SOIL SCI. SOC. AM. J., VOL. 60, NOVEMBER-DECEMBER 1996
Table 7. Summary of relationships between the Profile DarknessIndex, PDI, and organic C content (kg m~2) of the A horizon(s)at five Minnesota sites and two other published studies.
Site/source Regression equationCoefficient ofdetermination
DaltonFaribaultThief River Falls
Megonigal et al. (1993)James and Fenton (1993)
Minnesota sitesCOTg = 171»»*PDI + 216 0.98Corg = 66.4*PDI + 288 0.76Co, = 71.7PDI + 312 0.69
Other published dataC0,g = 143***PDI + 24.3 0.92Co™ = 43.4*PDI + 742 0.35
*, **, »** Regression coefficient (slope) significant at the 0.05, 0.01, and0.001 levels, respectively.
conditions, these techniques may potentially be used forestimation of the spatial distribution of hydric soils insimilar landscapes.
Identifying Hydric SoilsThe use of PDI for hydric soil identification and delin-
eation requires setting a threshold value that separateshydric from nonhydric soils. Based on variations in PDIamong the three Minnesota study sites, the thresholdvalue would be specific to soils of similar climate andparent materials. From our hydrologic monitoring dataat the Dalton study site (Table 2) and corresponding PDIdata (Table 4), the threshold value should lead to the
inclusion of the soils at the toeslope (PDI = 29.0) anddepression (PDI = 70.2). At the Dalton study site, settingthe threshold is complicated by the presence of the benchfeature along the hillslope. The pedon at the bench hasa relatively high (32.8) PDI (Table 4) but monitoringdata indicates that the water table has not been within50 cm of the surface during this study (Table 2). Thelarge PDI is probably a result of deposition of highorganic matter sediments eroded from upslope positions,not prolonged saturated and reducing conditions. At thissite the threshold between PDI values of hydric andnonhydric soils is likely between 3.2 and 29.0 (Table4). A conservative estimate of the threshold value wouldbe 29.0—the lowest PDI value of a soil with a >2-wkduration of saturated conditions within the upper 25 cmduring our monitoring period (i.e., presumed hydricsoils). At the other study sites threshold values wouldbe different. For example, at the Faribault study site thelowest PDI score of a presumed hydric soil is 46.8.Separation between the PDI scores of hydric and nonhy-dric soils at the Thief River Falls study site is not as clear.These differences among only three sites in Minnesotaaccentuate the necessity for regionalization of this ap-proach. As with other proposed indicators of hydricsoils, the PDI threshold value will change among climatesand parent materials. Continued research in both Mollisoland non-Mollisol landscapes is warranted to better estab-
420
415
-410
405
400
425
-420
Color Index
Surface Elevation
Sample
400
Sample SampleFig. 6. Variations in soil color indexes along a hillslope transect at the Dalton study site: (a) Profile Darkness Index (PDI); (b) Redness Rating
(RR); (c) Cl; and (d) C2.
THOMPSON & BELL: COLOR INDEX FOR HYDRIC CONDITIONS 1987
lish reasonable threshold values. Local calibration is alsorecommended for detailed delineations of hydric soils.
This approach emphasizes the difficulty associated withtrying to draw an abrupt boundary in a continuouslyvarying soil landscape. Clear threshold values frequentlywill not be apparent because the nature of the spatialvariability in soil characteristics is often gradual ratherthan discrete. One possible use of this index would beas part of a fidelity rating system as suggested by theNational Committee on Characterization of Wetlands(National Research Council, 1995, p. 79-131). In sucha system, the range in PDI would be partitioned intothree classes to distinguish among obligate hydric soils,facultative hydric soils, and obligate nonhydric soils.For certain landscapes, PDI appears to be more effectivethan other color indexes at distinguishing what are clearlynot hydric soils from those that are hydric soils as wellas identifying the marginal soils. The use of a single soilmorphological characteristic for identification of hydricsoils is often problematic, particularly for "problem soils"such as Mollisols. Consequently, PDI should be viewedas a potential indicator of hydric soil conditions andneeds to be considered in the context of additional soilmorphological and landscape evidence.
It may be possible to use PDI in conjunction withother soil morphologic information, such as observationof redox concentrations or depletions in the upper Bhorizon, or with another color index as supporting evi-dence for delineation of hydric soils. Of the three Bhorizon color indexes, RR appears to give the best separa-tion among the hydric and nonhydric soils at the Daltonstudy site (Fig. 6b, Table 5). A similar threshold couldbe selected for RR as was done with PDI, such as 9.0.If a pedon were to score above the PDI threshold andbelow the RR threshold, this would be strong evidencethat that pedon is probably a hydric soil. This emphasizesthe importance of B horizon color for identifying thepresence of seasonally saturated soil conditions in Molli-sols. Similar combinations of two (or more) color indexescould be used in a fidelity rating system for assessingthe certainty of hydric soil conditions.
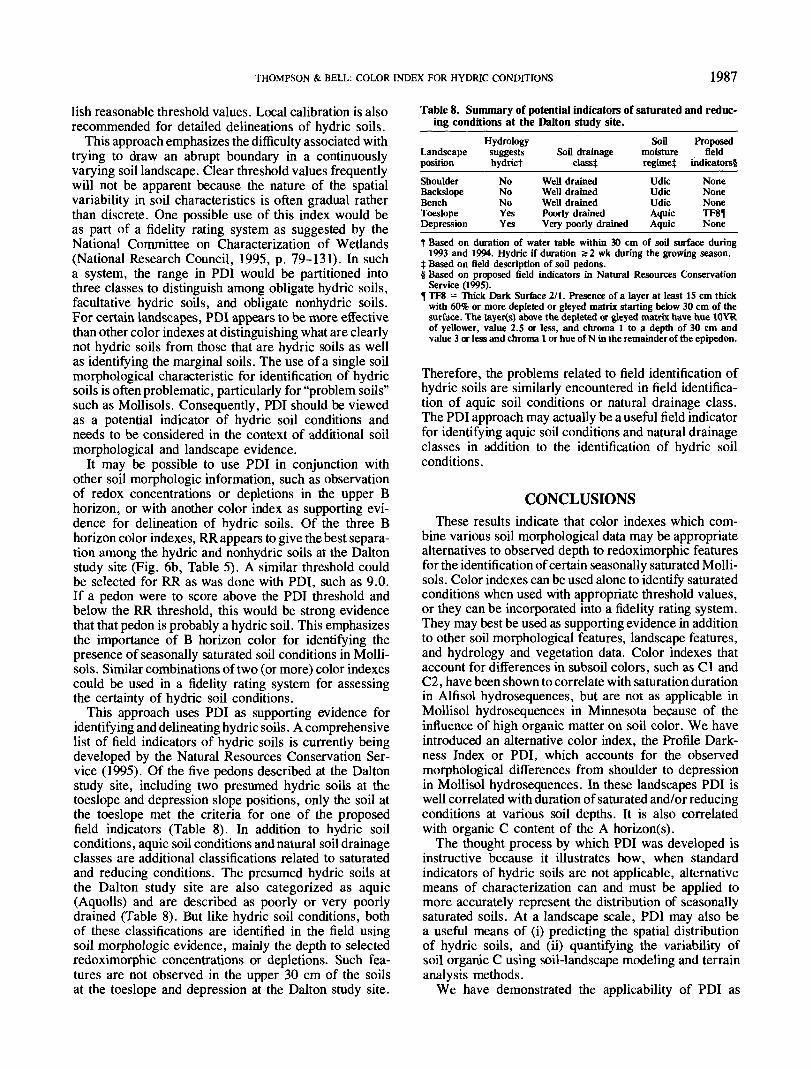
This approach uses PDI as supporting evidence foridentifying and delineating hydric soils. A comprehensivelist of field indicators of hydric soils is currently beingdeveloped by the Natural Resources Conservation Ser-vice (1995). Of the five pedons described at the Daltonstudy site, including two presumed hydric soils at thetoeslope and depression slope positions, only the soil atthe toeslope met the criteria for one of the proposedfield indicators (Table 8). In addition to hydric soilconditions, aquic soil conditions and natural soil drainageclasses are additional classifications related to saturatedand reducing conditions. The presumed hydric soils atthe Dalton study site are also categorized as aquic(Aquolls) and are described as poorly or very poorlydrained (Table 8). But like hydric soil conditions, bothof these classifications are identified in the field usingsoil morphologic evidence, mainly the depth to selectedredoximorphic concentrations or depletions. Such fea-tures are not observed in the upper 30 cm of the soilsat the toeslope and depression at the Dalton study site.
Table 8. Summary of potential indicators of saturated and reduc-ing conditions at the Dalton study site.
Landscapeposition
ShoulderBackslopeBenchToeslopeDepression
Hydrologysuggestshydrict
NoNoNoYesYes
Soil drainageclasst
Well drainedWell drainedWell drainedPoorly drainedVery poorly drained
Soilmoistureregime^
UdicUdicUdicAquicAquic
Proposedfield
indicators§
NoneNoneNoneTF81None
t Based on duration of water table within 30 cm of soil surface during1993 and 1994. Hydric if duration a 2 wk during the growing season.
t Based on field description of soil pedons.§ Based on proposed field indicators in Natural Resources Conservation
Service (1995).1TF8 = Thick Dark Surface 2/1. Presence of a layer at least 15 cm thick
with 60% or more depleted or gleyed matrix starting below 30 cm of thesurface. The layer(s) above the depleted or gleyed matrix have hue 10YRof yellower, value 2.5 or less, and chroma 1 to a depth of 30 cm andvalue 3 or less and chroma 1 or hue of N in the remainder of the epipedon.
Therefore, the problems related to field identification ofhydric soils are similarly encountered in field identifica-tion of aquic soil conditions or natural drainage class.The PDI approach may actually be a useful field indicatorfor identifying aquic soil conditions and natural drainageclasses in addition to the identification of hydric soilconditions.
CONCLUSIONSThese results indicate that color indexes which com-
bine various soil morphological data may be appropriatealternatives to observed depth to redoximorphic featuresfor the identification of certain seasonally saturated Molli-sols. Color indexes can be used alone to identify saturatedconditions when used with appropriate threshold values,or they can be incorporated into a fidelity rating system.They may best be used as supporting evidence in additionto other soil morphological features, landscape features,and hydrology and vegetation data. Color indexes thataccount for differences in subsoil colors, such as Cl andC2, have been shown to correlate with saturation durationin Alfisol hydrosequences, but are not as applicable inMollisol hydrosequences in Minnesota because of theinfluence of high organic matter on soil color. We haveintroduced an alternative color index, the Profile Dark-ness Index or PDI, which accounts for the observedmorphological differences from shoulder to depressionin Mollisol hydrosequences. In these landscapes PDI iswell correlated with duration of saturated and/or reducingconditions at various soil depths. It is also correlatedwith organic C content of the A horizon(s).
The thought process by which PDI was developed isinstructive because it illustrates how, when standardindicators of hydric soils are not applicable, alternativemeans of characterization can and must be applied tomore accurately represent the distribution of seasonallysaturated soils. At a landscape scale, PDI may also bea useful means of (i) predicting the spatial distributionof hydric soils, and (ii) quantifying the variability ofsoil organic C using soil-landscape modeling and terrainanalysis methods.
We have demonstrated the applicability of PDI as
1988 SOIL SCI. SOC. AM. J., VOL. 60, NOVEMBER-DECEMBER 1996
supporting evidence for discriminating between hydricand nonhydric soils on individual hillslopes dominatedby Mollisols in Minnesota. We expect that this indexwill not be as applicable in non-Mollisol landscapesand that the PDI threshold value between hydric andnonhydric soils is a function of both climate and parentmaterials.
ACKNOWLEDGMENTSWe acknowledge the contributions of Charlie Butler, Mark
Rollins, and Paul Cameron (University of Minnesota); JohnBeck (Natural Resources Conservation Service); and Dr. JimRichardson, Todd Soukup, and Lynn Foss (North Dakota StateUniversity) in data collection at the various sites in Minnesota.We also acknowledge the contributions of Dr. Warren Lynn(Natural Resources Conservation Service) and Dr. SteveSprecher (U.S. Army Corps of Engineers) for leading thisresearch initiative at the national level. Portions of this researchwere supported by funds provided by Natural Resources Con-servation Service, Army Corps of Engineers Waterways Exper-iment Station, the Minnesota Agricultural Experiment Station,and the University of Minnesota Graduate School. We alsothank Dr. Ed Nater, Dr. Jim Anderson, and Dr. David Mullaof the University of Minnesota for offering many thoughtfulcomments that improved this manuscript.