Embed Size (px)
Citation preview
Color Constancy:Small overall and large local changes
John J. McCann
Vision Research Laboratory, PolaroidCambridge, MA, 02139, USA
ABSTRACT
This is a two-pan study of the human visual system's mechanism for normalization in color constancy phenom-ena. Part I uses a viewing technique shown by Maximov. The viewing box consists of a cardboard shoe box with ahole cut in the top to pass light, a color correcting filter and a viewing tube. The viewing tube restricts the field ofview on the opposite wall where small five-area Mondrians, called Tatami are mounted.
For the Part I. Tatami Control we chose two illuminations and prepared a pair of Tatami (A & B).). The productof one illuminant and Tatami A reflectances equal led the product of the other illuminant and the Tatami B reflectances.Corresponding pixels in the two Tatami cause identical quanta catches at the retina. Thus, the two Tatami lookidentical, even though they have very different reflectances. These Tatami contradict everyday experience that com-plex displays exhibit color constancy.
The Tatami Experiment is the addition of the same white reflectance area to both Tatami. All pixels, exceptthose replaced by white area, are the same as in the control experiment. Nevertheless,, all of the areas in both Tatamino longer match. Each Tatami looks much closer to its appearance in the room. The introduction of the white area hasdestroyed the color match and has initiated the human color constancy mechanism.
Part II Control uses even simpler displays: a pair of Center-Surround targets. The experiment uses two trans-parencies on an overhead projector. The first transparency represents a pair of uniform "Illumination" componentsand the second a pair of two-area, "Reflectance" components. First, the two different illumination transmittances areselected. Then, the transmittances for two sets of "Reflectance Components" (A & B)) are chosen so that the productof one "Illumination" and "Reflectances" A components are equal to the product of the other "Illumination" and"Reflectances" B components for corresponding pixels. This is analogous to the control pan of the Tatami experi-ments. As before, these Center-Surround targets contradict everyday experience that complex displays exhibit colorconstancy.
The Part II Experiment uses the Center-Surround target described in the control with one modification. Thinbands of a new "Reflectance," called Constancy Test Patches are added to the target. The same "Reflectance" isadded to both targets, A and B. Some test patches destroy the color match by initiating the color constancy mecha-nism; others have no effect. In all, 16 different Constancy Test Patches are tested. The results help to understand themechanism controlling the human color constancy mechanism.
The introduction of any Constancy Test Patches with a new maximum quanta catch for any cone causes a resetof color appearance. The introduction of any new maximum quanta catch for any cone type turns on the colorconstancy, or match destroying, mechanism. It follows that the mechanism controlling color constancy uses theindividual maxima in each wave band to calculate color sensations. This is the Retinex hypothesis.
310 / SPIE Vol. 1666 Human Vision, Visual Processing, and Digital Display III (1992) 0-8194-082-4/921 $4.00
1. INTRODUCTION
Colors of objects tend to be constant regardless of the color of the illuminant, therefore, regardless of thequanta catch of the retinal cones. Various color-constancy mechanisms including context recognition, (Helmholtz1),adaptation of retinal sensitivities (von Kries2) and independent processing by receptor types (Retinex3) have beenproposed to explain these observations.
The present experiments test three hypothesizes related to the Retinex explanation. The first is that colors aredetermined by the normalized relationship between all quanta catches in the field of view. By this hypothesis, colorsare constant in classical experiments simply because changes of the illuminant do not disrupt the relationship ofquanta catches in the field of view. The second hypothesis is that the normalization process is controlled by themaxima in the field of view. The third hypothesis is that this process functions independently for long-, middle- andshort-wave cones.
The most important problem in understanding human's color constancy mechanism is not the separation of"Reflectance" from "Illumination." It is simply an understanding of spatial mechanisms - global vs. Iocal. Globalchanges in quanta catch cause small appearance changes4. This is true of overall color shifts due to the color tem-perature of the illuminant and true of gradients created by nonuniformities in illumination or reflectance. Localchanges in quanta catch cause large changes in color appearance. Whether the local changes in radiance are fromreflectance, illumination or transmittance does not matter. Color-constancy mechanisms use local contrast informa-tion to normalize the image in the calculation of color sensations.
2 TATAMI EXPERIMENT
Part I of this paper is an extension of Tatami Experiments described in the Contrasts in Vision Festspiel inhonor of Fergus Campbell.5 A Tatami is a five area Mondrian designed in the style of a Japanese floor mat. TheTatami Experiments consist of making pairs of color displays, each with the same relative quanta catches, but differ-ent absolute reflectances.
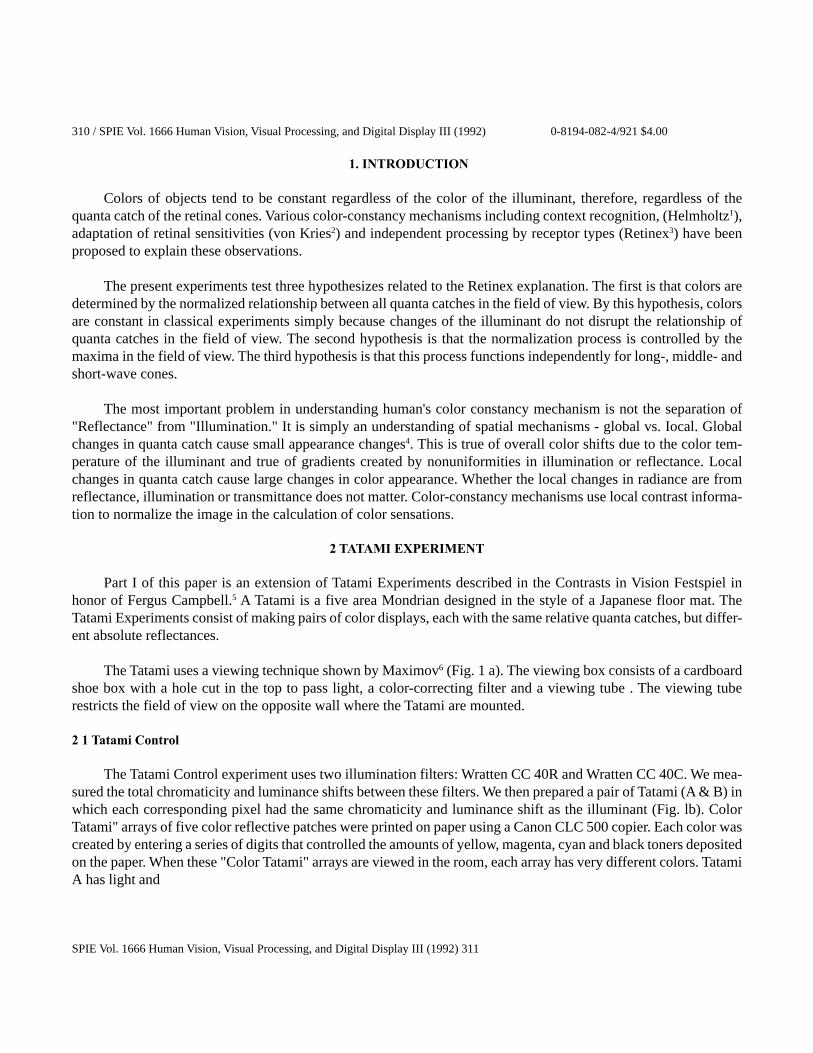
The Tatami uses a viewing technique shown by Maximov6 (Fig. 1 a). The viewing box consists of a cardboardshoe box with a hole cut in the top to pass light, a color-correcting filter and a viewing tube . The viewing tuberestricts the field of view on the opposite wall where the Tatami are mounted.
2 1 Tatami Control
The Tatami Control experiment uses two illumination filters: Wratten CC 40R and Wratten CC 40C. We mea-sured the total chromaticity and luminance shifts between these filters. We then prepared a pair of Tatami (A & B) inwhich each corresponding pixel had the same chromaticity and luminance shift as the illuminant (Fig. lb). ColorTatami" arrays of five color reflective patches were printed on paper using a Canon CLC 500 copier. Each color wascreated by entering a series of digits that controlled the amounts of yellow, magenta, cyan and black toners depositedon the paper. When these "Color Tatami" arrays are viewed in the room, each array has very different colors. TatamiA has light and
SPIE Vol. 1666 Human Vision, Visual Processing, and Digital Display III (1992) 311
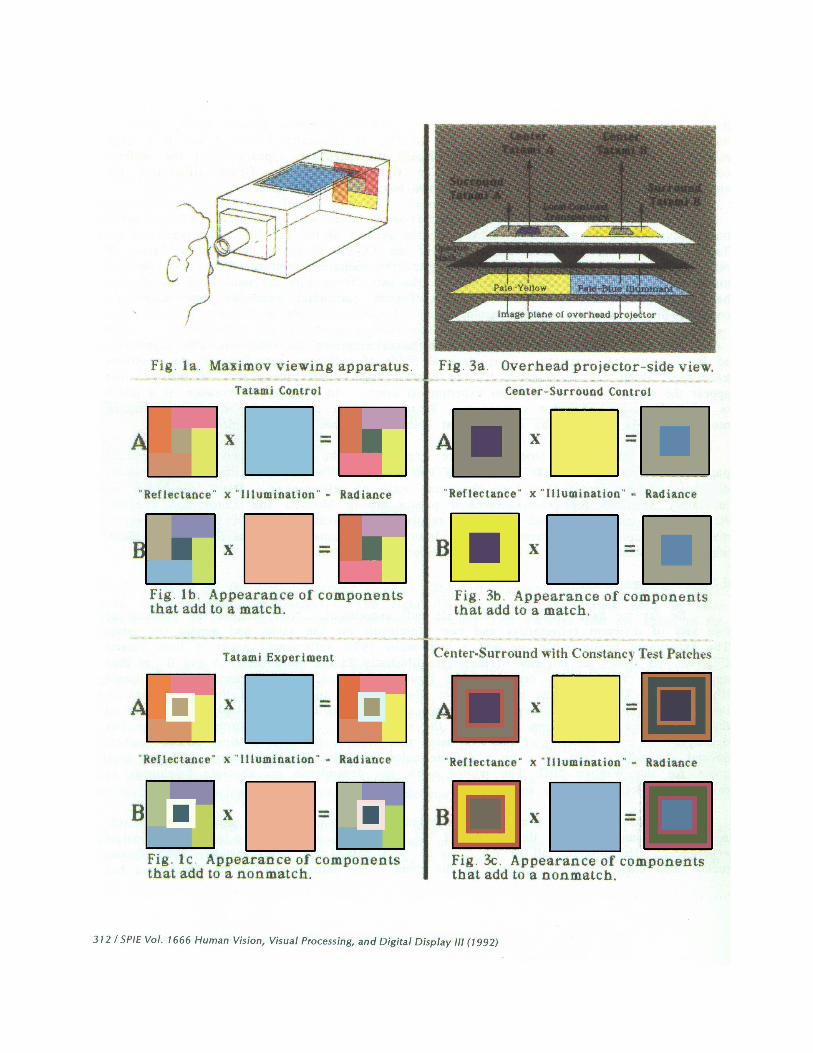
middle-tone pinks, a yellow, a red and a gray. Tatami B has a gray, a green, light and middle-tone blues and a cyan.The left side of Fig. lb illustrates Tatami A and B as they appear in the room. The center of the figure illustrates theappearance of the uniform color-correcting filtered illumination. The right side of the figure illustrates the appear-ance of the combination in the Maximov box.
When the Tatami are viewed in the Maximov boxes with a restricted field of view, both arrays appear the same.Pixel by pixel, the product of the CC 50 C illuminant and the Tatami A reflectances equaled the product of the CC 50R illuminant and the Tatami B reflectances. Except for experimental errors, the radiances coming from correspond-ing pixels in the two Tatami are identical. Thus, the two Tatami look the same even though they have very differentreflectances. These Tatami contradict everyday experience that complex displays exhibit color constancy.
Although placing the Tatami in shoe boxes surprises the observers, the experiment so far is a logical certainty.Two identical fields of radiances, regardless of the observers knowledge about the reflectances of the papers, mustappear identical. If they do not appear the same, there has to be an experimental error. In a sense, the creation of amatch is the destruction of color constancy. Whatever is in control of the color constancy mechanism it is overcomeby the fact that both displays are physically identical.
One of the reasons that people are surprised by the fact that two different sets of paper reflectances can appearidentical in two different illuminants is that it is extremely difficult to find papers that have the same ratio of reflectances.David Stork7 in our laboratory searched for pre-manufactured papers among Munsell and Color Aid samples. Hefound several paper with the same relative reflectances. He found that the observer matched the colors in the simpli-fied Mondrians to the same patches in the Munsell Book when the reflectances were viewed in compensating illumi-nation.
2.2 Tatami Experiment
So far we have created an elaborate null experiment. Null because the products of two sets of different reflectancesand two illuminants are the same, and appear the same. The experiment begins when we add a new white (95%reflectance) paper to both Tatami (Fig.1c). As above, the left side of the figure illustrates Tatami (with white) A andB as they appear in the room. The center of the figures illustrates the appearance of the filtered illumination. Theright side of the figure illustrates the appearance of the combination in the Maximov box. The observers report twofacts. First, the papers look much closer to their appearance in the room outside of the shoe boxes. In other words, thewhite has destroyed the color matches of the five areas that send to the eye identical quanta catches. Second, thewhites have taken on a definite color tint, pink for the Wratten 50R and blue green for the Wratten 50C. The whitesshow the dependence on absolute brightness as reported by McCann, McKee and Taylor.8
The addition of the same white reflectance area to each Tatami destroys the match. All pixel radiances, exceptthose replaced by white area, are the same as in the control experiment. Nevertheless, all of the areas in both Tatamino longer match. Each Tatami looks much closer to its appearance in the room. The introduction of the white area has
SPIE Vol. 1666 Human Vision, Visual Processing, and Digital Display 111 (1992) /313
destroyed the match and has initiated the color constancy mechanism. The same result as David Stork found in histhesis research.7.
3. CENTER-SURROUND EXPERIMENT
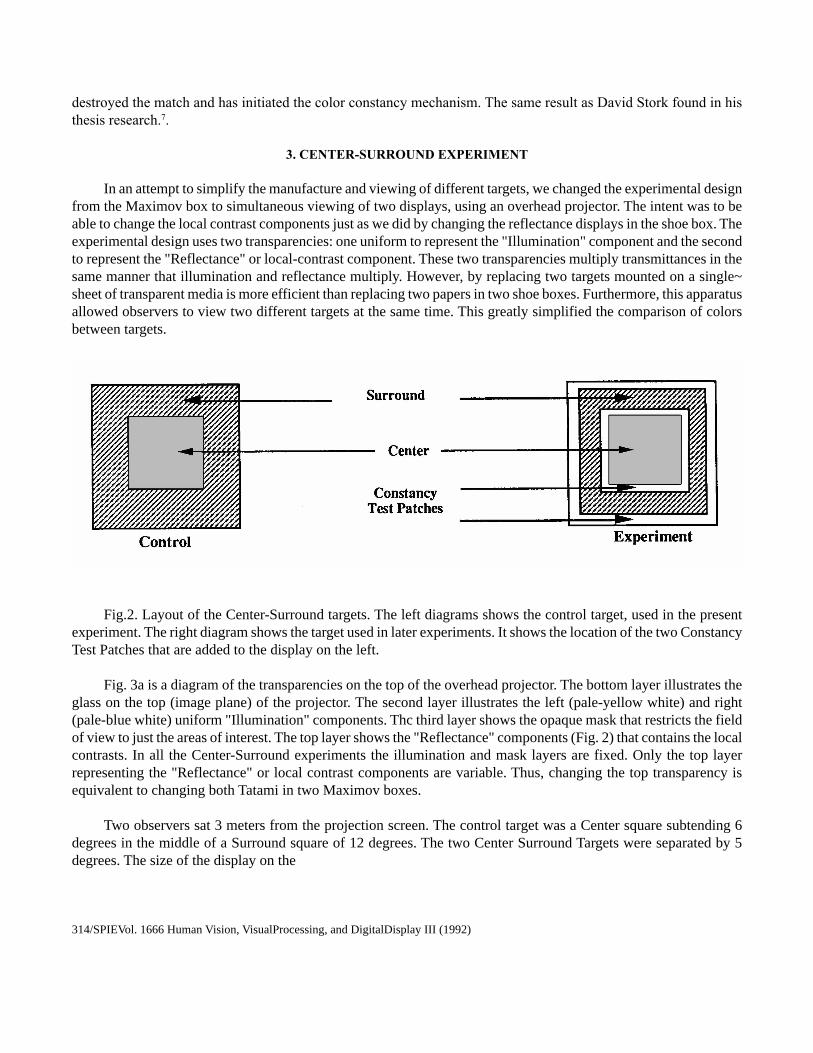
In an attempt to simplify the manufacture and viewing of different targets, we changed the experimental designfrom the Maximov box to simultaneous viewing of two displays, using an overhead projector. The intent was to beable to change the local contrast components just as we did by changing the reflectance displays in the shoe box. Theexperimental design uses two transparencies: one uniform to represent the "Illumination" component and the secondto represent the "Reflectance" or local-contrast component. These two transparencies multiply transmittances in thesame manner that illumination and reflectance multiply. However, by replacing two targets mounted on a single~sheet of transparent media is more efficient than replacing two papers in two shoe boxes. Furthermore, this apparatusallowed observers to view two different targets at the same time. This greatly simplified the comparison of colorsbetween targets.
Fig.2. Layout of the Center-Surround targets. The left diagrams shows the control target, used in the presentexperiment. The right diagram shows the target used in later experiments. It shows the location of the two ConstancyTest Patches that are added to the display on the left.
Fig. 3a is a diagram of the transparencies on the top of the overhead projector. The bottom layer illustrates theglass on the top (image plane) of the projector. The second layer illustrates the left (pale-yellow white) and right(pale-blue white) uniform "Illumination" components. Thc third layer shows the opaque mask that restricts the fieldof view to just the areas of interest. The top layer shows the "Reflectance" components (Fig. 2) that contains the localcontrasts. In all the Center-Surround experiments the illumination and mask layers are fixed. Only the top layerrepresenting the "Reflectance" or local contrast components are variable. Thus, changing the top transparency isequivalent to changing both Tatami in two Maximov boxes.
Two observers sat 3 meters from the projection screen. The control target was a Center square subtending 6degrees in the middle of a Surround square of 12 degrees. The two Center Surround Targets were separated by 5degrees. The size of the display on the
314/SPIEVol. 1666 Human Vision, VisualProcessing, and DigitalDisplay III (1992)
retina varies with viewing distance. This type of display shows very little change with change of visual angle.9
Observers sitting at different distances report the same results.
As in the previous experiment the color patches were made on the Canon CLC 500 laser printer under digitalcontrol. This time they are printed on a transparent substrate. The search for highly constrained transmittances isgreatly simplified by using the same dye set to generate both "Illumination" and "Reflectance" components. Sincethe dye sets are the same, it is possible to make convenient densitometer measurements while adjusting digits in theprinter. All final measurements are confirmed using a colorimeter.
3.1 Center-Surround Target--Control
First, the two different illumination transmittances are selected. They are made on the CLC 500 on transparentmedia by painting with uniform digital values for yellow, cyan, magenta and black toners. The digital values werechosen so as to have a weak blue filter and a weak yellow of about the same luminance. The pale-yellow "illuminant"had toner values of Y=50%, M=0%, C=0% and K=30%; the pale-blue "illuminant" had toner values of Y=0%,M=75%, C=75% and K=0%.
The next step in the experiment is to find the transmittances of a pair of Centers and the transmittances of apair of Surrounds that satisfy the following four constraints:
° The ratio of quanta catches for A center to A surround equals the ratio of quanta catches for B center to Bsurround, for all three cone types.
° The absolute quanta catches for A center is different from the quanta catches for B center for all three conetypes.
° The sum of optical densities of the pale-yellow "Illuminant" and A center equals the sum of the pale-blue"Illumination" and B center.
° The sum of optical densities of the pale-yellow "Illumination" and A surround equals the sum of the paleblue "Illumination" and B surround.
The left side of Fig. 3b illustrates Center-Surround A and B as they appear projected by themselves. On the farleft are the "Reflectances." The A Surround is gray; the A Center is a saturated blue. The B Surround is yellow; the ACenter is gray. In the middle, the A Illumination is pale-yellow; the B Illumination is pale-blue. These uniformpatches illustrate the appearance of the uniform "Illuminations" projected by themselves using a tungsten lamp in anoverhead projector. The right side of Fig. 3b illustrates the appearance of the combination of "Reflectances" and"Illuminations" on the screen. The consequence of above constraints is that the A Center-Surround Target in pale-yellow "Illumination" is identical to the B Center-Surround Target in pale-blue "Illumination." This is an equivalentexperiment to the Tatami control described above. As in the Tatami control, the two CenterSurround target appearthe same colors; they both have gray surround (slight yellow tint) and a medium saturation, bright blue center. Theylook the same because they are identical quanta catches everywhere in the field of view.
SPIE Vol. 1666 Human Vision, Visual Processing, and Digital Display III (1992) /315
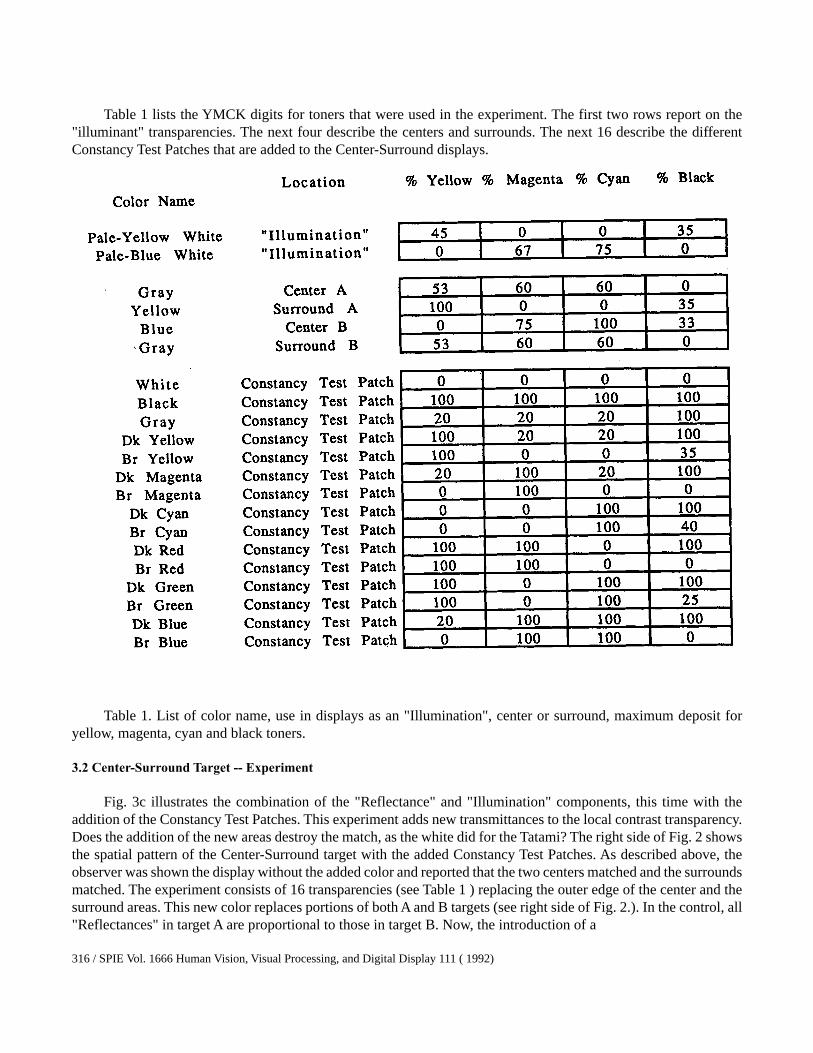
Table 1 lists the YMCK digits for toners that were used in the experiment. The first two rows report on the"illuminant" transparencies. The next four describe the centers and surrounds. The next 16 describe the differentConstancy Test Patches that are added to the Center-Surround displays.
Table 1. List of color name, use in displays as an "Illumination", center or surround, maximum deposit foryellow, magenta, cyan and black toners.
3.2 Center-Surround Target -- Experiment
Fig. 3c illustrates the combination of the "Reflectance" and "Illumination" components, this time with theaddition of the Constancy Test Patches. This experiment adds new transmittances to the local contrast transparency.Does the addition of the new areas destroy the match, as the white did for the Tatami? The right side of Fig. 2 showsthe spatial pattern of the Center-Surround target with the added Constancy Test Patches. As described above, theobserver was shown the display without the added color and reported that the two centers matched and the surroundsmatched. The experiment consists of 16 transparencies (see Table 1 ) replacing the outer edge of the center and thesurround areas. This new color replaces portions of both A and B targets (see right side of Fig. 2.). In the control, all"Reflectances" in target A are proportional to those in target B. Now, the introduction of a
316 / SPIE Vol. 1666 Human Vision, Visual Processing, and Digital Display 111 ( 1992)
new area, that has the same transmittance in both the A and the B displays, destroys the proportional relationship.
Model Predictions
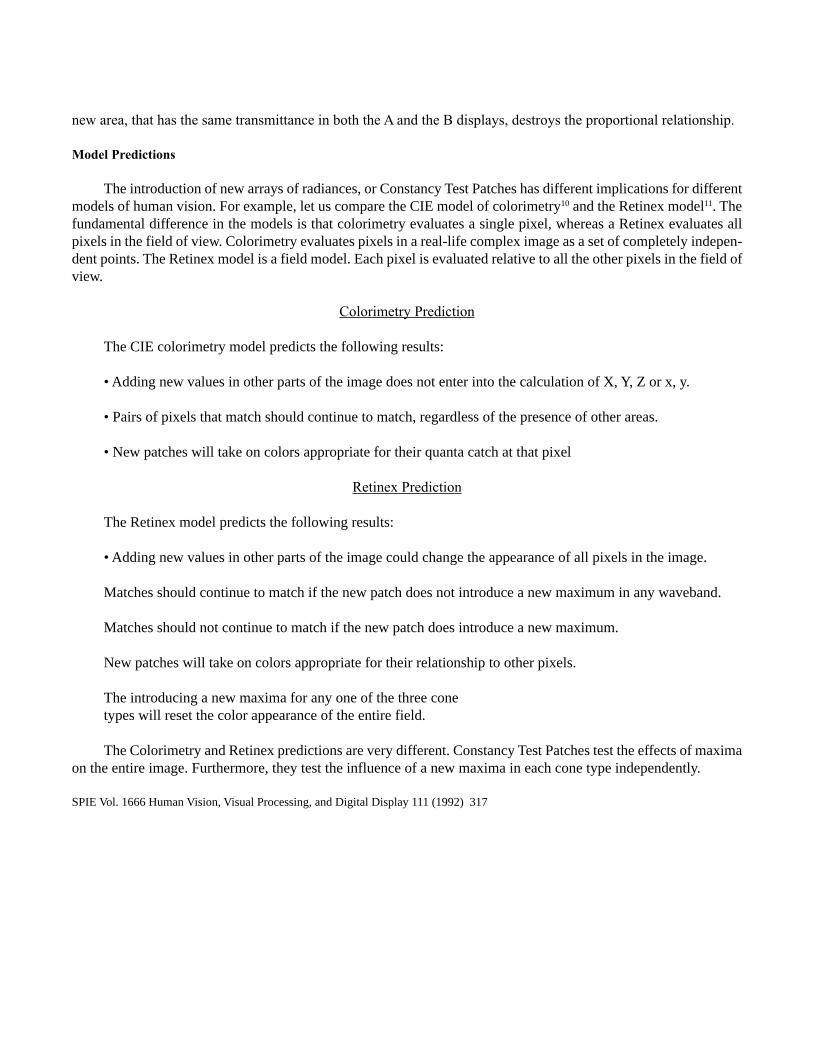
The introduction of new arrays of radiances, or Constancy Test Patches has different implications for differentmodels of human vision. For example, let us compare the CIE model of colorimetry10 and the Retinex model11. Thefundamental difference in the models is that colorimetry evaluates a single pixel, whereas a Retinex evaluates allpixels in the field of view. Colorimetry evaluates pixels in a real-life complex image as a set of completely indepen-dent points. The Retinex model is a field model. Each pixel is evaluated relative to all the other pixels in the field ofview.
Colorimetry Prediction
The CIE colorimetry model predicts the following results:
• Adding new values in other parts of the image does not enter into the calculation of X, Y, Z or x, y.
• Pairs of pixels that match should continue to match, regardless of the presence of other areas.
• New patches will take on colors appropriate for their quanta catch at that pixel
Retinex Prediction
The Retinex model predicts the following results:
• Adding new values in other parts of the image could change the appearance of all pixels in the image.
Matches should continue to match if the new patch does not introduce a new maximum in any waveband.
Matches should not continue to match if the new patch does introduce a new maximum.
New patches will take on colors appropriate for their relationship to other pixels.
The introducing a new maxima for any one of the three conetypes will reset the color appearance of the entire field.
The Colorimetry and Retinex predictions are very different. Constancy Test Patches test the effects of maximaon the entire image. Furthermore, they test the influence of a new maxima in each cone type independently.
SPIE Vol. 1666 Human Vision, Visual Processing, and Digital Display 111 (1992) 317
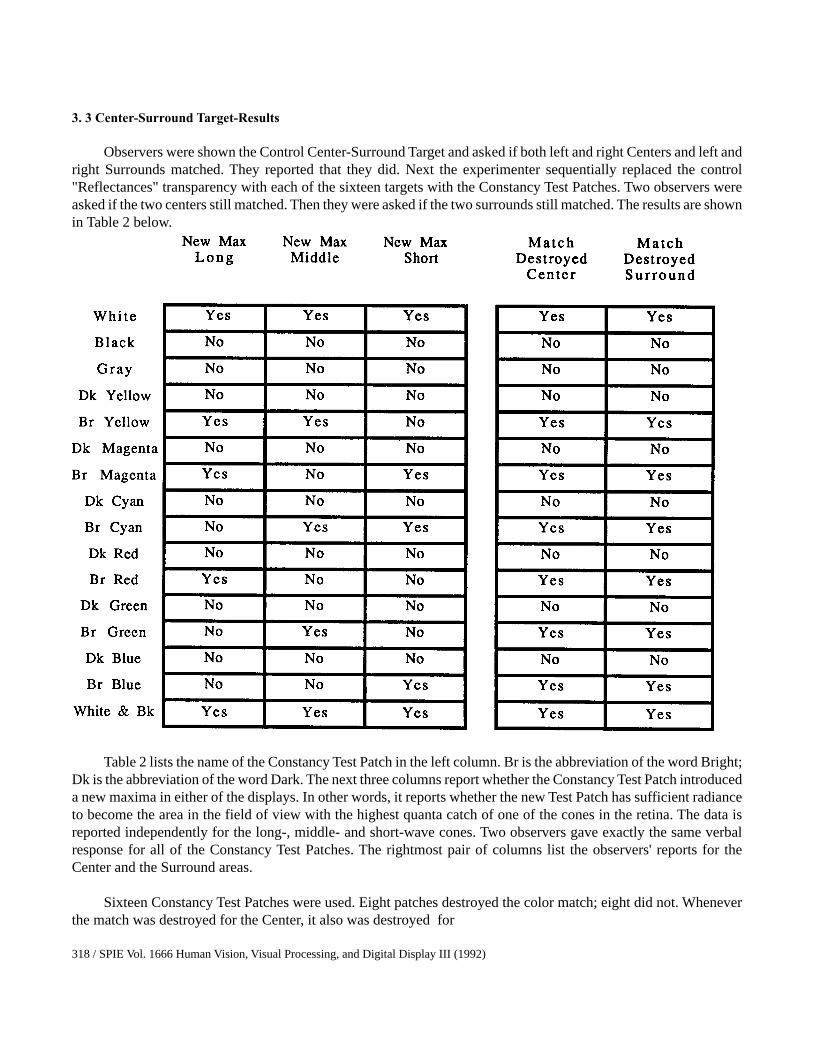
3. 3 Center-Surround Target-Results
Observers were shown the Control Center-Surround Target and asked if both left and right Centers and left andright Surrounds matched. They reported that they did. Next the experimenter sequentially replaced the control"Reflectances" transparency with each of the sixteen targets with the Constancy Test Patches. Two observers wereasked if the two centers still matched. Then they were asked if the two surrounds still matched. The results are shownin Table 2 below.
Table 2 lists the name of the Constancy Test Patch in the left column. Br is the abbreviation of the word Bright;Dk is the abbreviation of the word Dark. The next three columns report whether the Constancy Test Patch introduceda new maxima in either of the displays. In other words, it reports whether the new Test Patch has sufficient radianceto become the area in the field of view with the highest quanta catch of one of the cones in the retina. The data isreported independently for the long-, middle- and short-wave cones. Two observers gave exactly the same verbalresponse for all of the Constancy Test Patches. The rightmost pair of columns list the observers' reports for theCenter and the Surround areas.
Sixteen Constancy Test Patches were used. Eight patches destroyed the color match; eight did not. Wheneverthe match was destroyed for the Center, it also was destroyed for
318 / SPIE Vol. 1666 Human Vision, Visual Processing, and Digital Display III (1992)
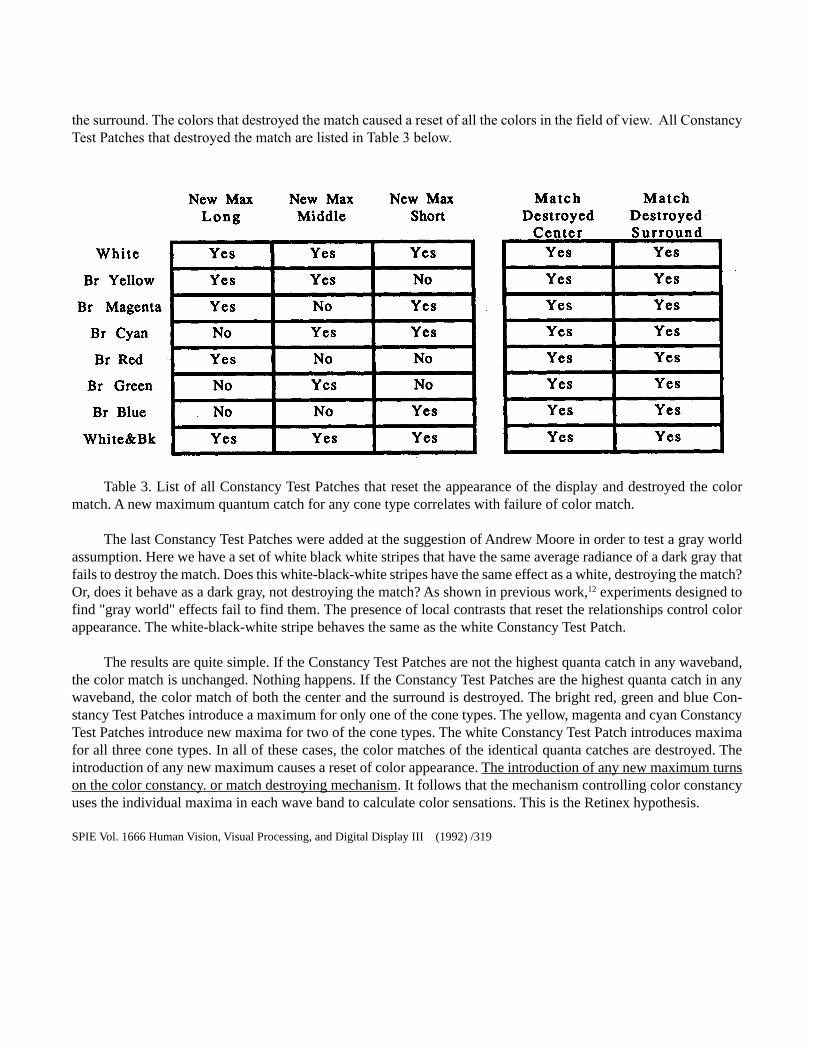
the surround. The colors that destroyed the match caused a reset of all the colors in the field of view. All ConstancyTest Patches that destroyed the match are listed in Table 3 below.
Table 3. List of all Constancy Test Patches that reset the appearance of the display and destroyed the colormatch. A new maximum quantum catch for any cone type correlates with failure of color match.
The last Constancy Test Patches were added at the suggestion of Andrew Moore in order to test a gray worldassumption. Here we have a set of white black white stripes that have the same average radiance of a dark gray thatfails to destroy the match. Does this white-black-white stripes have the same effect as a white, destroying the match?Or, does it behave as a dark gray, not destroying the match? As shown in previous work,12 experiments designed tofind "gray world" effects fail to find them. The presence of local contrasts that reset the relationships control colorappearance. The white-black-white stripe behaves the same as the white Constancy Test Patch.
The results are quite simple. If the Constancy Test Patches are not the highest quanta catch in any waveband,the color match is unchanged. Nothing happens. If the Constancy Test Patches are the highest quanta catch in anywaveband, the color match of both the center and the surround is destroyed. The bright red, green and blue Con-stancy Test Patches introduce a maximum for only one of the cone types. The yellow, magenta and cyan ConstancyTest Patches introduce new maxima for two of the cone types. The white Constancy Test Patch introduces maximafor all three cone types. In all of these cases, the color matches of the identical quanta catches are destroyed. Theintroduction of any new maximum causes a reset of color appearance. The introduction of any new maximum turnson the color constancy. or match destroying mechanism. It follows that the mechanism controlling color constancyuses the individual maxima in each wave band to calculate color sensations. This is the Retinex hypothesis.
SPIE Vol. 1666 Human Vision, Visual Processing, and Digital Display III (1992) /319
4. CONCLUSIONS
This is a two-pan study of the human visual system's mechanism for normalization in color constancy. Bycombining the Tatami and the Center-Surround experiments we can draw a number of important conclusions aboutthe human color-constancy mechanism.
Exact color constancy is achieved by exactly equal quanta catches everywhere in the field of view. The intro-duction of global changes in quanta catch cause small appearance changes. This is very different from local changesin quanta catch that cause large appearance changes.
The human color constancy mechanism normalizes sensations to the maxima in the field of view. The additionof the same white to two Tatami, destroys the match of all of the areas in both Tatami. Each Tatami looks much closerto its appearance in the room. The introduction of the white area has destroyed the color match and has initiated thecolor constancy mechanism.
The human color constancy mechanism normalizes sensations to the maxima in the field of view; It normalizeseach waveband separately (Retinex). Constancy Test Patches in Center-Surround targets showed that the introduc-tion of any patch with a new maximum quanta catch for any cone causes a reset of color appearance. The introduc-tion of any new maximum quanta catch for any cone type turns on the color-constancy, or match destroying, mecha-nism. It follows that the mechanism controlling color constancy uses the individual maxima in each wave band tocalculate color sensations.
5. ACKNOWLEDGMENTS
This research was started many years ago with David Stork's early work. The author wishes to thank AndyMoore for his helpful discussions.
6. REFERENCES
1 H. von Helmholtz, "Physiological Optics," Vol. II, J. P. Southall, Ed., Optical Society of America, pp. 264-265, 1924.2J. von Kries, Die Geisichtsempfindungen, in Nagel's Handbuch der Physiologie des Menschen, Vol. 3, pp. 205-240, Vieweg, Braunschweig,
1905.3 E. H. Land, and J. J. McCann, Lightness and Retinex Theory. J. Opt. Soc. Am.,vol. 61, 1-11,1971.4. J. J. McCann, "Local/Global Mechanisms for Color Constancy" Die Farber, vol.34, 275-283,1987.5. J. J. McCann, "Rules for colour constancy," Ophthal. Physiol. Opt. Vol 12, in press, 1992.6. V. Maximov, Personal Communication.7. D. Stork, MIT Undergraduate Thesis, 1976.8. J. J. McCann, S. P. McKee and T. H. Taylor, "Quantitative Studies in Retinex Theory, A Comparison Between Theoretical Predictions and
Observer Responses to the "ColorMondrian" Experiments," Vis. Res., vol. 16, 445-458, 1976.9. J. J. McCann, Visibility of gradients and low-spatial frequency sinusoids: Evidence for a distance constancy mechanism, Photogr. Sci. Eng.,
Vol 22, pp. 64-68, 1978.10. CIE Proceedings 1931, Cambridge University Press, Cambridge, 1932.
320 / SPIE Vol. 1666 Human Vision, Visual Processing, and Digital Display III(1992)

11. J. Frankle and J. McCann, "Method and Apparatus of Lightness imaging," U.S. Patent, 4,384,336.1 2. J. J. McCann, "The role of nonlinear operations in modeling human color sensations," SPIE Proceedings, vol. 1077, pp. 355-363, 1989.
SPIE Vol. 1666 Human Vision, Visual Processing, and Digital Display III (1992) /321