Embed Size (px)
Citation preview
[ – DRAFT – ]
Colony NorthStar Credit Real Estate, Inc.
Creating a Leading Commercial Real Estate Credit REIT
January 2018
Colony NorthStar Credit Real Estate, Inc. 1
Forward-Looking Statements
Cautionary Statement Regarding Forward-Looking StatementsThis presentation may contain forward-looking statements within the meaning of the federal securities laws. Forward-looking statements relate to expectations, beliefs, projections, future plans and strategies, anticipated events or trends
and similar expressions concerning matters that are not historical facts. In some cases, you can identify forward-looking statements by the use of forward-looking terminology, such as “may,” “will,” “should,” “expects,” “intends,” “plans,”
“anticipates,” “believes,” “estimates,” “predicts” or “potential” or the negative of these words and phrases or similar words or phrases which are predictions of or indicate future events or trends and which do not relate solely to historical
matters. Forward-looking statements involve known and unknown risks, uncertainties, assumptions and contingencies, many of which are beyond our control, and may cause actual results to differ significantly from those expressed in any
forward-looking statement. Among others, the following uncertainties and other factors could cause actual results to differ from those set forth in the forward-looking statements: the failure to receive, on a timely basis or otherwise, the
required approvals by each of the NorthStar Real Estate Income Trust, Inc. and NorthStar Real Estate Income II, Inc. stockholders, government or regulatory agencies and third parties; the risk that a condition to closing of the combination
may not be satisfied (including the listing by Colony Northstar Credit Real Estate, Inc. of its Class A common stock on a national securities exchange); each company’s ability to consummate the combination; operating costs and business
disruption may be greater than expected; and the ability to realize substantial efficiencies as well as anticipated strategic and financial benefits, and the impact of legislative, regulatory and competitive changes, and other risk factors
relating to the industries in which each company operates, as detailed from time to time in each company’s reports filed with Securities and Exchange Commission (“SEC”). There can be no assurance that the combination will in fact be
consummated.
None of Colony NorthStar, Inc., NorthStar Real Estate Income Trust, Inc., NorthStar Real Estate Income II, Inc. or any other person assumes responsibility for the accuracy or completeness of any of these forward-looking statements. You
should not rely upon forward-looking statements as predictions of future events. The forward-looking statements speak only as of the date of this presentation. None of Colony NorthStar, Inc., NorthStar Real Estate Income Trust, Inc. or
NorthStar Real Estate Income II, Inc. are under any duty to update any of these forward-looking statements after the date of this presentation, nor to conform prior statements to actual results or revised expectation, and none of Colony
NorthStar, Inc., NorthStar Real Estate Income Trust, Inc. or NorthStar Real Estate Income II, Inc. intends to do so.
Additional Information and Where to Find ItIn connection with the proposed transaction, Colony NorthStar Credit Real Estate, Inc. has filed with the SEC a registration statement on Form S-4 (File No. 333-221685) and Colony NorthStar Credit Real Estate, Inc., NorthStar Real
Estate Income Trust, Inc. and NorthStar Real Estate Income II, Inc. have filed with the SEC a definitive joint proxy statement / prospectus that was first mailed to security holders of Northstar Real Estate Income Trust, Inc. and NorthStar
Real Estate Income II, Inc. on or about December 6, 2017. Each of Colony NorthStar Credit Real Estate, Inc., NorthStar Real Estate Income Trust, Inc. and NorthStar Real Estate Income II, Inc. may also file other documents with the SEC
regarding the proposed transaction. This document is not a substitute for the joint proxy statement/prospectus or registration statement or any other document that Colony NorthStar Credit Real Estate, Inc., NorthStar Real Estate Income
Trust, Inc. or NorthStar Real Estate Income II, Inc. may file with the SEC. INVESTORS AND SECURITY HOLDERS OF COLONY NORTHSTAR CREDIT REAL ESTATE, INC., NORTHSTAR REAL ESTATE INCOME TRUST, INC. AND
NORTHSTAR REAL ESTATE INCOME II, INC. ARE URGED TO READ THE REGISTRATION STATEMENT, THE JOINT PROXY STATEMENT/PROSPECTUS, THE CURRENT REPORTS ON FORM 8-K FILED BY EACH OF COLONY
NORTHSTAR, INC., NORTHSTAR REAL ESTATE INCOME TRUST, INC. AND NORTHSTAR REAL ESTATE INCOME II, INC. ON AUGUST 28, 2017 IN CONNECTION WITH THE ANNOUNCEMENT OF THE ENTRY INTO THE
MASTER COMBINATION AGREEMENT, THE CURRENT REPORTS ON FORM 8-K FILED BY EACH OF COLONY NORTHSTAR, INC., NORTHSTAR REAL ESTATE INCOME TRUST, INC. AND NORTHSTAR REAL ESTATE INCOME
II, INC. ON NOVEMBER 21, 2017 IN CONNECTION WITH THE ANNOUNCEMENT OF THE ENTRY INTO THE AMENDED AND RESTATED MASTER COMBINATION AGREEMENT AND ANY OTHER RELEVANT DOCUMENTS THAT
ARE FILED OR WILL BE FILED WITH THE SEC, AS WELL AS ANY AMENDMENTS OR SUPPLEMENTS TO THESE DOCUMENTS, CAREFULLY AND IN THEIR ENTIRETY BECAUSE THEY CONTAIN OR WILL CONTAIN
IMPORTANT INFORMATION ABOUT THE PROPOSED TRANSACTION AND RELATED MATTERS. Investors and security holders may obtain free copies of the registration statement and the joint proxy statement/prospectus and other
documents filed with the SEC by Colony NorthStar, Inc., NorthStar Real Estate Income Trust, Inc. and NorthStar Real Estate Income II, Inc. through the website maintained by the SEC at www.sec.gov or by contacting the investor relations
department of Colony NorthStar, Inc., NorthStar Real Estate Income Trust, Inc. or NorthStar Real Estate Income II, Inc. at the following:
Contacts:Colony NorthStar, Inc.
Darren J. Tangen Kevin P. Traenkle Lasse Glassen
Executive Vice President and Chief Financial Officer Executive Vice President and Chief Investment Officer Addo Investor Relations
310-552-7230 310-552-7212 310-829-5400
NorthStar Real Estate Income Trust, Inc. NorthStar Real Estate Income II, Inc.
Investor Relations Investor Relations
877-940-8777 877-940-8777
Participants in the SolicitationEach of NorthStar Real Estate Income Trust, Inc. and NorthStar Real Estate Income II, Inc. and their respective directors and executive officers may be deemed to be participants in the solicitation of proxies from their respective
stockholders in connection with the proposed transaction. Information regarding NorthStar Real Estate Income Trust, Inc.’s d irectors and executive officers, including a description of their direct interests, by security holdings or otherwise,
is contained in NorthStar Real Estate Income Trust, Inc.’s Annual Report on Form 10-K for the year ended December 31, 2016 and its annual proxy statement filed with the SEC on April 28, 2017. Information regarding NorthStar Real
Estate Income II, Inc.’s directors and executive officers, including a description of their direct interests, by security holdings or otherwise, is contained in NorthStar Real Estate Income II, Inc.’s Annual Report on Form 10-K for the year
ended December 31, 2016 and its annual proxy statement filed with the SEC on April 28, 2017. You may obtain free copies of these documents as described in the preceding paragraph.
No Offer or SolicitationThis communication is not intended to and shall not constitute an offer to sell or the solicitation of an offer to sell or the solicitation of an offer to buy any securities or a solicitation of any vote of approval, nor shall there be any sale of
securities in any jurisdiction in which such offer, solicitation or sale would be unlawful prior to registration or qualification under the securities laws of any such jurisdiction. No offer of securities shall be made except by means of a
prospectus meeting the requirements of Section 10 of the Securities Act of 1933, as amended.
Rounded figures may not foot.
Colony NorthStar Credit Real Estate, Inc. 2
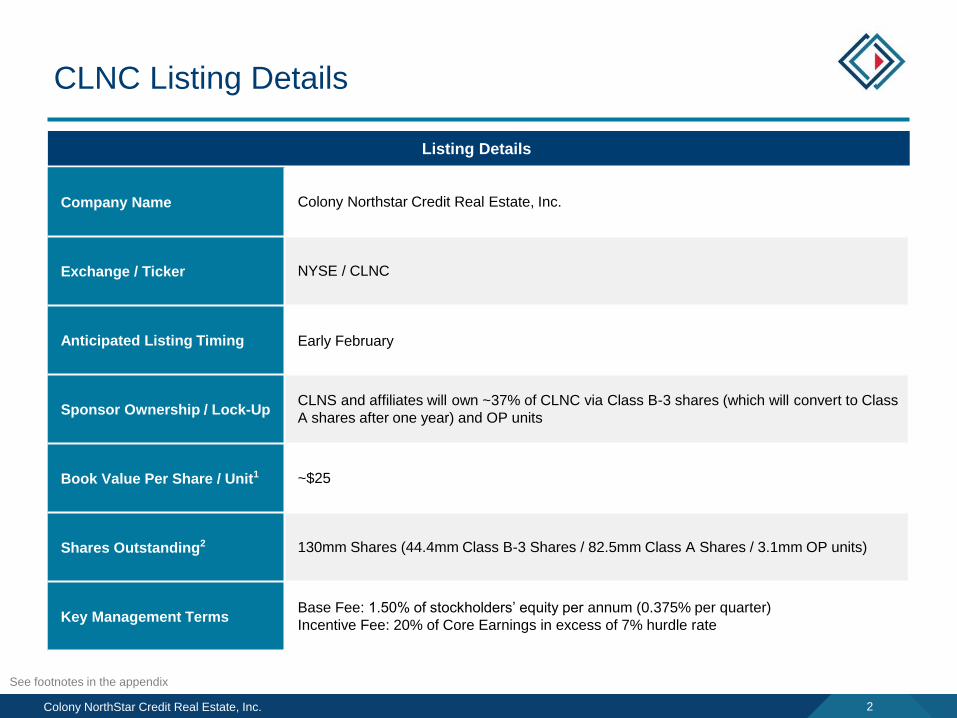
CLNC Listing Details
Listing Details
Company Name Colony Northstar Credit Real Estate, Inc.
Exchange / Ticker NYSE / CLNC
Anticipated Listing Timing Early February
Sponsor Ownership / Lock-UpCLNS and affiliates will own ~37% of CLNC via Class B-3 shares (which will convert to Class
A shares after one year) and OP units
Book Value Per Share / Unit1 ~$25
Shares Outstanding2 130mm Shares (44.4mm Class B-3 Shares / 82.5mm Class A Shares / 3.1mm OP units)
Key Management TermsBase Fee: 1.50% of stockholders’ equity per annum (0.375% per quarter)
Incentive Fee: 20% of Core Earnings in excess of 7% hurdle rate
See footnotes in the appendix
Colony NorthStar Credit Real Estate, Inc. 3
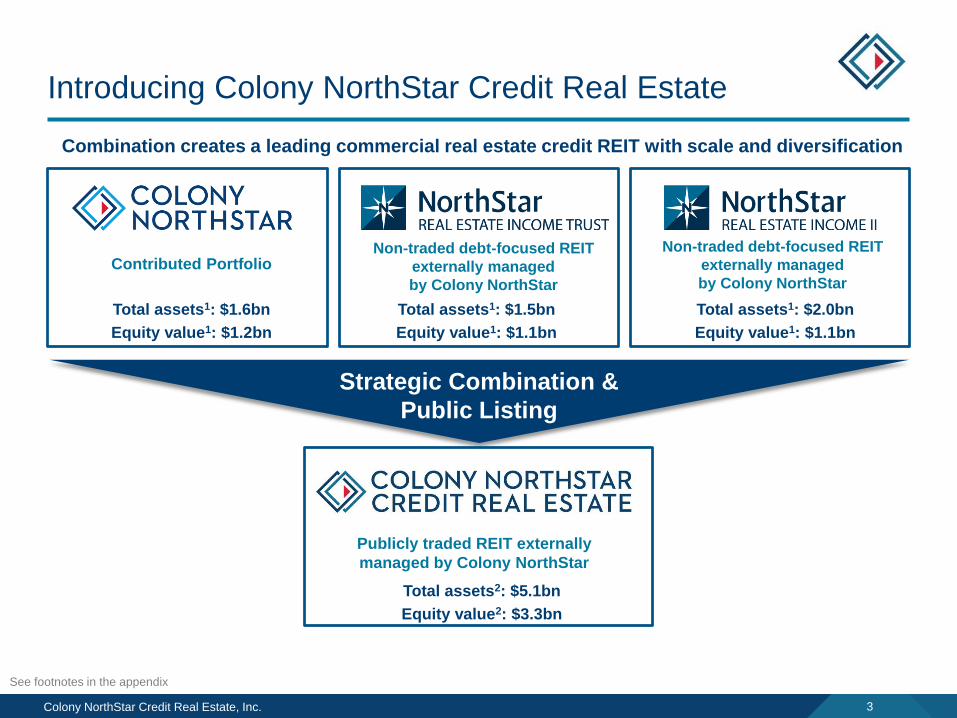
Introducing Colony NorthStar Credit Real Estate
Strategic Combination &
Public Listing
Contributed Portfolio
Total assets1: $1.6bn
Equity value1: $1.2bn
Total assets1: $2.0bn
Equity value1: $1.1bn
See footnotes in the appendix
Total assets1: $1.5bn
Equity value1: $1.1bn
Combination creates a leading commercial real estate credit REIT with scale and diversification
Non-traded debt-focused REIT
externally managed
by Colony NorthStar
Non-traded debt-focused REIT
externally managed
by Colony NorthStar
Total assets2: $5.1bn
Equity value2: $3.3bn
Publicly traded REIT externally
managed by Colony NorthStar

Colony NorthStar Credit Real Estate, Inc. 4
Investment Highlights
Compelling market opportunity across targeted investment classes
Colony NorthStar sponsorship – world class expertise and ~37% ownership
Flexible and differentiated investment strategy
Conservative balance sheet with embedded new investment capacity
Veteran management team with significant lending experience
Well-diversified $5.1bn initial portfolio (total assets)
Yield with upside potential – initial target of ~7.0%1
1. Annual dividend (paid quarterly), based on 9/30/17 book value per common share; subject to board approval
Colony NorthStar Credit Real Estate, Inc. 5
Capital
Markets
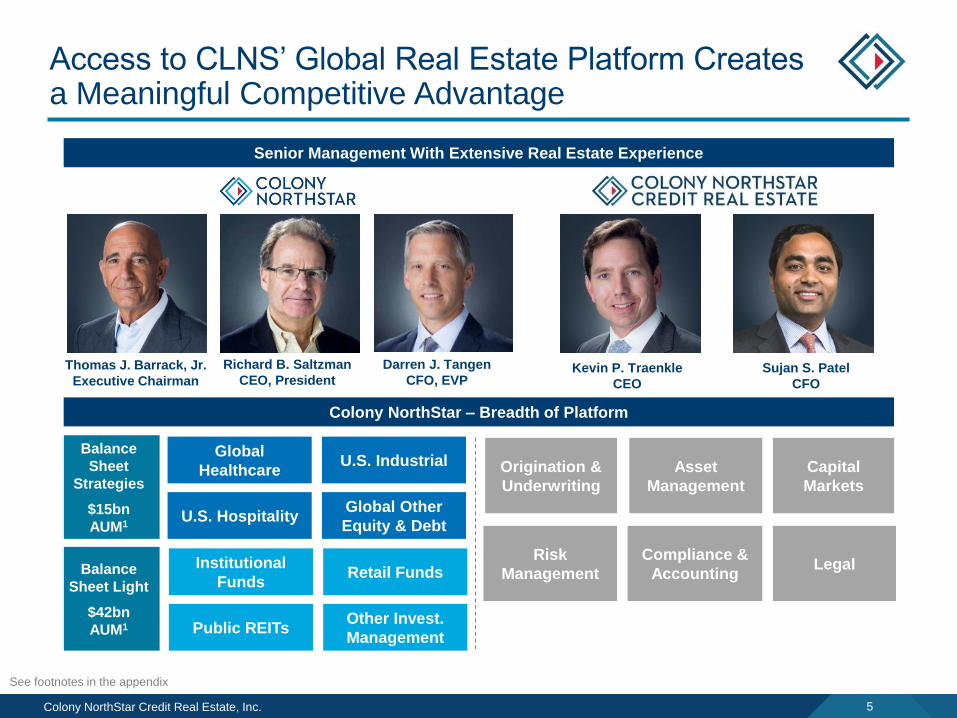
Access to CLNS’ Global Real Estate Platform Creates a Meaningful Competitive Advantage
Thomas J. Barrack, Jr.
Executive Chairman
Richard B. Saltzman
CEO, President
Senior Management With Extensive Real Estate Experience
Colony NorthStar – Breadth of Platform
Balance
Sheet
Strategies
$15bn
AUM1
Balance
Sheet Light
$42bn
AUM1
U.S. Industrial
U.S. HospitalityGlobal Other
Equity & Debt
Global
Healthcare
Retail Funds
Public REITsOther Invest.
Management
Institutional
Funds
Origination &
Underwriting
Asset
Management
LegalRisk
Management
Compliance &
Accounting
Kevin P. Traenkle
CEO
Sujan S. Patel
CFO
See footnotes in the appendix
Darren J. Tangen
CFO, EVP
Colony NorthStar Credit Real Estate, Inc. 6
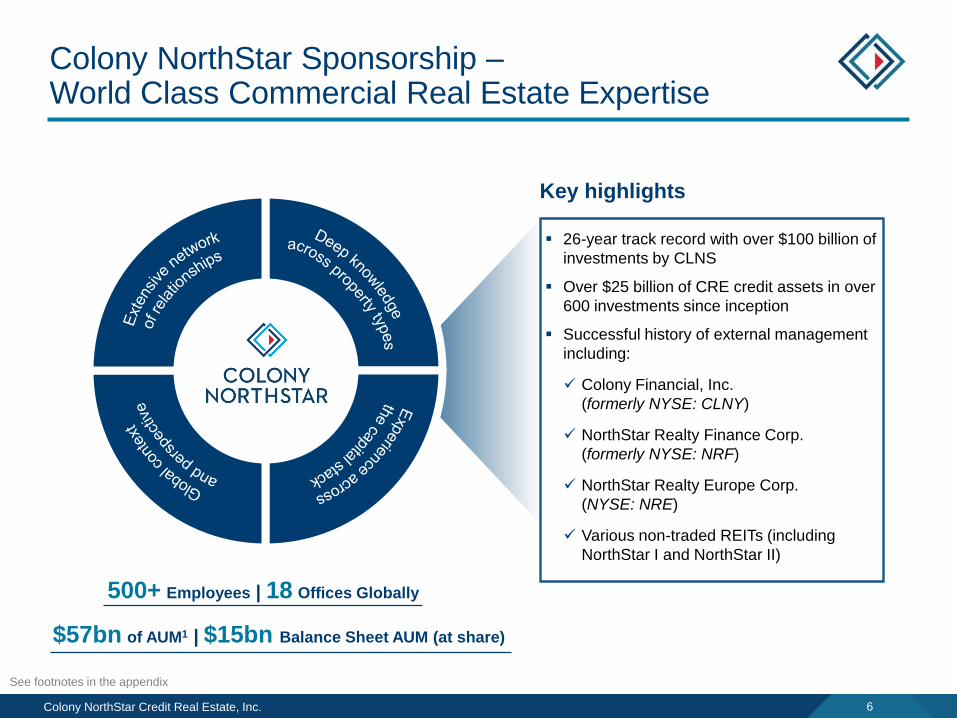
Colony NorthStar Sponsorship –World Class Commercial Real Estate Expertise
Key highlights
26-year track record with over $100 billion of
investments by CLNS
Over $25 billion of CRE credit assets in over
600 investments since inception
Successful history of external management
including:
Colony Financial, Inc.
(formerly NYSE: CLNY)
NorthStar Realty Finance Corp.
(formerly NYSE: NRF)
NorthStar Realty Europe Corp.
(NYSE: NRE)
Various non-traded REITs (including
NorthStar I and NorthStar II)
$57bn of AUM1 | $15bn Balance Sheet AUM (at share)
500+ Employees | 18 Offices Globally
See footnotes in the appendix
Colony NorthStar Credit Real Estate, Inc. 7
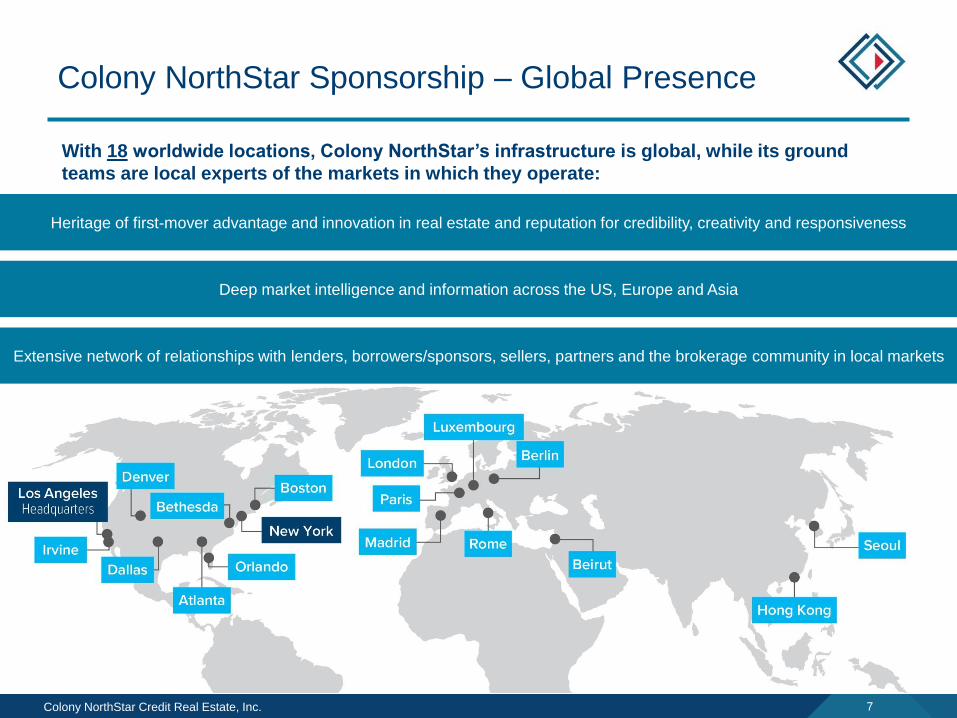
Colony NorthStar Sponsorship – Global Presence
With 18 worldwide locations, Colony NorthStar’s infrastructure is global, while its ground
teams are local experts of the markets in which they operate:
Heritage of first-mover advantage and innovation in real estate and reputation for credibility, creativity and responsiveness
Deep market intelligence and information across the US, Europe and Asia
Extensive network of relationships with lenders, borrowers/sponsors, sellers, partners and the brokerage community in local markets
Colony NorthStar Credit Real Estate, Inc. 8
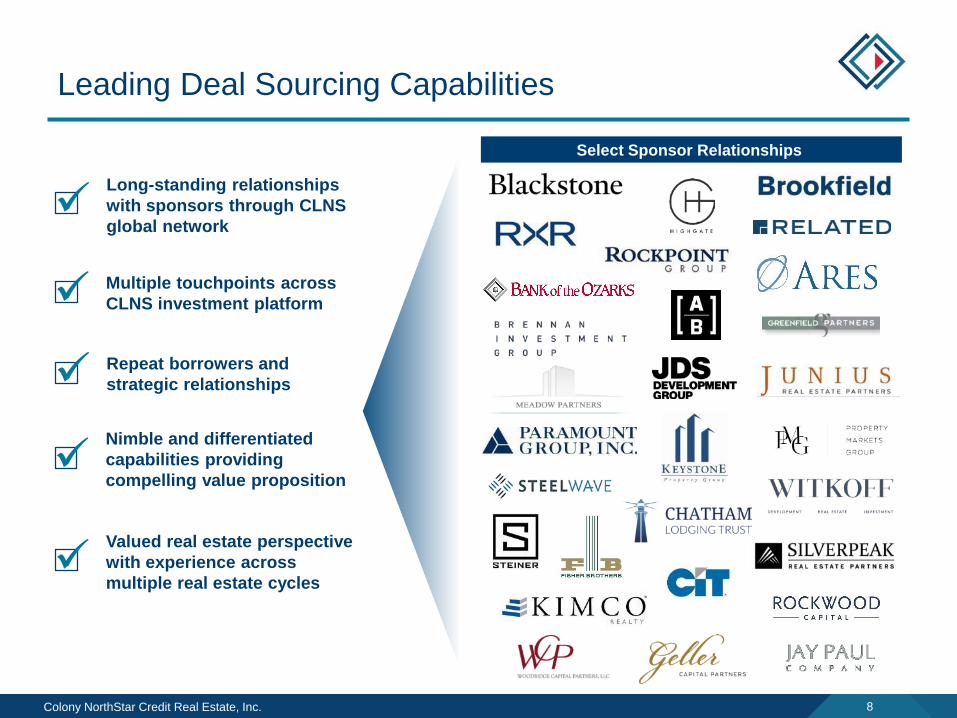
Leading Deal Sourcing Capabilities
Long-standing relationships
with sponsors through CLNS
global network
Repeat borrowers and
strategic relationships
Nimble and differentiated
capabilities providing
compelling value proposition
Multiple touchpoints across
CLNS investment platform
Select Sponsor Relationships
Valued real estate perspective
with experience across
multiple real estate cycles
Colony NorthStar Credit Real Estate, Inc. 9
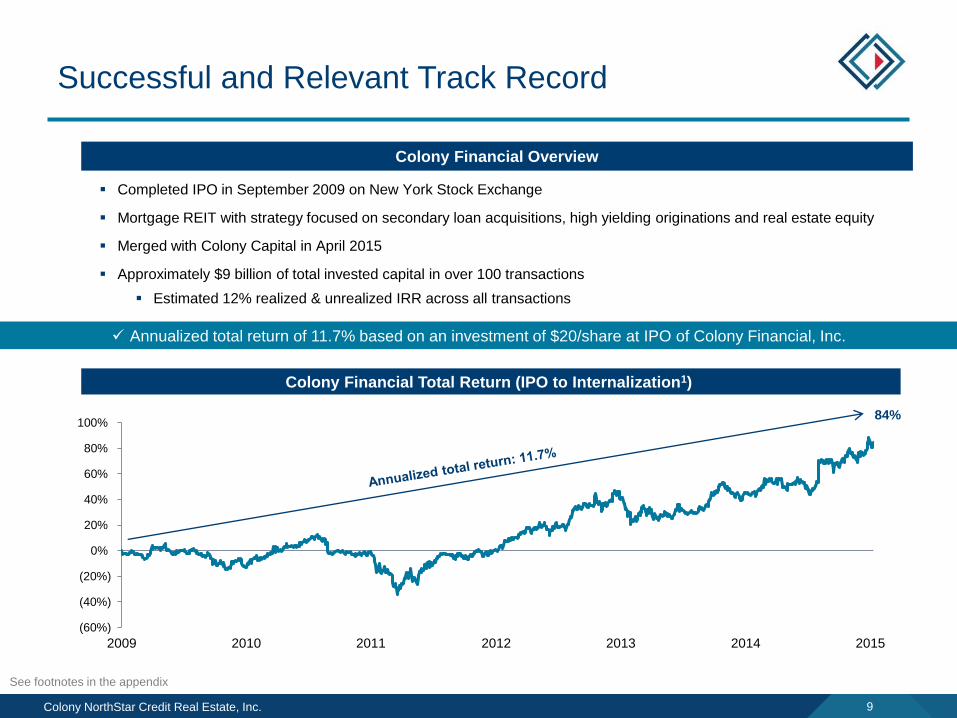
Annualized total return of 11.7% based on an investment of $20/share at IPO of Colony Financial, Inc.
Successful and Relevant Track Record
Completed IPO in September 2009 on New York Stock Exchange
Mortgage REIT with strategy focused on secondary loan acquisitions, high yielding originations and real estate equity
Merged with Colony Capital in April 2015
Approximately $9 billion of total invested capital in over 100 transactions
Estimated 12% realized & unrealized IRR across all transactions
Colony Financial Overview
(60%)
(40%)
(20%)
0%
20%
40%
60%
80%
100%
2009 2010 2011 2012 2013 2014 2015
84%
Colony Financial Total Return (IPO to Internalization1)
See footnotes in the appendix
Colony NorthStar Credit Real Estate, Inc. 10
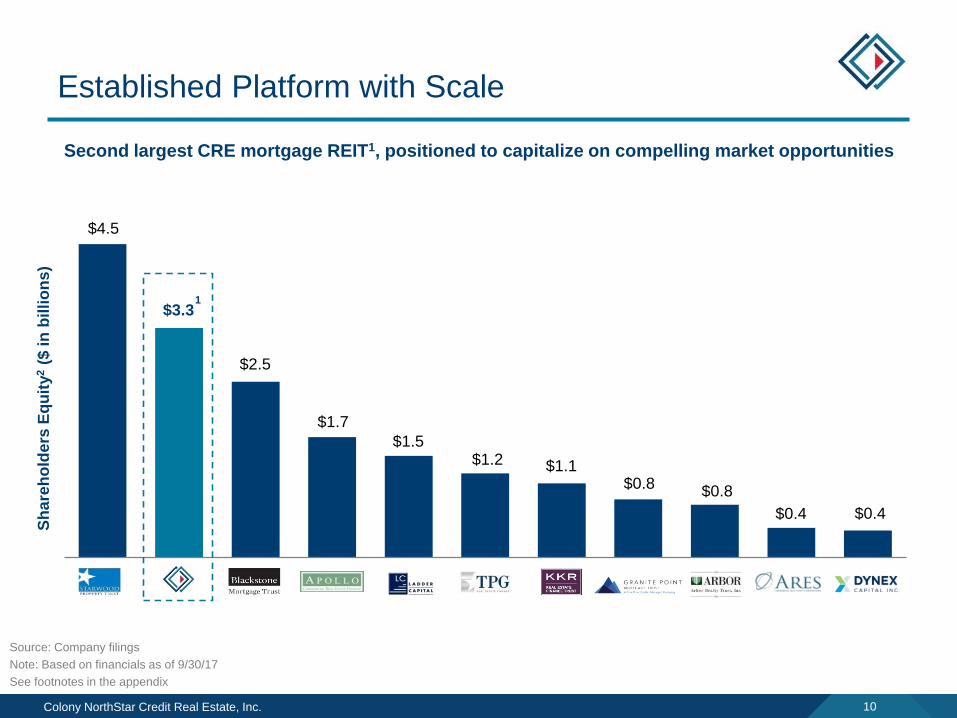
$4.5
$2.5
$1.7
$1.5 $1.2 $1.1
$0.8 $0.8
$0.4 $0.4
STWD NewCo BXMT ARI LADR TRTX KREF GPMT ABR ACRE DX
$3.3
Established Platform with Scale
Sh
are
ho
lde
rs E
qu
ity
2($
in
billi
on
s)
Source: Company filings
Note: Based on financials as of 9/30/17
See footnotes in the appendix
Second largest CRE mortgage REIT1, positioned to capitalize on compelling market opportunities
1
Colony NorthStar Credit Real Estate, Inc. 11
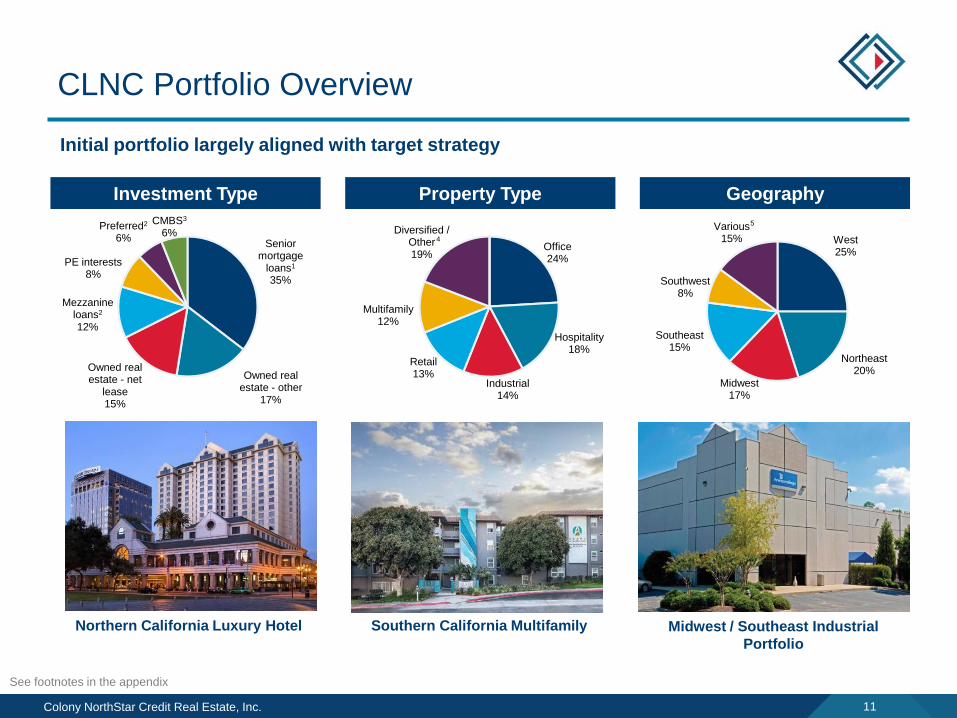
Office24%
Hospitality18%
Industrial14%
Retail13%
Multifamily12%
Diversified / Other19%
CLNC Portfolio Overview
Senior mortgage
loans1
35%
Owned real estate - other
17%
Owned real estate - net
lease15%
Mezzanine loans2
12%
PE interests8%
Preferred2
6%
CMBS3
6%
Investment Type Property Type Geography
West25%
Northeast20%
Midwest17%
Southeast15%
Southwest8%
Various15%
5
4
Initial portfolio largely aligned with target strategy
Southern California Multifamily Midwest / Southeast Industrial
Portfolio
Northern California Luxury Hotel
See footnotes in the appendix
Colony NorthStar Credit Real Estate, Inc. 12
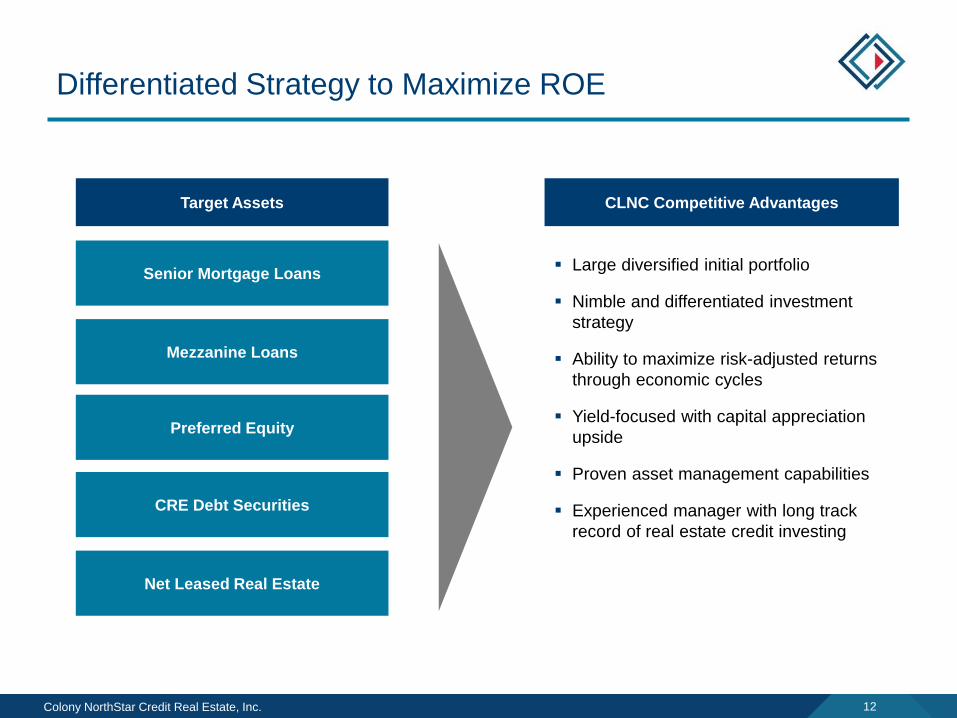
Differentiated Strategy to Maximize ROE
Senior Mortgage Loans
Mezzanine Loans
Net Leased Real Estate
Target Assets
CRE Debt Securities
Large diversified initial portfolio
Nimble and differentiated investment
strategy
Ability to maximize risk-adjusted returns
through economic cycles
Yield-focused with capital appreciation
upside
Proven asset management capabilities
Experienced manager with long track
record of real estate credit investing
Preferred Equity
CLNC Competitive Advantages
Colony NorthStar Credit Real Estate, Inc. 13
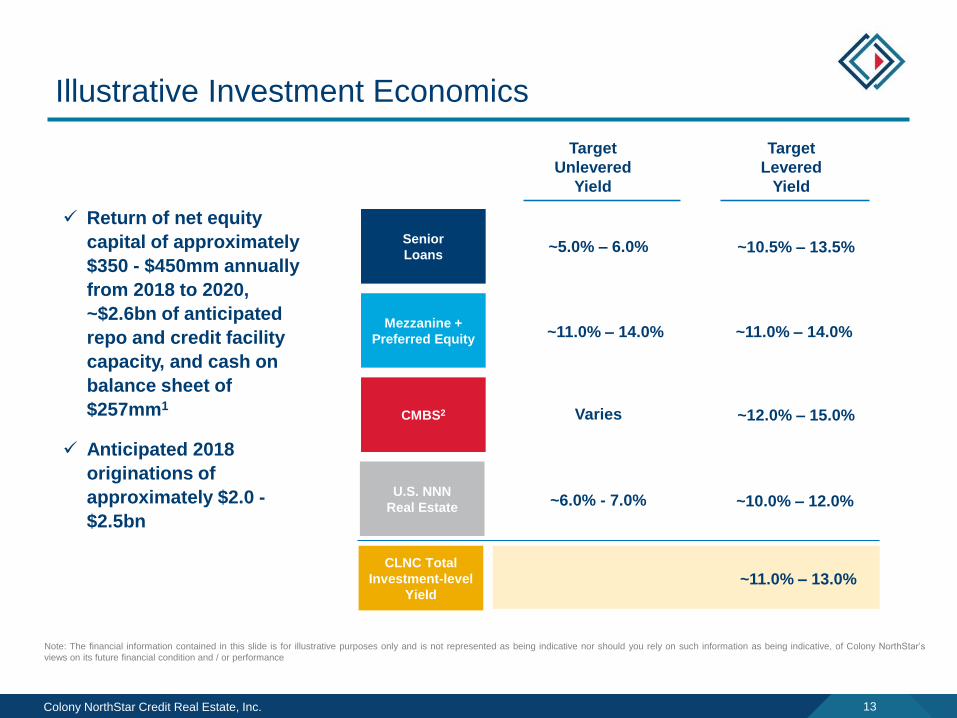
Illustrative Investment Economics
Note: The financial information contained in this slide is for illustrative purposes only and is not represented as being indicative nor should you rely on such information as being indicative, of Colony NorthStar’s
views on its future financial condition and / or performance
Senior
Loans
Mezzanine +
Preferred Equity
CMBS2
U.S. NNN
Real Estate
Target
Levered
Yield
~10.5% – 13.5%
~11.0% – 14.0%
~12.0% – 15.0%
~10.0% – 12.0%
Target
Unlevered
Yield
~5.0% – 6.0%
~11.0% – 14.0%
CLNC Total
Investment-level
Yield~11.0% – 13.0%
~6.0% - 7.0%
Varies
Return of net equity
capital of approximately
$350 - $450mm annually
from 2018 to 2020,
~$2.6bn of anticipated
repo and credit facility
capacity, and cash on
balance sheet of
$257mm1
Anticipated 2018
originations of
approximately $2.0 -
$2.5bn
Colony NorthStar Credit Real Estate, Inc. 14
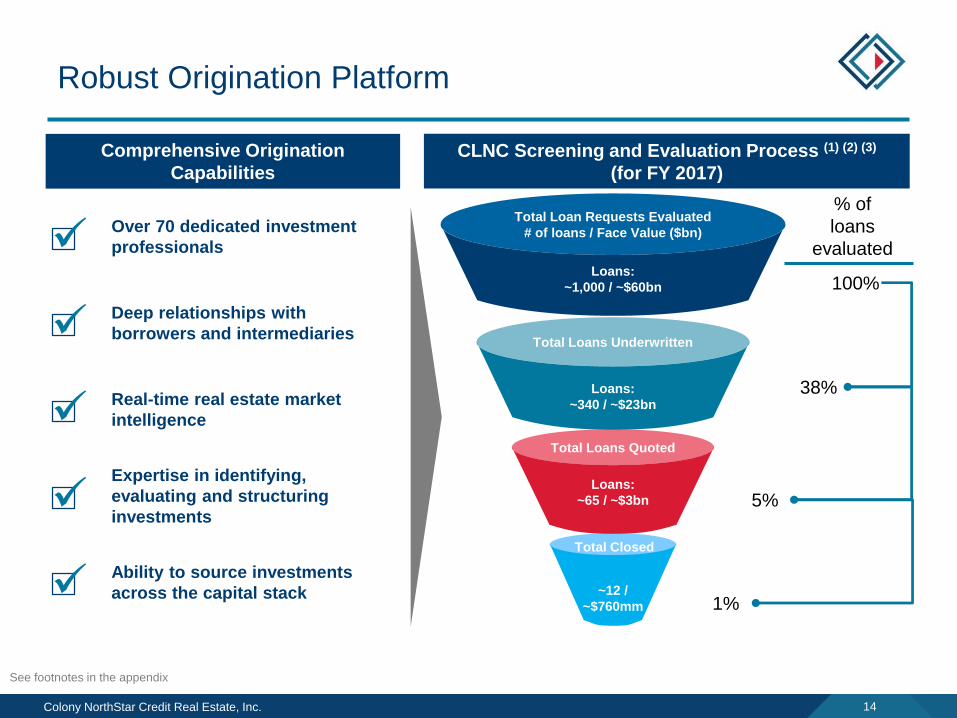
Robust Origination Platform
Comprehensive Origination
Capabilities
Total loan requests reviewed:
$[X]bn2
Over 70 dedicated investment
professionals
CLNC Screening and Evaluation Process (1) (2) (3)
(for FY 2017)
Deep relationships with
borrowers and intermediaries
Expertise in identifying,
evaluating and structuring
investments
Real-time real estate market
intelligence
Ability to source investments
across the capital stack ~12 /
~$760mm
Total Loans Quoted
Loans:
~65 / ~$3bn
Total Loans Underwritten
Loans:
~340 / ~$23bn
100%
Total Loan Requests Evaluated
# of loans / Face Value ($bn)
Loans:
~1,000 / ~$60bn
Total Closed
See footnotes in the appendix
% of
loans
evaluated
38%
5%
1%
Colony NorthStar Credit Real Estate, Inc. 15
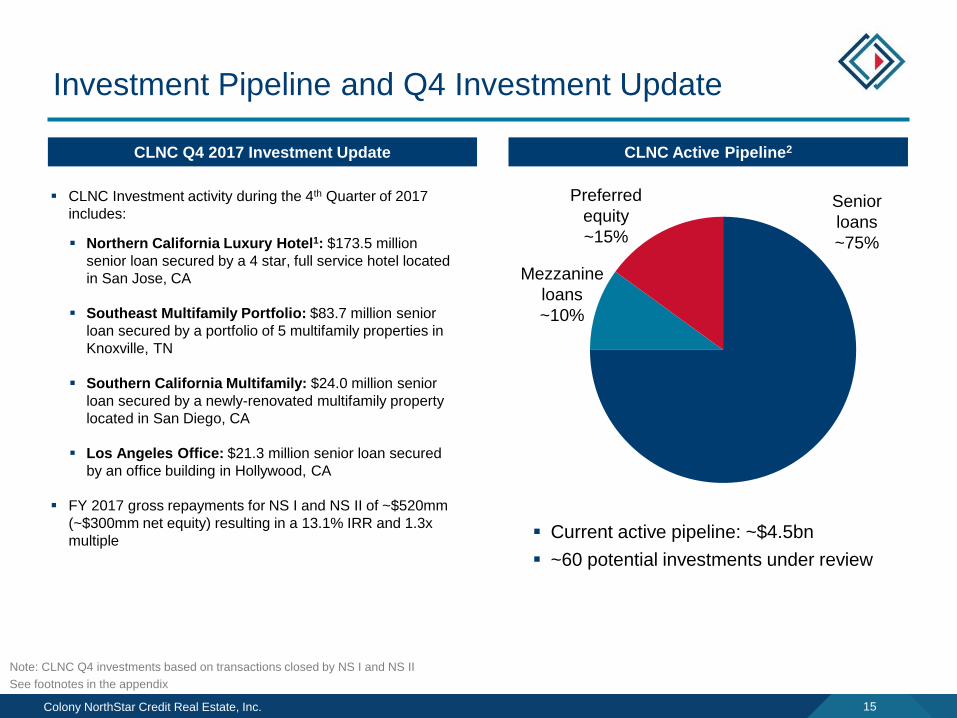
Investment Pipeline and Q4 Investment Update
CLNC Q4 2017 Investment Update
CLNC Investment activity during the 4th Quarter of 2017
includes:
Northern California Luxury Hotel1: $173.5 million
senior loan secured by a 4 star, full service hotel located
in San Jose, CA
Southeast Multifamily Portfolio: $83.7 million senior
loan secured by a portfolio of 5 multifamily properties in
Knoxville, TN
Southern California Multifamily: $24.0 million senior
loan secured by a newly-renovated multifamily property
located in San Diego, CA
Los Angeles Office: $21.3 million senior loan secured
by an office building in Hollywood, CA
FY 2017 gross repayments for NS I and NS II of ~$520mm
(~$300mm net equity) resulting in a 13.1% IRR and 1.3x
multiple
CLNC Active Pipeline2
Note: CLNC Q4 investments based on transactions closed by NS I and NS II
See footnotes in the appendix
Senior
loans
~75%
Mezzanine
loans
~10%
Preferred
equity
~15%
Current active pipeline: ~$4.5bn
~60 potential investments under review
Colony NorthStar Credit Real Estate, Inc. 16
$0
$90
$180
$270
$360
$450
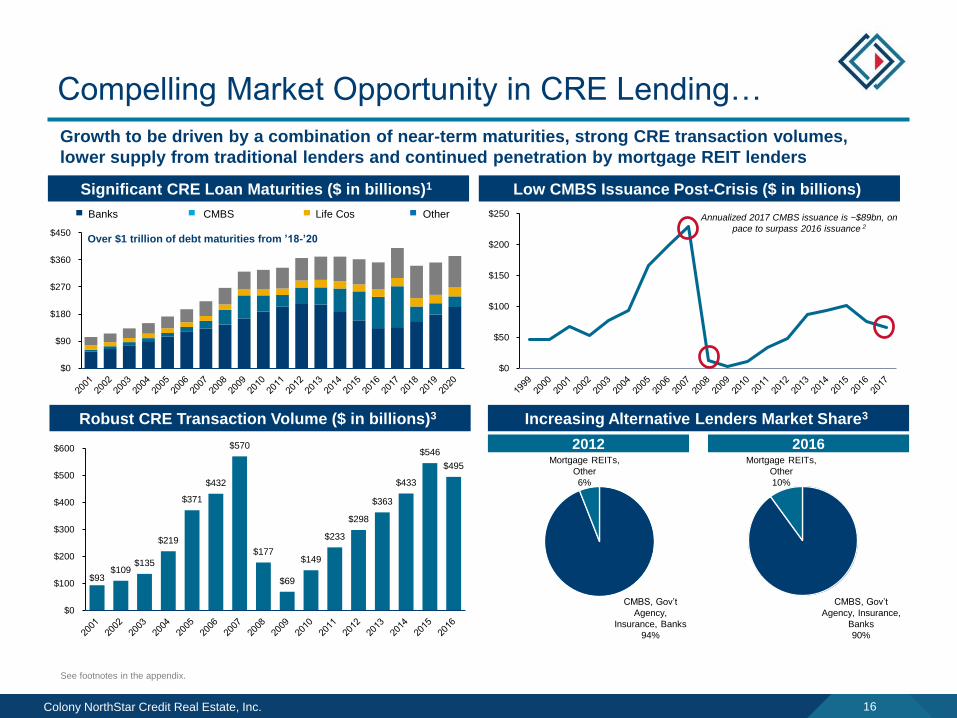
$93 $109
$135
$219
$371
$432
$570
$177
$69
$149
$233
$298
$363
$433
$546
$495
$0
$100
$200
$300
$400
$500
$600
Compelling Market Opportunity in CRE Lending…
Over $1 trillion of debt maturities from ’18-’20
Significant CRE Loan Maturities ($ in billions)1
Robust CRE Transaction Volume ($ in billions)3 Increasing Alternative Lenders Market Share3
CMBS Life Cos OtherBanks
CMBS, Gov’t
Agency,
Insurance, Banks
94%
Mortgage REITs,
Other
6%
CMBS, Gov’t
Agency, Insurance,
Banks
90%
Mortgage REITs,
Other
10%
2012
See footnotes in the appendix.
Growth to be driven by a combination of near-term maturities, strong CRE transaction volumes,
lower supply from traditional lenders and continued penetration by mortgage REIT lenders
2016
Low CMBS Issuance Post-Crisis ($ in billions)
$0
$50
$100
$150
$200
$250 Annualized 2017 CMBS issuance is ~$89bn, on
pace to surpass 2016 issuance 2
Colony NorthStar Credit Real Estate, Inc. 17
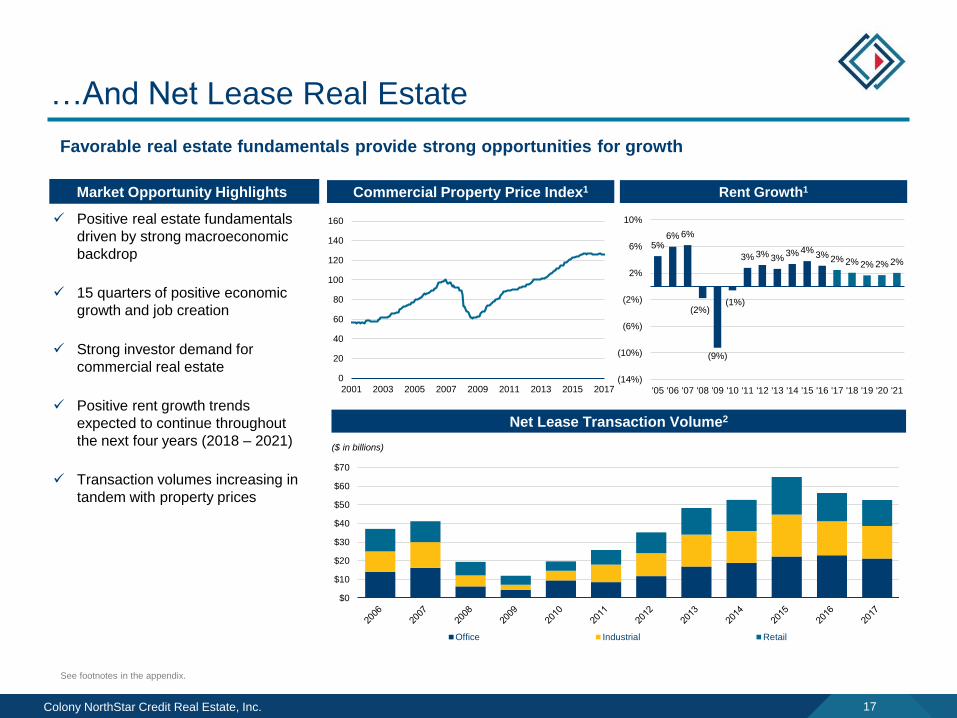
…And Net Lease Real Estate
Favorable real estate fundamentals provide strong opportunities for growth
Market Opportunity Highlights
Positive real estate fundamentals
driven by strong macroeconomic
backdrop
15 quarters of positive economic
growth and job creation
Strong investor demand for
commercial real estate
Positive rent growth trends
expected to continue throughout
the next four years (2018 – 2021)
Transaction volumes increasing in
tandem with property prices
Commercial Property Price Index1 Rent Growth1
Net Lease Transaction Volume2
($ in billions)
0
20
40
60
80
100
120
140
160
2001 2003 2005 2007 2009 2011 2013 2015 2017
$0
$10
$20
$30
$40
$50
$60
$70
Office Industrial Retail
5%6% 6%
(2%)
(9%)
(1%)
3% 3% 3%3% 4%
3% 2% 2% 2% 2% 2%
(14%)
(10%)
(6%)
(2%)
2%
6%
10%
'05 '06 '07 '08 '09 '10 '11 '12 '13 '14 '15 '16 '17 '18 '19 '20 '21
See footnotes in the appendix.
Colony NorthStar Credit Real Estate, Inc. 18
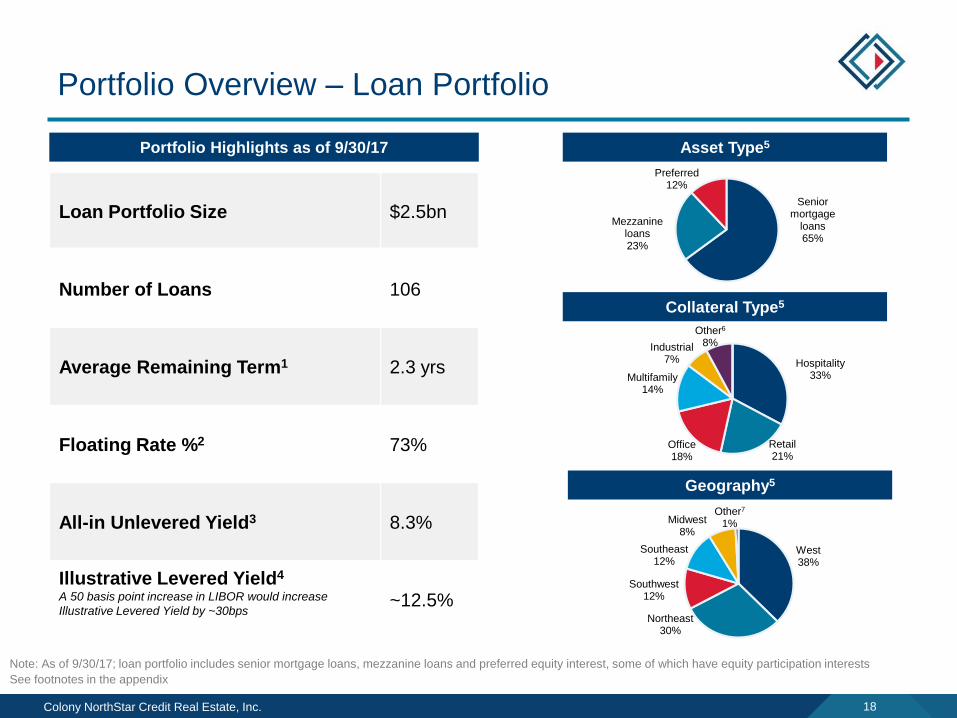
Portfolio Overview – Loan Portfolio
Asset Type5
Geography5
Collateral Type5
Portfolio Highlights as of 9/30/17
Loan Portfolio Size $2.5bn
Number of Loans 106
Average Remaining Term1 2.3 yrs
Floating Rate %2 73%
All-in Unlevered Yield3 8.3%
Illustrative Levered Yield4
A 50 basis point increase in LIBOR would increase
Illustrative Levered Yield by ~30bps~12.5%
Senior mortgage
loans65%
Mezzanine loans23%
Preferred12%
Hospitality33%
Retail21%
Office18%
Multifamily14%
Industrial7%
Other6
8%
West38%
Northeast30%
Southwest12%
Southeast12%
Midwest8%
Other7
1%
Note: As of 9/30/17; loan portfolio includes senior mortgage loans, mezzanine loans and preferred equity interest, some of which have equity participation interests
See footnotes in the appendix
Colony NorthStar Credit Real Estate, Inc. 19
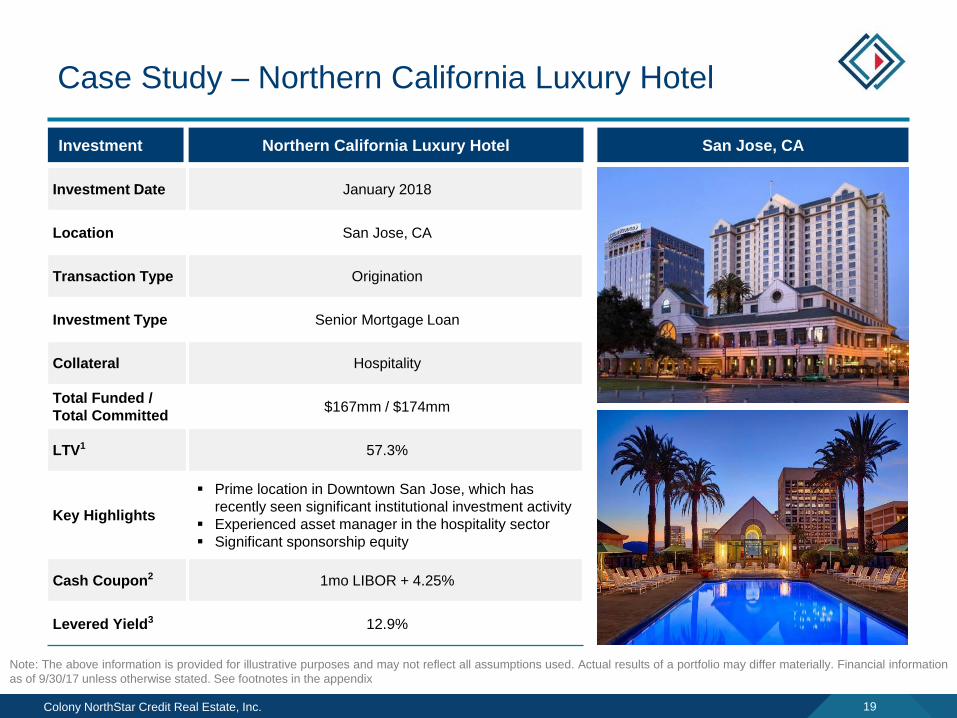
San Jose, CA
Case Study – Northern California Luxury Hotel
Investment Date January 2018
Location San Jose, CA
Transaction Type Origination
Investment Type Senior Mortgage Loan
Collateral Hospitality
Total Funded /
Total Committed$167mm / $174mm
LTV1 57.3%
Key Highlights
Prime location in Downtown San Jose, which has
recently seen significant institutional investment activity
Experienced asset manager in the hospitality sector
Significant sponsorship equity
Cash Coupon2 1mo LIBOR + 4.25%
Levered Yield3 12.9%
Investment Northern California Luxury Hotel
Note: The above information is provided for illustrative purposes and may not reflect all assumptions used. Actual results of a portfolio may differ materially. Financial information
as of 9/30/17 unless otherwise stated. See footnotes in the appendix
Colony NorthStar Credit Real Estate, Inc. 20
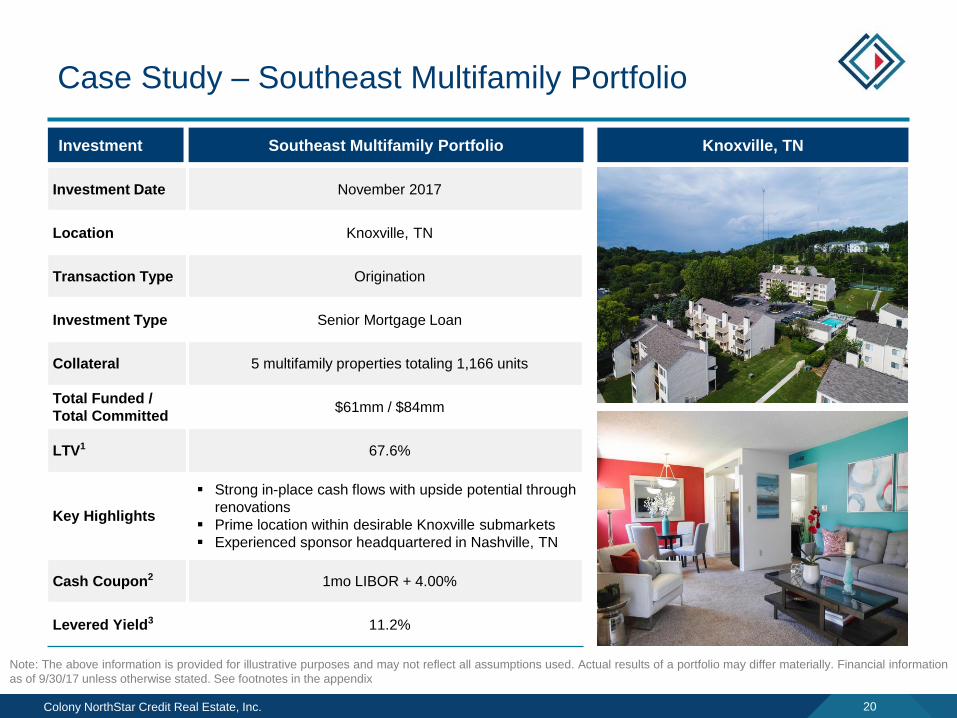
Case Study – Southeast Multifamily Portfolio
Investment Date November 2017
Location Knoxville, TN
Transaction Type Origination
Investment Type Senior Mortgage Loan
Collateral 5 multifamily properties totaling 1,166 units
Total Funded /
Total Committed$61mm / $84mm
LTV1 67.6%
Key Highlights
Strong in-place cash flows with upside potential through
renovations
Prime location within desirable Knoxville submarkets
Experienced sponsor headquartered in Nashville, TN
Cash Coupon2 1mo LIBOR + 4.00%
Levered Yield3 11.2%
Investment Southeast Multifamily Portfolio
Note: The above information is provided for illustrative purposes and may not reflect all assumptions used. Actual results of a portfolio may differ materially. Financial information
as of 9/30/17 unless otherwise stated. See footnotes in the appendix
Knoxville, TN
Colony NorthStar Credit Real Estate, Inc. 21
Midtown – New York, NY
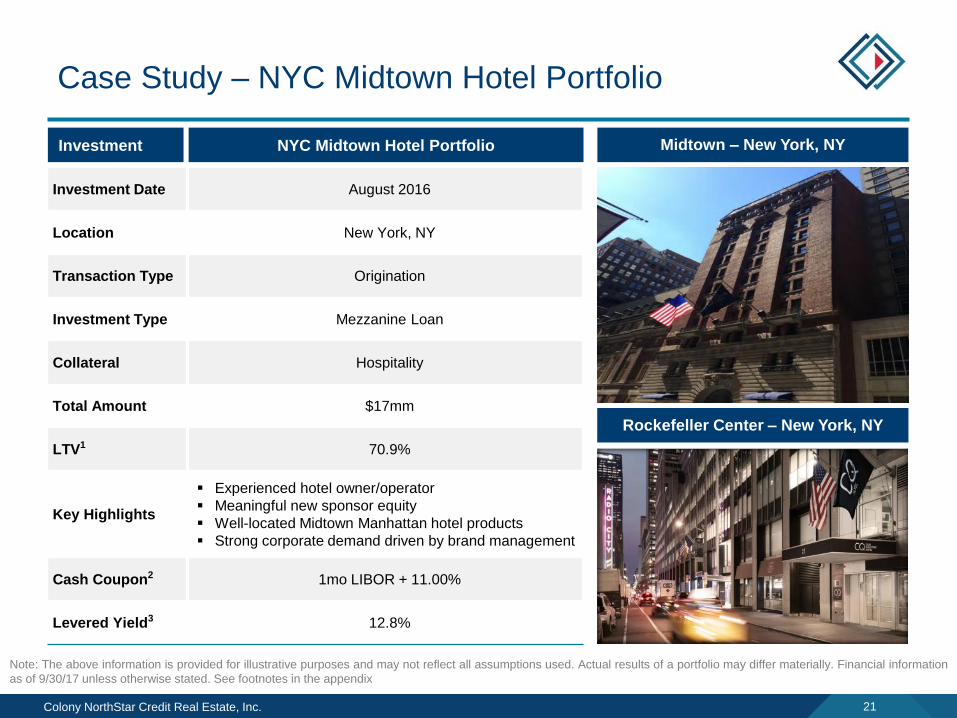
Case Study – NYC Midtown Hotel Portfolio
Rockefeller Center – New York, NY
Investment Date August 2016
Location New York, NY
Transaction Type Origination
Investment Type Mezzanine Loan
Collateral Hospitality
Total Amount $17mm
LTV1 70.9%
Key Highlights
Experienced hotel owner/operator
Meaningful new sponsor equity
Well-located Midtown Manhattan hotel products
Strong corporate demand driven by brand management
Cash Coupon2 1mo LIBOR + 11.00%
Levered Yield3 12.8%
Investment NYC Midtown Hotel Portfolio
Note: The above information is provided for illustrative purposes and may not reflect all assumptions used. Actual results of a portfolio may differ materially. Financial information
as of 9/30/17 unless otherwise stated. See footnotes in the appendix
Colony NorthStar Credit Real Estate, Inc. 22
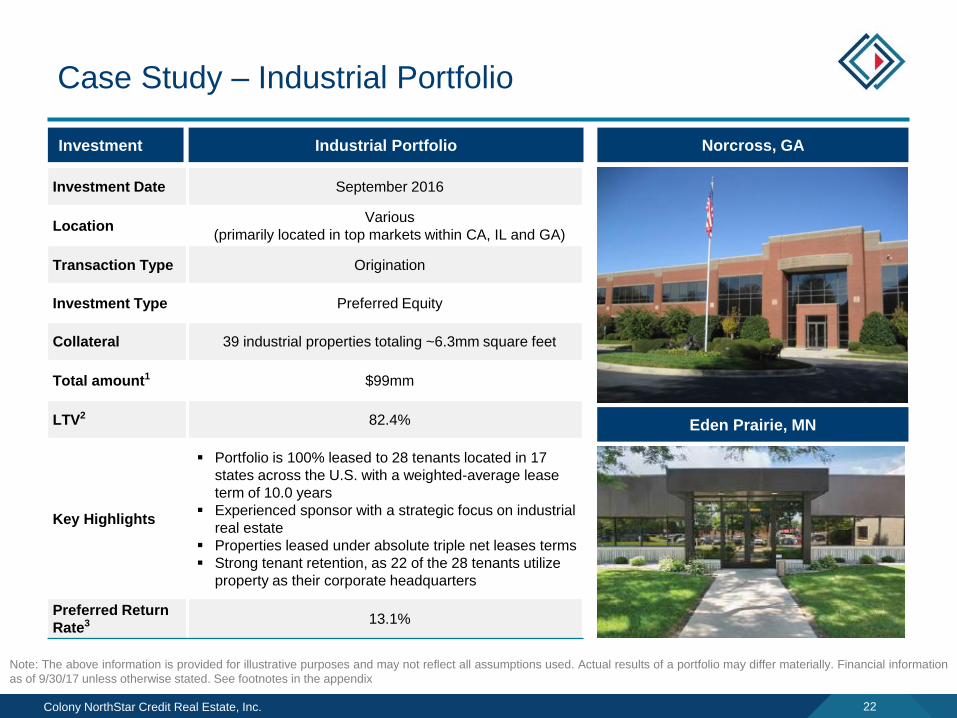
Case Study – Industrial Portfolio
Norcross, GA
Eden Prairie, MN
Investment Date September 2016
LocationVarious
(primarily located in top markets within CA, IL and GA)
Transaction Type Origination
Investment Type Preferred Equity
Collateral 39 industrial properties totaling ~6.3mm square feet
Total amount1 $99mm
LTV2 82.4%
Key Highlights
Portfolio is 100% leased to 28 tenants located in 17
states across the U.S. with a weighted-average lease
term of 10.0 years
Experienced sponsor with a strategic focus on industrial
real estate
Properties leased under absolute triple net leases terms
Strong tenant retention, as 22 of the 28 tenants utilize
property as their corporate headquarters
Preferred Return
Rate3 13.1%
Investment Industrial Portfolio
Note: The above information is provided for illustrative purposes and may not reflect all assumptions used. Actual results of a portfolio may differ materially. Financial information
as of 9/30/17 unless otherwise stated. See footnotes in the appendix
Colony NorthStar Credit Real Estate, Inc. 23
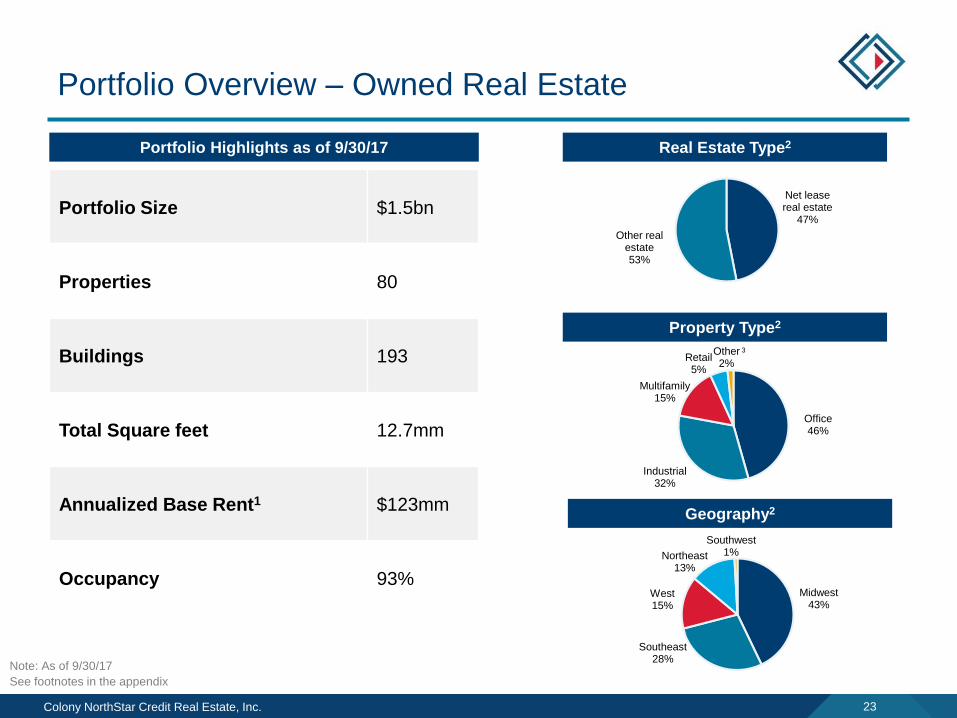
Portfolio Overview – Owned Real Estate
Portfolio Highlights as of 9/30/17
Portfolio Size $1.5bn
Properties 80
Buildings 193
Total Square feet 12.7mm
Annualized Base Rent1 $123mm
Occupancy 93%
Real Estate Type2
Geography2
Property Type2
Net lease real estate
47%
Other real estate53%
Office46%
Industrial32%
Multifamily15%
Retail5%
Other2%
Midwest43%
Southeast28%
West15%
Northeast13%
Southwest1%
Note: As of 9/30/17
See footnotes in the appendix
3
Colony NorthStar Credit Real Estate, Inc. 24
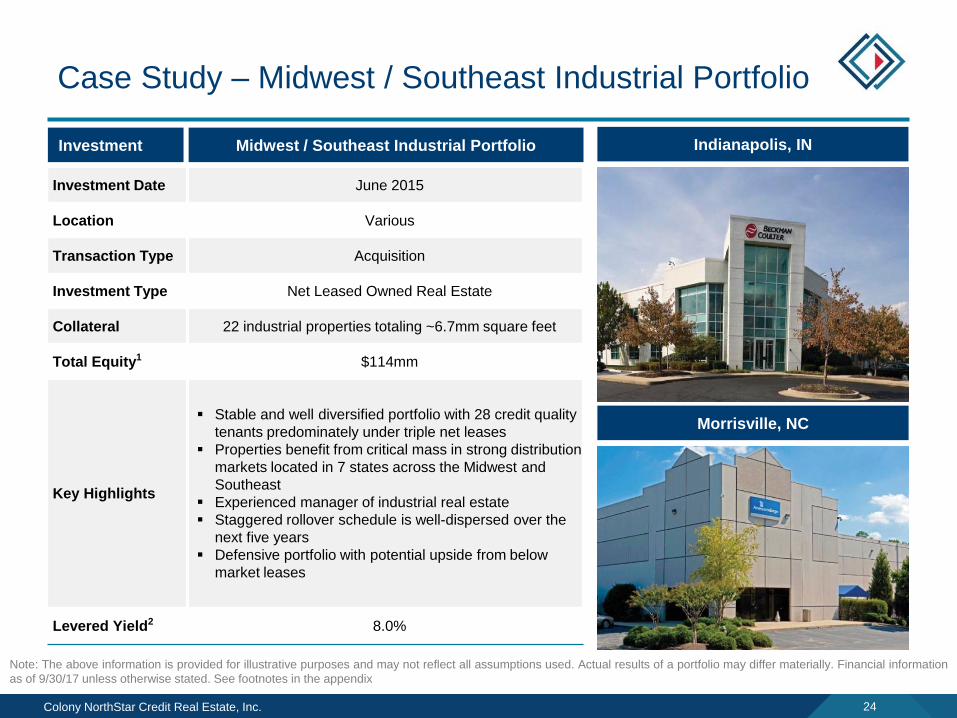
Case Study – Midwest / Southeast Industrial Portfolio
Indianapolis, IN
Morrisville, NC
Investment Date June 2015
Location Various
Transaction Type Acquisition
Investment Type Net Leased Owned Real Estate
Collateral 22 industrial properties totaling ~6.7mm square feet
Total Equity1 $114mm
Key Highlights
Stable and well diversified portfolio with 28 credit quality
tenants predominately under triple net leases
Properties benefit from critical mass in strong distribution
markets located in 7 states across the Midwest and
Southeast
Experienced manager of industrial real estate
Staggered rollover schedule is well-dispersed over the
next five years
Defensive portfolio with potential upside from below
market leases
Levered Yield2 8.0%
Investment Midwest / Southeast Industrial Portfolio
Note: The above information is provided for illustrative purposes and may not reflect all assumptions used. Actual results of a portfolio may differ materially. Financial information
as of 9/30/17 unless otherwise stated. See footnotes in the appendix
Colony NorthStar Credit Real Estate, Inc. 25
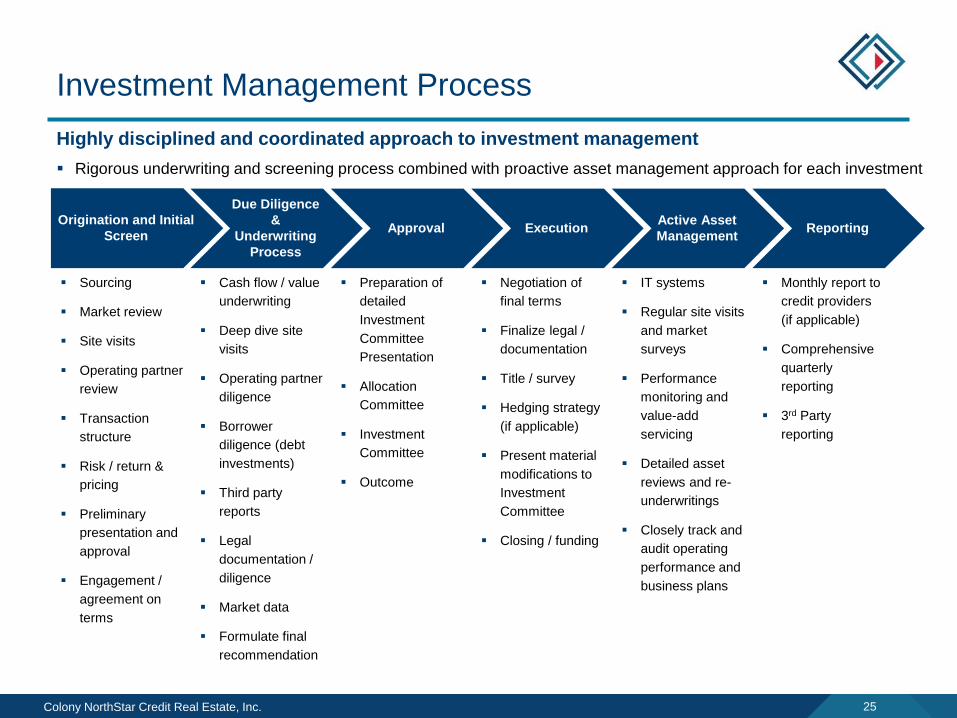
Investment Management Process
Origination and Initial
Screen
Due Diligence
&
Underwriting
Process
Approval ExecutionActive Asset
ManagementReporting
Negotiation of
final terms
Finalize legal /
documentation
Title / survey
Hedging strategy
(if applicable)
Present material
modifications to
Investment
Committee
Closing / funding
IT systems
Regular site visits
and market
surveys
Performance
monitoring and
value-add
servicing
Detailed asset
reviews and re-
underwritings
Closely track and
audit operating
performance and
business plans
Monthly report to
credit providers
(if applicable)
Comprehensive
quarterly
reporting
3rd Party
reporting
Sourcing
Market review
Site visits
Operating partner
review
Transaction
structure
Risk / return &
pricing
Preliminary
presentation and
approval
Engagement /
agreement on
terms
Cash flow / value
underwriting
Deep dive site
visits
Operating partner
diligence
Borrower
diligence (debt
investments)
Third party
reports
Legal
documentation /
diligence
Market data
Formulate final
recommendation
Preparation of
detailed
Investment
Committee
Presentation
Allocation
Committee
Investment
Committee
Outcome
Highly disciplined and coordinated approach to investment management
Rigorous underwriting and screening process combined with proactive asset management approach for each investment
Colony NorthStar Credit Real Estate, Inc. 26
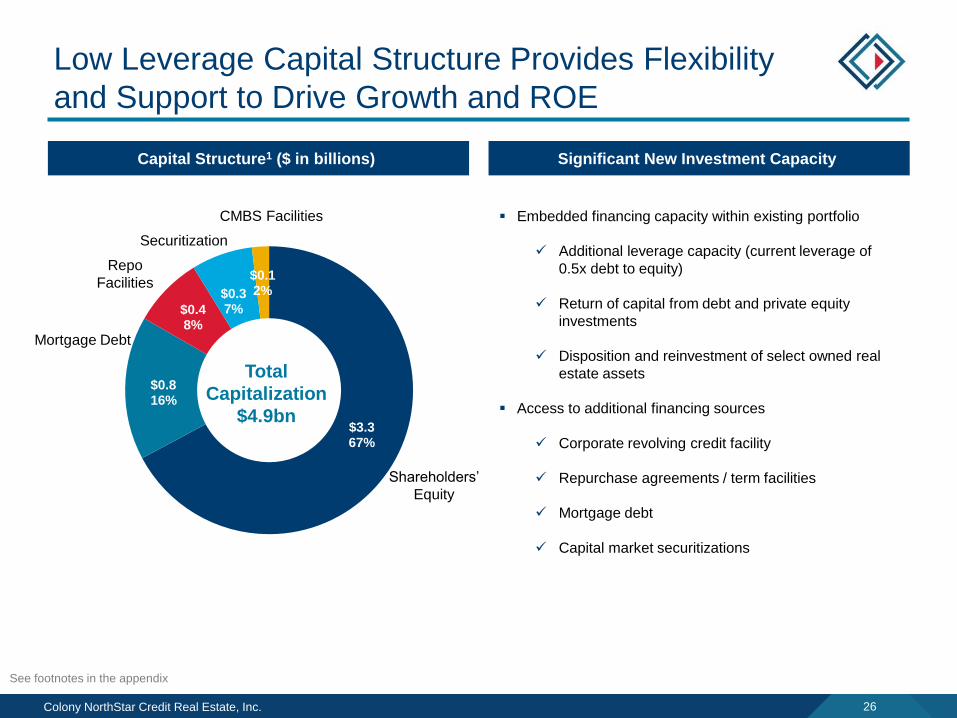
Low Leverage Capital Structure Provides Flexibility
and Support to Drive Growth and ROE
Capital Structure1 ($ in billions) Significant New Investment Capacity
Embedded financing capacity within existing portfolio
Additional leverage capacity (current leverage of
0.5x debt to equity)
Return of capital from debt and private equity
investments
Disposition and reinvestment of select owned real
estate assets
Access to additional financing sources
Corporate revolving credit facility
Repurchase agreements / term facilities
Mortgage debt
Capital market securitizations
$3.367%
$0.816%
$0.48%
$0.37%
$0.12%
Total
Capitalization
$4.9bn
Shareholders’
Equity
Repo
Facilities
Mortgage Debt
Securitization
CMBS Facilities
See footnotes in the appendix
Colony NorthStar Credit Real Estate, Inc. 27
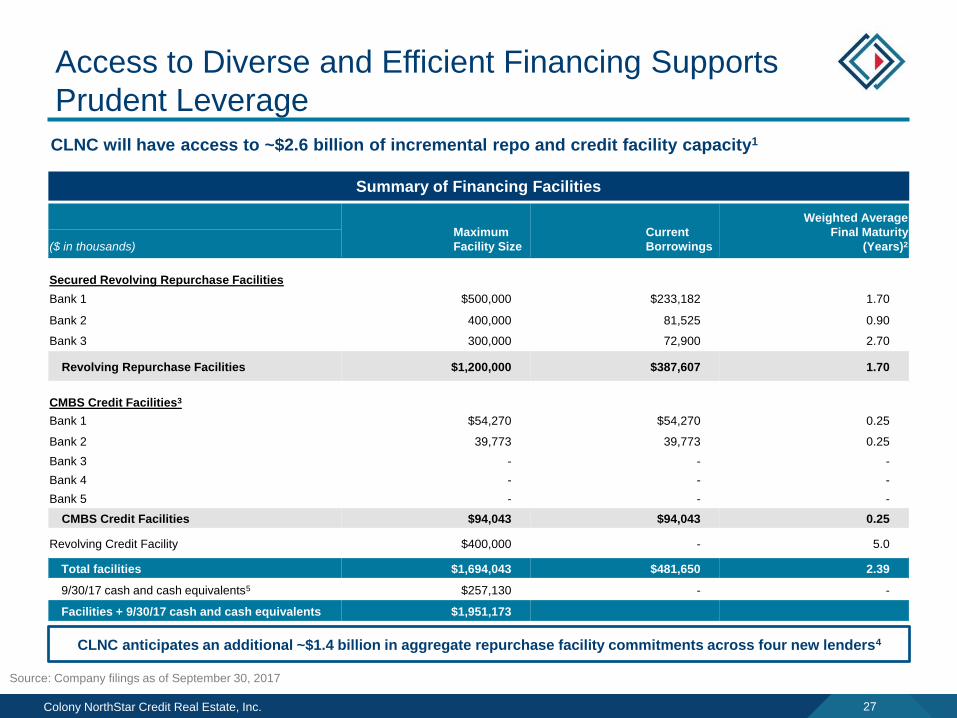
Access to Diverse and Efficient Financing Supports
Prudent Leverage
CLNC will have access to ~$2.6 billion of incremental repo and credit facility capacity1
Summary of Financing Facilities
Maximum
Facility Size
Current
Borrowings
Weighted Average
Final Maturity
(Years)2($ in thousands)
Secured Revolving Repurchase Facilities
Bank 1 $500,000 $233,182 1.70
Bank 2 400,000 81,525 0.90
Bank 3 300,000 72,900 2.70
Revolving Repurchase Facilities $1,200,000 $387,607 1.70
CMBS Credit Facilities3
Bank 1 $54,270 $54,270 0.25
Bank 2 39,773 39,773 0.25
Bank 3 - - -
Bank 4 - - -
Bank 5 - - -
CMBS Credit Facilities $94,043 $94,043 0.25
Revolving Credit Facility $400,000 - 5.0
Total facilities $1,694,043 $481,650 2.39
9/30/17 cash and cash equivalents5 $257,130 - -
Facilities + 9/30/17 cash and cash equivalents $1,951,173
Source: Company filings as of September 30, 2017
CLNC anticipates an additional ~$1.4 billion in aggregate repurchase facility commitments across four new lenders4
Colony NorthStar Credit Real Estate, Inc. 28
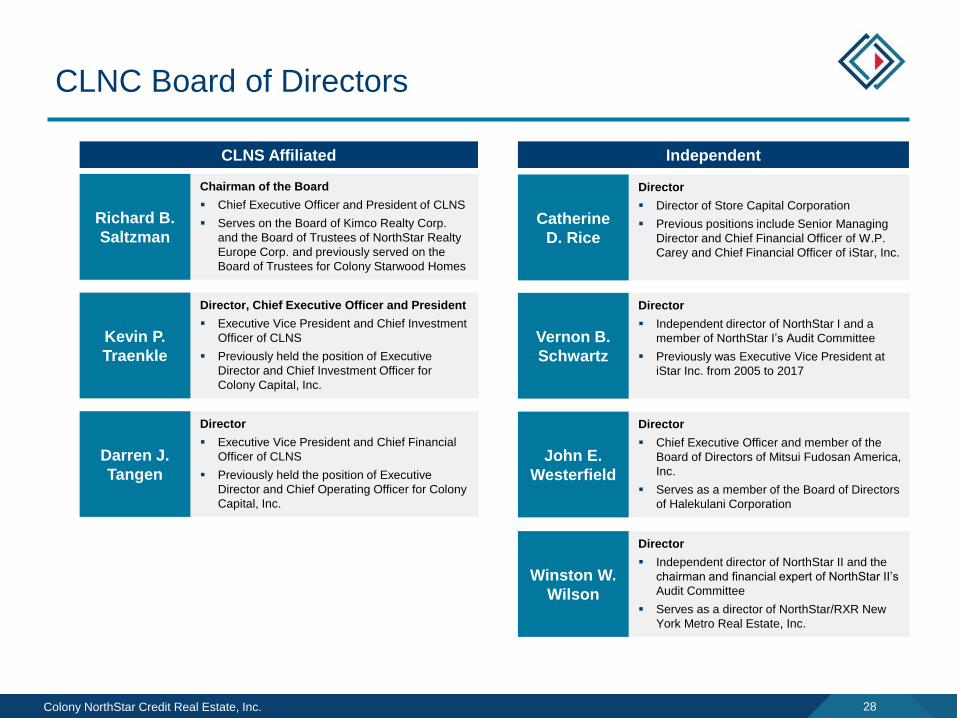
CLNC Board of Directors
Richard B.
Saltzman
Chairman of the Board
Chief Executive Officer and President of CLNS
Serves on the Board of Kimco Realty Corp.
and the Board of Trustees of NorthStar Realty
Europe Corp. and previously served on the
Board of Trustees for Colony Starwood Homes
Kevin P.
Traenkle
Director, Chief Executive Officer and President
Executive Vice President and Chief Investment
Officer of CLNS
Previously held the position of Executive
Director and Chief Investment Officer for
Colony Capital, Inc.
Darren J.
Tangen
Director
Executive Vice President and Chief Financial
Officer of CLNS
Previously held the position of Executive
Director and Chief Operating Officer for Colony
Capital, Inc.
Catherine
D. Rice
Director
Director of Store Capital Corporation
Previous positions include Senior Managing
Director and Chief Financial Officer of W.P.
Carey and Chief Financial Officer of iStar, Inc.
Vernon B.
Schwartz
Director
Independent director of NorthStar I and a
member of NorthStar I’s Audit Committee
Previously was Executive Vice President at
iStar Inc. from 2005 to 2017
John E.
Westerfield
Director
Chief Executive Officer and member of the
Board of Directors of Mitsui Fudosan America,
Inc.
Serves as a member of the Board of Directors
of Halekulani Corporation
CLNS Affiliated Independent
Winston W.
Wilson
Director
Independent director of NorthStar II and the
chairman and financial expert of NorthStar II’s
Audit Committee
Serves as a director of NorthStar/RXR New
York Metro Real Estate, Inc.
Colony NorthStar Credit Real Estate, Inc. 29
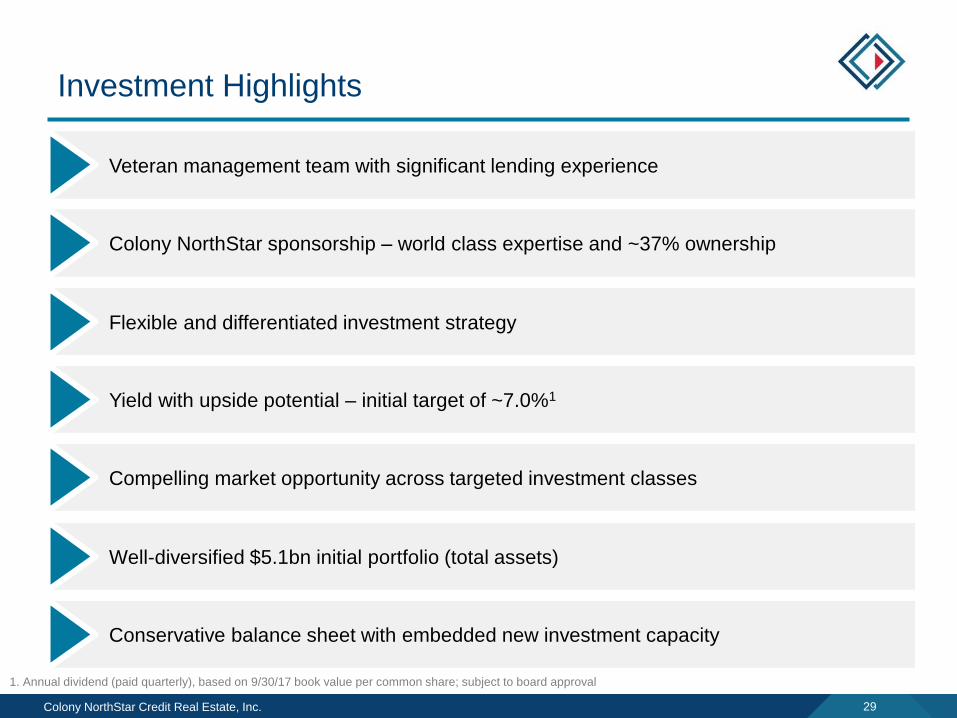
Investment Highlights
Compelling market opportunity across targeted investment classes
Colony NorthStar sponsorship – world class expertise and ~37% ownership
Flexible and differentiated investment strategy
Conservative balance sheet with embedded new investment capacity
Veteran management team with significant lending experience
Well-diversified $5.1bn initial portfolio (total assets)
Yield with upside potential – initial target of ~7.0%1
1. Annual dividend (paid quarterly), based on 9/30/17 book value per common share; subject to board approval
Appendix
Colony NorthStar Credit Real Estate, Inc. 31
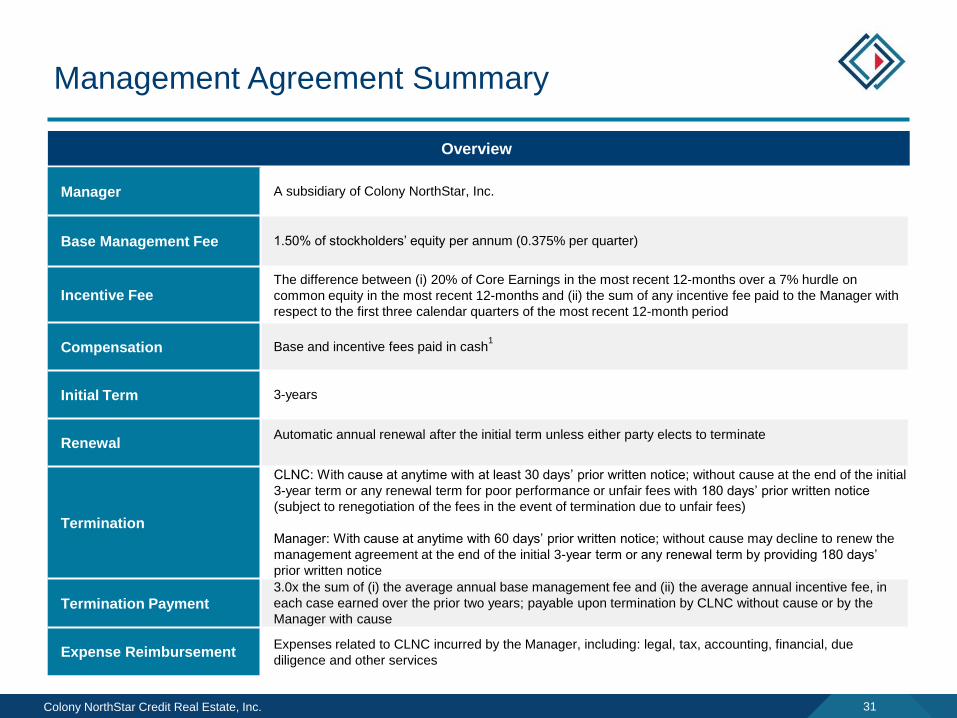
Management Agreement Summary
Overview
Manager A subsidiary of Colony NorthStar, Inc.
Base Management Fee 1.50% of stockholders’ equity per annum (0.375% per quarter)
Incentive FeeThe difference between (i) 20% of Core Earnings in the most recent 12-months over a 7% hurdle on
common equity in the most recent 12-months and (ii) the sum of any incentive fee paid to the Manager with
respect to the first three calendar quarters of the most recent 12-month period
Compensation Base and incentive fees paid in cash1
Initial Term 3-years
RenewalAutomatic annual renewal after the initial term unless either party elects to terminate
Termination
CLNC: With cause at anytime with at least 30 days’ prior written notice; without cause at the end of the initial
3-year term or any renewal term for poor performance or unfair fees with 180 days’ prior written notice
(subject to renegotiation of the fees in the event of termination due to unfair fees)
Manager: With cause at anytime with 60 days’ prior written notice; without cause may decline to renew the
management agreement at the end of the initial 3-year term or any renewal term by providing 180 days’
prior written notice
Termination Payment3.0x the sum of (i) the average annual base management fee and (ii) the average annual incentive fee, in
each case earned over the prior two years; payable upon termination by CLNC without cause or by the
Manager with cause
Expense ReimbursementExpenses related to CLNC incurred by the Manager, including: legal, tax, accounting, financial, due
diligence and other services
Colony NorthStar Credit Real Estate, Inc. 32
Footnotes
Page 2
1. Reflects book value per share of common equity. Based on unaudited pro forma condensed combined balance sheet as of 9/30/17 and reflects pro forma transaction adjustments including the
impact of fair value, consolidation, and various closing adjustments. True-up adjustments between the period between of 10/1/17 and closing of the merger are excluded and not currently
determinable
2. Assumes the closing of the transaction following a listing, OP units are convertible into Class A shares
Page 3
1. Represents agreed upon contribution values as of 9/30/17 using valuation methodologies that were consistently applied across all parties, including the use of values, which were within a range of
values provided by an independent third-party valuation firm
2. Represents sum of contributed values, excludes transaction costs and does not reflect any potential combination accounting adjustments; shareholders’ equity includes non-controlling interest in
operating partnership and excludes non-controlling interest in investments
Page 5
1. Represents balance sheet and third-party AUM as of 9/30/17 (including $15bn attributable to a business held for sale)
Page 6
1. Represents balance sheet and third-party AUM as of 9/30/17 (including $15bn attributable to a business held for sale)
Page 9
1. Based on investments closed by Colony Financial, Inc. between its September 2009 IPO and April 2015 internalization of Colony Capital, LLC. Realized and unrealized IRR are based on actual
quarterly contributions and distributions with the exit values of unrealized IRR based on liquidation at estimated fair value as of 9/30/17 and calculated using a “time-zero” methodology in which the
cash flows of all investments begin on the same date
Page 10
1. Based on shareholders’ equity value as of 9/30/17 assuming the consummation of the transaction
2. Shareholders’ equity includes non-controlling interest in operating partnership and excludes liquidation value of preferred equity
Page 11
1. Senior mortgage loans include junior participations in our originated senior mortgage loans for which we have syndicated the senior participations to other investors and retained the junior
participations for our portfolio and contiguous mezzanine loans where we own both the senior and junior loan positions. We believe these investments are more similar to the senior mortgage loans
we originate than other loan types given their credit quality and risk profile
2. Mezzanine and preferred equity balances include $3.8 million and $56.4 million of value of pro forma book value at our share, respectively, for related equity participation interests. Mezzanine loans
also include other subordinated loans
3. Pro forma book value includes $3.3 billion of assets in three securitization trusts in which we are expected to own the controlling class of securities and therefore consolidate. The consolidated
liabilities related to these consolidated assets are $3.1 billion. Pro forma book value at our share reflects both the elimination of the consolidated assets and inclusion of our net $140.9 million equity
position in these securitization trusts
4. Diversified/Other includes (i) CMBS and private equity interests, which have a diversified underlying collateral/asset base, (ii) manufactured housing communities and (iii) commercial and residential
development and predevelopment assets
5. Various includes CMBS, private equity interests and one non-U.S. collateral asset
Page 13
1. Pro forma cash on balance sheet as of 9/30/17 and reflects anticipated transaction and closing adjustments. True-up adjustments between the period between of 10/1/17 and closing of the merger
are excluded and not currently determinable
2. Includes B pieces
Page 14
1. Loan figures represent all 2017 activity for all of CLNS managed entities / funds and balance sheet
2. Includes US debt investments only; excludes CMBS
3. Includes deals generated through the US Investment Management platform only; excludes Colony NorthStar balance sheet deals
Page 15
1. Northern California Luxury Hotel loan closed January 2, 2018
2. As of January 3, 2018
Colony NorthStar Credit Real Estate, Inc. 33
Footnotes (cont’d)
Page 16
1. Trepp LLC as of September 2017
2. Commercial Mortgage Alert; 2017 issuance data as of September 2017
3. Real Capital Analytics as of December 2016
Page 17
1. Green Street Advisors as of December 2017; based on equal-weighted average of the five major property sectors: Apartment, industrial, mall, office, and strip centers.
2. Real Capital Analytics as of December 2017
Page 18
1. Represents the remaining term based on the current contractual maturity date of loans and is weighted by pro forma book value at our share excluding equity participations
2. Weighted by pro forma book value at our share
3. Based on pro forma book value at our share excluding equity participations; in addition to credit spread, all-in yield includes the amortization of deferred origination fees, purchase price premium and
discount, loan origination costs and accrual of both extension and contractual exit fees. All-in yield for the loan portfolio assumes the applicable floating benchmark rate as of 9/30/17 for weighted
average calculations
4. Illustrative levered yield represents investment net income from senior portfolio utilizing leverage of 75% at L + 225bps and unlevered investment net income from mezzanine and preferred portfolios,
divided by pro forma net book value at our share
5. Pro forma book value at our share represents the proportionate pro forma book value based on our ownership by asset
6. Other includes manufactured housing communities and commercial and residential development and predevelopment assets
7. Other includes one non U.S. collateral asset
Page 19
1. Based on the total committed loan amount divided by third party appraised value
2. Cash coupon does not include origination or exit fees
3. Reflects levered investment net income divided by net book value; based on total committed funding and includes future financing expected to be funded upon merger close
Page 20
1. Based on the total committed loan amount divided by third party appraised value
2. Cash coupon does not include origination or exit fees
3. Reflects levered investment net income divided by net book value; based on total committed funding
Page 21
1. Based on the total loan amount divided by third party appraised value
2. Cash coupon does not include origination or exit fees
3. Reflects investment net income divided by net book value
Page 22
1. Does not include potential upside through equity participation
2. Based on the total loan amount divided by third party appraised value
3. Reflects current preferred return rate which has future contractual increases of 0.50% annually
Page 23
1. Total annualized base rent is based on in-place leases multiplied by 12, excluding straight-line adjustments and rent concessions as of September 30, 2017
2. Pro forma book value at our share represents the proportionate pro forma book value based on our ownership by asset
3. Other owned real estate includes hotel assets and residential development and predevelopment assets
Page 24
1. Represents the Company’s share
2. Reflects levered investment net income divided by net book value
Colony NorthStar Credit Real Estate, Inc. 34
Footnotes (cont’d)
Page 26
1. Capital structure is shown on a pro rata basis as of September 30, 2017
Page 27
1. Includes $1.4 billion of additional capacity from new repurchase facilities currently under negotiation
2. Final maturity assumes extensions are exercised
3. CMBS credit facilities do not have specified capacity. Borrowings and interest rates are asset-specific and determined at the time of borrowing. These credit facilities are indexed to one-month or
three-month LIBOR and currently have an as of right, rolling three-month term
4. There is no assurance that definitive agreements will be entered into on the terms contemplated or at all
5. Pro forma cash on balance sheet as of 9/30/17 and reflects anticipated transaction and closing adjustments. True-up adjustments between the period between of 10/1/17 and closing of the merger
are excluded and not currently determinable
Page 31
1. As a component of Manager’s compensation, the Company or subsidiaries may issue to the Manager or personnel of the Manager stock-based or other equity-based compensation under the
Company’s or subsidiary’s equity incentive plan