Embed Size (px)
Citation preview
Colonisation and development in the former French West Africa
The long-term impact of the colonial public investments
Elise Huillery∗
December 2006
Abstract To what extend did colonial public investments influence current regional inequalities in French-speaking West Africa? This paper uses the differences in development outcomes across areas of the former French West Africa to show the existence of colonial long term effects on development paths. It innovates in underlying the role of public investments rather than the more general role of institutions. To correct from potential biases, I take carefully into account the districts’ geographical and pre-colonial characteristics and use the spatial discontinuities of colonial investments policy to control for potential districts’ unobservable characteristics. Results show that colonial investments in education, health and public works are a strong determinant of current development of former French West Africa’s districts. They explain 12% of current stunting rate, 32% of current school attendance rate, and around 40% of current electricity, water tap and modern combustible equipment rates. The nature of public investments also matters: each type of current performance has been more specifically determined by the corresponding colonial investments. Colonial public policies had thus very persistent effects and played a strong spatial discriminating role.
∗ Doctorate student DIAL-IRD and Paris Jourdan Sciences Economiques (PSE), Paris. E-mail : [email protected]
1. Introduction Since the independences in the 1960’s, West Africa’s economic performances have been strikingly low in comparison with other developing countries. This is what makes many observers refer to an “African tragedy”. Obviously, the need for understanding this tragedy is a crucial concern. The economic historian Paul Bairoch writes: “There is no doubt that a large number of negative structural features of the process of economic underdevelopment have historical roots going back to European colonization” (Bairoch, 1993). Since 2000, a growing literature focuses on the interaction between colonialism and development. Several empirical papers have tested the impact of colonial history on development paths and for the best clarity I classify them in three groups according to their colonial dimension of interest. A first group of papers focuses on differences induced by colonisers’ identities: La Porta & al (1998) and Acemoglu & Robinson (2003) find that colonisers’ identities had an impact on the development path of ex-colonies through the nature of legal systems imported in colonies. Both give evidence that former English colonies benefit from better institutions than former French colonies thanks to a more efficient legal system inherited from colonial times. A second group of papers focuses on the impact of European settlement: Acemoglu, Johnson & Robinson (2000) show that former settlement colonies perform better than former extractive colonies because they inherited institutions which protect more private property rights. Finally, a third group of papers focuses on the impact of institutions induced by particular administrative rules: Banerjee & Iyer (2005) study the impact of colonial land tenure system on Indian districts development. They provide evidence that districts in which property rights in land were given to the cultivators now perform better than the districts in which these rights were given to landlords. Iyer (2004) compare economic outcomes across areas in India which where under the direct colonial rule of British administrators with areas which were under indirect colonial rule. She finds that the districts under direct colonial rule have significantly lower availability of public goods than districts under indirect colonial rule. These two latter papers differ from the others in the sense that they do not compare all former colonies but focus on one particular country, India. The authors argue that it allows them to locate the source of difference more easily, relative to the case where ex-colonies have radically different historical, geographical, cultural backgrounds as well as different colonial histories. This paper follows the same idea: it focuses on one particular source of difference - colonial public investments- in one particular area –French West Africa. This region exhibits a noticeable homogeneity regarding its geographical, anthropological, cultural and historical characteristics. Moreover, it was colonised by French only (which allows us to control for the coloniser’s identity), at the same period (from the last quarter of the nineteenth century to
2
19601). The sources of difference between districts of former French West Africa are therefore easier to identify than between all former colonies. I compare the present day performances of districts of French West Africa which received different levels of public investments during colonial times. This paper thus proposes an empirical framework to estimate the long term impact of public investments on spatial inequalities. This is motivated by two underlying questions: first, what is the importance of colonial history relative to pre-colonial history and geography? Secondly, what are the long term returns of public investments? In respect to the existing literature, this paper innovates in underlying the role of public investments rather than the more general role of institutions. Institutions are commonly viewed as provided a general favorable environment for development. But it is not clear in which precise way they encourage economic development. Acemoglu, Johnson and Robinson (2003) privilege the interpretation of institutional overhang, but it is generally impossible to distinguish between the various potential channels of institutions’ influence. Banerjee & Iyer (2005) and Iyer (2004) give evidence that the effect of land tenure system and colonial rule on productivity in India is indirect, partially lying on their effect on investments: they argue that the differences in economic outcomes are largely due to differences in investments. Focusing on colonial public investments therefore contributes to precise channels through which long term history matters. Another advantage of this paper is the use of a first-hand data set matching direct and precise historical data with current data on districts. Colonial and pre-colonial data come from historical archives found in Paris and Dakar, whereas recent data come from national household surveys performed in the middle of the 1990’s. I matched both using the geographical coordinates of the surveyed households’ locality and very precise colonial maps of each district. Colonial times introduced important differences between districts of former French West Africa. The colonial investments in education, health and infrastructures were indeed very unequal from a district to another. Even if the pre-colonial context was much more homogeneous within former French West Africa relative to all ex-colonies, districts were not strictly equivalent to French colonial power and differences in colonial investments were not totally random. Nevertheless, access to a detailed history allows to identifying how variations came about. This is a crucial issue because districts’ pre-colonial characteristics could have influenced both colonial investments and development paths, biasing the naïve estimates of the causal effect of public investments: French colonial power could have more invested in the richest districts, which would have reached anyway a higher level of development than
1 Guinea acceded independence in 1958, whereas the other colonies of the French West Africa acceded independence in 1960.
3

their poorer neighbors. To overcome this potential selection bias, this paper uses a two-step strategy: first, it exploits proxies of the potential determinants of colonial investments, which can be classified in three groups: geographical factors, pre-colonial factors, and characteristics of colonial conquest. OLS regressions including these proxies give a first estimation of the impact of colonial investments on current development controlling for main pre-colonial characteristics. The second step consists in testing the robustness of these first results by using the geographical discontinuities of colonial policy. The autonomy of the French districts’ Administrators and the arbitrariness of colonial borders actually allow us to argue for exogeneity of neighbor districts’ variations. Some unobservable characteristics that may not be captured by our OLS controls are in fact similar for border districts, so differences in outcomes between border districts are more likely to be due to differences in colonial public investments. Results show that the colonial public investments have been a strong determinant of current districts’ development. Colonial investments between 1907 and 1930 explains 12% of current less than 5-year old children stunting rate, 32% of 7-12-year old children school attendance rate and around 40% of electricity, water tap and modern combustible equipment rates. Moreover, the nature of the public investments matters: current educational performances are more specifically determined by colonial investments in education, as current health performances by colonial investments in health and current infrastructures’ development by colonial public works. I also find cross-effects of health investments on electricity, private water tap and modern combustible use, as well as of infrastructures investments on school attendance. Public investments’ returns thus appear to have been very high in French West Africa during colonial times. Furthermore, colonial history has been a strong source of districts discrimination in French-speaking West Africa, whose effects on spatial inequalities are still sensitive 60 years later. The paper is structured as follows: Section 2 describes the historical background and the investments policy under French rule in West Africa. Section 3 describes the data and gives some summary statistics on current development, colonial investments and districts characteristics. Section 4 describes the empirical approach used to estimate the impact of colonial investments on development paths. The main empirical results are reported and discussed in section 5. Section 6 discusses potential mechanisms that might explain the persistence of the effect of colonial investments. Section 7 concludes.
4
2. Historical background: the French colonisation 2.1. French political control on West Africa
French West Africa lasted officially 65 years, from 1895 to 1960. Historical reality is that military expansion lasted from 1854 to 1903, pacification from 1854 to 1929 and effective occupation from 1904 to 1960. The French first arrived in 1854 on the Senegalese coasts, driven by the famous General Faidherbe. Colonial expansion in the 1850’s began from the west of the region: a first military column went from the Senegalese coasts to the east direction and arrived in the late 1850’s at the west side of current Mali (Kayes, Satadougou). A second military expansion was engaged during the 1850’s to the north direction on what corresponds now to current Mauritania. A third military expansion took place along the Guinean coasts (Conakry, Boffa, Boke, Forecariah). South Dahomey was then the only new expansion of the 1860’s. Nothing appended during the 1870’s. The main colonial expansion occurred in the 1880’s, from the South to the North and from the West to the East. In the 1890’s, a last military column progressed from the south-east side of current Mali towards the east as far as the Tchad Lake, joined by a column progressing from the Benin’s coasts towards the north. French West Africa was officially created in 1895 as a federation of colonies of West Africa. But the conquest was not yet achieved. The Federal Government became effective in 1904. Despite a military control on the major part of the territory before 1900, there were no sensitive all-day life modifications for local people before 1900-1910 except for few coastal localities. Local chiefs’ prerogatives in particular were in general still intact, their military obedience being materialised by friendship treaties. Hostile chiefs only suffer from French military repression. Civil administration took place progressively in the whole territory from 1900 to 1920. We can thus consider that an administrative occupation has been effective in the major part of the territory from approximately 1910 to 1960. 2.2. Financial and administrative organisation of French West Africa French colonial administration was structured as a pyramid: at the top chairs the General Governor of the federation. Below stands a “Lieutenant-Governor” for each of the 8 colonies. Then stand the districts’ administrators, around 15 per colony. In 1925, French West Africa counted 120 districts. The largest districts were divided in subdivisions that were also managed by French administrators (in 1925, the number of subdivisions -or districts when the districts have no subdivision- amounts to 164). At the bottom of pyramid stand African chiefs. They received from the colonial administration the status of “village’s chiefs” so as to limit their influence to small areas.
5
In this pyramidal organisation, the effective power was concentrated at the third stage: the districts’ administrators were “the real chiefs of the French empire” (Delavignette (1939)). Their tasks were very important: oversee tax collection, represent the Lieutenant-Governor in all official events, count people living in the district, draw up the district’s map, steer elementary schools, watch Koranic schools, plan and supervise the building of roads, bridges, wells and tracks, arrest criminals and judge them according to the “native population code”2. The official tasks of African chiefs were to collect taxes, recruit workforce for hard labour and recruit military reservists. The number of people to recruit and the amount of taxes to collect was defined by French district’s administrators. African chiefs were therefore quartered to auxiliaries of French colonial administrators. The administrative organisation was thus officially centralized but effectively decentralized. French districts’ administrators could manage their local policy in an almost independent way thanks to physical distances and lack of means of communication. Neighbour districts could therefore have experimented different colonial policies. French colonial financial system in West Africa was organised with 3 levels of budgets: the budget of the French Ministry of Colonies, French West Africa’s federal budget and colonies’ local budgets. The budget of the French Ministry of Colonies was credited with metropolitan taxes and entirely devoted to military expenses. French West Africa’s federal budget was credited with customs duties generated by trade between the federation and the rest of the world. This budget had to cover three expenses: the running expenses of the General Government and its central services, large-scale public works covering several colonies (railway works for the most part), and subsidies to poor colonies (Mauritania only). Finally, colonies’ local budgets were credited with local taxes. Each colony must then use its own resources so as to finance French colonisation costs (except Mauritania which benefited from federal subsidies). According to the statistics I computed3, 60% of the colonies’ budgets came from the capitation tax between 1907 and 1930. Direct taxes (capitation tax, trading tax and property tax) represent all together 89% of total colonies’ resources. Local budgets must cover all expenses except for military expenses and some of the biggest large-scale public works. Colonisation’s costs were thus endured by local populations themselves rather than by French taxpayers, and more precisely by households for the most part rather than firms. Central services and colony’s Government absorbed 30% of colony’s resources. Districts received the other 70%, on average distributed as follows: 40 for administration expenses, 10 for public works, 15 for education and health expenses (personal and material), and the 5 left for miscellaneous expenses. Investments in infrastructures, health and education in districts amounted together to 25% of colonies’ budgets. All expenses concerning colonies and a
2 Called in French the « code de l’indigénat ». This code was exclusively devoted to African people. 3 These statistics were calculated from 71 budgets covering the 8 colonies between 1907 and 1930.
6
fortiori districts were therefore carried out by local budgets, except for some very large-scale public works, almost exclusively railway works, financed by federal resources. 2.3. The public goods’ investment policy As evocated above, colonial administration invested in three public goods: education, health and infrastructures. French administrators had yearly to define precisely their need in terms of those three kinds of investments for the elaboration of annual local budgets. In education field, administrators had thus to decide which number of European teachers, African teachers and teaching assistants to require by adding each of their localities’ needs, as well as the amount of teaching material needed. In medical field, they computed annually on the same way the number of European doctors and nurses, African doctors and nurses and medical assistants as well as the amount of medical material required. Finally, French administrators decided the amount of financial resources needed to cover their infrastructures expenditures: roads, wells, tracks, buildings, bridges’ reparations and constructions. A very precise “plan de campagne” was annually established to describe all the works to be performed in each locality. Taxes were collected at the district level but entirely paid back to local budgets. Colonial investments in education, health and infrastructures were therefore not proportional to districts’ taxes. Some districts contributed much to local budgets but received few investments, others contributed much to local budgets and received many investments, and conversely. Richness of districts, measured by taxes contribution, was then not the only determinant of public investments policy even if the correlation between public investments and collected taxes per capita is positive4. No explicit investments strategy can actually be found in local budgets. Motivations reported at the beginning of each local budget explain the global level of annual resources and modifications in resources employment but do not mention their spatial distribution. However, all historical documents on French colonial administrative system mention the relative autonomy of French districts’ administrators and their power in terms of policy making (Bouche (1991), Ki-Zerbo (1978), Cohen (1974)). Biographies of former French colonial administrators also give evidence of their initiating role in investments decision process (Delavignette (1939), Duchamps (1975)). The influence of administrators on investments policy was thus certainly very high. Their personality, educational background or colonial philosophy then could have been exogenous sources of variation of colonial public investments. But some intrinsic districts characteristics also certainly influenced administrators’ investments policy and constitute therefore sources of endogeneity which our empirical strategy in section 4 tries to control for.
4 Cf. section 3
7
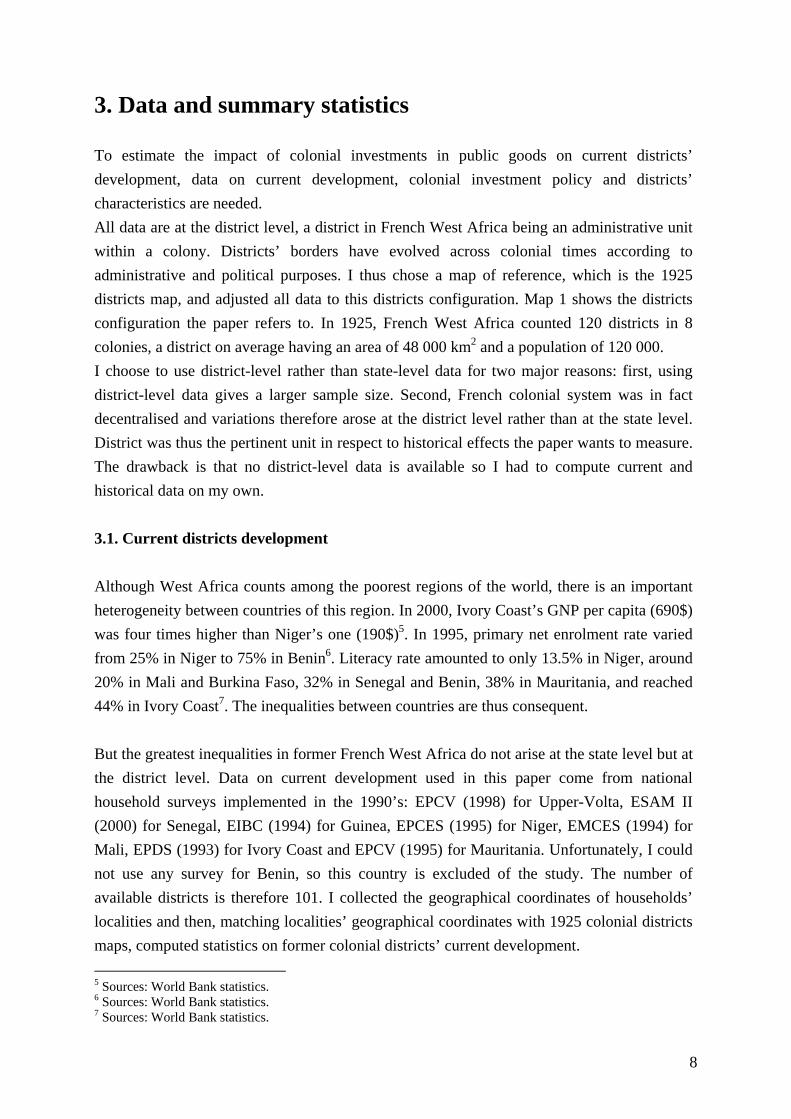
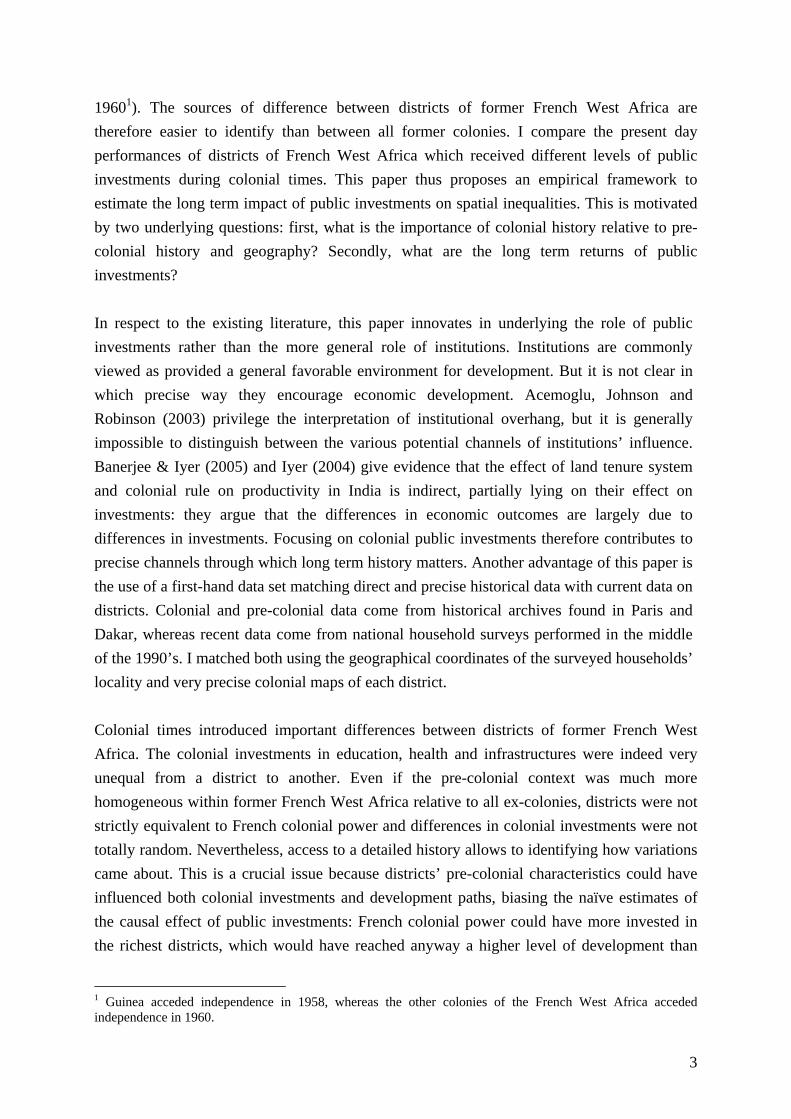
3. Data and summary statistics To estimate the impact of colonial investments in public goods on current districts’ development, data on current development, colonial investment policy and districts’ characteristics are needed. All data are at the district level, a district in French West Africa being an administrative unit within a colony. Districts’ borders have evolved across colonial times according to administrative and political purposes. I thus chose a map of reference, which is the 1925 districts map, and adjusted all data to this districts configuration. Map 1 shows the districts configuration the paper refers to. In 1925, French West Africa counted 120 districts in 8 colonies, a district on average having an area of 48 000 km2 and a population of 120 000. I choose to use district-level rather than state-level data for two major reasons: first, using district-level data gives a larger sample size. Second, French colonial system was in fact decentralised and variations therefore arose at the district level rather than at the state level. District was thus the pertinent unit in respect to historical effects the paper wants to measure. The drawback is that no district-level data is available so I had to compute current and historical data on my own. 3.1. Current districts development Although West Africa counts among the poorest regions of the world, there is an important heterogeneity between countries of this region. In 2000, Ivory Coast’s GNP per capita (690$) was four times higher than Niger’s one (190$)5. In 1995, primary net enrolment rate varied from 25% in Niger to 75% in Benin6. Literacy rate amounted to only 13.5% in Niger, around 20% in Mali and Burkina Faso, 32% in Senegal and Benin, 38% in Mauritania, and reached 44% in Ivory Coast7. The inequalities between countries are thus consequent. But the greatest inequalities in former French West Africa do not arise at the state level but at the district level. Data on current development used in this paper come from national household surveys implemented in the 1990’s: EPCV (1998) for Upper-Volta, ESAM II (2000) for Senegal, EIBC (1994) for Guinea, EPCES (1995) for Niger, EMCES (1994) for Mali, EPDS (1993) for Ivory Coast and EPCV (1995) for Mauritania. Unfortunately, I could not use any survey for Benin, so this country is excluded of the study. The number of available districts is therefore 101. I collected the geographical coordinates of households’ localities and then, matching localities’ geographical coordinates with 1925 colonial districts maps, computed statistics on former colonial districts’ current development. 5 Sources: World Bank statistics. 6 Sources: World Bank statistics. 7 Sources: World Bank statistics.
8

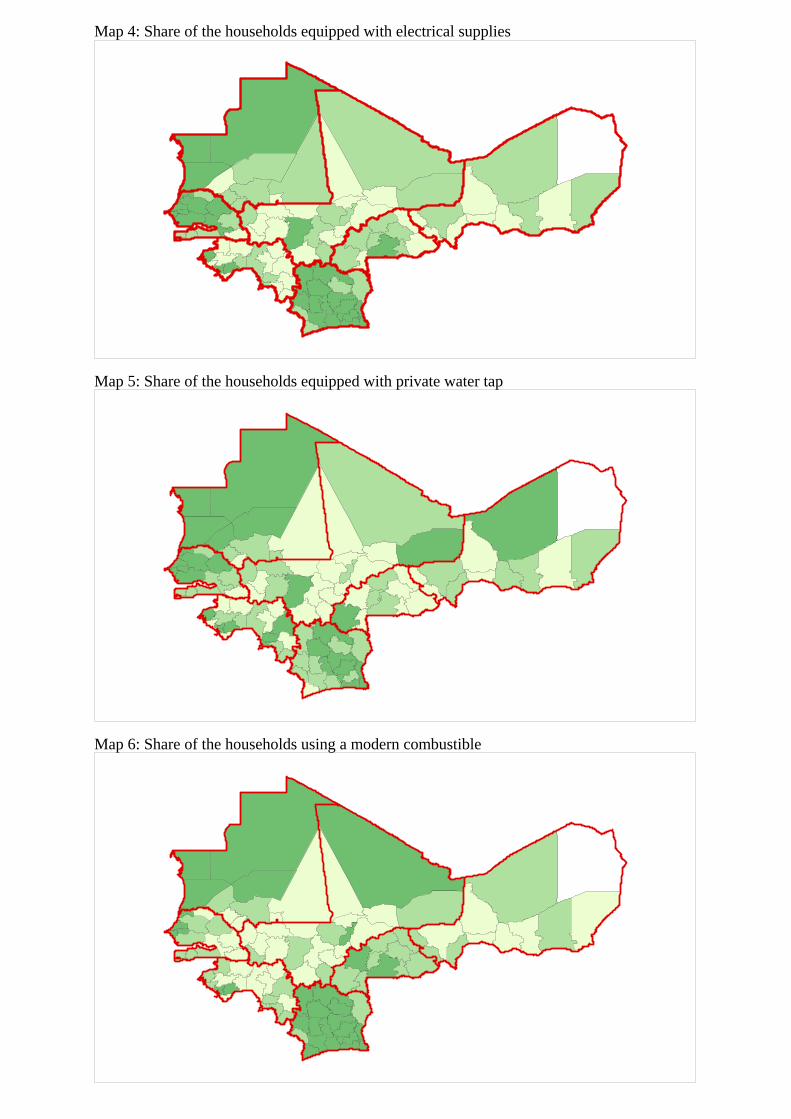
I am limited in the kind of data that I can get because of the use of different national household surveys. The development indicators which can be computed from each national household’s surveys are: an educational development indicator (7-12 year old children school attendance rate), a health development indicator (less than 5-year old children suffering from stunting rate), and 3 infrastructures development indicators (electricity, private water tap and modern combustible equipment rate)8. I used international standards associated to each age (measured in months) to calculate the rate of stunting children in each district. A child is said to suffer from stunting if his height is less than two standard errors under the median height. The median of the height for a given age (in months) is calculated from international data, not regional ones. The Mauritanian survey does not contain information about the weight and the height of the children, so Mauritania can not be included in these statistics. Table 1 presents summary statistics on those 5 development indicators. On average per district, 34% of the 7/12-year old children are going to school, 37% of less than 5-year old children suffer from stunting, 14% of the households benefit from electrical supplies, 11% have a private water tap (by opposition to public sources of water like fountains or natural sources like streams), and 15% use a modern combustible for cooking (gas, coal or electricity, by opposition to natural combustibles). Our statistics thus reflect the very low development level of French-speaking West Africa. The dispersion of all these indicators is very important: their distributions are exceptionally unequal, particularly for infrastructures development indicators, as shown by the high values of standards errors and gaps between terciles’ means. Maps 2 to 6 represent the geographical repartition of districts by terciles for each development indicator. The districts of the first tercile are light coloured, those of the third tercile are dark coloured. We can observe some regional tendencies (“light” areas versus “dark” areas): the north-west of West Africa and the south of Ivory Coast are evidently more educated than the rest of the region. Niger appears to be the area with the highest rate of stunting children. Average stunting children rate of Nigerien districts is actually 50%, whereas Guinean districts have the lowest mean rate with 29%. Ivory Coast, Senegal and north-west of Mauritania seem to have better infrastructures than the rest of the region, particularly Niger and Mali: average electricity equipment rate is 28% for Ivorian districts and 26% for Senegalese ones, what is much higher than the general average rate of 14%. Conversely, average electricity equipment
8 Surveys count on average 450 households, 620 7-12 year old children and 370 less than 5 year-old children per district.
9
rate is only 3.4% for Malian districts and 4% for Nigerien ones. Development spatial inequalities are therefore partly a matter of country and geographical position. Nevertheless, Maps 2 to 6 also give evidence of an important heterogeneity between neighbouring districts. Districts of first tercile are neighbour of districts of third tercile. To measure the importance of being in a particular country, I decomposed the total variance of each indicator in two parts, the variance within countries9 and the variance between countries10. Table 2 reports the share of total variance due to variance within countries. It shows clearly the predominance of within countries variance which represents around 80% of total variance. Country or geographical position is thus a small part of the story. What we have to explain is therefore inequalities at the district rather than at the state level. To conclude, performances are on average quite bad, but there is a significant heterogeneity between districts. Even if some areas are more homogeneous, heterogeneity affects also border districts. Inequalities between districts of a country are much higher than inequalities between countries. 3.2. Colonial public investments Data on colonial investments come from annual local budgets over 1907-1930. Local budgets often detail public investments repartition by district. Concerning colonial investments in education, I collected the number of teachers per district for each available year between 1907 and 1930 and use the average number of teachers per 100 000 habitants as a proxy of colonial investments in education. I use exactly the same variable for colonial investments in health substituting medical staff to teachers. Finally, I collected annual public works material expenses between 1907 and 1930 per district and use the average amount of public works expenses over 1907-1930 per km2 as a proxy of infrastructures colonial investments. Public works consisted in roads, wells, tracks, buildings and bridges reparation and construction. As districts borders evolved slightly during colonial times, original district-level data found in local budgets had to be adjusted to our constant statistical unit: 1925 districts. I used information on territorial modifications and - if possible - localities’ names to adjust data to 1925 districts configuration. Data on large-scale public works financed on federal resources are not included for two reasons: firstly, it would have required the collection of federal budgets’ data in addition to local ones, which represents an important additional effort; secondly, federal budgets do not decompose investments nor at the district level neither at the state level, making their
9 The variance within countries is the mean of the variances of the districts’ values in a country. 10 The variance between countries is the variance of the countries’ means values.
10
repartition between districts very hypothetical. This exclusion produces actually an understatement of spatial colonial discrimination: large-scale public works financed on federal resources were mostly devoted to the main towns or main axes of each colony, those which were already advantaged by colony’s budgets. Actual inequalities in infrastructures’ investments were thus probably bigger than measured here. As shown in table 1, colonial investments per district were on average very low. Districts received on average 7 teachers and 12 medical workers per 100 000 habitants, and 54 FF per km2 for public works expenses. Dakar and Saint-Louis received much more than other districts: excluding Dakar and Saint-Louis, average investments per districts fall to 4.5 teachers and 9 medical workers per 100 000 habitants, and 3.3 FF per km2 in public works expenses. Standard deviations are very high relative to means and gaps between terciles’ means are huge (especially between the two top terciles). This gives evidence that colonial investments distribution was very unequal, particularly investments in infrastructures. Maps 7 to 9 show the geographical distribution of terciles for each colonial investment. It is clear that colonial investments policy advantaged some regions in detriment of others: Upper-Volta and south-east of Niger have been disadvantaged in terms of human capital investments; investments in infrastructures were more concentrated in coastal areas of Senegal, Guinea and Ivory Coast, which can reflect the structure of French colonial economic system based on exportations and importations with European countries. In addition to regional discriminations, it is also visible that neighbouring districts received different colonial treatments. The average gap between two neighbouring districts is equal to 5 teachers and 10 doctors, which is big compared to the average numbers of teachers and doctors per district. Table 3 reports some statistics on districts ratio between their share of colony’s investments and their share of colony’s resources. These statistics show that public goods’ allocation was largely disconnected from districts’ contribution to the colony’s tax revenue (this would have been the case if the ratio had been near 1). There was thus a very important redistribution between colonial districts. Redistribution was neither systematically from the richest towards the poorest nor systematically from the poorest towards the richest. The allocation of public goods in the colonies was thus not linked to the resources of the districts. To conclude on colonial investments policy, there have been only few colonial investments at least until 1930. Totalizing average investments per district over 1907-1930 shows that there were on average only 700 teachers and 1 230 medical workers in whole French West Africa (including a majority of Africans). This is obviously not insignificant, but the investment effort
11
was not massive. Secondly, these investments were very unequally distributed. Colonial public investments’ policy was thus an important source of discrimination between districts. 3.3. Other districts characteristics At the end of nineteenth century, French West Africa was a vast territory of 4 800 000 km2 habited by a scarce population of around 12 000 000 people11. Population density was therefore very low: around 2.5 people per km2. As said in introduction, a great advantage of limiting the study to a geographically restricted area is that sources of variation are much easier to identify than in case of very different historical, anthropological, geographical and institutional backgrounds. This section identifies potential districts characteristics which potentially determined both colonial investments and development performances. I collected an important number of districts observable characteristics. All data are original ones. 3.3.1. Geographical characteristics Districts geographical characteristics are potentially important determinants of their development path: they condition soil fertility, climate severity or mildness, accessibility of water, etc. Climate, proximity of the coasts, presence of practicable rivers for instance, could also have influenced colonial investments through their impact on districts accessibility and attractiveness. I thus collected geographical characteristics reflecting districts accessibility and attractiveness: altitude, annual precipitations, latitude, longitude, presence of a coastal border and of an important river. Data on altitude, latitude and longitude have been collected on the website of Falling Rain Genomics. I collected the altitude of the main town of each district and the latitude and longitude of surveyed households’ localities. I use districts households’ average latitude and longitude as measures of districts latitude and longitude. Data on districts annual precipitations come from ORSTOM statements completed in many towns of all West African countries since 1915. I use the average annual precipitations over 1915-1975 in the main town of each district as measure of districts annual precipitations. Finally, data on coastal borders and important river come from colonial 1925 maps. I simply constructed dummies indicating whether a district has a coastal border and an important river or not.
3.3.2. Pre-colonial history
11 This corresponds to French West Africa’s population around 1910. I calculated it from the censuses made by French districts’ administrators between 1906 and 1912. These censuses are available at Paris National Archives.
12
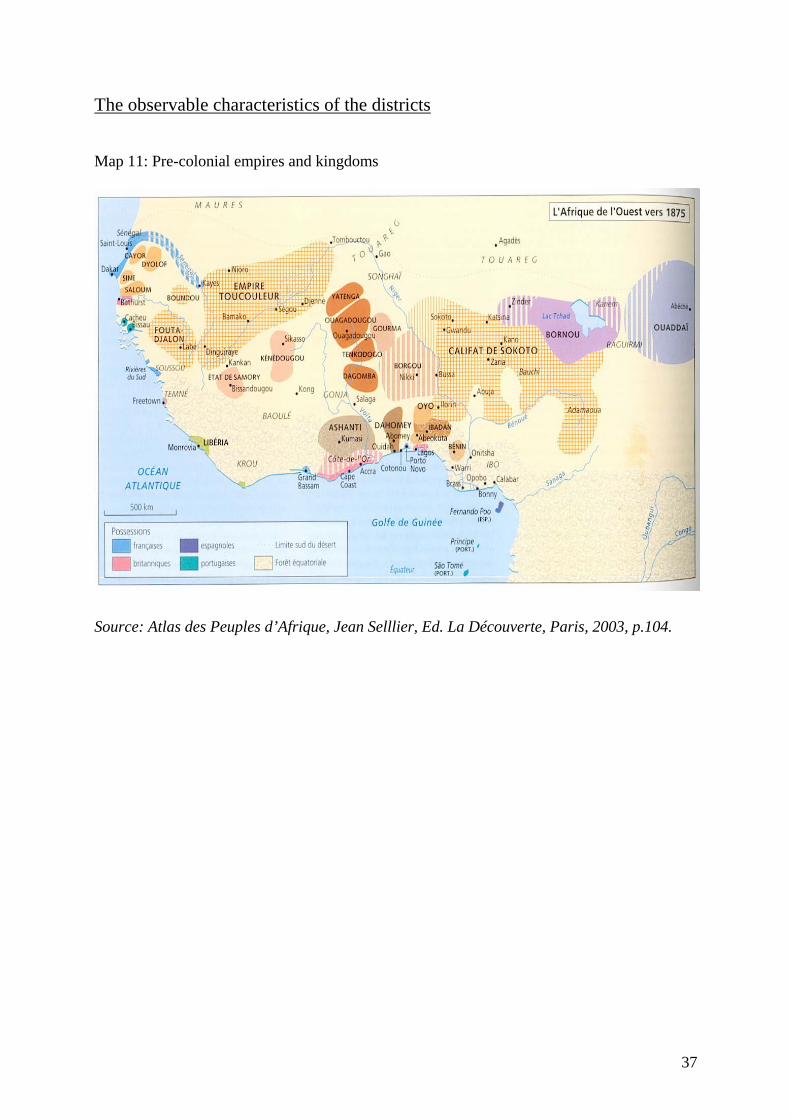
Districts pre-colonial development potentially influenced colonial investments and development paths. As French colonisation was partly motivated by economic profitability, colonial investments could have been actually oriented in favour of the more profitable districts, which depends on their political and economic development level before French conquest. District-level information on pre-colonial times is difficult to collect so I retain 3 proxies of pre-colonial districts characteristics: one on political context, one on agricultural context and the latter on commercial context. a. Pre-colonial political context Pre-colonial political context can be synthesized in two types of districts: those under a centralized political power (state societies) and those under no centralized political power (stateless societies). The existence of a centralized political power could have encouraged colonial investments according to the fact that investments could be more profitable in state rather than stateless districts, as shown by Geneaioli & Rainer results12. Map 1113 indicates the identified kingdoms at the end of the nineteenth century. Some of them, like the States of Samory, can not be considered as centralized political power states because of their instability and/or youth. Data on pre-colonial kingdoms and empires come from several historian documents: Suret-Canale (1964), Bouche (1998), Boahen (1989), Coquery-Vidrovitch, Moniot (1993), Chailley (1968). I constructed a dummy for the presence of a pre-colonial centralized political power which determinates “state” and “stateless” districts. Districts sheltering a not too much recent kingdom are classified as “state” districts (I reject the states appeared after 1850). b. Pre-colonial agricultural context At the end of nineteenth century, West Africa was a quasi-total rural area. Towns were scarce and very small: the five biggest towns were Saint-Louis (around 24 000 habitants), Dakar (18 400), Rufisque (12 500), Conakry (8 200) and Cotonou (4 400). Since these figures come from censuses of the 1900’s, these towns were actually smaller at the end of the pre-colonial era. The quasi-totality of population was then rural. That is why “agricultural development” is a very important dimension of economic development. Agricultural development can be measured indirectly by districts 1910 population density14. Data come from colonial districts censuses (French West Africa archives, série G, sous-série 22). Average population density of French West African districts around 1910 amounted to 8.7 habitants per km2, very unequally distributed: average terciles’ densities are respectively 1, 4 and 14 habitants per km2. Pre-colonial agricultural development was concentrated in 5 places:
12 Nicolas Geneaioli & Ilia Rainer, On the costs and benefits of political centralization : a lesson from African indigenous institutions, 2003. 13 From the “Atlas des peuples d’Afrique”, Jean Sellier, La découverte, Paris, 2003, p.104. 14 1910 is the earliest period we can reach through available census data.
13
on the right side of the Niger Loop, on Senegalese coastal areas, Guinea and Ivory Coast, and in Guinean forest area. c. Pre-colonial commercial context Local trade existed all over West Africa thanks to Dioulas, an ethnic group of travelling retail traders. Dioulas were (and still are) present on whole territory, but I have no statistical information on the intensity of local trade activities by district. Besides these local trade activities, there were some very important trade areas: the European trading counters. These trading counters had created real discontinuities in West African economic development. That is why I simply constructed a dummy variable indicating the existence of a European counter or not.
3.3.3. French conquest characteristics Colonial conquest characteristics could be the expression of some districts intrinsic characteristics which can make them more or less attractive for French power and more or less inclined to develop. I therefore collected district-level data on colonial conquest. a. Year of French colonial conquest’s beginning Year of French colonial conquest’s beginning is defined as year of arrival of the first military troops. I collected district-level data on French military troops’ arrival using French military archives: Duboc (1939), Deloncle (1934). It varied from 1854 for some Senegalese districts to 1903 for the district of Agadez (Niger). Fifty years passed between the beginning and the end of French colonial expansion in West Africa, which makes a big difference in comparison to the length of colonial era itself. It could first have influenced colonial investments because districts conquered earlier could have been advantaged in comparison to districts conquered later: colonial power settled sooner, so potentially invested more. Year of French colonial conquest’s beginning may also be linked to districts development potentialities: it can reflect districts socio-economic advantages explaining their attractiveness for French colonisers. b. African people resistance African people resistance against French colonial power might also influence colonial investments as well as districts development. Colonial investments could actually have played a role of rewards and punishments in response to local people attitude. Besides, resistance was probably the expression of some districts cultural, anthropological or political characteristics which influence their development. Data on African people resistance come from Crowder (1971), Deloncle (1934), Duboc (1939), Ki-Zerbo (1978), Suret-Canale (1964). I collected two dates to measure resistance length: year of French military troops’ arrival and year of the last
14
military intervention for district pacification. I use the difference between these two dates as measure of districts resistance length. Data exhibit an average resistance length of 22 years, which is much longer than what we are used to be told about colonial history. Variations of resistance length are quite important: some districts opposed no resistance to the colonial power (district of Indénié in Ivory Coast, former Europeans trading counters), whereas others resisted more than 50 years (Casamance, most of Mauritanian districts, middle-east of Benin). c. Former African chiefs’ reaction African chiefs had various reactions: some refused to cooperate and were often killed or exiled, whereas others dealt with French colonial power. This can be measured by “former chiefs indemnities” reported in colonial budgets. Indemnities rewarded chiefs for their obedience to colonial power. Chiefs’ indemnities are thus a proxy for African chiefs’ reaction. As African people resistance, collaboration between traditional and colonial power might reflect some districts political or cultural characteristics potentially linked to their development capacities. 3.3.4. Districts initial attractiveness a. Early European settlement According to existing literature, European settlement is a very good proxy of districts attractiveness and encouraged good colonial treatment (Acemoglu & al (2001), Cogneau & Guénard (2003)). In West Africa, very few Europeans settled in comparison to other colonies like Australia, Canada etc. However, early French settlement reflected districts initial attractiveness and was probably a strong determinant of colonial investments. District-level data on European settlers come from 1910 colonial censuses. 1910 is early enough to suppose that European settlement at this time was not yet the result of any colonial policy but the result of districts intrinsic characteristics. In 1910, European people represented on average 0.2% of districts population (68 Europeans per district). Variations are important: terciles’ means are respectively 5, 16 and 186 Europeans per district. b. Early modern economic activities Early modern economic activities are also an expression of districts initial development potentialities: districts where modern economic activities appeared early had potentially some positive characteristics that other districts did not have, and were potentially more attractive for colonial investments. I use the amount of trading tax collected in 1914 in each district to measure early modern economic activities. Trading tax was introduced few years before 1914 and concerns all secondary and tertiary activities. Tariffs of trading tax depended on firms’ activity and number of employees.
15

Access to a detailed history on West Africa offers then the possibility to identify main districts characteristics which influenced both colonial investments and current development.
16
4. Empirical strategy 4.1. OLS estimates of the impact of colonial public investments on current development I compare districts development performances according to colonial investments they received by running ordinary least squares regressions of the form:
Yi = α + βCIi + OCIiγ + Xiλ + Diµ + ui (1) where Yi is an outcome variable in district i, CIi the colonial investment of interest in district i, OCIi other colonial investments in district i and Xi control variables. Outcomes in equation (1) are those presented in section 3: 7/12-year old children school attendance rate, less than 5-year old stunting children rate, household electricity equipment rate, household private water tap equipment rate and household modern combustible equipment rate. Concerning colonial investments, what interests me more specifically is the impact of colonial investments in education on educational performances, the impact of colonial investments in health on health performances and the impact of colonial investments in infrastructures on infrastructures’ development. As colonial investments in education, health and infrastructures are much correlated, I want disentangle each investment’s own effect. I thus measure the specific impact of a given colonial investment (CIi in equation (1)) on the related current performance (Yi in equation (1)) by controlling for the other colonial investments (OCIi in equation (1)). For example, when Yi is districts 7/12-year old children school attendance rate, CIi is districts average annual number of teachers per 100 000 capita, and OCIi are districts average annual medical staff per 100 000 capita and average annual amount of public works per km2. When Yi is districts less than 5-year old stunting children rate, CIi is districts average annual medical staff per 100 000 capita, and when Yi is one of the three infrastructures development indicator, CIi is districts average annual amount of public works per km2, OCIi being the two other colonial investments. In all regressions Xi is the set of control variables described in section 3: geographical variables (precipitations, altitude, latitude, longitude, coastal border dummy and practicable river dummy), pre-colonial variables (centralised political power dummy, 1910 population density and European trade counter dummy), conquest variables (year of colonial conquest’s beginning, local resistance length and local chiefs indemnities) and initial attractiveness variables (1910 European settlement and 1914 per capita collected trade taxes).
17
Finally, Di is a set of outliers’ dummies. Dakar and Saint-Louis are outliers whatever outcome and colonial investment are considered in equation (1). Those two districts received actually much more annual colonial investments than others (62 teachers, 132 medical workers and 3969 FF per km2 public works for Dakar, 202 teachers and 241 medical workers and 1176 FF per km2 public works for Saint-Louis, on average over 1907-1930), and are also much more developed today. The colonial investments gap between those two districts and the others therefore would produce an important overstatement of the impact of colonial investments on current performances. Dummies for Dakar and Saint-Louis are thus always included in equation (1). A dummy for Bafoulabe district is also included in equation (1) when outcome variable is district’s less than 5-year old stunting children rate because of its very high less than 5-year old stunting children rate (0.85) and its very low colonial investment in health (0.7 medical workers), which would produce an important overstatement of the impact of colonial investments in health on current health performances. Finally, a dummy for Gao district is included in equation (1) when outcome variable is district’s water tap equipment rate for the same reason. Our coefficient of interest is thus β, and to a lesser extent γ, because it is also interesting to know whether there are “cross effects”, for example effects of colonial investments in education on current health and infrastructures performances. This equation is estimated with generally 99 observations (colonial investments in health is missing for Conakry’s district), 90 when outcome variable is districts less than 5-year old stunting children rate (this data is missing for Mauritanian districts). 4.2. Further estimates using neighbouring districts to control for unobservable characteristics The inconvenient of equation (1) is the possibility that β might reflect omitted variables. Despite my effort to collect many district-level data on pre-colonial characteristics, I can not be sure that my set of controls Xi capture all colonial investments’ endogeneity factors. One strategy to control for possible omitted variables is to use an instrument, in other words a variable correlated to colonial investments but not to districts development paths. Acemoglu, Johnson and Robinson (2000) use European mortality rate as an instrument of European settlement. European mortality rate is also a good instrument candidate for colonial investments since it influenced European settlement and European settlement influenced colonial investments. I collected districts European mortality rates from colonial censuses. But the number of Europeans living in each district is so small that resulting mortality rates are
18
unusable: mortality rates obtained on ten or twenty Europeans are completely unrepresentative. The quality of this variable is then very bad and forces me to abandon this strategy. Another strategy to control for possible omitted variables is to use spatial discontinuities by comparing neighbour districts only. The underlying idea is that geographical neighbours had similar unobservable characteristics before being separated by a border. Differences in neighbours’ outcomes are then likely to be due to differences in any “post-border” treatment. This method is thus very close to a matching approach. In the case of French West Africa, there are good reasons to think that neighbour districts were very similar before colonial times. Districts borders did actually not exist in pre-colonial era and were created at the beginning of French colonial rule. The most part are natural borders (rivers), some are simply straight lines between two points. The aim of colonial power was to build districts that represented approximately a similar charge for French administrators, either in terms of population or in terms of area: colonies annual political reports15 give evidence that the definition of districts borders was often a matter of administrative charges rather than a matter of intrinsic characteristics. Colonial power also divided some communities into different districts to have a greater control on it. Districts administrators’ annual reports relate many cases of unrest at the borders due to the fact that people continued to ignore it and went here and there without worrying about colonial administrative rules. Pre-colonial kingdoms’ borders have been ignored, as well as ethnic differences. This fact is clearly evident on colonial districts maps: these maps indicate precisely the ethnic groups present in each district, and we can see that an ethnic group was often present on both sides of districts borders. Districts borders are thus at least partly exogenous. This leads me to assume that neighbour districts share similar unobservable characteristics. This assumption can be interpreted as the fact that unobservable characteristics are geographically distributed and that districts borders were sufficiently exogenous to make differences between neighbour districts’ unobservable characteristics not significant. Banerjee & Iyer (2005) also use this assumption. But they derive a different empirical strategy using a sub-sample of neighbour districts to check if OLS results are driven by omitted variables. They argue that restricting the sample to those districts which happen to be geographical neighbours with a different colonial treatment allow controlling for possible omitted variables. But in the case of a continuous treatment (like colonial investments), using a sub-sample of neighbouring districts is not sufficient to control for omitted variables: in presence of a “low-middle peer” (one district received a “low” treatment whereas its neighbour received a “middle” treatment) and a “middle-high peer” (one district received a “middle”
15 These annual political reports can be refered to at Paris National Archives.
19
treatment whereas its neighbour received a “high” treatment), results might be driven by the difference between the low and the high districts which are not neighbours. Bias due to omitted variables is thus not corrected. There is another difference between existing neighbourhood effects framework and the method employed in this paper: neighbourhoods are not disjointed. As each district is either a neighbour or a neighbour of a neighbour or a neighbour of a neighbour of a neighbour, etc. of any other district, assuming that all neighbour districts share similar unobservable characteristics would imply that all districts share similar characteristics. In order to avoid this problem, I cluster neighbour districts three by three and assume that neighbour districts within each cluster share similar unobservable characteristics but not necessarily neighbour districts of distinct clusters. Districts map is thus divided in disjointed districts clusters which can be interpreted as “pertinent” neighbourhoods, in the sense that neighbourhood effects are sensitive within but not between clusters. I thus suppose that current outcomes of district i belonging to neighbourhood j can be written as a linear function of its colonial investments CIi and OCIi, its intrinsic characteristics Xi and Di, and a neighbourhood effect θj:
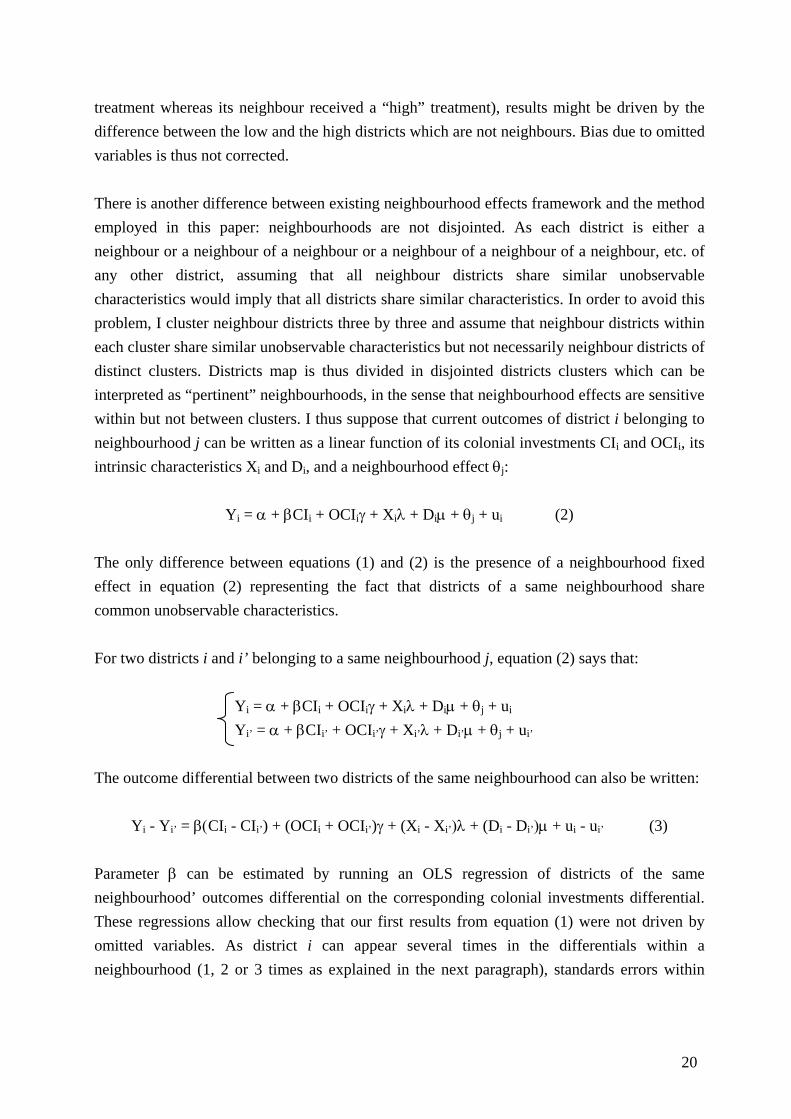
Yi = α + βCIi + OCIiγ + Xiλ + Diµ + θj + ui (2) The only difference between equations (1) and (2) is the presence of a neighbourhood fixed effect in equation (2) representing the fact that districts of a same neighbourhood share common unobservable characteristics. For two districts i and i’ belonging to a same neighbourhood j, equation (2) says that:
Yi = α + βCIi + OCIiγ + Xiλ + Diµ + θj + ui Yi’ = α + βCIi’ + OCIi’γ + Xi’λ + Di’µ + θj + ui’
The outcome differential between two districts of the same neighbourhood can also be written:
Yi - Yi’ = β(CIi - CIi’) + (OCIi + OCIi’)γ + (Xi - Xi’)λ + (Di - Di’)µ + ui - ui’ (3) Parameter β can be estimated by running an OLS regression of districts of the same neighbourhood’ outcomes differential on the corresponding colonial investments differential. These regressions allow checking that our first results from equation (1) were not driven by omitted variables. As district i can appear several times in the differentials within a neighbourhood (1, 2 or 3 times as explained in the next paragraph), standards errors within
20
neighbourhoods are not independent. Standard errors are thus adjusted for clustering at the neighbourhood level. The last methodological issue is that the “true” pertinent neighbourhoods are not known. I thus estimate equation (3) for 50 random neighbourhood designs obtained by randomly assigning to each district two of its neighbour districts. This method potentially keeps some districts out of any neighbourhood (if all their neighbour districts already belong to a neighbourhood). In this case, I randomly assign to the remaining district one of its neighbours’ neighbourhood. The resulting neighbourhoods thus contain 3 or 4 neighbour districts. I constitute for each neighbourhood design a data set containing neighbour districts’ differentials. In order to avoid redundant observations, I keep 2 differentials for 3-districts neighbourhoods and 3 differentials for 4-districts neighbourhoods. This produces samples of districts differentials counting between 65 and 80 observations, with a mean size of 71 observations. For each of the 50 neighbourhood designs, equation (3)’s estimation provides estimates of β and γ. Since OLS estimators are normally distributed and unbiased, the empirical mean of the 50 estimates is a
unbiased and convergent estimator of coefficient in equation (3) and ( 5049
× the empirical
standard deviation of these 50 estimates) is a unbiased estimator of the standard deviation of coefficient in equation (3) (see proof in Appendix). I thus can use the empirical mean of the 50 estimates of β (respectively γ) as an estimate of β (respectively γ) and the empirical standard deviation of the 50 estimates of β (respectively γ) as an estimate of the standard deviation of β (respectively γ).
21
5. Results 5.1. OLS estimates Table 4 reports results on the impact of colonial investments on current educational performances. Districts which received more investments in education over 1907-1930 have today a significantly higher school attendance, all other investments and observable characteristics being equal. The size of the impact of colonial investments in education is important: a one standard deviation increase in the number of teachers over 1907-1930 would have produced a 1.52 standard deviations increase in current districts school attendance rate. OLS results also show that colonial investments in health and in infrastructures did not have per se an impact on current school attendance. Table 5 reports results on the impact of colonial investments on current health performances. Districts which received more investments in health over 1907-1930 have today a significantly lower rate of stunting children, all other investments and observable characteristics being equal. A one standard deviation increase in the number of doctors over 1907-1930 would have produced a 1.23 standard deviations fall in districts stunting children rate, whereas colonial investments in education and in infrastructures did not have any additional impact on health performances. Finally, tables 6, 7 and 8 report results on the impact of colonial investments on infrastructures development. Districts which received more investments in public works over 1907-1930 have today significantly more infrastructures (note that in electricity equipment rate’ regression the coefficient on colonial public works is not significant when other colonial investments are included). The size of the estimated impact of colonial investments in infrastructures is particularly important: a one standard deviation increase in colonial public works would have produced an 8.2 standard deviations increase in districts water tap equipment rate and a 10.55 standard deviations increase in districts modern combustible using rate. The size of these impacts might yet be lower than estimated here because large-scale public works financed on federal resources are not included in districts’ amount of annual public works variable, producing an undervaluation of spatial colonial discriminations: actual inequalities in colonial investments in infrastructures were probably bigger than measured here (see section 3). In this case, the “true” causal impact of colonial investment in infrastructures is lower than measured here. Besides, colonial investments in health had also a positive impact on access to infrastructures, possibly because doctors played an informative role on medical benefits of electricity, water tap and modern combustible use.
22
We can finally notice that the geographical, pre-colonial and colonial characteristics observed in this paper explain between 60% and 80% of current districts’ performances. Colonial investments alone explain 12% of current stunting rate, 32% of current school attendance rate, and around 40% of current electricity, water tap and modern combustible equipment rates (R2 calculated without the outliers in the sample). 5.2. Matching estimates Table 9 show the results of regressing the difference in current performances between neighbour districts of a same neighbourhood on the corresponding difference in colonial investments and other observable characteristics. They are close to those obtained in tables 4 to 8. Previous significant impacts of colonial investments on current performances are still significant but slightly lower, what indicates that naïve estimates were a little upward biased but not driven by unobservable characteristics shared by neighbour districts. Reassuringly, the fall in the sample size (one third less on average) does not affect the results. The impact of colonial investments in infrastructures on current school attendance, which was not significant in the naïve regression, is now significantly positive in the matching specification. These regressions also indicate that the geographical, pre-colonial and colonial characteristics observed in this paper explain between 50% and 80% of the differences in current performances between neighbour districts. The colonial investments in public goods seem thus to have played a strong discriminating role among West African districts. These results are particularly interesting since they concern the early colonial investments. 60 years later, the variation in colonial public investments is still sensitive. Another interesting result is that despite a long time passed, all colonial investments are not equivalent: each colonial investment had a specific impact on the corresponding current performances, all other investments being equal, in addition to which I find “cross-impacts” of colonial investments in infrastructures on education and of colonial investments in health on electricity, water tap and modern combustible equipment. These effects are large since a one standard deviation increase in the number of teachers over 1907-1930 would have produced a 1.2 standard deviations increase in the 1990’s school attendance rate, a one standard deviation increase in the number of doctors over 1907-1930 would have produced a 1.35 standard deviations fall in the 1990’s stunting children rate and a between 0.3 and 0.6 standard deviations increase in the electricity, water tap and modern combustible equipment rate, and finally a one standard deviation increase in the amount of public works over 1907-1930 would have produced a 10.3 standard deviations increase in the 1990’s school attendance rate, a 5.5 standard deviations increase in the water tap equipment rate and a 9.4 standard deviations increase in the modern combustible use rate.
23
6. Why do colonial public investments still matter? In this section, I just want to list some potential answers, postponing to another paper any discussion of the empirical plausibility of these answers. I see actually two main potential answers. The first potential answer is path-dependence, according to a dynamic vision of economic evolution very different from the neo-classical economics tradition which in its simplest form assumed that only a single outcome could possibly be reached, regardless of initial conditions or transitory events. With path dependence, both the starting point and accidental events can have significant effects on the ultimate outcome. The underlying idea is that some random events can disrupt the ongoing course with irreversible consequences. In the case of colonial experience in West Africa, there may not have been any particular reason to prefer one place to another before the investments developed, but as they have become concentrated in one place any new entrants elsewhere could have been at a disadvantage, and therefore tended to move into the hub if possible, further increasing its relative efficiency. The mechanism at work is a “virtuous cycles” effect which can explain why the small but early advantage gained by some districts became larger over time. Path-dependence is thus related to endogenous growth theory discarding the neoclassical assumption of diminishing marginal returns to capital investments. The second potential answer, which is not incompatible with the previous one, is colonial and post-colonial investments policy repetition. Districts administrators between 1930 and 1960 then post-colonial administrators could simply have reproduced the same investments policy. In this case, what I estimate in this paper is the impact of the total sum of public investments since 1907 on current performances rather than the impact of early colonial investments per se. What explain the persistence of colonial investments effects would thus be the persistence of investments themselves. To test empirically these two potential answers to the colonial investments effects’ persistency, data on the interval period are needed. In another work, I thus use colonial data over 1930-1960 to test path-dependence versus pure reproduction hypothesis.
24
7. Conclusion The purpose of this paper was to evaluate long term historical effects on development and the influence of colonial experience in West Africa. The results give evidence that colonial public investments over 1907-1930 have been a strong determinant of current spatial development’s inequalities. The impact of colonial investments in education, health and public works on current regional development in West Africa is statistically significant, positive and sizeable. Moreover, the nature of public investments matters: current educational performances are specifically determined by colonial investments in education, as current health performances by colonial investments in health and current infrastructures’ development by colonial investments in infrastructures and health. Various controls have been introduced to check that the causal effect of colonial public investments on current development is not driven by the fact that the colonial power favoured districts which had already better intrinsic characteristics. This study raises then the question of the sources of the persistence of public policies. To go further, it would be interesting to study the correlation between the public policies before and after 1930: have the spatial inequalities created by the colonial public policies before 1930 been amplified or reduced by the later public policies?
25
References Acemoglu, Daron, Simon Johnson, James A. Robinson, The colonial origins of comparative development: an empirical investigation, 2001, American Economic Review, 91(5), 1369-1401 Acemoglu, Daron, Simon Johnson, Unbundling institutions, 2003, NBER Working Paper No. 9934 Acemoglu, Daron, Simon Johnson, James A. Robinson, Reversal of fortune: Geography and Institutions in the Making of the Modern World Income Distribution,, 2002, Quaterly Journal of Economics, 117, 1231-1294 Amin, Samir, L’Afrique de l’Ouest bloquée, l’économie politique de la colonisation (1880-1970), 1971, Les Editions de Minuit Association des anciens élèves de l’école coloniale, L’administrateur colonial, cet inconnu, 1998, L’Harmattan Bairoch, Paul, Economics and World History, Myths and Paradoxes, 1993, University of Chicago Press Banerjee, Abhijit, Lakshmi Iyer, History, Institutions and Economic Performance: the legacy of colonial tenure systems in India, 2005, American Economic Review, 95(4), 1190-1213 Becker, Charles, Saliou Mbaye, Ibrahima Thioub, AOF, réalités et héritages : sociétés ouest-africaines et ordre colonial, 1895-1960, 1997, Direction des Archives Nationales du Sénégal, Dakar Bertocchi, Graziella, Fabio Canova, Did colonization matter for growth? An empirical exploration into the historical causes of Africa’s underdevelopment, 2001, European Economic Review, 46, 1851-1871 Boahen, A. Adu, L’Afrique sous la domination coloniale : 1885-1935, in Histoire générale de l’Afrique, vol VII, 1990, UNESCO/NEA Bouche, Denise, Histoire de la colonisation française, 1991, Fayard
26
Brown, David S., Democracy, colonization and human capital in sub-saharian Africa, 2000, Studies in Comparative International Development, 35(1) Brunschwig, Henri, Noirs et Blancs dans l’Afrique Noire Française, 1985, Canadian Journal of African Studies, Vol. 19, No. 3, 642-643 Chailley, Marcel, Histoire de l’Afrique Occidentale Française : 1638-1959, 1968, Berger-Levrault, Paris Cogneau, Denis, Colonization, school and development in Africa, an empirical analysis, 2003, DIAL, DT/2003/01 Cogneau, Denis, Charlotte Guénard, Colonization, institutions and inequality, a note on some suggestive evidence, 2003, DIAL, DT/2003/05 Cohen, William B., Empereurs sans sceptre, histoire des administrateurs de la France d’Outre-mer et de l’Ecole coloniale, 1974, Berger-Levrault, Paris Colombani, Olivier, Mémoires coloniales, la fin de l’Empire français d’Afrique vu par les administrateurs coloniaux, 1991, La Découverte, Paris Coquery-Vidrovitch, Catherine, L’Afrique Occidentale au temps des français : colonisateurs et colonisés, 1860-1960, 1992, La Découverte, Paris Coquery-Vidrovitch, Catherine, Henri Moniot, L’Afrique Noire de 1800 à nos jours, 1993, PUF Crowder, Michael, West Africa under colonial rule, 1968, Northern University Press Crowder, Michael, West African resistance, the military response to colonial occupation, 1971, Hutchinson of London, London Crowder, Mickael, Obaro Ikime, West African chiefs : their changing status under colonial rule and independence, 1970, Africana Publications, New York Curtin, Philip, Steven Feierman, Leonard Thompson, Jan Vansina, African history from earliest times to independence, 1995, Longman
27
Delavignette, Robert, Les vrais chefs de l’Empire, 1939, Gallimard Deloncle Pierre, Afrique Occidentale Française: Découverte, Pacification, Mise en Valeur, 1934, éditions Ernest Leroux, Paris Dimier, Véronique, Le discours idéologique de la méthode coloniale chez les français et les britanniques de l’entre-deux guerres à la décolonisation, 1998, Centre d’étude d’Afrique Noire, IEP de Bordeaux, DT No. 58-59 Duboc (Général), L’épopée coloniale en Afrique Occidentale Française, 1939, E. Malfère, Paris Duchamps, Hubert, Roi de la brousse, 1975, Berger-Levrault, Nancy Engerman, Stanley L. & Kenneth L. Sokoloff, Factor Endowments, Inequality and Paths of Development Among New World Economies, NBER Working Paper No. 9259 Engelbert, Pierre, Pre-colonial Institutions, Post-colonial States and Economic Development in Tropical Africa, 2000, Political Research Quaterly, 53, 1-30. Ferro, Marc, Le livre noir du colonialisme, XVIè-XXIè siècle : de l’extermination à la repentance, Robert Laffont Frankema E.H.P., The colonial origins of inequality: exploring the causes and consequences of land distribution, 2005, Ibero America Institute for Econ. Research (IAI) Discussion Papers No. 119 Gennaioli, Nicola and Rainer, Ilia, The Modern Impact of Precolonial Centralization in Africa, November 2005 Grier, Robin, Colonial legacies and economic growth, 1999, Public Choice, 98, 317-335 Hall, Robert E., Charles I. Jones, Why do some countries produce so much more output per worker than others?, 1999, Quarterly Journal of Economics, Vol. 114, No. 1, 83-116 Herbst, Jeffrey, States and power in africa, 2000, Princeton University Press, Princeton
28
Hoff, Karla, Paths of institutional development: a view from economic history, 2003, The World Bank Research Observer, Oxford University Press Iyer Lakshmi, The long-term impact of colonial rule: evidence from India, 2005, Harvard University, Harvard Business Scholl Working Paper No. 05-041 Kaufmann, Daniel, Art Kraay, Pablo Zoido-Lobaton, Governance Matters, 1999, World Bank Policy Research Working Paper No. 2196 Ki-Zerbo, Joseph, Histoire de l’Afrique Noire, d’Hier à Demain, 1978, Hatier, Paris Landes, David, The wealth and poverty of nations: why are some so rich and some so poor?, 1998, W. W. Norton & Company La Porta, Raphael, Florencio Lopez-De Silanes, Andrei Schleifer, Robert Vishny, The quality of government, 1999, Journal of Law, Economic, and Organisation, 15, 222-279 Lombard J., Autorités traditionnelles et pouvoirs européens en Afrique Noire, le déclin d’une aristocratie sous le régime colonial, 1967, Colin, Paris Marseille, Jacques, Empire colonial et capitalisme français, in La France d’outre-mer, un siècle de relations monétaires et financières, 1998, CHEFF Miguel, Edward, Tribe or nation? Nation-building and public goods in Kenya versus Tanzania, 2004, World Politics, Volume 56, Number 3, 327-362 Perrot, Claude-Hélène, François-Xavier Fauvelle-Aymar, Le retour des rois, les autorités traditionnelles et l’Etat en Afrique contemporaine, 2003, Karthala Quy Toan Do, Lakshmi Iyer, Lands right and economic development: evidence from Viet Nam, 2002, World Bank Policy Research Working Paper No. 3120 Rodrik, Dani, Arvind Subramanian, Francesco Trebbi, Institutions rule: the primacy of institutions over geography and integration in economic development, 2002, Harvard Sokoloff, Kenneth L. & Stanley L. Engermann (2000), History Lessons: Institutions, Factor Endowments, and Paths of Development in the New World, Journal of Economic Perspectives, 14, 217-232
29
Appendix: estimation of regression coefficients’ value and variance in case of random sampling If y = a + bx + e is a linear regression model, the ordinary least squares estimator of b, noted
, is assumed to fulfil the following property: b$
2( , )b
b N b σ→ $$ (1)
In the case of 50 independent estimations of the model with 50 random samples, every ordinary least squares estimators of b fulfil the property (1):
[ ] 21,50 , ( , )i bi b N b σ∀ ∈ → $
$ (2)
1) The empirical mean of ( ) is an unbiased and convergent estimator of b ib$
The empirical mean of ( ) is ib$
50
1
50
ii
b=∑ $
, noted b$ .
As ( ) is an independent vector, the weak law of large numbers applies. ib$
Then
50
1
50
ii
b=∑ $
is an unbiased and convergent estimator of b.
2) 5049
× the empirical variance of ( ) is an unbiased estimator of ib$ 2b
σ $ :
The empirical variance of ( ) isib$( )50 2
1
50
ii
b b=
−∑ $ $
.
Using the facts that ( )iE b b=$ , ( )E b b=$ , ( ) 2i b
V b σ= $$ and that ( ) is an independent vector,
the expected value of the empirical variance of ( ) can be calculated as follows:
ib$
ib$
30
( ) ( )50 2
50 21
1
150 50
ii
ii
b bE E b b=
=
⎛ ⎞−⎜ ⎟ ⎛ ⎞⎜ ⎟ = × −⎜ ⎟⎜ ⎟ ⎝ ⎠
⎜ ⎟⎝ ⎠
∑∑
$ $
$ $
( ) ( )( )( ) ( ) ( )( )( ) ( ) ( )( )( )( ) ( ) ( )( )( )
( ) ( )( )( )
250
1
50 22
1
50 22
1
50
1
502
1
2
150
1 250
1 2501 2501 2 ,501 250
ii
i ii
i ii
i ii
ibi
b
E b b b b
E b b b b b b b b
E b b E b b E b b b b
V b V b E b b b b
V b COV b b b b
V b C
σ
σ
=
=
=
=
=
⎛ ⎞= × − − −⎜ ⎟
⎝ ⎠⎛ ⎞= × − + − − − −⎜ ⎟⎝ ⎠
⎛ ⎞= × − + − − − −⎜ ⎟⎝ ⎠
⎛ ⎞= × + − − −⎜ ⎟⎝ ⎠
= × + − − −
= × + −
∑
∑
∑
∑
∑ $
$
$ $
$ $ $ $
$ $ $ $
$ $ $ $
$ $ $
$ ( )( )
( ) ( )
50
1
50 50
501 12
1
50 502
21 1
50 502 2 2
21 1
2 2
,
1 2 ,50 50 50
1 1 250 50 50
1 1 250 50 50
150
ii
j jj j
ibi
j jbi j
b b bi j
b b
OV b b
b bV COV b
V b V b
σ
σ
σ σ σ
σ σ
=
= =
=
= =
= =
⎛ ⎞⎛ ⎞ ⎛ ⎞⎜ ⎟⎜ ⎟ ⎜ ⎟⎜ ⎟⎜ ⎟ ⎜ ⎟= × + −⎜ ⎟⎜ ⎟ ⎜ ⎟⎜ ⎟⎜ ⎟ ⎜ ⎟
⎝ ⎠ ⎝ ⎠⎝ ⎠⎛ ⎞
= × + −⎜ ⎟⎝ ⎠⎛ ⎞
= × + −⎜ ⎟⎝ ⎠
= + ×
∑
∑ ∑∑
∑ ∑
∑ ∑
$
$
$ $ $
$ $
$ $
$ $
$
$ $
2
2
250
4950
b
b
σ
σ
−
=
$
$
The conclusion is then that ( )50 2
1
49
ii
b b=
−∑ $ $
is an unbiased estimator of 2b
σ $ .
31
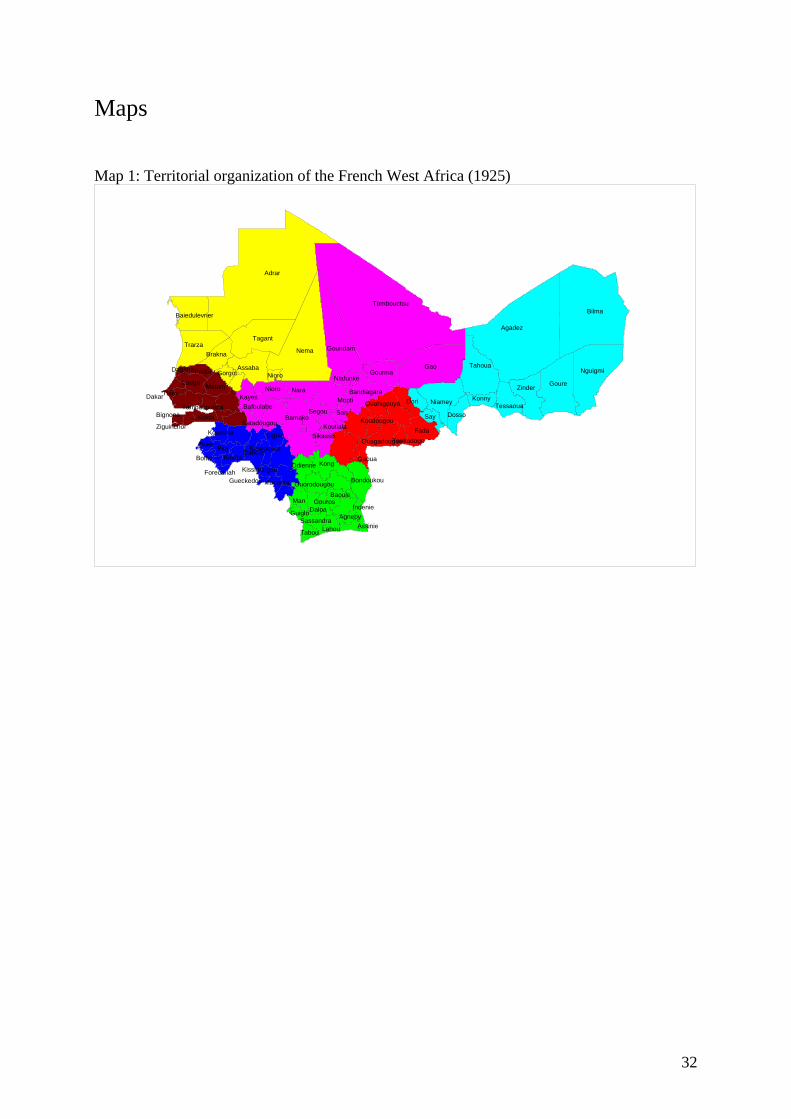
Maps Map 1: Territorial organization of the French West Africa (1925)
Boffa Kindia
Forecariah Kissidougou
DabolaKouroussa
Gueckedou OuorodougouMacenta
Odienne
Guiglo
Gouros
Dori
SayKoudougou
Assinie
Indenie
LahouSassandra
Daloa
Baoule
Bondoukou
Satadougou
TambacoundaKolda
Kong
MatamKayes
Ziguinchor
Bignona
DakarThies
KoutialaSikasso
Segou
Gaoua
OuagadougouTenkodogo
DossoTessaoua
Zinder
Nema Goundam
Baiedulevrier
Trarza
Dagana
Bandiagara
Niafunke
Mopti
Nguigmi
Fada
Ouahigouya
Agneby
Man
Tabou
Boke
Koumbia
Pita
Siguiri
Adrar
Assaba
Brakna
Gorgol Nioro
Tagant
Bafoulabe
Bamako
GaoGourma
NaraNioro
San
Tombouctou
Agadez
Bilma
Goure
KonnyNiamey
Tahoua
LougaPodor
32
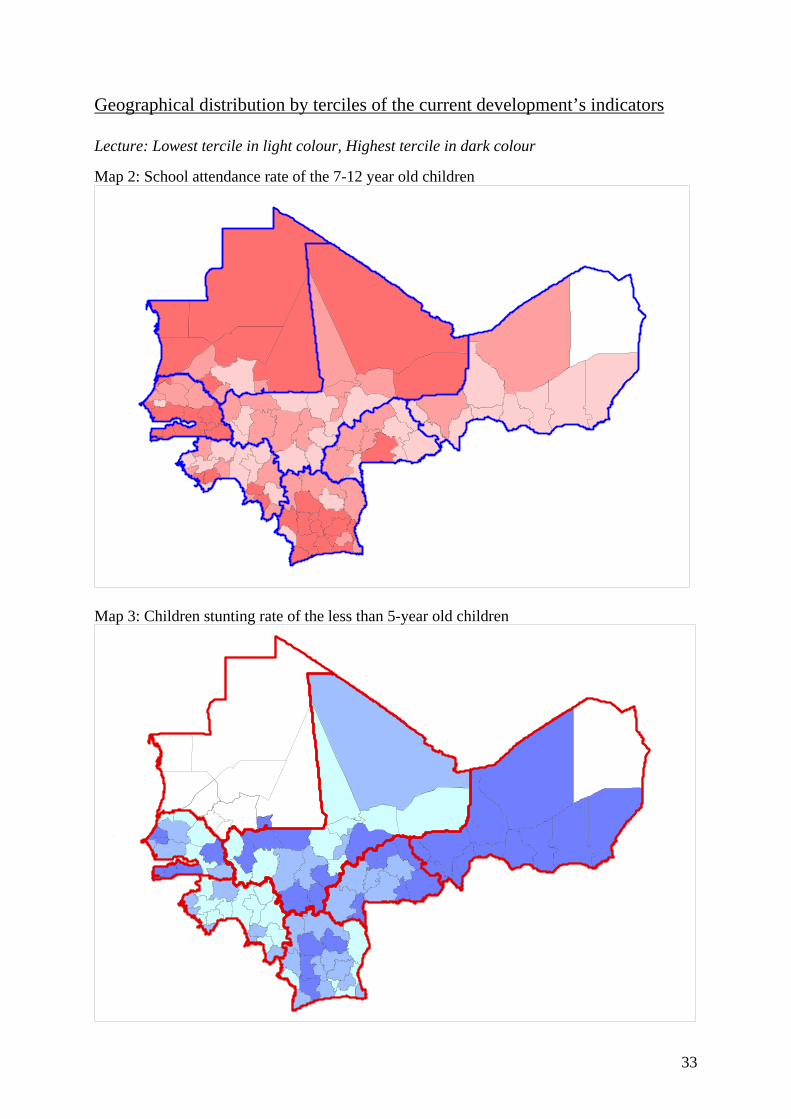
Geographical distribution by terciles of the current development’s indicators Lecture: Lowest tercile in light colour, Highest tercile in dark colour Map 2: School attendance rate of the 7-12 year old children
Map 3: Children stunting rate of the less than 5-year old children
33
Map 4: Share of the households equipped with electrical supplies
Map 5: Share of the households equipped with private water tap
Map 6: Share of the households using a modern combustible
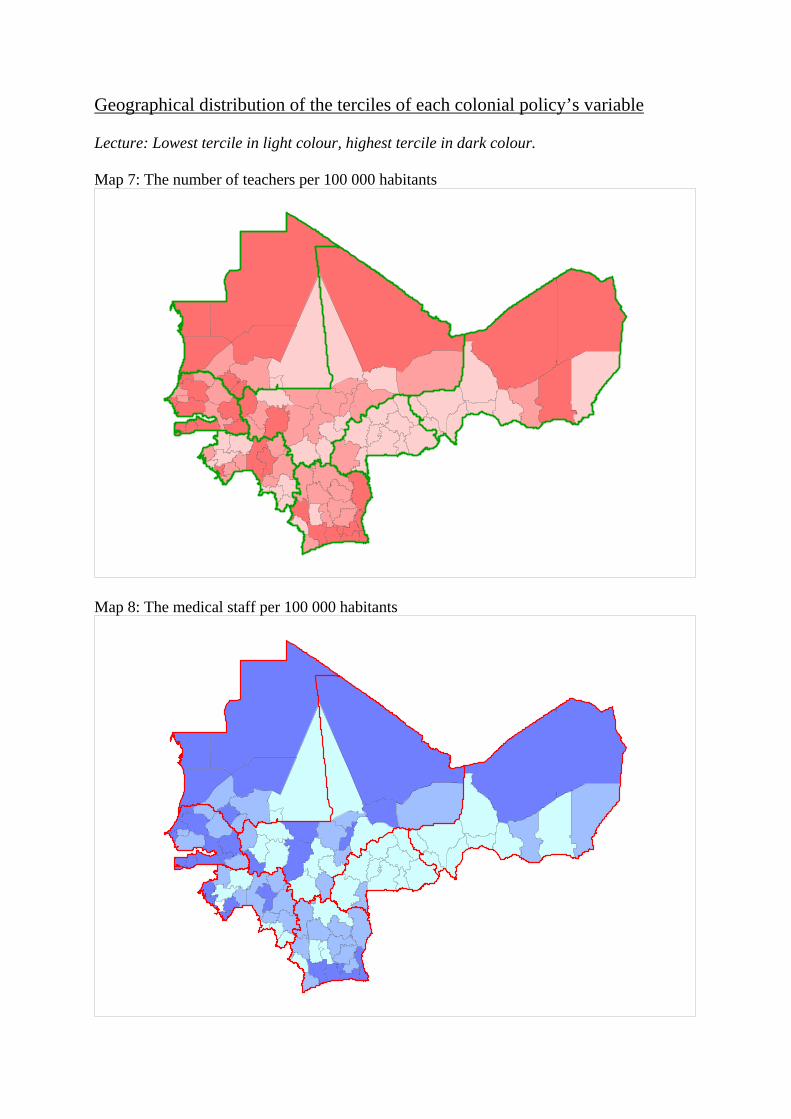
Geographical distribution of the terciles of each colonial policy’s variable Lecture: Lowest tercile in light colour, highest tercile in dark colour. Map 7: The number of teachers per 100 000 habitants
Map 8: The medical staff per 100 000 habitants
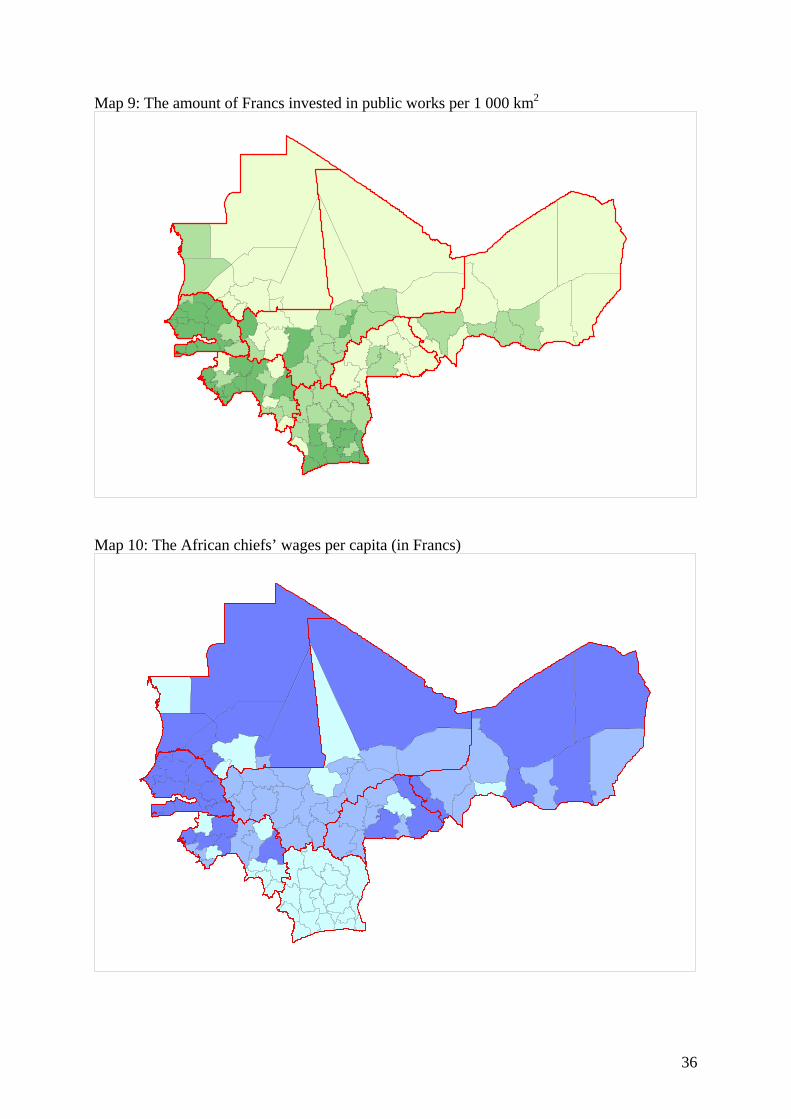
Map 9: The amount of Francs invested in public works per 1 000 km2
Map 10: The African chiefs’ wages per capita (in Francs)
36
The observable characteristics of the districts
Source: Atlas des Peuples d’Afrique, Jean Selllier, Ed. La Découverte, Paris, 2003, p.104.
37
Map 11: Pre-colonial empires and kingdoms
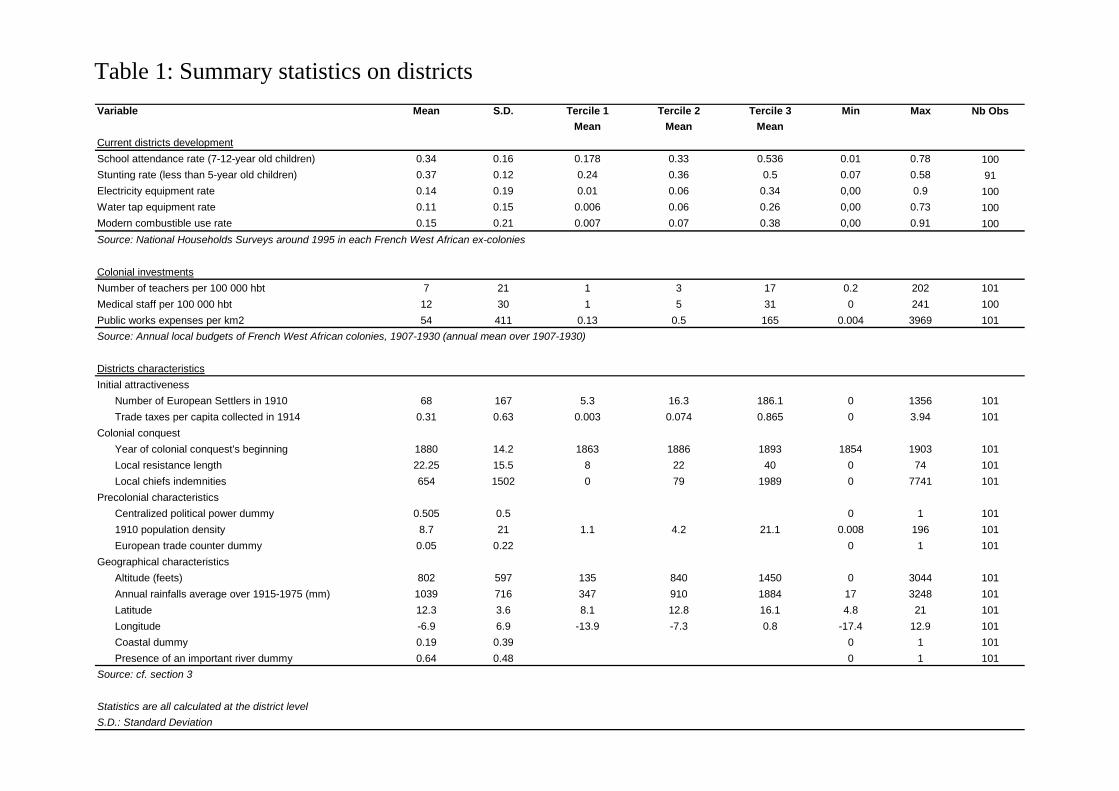
Table 1: Summary statistics on districts Variable Mean S.D. Tercile 1 Tercile 2 Tercile 3 Min Max Nb Obs
Mean Mean MeanCurrent districts developmentSchool attendance rate (7-12-year old children) 0.34 0.16 0.178 0.33 0.536 0.01 0.78 100Stunting rate (less than 5-year old children) 0.37 0.12 0.24 0.36 0.5 0.07 0.58 91Electricity equipment rate 0.14 0.19 0.01 0.06 0.34 0,00 0.9 100Water tap equipment rate 0.11 0.15 0.006 0.06 0.26 0,00 0.73 100Modern combustible use rate 0.15 0.21 0.007 0.07 0.38 0,00 0.91 100Source: National Households Surveys around 1995 in each French West African ex-colonies
Colonial investmentsNumber of teachers per 100 000 hbt 7 21 1 3 17 0.2 202 101Medical staff per 100 000 hbt 12 30 1 5 31 0 241 100Public works expenses per km2 54 411 0.13 0.5 165 0.004 3969 101Source: Annual local budgets of French West African colonies, 1907-1930 (annual mean over 1907-1930)
Districts characteristicsInitial attractiveness Number of European Settlers in 1910 68 167 5.3 16.3 186.1 0 1356 101 Trade taxes per capita collected in 1914 0.31 0.63 0.003 0.074 0.865 0 3.94 101Colonial conquest Year of colonial conquest's beginning 1880 14.2 1863 1886 1893 1854 1903 101 Local resistance length 22.25 15.5 8 22 40 0 74 101 Local chiefs indemnities 654 1502 0 79 1989 0 7741 101Precolonial characteristics Centralized political power dummy 0.505 0.5 0 1 101 1910 population density 8.7 21 1.1 4.2 21.1 0.008 196 101 European trade counter dummy 0.05 0.22 0 1 101Geographical characteristics Altitude (feets) 802 597 135 840 1450 0 3044 101 Annual rainfalls average over 1915-1975 (mm) 1039 716 347 910 1884 17 3248 101 Latitude 12.3 3.6 8.1 12.8 16.1 4.8 21 101 Longitude -6.9 6.9 -13.9 -7.3 0.8 -17.4 12.9 101 Coastal dummy 0.19 0.39 0 1 101 Presence of an important river dummy 0.64 0.48 0 1 101Source: cf. section 3
Statistics are all calculated at the district levelS.D.: Standard Deviation
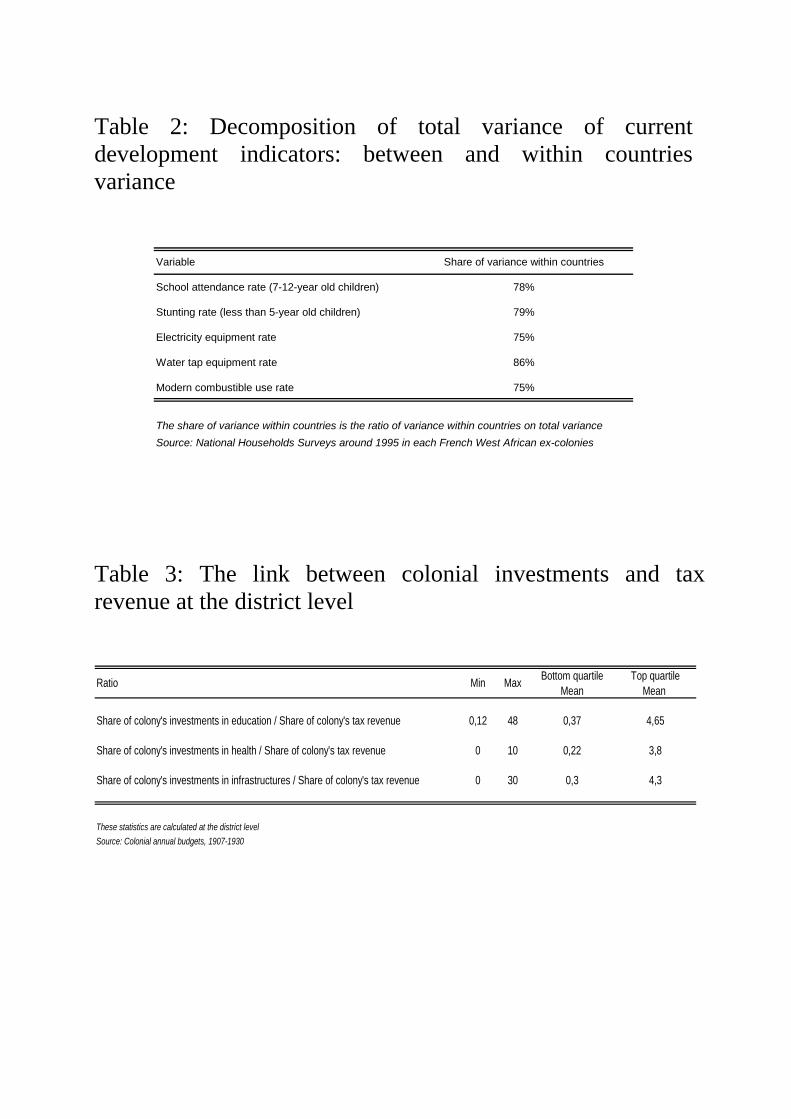
Table 2: Decomposition of total variance of current development indicators: between and within countries variance
Variable Share of variance within countries
School attendance rate (7-12-year old children) 78%
Stunting rate (less than 5-year old children) 79%
Electricity equipment rate 75%
Water tap equipment rate 86%
Modern combustible use rate 75%
The share of variance within countries is the ratio of variance within countries on total varianceSource: National Households Surveys around 1995 in each French West African ex-colonies
Table 3: The link between colonial investments and tax revenue at the district level
Bottom quartile Top quartileMean Mean
Share of colony's investments in education / Share of colony's tax revenue 0,12 48 0,37 4,65
Share of colony's investments in health / Share of colony's tax revenue 0 10 0,22 3,8
Share of colony's investments in infrastructures / Share of colony's tax revenue 0 30 0,3 4,3
These statistics are calculated at the district levelSource: Colonial annual budgets, 1907-1930
Ratio Min Max
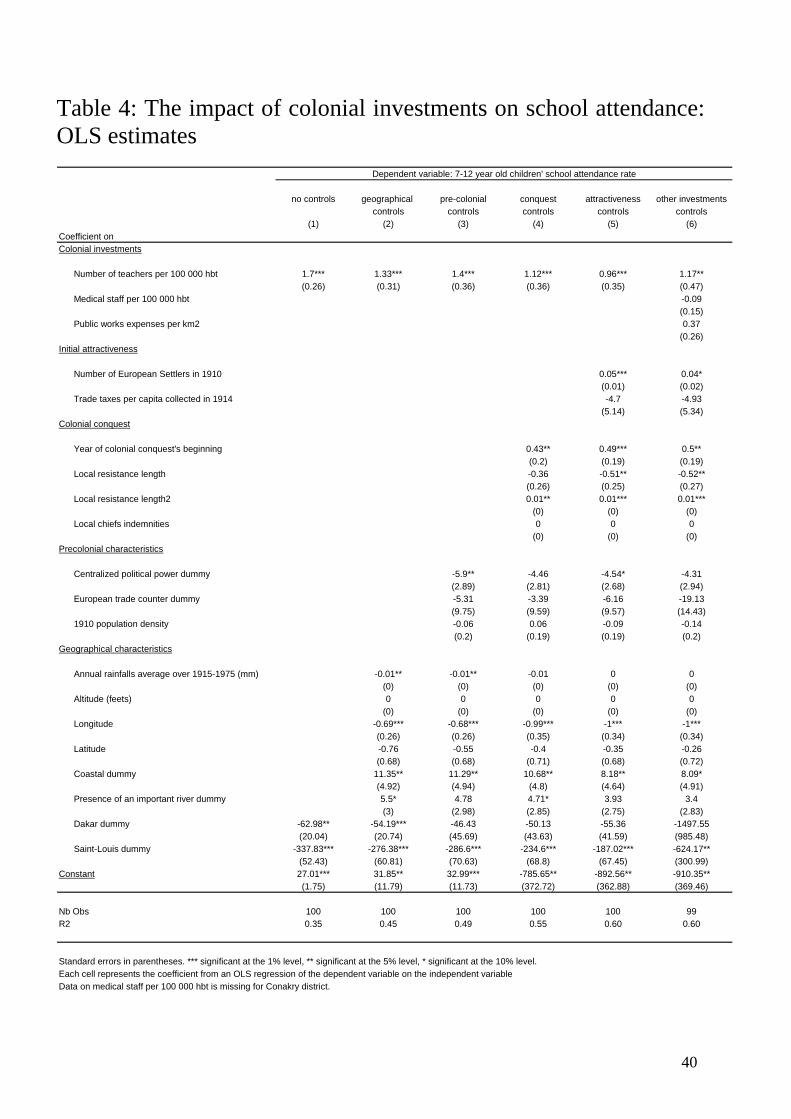
Table 4: The impact of colonial investments on school attendance: OLS estimates
no controls geographical pre-colonial conquest attractiveness other investmentscontrols controls controls controls controls
(1) (2) (3) (4) (5) (6)Coefficient onColonial investments
Number of teachers per 100 000 hbt 1.7*** 1.33*** 1.4*** 1.12*** 0.96*** 1.17**(0.26) (0.31) (0.36) (0.36) (0.35) (0.47)
Medical staff per 100 000 hbt -0.09(0.15)
Public works expenses per km2 0.37(0.26)
Initial attractiveness
Number of European Settlers in 1910 0.05*** 0.04*(0.01) (0.02)
Trade taxes per capita collected in 1914 -4.7 -4.93(5.14) (5.34)
Colonial conquest
Year of colonial conquest's beginning 0.43** 0.49*** 0.5**(0.2) (0.19) (0.19)
Local resistance length -0.36 -0.51** -0.52**(0.26) (0.25) (0.27)
Local resistance length2 0.01** 0.01*** 0.01***(0) (0) (0)
Local chiefs indemnities 0 0 0(0) (0) (0)
Precolonial characteristics
Centralized political power dummy -5.9** -4.46 -4.54* -4.31(2.89) (2.81) (2.68) (2.94)
European trade counter dummy -5.31 -3.39 -6.16 -19.13(9.75) (9.59) (9.57) (14.43)
1910 population density -0.06 0.06 -0.09 -0.14(0.2) (0.19) (0.19) (0.2)
Geographical characteristics
Annual rainfalls average over 1915-1975 (mm) -0.01** -0.01** -0.01 0 0(0) (0) (0) (0) (0)
Altitude (feets) 0 0 0 0 0(0) (0) (0) (0) (0)
Longitude -0.69*** -0.68*** -0.99*** -1*** -1***(0.26) (0.26) (0.35) (0.34) (0.34)
Latitude -0.76 -0.55 -0.4 -0.35 -0.26(0.68) (0.68) (0.71) (0.68) (0.72)
Coastal dummy 11.35** 11.29** 10.68** 8.18** 8.09*(4.92) (4.94) (4.8) (4.64) (4.91)
Presence of an important river dummy 5.5* 4.78 4.71* 3.93 3.4(3) (2.98) (2.85) (2.75) (2.83)
Dakar dummy -62.98** -54.19*** -46.43 -50.13 -55.36 -1497.55(20.04) (20.74) (45.69) (43.63) (41.59) (985.48)
Saint-Louis dummy -337.83*** -276.38*** -286.6*** -234.6*** -187.02*** -624.17**(52.43) (60.81) (70.63) (68.8) (67.45) (300.99)
Constant 27.01*** 31.85** 32.99*** -785.65** -892.56** -910.35**(1.75) (11.79) (11.73) (372.72) (362.88) (369.46)
Nb Obs 100 100 100 100 100 99R2 0.35 0.45 0.49 0.55 0.60 0.60
Standard errors in parentheses. *** significant at the 1% level, ** significant at the 5% level, * significant at the 10% level.Each cell represents the coefficient from an OLS regression of the dependent variable on the independent variableData on medical staff per 100 000 hbt is missing for Conakry district.
Dependent variable: 7-12 year old children' school attendance rate
40
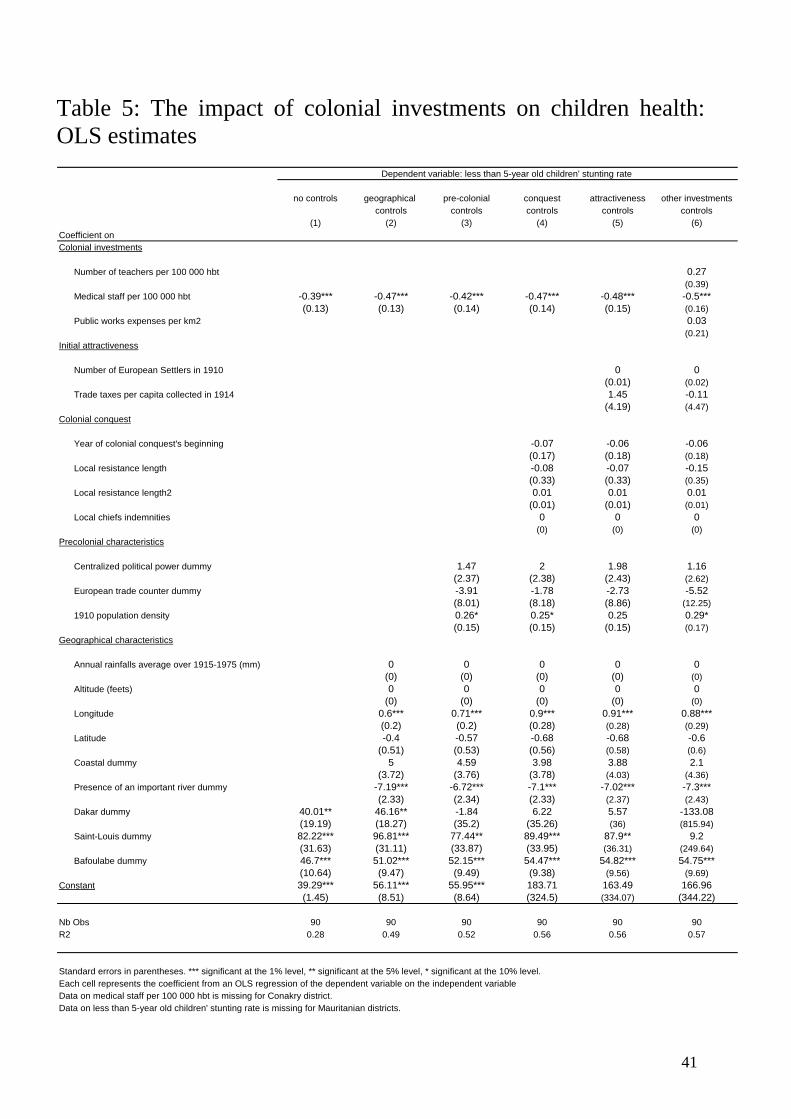
Table 5: The impact of colonial investments on children health: OLS estimates
no controls geographical pre-colonial conquest attractiveness other investmentscontrols controls controls controls controls
(1) (2) (3) (4) (5) (6)Coefficient onColonial investments
Number of teachers per 100 000 hbt 0.27(0.39)
Medical staff per 100 000 hbt -0.39*** -0.47*** -0.42*** -0.47*** -0.48*** -0.5***(0.13) (0.13) (0.14) (0.14) (0.15) (0.16)
Public works expenses per km2 0.03(0.21)
Initial attractiveness
Number of European Settlers in 1910 0 0(0.01) (0.02)
Trade taxes per capita collected in 1914 1.45 -0.11(4.19) (4.47)
Colonial conquest
Year of colonial conquest's beginning -0.07 -0.06 -0.06(0.17) (0.18) (0.18)
Local resistance length -0.08 -0.07 -0.15(0.33) (0.33) (0.35)
Local resistance length2 0.01 0.01 0.01(0.01) (0.01) (0.01)
Local chiefs indemnities 0 0 0(0) (0) (0)
Precolonial characteristics
Centralized political power dummy 1.47 2 1.98 1.16(2.37) (2.38) (2.43) (2.62)
European trade counter dummy -3.91 -1.78 -2.73 -5.52(8.01) (8.18) (8.86) (12.25)
1910 population density 0.26* 0.25* 0.25 0.29*(0.15) (0.15) (0.15) (0.17)
Geographical characteristics
Annual rainfalls average over 1915-1975 (mm) 0 0 0 0 0(0) (0) (0) (0) (0)
Altitude (feets) 0 0 0 0 0(0) (0) (0) (0) (0)
Longitude 0.6*** 0.71*** 0.9*** 0.91*** 0.88***(0.2) (0.2) (0.28) (0.28) (0.29)
Latitude -0.4 -0.57 -0.68 -0.68 -0.6(0.51) (0.53) (0.56) (0.58) (0.6)
Coastal dummy 5 4.59 3.98 3.88 2.1(3.72) (3.76) (3.78) (4.03) (4.36)
Presence of an important river dummy -7.19*** -6.72*** -7.1*** -7.02*** -7.3***(2.33) (2.34) (2.33) (2.37) (2.43)
Dakar dummy 40.01** 46.16** -1.84 6.22 5.57 -133.08(19.19) (18.27) (35.2) (35.26) (36) (815.94)
Saint-Louis dummy 82.22*** 96.81*** 77.44** 89.49*** 87.9** 9.2(31.63) (31.11) (33.87) (33.95) (36.31) (249.64)
Bafoulabe dummy 46.7*** 51.02*** 52.15*** 54.47*** 54.82*** 54.75***(10.64) (9.47) (9.49) (9.38) (9.56) (9.69)
Constant 39.29*** 56.11*** 55.95*** 183.71 163.49 166.96(1.45) (8.51) (8.64) (324.5) (334.07) (344.22)
Nb Obs 90 90 90 90 90 90R2 0.28 0.49 0.52 0.56 0.56 0.57
Standard errors in parentheses. *** significant at the 1% level, ** significant at the 5% level, * significant at the 10% level.Each cell represents the coefficient from an OLS regression of the dependent variable on the independent variableData on medical staff per 100 000 hbt is missing for Conakry district.Data on less than 5-year old children' stunting rate is missing for Mauritanian districts.
Dependent variable: less than 5-year old children' stunting rate
41
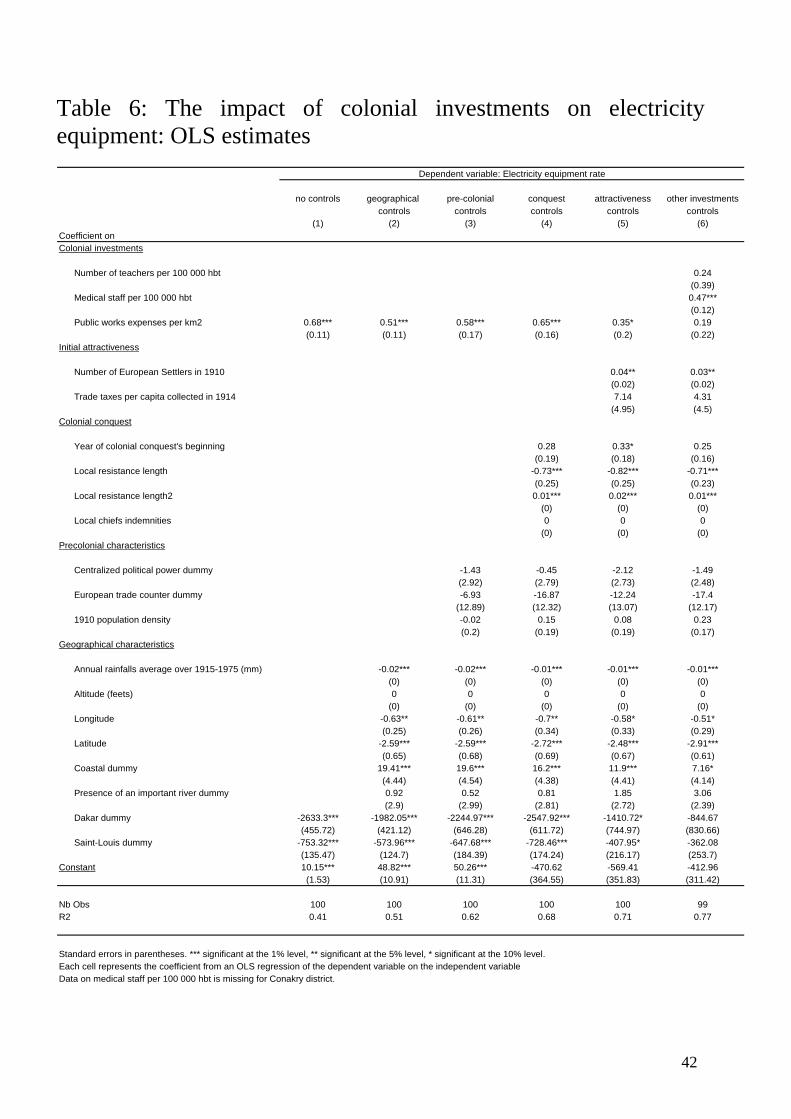
Table 6: The impact of colonial investments on electricity equipment: OLS estimates
no controls geographical pre-colonial conquest attractiveness other investmentscontrols controls controls controls controls
(1) (2) (3) (4) (5) (6)Coefficient onColonial investments
Number of teachers per 100 000 hbt 0.24(0.39)
Medical staff per 100 000 hbt 0.47***(0.12)
Public works expenses per km2 0.68*** 0.51*** 0.58*** 0.65*** 0.35* 0.19(0.11) (0.11) (0.17) (0.16) (0.2) (0.22)
Initial attractiveness
Number of European Settlers in 1910 0.04** 0.03**(0.02) (0.02)
Trade taxes per capita collected in 1914 7.14 4.31(4.95) (4.5)
Colonial conquest
Year of colonial conquest's beginning 0.28 0.33* 0.25(0.19) (0.18) (0.16)
Local resistance length -0.73*** -0.82*** -0.71***(0.25) (0.25) (0.23)
Local resistance length2 0.01*** 0.02*** 0.01***(0) (0) (0)
Local chiefs indemnities 0 0 0(0) (0) (0)
Precolonial characteristics
Centralized political power dummy -1.43 -0.45 -2.12 -1.49(2.92) (2.79) (2.73) (2.48)
European trade counter dummy -6.93 -16.87 -12.24 -17.4(12.89) (12.32) (13.07) (12.17)
1910 population density -0.02 0.15 0.08 0.23(0.2) (0.19) (0.19) (0.17)
Geographical characteristics
Annual rainfalls average over 1915-1975 (mm) -0.02*** -0.02*** -0.01*** -0.01*** -0.01***(0) (0) (0) (0) (0)
Altitude (feets) 0 0 0 0 0(0) (0) (0) (0) (0)
Longitude -0.63** -0.61** -0.7** -0.58* -0.51*(0.25) (0.26) (0.34) (0.33) (0.29)
Latitude -2.59*** -2.59*** -2.72*** -2.48*** -2.91***(0.65) (0.68) (0.69) (0.67) (0.61)
Coastal dummy 19.41*** 19.6*** 16.2*** 11.9*** 7.16*(4.44) (4.54) (4.38) (4.41) (4.14)
Presence of an important river dummy 0.92 0.52 0.81 1.85 3.06(2.9) (2.99) (2.81) (2.72) (2.39)
Dakar dummy -2633.3*** -1982.05*** -2244.97*** -2547.92*** -1410.72* -844.67(455.72) (421.12) (646.28) (611.72) (744.97) (830.66)
Saint-Louis dummy -753.32*** -573.96*** -647.68*** -728.46*** -407.95* -362.08(135.47) (124.7) (184.39) (174.24) (216.17) (253.7)
Constant 10.15*** 48.82*** 50.26*** -470.62 -569.41 -412.96(1.53) (10.91) (11.31) (364.55) (351.83) (311.42)
Nb Obs 100 100 100 100 100 99R2 0.41 0.51 0.62 0.68 0.71 0.77
Standard errors in parentheses. *** significant at the 1% level, ** significant at the 5% level, * significant at the 10% level.Each cell represents the coefficient from an OLS regression of the dependent variable on the independent variableData on medical staff per 100 000 hbt is missing for Conakry district.
Dependent variable: Electricity equipment rate
42
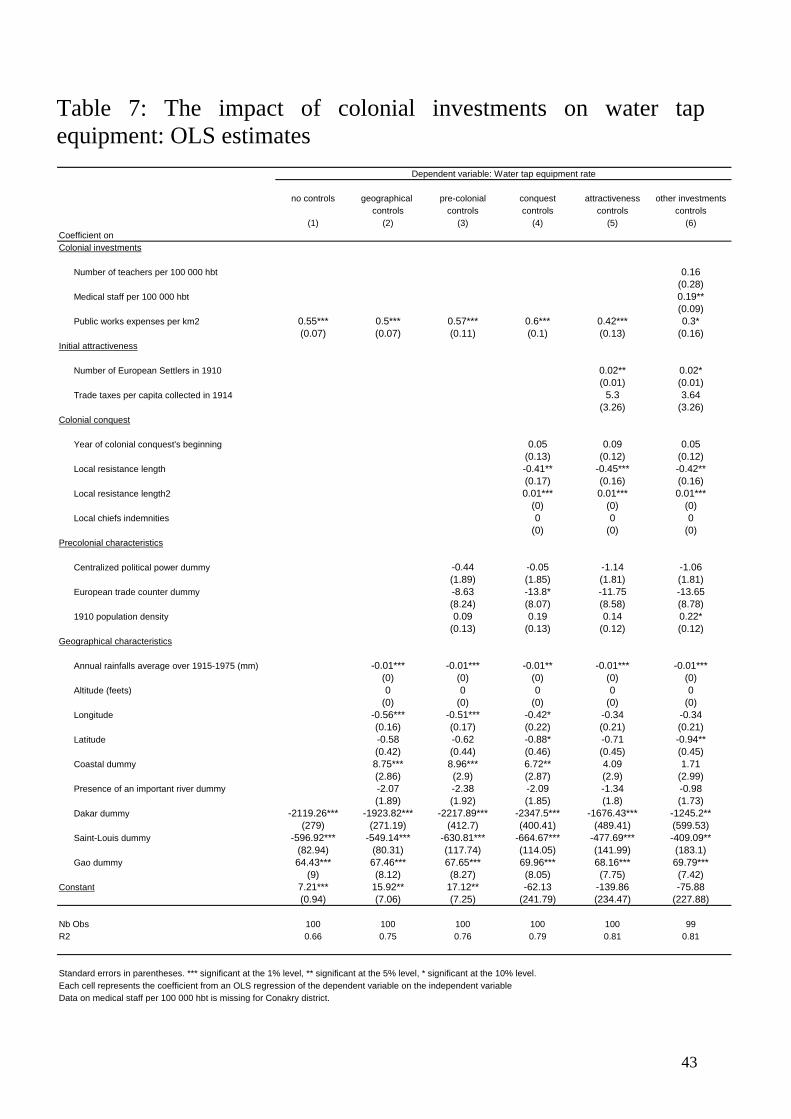
Table 7: The impact of colonial investments on water tap equipment: OLS estimates
no controls geographical pre-colonial conquest attractiveness other investmentscontrols controls controls controls controls
(1) (2) (3) (4) (5) (6)Coefficient onColonial investments
Number of teachers per 100 000 hbt 0.16(0.28)
Medical staff per 100 000 hbt 0.19**(0.09)
Public works expenses per km2 0.55*** 0.5*** 0.57*** 0.6*** 0.42*** 0.3*(0.07) (0.07) (0.11) (0.1) (0.13) (0.16)
Initial attractiveness
Number of European Settlers in 1910 0.02** 0.02*(0.01) (0.01)
Trade taxes per capita collected in 1914 5.3 3.64(3.26) (3.26)
Colonial conquest
Year of colonial conquest's beginning 0.05 0.09 0.05(0.13) (0.12) (0.12)
Local resistance length -0.41** -0.45*** -0.42**(0.17) (0.16) (0.16)
Local resistance length2 0.01*** 0.01*** 0.01***(0) (0) (0)
Local chiefs indemnities 0 0 0(0) (0) (0)
Precolonial characteristics
Centralized political power dummy -0.44 -0.05 -1.14 -1.06(1.89) (1.85) (1.81) (1.81)
European trade counter dummy -8.63 -13.8* -11.75 -13.65(8.24) (8.07) (8.58) (8.78)
1910 population density 0.09 0.19 0.14 0.22*(0.13) (0.13) (0.12) (0.12)
Geographical characteristics
Annual rainfalls average over 1915-1975 (mm) -0.01*** -0.01*** -0.01** -0.01*** -0.01***(0) (0) (0) (0) (0)
Altitude (feets) 0 0 0 0 0(0) (0) (0) (0) (0)
Longitude -0.56*** -0.51*** -0.42* -0.34 -0.34(0.16) (0.17) (0.22) (0.21) (0.21)
Latitude -0.58 -0.62 -0.88* -0.71 -0.94**(0.42) (0.44) (0.46) (0.45) (0.45)
Coastal dummy 8.75*** 8.96*** 6.72** 4.09 1.71(2.86) (2.9) (2.87) (2.9) (2.99)
Presence of an important river dummy -2.07 -2.38 -2.09 -1.34 -0.98(1.89) (1.92) (1.85) (1.8) (1.73)
Dakar dummy -2119.26*** -1923.82*** -2217.89*** -2347.5*** -1676.43*** -1245.2**(279) (271.19) (412.7) (400.41) (489.41) (599.53)
Saint-Louis dummy -596.92*** -549.14*** -630.81*** -664.67*** -477.69*** -409.09**(82.94) (80.31) (117.74) (114.05) (141.99) (183.1)
Gao dummy 64.43*** 67.46*** 67.65*** 69.96*** 68.16*** 69.79***(9) (8.12) (8.27) (8.05) (7.75) (7.42)
Constant 7.21*** 15.92** 17.12** -62.13 -139.86 -75.88(0.94) (7.06) (7.25) (241.79) (234.47) (227.88)
Nb Obs 100 100 100 100 100 99R2 0.66 0.75 0.76 0.79 0.81 0.81
Standard errors in parentheses. *** significant at the 1% level, ** significant at the 5% level, * significant at the 10% level.Each cell represents the coefficient from an OLS regression of the dependent variable on the independent variableData on medical staff per 100 000 hbt is missing for Conakry district.
Dependent variable: Water tap equipment rate
43
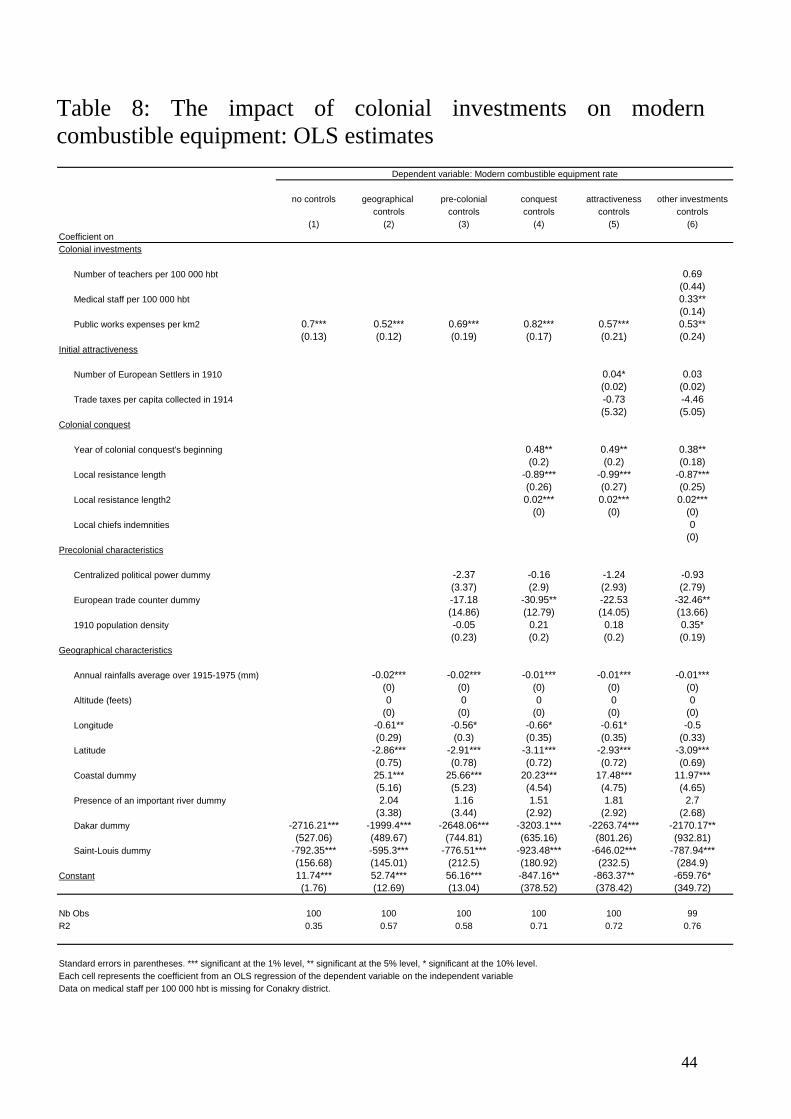
Table 8: The impact of colonial investments on modern combustible equipment: OLS estimates
no controls geographical pre-colonial conquest attractiveness other investmentscontrols controls controls controls controls
(1) (2) (3) (4) (5) (6)Coefficient onColonial investments
Number of teachers per 100 000 hbt 0.69(0.44)
Medical staff per 100 000 hbt 0.33**(0.14)
Public works expenses per km2 0.7*** 0.52*** 0.69*** 0.82*** 0.57*** 0.53**(0.13) (0.12) (0.19) (0.17) (0.21) (0.24)
Initial attractiveness
Number of European Settlers in 1910 0.04* 0.03(0.02) (0.02)
Trade taxes per capita collected in 1914 -0.73 -4.46(5.32) (5.05)
Colonial conquest
Year of colonial conquest's beginning 0.48** 0.49** 0.38**(0.2) (0.2) (0.18)
Local resistance length -0.89*** -0.99*** -0.87***(0.26) (0.27) (0.25)
Local resistance length2 0.02*** 0.02*** 0.02***(0) (0) (0)
Local chiefs indemnities 0(0)
Precolonial characteristics
Centralized political power dummy -2.37 -0.16 -1.24 -0.93(3.37) (2.9) (2.93) (2.79)
European trade counter dummy -17.18 -30.95** -22.53 -32.46**(14.86) (12.79) (14.05) (13.66)
1910 population density -0.05 0.21 0.18 0.35*(0.23) (0.2) (0.2) (0.19)
Geographical characteristics
Annual rainfalls average over 1915-1975 (mm) -0.02*** -0.02*** -0.01*** -0.01*** -0.01***(0) (0) (0) (0) (0)
Altitude (feets) 0 0 0 0 0(0) (0) (0) (0) (0)
Longitude -0.61** -0.56* -0.66* -0.61* -0.5(0.29) (0.3) (0.35) (0.35) (0.33)
Latitude -2.86*** -2.91*** -3.11*** -2.93*** -3.09***(0.75) (0.78) (0.72) (0.72) (0.69)
Coastal dummy 25.1*** 25.66*** 20.23*** 17.48*** 11.97***(5.16) (5.23) (4.54) (4.75) (4.65)
Presence of an important river dummy 2.04 1.16 1.51 1.81 2.7(3.38) (3.44) (2.92) (2.92) (2.68)
Dakar dummy -2716.21*** -1999.4*** -2648.06*** -3203.1*** -2263.74*** -2170.17**(527.06) (489.67) (744.81) (635.16) (801.26) (932.81)
Saint-Louis dummy -792.35*** -595.3*** -776.51*** -923.48*** -646.02*** -787.94***(156.68) (145.01) (212.5) (180.92) (232.5) (284.9)
Constant 11.74*** 52.74*** 56.16*** -847.16** -863.37** -659.76*(1.76) (12.69) (13.04) (378.52) (378.42) (349.72)
Nb Obs 100 100 100 100 100 99R2 0.35 0.57 0.58 0.71 0.72 0.76
Standard errors in parentheses. *** significant at the 1% level, ** significant at the 5% level, * significant at the 10% level.Each cell represents the coefficient from an OLS regression of the dependent variable on the independent variableData on medical staff per 100 000 hbt is missing for Conakry district.
Dependent variable: Modern combustible equipment rate
44
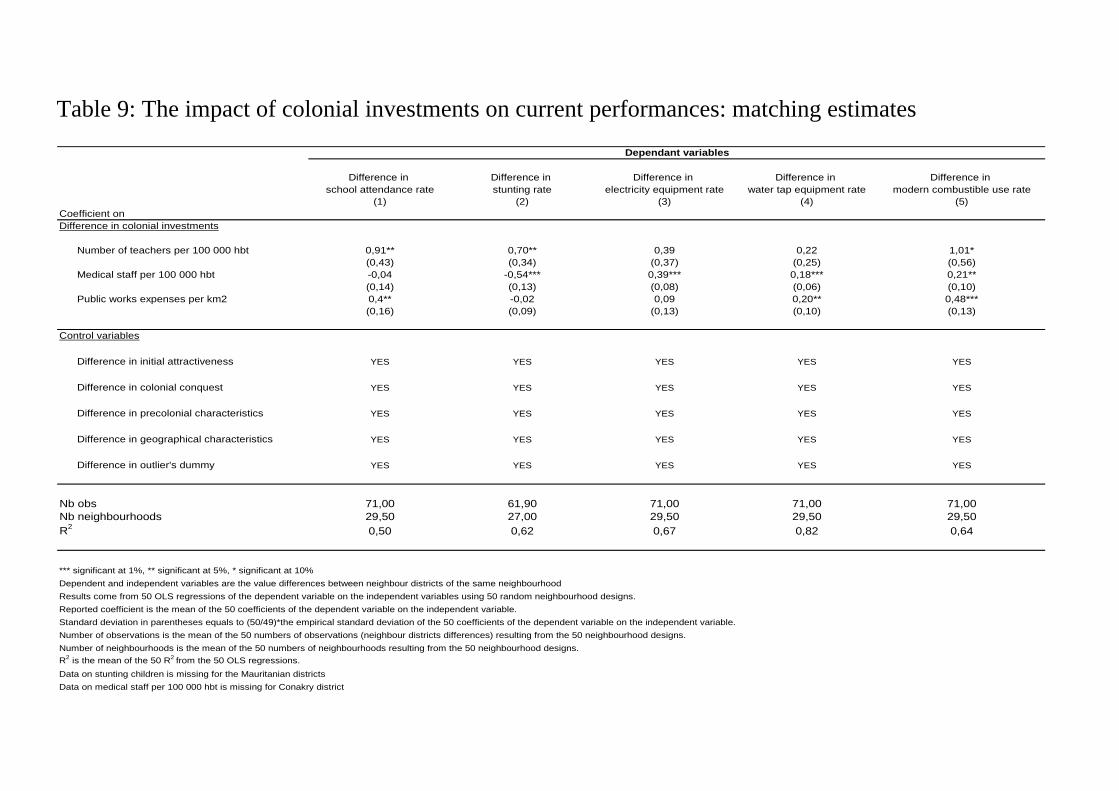
Table 9: The impact of colonial investments on current performances: matching estimates
Difference in Difference in Difference in Difference in Difference in school attendance rate stunting rate electricity equipment rate water tap equipment rate modern combustible use rate
(1) (2) (3) (4) (5)Coefficient onDifference in colonial investments
Number of teachers per 100 000 hbt 0,91** 0,70** 0,39 0,22 1,01*(0,43) (0,34) (0,37) (0,25) (0,56)
Medical staff per 100 000 hbt -0,04 -0,54*** 0,39*** 0,18*** 0,21**(0,14) (0,13) (0,08) (0,06) (0,10)
Public works expenses per km2 0,4** -0,02 0,09 0,20** 0,48***(0,16) (0,09) (0,13) (0,10) (0,13)
Control variables
Difference in initial attractiveness YES YES YES YES YES
Difference in colonial conquest YES YES YES YES YES
Difference in precolonial characteristics YES YES YES YES YES
Difference in geographical characteristics YES YES YES YES YES
Difference in outlier's dummy YES YES YES YES YES
Nb obs 71,00 61,90 71,00 71,00 71,00Nb neighbourhoods 29,50 27,00 29,50 29,50 29,50R2 0,50 0,62 0,67 0,82 0,64
*** significant at 1%, ** significant at 5%, * significant at 10%Dependent and independent variables are the value differences between neighbour districts of the same neighbourhoodResults come from 50 OLS regressions of the dependent variable on the independent variables using 50 random neighbourhood designs.Reported coefficient is the mean of the 50 coefficients of the dependent variable on the independent variable.Standard deviation in parentheses equals to (50/49)*the empirical standard deviation of the 50 coefficients of the dependent variable on the independent variable.Number of observations is the mean of the 50 numbers of observations (neighbour districts differences) resulting from the 50 neighbourhood designs.Number of neighbourhoods is the mean of the 50 numbers of neighbourhoods resulting from the 50 neighbourhood designs.R2 is the mean of the 50 R2 from the 50 OLS regressions.Data on stunting children is missing for the Mauritanian districtsData on medical staff per 100 000 hbt is missing for Conakry district
Dependant variables