Embed Size (px)
Citation preview

Colonial America
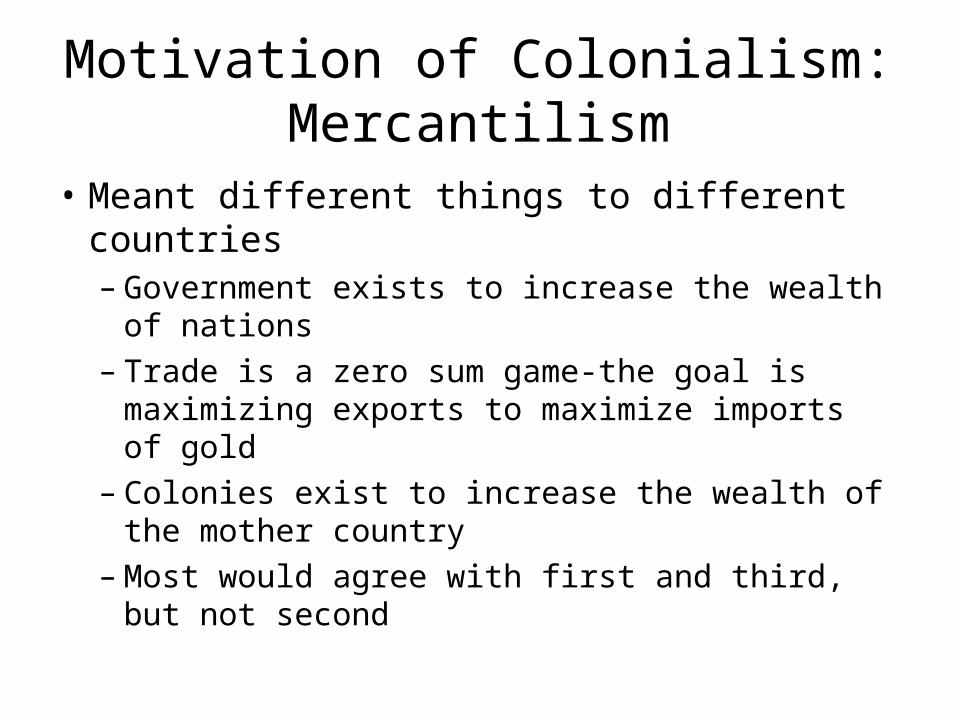
Motivation of Colonialism:Mercantilism
• Meant different things to different countries– Government exists to increase the wealth of
nations– Trade is a zero sum game-the goal is maximizing
exports to maximize imports of gold– Colonies exist to increase the wealth of the
mother country– Most would agree with first and third, but not
second
Differences between North and South America
• All of the Americas were colonized by European powers but outcome is different in North and South America
South and Central American Colonies
• Spain and Portugal colonize this area• Native population is relative large, urban with
central government• Life expectancy on par with Europe• Lack iron tools, wheel, draft animals (Llama
and alpaca are the only draft animals native to the Americas)
• Easily subdued
Organization of South and Central American Colonies
• Spanish population is declining at this time. Immigration is discouraged.
• Spanish Conquistadores given large grants of land or mines with natives tied to land. (Similar to serfdom in Europe) Encomienda system.
• Harsh treatment results in high mortality rate of native population. – Population is 25 million in central Mexico in 1492.
Falls to 1 million by 1620
Organization of South and Central American Colonies
• Important economic activities are mining gold and silver and sugar production.
• Sugar production has large economies of scale– Large plantations with hundreds of slaves– Large capital requirements
• High concentration of wealth

North American Colonies
• English, French and Dutch end up in North America
• Native population is much smaller, little urbanization, decentralized tribes– Best guess is around 2 million in 1600 reduced to
250,000 in 1700.– Result of disease and war. Native population not
used as workforce
Organization of colonies
• First permanent settlement is Jamestown in 1607 – Virginia company is joint stock company given
monopoly trading privileges .– Bound workers provided much of labor.– Fed by company and worked communally.
• Did not work hard.• Replaced by indentured servants and free labor• Private property
Organization of colonies
• Plymouth colony in Massachusetts in 1620.– Also financed as a business venture although most
were religious dissenters.– For its first two-and-a-half years, the economy of
Plymouth was form of a communal system• Food distributed equally and no division of labor• Results were starvation .
Organization of colonies
• Land was then allotted to each family and productivity increased.
• According to William Bradford. “This had very good success, for it made all hands industrious, so as much more corn was planted than otherwise would have been by any means the Governor or any other could use, and saved him a great deal of trouble, and gave far better content. The women now went willingly into the field, and took their little ones with them to set corn; which before would allege weakness and inability;”

Organization of colonies
• Example of Institutional Change in a market environment.
• Incentive to change institutional structure to increase efficiency
Organization of colonies
• British population is growing rapidly and immigration is encouraged
• No mineral wealth is found so the focus of colonies is on agriculture.
• Land is abundant but not free. Must be cleared.
• Cost of transportation limited immigration
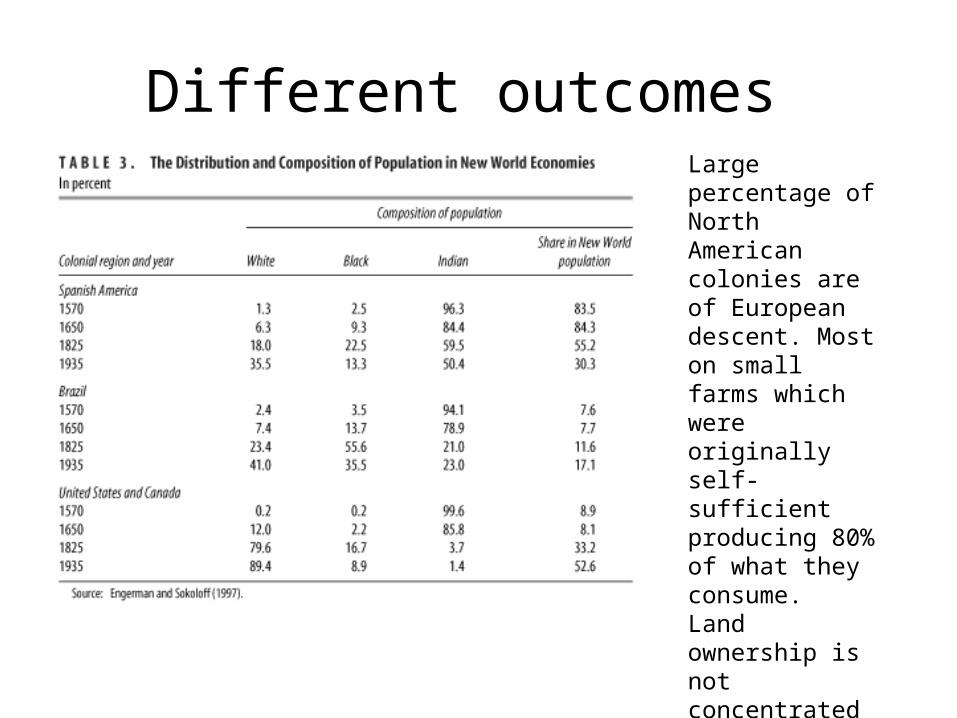
Different outcomes Large percentage of North American colonies are of European descent. Most on small farms which were originally self-sufficient producing 80% of what they consume. Land ownership is not concentrated compared to South and Central America.
Regional Differences in Colonial Agriculture
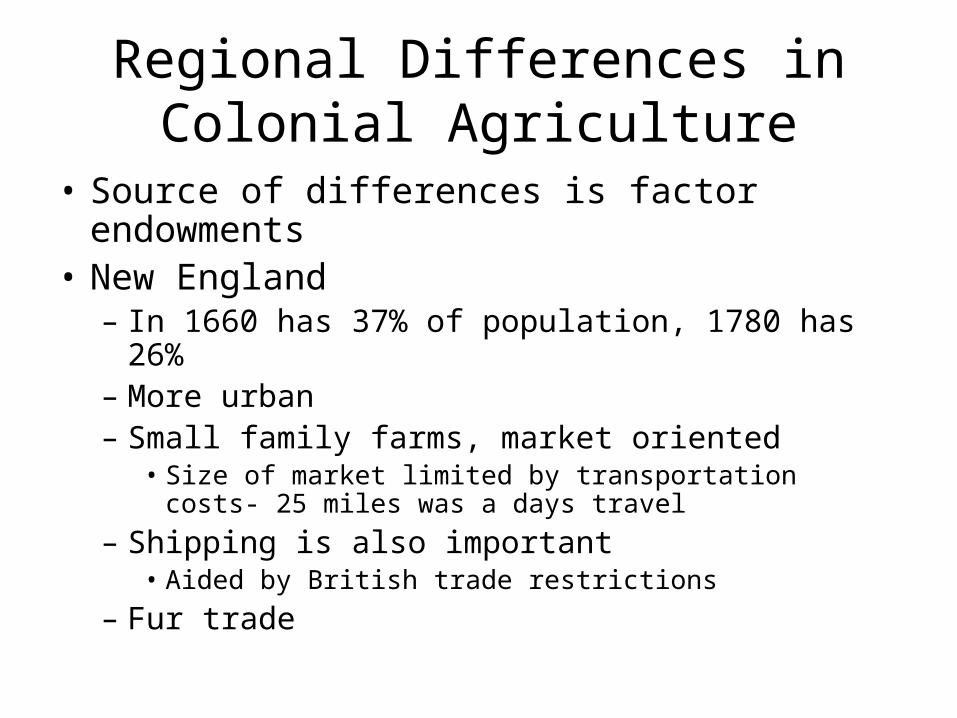
• Source of differences is factor endowments• New England
– In 1660 has 37% of population, 1780 has 26%– More urban – Small family farms, market oriented
• Size of market limited by transportation costs- 25 miles was a days travel
– Shipping is also important• Aided by British trade restrictions
– Fur trade
Regional Differences in Colonial Agriculture
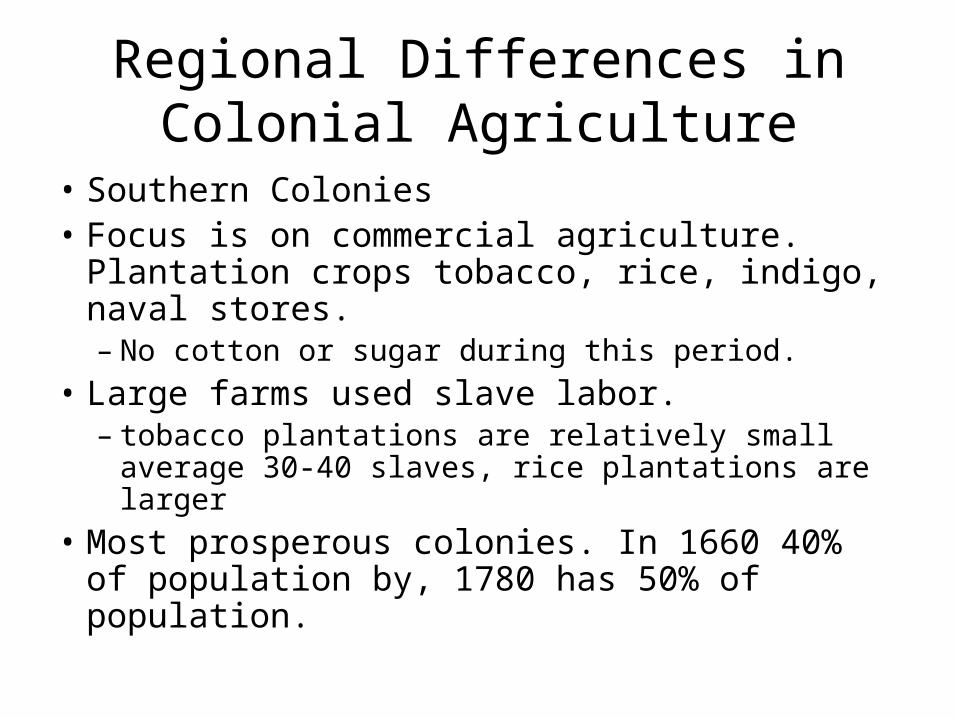
• Southern Colonies• Focus is on commercial agriculture. Plantation
crops tobacco, rice, indigo, naval stores.– No cotton or sugar during this period.
• Large farms used slave labor.– tobacco plantations are relatively small average
30-40 slaves, rice plantations are larger• Most prosperous colonies. In 1660 40% of
population by, 1780 has 50% of population.
Regional Differences in Colonial Agriculture
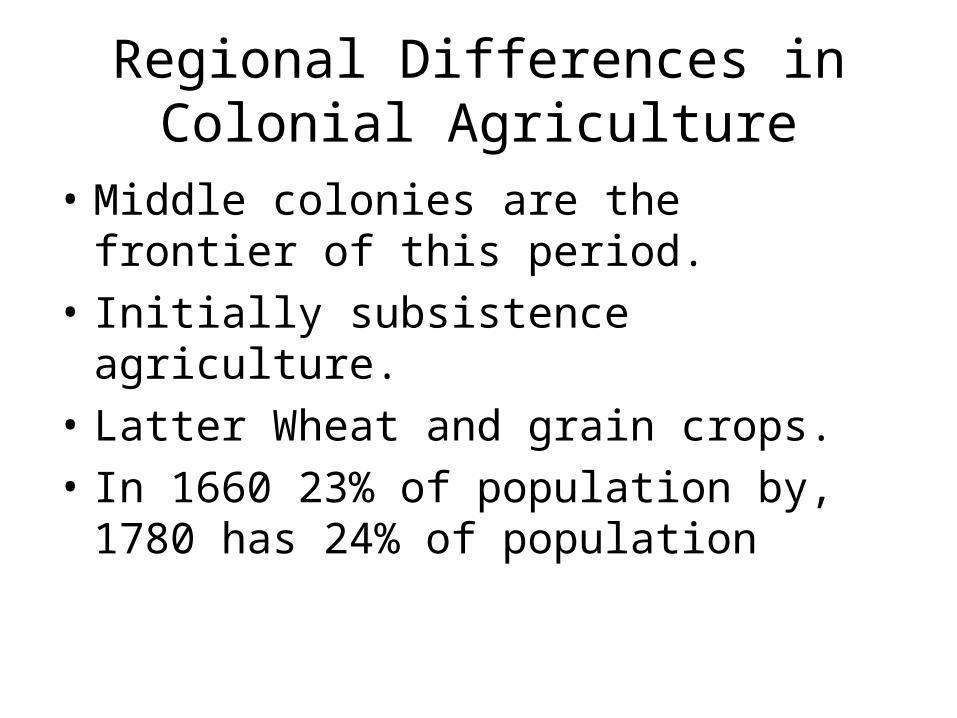
• Middle colonies are the frontier of this period.• Initially subsistence agriculture.• Latter Wheat and grain crops. • In 1660 23% of population by, 1780 has 24%
of population
Population Change in Colonial Period
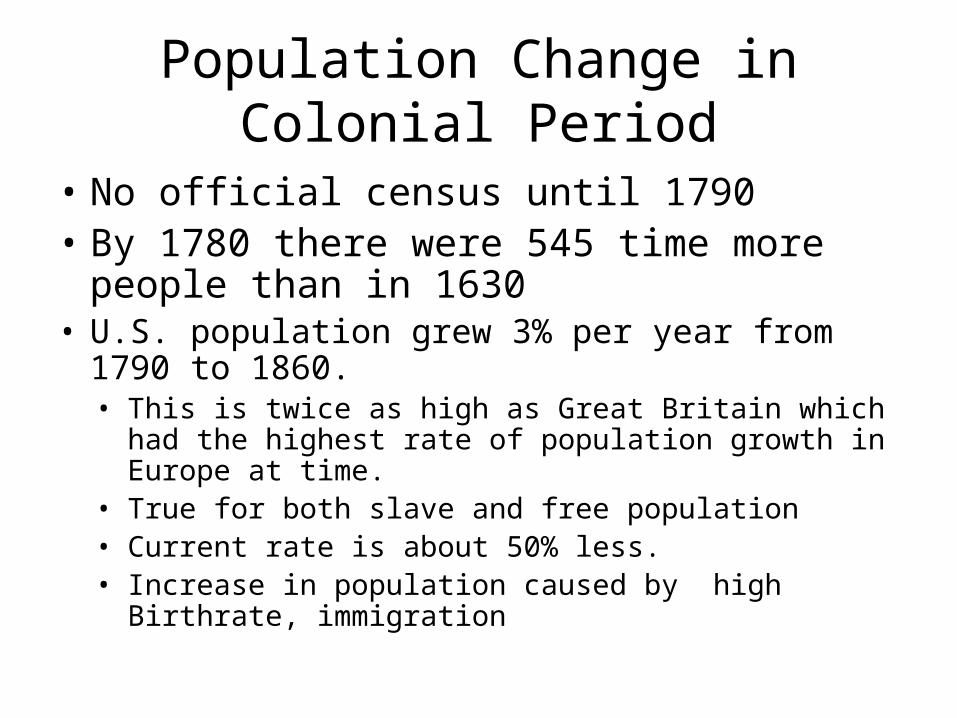
• No official census until 1790• By 1780 there were 545 time more people
than in 1630• U.S. population grew 3% per year from 1790 to 1860.
• This is twice as high as Great Britain which had the highest rate of population growth in Europe at time.
• True for both slave and free population• Current rate is about 50% less.• Increase in population caused by high Birthrate,
immigration

High Birthrate
• In 1800, the typical American mother had given birth to 7 children. Higher than ever recorded for any European country.
• Reasons– Relatively young population– Abundant resources– Favorable disease environment
• Different outcome for British colonies in Caribbean
Growth of GDP and GDP percapita
• Little data collected by either British gov or colonial gov– Some on trade but not much else– Any estimates are going to have large errors
• Given population growth even if GDP per capita did not change GDP would have increased.
GDP per capita
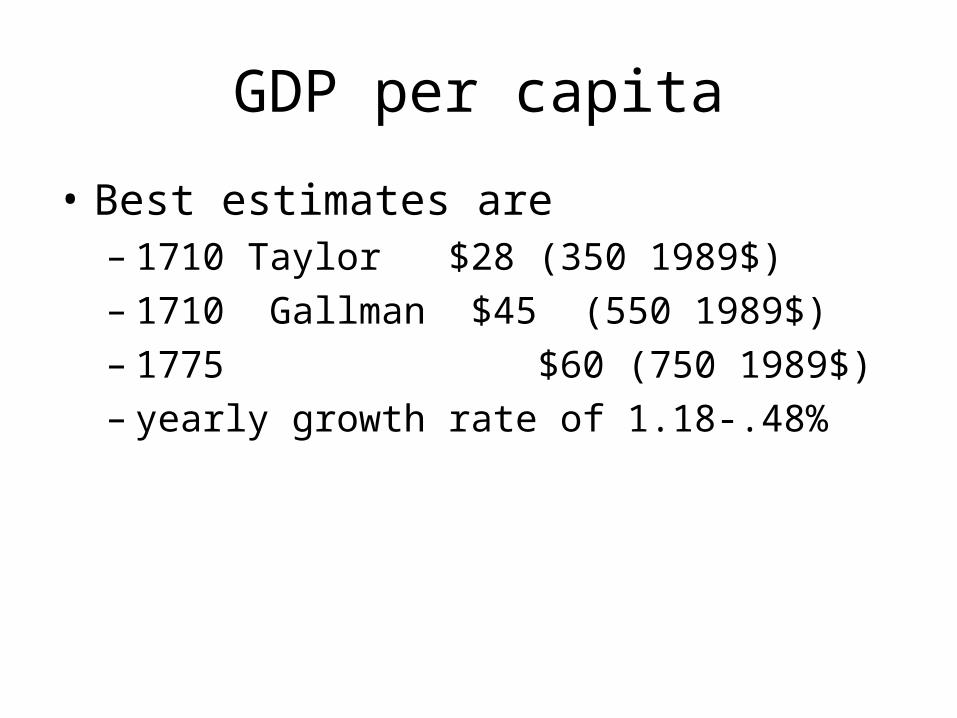
• Best estimates are– 1710 Taylor $28 (350 1989$)– 1710 Gallman $45 (550 1989$)– 1775 $60 (750 1989$) – yearly growth rate of 1.18-.48%
Other measures of standard of living
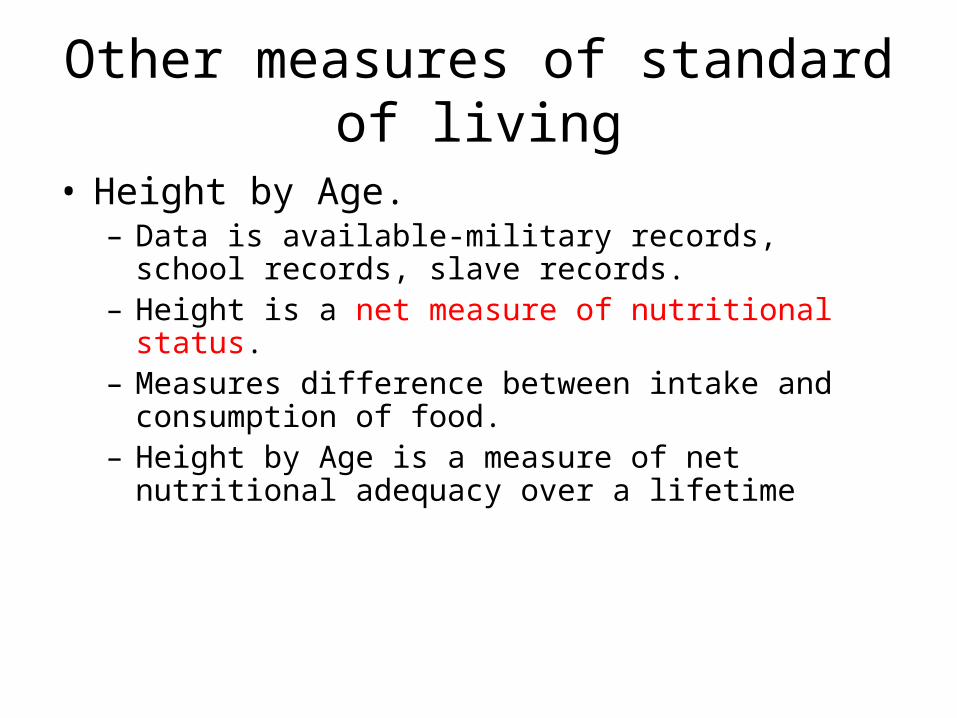
• Height by Age.– Data is available-military records, school records, slave
records. – Height is a net measure of nutritional status.– Measures difference between intake and consumption of
food. – Height by Age is a measure of net nutritional adequacy over
a lifetime

Height by Age Profile-TheoreticalBirth length indicates nutritional status of mother.
Infant growth spurt-0 to 3 years.
Adolescent growth spurt-age 12.
Final Adult Height reached around 18.

Height by Age Profile-malnourishedShort periods of severe under nutrition or prolonged periods of moderate under-nutrition delay adolescent growth spurt.
Severe prolonged under-nutrition leads to diminished typical growth spurt pattern (spurts smaller) and contribute to substantial stunting.
Hence average age at which growth spurts peak, average length at birth, average age at which growth terminates. mean adolescent height and mean final height are all important indicators of nutritional status.

Preliminary findings—U.S. Life Expectancy and Adult Final Height.
Rising heights and life expectancy in the 18th century, consistent with increase in per capita income
Life expectancy declined from 1790 to 1860 while heights did not begin to decline until 1830.
Modern rise in life expectancy and heights from 1890 to present.

US vs. Great Britain
• Adult males in American were about 68 inches in Revolutionary War
• British soldiers were about 64-65 inches– part of this difference was due to lower class of
British soldiers
• Average height in developing countries today is about 63-64 inches.
US vs. Great Britain
England and Wales (both
sexes)British
PeerageBritish
PeerageUS Native
Born malesBirth
Cohort at birth at birth at age 10 at age 10
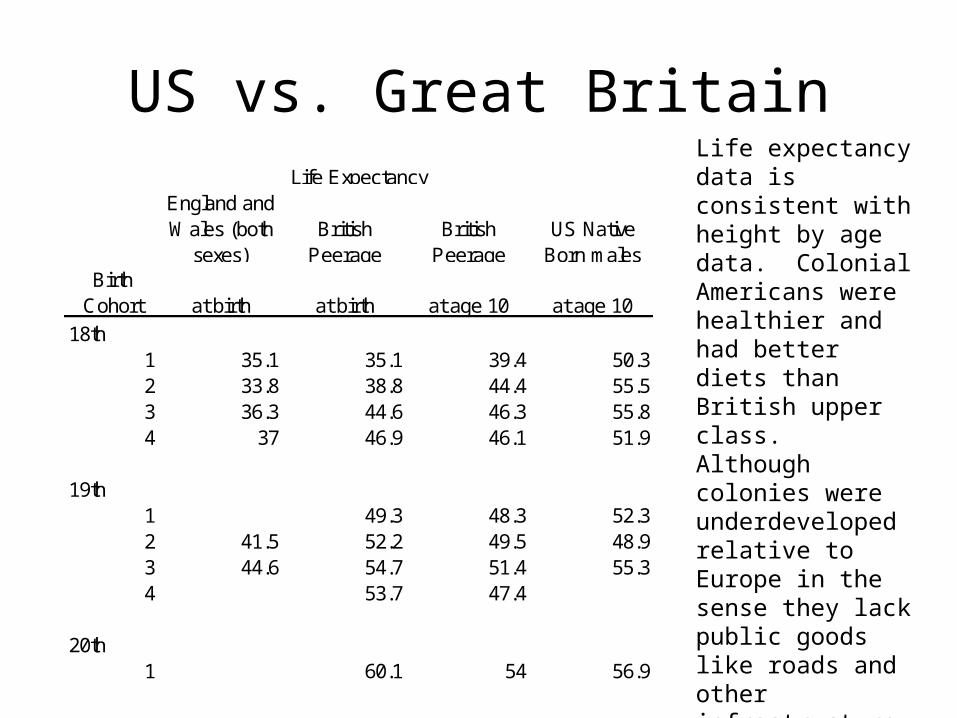
18th1 35.1 35.1 39.4 50.32 33.8 38.8 44.4 55.53 36.3 44.6 46.3 55.84 37 46.9 46.1 51.9
19th1 49.3 48.3 52.32 41.5 52.2 49.5 48.93 44.6 54.7 51.4 55.34 53.7 47.4
20th1 60.1 54 56.9
Life ExpectancyLife expectancy data is consistent with height by age data. Colonial Americans were healthier and had better diets than British upper class. Although colonies were underdeveloped relative to Europe in the sense they lack public goods like roads and other infrastructure, income was not low.
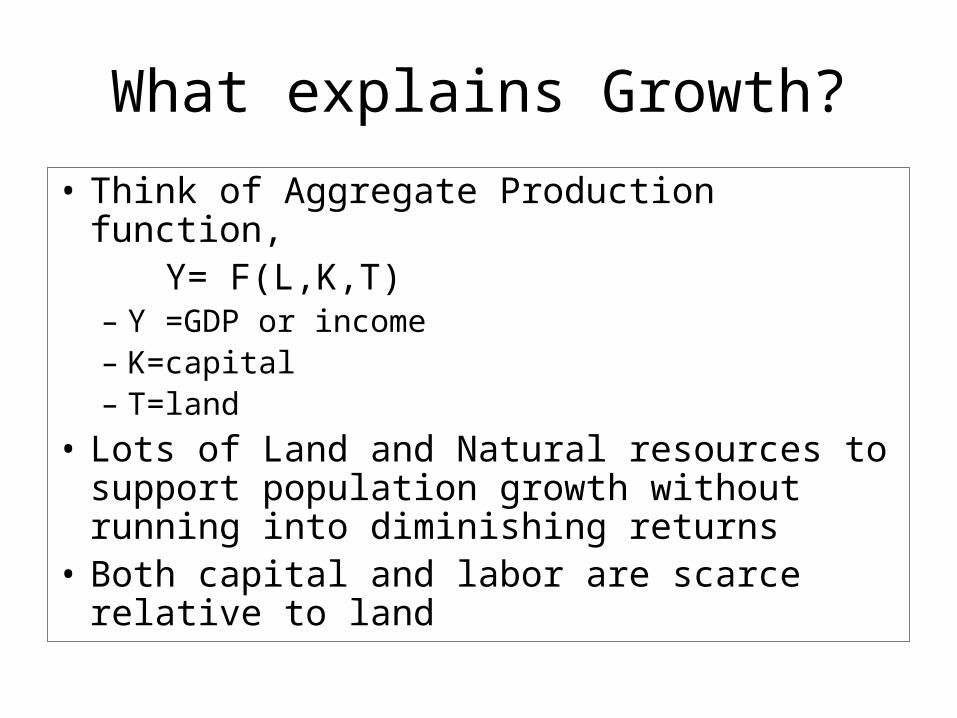
What explains Growth?
• Think of Aggregate Production function, Y= F(L,K,T)
– Y =GDP or income– K=capital– T=land
• Lots of Land and Natural resources to support population growth without running into diminishing returns
• Both capital and labor are scarce relative to land
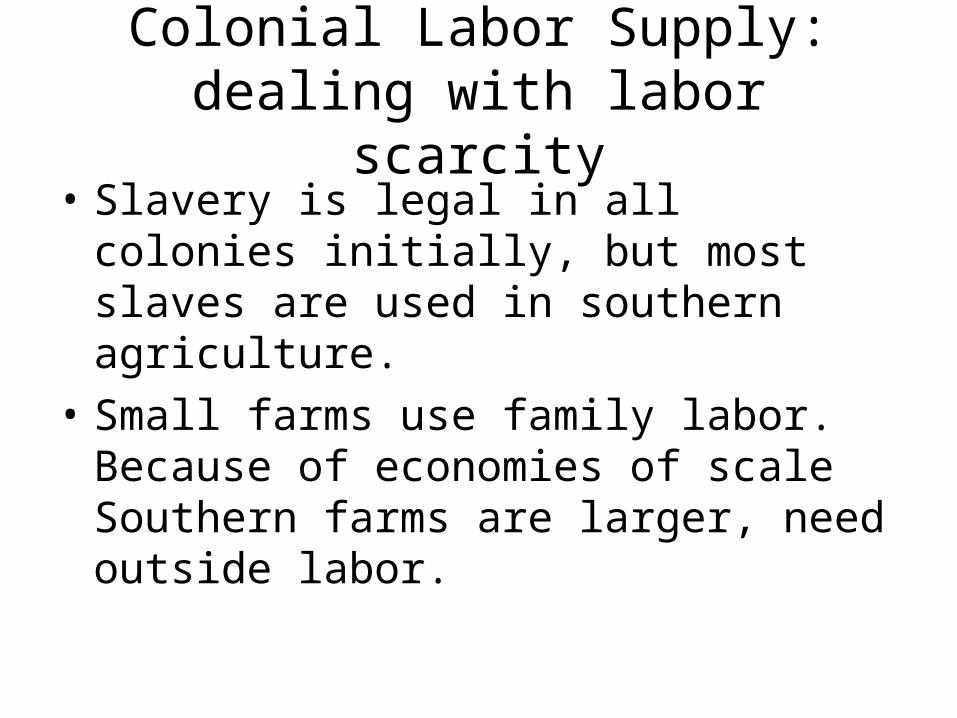
Colonial Labor Supply: dealing with labor scarcity
• Slavery is legal in all colonies initially, but most slaves are used in southern agriculture.
• Small farms use family labor. Because of economies of scale Southern farms are larger, need outside labor.
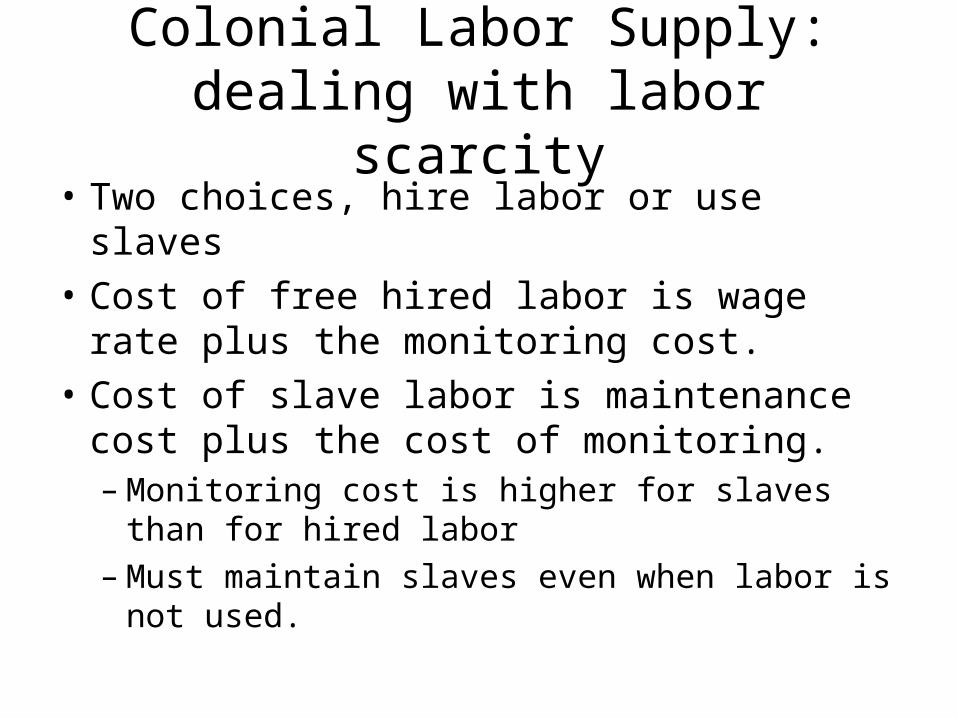
Colonial Labor Supply: dealing with labor scarcity
• Two choices, hire labor or use slaves• Cost of free hired labor is wage rate plus the
monitoring cost.• Cost of slave labor is maintenance cost plus
the cost of monitoring.– Monitoring cost is higher for slaves than for hired
labor– Must maintain slaves even when labor is not used.
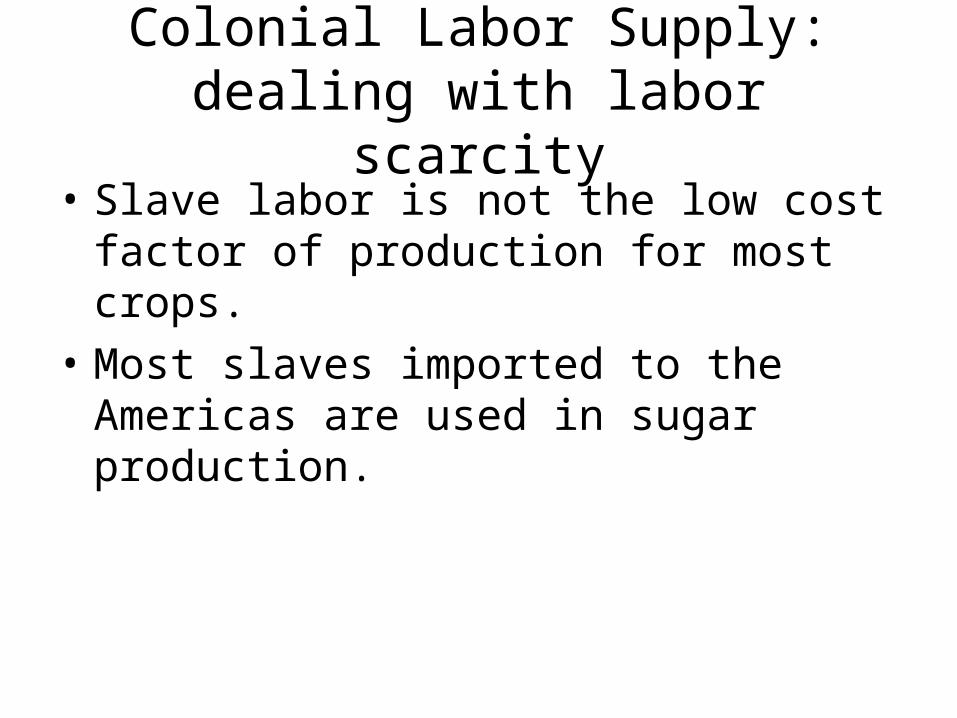
Colonial Labor Supply: dealing with labor scarcity
• Slave labor is not the low cost factor of production for most crops.
• Most slaves imported to the Americas are used in sugar production.
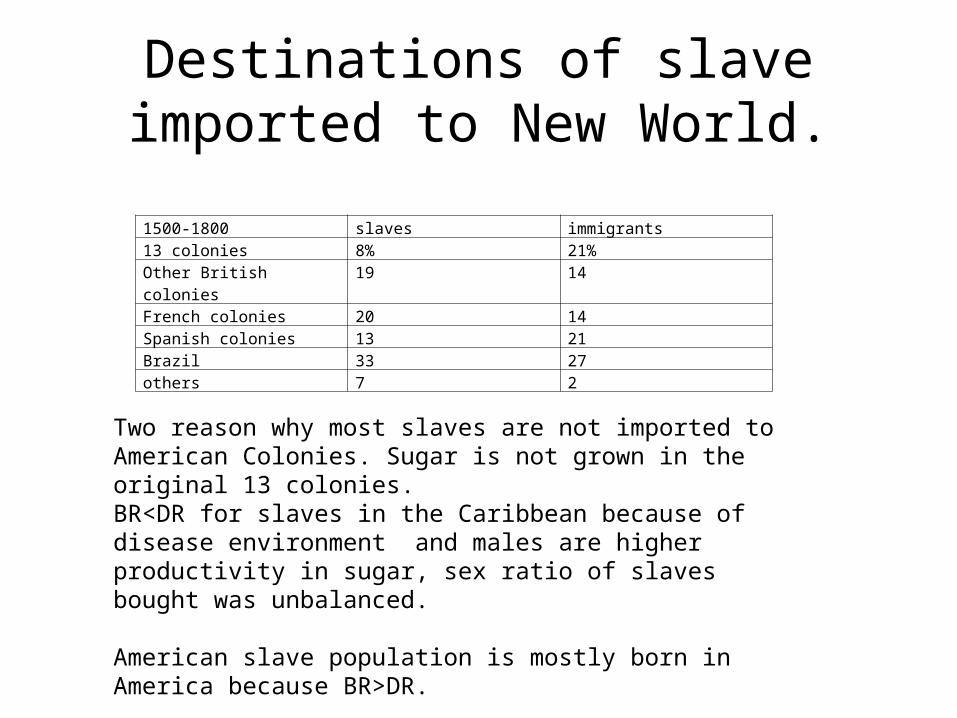
Destinations of slave imported to New World.
1500-1800 slaves immigrants13 colonies 8% 21%Other British colonies 19 14French colonies 20 14Spanish colonies 13 21Brazil 33 27others 7 2
Two reason why most slaves are not imported to American Colonies. Sugar is not grown in the original 13 colonies. BR<DR for slaves in the Caribbean because of disease environment and males are higher productivity in sugar, sex ratio of slaves bought was unbalanced.
American slave population is mostly born in America because BR>DR.

Indentured Servants• What should happen in a market economy if the
price of a good is higher in one place than another? The same is true of labor.
• What prevents labor from moving from England to Colonies?– Cost of transportation– Should this persist?
• Not if capital markets are efficient• Should be able to borrow money to mover just like you
borrow money for college– What are problems with this type of loan?
• No collateral
Indenture Contracts
• Made between immigrant and shipper• Worker agreed to work a set number of years to
pay the cost of transport to the colonies. • When ship landed in colony, shippers would sell
the contract to merchant or business owner compensating him for the cost of voyage. The merchant would providing food, housing etc, for servant.
• 50-66 % of white immigrants come to colonies under these contracts.

Form of Indenture contract
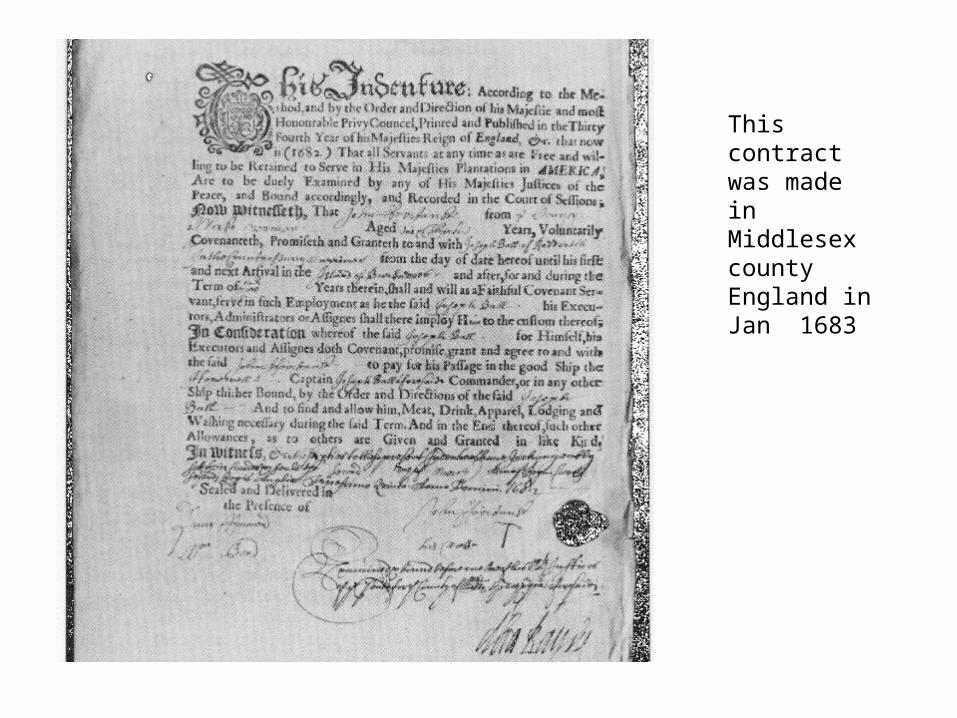
This contract was made in Middlesex county England in Jan 1683
Slaves vs Indentured Servants
• Not clear that slaves and indentured servants are used as substitutes
• Majority of slaves are used in plantation agriculture
Economics of Indentured Servants
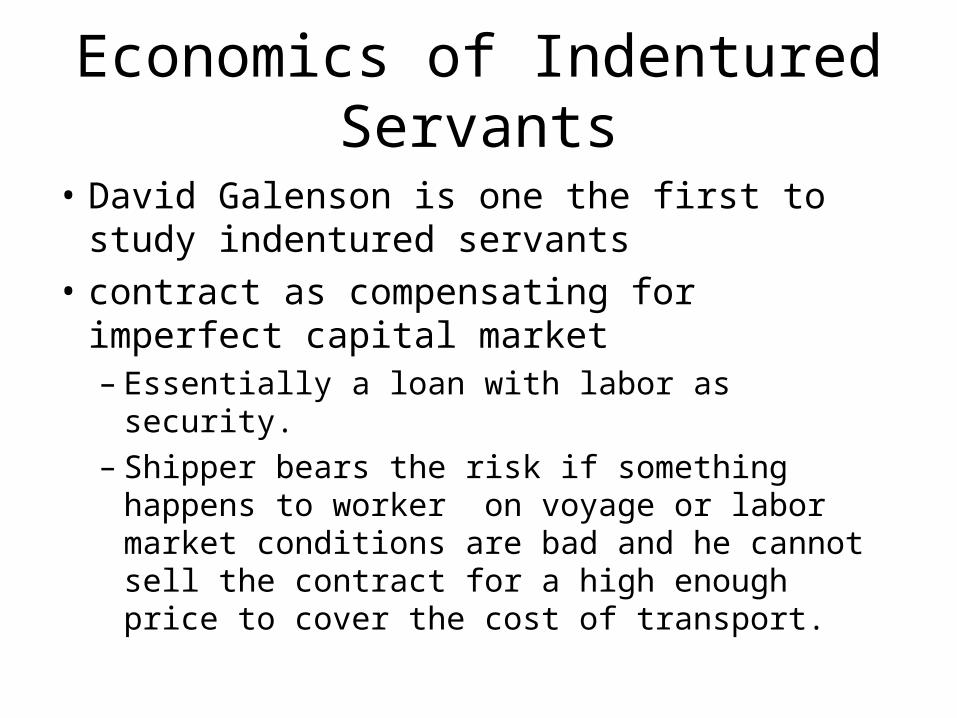
• David Galenson is one the first to study indentured servants
• contract as compensating for imperfect capital market– Essentially a loan with labor as security. – Shipper bears the risk if something happens to
worker on voyage or labor market conditions are bad and he cannot sell the contract for a high enough price to cover the cost of transport.
Demand and Supply for contracts
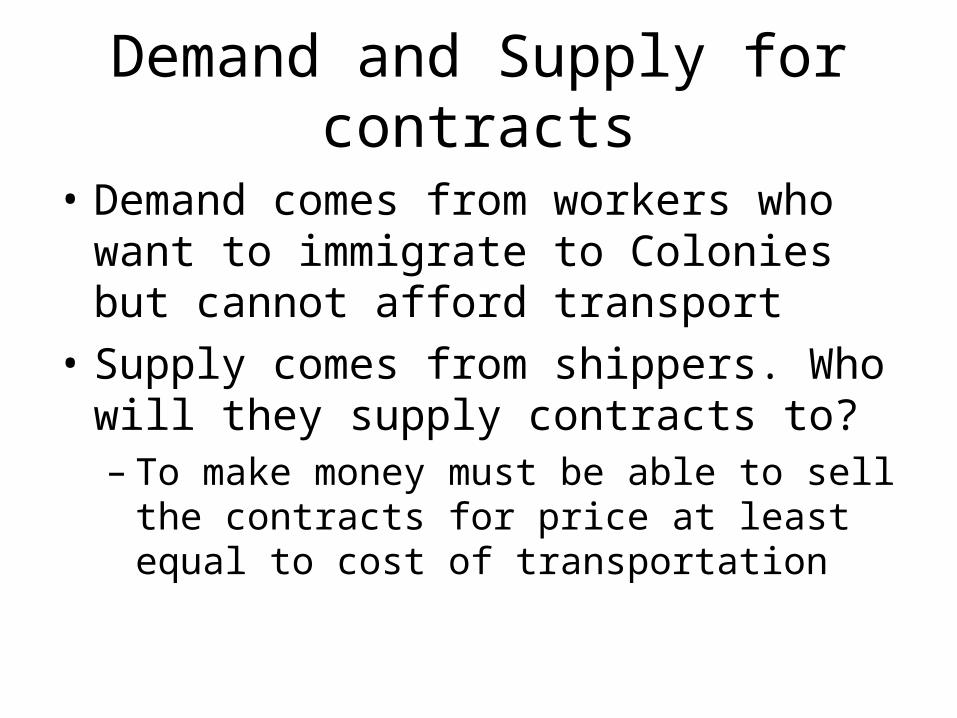
• Demand comes from workers who want to immigrate to Colonies but cannot afford transport
• Supply comes from shippers. Who will they supply contracts to?– To make money must be able to sell the contracts
for price at least equal to cost of transportation

Who gets a contract?
• Who does economic theory predict will be most productive?– Male or Female?– Young or Old?– Skilled or Unskilled?

Galenson Results
• Galenson looks at people who are indentured servants– finds that most are male late teens or early
twenties– most are literate – Even early on about 1/3 are skilled and this
increases over time.– Few are convicts or low productivity workers.

Galenson Results• Observes lots of variation in contract price
– Lot of uncertainty about value of labor services over time.
• When contracts are sold terms of service are also altered.
• In a market with perfect information, price of contracts should move to an equilibrium where they are equal to cost of transportation and terms of service should change with productivity – Evidence is mixed, probably because of lack of
information
Indentured markets
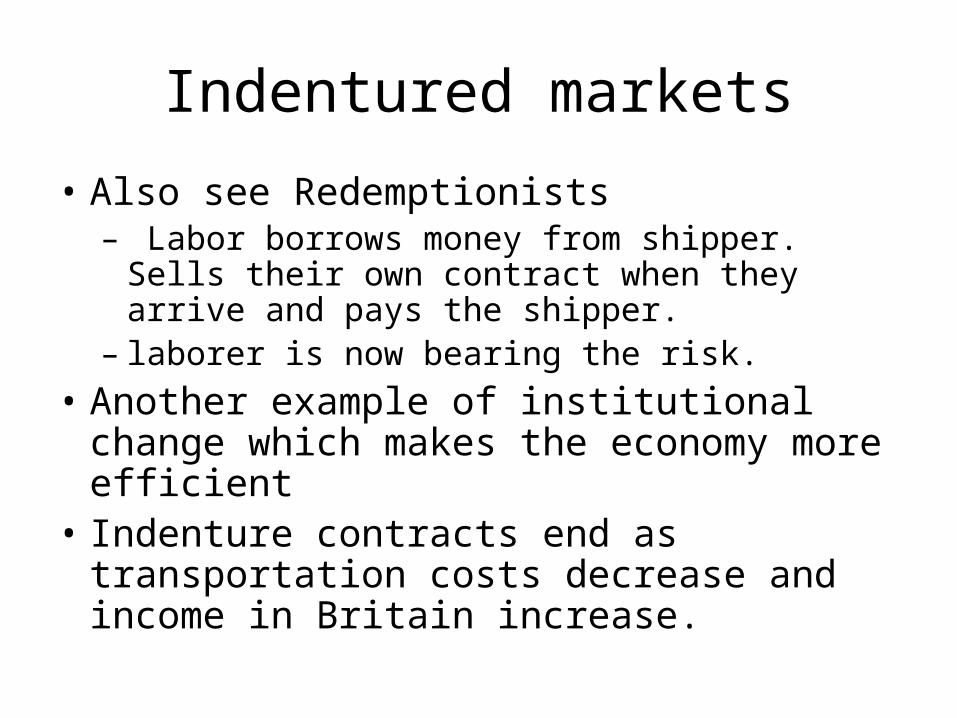
• Also see Redemptionists– Labor borrows money from shipper. Sells their
own contract when they arrive and pays the shipper.
– laborer is now bearing the risk.• Another example of institutional change
which makes the economy more efficient• Indenture contracts end as transportation
costs decrease and income in Britain increase.

Growth due to productivityMeasurement
Aggregate Production function, Y= F(L,K,T)
– Y =GDP or income– K=capital– T=land
• Productivity increase changes the function itself
Measures of productivity
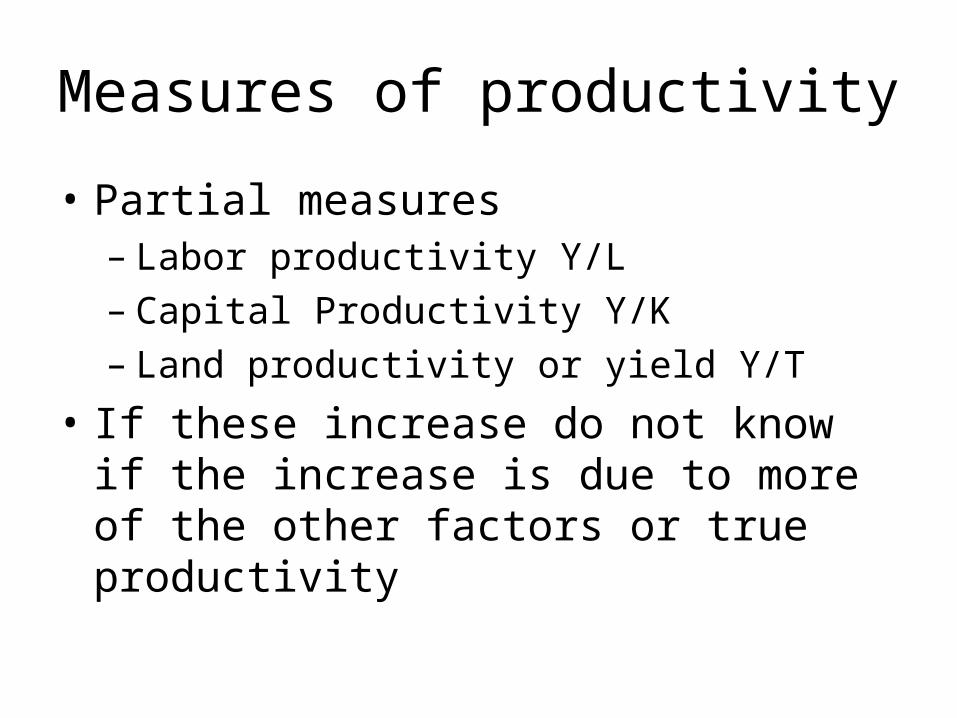
• Partial measures– Labor productivity Y/L– Capital Productivity Y/K– Land productivity or yield Y/T
• If these increase do not know if the increase is due to more of the other factors or true productivity

Agregate Production function
• Assume a Cobb-Douglas Production Function• Q=LaKbTc
– a, b and c are output elasticity with respect to L, K, T (a tells us how much output would increase if L increases by 1%)
– a+b+c tells us about economies of scale– In a perfectly competitive economy with constant
returns to scale a+b+c=1– a,b,c will also be equal to factor shares
• For example a= W*L/Y etc

Total Factor Productivity
• Total Factor Productivity– TFP=Y/LaKbTc
– Can think of it as productivity of a weighted measure of inputs
– Or the residual of production function– (See appendix B of chapter 1)
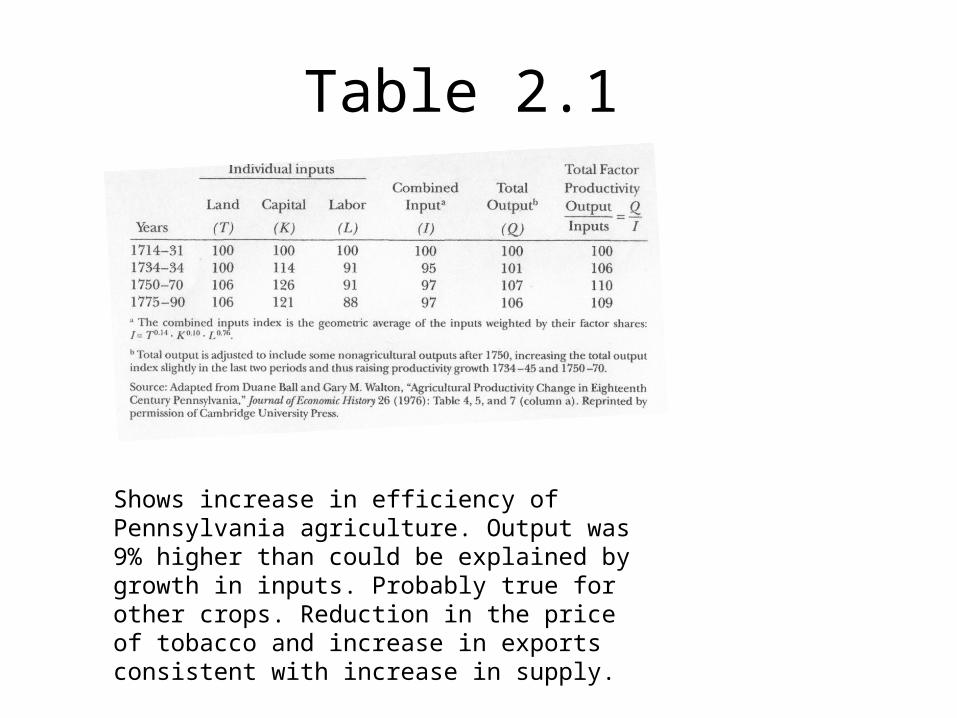
Table 2.1
Shows increase in efficiency of Pennsylvania agriculture. Output was 9% higher than could be explained by growth in inputs. Probably true for other crops. Reduction in the price of tobacco and increase in exports consistent with increase in supply.
Source of Productivity growth
• Reduction in transportation costs– Ocean shipping
• New types of boats made possible by reduction in piracy-especially in Carribean
• Less crew , less time in port.
• Organization Change– Increases in market size (Smithian growth
increases in division of labor) – More population reduced transportation cost mean larger markets.

Government and Economic Growth
• No central government in North America• British provide defense, not much else
– Not interested in intervening until 1763
• Each colonial government is separate– British appoint governor– Most colonies had legislatures with two houses at
least one of which elected by adult male population. – Governors could veto but were dependent on
legislature for funds.
Government and Economic Growth
• In general colonial laws enforced property rights
• Increase in volume of trade during this period
Did Colonies suffer from lack of a central government
• Money – Specie- gold and silver coins
• Comes from trade with the Spanish, West Indies and British
• Overall probably a small deficit.
– Barter– Commodity money
• Tobacco most common in colonies

• Paper currency• Bills of Exchange
– A promise to pay B a sum of money some time in future– Colonial governments printed money in the form of promises to
pay specie some time in the future. – Both these sold at a discount
– Why do we care about the size of the money supply?• MV=PY
• Was there too much or too little paper currency?– Different experiences in different colonies. – Competing supplies of money
• Result of issuing too much is money is worthless.
• Not much evidence of inflation– Between 1720 and 1775 price increase was less
than 1% per year.
Too Little Money?
• Lots of complaints about shortage of specie, not the same thing as shortage of money.– Interest rates low– Prices rise not fall– Economy grew
• If the economy grew during the colonial period, why do the colonists revolt?