Embed Size (px)
Citation preview

1
Submitted report on Sufi recordings at AAPB 2013 in Portland
Not for general distribution.
Thomas F. Collura, Ph.D.
July, 2013
Summary of EEG findings
The intent of the EEG monitoring was to see which characteristics of this individual’s brain
activity are unique. The subject was monitored continuously, using 19 channels of EEG.
The sensors were attached manually, avoiding the need for a cap. EEG was measured
referenced to the left ear, and also included the right ear as channel 20. Recordings were then
referenced to linked ears for waveform, map, and sLORETA analysis. Recordings started 15
minutes before the procedure began, and continued for several minutes afterward, as well.
Recordings were reviewed using three basic methods: (1) visual inspection of raw
waveforms, (2) surface maps using a normative database (John, Prichep, Fridman, &
Eastman, 1998), and (3) sLORETA (Pascual-Marqui, 2002) images using the same normative
database.
When using comparison with a normative database, the individual’s EEG is compared with
what is regarded as typical for any individual of that age. Therefore, this approach can be
used to answer the question, “what is unusual in this particular EEG at this time?” By
inspecting raw EEG waveforms and maps, it is possible to identify magnitudes and locations
of prominent EEG activity. When a statistical comparison with a normative sample is used,
the results pinpoint the frequencies and locations in which the observed activity is notable,
that is, it diverges significantly from typical activity. In this way, it is now possible to
identify what is unusual about the recording, because any activity at normal levels is
disregarded due to its having a nonsignificant (at or near zero) z-score.
The following segment shows the EEG at the beginning of the procedure. This reflects the
time that the participant is planning the piercing, and is in a state of rest and composure.
Between sections contaminated with EMG, there is a brief moment of clean EEG that can be
viewed and analyzed. This segment, which occurs 15 seconds before the piercing begins, is
remarkably normal, considering the impending procedure. In particular, significant amounts
of alpha are present generally. Despite the fact that the individual’s eyes were open, this
looks like an eyes-closed EEG.

2
When processed using the normative database producing z-scores, what is most evident is
that the amount of activity in all bands is remarkably normal, with the exception of a relative
excess of alpha and beta in the left frontal region. That is, while the alpha source is clearly
largest posteriorly, the z-scores show that the amount of alpha is at a normal level in these
regions. Where the alpha exceeds typical levels is in the left frontal areas, being pronounced
at F3 and F7. It is highly asymmetric, and little alpha is evident on the right side, i.e. at F4
and F8, where it is essentially absent. This is interesting in light of the fact that the left
frontal area is responsible for assessing safe situations, and mediating approach behaviour
(Davidson & Begley, 2012). There is also an evident hypercoherence in alpha, reflected in
the waveforms in the extreme synchrony of the alpha waves. In addition, there is some
hypocoherence in theta involving the frontal areas.
This activity can be imaged in raw power using sLORETA, showing the abundance of
posterior alpha.

3
When the sLORETA image is rendered using z-scores, it is evident that most of the cortical
activity is at a normal level (for an eyes-closed condition), and that the excess is frontal:
An even more interesting picture emerges when inspecting the activity in the gamma (35-50
Hz) range. This rhythm is associated with perceptual binding, and is related to phenomena
that give rise to conscious awareness, and has been observed in instances of clairvoyance and
advanced meditation (Collura & Don, 2004; Lutz, Greischar, Rawlings, Ricard, & Davidson,
2004). Therefore, the locations and patterns of gamma in this subject would be expected to
provide information relevant to the experience and its mental attributes.

4
The gamma from the current sample of EEG is shown in the following graph. The evident
waxing and waning gamma bursts are clear, as well as their being most prominent in the
temporal leads (T3 and T4).
Although the surface maps show these excesses clearly both as raw and as z-scores, the
sLORETA analysis provides significant additional detail. When analyzing the gamma, two
significant patterns emerge. One is that there is a prominent excess of gamma in the mesial
regions of the temporal lobes. This is shown in the figure below
A particularly interesting pattern emerges, however when the areas of least gamma activity,
that is gamma deficits, are imaged. The initial evidence for a gamma deficit is seen when the
z-scores for gamma are displayed. In this case, several “pockets” of hypoactivity are evident
as darker areas:

5
Seeing these areas of hypoactivity, it becomes of interest to image these areas specifically,
and look for the spatial pattern that they define. This would reveal areas that are
systematically de-activated in concert, suggesting a functional collection of areas. The
method to see them is to alter the display thresholds so that only these areas are shown. This
relatively uncommon technique consists of selecting only those voxels with z-scores below a
certain level. In this case, when only voxels with gamma z-scores below -1.2 are imaged, a
clear pattern emerges defining a possible functional hub:
The areas of gamma deficit reside in the occipital and to a lesser extent the parietal lobes
(Brodmann areas 17, 18, and 19), , the motor strip (Brodmann Areas 2, 3, and 4), and the
frontal lobes (Brodmann Areas 8 and 9). This may also be related to Raichle’s Dorsal
Attention Network. Laird’s ICN 2 Network.
6
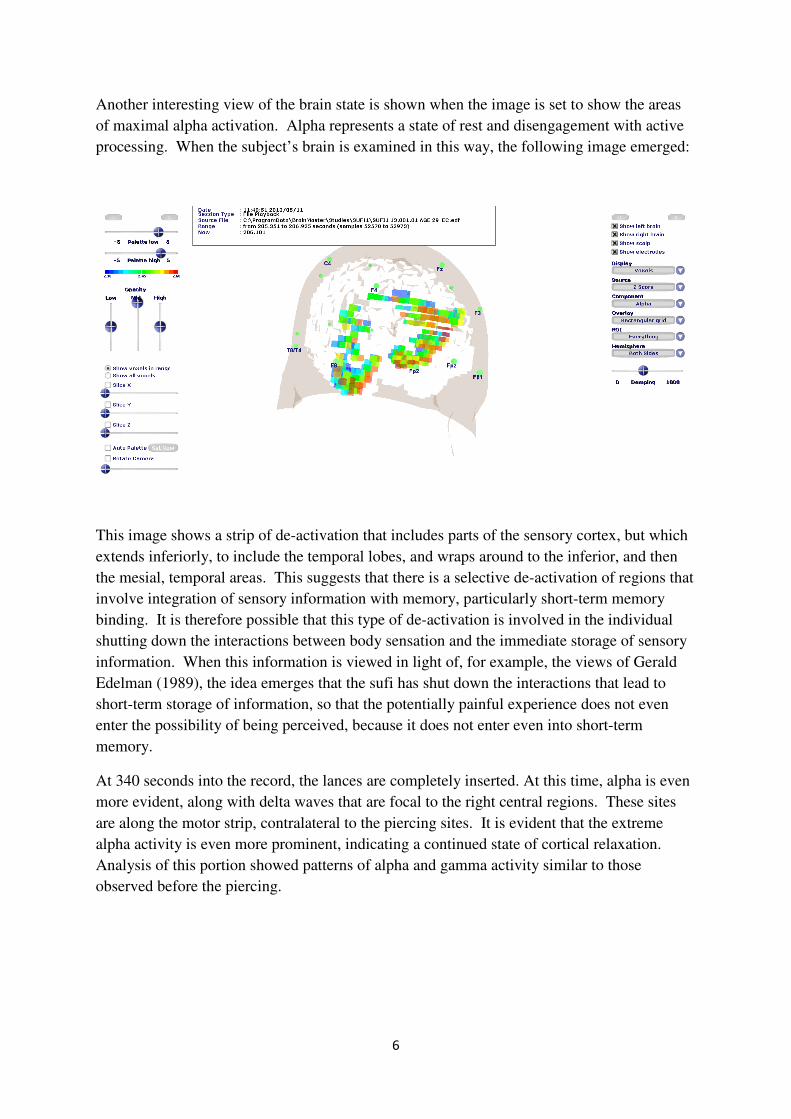
Another interesting view of the brain state is shown when the image is set to show the areas
of maximal alpha activation. Alpha represents a state of rest and disengagement with active
processing. When the subject’s brain is examined in this way, the following image emerged:
This image shows a strip of de-activation that includes parts of the sensory cortex, but which
extends inferiorly, to include the temporal lobes, and wraps around to the inferior, and then
the mesial, temporal areas. This suggests that there is a selective de-activation of regions that
involve integration of sensory information with memory, particularly short-term memory
binding. It is therefore possible that this type of de-activation is involved in the individual
shutting down the interactions between body sensation and the immediate storage of sensory
information. When this information is viewed in light of, for example, the views of Gerald
Edelman (1989), the idea emerges that the sufi has shut down the interactions that lead to
short-term storage of information, so that the potentially painful experience does not even
enter the possibility of being perceived, because it does not enter even into short-term
memory.
At 340 seconds into the record, the lances are completely inserted. At this time, alpha is even
more evident, along with delta waves that are focal to the right central regions. These sites
are along the motor strip, contralateral to the piercing sites. It is evident that the extreme
alpha activity is even more prominent, indicating a continued state of cortical relaxation.
Analysis of this portion showed patterns of alpha and gamma activity similar to those
observed before the piercing.
7
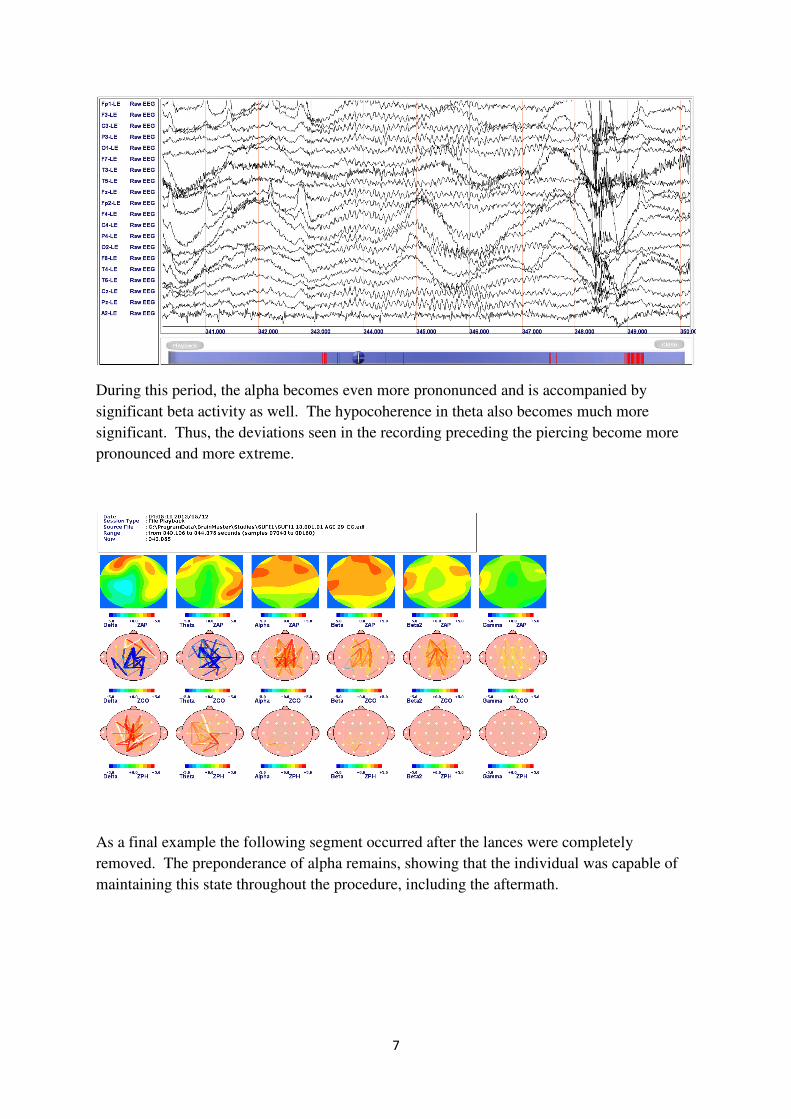
During this period, the alpha becomes even more prononunced and is accompanied by
significant beta activity as well. The hypocoherence in theta also becomes much more
significant. Thus, the deviations seen in the recording preceding the piercing become more
pronounced and more extreme.
As a final example the following segment occurred after the lances were completely
removed. The preponderance of alpha remains, showing that the individual was capable of
maintaining this state throughout the procedure, including the aftermath.

8
At this stage, the extreme amounts of alpha become even more prominent, and the
hypercoherence in alpha becomes even more notable. Theta activity has become more
normal, however.
Overall, the following observations can be made regarding the unique characteristics of this
individual’s EEG:
Before the procedure, his EEG shows a preponderance of alpha waves, which are maximal
posteriorly, but are most notable for their amplitude in the anterior regions. The alpha is also
hypercoherent. There is also a moderate amount of hypocoherence in theta, particularly in
the frontal regions. There is also evidence that particular regions including Brodman areas 2,
3, 4, 8, 9, 17, 18, and 19 undergo a significant decrease in activation, suggesting that this
functional hub is being de-activated. During the procedure, these deviations become even
more pronounced. After the procedure, the alpha preponderance becomes diffuse, and is

9
accompanied by a bilateral posterior excess of beta as well. The findings are consistent with
the interpretation that this individual is able to achieve an extreme state of relaxation despite
this process, and is also able to selectively disengage a broadly based brain network that may
be related to attention.
References
Collura, T.F. & Don, N.S. (2004) EEG event-related spectral signatures associated with a psi-
conducive task. Presented at the 35th
annual meeting of the AAPB, April 1-4,
Colorado Springs, CO.
Davidson, R.J. and Begley, S. (2012) The Emotional Life of Your Brain. New York:
Penguin Group.
Edelman, G. (1989) The Remembered Present: A Biological Theory of Consciousness. New
York: Basic Books.
John, E. R., Prichep, L. S., Fridman, J. & Easton, P. (1988). Neurometrics: Computer assisted
differential diagnosis of brain dysfunctions. Science, 293, 162-169.
Laird, A.R., Fox, P.M., Eickhoff, S.B., Turner, J.A., Ray, K.L. et al. (2011) Behavioral
interpretations of intrinsic connectivity networks. J. Cogn. Neurosci. 23(12) 4022-37.
Lutz, A., Greischer, L.L., Rawlings, N.B., Ricard, M., & Davidson, R.J. (2004) Long-term
meditators self-induce high-amplitude gamma synchrony during mental practice.
Proc. Nat. Acad. Sci. of the USA. 101(46) 16369-73.
Pascual-Marqui, R.D. (2002). Standardized low-resolution brain electromagnetic
tomography (sLORETA): technical details, methods, and findings. Clinical
Pharmacology. 24: 5-12.
Raichle, M.W. (2010) Two views of brain function. Trends in Cognitive Science. 14(4):
180-190.


![Sufi Poetry [Eng]](https://img.pdfslide.us/doc/110x75/55cf9005550346703ba26111/sufi-poetry-eng.jpg)