Embed Size (px)
Citation preview
204
1.0 Introduction
Soil is the primary stay of existence, and production di-rectly depends on its composition and structural stability. Soil structure is a significant soil property which plays a critical role in maintaining other related processes to soil productive ability, agricultural sustainability and environ-mental quality (Kay and Munkholm, 2004). Structural stability is expressed by the stability of soil aggregates, directly or indirectly influences other physical and chemi-cal properties of the soil and can be used as an indicator of soil degradation (Cerda, 2000). Structural stability ex-plains the potential of the soil to preserve its aggregation and pore space when exposed to water, wind, or cultiva-tion. Cultivation is one of the main factors that break the protective measure of the soil structural aggregates, so soil structural stability frequently reduced with cultivation (Moreau, 1978; Six et al., 2000; Eynard et al., 2004). Pagliai (2005) observed that stable macro-aggregate in
wet sieving of tilled soil is lower than that of no-tilled soil due to aggregate break down in the tillage process. Fur-thermore, land use type or cropping pattern has also been found to affect the structural stability of the soil aggre-gates. Mbagwu and Auerswald (1999) observed that land use influenced structural stability more than inherent soil properties and that percolation stability of soil increased with an increase in organic matter content. Therefore, con-tinuous cultivation leads to easy erosion of poorly struc-tured soils. Perennial crops usually develop soil structure, while annual row cropping often results in structural deg-radation, primarily as a result of losses in organic matter and ground cover from soil disturbance (Magdoff and van Es, 2000; Karunatilake and Van Es, 2002), is of the view that increased soil disturbance from tillage can promote soil degradation when annual row crops are replaced with perennial crops. Han et al. (2007) reported higher content of water-stable aggregates in the orchard than in annual upland crops about land use.
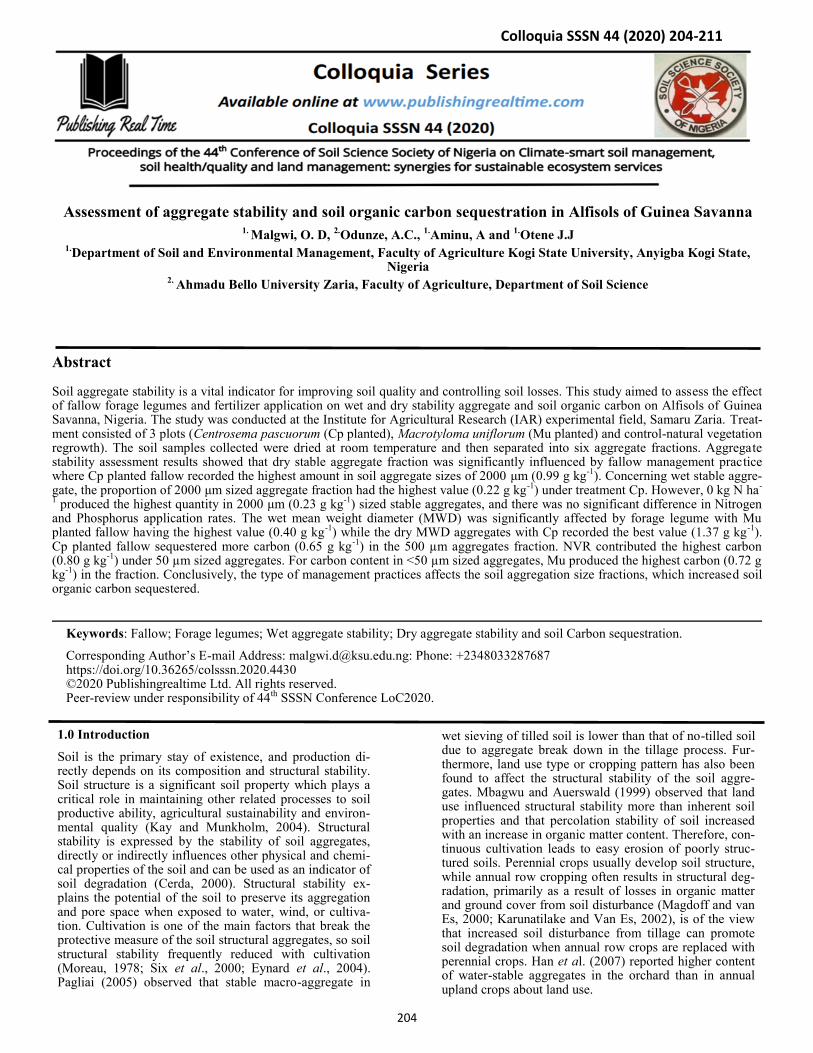
Assessment of aggregate stability and soil organic carbon sequestration in Alfisols of Guinea Savanna 1. Malgwi, O. D, 2.Odunze, A.C., 1.Aminu, A and 1.Otene J.J
1.Department of Soil and Environmental Management, Faculty of Agriculture Kogi State University, Anyigba Kogi State, Nigeria
2. Ahmadu Bello University Zaria, Faculty of Agriculture, Department of Soil Science
Abstract
Soil aggregate stability is a vital indicator for improving soil quality and controlling soil losses. This study aimed to assess the effect of fallow forage legumes and fertilizer application on wet and dry stability aggregate and soil organic carbon on Alfisols of Guinea Savanna, Nigeria. The study was conducted at the Institute for Agricultural Research (IAR) experimental field, Samaru Zaria. Treat-ment consisted of 3 plots (Centrosema pascuorum (Cp planted), Macrotyloma uniflorum (Mu planted) and control-natural vegetation regrowth). The soil samples collected were dried at room temperature and then separated into six aggregate fractions. Aggregate stability assessment results showed that dry stable aggregate fraction was significantly influenced by fallow management practice where Cp planted fallow recorded the highest amount in soil aggregate sizes of 2000 μm (0.99 g kg-1). Concerning wet stable aggre-gate, the proportion of 2000 μm sized aggregate fraction had the highest value (0.22 g kg-1) under treatment Cp. However, 0 kg N ha-
1 produced the highest quantity in 2000 μm (0.23 g kg-1) sized stable aggregates, and there was no significant difference in Nitrogen and Phosphorus application rates. The wet mean weight diameter (MWD) was significantly affected by forage legume with Mu planted fallow having the highest value (0.40 g kg-1) while the dry MWD aggregates with Cp recorded the best value (1.37 g kg-1). Cp planted fallow sequestered more carbon (0.65 g kg-1) in the 500 µm aggregates fraction. NVR contributed the highest carbon (0.80 g kg-1) under 50 µm sized aggregates. For carbon content in <50 µm sized aggregates, Mu produced the highest carbon (0.72 g kg-1) in the fraction. Conclusively, the type of management practices affects the soil aggregation size fractions, which increased soil organic carbon sequestered.
Keywords: Fallow; Forage legumes; Wet aggregate stability; Dry aggregate stability and soil Carbon sequestration.
Corresponding Author’s E-mail Address: [email protected]: Phone: +2348033287687 https://doi.org/10.36265/colsssn.2020.4430 ©2020 Publishingrealtime Ltd. All rights reserved. Peer-review under responsibility of 44th SSSN Conference LoC2020.
Colloquia SSSN 44 (2020) 204-211
205
Soil aggregates are the fundamental units of soil structures and supply to soil carbon sequestration function and car-bon stabilization (Cerdà, 1996; Mekonnen et al., 2015; Brevik et al., 2015). Suitable soil structures present solid nitty-gritty for the storage and stabilization of organic carbon (Jastrow, 1996; Mao et al., 2007; Gelaw, 2013). The unit sizes of aggregates affect their abilities to store organic carbon as well as the circulations of their stored organic carbon components (Abu-Hamdeh et al., 2005; Liu and He, 2009). The distribution and firmness of soil aggregates are directly related to the wearing away the resistance of soil and, therefore, are helpful signs of ero-sion sensitivity (Rachman et al., 2003; Valmis et al., 2005; Guo et al., 2007). According to Le Bissonnais (1996, 1997), soil erosion is primarily a result of the destruction of soil aggregates. Young (1980) and Bryan (2000) deter-mined that aggregate stability affects the erodibility and nutrient holding capacity of the soil. The formation and stability of the water-stable aggregates in the soil are de-pendent on soil organic carbon (SOC), simultaneously vegetation communities affect SOC content through the addition of outer soil organic matter and in turn contribute to the formation of soil aggregates (Gabarrón-Galeote et al., 2013; Mekonnen et al., 2015). Impact of land use changes on aggregate stability and distribution of aggre-gate-associated SOC has always been a research hotspot (Unger, 1997; Dimoyiannis, 2012; Stanchi et al., 2015).
Soil aggregate stability and soil organic matter (SOM) are too many properties that are directly related to each other and usually known as critical indicators of soil productivi-ty, which reduce soil erosion as they improve. Aggregate stability is a multifaceted factor and a significant factor affecting soil organic carbon, soil structure, aeration, infiltration, soil compaction, water retention, and hydrau-lic conductivity. Thus, it is vital to sustain soil aggregate stability to protect soil productivity, effectiveness, and to minimize soil losses (Yu et al., 2015; Onweremadu et al., 2007; Six et al., 2004). Similarly, the presence of soil or-ganic carbon (SOC) in aggregate sizes is necessary for soil quality assessments, which can be easily lost in the ero-sion process (since large aggregates sizes are more stable). This study aimed to assess soil aggregates and size distri-bution in three main plots and soil carbon sequestration from fallow of two forage legumes: Centrosema pascuor-um (Cp) and Macrotyloma uniflorum (Mu) on Alfisols of Guinea Savanna, Nigeria.
2.0 Materials and Methods
2.1. Site location and description
The study was conducted in the experimental field of In-stitute for Agricultural Research (IAR) Samaru Zaria on longitude 7° 38′ E and latitude 11° 11′ N. It is character-ized by a tropical continent type of climate with alternat-ing wet and dry seasons, which vary markedly in intensity and period with attendant effects on agricultural produc-tivity. The soils are formed from loess materials overlying basement complex, covering an area of 43,000 km (Klinkenberg & Higgins, 1968). The clay is predominant-ly Kaolinitic (Ojanuga, 1979) and is typically high in iron (Fe) and aluminium (Al) oxides (Esu & Ojanuga, 1985) and are of paramount agricultural importance (Agbenin & Goladi, 1997). The area has a uni-modal pattern of rain-fall annually, beginning in April and ending in October. Rainfall records show that August recorded the highest rainfall amounts. The area is also characterized by high average monthly maximum temperatures and low mini-
mum temperatures within the year with temperatures peak typically attained in March/April. The maximum and min-imum temperatures during the rainy season range from 14.12°C – 23.17°C and 29.97°C – 38.43°C respectively (Anosike, 1999). The harmattan periods of December to February are mostly associated with lower temperature. Samaru has an extensive range of mean monthly relative humidity (11-85 %) compared with locations at lower lati-tudes within Nigeria (Anosike, 1999). The length of the rainy season, however, has been on the decline in recent years. The regular rainy season had been from February with a steady rise through August when it attains its high-est peak and begins to decline gradually terminating in October.
2.2. Treatments and experimental design
The main plots for this experiment were Centrosema pas-cuorum, Macrotyloma uniflorum and Natural fallow. The sub-plot treatments were a factorial combination of four nitrogen levels (0, 40, 80 and 120 kg N ha-1) and three levels of P (0, 13.2 and 26.4 kg P ha-1). The field was laid out in split-plot arrangement with three replicates. Gross plot size was (5 m x 3 m) = 15 m2, while net plot size was (1.5 m x 5 m) = 7.5 m2. Extra early maize variety (SAMMAZ 11) was used as test crop.
2.3. Soil Analysis
Sampling and Preparation; post-cropping composite soil samples were taken with an auger at depths 0-30 cm. The samples collected were air-dried, grounded and sieved with a 2 mm sieve. The less than 2 mm fraction was ana-lyzed for soil organic carbon.
2.4. Sampling procedure for the determination of aggre-gate size fractions
To estimate Dry Stable Aggregate (DSA) and Wet Stable Aggregate (WSA), individual soil samples were collected randomly in different locations from the same plot, in trip-licate. Samples were sealed in polyethene bags and trans-ported to the laboratory to determine the dry and wet sta-bility of the soil aggregates. Soil samples were air-dried at room temperature for 48 hrs. Plant roots and stones were removed from the samples, and 150 g were measured on the rotary device for sieving (oscillatory sieving analyzer) for the analysis of DSA. This device is enclosed with dif-ferent sizes of sieves that were 2 mm, 1 mm, 500 μm, 250 μm, 50 μm and >50 μm. Each sample was separately put on the top of the sieve (2 mm), and the fixed sieve analyz-er shook for 2 min at 270 rpm. The distributed soil aggre-gates were collected separately in each sieve and weighed on an electrical balance to calculate the distribution of the 2 mm, 1 mm, 500 μm, 250 μm, 50 μm and >50 μm soil aggregates, while for WSA same gram of soil samples were placed in sieves and dipped into water and the sieves were moved up and down at 30 cycles/min for 2 min. The remaining soil sample in each sieve was recorded to calcu-late the water aggregate stability, dry aggregate stability and mean weight diameter by using the formulas below.
Weight of aggregate = weight of can + aggregate – the weight of empty can.
Aggregate size distribution was calculated as the propor-tion of soil retained in each sieve i.e.
Weight of soil retained in the sieve Total weight of soil taken
The mean weight diameter (MWD) was calculated using the formula
Malgwi et al. Colloquia SSSN 44 (2020) 204-211
206
MWD = ∑Pidi
Where Pi = proportion of soil aggregate in the sieve
di = diameter of sieves (Van Bavel, 1949).
2.5. Determination of Organic Carbon (OC)
The organic carbon contents of soil samples were deter-mined using the Walkley-Black wet oxidation method (Nelson & Sommers, 1982).
2.6. Statistical analysis
Data collected were subjected to Analysis of Variance (ANOVA) using a statistical computer package (SAS 2003). The Duncan’s New Multiple Range Test (DNMRT) was used to separate means at 5% probability level (P<0.05).
3.0 Results and Discussions
3.1. Effect of forage legumes planted fallow and fertilizer rate on the stability of dry aggregate fractions.
Dry 2000 µm-sized soil aggregates (DA) was significantly (P≤0.05) influenced by fallow management practices where Centrosema pascuorum (Cp) planted fallow record-ed 3% increase over the control, (Table 1). However, soils under natural vegetative regrowth recorded the lowest values followed by Macrotyloma uniflorum, (Mu) proba-bly because of the nature of the plant materials and contri-butions to soil aggregation. If control Nitrogen (N) ferti-lizer treatment (0 kg Nha-1) gave the highest value (0.93 g kg-1), this could imply that non-application of N-fertilizer could strongly influence the formation of (2000 µm) sized aggregate fraction. Dry 1000 µm- sized aggregates was significantly (P≤0.05) influenced by forage legume plant-ed fallow. Cp planted fallow produced a higher amount of the aggregate fraction (0.25 g kg-1) than natural vegetative regrowth (NVG) (0.23gkg-1) followed by Mu planted fal-low (0.20 g kg-1). This suggests that Cp could improve the soil aggregate fractions 1000 µm better than other treat-
ment. The influence of nitrogen and phosphorus rates on this aggregate fraction was also not significant (Table 1), suggesting that N and P application rates had no effects on 1000 µm sized aggregates fraction. The 500 µm- sized DA were significantly influenced by fallow management prac-tices with the highest values recorded under NVR (0.026 g kg-1) (Table 1). This was followed by Mu (0.025 g kg-1) while Cp planted fallow (0.020 g kg-1) plots significantly recorded the least values. The result implies that the NVR plot produced structurally stable 500 µm soil aggregates relative to other treatments. For DA 250 µm – sized frac-tions, the natural vegetative regrowth recorded the highest values of aggregate fractions with a 29% increase over Cp planted fallow that recorded the least value (0.007 g kg-1). This was followed by that of Mu (0.013 g kg-1). The result implies that NVR could influence the 250 µm aggregates to be stable against wind erosion (Table 1) better than the other treatments. For soil aggregates of 50 µm sized, Mu planted fallow plots treatment resulted in the highest val-ue, which was 36% higher than control (Table 1). It was observed that Mu planted fallow enhanced the develop-ment of 50 µm size aggregates. This may result from in-creased organic matter that binds soil particles and creates organo-mineral complexes while are important for floccu-lating aggregates (Tisdall and Oades, 1982). There were no significant differences between nitrogen and phospho-rus rates used, suggesting that Nitrogen and phosphorus rates had no direct implication on the 50 μm –sized aggre-gate fraction. Regarding dry soil aggregates of <50 µm, natural vegetative regrowth treatment recorded the highest values of 50% over the other treatments (Table 1). Cp planted fallow plot recorded the least value that was statis-tically similar with fallow planted with Mu. This suggests that soils under Cp and Mu planted fallow would resist wind erosion because of low <50 µm aggregation better than natural vegetation regrowth. Wind dislodges and car-ries away small soil aggregates leading to erosion (Unger, 1997). Treatments with the application of 80 kg N ha-1
Table 1: Effects of forage legumes planted fallow and fertilizer rates on the stability of dry sieved aggregate fractions
Aggregate fraction→ Treatment↓
2000 µm 1000 µm 500 µm 250 µm 50 µm <50 µm
Legumes (L) Natural 0.91b 0.23b 0.026a 0.018a 0.081b 0.006a Centrosema 0.99a 0.25a 0.020c 0.007c 0.101a 0.003b Macrotyloma 0.77c 0.20c 0.025b 0.013b 0.103a 0.003b SE± 0.02 0.006 0.0015 0.001 0.002 0.0007 Nitrogen(N) kg ha-1 0 0.93 0.23 0.025a 0.012 0.094 0.0038b 40 0.90 0.23 0.023b 0.013 0.095 0.0044ab 80 0.85 0.22 0.024ab 0.013 0.095 0.0048a 120 0.89 0.22 0.024ab 0.015 0.094 0.0044ab SE± 0.03 0.007 0.0017 0.001 0.002 0.0008 Phosphorus (P) kg ha-1 0 0.90 0.22 0.02 0.01 0.093 0.0045 13.2 0.89 0.23 0.02 0.01 0.097 0.0043 26.4 0.89 0.23 0.02 0.02 0.094 0.0044 SE± 0.02 0.006 0.0015 0.001 0.002 0.0007 Interaction L X N NS NS * NS * * L X P NS NS NS NS NS * N X P NS NS NS NS NS NS LXNXP NS NS NS NS NS NS
Means in a column of any set of treatments followed by unlike letters are significantly different at P ≤0.05 using DMRT. *- Significant NS- Not Significant
Malgwi et al. Colloquia SSSN 44 (2020) 204-211
207
recorded the highest dry aggregates of <50 µm - sized (0048 g kg-1) and suggests that application of 80 kg N ha-1 in the soil might have NVR plant root biomass that en-hanced soil <50 µm aggregation.
3.2. Effect of forage legumes planted fallow and fertilizer rates on wet aggregates fractions.
The proportion of 2000 µm sized aggregate fraction was significantly (P≤0.05) affected by treatments Cp recorded the highest value (0.22 g kg-1) and was followed by fallow planted with Mu (Table 2). The value for the NVR treat-ments was significantly lower than for the other treatment. Treatments with non-application of nitrogen (0 kg N ha-1), recorded the highest wet 2000 µm aggregates fraction (0.23 g kg-1) though it was statistically similar to 40 and 80 kg N ha-1 treatment. This implies that Cp, Mu and N fertilizer rates application enhanced the development of 2000 µm aggregates better than the NVR treatment. The proportion of 1000 µm - sized wet aggregates fraction was not significantly (P≤0.05) affected by forage legumes planted fallow. Similarly, N and P application rates did not significantly (P≤0.05) affect 1000 µm- sized wet ag-gregates (Table 2). The WA stability of 500 µm - sized fractions was significantly (P≤0.05) influenced by the fallow management practices; with highest values record-ed under NVR (0.020 g kg-1) and 1.41% increase over Mu
Planted fallow. The lower value was recorded under Cp fallow treatments (Table 2). This implies that NVR could stabilize the soil aggregates against erosion by water better than the planted legume fallows. However, 0 kg N ha-1 produced the highest quantity of 500 µm – sized stable aggregates (0.025 g kg-1). P application rates did not sig-nificantly (P≤0.05) affect the development of the aggre-gate fraction. The 250 µm – sized WA fractions, were significantly (P≤0.05) influenced by the fallow manage-ment practices. The highest value was recorded under nat-ural vegetative regrowth (0.018 g kg-1) with 13.89% in-crease over fallow planted with Mu. Cp fallow treatment recorded the least value. This suggests that NVR regrowth increased the 250 µm size aggregates, consequently pro-ducing more structurally stable 250 µm size aggregates that would resist erosion by water. N and P application rates did not significantly (P≤0.05) affect the fraction of the aggregate. Among the forage legume planted fallow, Mu treatment recorded the highest 50 µm – sized aggre-gates (0.103 g kg-1) followed by Cp planted fallow and then the (0.101 g kg-1) control. It was observed that Mu planted fallow enhanced the formation of 50 µm size ag-gregates better than the others. There were no significant (P≤0.05) differences between nitrogen and phosphorus rates used (Table 2). For <50 µm – sized WA, there were no significant differences between forage legume planted
Table 2: Effects of forage legumes planted fallow and fertilizer rates on the stability of wet aggregate fractions of a savannah Alfisol. Aggregate fraction→ Treatment↓
2000 µm 1000 µm 500 µm 250 µm 50 µm <50 µm
Legumes (L) Control 0.16b 0.03 0.026a 0.018a 0.081b 0.006 Centrosema 0.22a 0.03 0.020c 0.007c 0.101a 0.003 Macrotyloma 0.20ab 0.02 0.025b 0.013b 0.103a 0.026 SE± 0.015 0.006 0.0015 0.001 0.002 0.014 Nitrogen(N) kg ha-1 0 0.23a 0.03 0.025a 0.012 0.094 0.0038 40 0.21a 0.02 0.023b 0.013 0.095 0.0044 80 0.15b 0.02 0.024ab 0.013 0.095 0.0048 120 0.20a 0.03 0.024ab 0.014 0.094 0.0357 SE± 0.017 0.006 0.0017 0.001 0.003 0.016 Phosphorus (P) kg ha-1 0 0.21 0.03 0.02 0.01 0.093 0.004 13.2 0.18 0.02 0.02 0.01 0.097 0.004 26.4 0.20 0.03 0.02 0.02 0.094 0.027 SE± 0.015 0.006 0.0015 0.001 0.002 0.014 Interaction L X N * NS * NS * NS L X P NS NS NS NS NS NS N X P NS NS NS NS NS NS LXNXP NS NS NS NS NS NS
Means in a column of any set of treatments followed by unlike letters are significantly different at P ≤0.05 using DMRT. *- Signifi-cant NS- Not Significant.
fallow treatment, although Mu produced the highest value (0.026 g kg-1). This was followed by Cp fallow and con-trol (Table 2). This implies that Mu can stabilize soil ag-gregate fractions of <50 µm in diameter. Nitrogen and phosphorus application rates did not significantly (P≤0.05) affect <50 µm WA.
3.3. Effect of forage legumes planted fallow and fertilizer rates on the wet and dry mean weight diameter of soils.
The wet mean weight diameter (MWD) was significantly
(P≤0.05) affected by forage legume planted fallow man-agement practices, with Mu fallow planted having the highest value (0.40 g kg-1), followed by that of Cp (0.37 g kg-1) and then control (0.33 g kg-1) (Table 3). This sug-gests that the planted forage legumes enhanced soil aggre-gation better than the control. The high wet MWD value recorded under Mu planted fallow could be attributed to the nature of Mu to contribute high carbon materials to support more stable aggregates than the other treatments. Treatments with non – application of nitrogen 0 kg N ha-1
Malgwi et al. Colloquia SSSN 44 (2020) 204-211
208
had significantly (P≤0.05) higher values of wet MWD. This could be attributed to an increase in microbial-derived agent produced by micro soil organism as a result of using N-fertilizer as a source of energy.
The dry MWD was also significantly (P≤0.05) affected by forage legume planted fallow management practices, with Cp planted fallow having the highest value (1.37 g kg-1), and followed by NVR (1.26 g kg-1) treatment (Table 3). Mu planted fallow had the lowest value (1.12 g kg-1). This
Means in a column of any set of treatments followed by unlike letters are significantly different at P ≤ 0.05 using DMRT. *- Significant NS- Not Significant
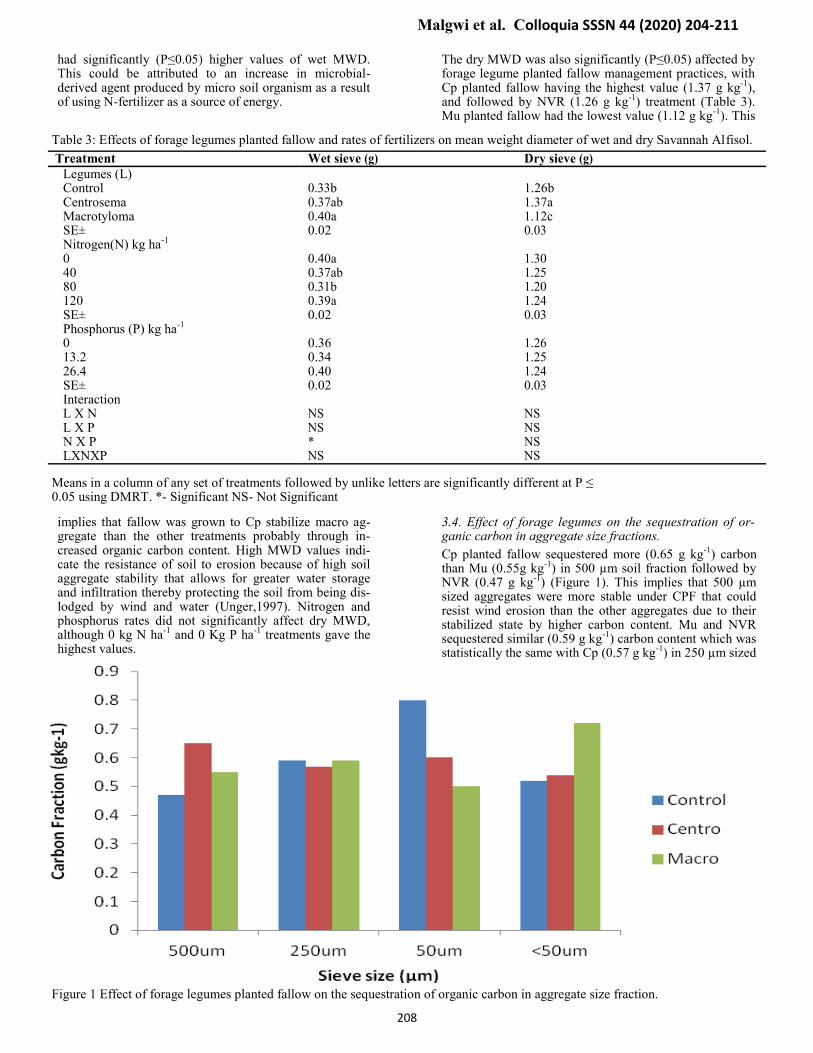
Figure 1 Effect of forage legumes planted fallow on the sequestration of organic carbon in aggregate size fraction.
implies that fallow was grown to Cp stabilize macro ag-gregate than the other treatments probably through in-creased organic carbon content. High MWD values indi-cate the resistance of soil to erosion because of high soil aggregate stability that allows for greater water storage and infiltration thereby protecting the soil from being dis-lodged by wind and water (Unger,1997). Nitrogen and phosphorus rates did not significantly affect dry MWD, although 0 kg N ha-1 and 0 Kg P ha-1 treatments gave the highest values.
3.4. Effect of forage legumes on the sequestration of or-ganic carbon in aggregate size fractions.
Cp planted fallow sequestered more (0.65 g kg-1) carbon than Mu (0.55g kg-1) in 500 µm soil fraction followed by NVR (0.47 g kg-1) (Figure 1). This implies that 500 µm sized aggregates were more stable under CPF that could resist wind erosion than the other aggregates due to their stabilized state by higher carbon content. Mu and NVR sequestered similar (0.59 g kg-1) carbon content which was statistically the same with Cp (0.57 g kg-1) in 250 µm sized
Table 3: Effects of forage legumes planted fallow and rates of fertilizers on mean weight diameter of wet and dry Savannah Alfisol.
Treatment Wet sieve (g) Dry sieve (g)
Legumes (L) Control 0.33b 1.26b Centrosema 0.37ab 1.37a Macrotyloma 0.40a 1.12c SE± 0.02 0.03 Nitrogen(N) kg ha-1 0 0.40a 1.30 40 0.37ab 1.25 80 0.31b 1.20 120 0.39a 1.24 SE± 0.02 0.03 Phosphorus (P) kg ha-1 0 0.36 1.26 13.2 0.34 1.25 26.4 0.40 1.24 SE± 0.02 0.03 Interaction L X N NS NS L X P NS NS N X P * NS LXNXP NS NS
Malgwi et al. Colloquia SSSN 44 (2020) 204-211
209
aggregates. These suggest that soil aggregates of 250 µm size were not differently affected by either of the treat-ment. Considering 50 µm sized aggregates, NVR contrib-uted the highest carbon (0.80 g kg-1) in the aggregate sized class than the other treatment. This implies that 50 µm stable aggregates were bound by organic carbon better under NVR. Regarding the content of OC in <50 µm sized aggregates, the forage legumes were not significantly dif-ferent, but Mu produced the highest carbon (0.72 g kg-1) in the fraction (Figure 1).
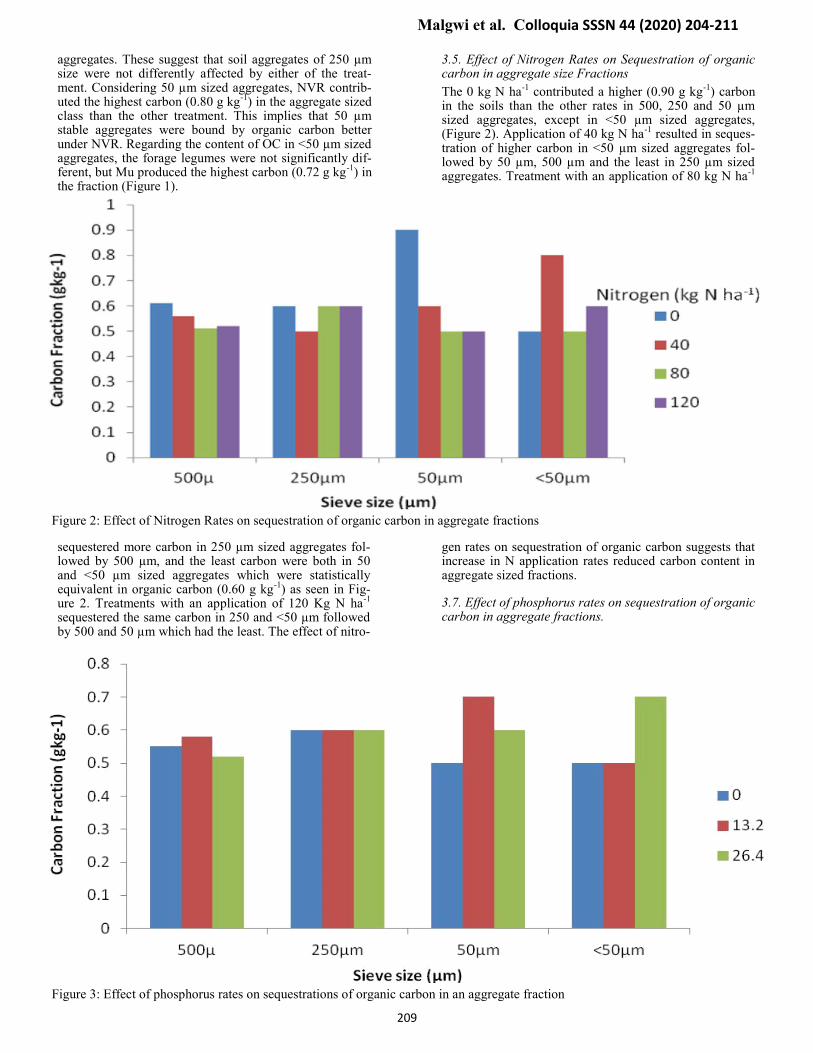
3.5. Effect of Nitrogen Rates on Sequestration of organic carbon in aggregate size Fractions
The 0 kg N ha-1 contributed a higher (0.90 g kg-1) carbon in the soils than the other rates in 500, 250 and 50 µm sized aggregates, except in <50 µm sized aggregates, (Figure 2). Application of 40 kg N ha-1 resulted in seques-tration of higher carbon in <50 µm sized aggregates fol-lowed by 50 µm, 500 µm and the least in 250 µm sized aggregates. Treatment with an application of 80 kg N ha-1
Figure 2: Effect of Nitrogen Rates on sequestration of organic carbon in aggregate fractions
Figure 3: Effect of phosphorus rates on sequestrations of organic carbon in an aggregate fraction
sequestered more carbon in 250 µm sized aggregates fol-lowed by 500 µm, and the least carbon were both in 50 and <50 µm sized aggregates which were statistically equivalent in organic carbon (0.60 g kg-1) as seen in Fig-ure 2. Treatments with an application of 120 Kg N ha-1 sequestered the same carbon in 250 and <50 µm followed by 500 and 50 µm which had the least. The effect of nitro-
gen rates on sequestration of organic carbon suggests that increase in N application rates reduced carbon content in aggregate sized fractions.
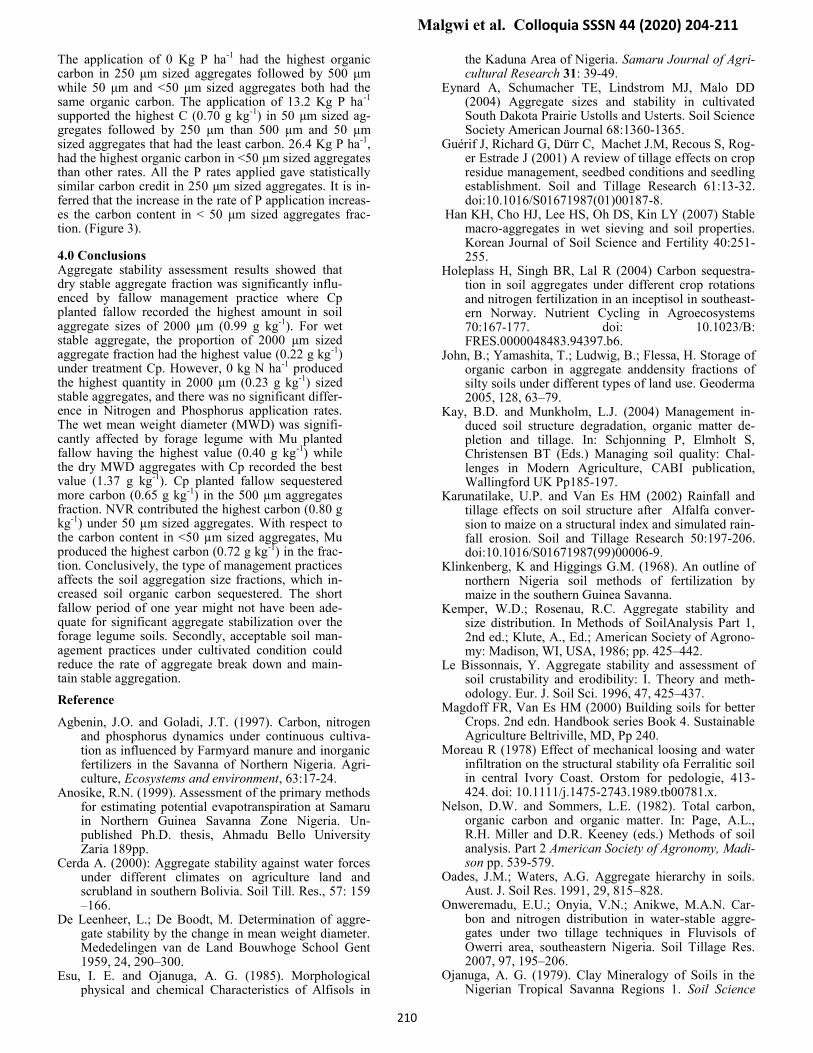
3.7. Effect of phosphorus rates on sequestration of organic carbon in aggregate fractions.
Malgwi et al. Colloquia SSSN 44 (2020) 204-211
210
The application of 0 Kg P ha-1 had the highest organic carbon in 250 μm sized aggregates followed by 500 μm while 50 μm and <50 μm sized aggregates both had the same organic carbon. The application of 13.2 Kg P ha-1 supported the highest C (0.70 g kg-1) in 50 μm sized ag-gregates followed by 250 μm than 500 μm and 50 μm sized aggregates that had the least carbon. 26.4 Kg P ha-1, had the highest organic carbon in <50 μm sized aggregates than other rates. All the P rates applied gave statistically similar carbon credit in 250 μm sized aggregates. It is in-ferred that the increase in the rate of P application increas-es the carbon content in < 50 μm sized aggregates frac-tion. (Figure 3).
4.0 Conclusions Aggregate stability assessment results showed that dry stable aggregate fraction was significantly influ-enced by fallow management practice where Cp planted fallow recorded the highest amount in soil aggregate sizes of 2000 μm (0.99 g kg-1). For wet stable aggregate, the proportion of 2000 μm sized aggregate fraction had the highest value (0.22 g kg-1) under treatment Cp. However, 0 kg N ha-1 produced the highest quantity in 2000 μm (0.23 g kg-1) sized stable aggregates, and there was no significant differ-ence in Nitrogen and Phosphorus application rates. The wet mean weight diameter (MWD) was signifi-cantly affected by forage legume with Mu planted fallow having the highest value (0.40 g kg-1) while the dry MWD aggregates with Cp recorded the best value (1.37 g kg-1). Cp planted fallow sequestered more carbon (0.65 g kg-1) in the 500 µm aggregates fraction. NVR contributed the highest carbon (0.80 g kg-1) under 50 µm sized aggregates. With respect to the carbon content in <50 µm sized aggregates, Mu produced the highest carbon (0.72 g kg-1) in the frac-tion. Conclusively, the type of management practices affects the soil aggregation size fractions, which in-creased soil organic carbon sequestered. The short fallow period of one year might not have been ade-quate for significant aggregate stabilization over the forage legume soils. Secondly, acceptable soil man-agement practices under cultivated condition could reduce the rate of aggregate break down and main-tain stable aggregation.
Reference
Agbenin, J.O. and Goladi, J.T. (1997). Carbon, nitrogen and phosphorus dynamics under continuous cultiva-tion as influenced by Farmyard manure and inorganic fertilizers in the Savanna of Northern Nigeria. Agri-culture, Ecosystems and environment, 63:17-24.
Anosike, R.N. (1999). Assessment of the primary methods for estimating potential evapotranspiration at Samaru in Northern Guinea Savanna Zone Nigeria. Un-published Ph.D. thesis, Ahmadu Bello University Zaria 189pp.
Cerda A. (2000): Aggregate stability against water forces under different climates on agriculture land and scrubland in southern Bolivia. Soil Till. Res., 57: 159–166.
De Leenheer, L.; De Boodt, M. Determination of aggre-gate stability by the change in mean weight diameter. Mededelingen van de Land Bouwhoge School Gent 1959, 24, 290–300.
Esu, I. E. and Ojanuga, A. G. (1985). Morphological physical and chemical Characteristics of Alfisols in
the Kaduna Area of Nigeria. Samaru Journal of Agri-cultural Research 31: 39-49.
Eynard A, Schumacher TE, Lindstrom MJ, Malo DD (2004) Aggregate sizes and stability in cultivated South Dakota Prairie Ustolls and Usterts. Soil Science Society American Journal 68:1360-1365.
Guérif J, Richard G, Dürr C, Machet J.M, Recous S, Rog-er Estrade J (2001) A review of tillage effects on crop residue management, seedbed conditions and seedling establishment. Soil and Tillage Research 61:13-32. doi:10.1016/S01671987(01)00187-8.
Han KH, Cho HJ, Lee HS, Oh DS, Kin LY (2007) Stable macro-aggregates in wet sieving and soil properties. Korean Journal of Soil Science and Fertility 40:251-255.
Holeplass H, Singh BR, Lal R (2004) Carbon sequestra-tion in soil aggregates under different crop rotations and nitrogen fertilization in an inceptisol in southeast-ern Norway. Nutrient Cycling in Agroecosystems 70:167-177. doi: 10.1023/B: FRES.0000048483.94397.b6.
John, B.; Yamashita, T.; Ludwig, B.; Flessa, H. Storage of organic carbon in aggregate anddensity fractions of silty soils under different types of land use. Geoderma 2005, 128, 63–79.
Kay, B.D. and Munkholm, L.J. (2004) Management in-duced soil structure degradation, organic matter de-pletion and tillage. In: Schjonning P, Elmholt S, Christensen BT (Eds.) Managing soil quality: Chal-lenges in Modern Agriculture, CABI publication, Wallingford UK Pp185-197.
Karunatilake, U.P. and Van Es HM (2002) Rainfall and tillage effects on soil structure after Alfalfa conver-sion to maize on a structural index and simulated rain-fall erosion. Soil and Tillage Research 50:197-206. doi:10.1016/S01671987(99)00006-9.
Klinkenberg, K and Higgings G.M. (1968). An outline of northern Nigeria soil methods of fertilization by maize in the southern Guinea Savanna.
Kemper, W.D.; Rosenau, R.C. Aggregate stability and size distribution. In Methods of SoilAnalysis Part 1, 2nd ed.; Klute, A., Ed.; American Society of Agrono-my: Madison, WI, USA, 1986; pp. 425–442.
Le Bissonnais, Y. Aggregate stability and assessment of soil crustability and erodibility: I. Theory and meth-odology. Eur. J. Soil Sci. 1996, 47, 425–437.
Magdoff FR, Van Es HM (2000) Building soils for better Crops. 2nd edn. Handbook series Book 4. Sustainable Agriculture Beltriville, MD, Pp 240.
Moreau R (1978) Effect of mechanical loosing and water infiltration on the structural stability ofa Ferralitic soil in central Ivory Coast. Orstom for pedologie, 413-424. doi: 10.1111/j.1475-2743.1989.tb00781.x.
Nelson, D.W. and Sommers, L.E. (1982). Total carbon, organic carbon and organic matter. In: Page, A.L., R.H. Miller and D.R. Keeney (eds.) Methods of soil analysis. Part 2 American Society of Agronomy, Madi-son pp. 539-579.
Oades, J.M.; Waters, A.G. Aggregate hierarchy in soils. Aust. J. Soil Res. 1991, 29, 815–828.
Onweremadu, E.U.; Onyia, V.N.; Anikwe, M.A.N. Car-bon and nitrogen distribution in water-stable aggre-gates under two tillage techniques in Fluvisols of Owerri area, southeastern Nigeria. Soil Tillage Res. 2007, 97, 195–206.
Ojanuga, A. G. (1979). Clay Mineralogy of Soils in the Nigerian Tropical Savanna Regions 1. Soil Science
Malgwi et al. Colloquia SSSN 44 (2020) 204-211
211
Society of America Journal, 43(6), 1237-1242. Pagliai U (2005) Soil Crusting, paper presented at 2005
college of soil physics ICIP Trieste Italy September 2005.
Peng, X.; Yan, X.; Zhou, H.; Zhang, Y.Z.; Sun, H. As-sessing the contributions of sesquioxides and soil or-ganic matter to aggregation in an Ultisol under long-
term fertilization. Soil Tillage Res. 2015, 146, 89–98. Singh, M.J.; Khera, KL Physical Indicators of Soil Quality
in Relation to Soil Erodibility under Different Land Uses. Arid Land Res. Manag. 2009, 23, 152–167.
Six J, Paustian K, Elliott ET, Combrink C (2000) Soil structure and organic matter. I.Distribution of aggre-gates size classes and aggregate associated carbon.
Malgwi et al. Colloquia SSSN 44 (2020) 204-211