Embed Size (px)
Citation preview
Colloidal Fluids, Glasses, and Crystals
Pierre WiltziusBeckman Institute for Advanced Science and Technology
University of Illinois, Urbana-Champaign
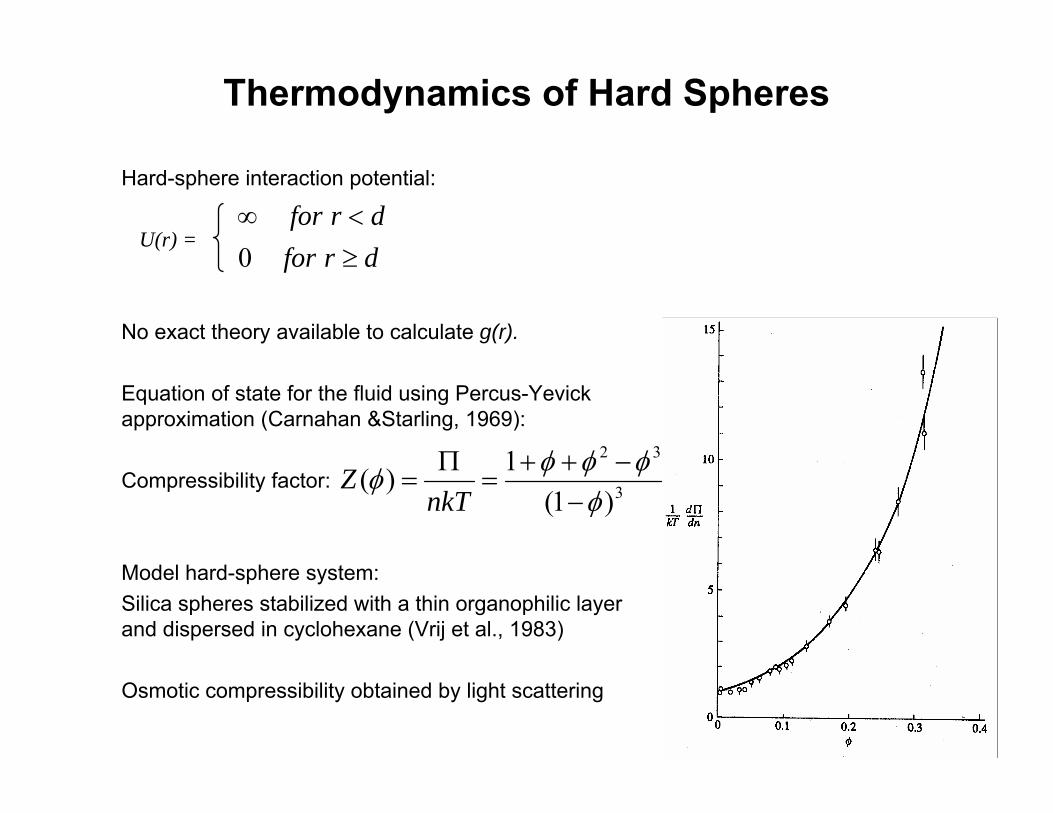
Thermodynamics of Hard Spheres
Hard-sphere interaction potential:
U(r) =
No exact theory available to calculate g(r).
Equation of state for the fluid using Percus-Yevick approximation (Carnahan &Starling, 1969):
Compressibility factor:
Model hard-sphere system:Silica spheres stabilized with a thin organophilic layer and dispersed in cyclohexane (Vrij et al., 1983)
Osmotic compressibility obtained by light scattering
3
32
)1(1)(
φφφφφ
−−++
=Π
=nkT
Z
drfordrfor
≥<∞
0
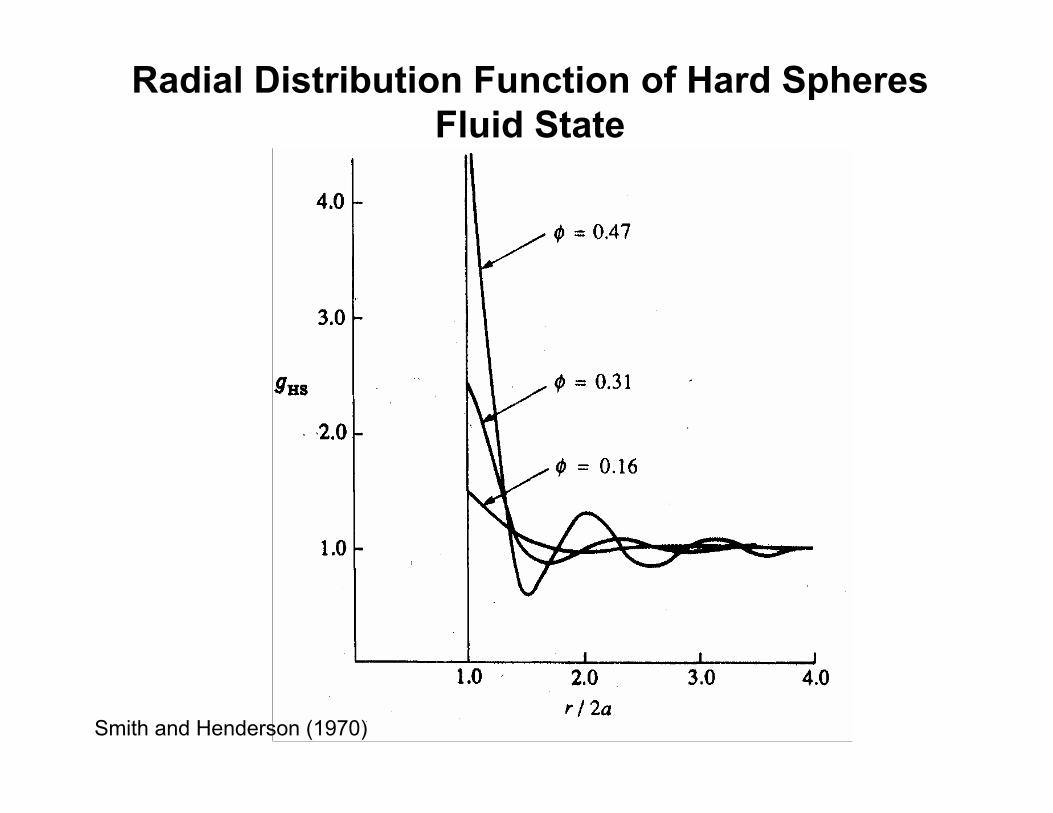
Radial Distribution Function of Hard SpheresFluid State
Smith and Henderson (1970)
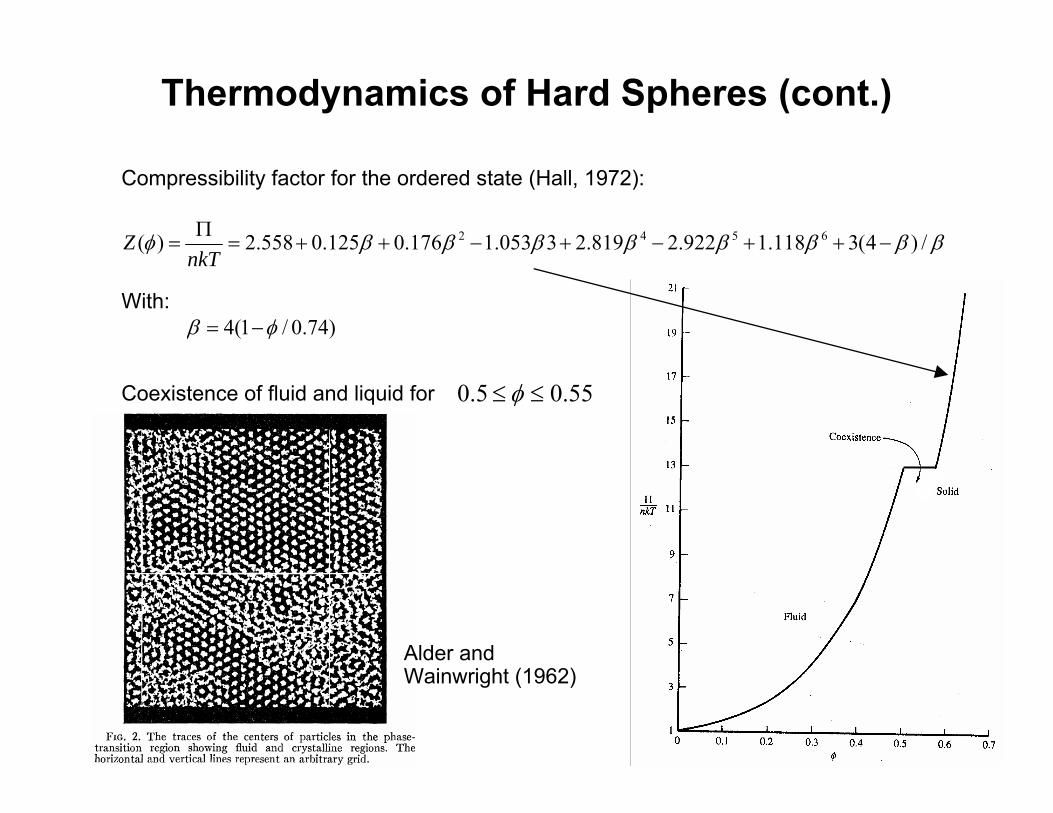
Thermodynamics of Hard Spheres (cont.)
Compressibility factor for the ordered state (Hall, 1972):
With:
Coexistence of fluid and liquid for
ββββββββφ /)4(3118.1922.2819.23053.1176.0125.0558.2)( 6542 −++−+−++=Π
=nkT
Z
)74.0/1(4 φβ −=
55.05.0 ≤≤ φ
Alder and Wainwright (1962)
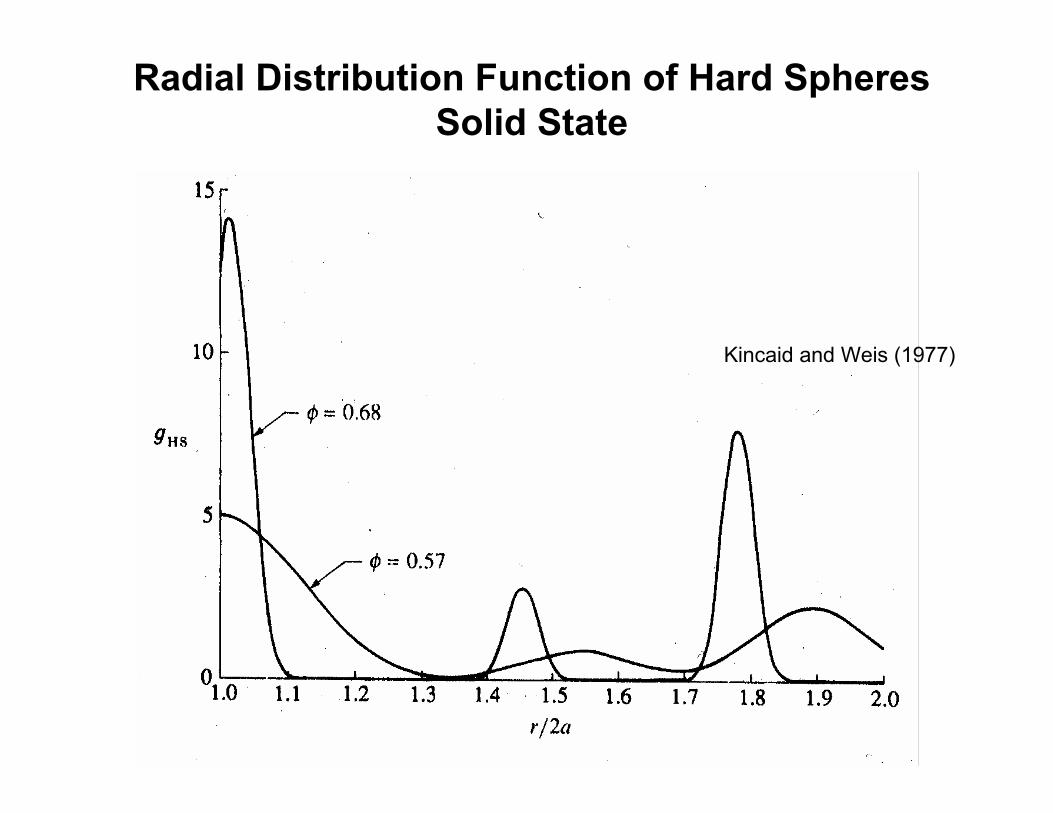
Radial Distribution Function of Hard SpheresSolid State
Kincaid and Weis (1977)
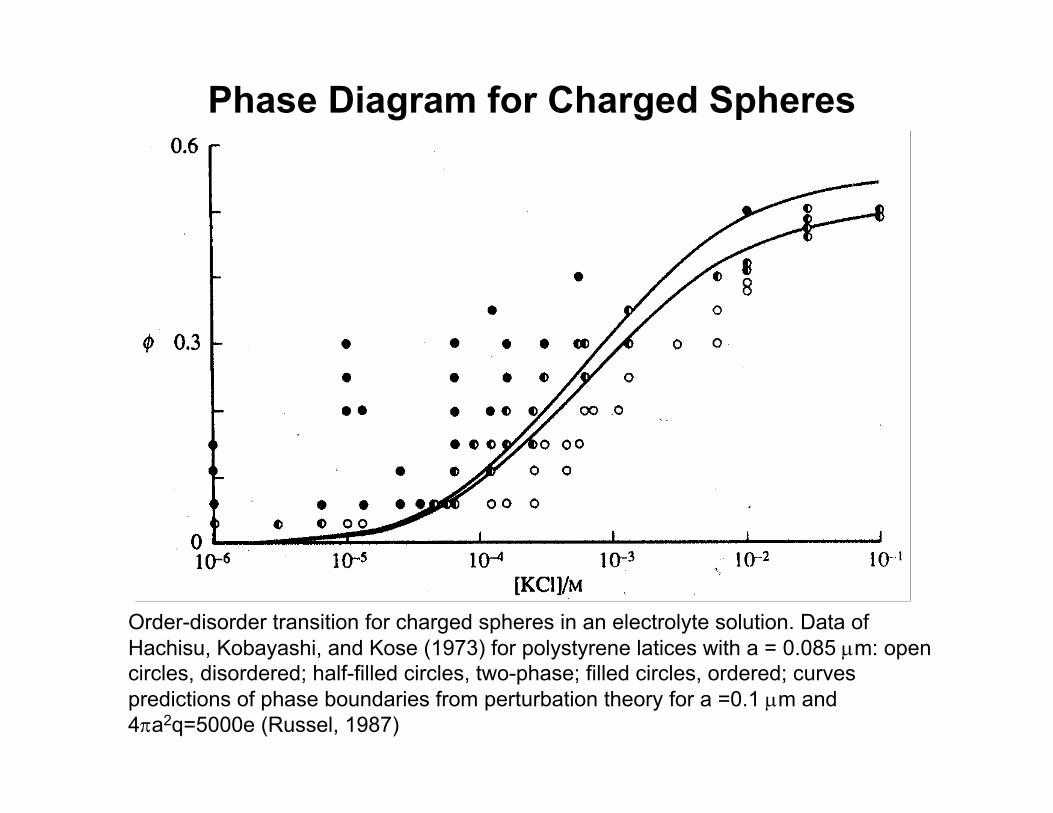
Phase Diagram for Charged Spheres
Order-disorder transition for charged spheres in an electrolyte solution. Data of Hachisu, Kobayashi, and Kose (1973) for polystyrene latices with a = 0.085 μm: open circles, disordered; half-filled circles, two-phase; filled circles, ordered; curves predictions of phase boundaries from perturbation theory for a =0.1 μm and 4πa2q=5000e (Russel, 1987)
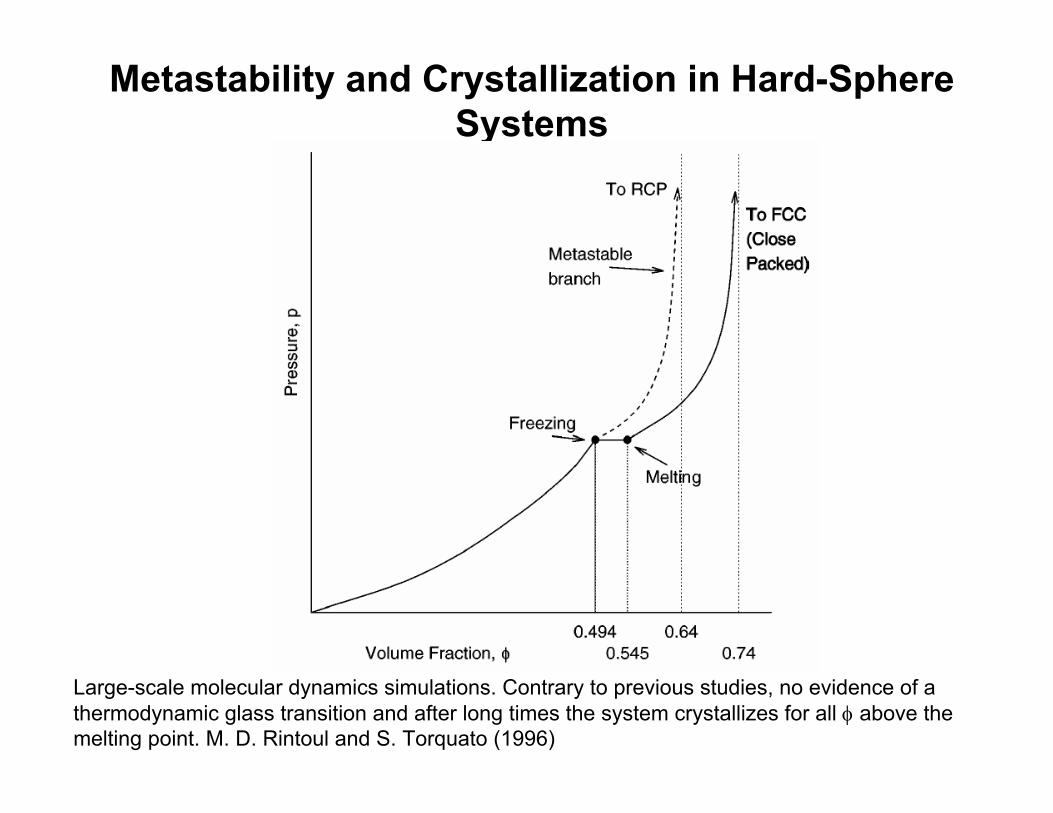
Metastability and Crystallization in Hard-Sphere Systems
Large-scale molecular dynamics simulations. Contrary to previous studies, no evidence of a thermodynamic glass transition and after long times the system crystallizes for all φ above the melting point. M. D. Rintoul and S. Torquato (1996)
References
• N. F. Carnahan and K. E. Starling, J. Chem Phys. 51, 635 (1969)
• A. Vrij, J. W. Jansen, J. K. G. Dhont, C. Pathmamanoharan, M. M. Kops-Werkhoven, and H. M. Fijnaut, Far. Dis. 76, 19 (1983)
• W. R. Smith and D. Henderson, Mol. Phys. 19, 411 (1970)
• K. R. Hall, J. Chem. Phys. 57, 2252 (1972)
• J. M. Kincaid and J. J. Weis, Mol. Phys. 34, 931 (1977)
• W. B. Russel, Dynamics of Colloidal Systems. University of Wisconsin Press (1987)
• M. D. Rintoul and S. Torquato, Phys Rev. Lett. 77, 4201 (1996)
• B. J. Alder and T. E. Wainwright, Phys. Rev. 127, 359 (1962)
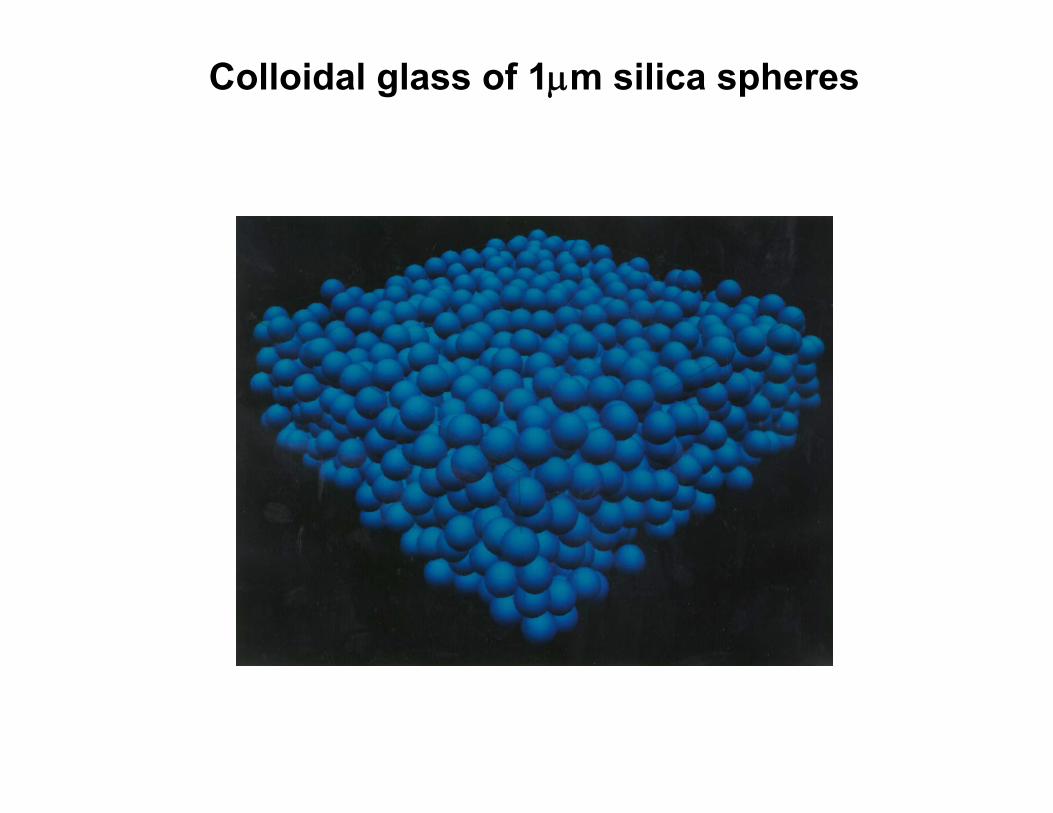
Colloidal glass of 1μm silica spheres
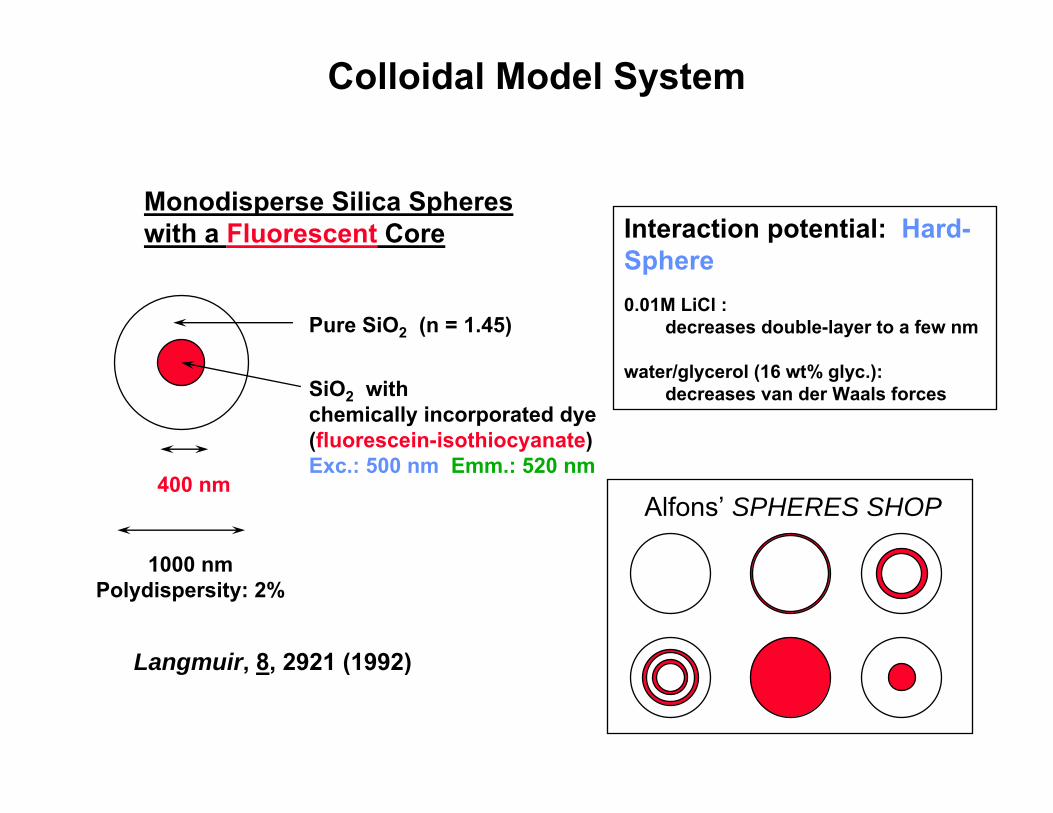
Interaction potential: Hard-Sphere0.01M LiCl :
decreases double-layer to a few nm
water/glycerol (16 wt% glyc.): decreases van der Waals forces
Pure SiO2 (n = 1.45)
SiO2 withchemically incorporated dye(fluorescein-isothiocyanate)Exc.: 500 nm Emm.: 520 nm
400 nm
1000 nmPolydispersity: 2%
Monodisperse Silica Sphereswith a Fluorescent Core
Langmuir, 8, 2921 (1992)
Alfons’ SPHERES SHOP
Colloidal Model System
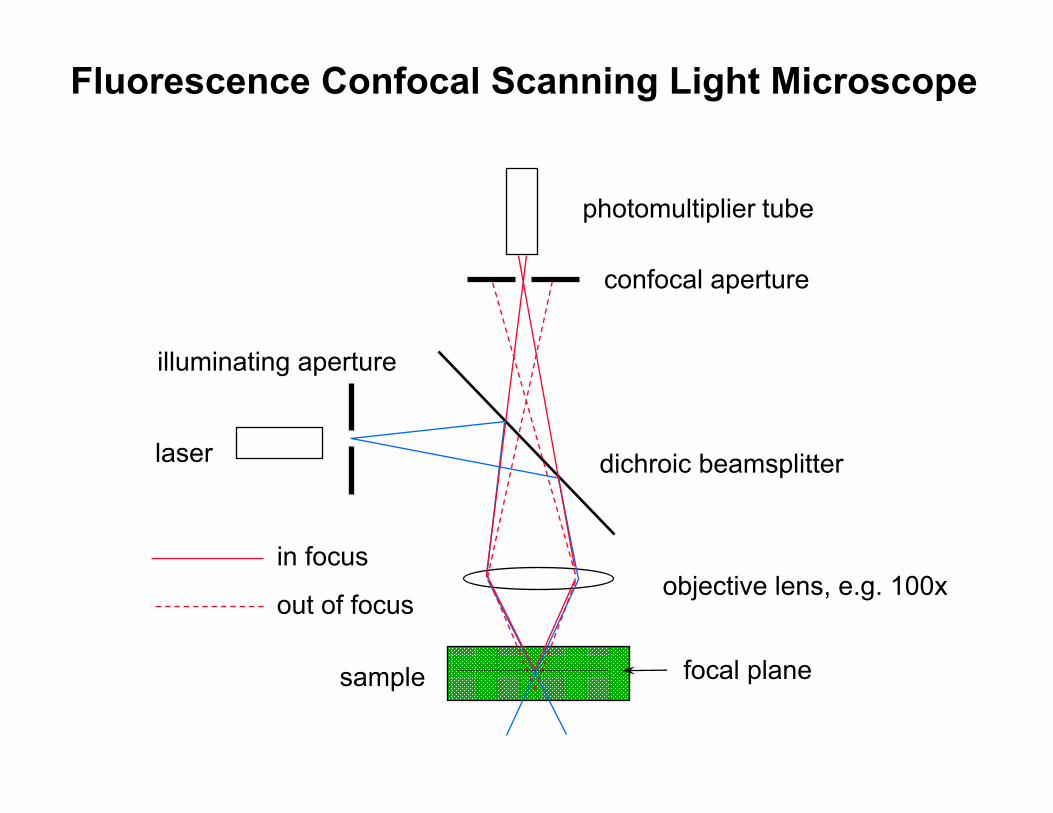
photomultiplier tube
objective lens, e.g. 100x
laser
illuminating aperture
dichroic beamsplitter
confocal aperture
focal planesample
in focus
out of focus
Fluorescence Confocal Scanning Light Microscope
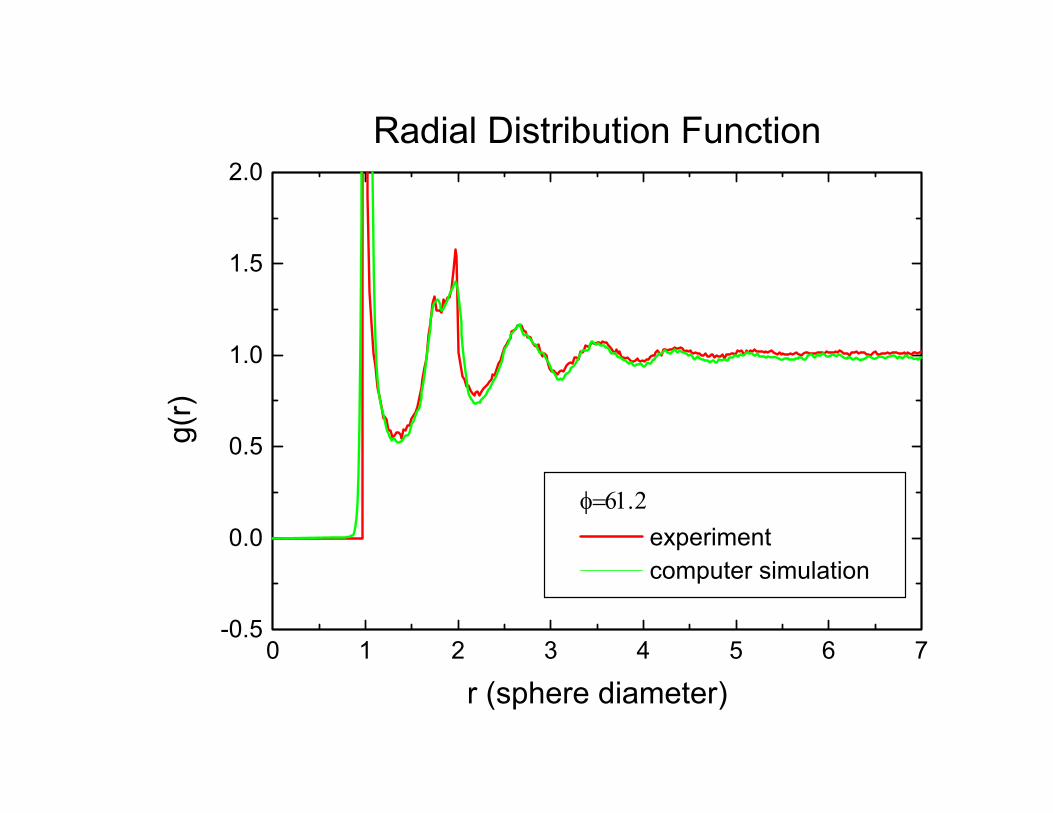
0 1 2 3 4 5 6 7-0.5
0.0
0.5
1.0
1.5
2.0Radial Distribution Function
φ=61.2 experiment computer simulation
g(r)
r (sphere diameter)
0 1 2 3 4 5 6 7-0.5
0.0
0.5
1.0
1.5
2.0
φ=61.2 experiment computer simulation
g(r)
r (sphere diameter)
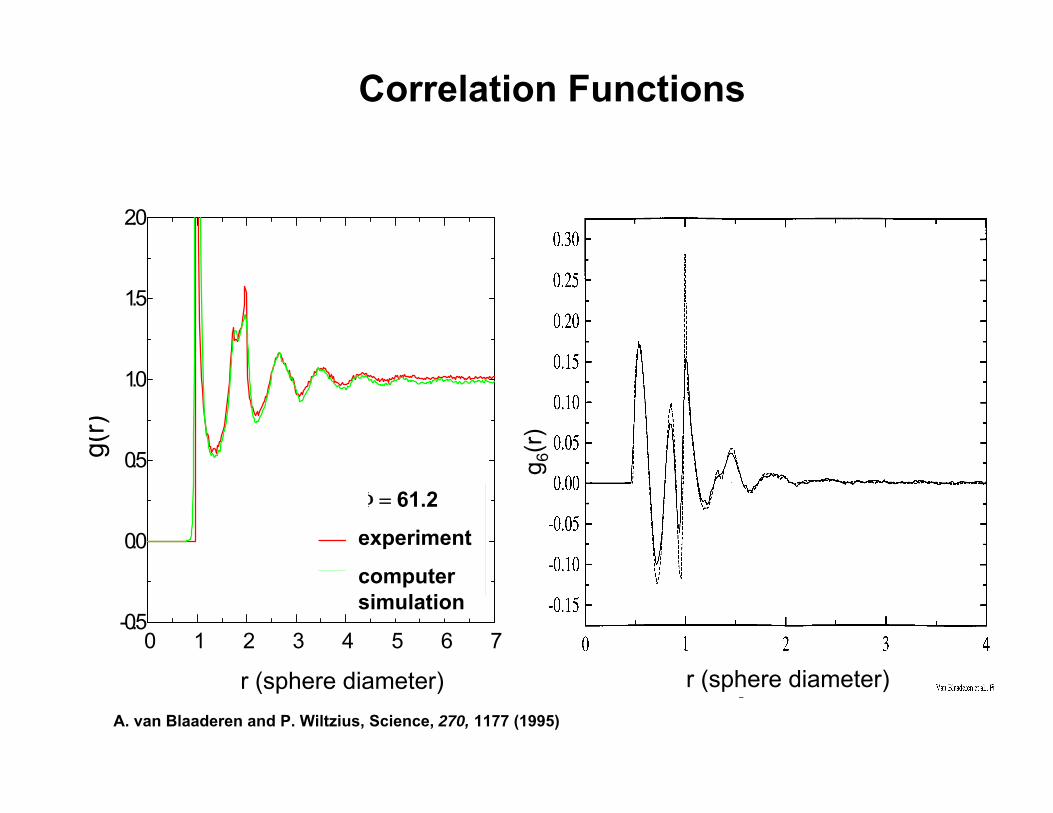
Correlation Functions
Φ = 61.2
experiment
computer simulation
r (sphere diameter) r (sphere diameter)
g 6(r
)
A. van Blaaderen and P. Wiltzius, Science, 270, 1177 (1995)
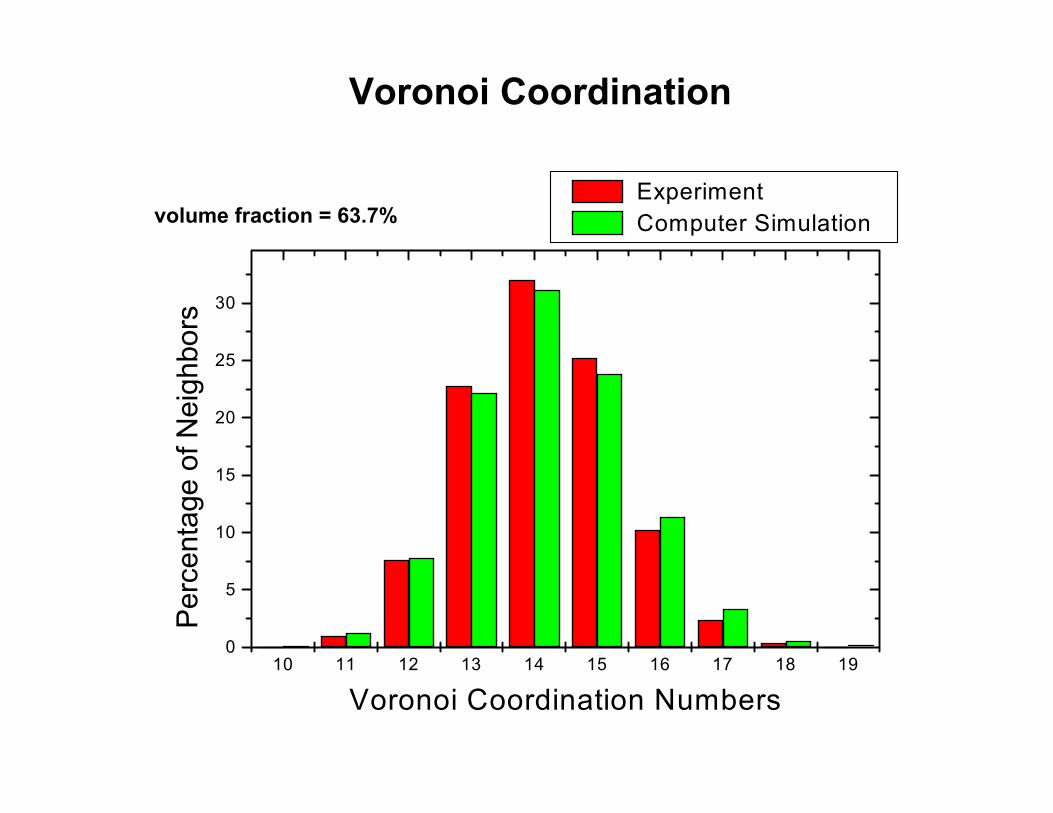
10 11 12 13 14 15 16 17 18 190
5
10
15
20
25
30
Perc
enta
ge o
f Nei
ghbo
rs
Voronoi Coordination Numbers
Experiment Computer Simulationvolume fraction = 63.7%
Voronoi Coordination
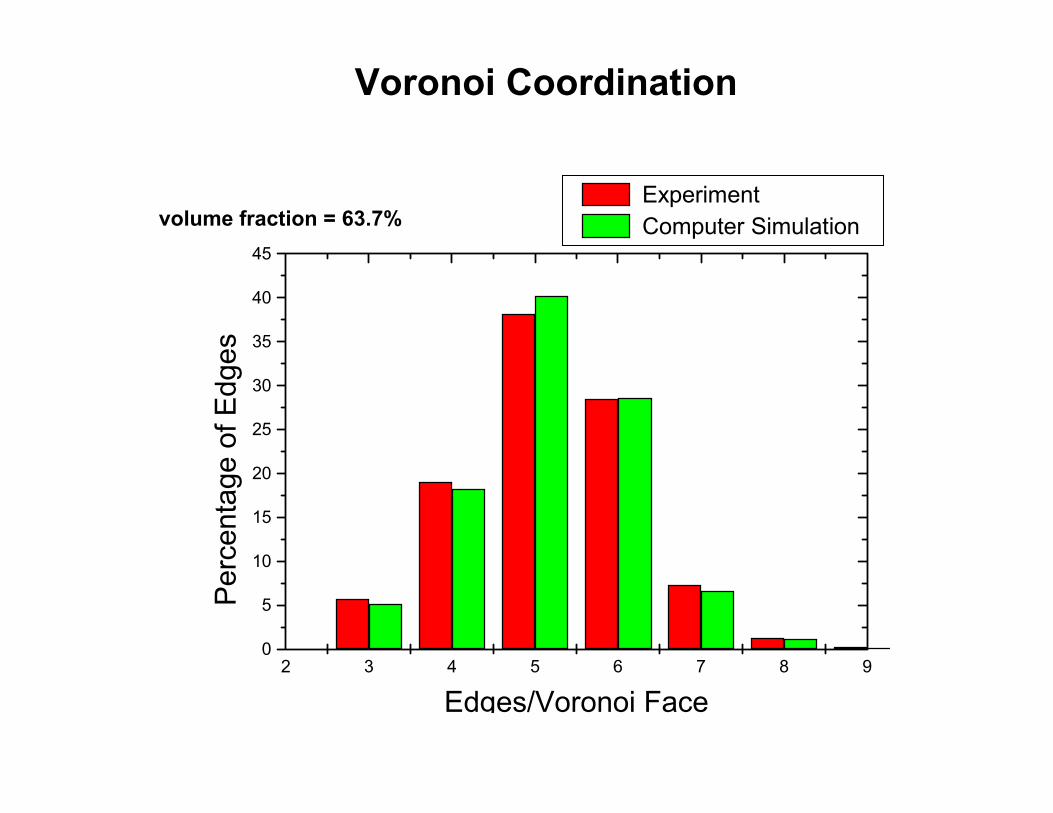
volume fraction = 63.7%
2 3 4 5 6 7 8 90
5
10
15
20
25
30
35
40
45P
erce
ntag
e of
Edg
es
Edges/Voronoi Face
Experiment Computer Simulation
Voronoi Coordination
-0.2 -0.1 0.0 0.10
2
4
6
8
10
12
Experiment Simulation
Perc
enta
ge o
f Bon
ds
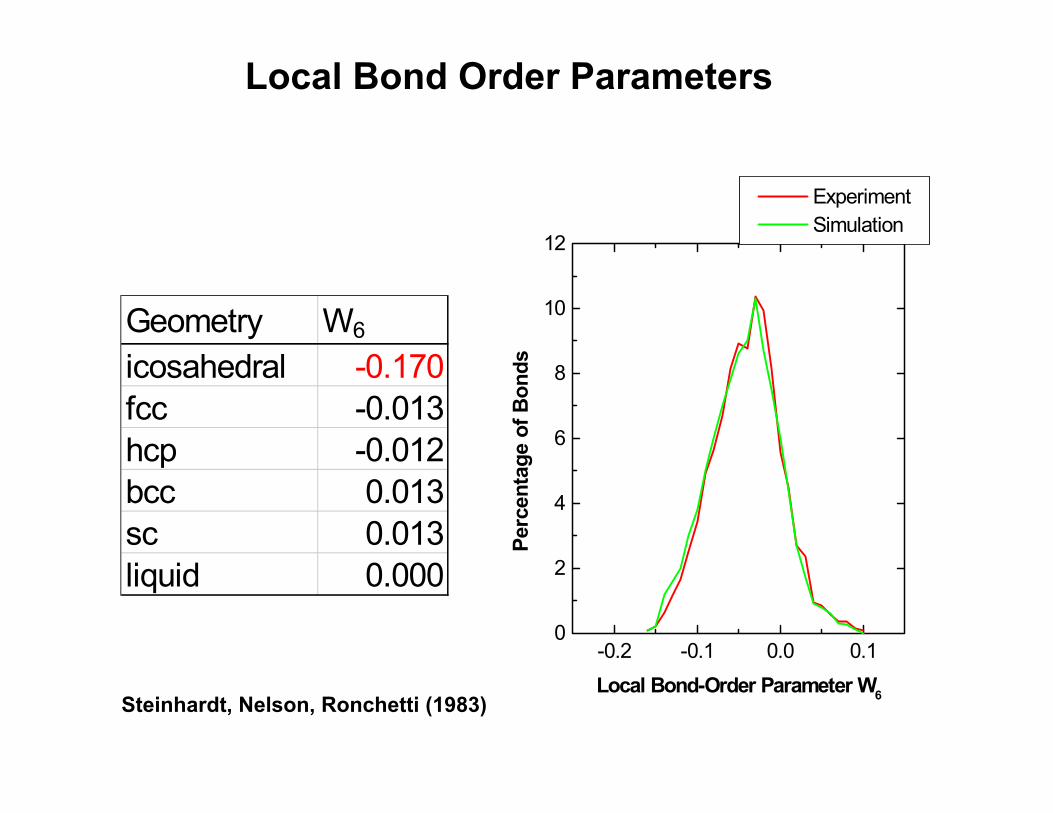
Local Bond-Order Parameter W6
Geometry W6
icosahedral -0.170fcc -0.013hcp -0.012bcc 0.013sc 0.013liquid 0.000
Steinhardt, Nelson, Ronchetti (1983)
Local Bond Order Parameters
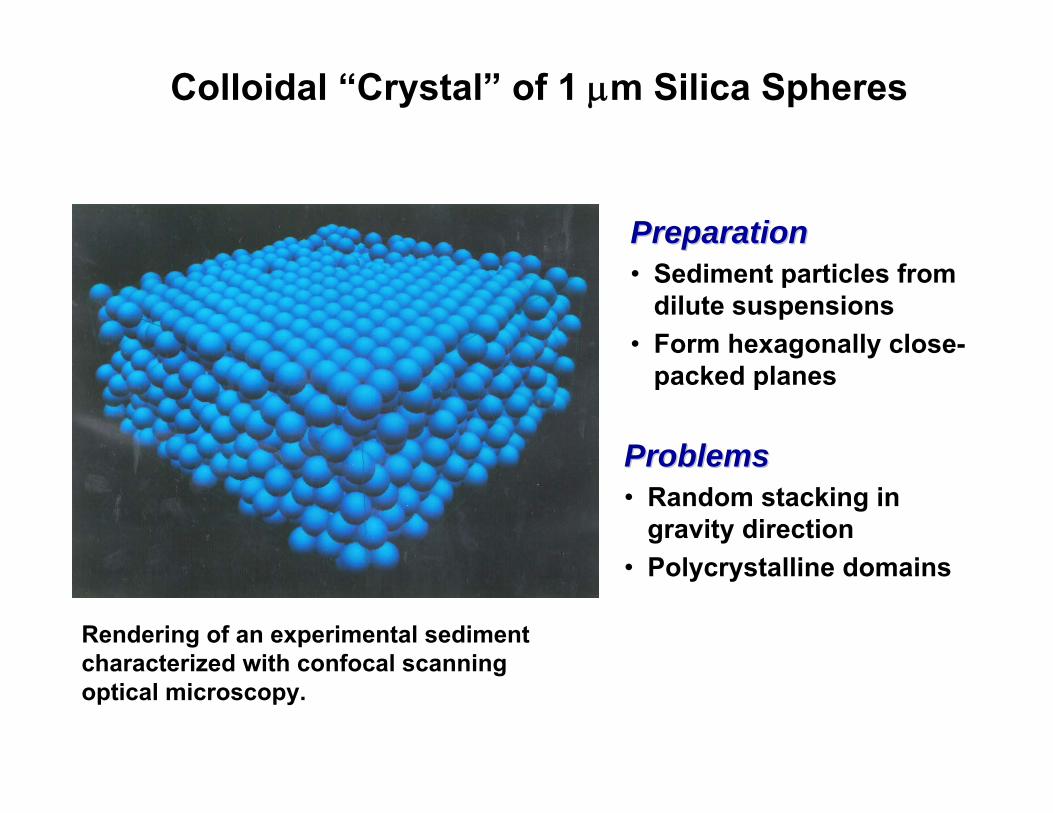
Colloidal “Crystal” of 1 μm Silica Spheres
PreparationPreparation• Sediment particles from
dilute suspensions • Form hexagonally close-
packed planes
Problems Problems • Random stacking in
gravity direction• Polycrystalline domains
Rendering of an experimental sediment characterized with confocal scanning optical microscopy.
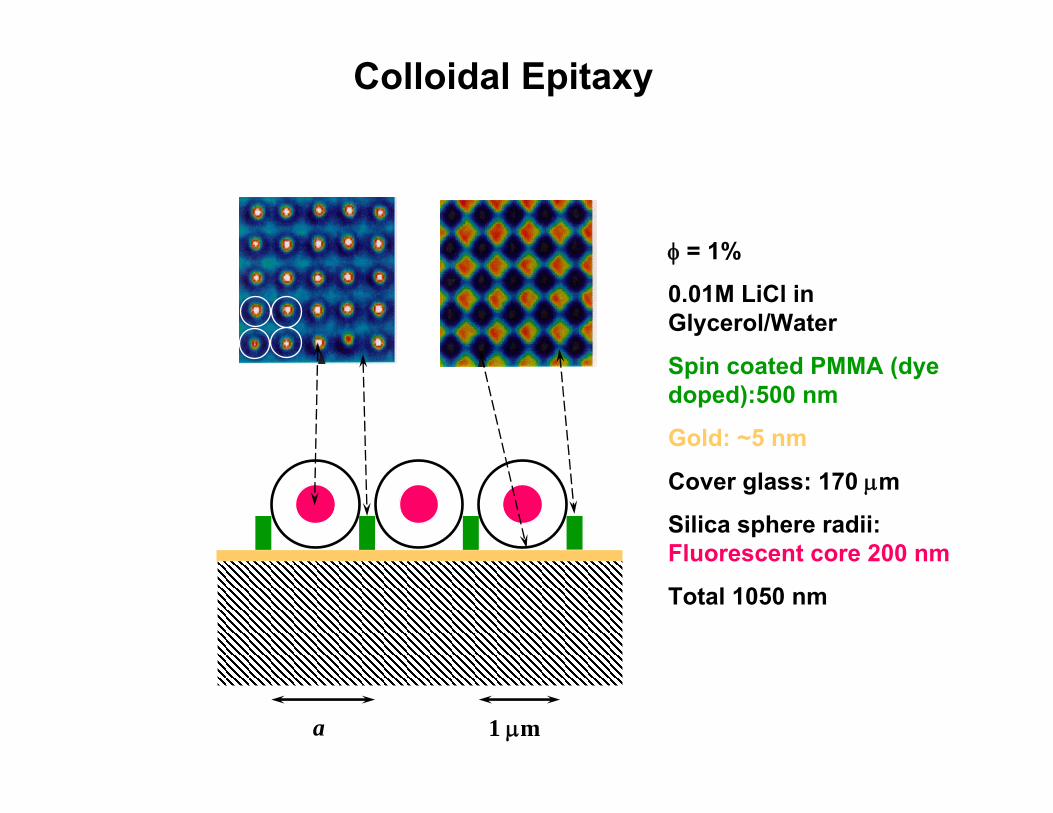
φ = 1%
0.01M LiCl in Glycerol/Water
Spin coated PMMA (dye doped):500 nm
Gold: ~5 nm
Cover glass: 170 μm
Silica sphere radii: Fluorescent core 200 nm
Total 1050 nm
1 μma
Colloidal Epitaxy
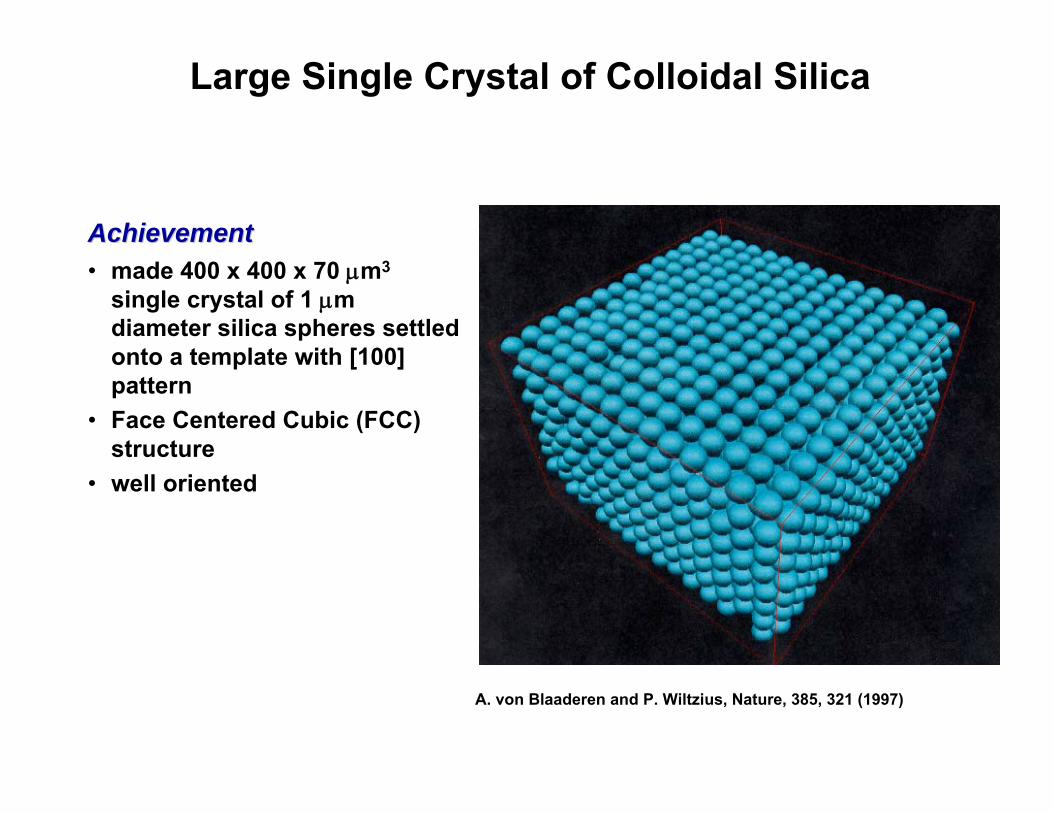
A. von Blaaderen and P. Wiltzius, Nature, 385, 321 (1997)
AchievementAchievement• made 400 x 400 x 70 μm3
single crystal of 1 μm diameter silica spheres settled onto a template with [100] pattern
• Face Centered Cubic (FCC) structure
• well oriented
Large Single Crystal of Colloidal Silica
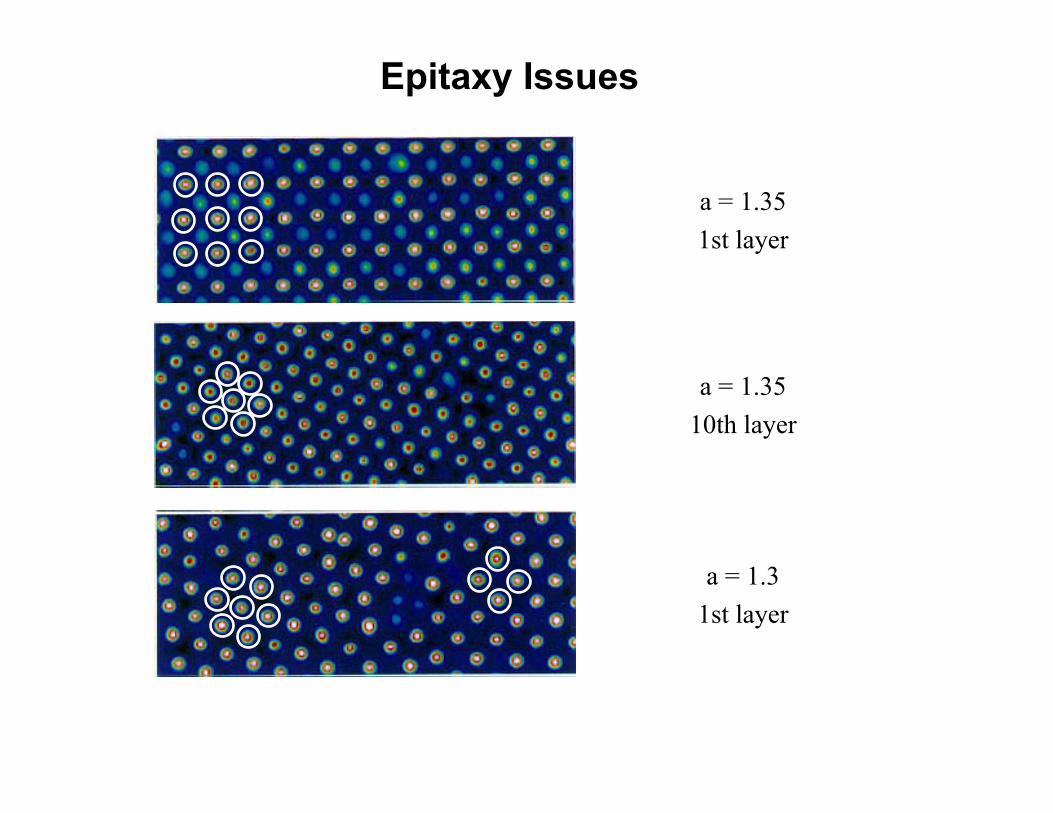
a = 1.351st layer
a = 1.3510th layer
a = 1.31st layer
Epitaxy Issues
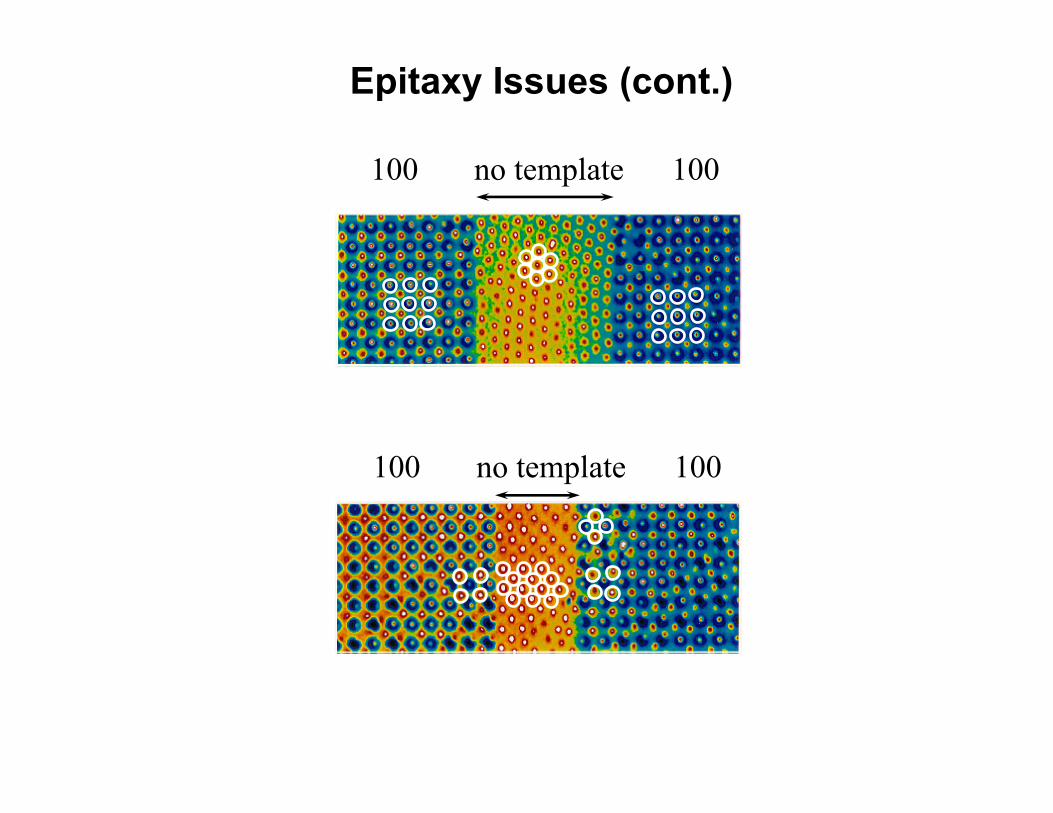
100 no template 100
100 no template 100
Epitaxy Issues (cont.)
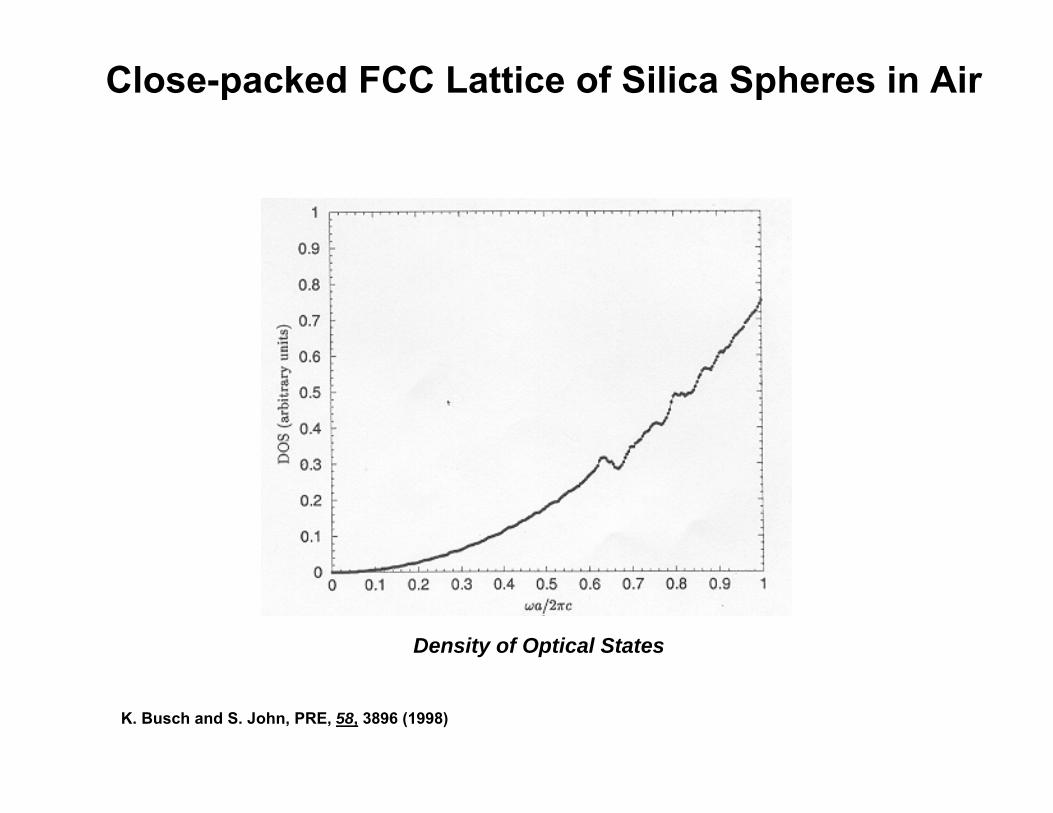
K. Busch and S. John, PRE, 58, 3896 (1998)
Close-packed FCC Lattice of Silica Spheres in Air
Density of Optical States
Density of Optical States
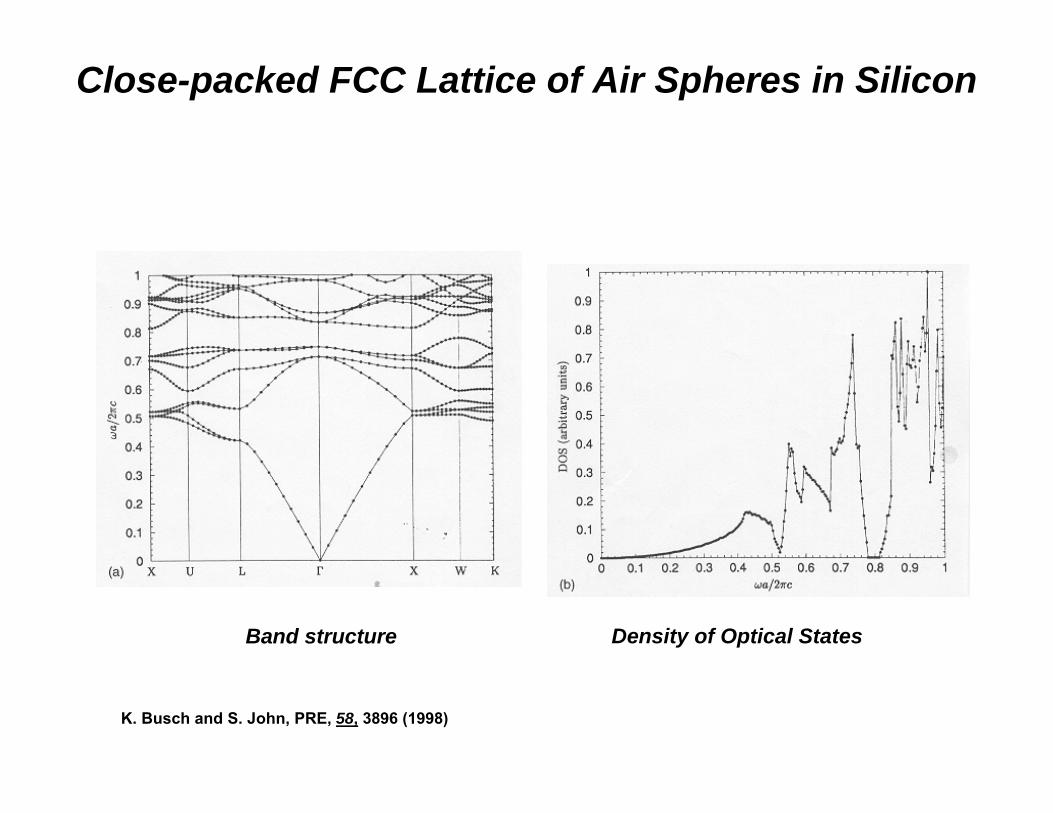
Close-packed FCC Lattice of Air Spheres in Silicon
Band structure
K. Busch and S. John, PRE, 58, 3896 (1998)
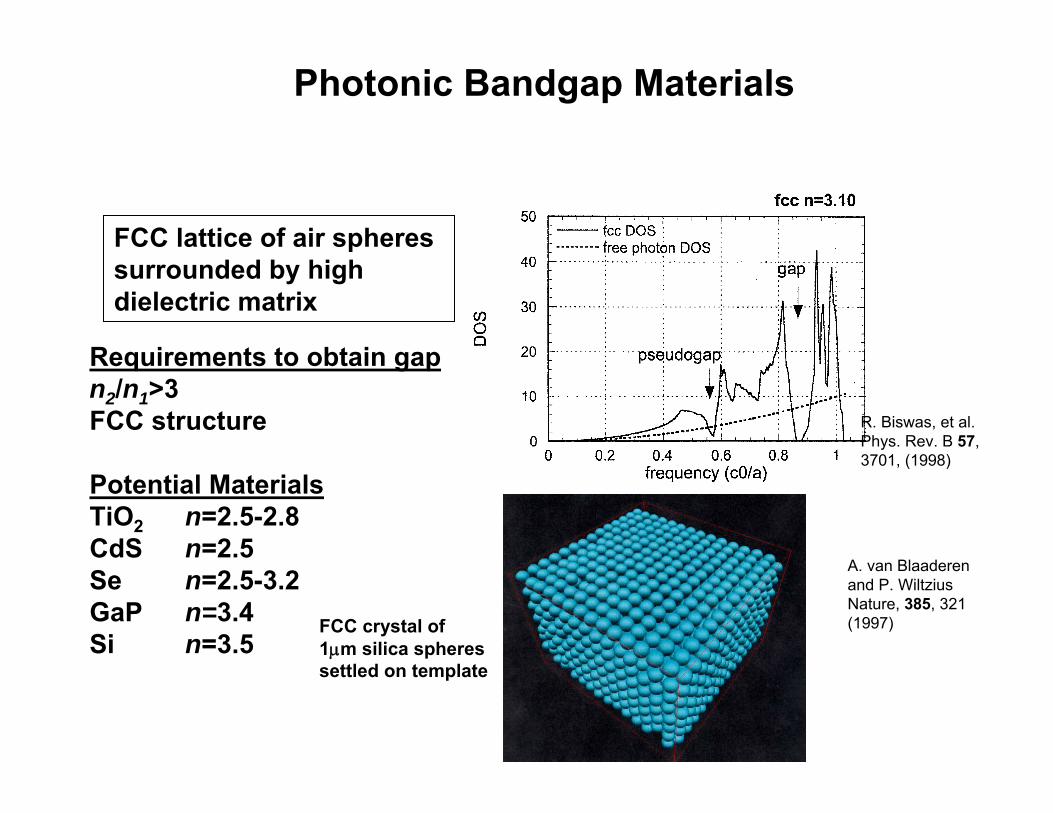
Photonic Bandgap Materials
FCC lattice of air spheres surrounded by high dielectric matrix
Requirements to obtain gapn2/n1>3FCC structure
Potential MaterialsTiO2 n=2.5-2.8CdS n=2.5Se n=2.5-3.2GaP n=3.4Si n=3.5
A. van Blaaderen and P. WiltziusNature, 385, 321 (1997)
R. Biswas, et al. Phys. Rev. B 57, 3701, (1998)
FCC crystal of1μm silica spheres settled on template
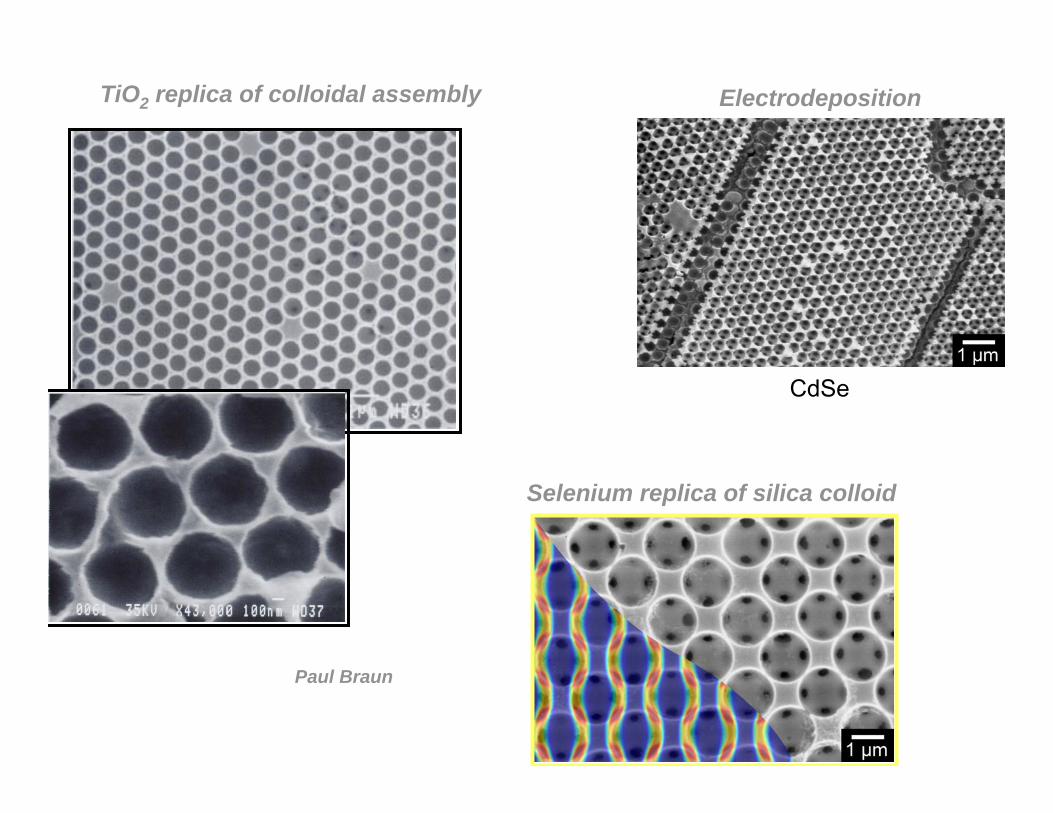
TiO2 replica of colloidal assembly
CdSe
Paul Braun
Electrodeposition
Selenium replica of silica colloid
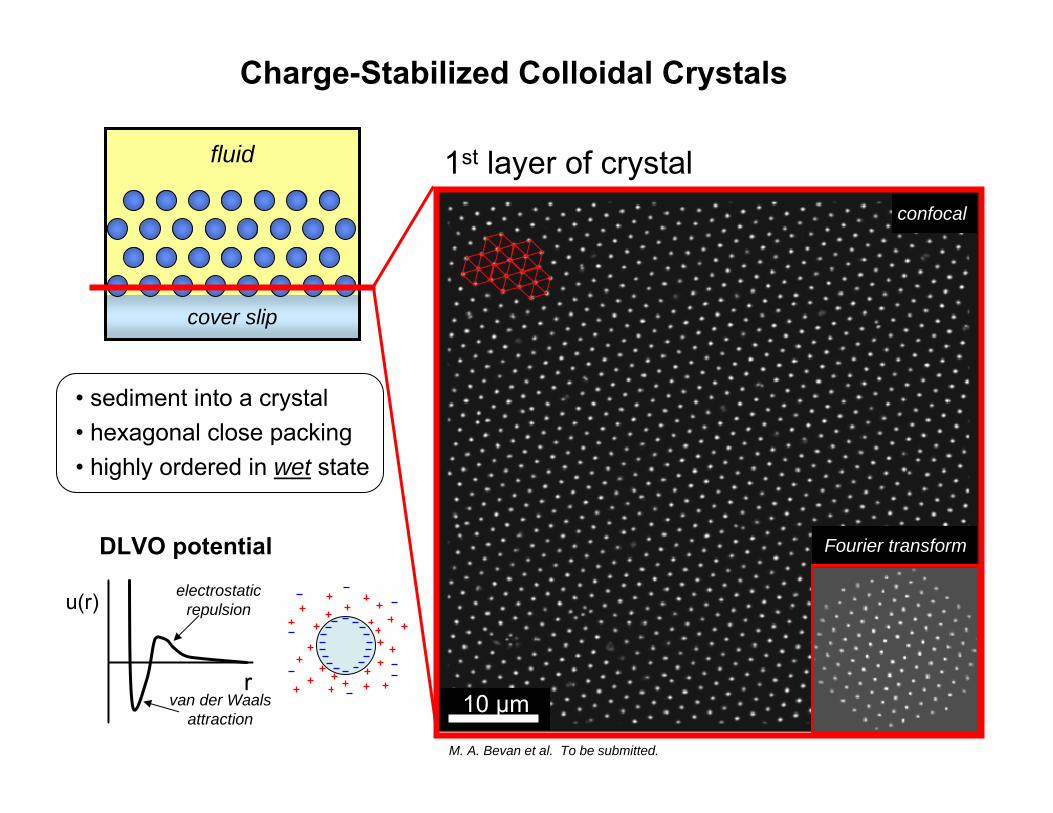
Charge-Stabilized Colloidal Crystals
10 μm
M. A. Bevan et al. To be submitted.
cover slip
1st layer of crystal
• sediment into a crystal• hexagonal close packing• highly ordered in wet state
u(r)
rvan der Waals
attraction
electrostaticrepulsion
DLVO potential
fluid
confocal
Fourier transform
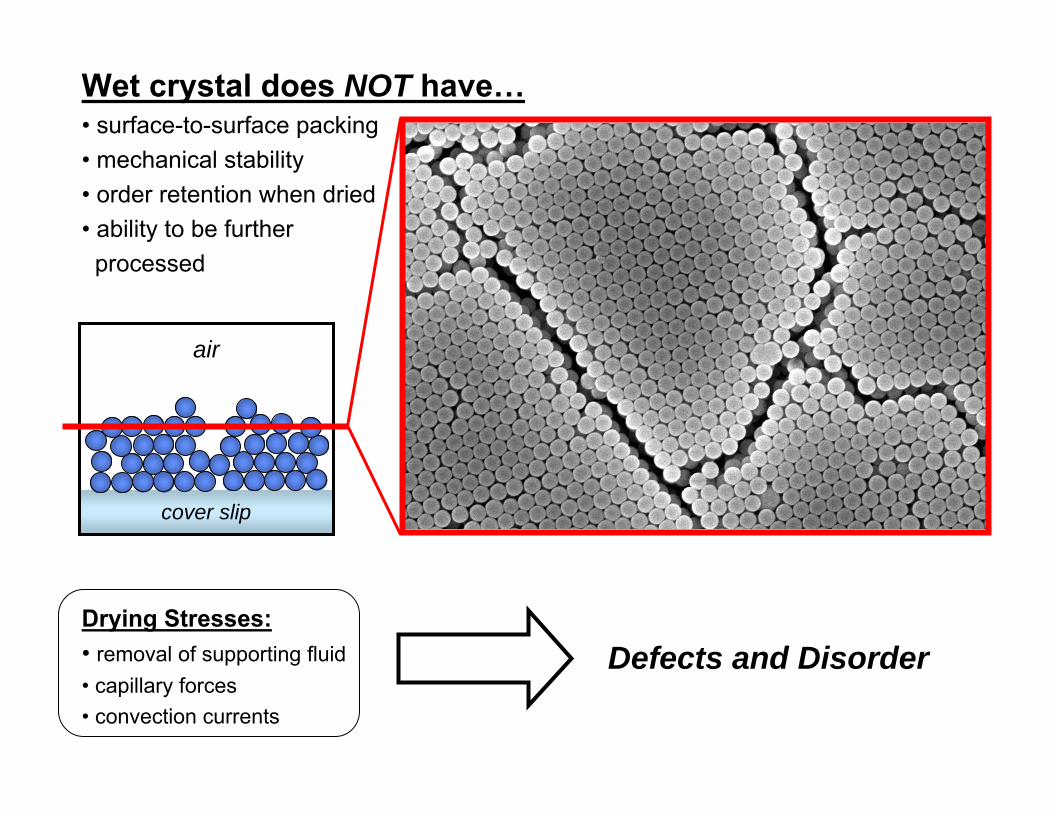
Wet crystal does NOT have…• surface-to-surface packing• mechanical stability• order retention when dried• ability to be furtherprocessed
Drying Stresses:• removal of supporting fluid• capillary forces• convection currents
Defects and Disorder
cover slip
air
add salt
Charge Stabilized
u(r)
rvan der Waals
attraction
electrostaticrepulsion
Screened
u(r)
r
screening
no salt
salt
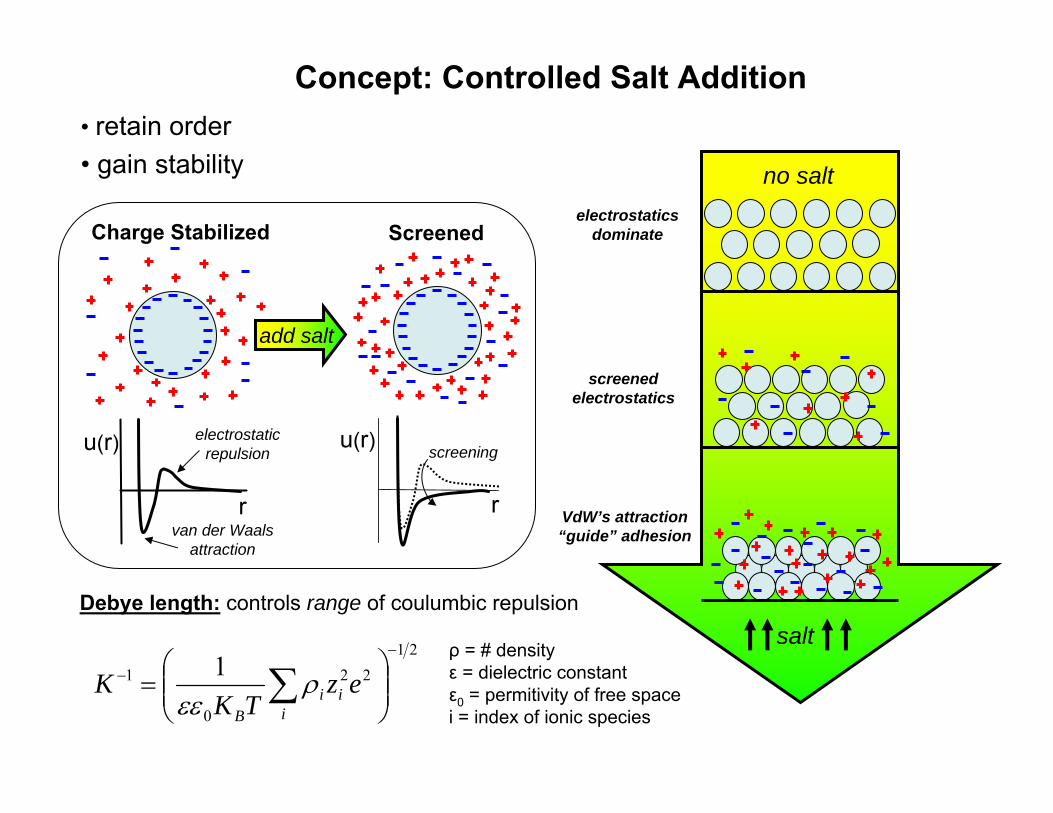
Concept: Controlled Salt Addition• retain order• gain stability
electrostaticsdominate
screenedelectrostatics
VdW’s attraction“guide” adhesion
Debye length: controls range of coulumbic repulsion
2122
0
1 1−
−⎟⎟⎠
⎞⎜⎜⎝
⎛= ∑
iii
B
ezTK
K ρεε
ρ = # densityε = dielectric constantε0 = permitivity of free spacei = index of ionic species
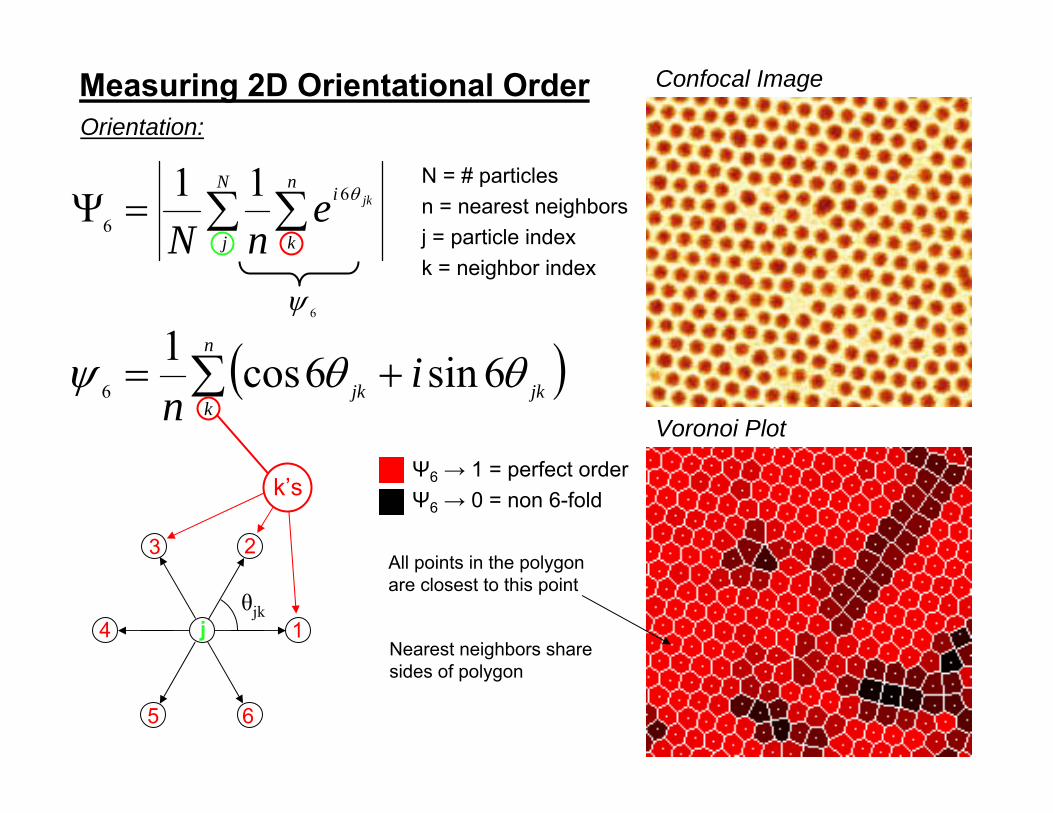
Measuring 2D Orientational OrderOrientation:
N = # particlesn = nearest neighborsj = particle indexk = neighbor index
Confocal Image
Voronoi Plot
∑ ∑=ΨN
j
n
k
i jkenN
θ6
6
11
6ψ
( )∑ +=n
kjkjk i
nθθψ 6sin6cos1
6
Ψ6 → 1 = perfect orderΨ6 → 0 = non 6-fold
All points in the polygonare closest to this point
Nearest neighbors sharesides of polygon
θjk1
23
4
65
j
k’s
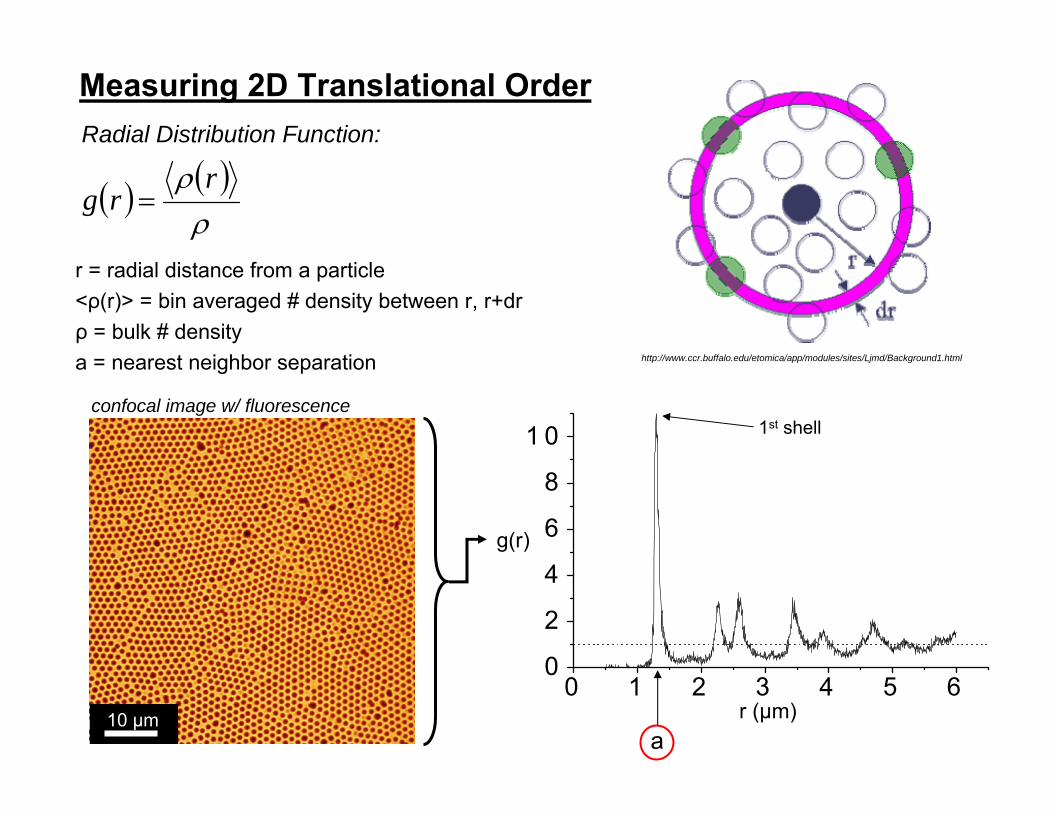
( ) ( )ρ
ρ rrg =
r = radial distance from a particle<ρ(r)> = bin averaged # density between r, r+drρ = bulk # densitya = nearest neighbor separation http://www.ccr.buffalo.edu/etomica/app/modules/sites/Ljmd/Background1.html
Measuring 2D Translational OrderRadial Distribution Function:
0 1 2 3 4 5 60
2
4
6
8
1 0
r (μm)
g(r)
a
1st shell
10 μm
confocal image w/ fluorescence
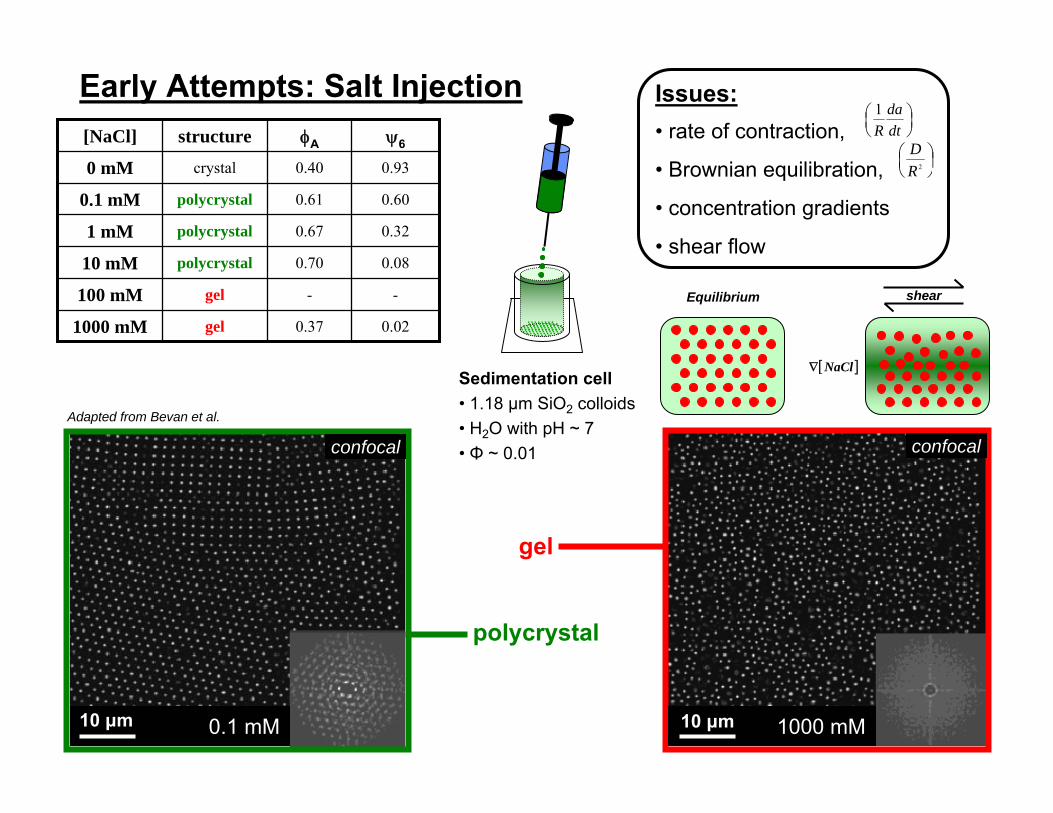
Early Attempts: Salt Injection
0.020.37gel1000 mM
--gel100 mM
0.080.70polycrystal10 mM
0.320.67polycrystal1 mM
0.600.61polycrystal0.1 mM
0.930.40crystal0 mM
ψ6φAstructure[NaCl]
Adapted from Bevan et al.
gel
polycrystal
Issues:• rate of contraction,
• Brownian equilibration,
• concentration gradients
• shear flow
Sedimentation cell• 1.18 μm SiO2 colloids• H2O with pH ~ 7• Φ ~ 0.01
Equilibrium
0.1 mM10 μm 1000 mM10 μm
⎟⎠⎞
⎜⎝⎛
dtda
R1
⎟⎠⎞⎜
⎝⎛
2RD
shear
confocal confocal
[ ]NaCl∇
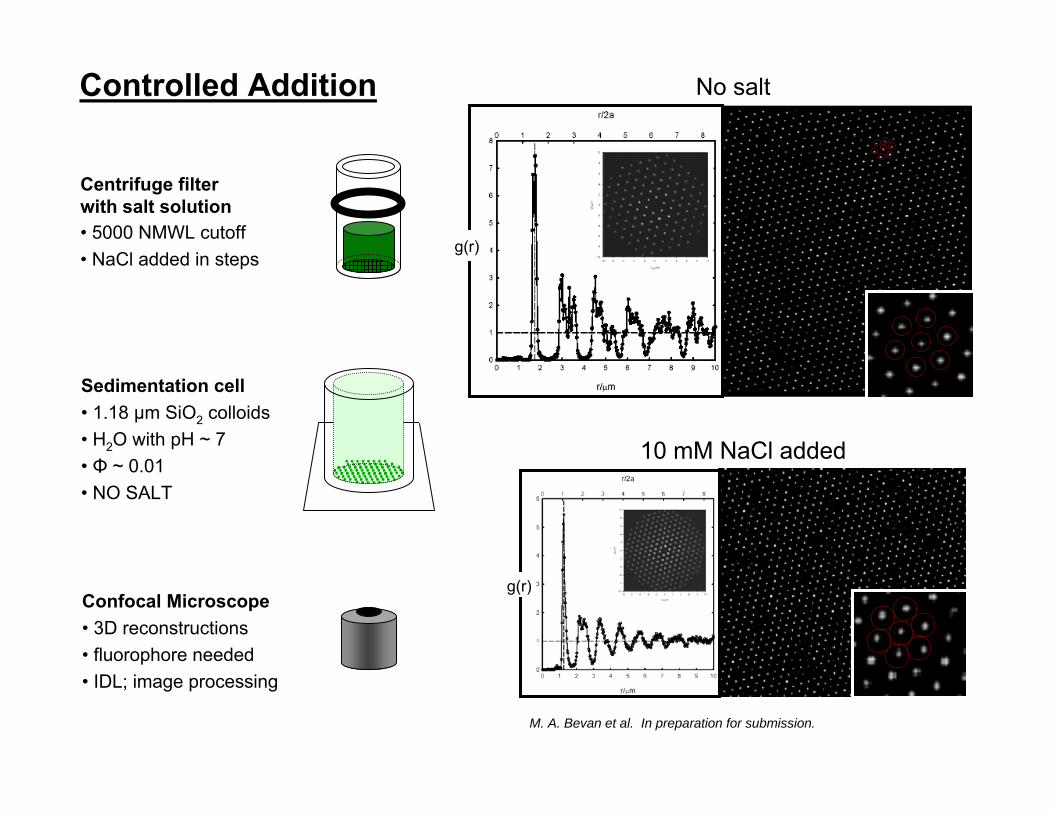
Centrifuge filterwith salt solution• 5000 NMWL cutoff• NaCl added in steps
Sedimentation cell• 1.18 μm SiO2 colloids• H2O with pH ~ 7• Φ ~ 0.01• NO SALT
Confocal Microscope• 3D reconstructions• fluorophore needed• IDL; image processing
10 mM NaCl added
No salt
g(r)
g(r)
Controlled Addition
M. A. Bevan et al. In preparation for submission.
0 20 40 60 80 100 120 1400 .0
0 .1
0 .2
0 .3
0 .4
0 .5
0 .6
0 .7
0 .8
0 .9
1 .0
1 .00
1 .05
1 .10
1 .15
1 .20
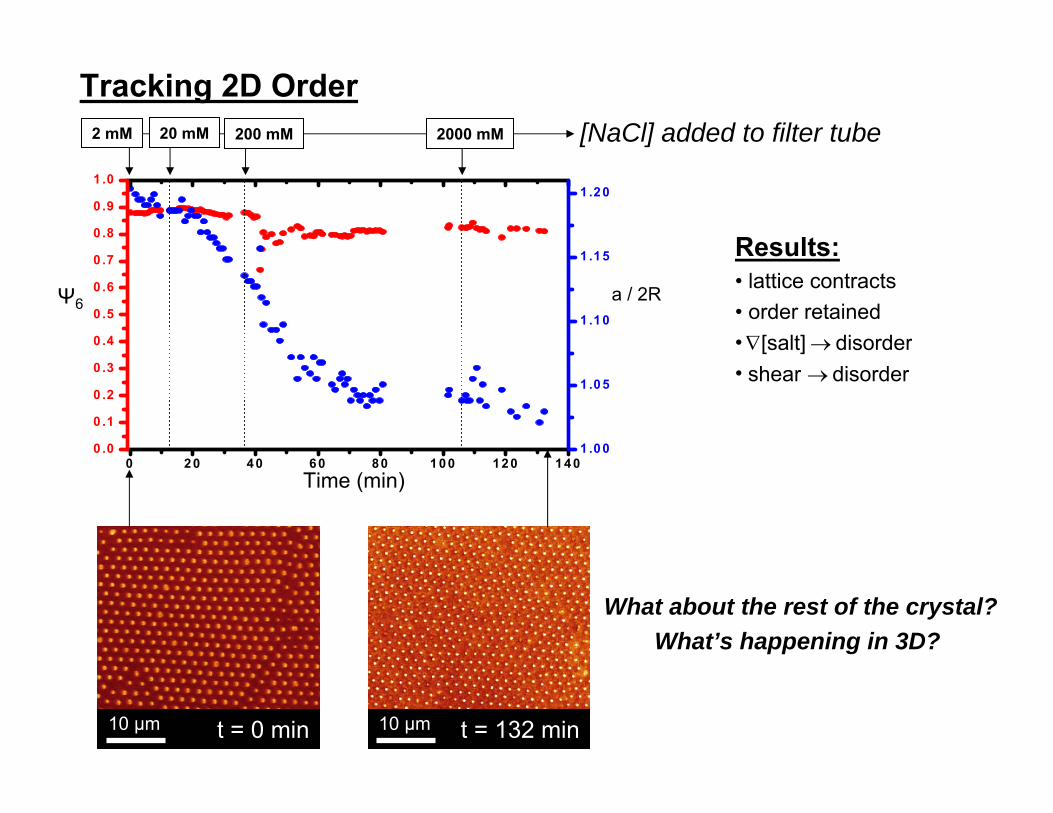
Tracking 2D Order
What about the rest of the crystal?What’s happening in 3D?
Results:• lattice contracts• order retained••
disorder[salt] →∇disordershear →
t = 0 min10 μm t = 132 min10 μm
Ψ6 a / 2R
Time (min)
2 mM 20 mM 200 mM 2000 mM [NaCl] added to filter tube
Imaging in 3D
10 μm
18.50 μm
~1:1 glycerol to water~0.2 mM Rhodamine 6G
index matching:• decreases scattering• increases observation range• decreases initial order
fluorescent dye:• increases contrast• feature identification• increases initial ionic strength• decreases initial order
glycerol:ngly = 1.47ηgly = 934 mPas
water:nwat = 1.33ηwat = 0.89 mPas
silica:nsilica ~ 1.4
Rhodamine 6G:disassociates in waterneed ~0.1 mM for contrast
14.25 μm
0:1 glycerol to water~0.3 mM Rhodamine 6G
10 μm 10 μm ~2:1 glycerol to water~0.3 mM Rhodamine 6G
http://omlc.ogi.edu/spectra/PhotochemCAD/html/rhodamine6G.html
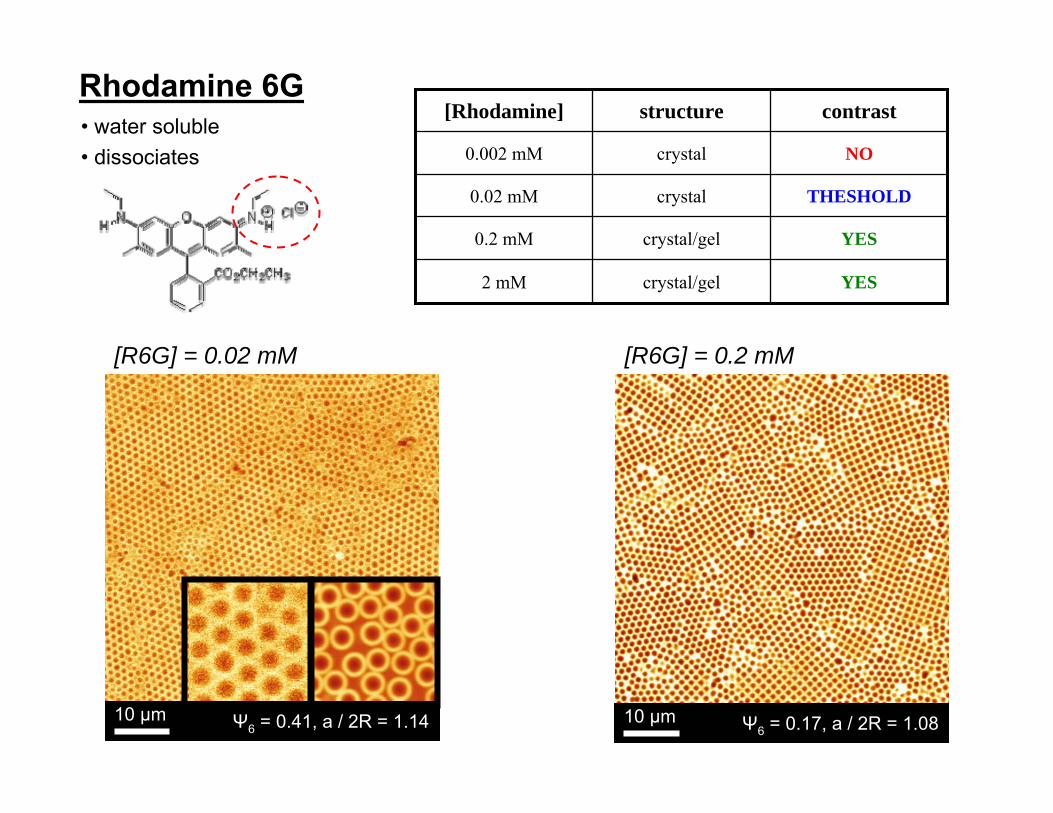
Rhodamine 6G
Rhodamine 6G
YEScrystal/gel2 mM
YEScrystal/gel0.2 mM
THESHOLDcrystal0.02 mM
NOcrystal0.002 mM
contraststructure[Rhodamine]• water soluble• dissociates
[R6G] = 0.2 mM
Ψ6 = 0.17, a / 2R = 1.0810 μm
[R6G] = 0.02 mM
Ψ6 = 0.41, a / 2R = 1.1410 μm
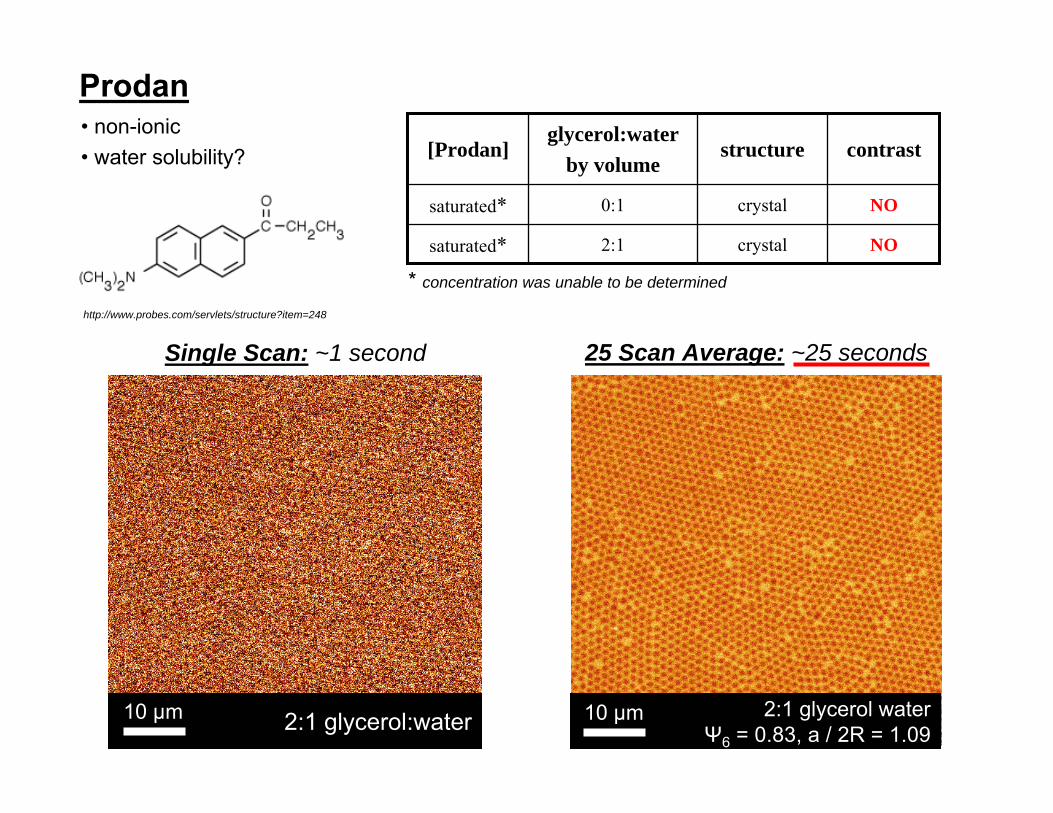
2:1 glycerol waterΨ6 = 0.83, a / 2R = 1.09
10 μm
25 Scan Average: ~25 seconds
NOcrystal2:1saturated*
NOcrystal0:1saturated*
contraststructureglycerol:water
by volume[Prodan]
* concentration was unable to be determined
http://www.probes.com/servlets/structure?item=248
Prodan• non-ionic• water solubility?
Single Scan: ~1 second
2:1 glycerol:water10 μm
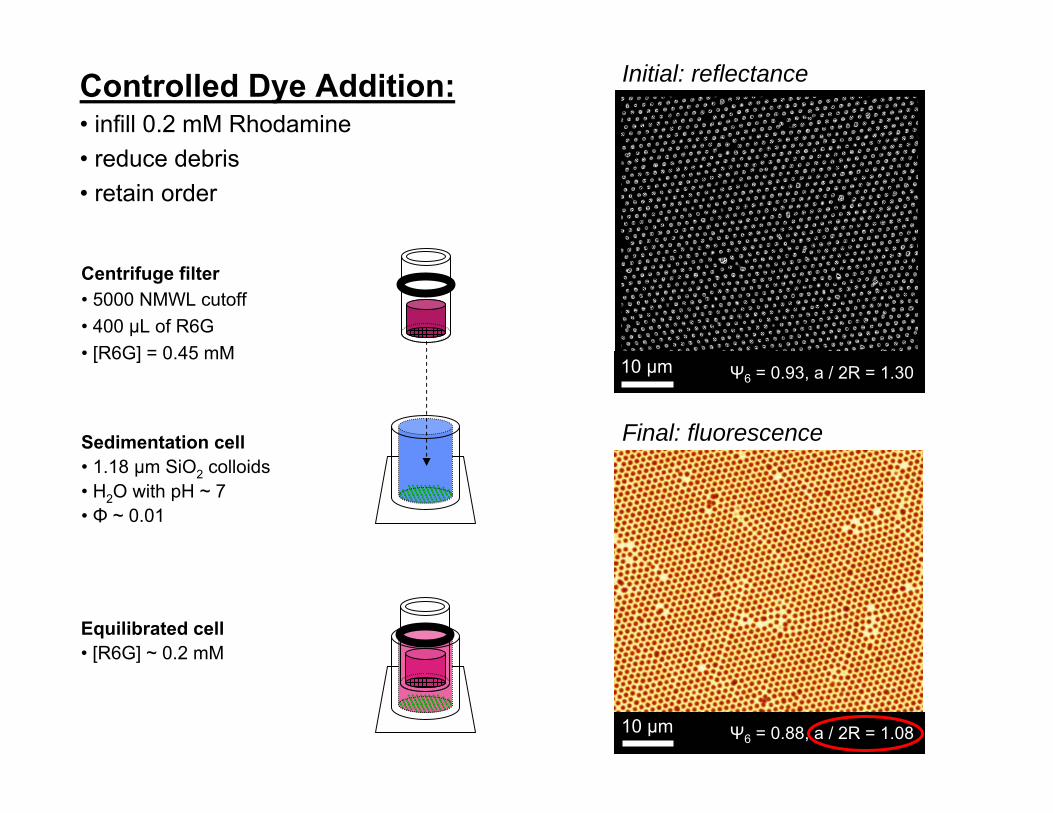
Controlled Dye Addition:• infill 0.2 mM Rhodamine• reduce debris• retain order
Centrifuge filter• 5000 NMWL cutoff• 400 μL of R6G• [R6G] = 0.45 mM
Sedimentation cell• 1.18 μm SiO2 colloids• H2O with pH ~ 7• Φ ~ 0.01
Equilibrated cell• [R6G] ~ 0.2 mM
Initial: reflectance
Ψ6 = 0.93, a / 2R = 1.3010 μm
Final: fluorescence
Ψ6 = 0.88, a / 2R = 1.0810 μm