Embed Size (px)
Citation preview
Dept of civil engineering-15CVL57 Page i
GLOBAL ACADEMY OF TECHNOLOGY
COLLEGE VISION AND MISSION
VISION
Become a premier institution imparting quality education in engineering and management
to meet the changing needs of society.
MISSION
M1. Create environment conducive for continuous learning through quality teaching and
learning processes supported by modern infrastructure.
M2. Promote Research and Innovation through collaboration with industries.
M3. Inculcate ethical values and environmental consciousness through holistic education
programs.
Dept of civil engineering-15CVL57 Page ii
GLOBAL ACADEMY OF TECHNOLOGY
DEPARTMENT VISION AND MISSION DEPARTMENT OF CIVIL ENGINEERING
VISION
To become a leading department oriented to serve the basic wants of human being related
to food, air, shelter and transportation, by providing quality education.
MISSION
M 1. Create a favorable environment for learning, teaching & continuous improvement
for implementation of various civil engineering facilities.
M 2. Promote professionalism, innovation and research through collaboration with
industries to realize cost & resource effective, stable, quality structures.
M 3. Inculcate environmental consciousness and ethical values through interconnected
training programs to ensure sustainability and client satisfaction.
PEO’s
PEO 1. Developing careers in government and private civil engineering organizations
and other professionally related domains
PEO 2. Pursuing higher studies, and research to develop innovative solutions and
technologies in civil engineering and other multi disciplinary areas
PEO 3. Improving professional and personal traits aligned to professional ethics and
environmental compulsions
PEO 4. Professional leadership and Successful entrepreneurship
PSO’s
PSO 1. Comprehend, analyze and design alternatives for execution of civil engineering
facilities
PSO 2. Apply Standard Codes of Practices and schedule of rates for planning, design,
quality control, estimating & costing of civil engineering projects.
PSO 3. Evaluate the buildings for resource conservation.
Dept of civil engineering-15CVL57 Page iii
GLOBAL ACADEMY OF TECHNOLOGY
PROGRAM OUTCOMES (POS)
1. Engineering knowledge: Apply the knowledge of mathematics, science, engineering
fundamentals, and an engineering specialization to the solution of complex engineering
problems.
2. Problem analysis: Identify, formulate, review research literature, and analyze complex
engineering problems reaching substantiated conclusions using first principles of
mathematics, natural sciences, and engineering sciences.
3. Design/development of solutions: Design solutions for complex engineering problems
and design system components or processes that meet the specified needs with appropriate
consideration for the public health and safety, and the cultural, societal, and environmental
considerations.
4. Conduct investigations of complex problems: Use research-based knowledge and
research methods including design of experiments, analysis and interpretation of data, and
synthesis of the information to provide valid conclusions.
5. Modern tool usage: Create, select, and apply appropriate techniques, resources, and
modern engineering and IT tools including prediction and modeling to complex
engineering activities with an understanding of the limitations.
6. The engineer and society: Apply reasoning informed by the contextual knowledge to
assess societal, health, safety, legal and cultural issues and the consequent responsibilities
relevant to the professional engineering practice.
7. Environment and sustainability: Understand the impact of the professional
engineering solutions in societal and environmental contexts, and demonstrate the
knowledge of, and need for sustainable development.
8. Ethics: Apply ethical principles and commit to professional ethics and responsibilities
and norms of the engineering practice.
9. Individual and team work: Function effectively as an individual, and as a member or
Dept of civil engineering-15CVL57 Page iv
GLOBAL ACADEMY OF TECHNOLOGY
leader in diverse teams, and in multidisciplinary settings.
10. Communication: Communicate effectively on complex engineering activities with the
engineering community and with society at large, such as, being able to comprehend and
write effective reports and design documentation, make effective presentations, and give
and receive clear instructions.
11. Project management and finance: Demonstrate knowledge and understanding of the
engineering and management principles and apply these to one’s own work, as a member
and leader in a team, to manage projects and in multidisciplinary environments.
12. Life-long learning: Recognize the need for, and have the preparation and ability to
engage in independent and life-long learning in the broadest context of technological
change.
Dept of civil engineering-15CVL57 Page v
GLOBAL ACADEMY OF TECHNOLOGY
PREFACE
This manual has been prepared to present the standard procedures & specifications
involved in testing soil. Field inspection & laboratory testing of soil are key activities in
the construction process.
This is not designed as field manual but is intended to be used in materials laboratory &
other offices for guidance, reference & instruction. In the laboratory manual instructions
for experiments to be performed are in conjunction with the course. The description for
each experiment includes its objective, an equipment list, background material, and a
recommended procedure.
The main objectives of these methods are to-
1. Make the test as simple & straight forward as possible.
2. Reduce to a reasonable minimum elapsed time necessary for completing the test.
The students will become familiar with the nature and properties of soil used for
construction by conducting laboratory tests. The tests have been selected to illustrate the
basic properties and methods of testing soil as per ASTM, AASHTO & Bureau of Indian
Standards.
Dept of civil engineering-15CVL57 Page vi
GLOBAL ACADEMY OF TECHNOLOGY
Regulations Governing to
THE DEGREE OF BACHELOR OF ENGINEERING
ATTENDANCE REQUIREMENT
➢ Each semester is considered as a unit and the candidate has to put in a minimum
attendance of 85% in each subject with a provision of condo nation of 10% of the
attendance by the Vice-Chancellor on the specific recommendation of the Principal
of the college where the candidate is studying, showing some reasonable cause
such as medical grounds, participation in University level sports, cultural activities,
seminars, workshops and paper presentation, etc.
➢ The basis for the calculation of the attendance shall be the period prescribed by the
University by its calendar of events. For the first semester students, the same is
reckoned from the date of admission to the course as per CET allotment.
➢ The students shall be informed about their attendance position periodically by the
colleges so that the students shall be cautioned to make up the shortage.
➢ A Candidate having shortage of attendance in one or more subjects shall have to
repeat the whole semester and such candidates shall not be permitted to take
admission to next higher semester. Such students shall take readmission to the
same semester in the subsequent academic year.
INTERNAL ASSESSMENT MARKS
➢ There shall be a maximum of 25 (or) 20 Internal Assessment Marks in each
practical papers, the IA marks shall be based on the laboratory journals/reports and
one practical test.
➢ The IA marks for I year Computer Aided Engineering / Drawing:
a)15 marks for class work (sketching and Computer Aided Engineering drawing).
b)10 marks for test in the same pattern as that of the main examination (better of
the two tests)
➢ The IA marks for other Drawings and Design Drawings offered by various
branches shall be based on the evaluation of the sheets and one test in the ratio
60:40.
A candidate failing to secure a minimum of 50% of the IA marks (12/25) in Practical,
50% of marks in project work, shall not be eligible for the practical / project in the
University examination. For a pass in a Practical/Project/Viva-voce examination, a
candidate shall secure a minimum of 40% of the maximum marks
Dept of civil engineering-15CVL57 Page vii
GLOBAL ACADEMY OF TECHNOLOGY
COURSE DETAILS
Course Name : Geotechnical Engineering Lab
Course Code : 15CVL57
Course prerequisite : Geotechnical Engineering I & II.
Course objectives
1. Comprehend the physical and index properties of soil.
2. Classify the soil into different types based on index properties and field identification.
3. Calculate the In-situ density of soil by sand replacement & by core cutter method.
4. Conduct the compaction test to determine OMC and MDD, plan and assess field compaction
program
5. Evaluate the strength and consolidation parameters to assess strength and deformation
characteristics.
Course Outcomes
Sl. no Course Outcomes PO’s Cognitive Level Class
Sessions
1
Determine the index properties by
conducting basic tests on collected soil
samples in the laboratory.
1
APPLY
10.5
2
Define the importance of gradation and
density characteristics of soil in assessing
the strength of soil indirectly.
1
REMEMBER
10.5
3 Estimate the strength parameters of soil
for the design of foundations. 1 APPLY 12.5
4
Predict the settlement of structures
founded on various types of soils
Consolidation Tests.
1
REMEMBER
8.5
TOTAL HOURS OF INSTRUCTION 42
GLOBAL ACADEMY OF TECHNOLOGY
Dept of civil engineering-15CVL57 Page viii
INDEX COLLEGE VISION AND MISSION .......................................................................................................................... i
DEPARTMENT VISION AND MISSION ................................................................................................... ii
PROGRAM OUTCOMES (POs) ................................................................................................................ iii
PREFACE ................................................................................................................................................... v
ATTENDANCE REQUIREMENT ........................................................................................................................... vi
Course Details............................................................................................................................. vii
INDEX ............................................................................................................................. viii
CO – PO Mapping – 10CVL67............................................................................................ x
EXPERIMENT – 1: FIELD IDENTIFICATION OF SOIL ................................................ 1
EXPERIMENT – 2: DETERMINATION OF MOISTURE CONTENT ............................ 3
EXPERIMENT – 3: DETERMINATION OF SPECIFIC GRAVITY ................................ 5
DENSITY BOTTLE ............................................................................................................ 5
EXPERIMENT - 3: DETERMINATION OF SPECIFIC GRAVITY ................................. 8
PYCNOMETER .................................................................................................................. 8
EXPERIMENT – 4: GRAIN SIZE DISTRIBUTION ....................................................... 10
I. SIEVE ANALYSIS ........................................................................................................ 10
EXPERIMENT – 5: 5.1. DETERMINATION OF CONSISTENCY LIMITS ................. 14
LIQUID LIMIT TEST BY CASAGRENDE’S ................................................................... 14
LIQUID LIMIT BY CONE PENETRATION METHOD .................................................. 18
5.2. PLASTIC LIMIT TEST .............................................................................................. 20
5.3 SHRINKAGE LIMIT TEST ........................................................................................ 23
EXPERIMENT – 6: IN SITU DENSITY BY CORE CUTTER AND SAND
REPLACEMENT METHOD ............................................................................................ 28
CORE CUTTER METHOD .............................................................................................. 28
SAND REPLACEMENT METHOD ................................................................................ 30
EXPERIMENT 7: STANDARD PROCTOR COMPACTION TEST .............................. 35
EXPERIMENT – 8: CO-EFFICIENT OF PERMEABILITY BY CONSTANT HEAD
AND VARIABLE HEAD METHODS ............................................................................. 39
EXPERIMENT – 9: UNCONFINED COMPRESSION TEST ......................................... 45
EXPERIMENT – 10 : DIRECT SHEAR TEST ................................................................ 49
EXPERIMENT – 11: TRIAXIAL SHEAR TEST ............................................................. 53
GLOBAL ACADEMY OF TECHNOLOGY
Dept of civil engineering-15CVL57 Page ix
EXPERIMENT – 12 : CONSOLIDATION TEST ............................................................ 58
EXPERIMENT – 13: MODIFIED PROCTOR TEST....................................................... 65
EXPERIMENT 14-HYDROMETER ANALYSIS .......................................................... 71
EXPERIMENT 15 -VANE SHEAR TEST ...................................................................... 76
DEMONSTRATION 1 - STANDARD PENETRATION TEST… ................................. 77
DEMONSTRATION 2 - SWELL PRESSURE ................................................................ 79
GLOBAL ACADEMY OF TECHNOLOGY
Dept of civil engineering-15CVL57 Page 1
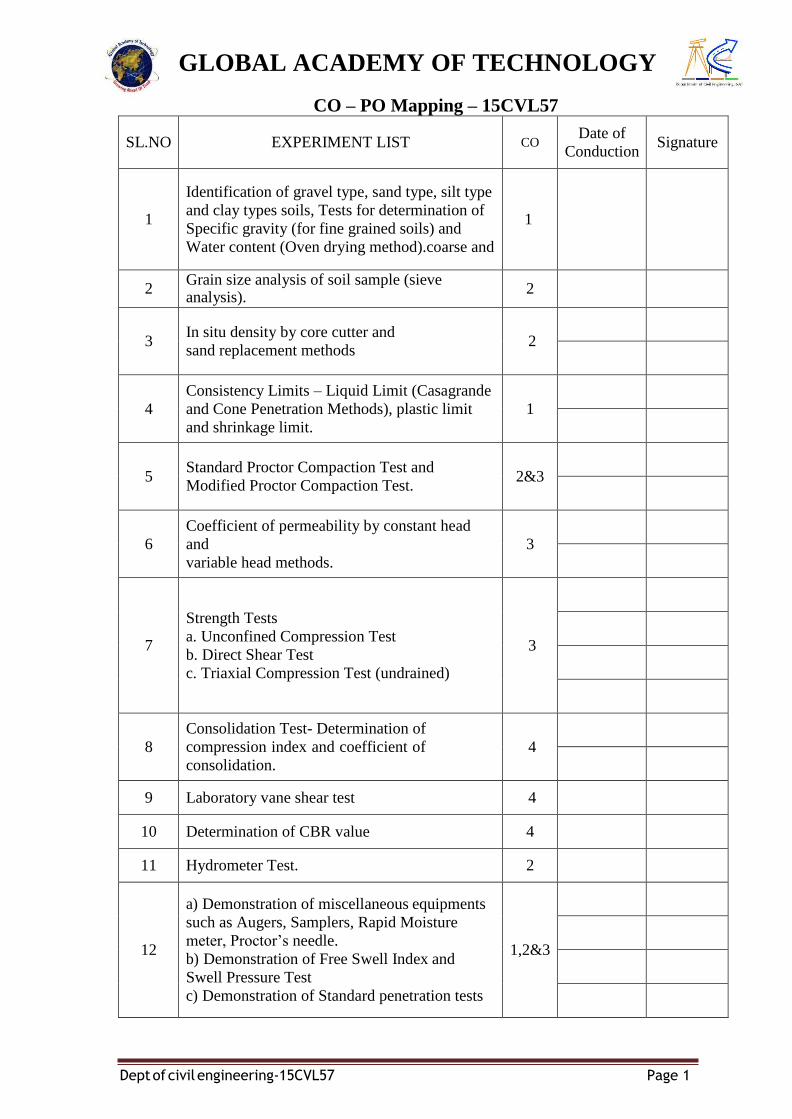
CO – PO Mapping – 15CVL57
SL.NO
EXPERIMENT LIST
CO Date of
Conduction
Signature
1
Identification of gravel type, sand type, silt type
and clay types soils, Tests for determination of
Specific gravity (for fine grained soils) and
Water content (Oven drying method).coarse and
1
2 Grain size analysis of soil sample (sieve analysis).
2
3
In situ density by core cutter and
sand replacement methods
2
4
Consistency Limits – Liquid Limit (Casagrande
and Cone Penetration Methods), plastic limit
and shrinkage limit.
1
5
Standard Proctor Compaction Test and
Modified Proctor Compaction Test.
2&3
6
Coefficient of permeability by constant head
and
variable head methods.
3
7
Strength Tests
a. Unconfined Compression Test
b. Direct Shear Test
c. Triaxial Compression Test (undrained)
3
8
Consolidation Test- Determination of
compression index and coefficient of
consolidation.
4
9 Laboratory vane shear test 4
10 Determination of CBR value 4
11 Hydrometer Test. 2
12
a) Demonstration of miscellaneous equipments
such as Augers, Samplers, Rapid Moisture
meter, Proctor’s needle.
b) Demonstration of Free Swell Index and
Swell Pressure Test
c) Demonstration of Standard penetration tests
1,2&3
GLOBAL ACADEMY OF TECHNOLOGY
Dept of civil engineering-15CVL57 Page 2
EXPERIMENT – 1: FIELD IDENTIFICATION OF SOIL
AIM: For field identification of soil into common types like sand, gravel, silty or clayey
sand, silt, clay and organic soil.
INTRODUCTION: for identifying the soils readily in the field into common types, these
are some simple tests which can be performed at the site location itself. These field tests
are very helpful and can take the place of laboratory testing of classification.
The most commonly used simple field tests are based on
1. Grain size of soil particles
2. Presence of lack of plasticity
3. Dilatancy
4. Dry strength
SCOPE AND APPLICATION: the field tests are very useful in differentiating silt and
clay in the field whose particle sizes are finer than 75 micron IS Sieve also, it helps to
determine the consistency of clay in the field.
PROCEDURE:
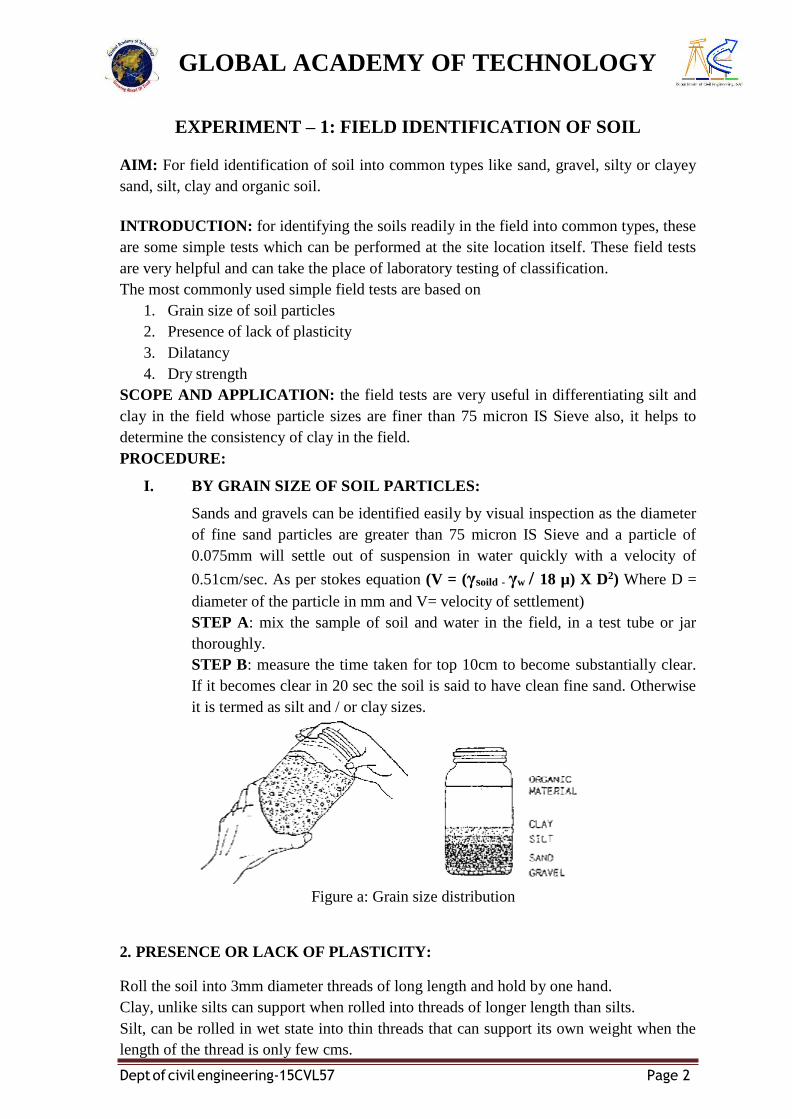
I. BY GRAIN SIZE OF SOIL PARTICLES:
Sands and gravels can be identified easily by visual inspection as the diameter
of fine sand particles are greater than 75 micron IS Sieve and a particle of
0.075mm will settle out of suspension in water quickly with a velocity of
0.51cm/sec. As per stokes equation (V = (γsoild - γw / 18 µ) X D2) Where D =
diameter of the particle in mm and V= velocity of settlement)
STEP A: mix the sample of soil and water in the field, in a test tube or jar
thoroughly.
STEP B: measure the time taken for top 10cm to become substantially clear.
If it becomes clear in 20 sec the soil is said to have clean fine sand. Otherwise
it is termed as silt and / or clay sizes.
Figure a: Grain size distribution
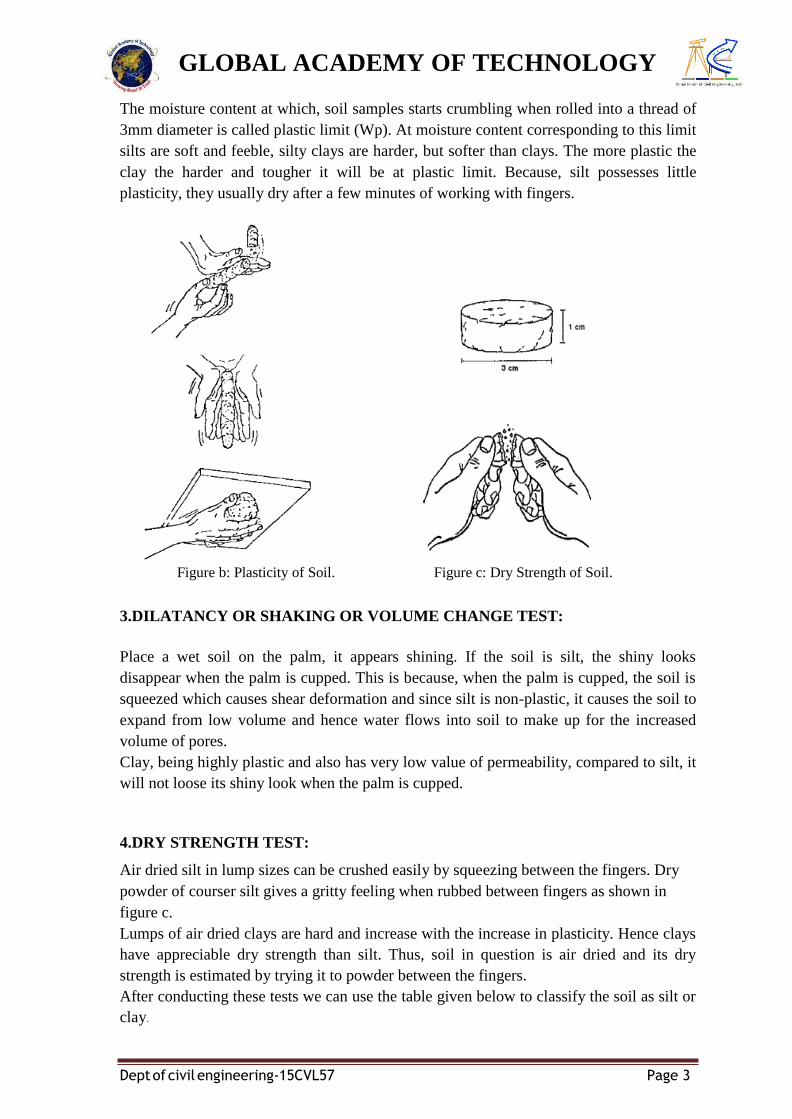
2. PRESENCE OR LACK OF PLASTICITY:
Roll the soil into 3mm diameter threads of long length and hold by one hand.
Clay, unlike silts can support when rolled into threads of longer length than silts.
Silt, can be rolled in wet state into thin threads that can support its own weight when the
length of the thread is only few cms.
GLOBAL ACADEMY OF TECHNOLOGY
Dept of civil engineering-15CVL57 Page 3
The moisture content at which, soil samples starts crumbling when rolled into a thread of
3mm diameter is called plastic limit (Wp). At moisture content corresponding to this limit
silts are soft and feeble, silty clays are harder, but softer than clays. The more plastic the
clay the harder and tougher it will be at plastic limit. Because, silt possesses little
plasticity, they usually dry after a few minutes of working with fingers.
Figure b: Plasticity of Soil. Figure c: Dry Strength of Soil.
3.DILATANCY OR SHAKING OR VOLUME CHANGE TEST:
Place a wet soil on the palm, it appears shining. If the soil is silt, the shiny looks
disappear when the palm is cupped. This is because, when the palm is cupped, the soil is
squeezed which causes shear deformation and since silt is non-plastic, it causes the soil to
expand from low volume and hence water flows into soil to make up for the increased
volume of pores.
Clay, being highly plastic and also has very low value of permeability, compared to silt, it
will not loose its shiny look when the palm is cupped.
4.DRY STRENGTH TEST:
Air dried silt in lump sizes can be crushed easily by squeezing between the fingers. Dry
powder of courser silt gives a gritty feeling when rubbed between fingers as shown in
figure c.
Lumps of air dried clays are hard and increase with the increase in plasticity. Hence clays
have appreciable dry strength than silt. Thus, soil in question is air dried and its dry
strength is estimated by trying it to powder between the fingers.
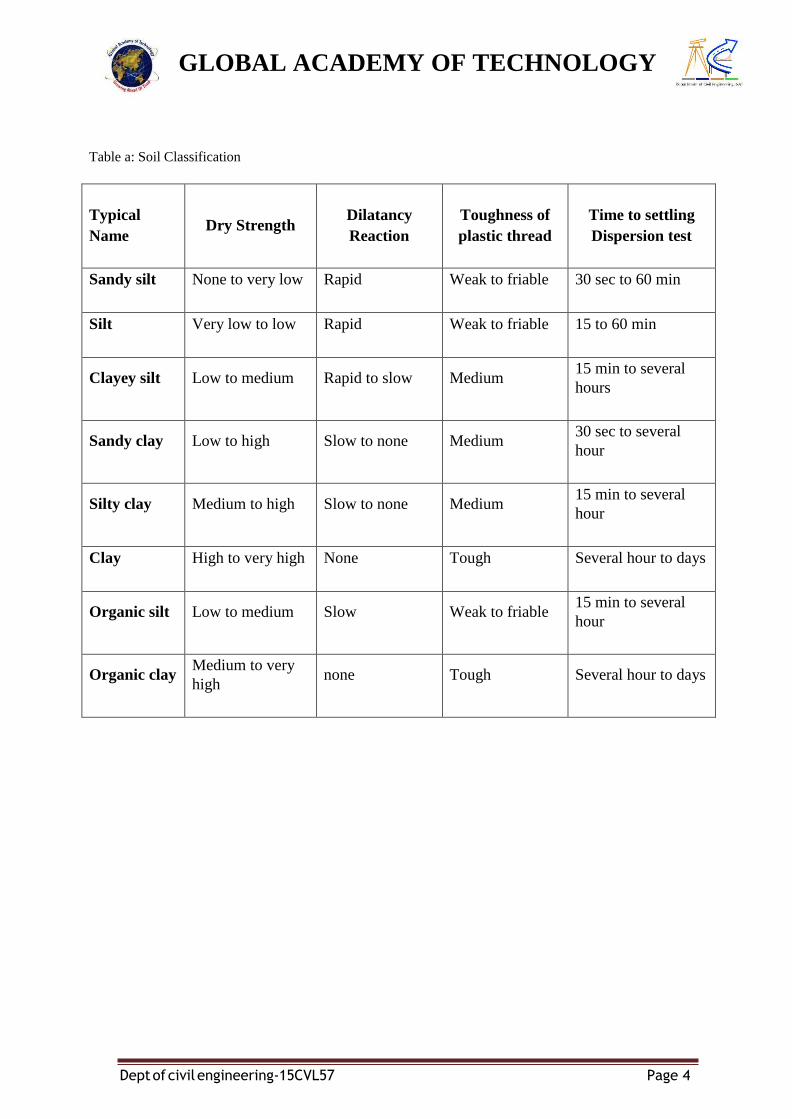
After conducting these tests we can use the table given below to classify the soil as silt or
clay.
GLOBAL ACADEMY OF TECHNOLOGY
Dept of civil engineering-15CVL57 Page 4
Table a: Soil Classification
Typical
Name
Dry Strength Dilatancy
Reaction
Toughness of
plastic thread
Time to settling
Dispersion test
Sandy silt None to very low Rapid Weak to friable 30 sec to 60 min
Silt Very low to low Rapid Weak to friable 15 to 60 min
Clayey silt Low to medium Rapid to slow Medium 15 min to several
hours
Sandy clay Low to high Slow to none Medium 30 sec to several
hour
Silty clay Medium to high Slow to none Medium 15 min to several
hour
Clay High to very high None Tough Several hour to days
Organic silt Low to medium Slow Weak to friable 15 min to several
hour
Organic clay Medium to very
high none Tough Several hour to days
GLOBAL ACADEMY OF TECHNOLOGY
Dept of civil engineering-15CVL57 Page 5
EXPERIMENT – 2: DETERMINATION OF MOISTURE
CONTENT
AIM: To determine the natural moisture content of the given soil sample.
NEED AND SCOPE OF THE EXPERIMENT:
In almost all soil tests natural moisture content of the soil is to be determined. The
knowledge of the natural moisture content is essential in all studies of soil mechanics. To
sight a few, natural moisture content is used in determining the bearing capacity and
settlement. The natural moisture content will give an idea of the state of soil in the field.
DEFINITION:
The natural water content also called the natural moisture content is the ratio of the
weight of water to the weight of the solids in a given mass of soil. This ratio is usually
expressed as percentage.
APPARATUS REQUIRED:
1. Non-corrodible air-tight container.
2. Electric oven, maintain the temperature between 1050 C to 1100 C.
3. Balance of sufficient sensitivity.
PROCEDURE:
1. Clean the containers with lid dry it and weigh it (W1).
2. Take a specimen of the sample in the container and weigh with lid (W2).
3. Keep the container in the oven with lid removed. Dry the specimen to constant
weight maintaining the temperature between 1050 C to 1100 C for a period varying
with the type of soil but usually 16 to 24 hours.
4. Record the final constant weight (W3) of the container with dried soil sample.
Peat and other organic soils are to be dried at lower temperature (say 600) possibly
for a longer period.
GLOBAL ACADEMY OF TECHNOLOGY
Dept of civil engineering-15CVL57 Page 6
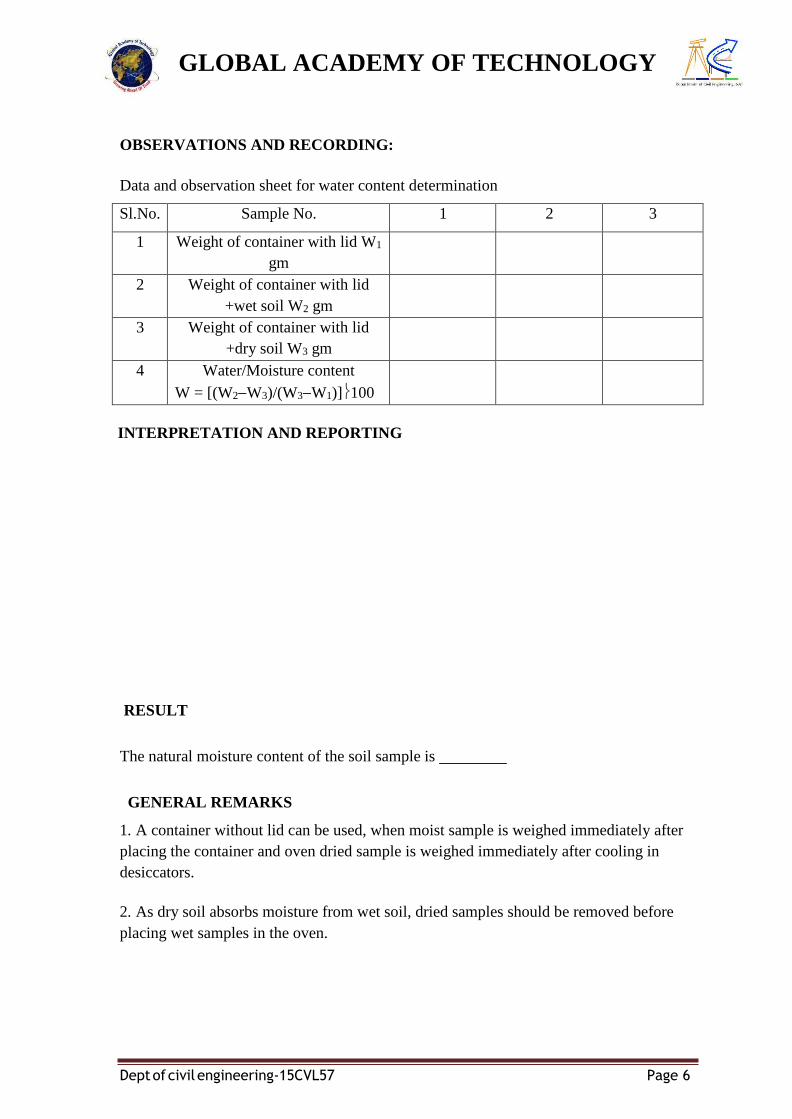
OBSERVATIONS AND RECORDING:
Data and observation sheet for water content determination
Sl.No. Sample No. 1 2 3
1 Weight of container with lid W1
gm
2 Weight of container with lid
+wet soil W2 gm
3 Weight of container with lid
+dry soil W3 gm
4 Water/Moisture content
W = [(W2−W3)/(W3−W1)]100
INTERPRETATION AND REPORTING
RESULT
The natural moisture content of the soil sample is
GENERAL REMARKS
1. A container without lid can be used, when moist sample is weighed immediately after
placing the container and oven dried sample is weighed immediately after cooling in
desiccators.
2. As dry soil absorbs moisture from wet soil, dried samples should be removed before
placing wet samples in the oven.
GLOBAL ACADEMY OF TECHNOLOGY
Dept of civil engineering-15CVL57 Page 7
EXPERIMENT – 3: DETERMINATION OF SPECIFIC GRAVITY
3.1. DENSITY BOTTLE
AIM:
Determine the specific gravity of soil fraction passing 4.75 mm I.S sieve by density
bottle.
NEED AND SCOPE:
The knowledge of specific gravity is needed in calculation of soil properties like void
ratio, degree of saturation etc.
DEFINITION:
Specific gravity G is defined as the ratio of the weight of an equal volume of distilled
water at that temperature both weights taken in air.
THEORY:
Specific gravity G is defined as the ratio of the weight of an equal volume of distilled
waters at that temperature both weights taken in air.
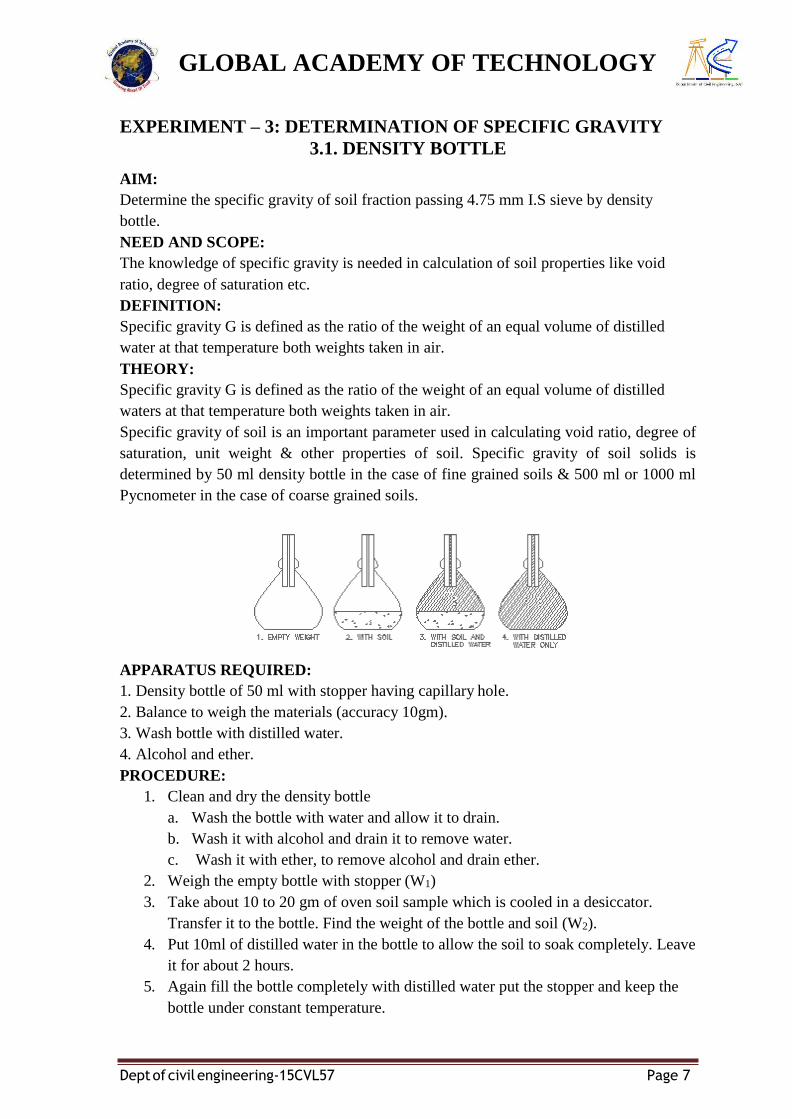
Specific gravity of soil is an important parameter used in calculating void ratio, degree of
saturation, unit weight & other properties of soil. Specific gravity of soil solids is
determined by 50 ml density bottle in the case of fine grained soils & 500 ml or 1000 ml
Pycnometer in the case of coarse grained soils.
APPARATUS REQUIRED:
1. Density bottle of 50 ml with stopper having capillary hole.
2. Balance to weigh the materials (accuracy 10gm).
3. Wash bottle with distilled water.
4. Alcohol and ether.
PROCEDURE:
1. Clean and dry the density bottle
a. Wash the bottle with water and allow it to drain.
b. Wash it with alcohol and drain it to remove water.
c. Wash it with ether, to remove alcohol and drain ether.
2. Weigh the empty bottle with stopper (W1)
3. Take about 10 to 20 gm of oven soil sample which is cooled in a desiccator.
Transfer it to the bottle. Find the weight of the bottle and soil (W2).
4. Put 10ml of distilled water in the bottle to allow the soil to soak completely. Leave
it for about 2 hours.
5. Again fill the bottle completely with distilled water put the stopper and keep the
bottle under constant temperature.
GLOBAL ACADEMY OF TECHNOLOGY
Dept of civil engineering-15CVL57 Page 8
6. Take the bottle outside and wipe it clean and dry note. Now determine the weight
of the bottle and the contents (W3).
7. Now empty the bottle and thoroughly clean it. Fill the bottle with only distilled
water and weigh it. Let it be W4.
8. Repeat the same process for 2 to 3 times, to take the average reading of it.
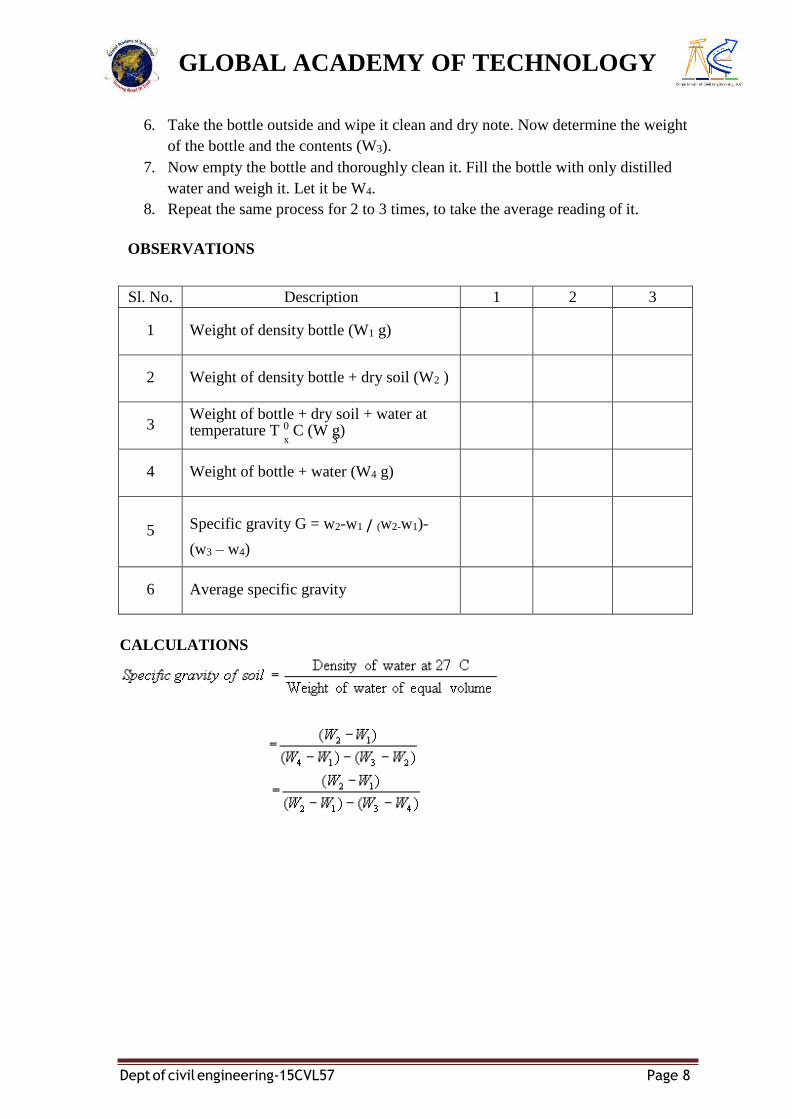
OBSERVATIONS
Sl. No. Description 1 2 3
1 Weight of density bottle (W1 g)
2 Weight of density bottle + dry soil (W2 )
3 Weight of bottle + dry soil + water at temperature T 0 C (W g)
x 3
4 Weight of bottle + water (W4 g)
5
Specific gravity G = w2-w1 / (w2-w1)-
(w3 – w4)
6 Average specific gravity
CALCULATIONS
GLOBAL ACADEMY OF TECHNOLOGY
Dept of civil engineering-15CVL57 Page 9
x
INTERPRETATION AND REPORTING:
Unless or otherwise specified specific gravity values reported shall be based on water at
270C. So the specific gravity at 270C = K Sp. gravity at T 0C.
The specific gravity of the soil particles lie within the range of 2.65 to 2.85. Soils
containing organic matter and porous particles may have specific gravity values below
Soils having heavy substances may have values above 3.0
VIVA QUESTIONS:
1) Define specific gravity?
2) What are the typical values of specific gravity for sandy soil used in the lab?
3) How do you convert the specific gravity at room temperature to the standard
temperature 27°C?
4) When do you use Kerosene instead of distilled water for determining specific
gravity of the soil?
5) What will happen to the soils kept in the oven at a temperature much higher than
110°C?
Additional Information
Sand particles composed of quartz have a specific gravity ranging from 2.65 to 2.67.
Inorganic clays generally range from 2.70 to 2.80. Soils with large amounts of organic matter or porous
particles (such as diatomaceous earth) have specific gravities below 2.60. Some range as low as 2.00.
GLOBAL ACADEMY OF TECHNOLOGY
Dept of civil engineering-15CVL57 Page 10
EXPERIMENT - 3: DETERMINATION OF SPECIFIC GRAVITY
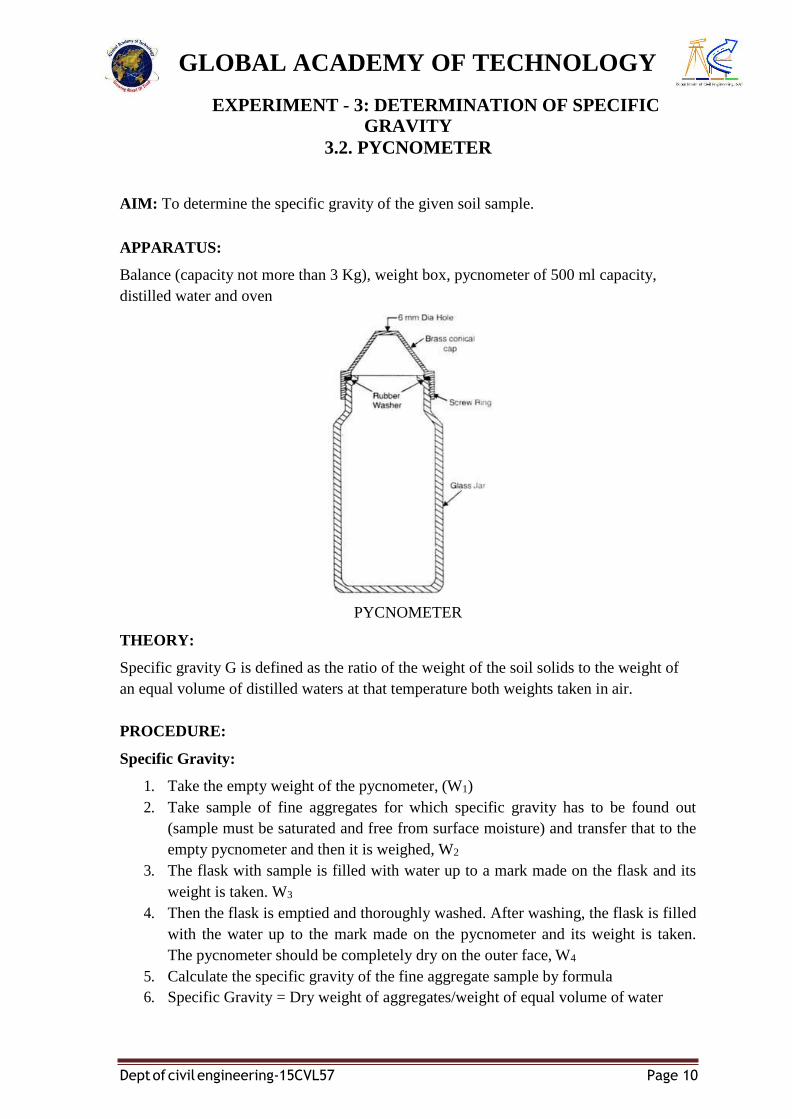
3.2. PYCNOMETER
AIM: To determine the specific gravity of the given soil sample.
APPARATUS:
Balance (capacity not more than 3 Kg), weight box, pycnometer of 500 ml capacity,
distilled water and oven
PYCNOMETER
THEORY:
Specific gravity G is defined as the ratio of the weight of the soil solids to the weight of
an equal volume of distilled waters at that temperature both weights taken in air.
PROCEDURE:
Specific Gravity:
1. Take the empty weight of the pycnometer, (W1)
2. Take sample of fine aggregates for which specific gravity has to be found out
(sample must be saturated and free from surface moisture) and transfer that to the
empty pycnometer and then it is weighed, W2
3. The flask with sample is filled with water up to a mark made on the flask and its
weight is taken. W3
4. Then the flask is emptied and thoroughly washed. After washing, the flask is filled
with the water up to the mark made on the pycnometer and its weight is taken.
The pycnometer should be completely dry on the outer face, W4
5. Calculate the specific gravity of the fine aggregate sample by formula
6. Specific Gravity = Dry weight of aggregates/weight of equal volume of water
Dept of civil engineering-15CVL57 Page 11
GLOBAL ACADEMY OF TECHNOLOGY
= (W2 – W1) / [(W2 – W1) - (W3 – W4)]
OBSERVATION AND CALCULATIONS:
DISCRIPTION Trial1 Trial 2 Trial 3 Average
Specific
Gravity
Mass of empty
pycnometer (W1) gm
Mass of pycnometer +
fine aggregates (W2)
gm
Mass of pycnometer
+ fine aggregates +
water, (W3) gm
Mass of pycnometer +
water, (W4) gm
Bulk specific Gravity = Dry weight of aggregates / weight of equal volume of water
= W4 / (W3 – (W1 – W2))
=
Apparent Specific Gravity = Dry weight of aggregates / (Weight of equal
volume of water excluding
air voids in aggregates)
= W4 / (W4 – (W1 – W2)
=
RESULT:
Specific Gravity of given soil sample =
GLOBAL ACADEMY OF TECHNOLOGY
Dept of civil engineering-15CVL57 Page 11
EXPERIMENT – 4: GRAIN SIZE DISTRIBUTION
I. SIEVE ANALYSIS
AIM: To determine the particle size distribution of coarse grained soil, as per IS:
2720 (Part IV) – 1965.
OBJECTIVE
(a) Select sieves as per I.S specifications and perform sieving.
(b) Obtain percentage of soil retained on each sieve.
(c) Draw graph between log grain size of soil and % finer.
NEED AND SCOPE OF EXPERIMENT
The grain size analysis is widely used in classification of soils. The data obtained
from grain size distribution curves is used in the design of filters for earth dams and to
determine suitability of soil for road construction, air field etc. Information
obtained from grain size analysis can be used to predict soil water movement although
permeability tests are more generally used.
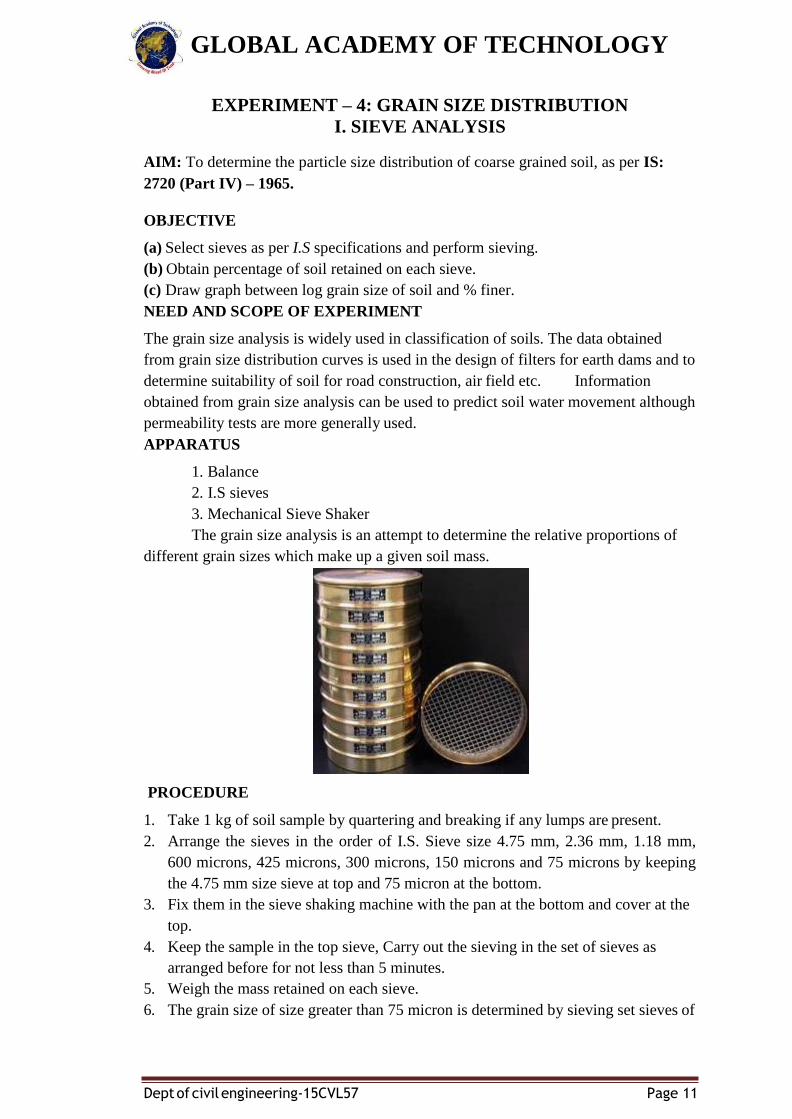
APPARATUS
1. Balance
2. I.S sieves
3. Mechanical Sieve Shaker
The grain size analysis is an attempt to determine the relative proportions of
different grain sizes which make up a given soil mass.
PROCEDURE
1. Take 1 kg of soil sample by quartering and breaking if any lumps are present.
2. Arrange the sieves in the order of I.S. Sieve size 4.75 mm, 2.36 mm, 1.18 mm,
600 microns, 425 microns, 300 microns, 150 microns and 75 microns by keeping
the 4.75 mm size sieve at top and 75 micron at the bottom.
3. Fix them in the sieve shaking machine with the pan at the bottom and cover at the
top.
4. Keep the sample in the top sieve, Carry out the sieving in the set of sieves as
arranged before for not less than 5 minutes.
5. Weigh the mass retained on each sieve.
6. The grain size of size greater than 75 micron is determined by sieving set sieves of
GLOBAL ACADEMY OF TECHNOLOGY
Dept of civil engineering-15CVL57 Page 12
decreasing order; sieve placed one below the other and separating out the different
size ranges. Two methods of sieve analysis are as follows:
1. wet sieving applicable to all soil and
2. Dry sieving applicable only to soil which has negligible proportion of
clay and silt.
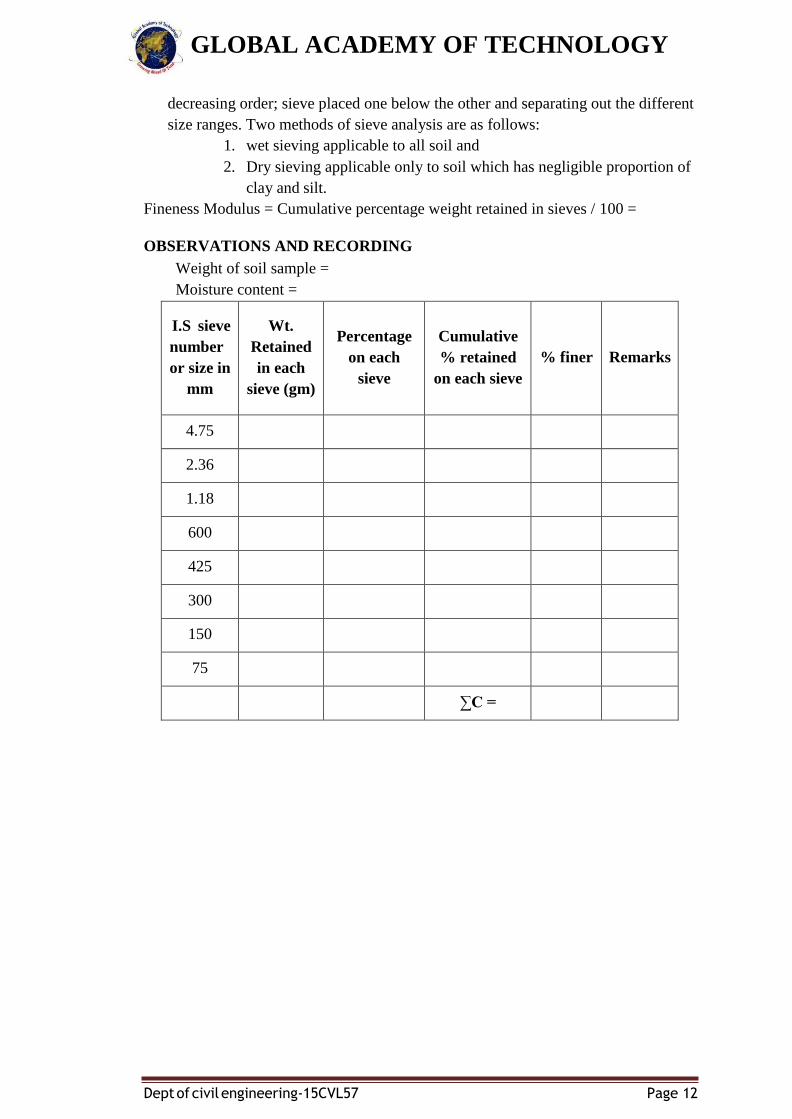
Fineness Modulus = Cumulative percentage weight retained in sieves / 100 =
OBSERVATIONS AND RECORDING
Weight of soil sample =
Moisture content =
I.S sieve
number
or size in
mm
Wt.
Retained
in each
sieve (gm)
Percentage
on each
sieve
Cumulative
% retained
on each sieve
% finer
Remarks
4.75
2.36
1.18
600
425
300
150
75
∑C =
GLOBAL ACADEMY OF TECHNOLOGY
Dept of civil engineering-15CVL57 Page 13
30 60 10
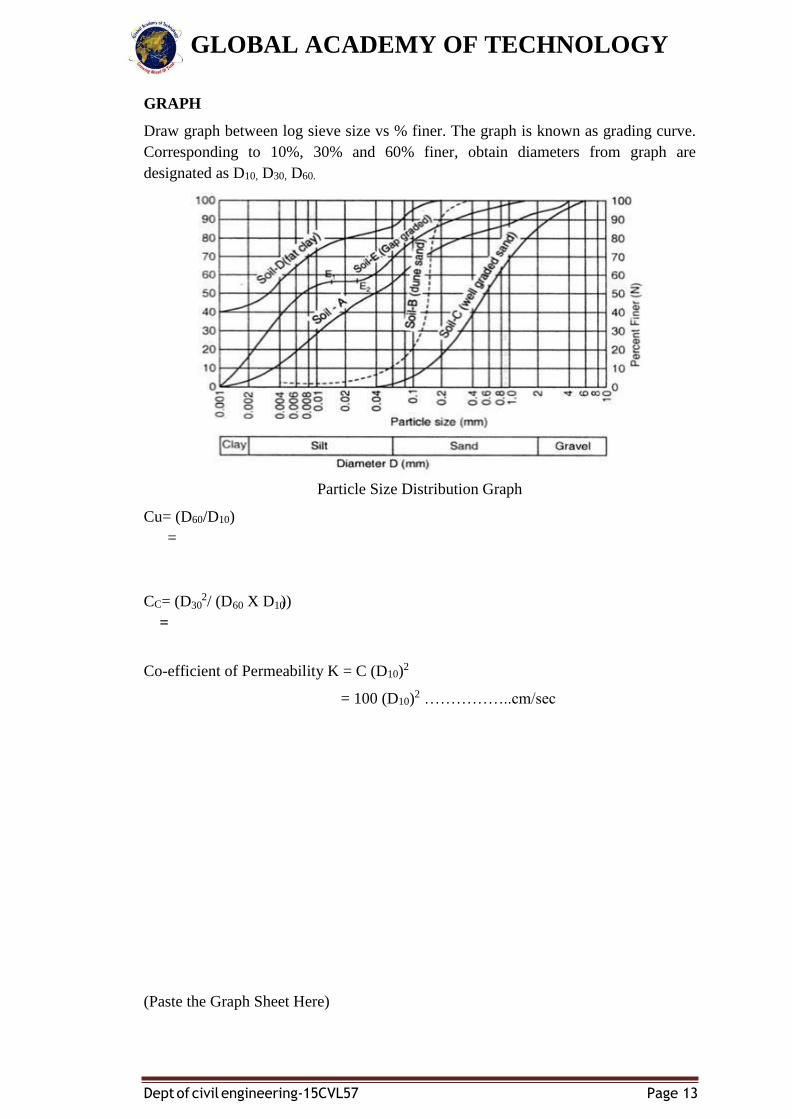
GRAPH
Draw graph between log sieve size vs % finer. The graph is known as grading curve.
Corresponding to 10%, 30% and 60% finer, obtain diameters from graph are
designated as D10, D30, D60.
Particle Size Distribution Graph
Cu= (D60/D10)
=
CC= (D 2/ (D X D ))
=
Co-efficient of Permeability K = C (D10)2
= 100 (D10)2 ……………..cm/sec
(Paste the Graph Sheet Here)
GLOBAL ACADEMY OF TECHNOLOGY
Dept of civil engineering-15CVL57 Page 14
CALCULATION
1. The percentage of soil retained on each sieve shall be calculated on the basis
of total weight of soil sample taken.
2. Cumulative percentage of soil retained on successive sieve is found.
VIVA QUESTIONS:-
1) What do you understand by well graded soil, poorly graded soil, gap graded
soil and uniformly graded soil?
2) How can you determine the gradations of fine grained soils?
3) Define Uniformity coefficient.
4) What do you understand by coefficient of curvature/gradation?
5) How can you arrive at coefficient of permeability of filter sands using D10 of
the soil?
6) Explain the following notations / designations of the soil: GW, GP, SW,
SP,GM,GC,SM,SC, MH, ML, OL
Additional Information:
• What is wet sieve analysis?
Wet sieving is a procedure used to evaluate particle size distribution or gradation of a
granular material. It’s also used to prepare a granular material for particle size analysis by removing
fines that may impede the separation process.
GLOBAL ACADEMY OF TECHNOLOGY
Dept of civil engineering-15CVL57 Page 15
EXPERIMENT – 5: 5.1. DETERMINATION OF CONSISTENCY
LIMITS
LIQUID LIMIT TEST BY CASAGRENDE’S
AIM: To determine the liquid limit of a given soil sample
OBJECTIVE
1. Prepare soil specimen as per specification.
2. Find the relationship between water content and number of blows.
3. Draw flow curve.
4. Find out liquid limit.
NEED AND SCOPE
Liquid limit is significant to know the stress history and general properties of the soil
met with construction. From the results of liquid limit the compression index may be
estimated. The compression index value will help us in settlement analysis. If the
natural moisture content of soil is closer to liquid limit, the soil can be considered as
soft if the moisture content is lesser than liquids limit, the soil can be considered as
soft if the moisture content is lesser than liquid limit. The soil is brittle and stiffer.
THEORY
The liquid limit is the moisture content at which the groove, formed by a standard tool
into the sample of soil taken in the standard cup, closes for 10 mm on being given 25
blows in a standard manner. At this limit the soil possess low shear strength.
APPARATUS REQUIRED
1. Balance
2. Liquid limit device (Casagrende’s)
3. Grooving tool
4. Mixing dishes
5. Spatula
6. Electrical Oven
GLOBAL ACADEMY OF TECHNOLOGY
Dept of civil engineering-15CVL57 Page 16
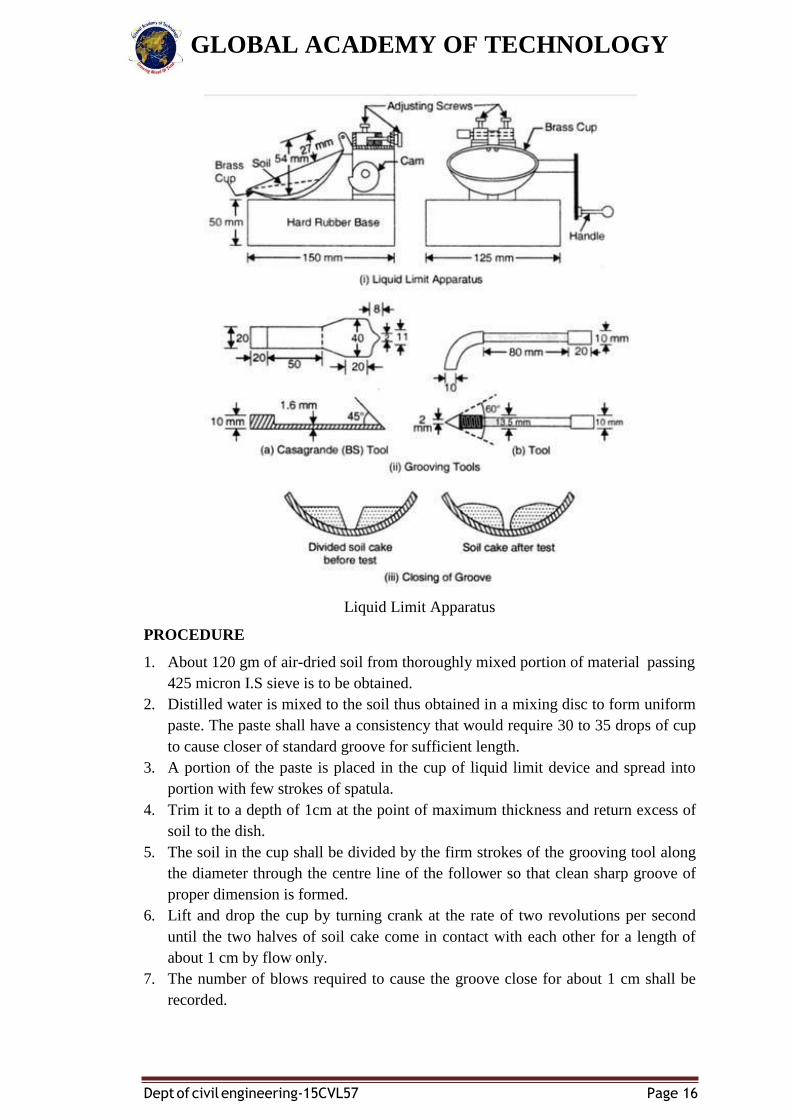
Liquid Limit Apparatus
PROCEDURE
1. About 120 gm of air-dried soil from thoroughly mixed portion of material passing
425 micron I.S sieve is to be obtained.
2. Distilled water is mixed to the soil thus obtained in a mixing disc to form uniform
paste. The paste shall have a consistency that would require 30 to 35 drops of cup
to cause closer of standard groove for sufficient length.
3. A portion of the paste is placed in the cup of liquid limit device and spread into
portion with few strokes of spatula.
4. Trim it to a depth of 1cm at the point of maximum thickness and return excess of
soil to the dish.
5. The soil in the cup shall be divided by the firm strokes of the grooving tool along
the diameter through the centre line of the follower so that clean sharp groove of
proper dimension is formed.
6. Lift and drop the cup by turning crank at the rate of two revolutions per second
until the two halves of soil cake come in contact with each other for a length of
about 1 cm by flow only.
7. The number of blows required to cause the groove close for about 1 cm shall be
recorded.

GLOBAL ACADEMY OF TECHNOLOGY
Dept of civil engineering-15CVL57 Page 17
8. A representative portion of soil is taken from the cup for water content
determination.
9. Repeat the test with different moisture contents at least three more times for blows
between 10 and 40.
OBSERVATIONS
Determination Number
1
2
3
4
Container number
Weight of
container (W1)
Weight of container +
wet soil (W2)
Weight of container +
dry soil (W3)
Weight of water
Ww = (W2- W3)
Weight of dry soil
Wd= (W3- W1)
Moisture content (%) =
(WW/WD)100
No. of blows
GLOBAL ACADEMY OF TECHNOLOGY
Dept of civil engineering-15CVL57 Page 18
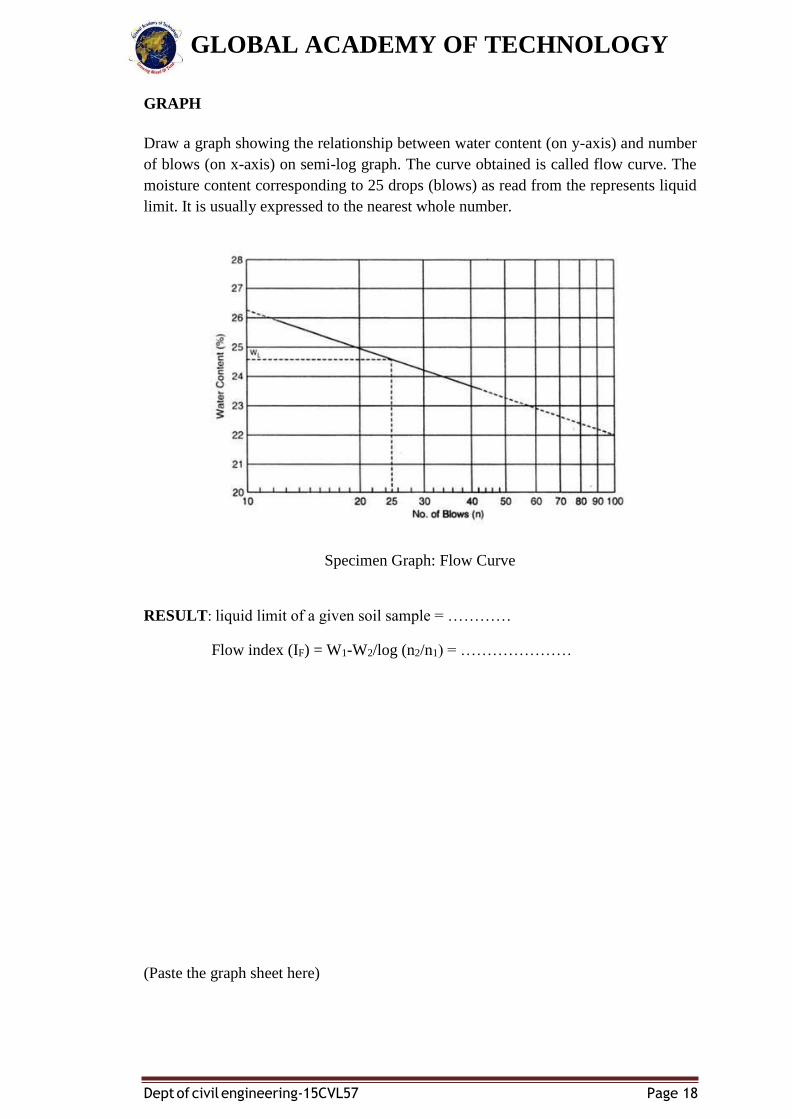
GRAPH
Draw a graph showing the relationship between water content (on y-axis) and number
of blows (on x-axis) on semi-log graph. The curve obtained is called flow curve. The
moisture content corresponding to 25 drops (blows) as read from the represents liquid
limit. It is usually expressed to the nearest whole number.
Specimen Graph: Flow Curve
RESULT: liquid limit of a given soil sample = …………
Flow index (IF) = W1-W2/log (n2/n1) = …………………
(Paste the graph sheet here)
GLOBAL ACADEMY OF TECHNOLOGY
Dept of civil engineering-15CVL57 Page 19
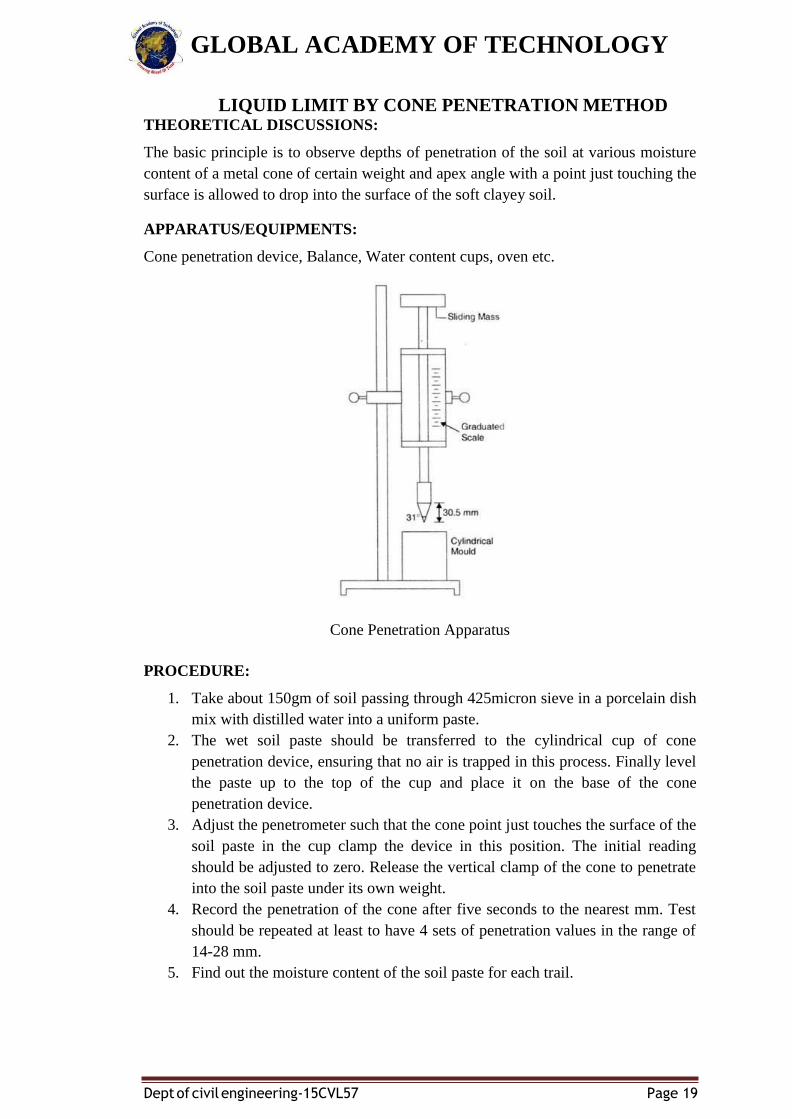
LIQUID LIMIT BY CONE PENETRATION METHOD THEORETICAL DISCUSSIONS:
The basic principle is to observe depths of penetration of the soil at various moisture
content of a metal cone of certain weight and apex angle with a point just touching the
surface is allowed to drop into the surface of the soft clayey soil.
APPARATUS/EQUIPMENTS:
Cone penetration device, Balance, Water content cups, oven etc.
Cone Penetration Apparatus
PROCEDURE:
1. Take about 150gm of soil passing through 425micron sieve in a porcelain dish
mix with distilled water into a uniform paste.
2. The wet soil paste should be transferred to the cylindrical cup of cone
penetration device, ensuring that no air is trapped in this process. Finally level
the paste up to the top of the cup and place it on the base of the cone
penetration device.
3. Adjust the penetrometer such that the cone point just touches the surface of the
soil paste in the cup clamp the device in this position. The initial reading
should be adjusted to zero. Release the vertical clamp of the cone to penetrate
into the soil paste under its own weight.
4. Record the penetration of the cone after five seconds to the nearest mm. Test
should be repeated at least to have 4 sets of penetration values in the range of
14-28 mm.
5. Find out the moisture content of the soil paste for each trail.
GLOBAL ACADEMY OF TECHNOLOGY
Dept of civil engineering-15CVL57 Page 20
OBSERVATIONS:-
Trial
Penetration
in (mm)
Cup
no
Weight of
empty cup
(w1)
Wt. Of
cup + wet
soil (w2)
Wt. Of cup
+ dry soil
(w3)
Water content
(w2- w3) / (w3-
w1)
GRAPH:
A graph representing water content in the Y-axis and the cone penetration on the X-
axis (using semi log sheet) shall be prepared the best fitted line is drawn. The
moisture content corresponding to cone penetration of 20 mm shall be taken as the
liquid limit of the soil.
(Paste the graph sheet here)
RESULTS:-
Liquid Limit by Cone Penetration Method =
Additional Information
Liquid limit values for types of soil.
Type of soil Liquid limit
sand 20
silts 27
clay 100
GLOBAL ACADEMY OF TECHNOLOGY
Dept of civil engineering-15CVL57 Page 21
5.2. PLASTIC LIMIT TEST
AIM: To determine the plastic limit of a given soil sample.
NEED AND SCOPE:
Soil is used for making bricks, tiles, and soil cement blocks in addition to its use as
foundation for structures.
APPARATUS REQUIRED
1. Porcelain dish.
2. Glass plate for rolling the specimen.
3. Air tight containers to determine the moisture content.
4. Balance of capacity 200gm and sensitive to 0.01gm
5. Oven thermostatically controlled with interior of non-corroding material to
maintain the temperature around 1050 and 1100C.
PROCEDURE
1. Take about 20gm of thoroughly mixed portion of the material passing through
425 micron I.S. Sieve obtained in accordance with I.S. 2720 (part 1).
2. Mix it thoroughly with distilled water in the evaporating dish till the soil mass
becomes plastic enough to be easily moulded with fingers.
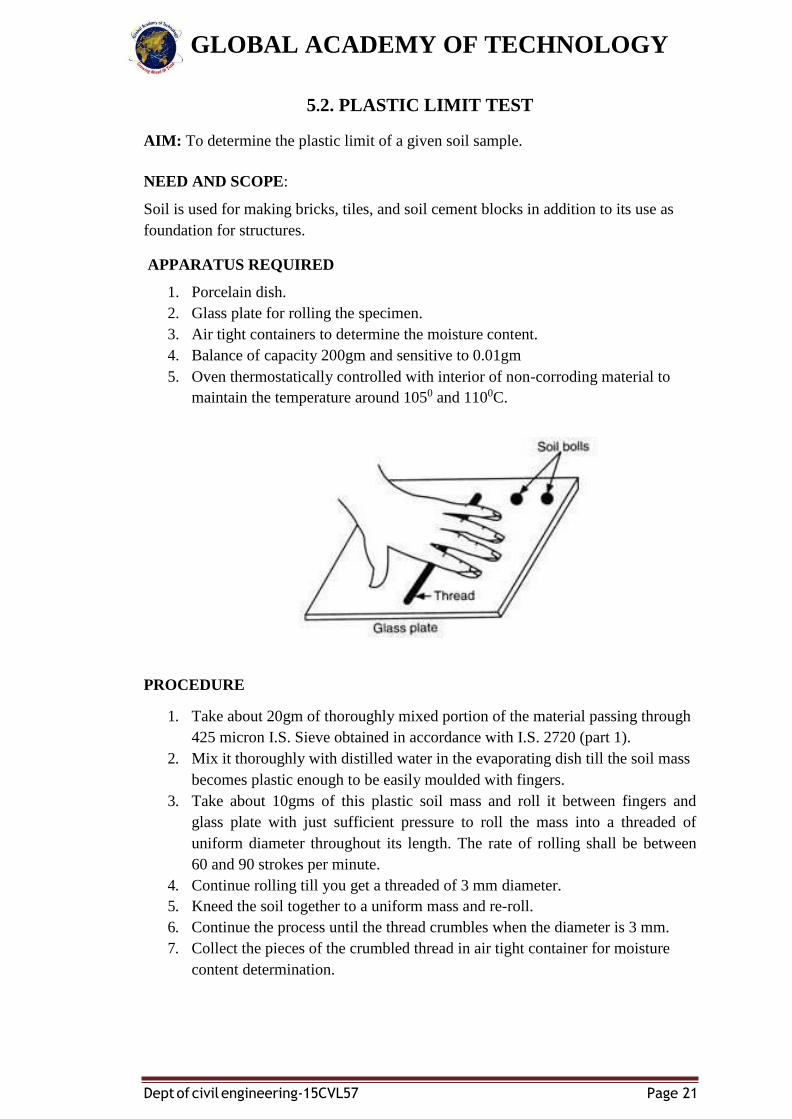
3. Take about 10gms of this plastic soil mass and roll it between fingers and
glass plate with just sufficient pressure to roll the mass into a threaded of
uniform diameter throughout its length. The rate of rolling shall be between
60 and 90 strokes per minute.
4. Continue rolling till you get a threaded of 3 mm diameter.
5. Kneed the soil together to a uniform mass and re-roll.
6. Continue the process until the thread crumbles when the diameter is 3 mm.
7. Collect the pieces of the crumbled thread in air tight container for moisture
content determination.
GLOBAL ACADEMY OF TECHNOLOGY
Dept of civil engineering-15CVL57 Page 22
8. Repeat the test to at least 3 times and take the average of the results calculated
to the nearest whole number.
OBSERVATION AND REPORTING
Compare the diameter of thread at intervals with the rod. When the diameter reduces
to 3 mm, note the surface of the thread for cracks.
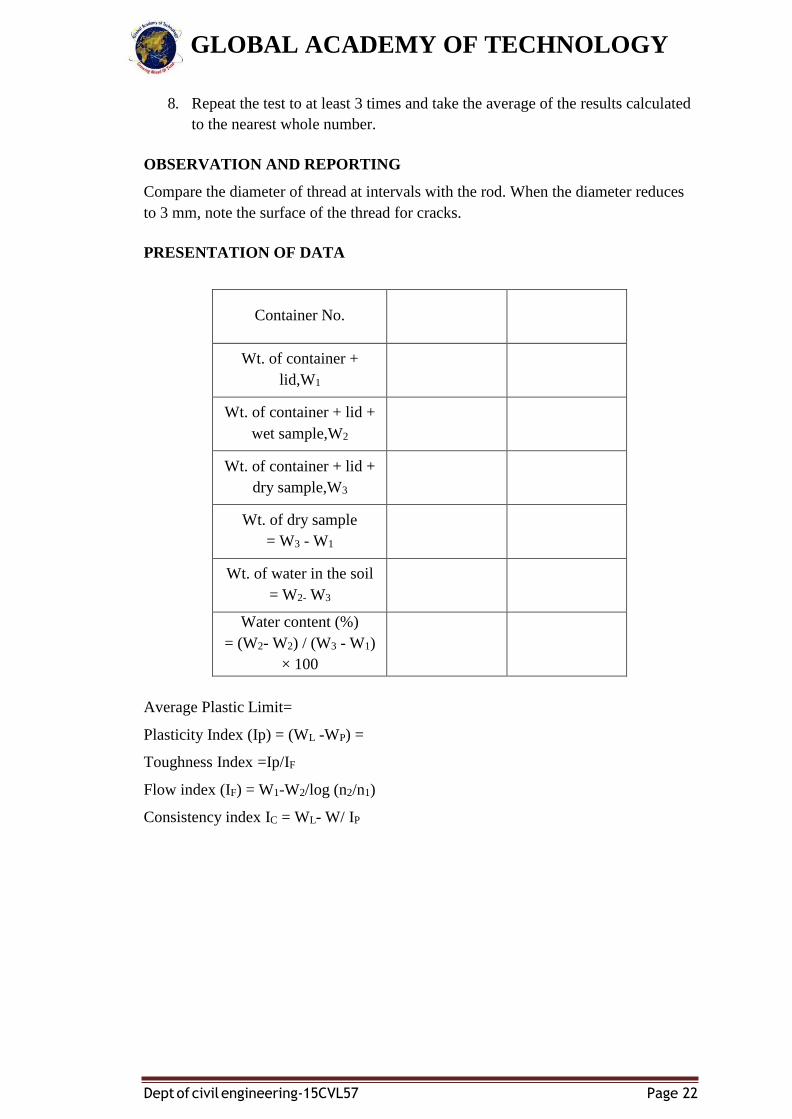
PRESENTATION OF DATA
Container No.
Wt. of container +
lid,W1
Wt. of container + lid +
wet sample,W2
Wt. of container + lid +
dry sample,W3
Wt. of dry sample
= W3 - W1
Wt. of water in the soil
= W2- W3
Water content (%)
= (W2- W2) / (W3 - W1)
× 100
Average Plastic Limit=
Plasticity Index (Ip) = (WL -WP) =
Toughness Index =Ip/IF
Flow index (IF) = W1-W2/log (n2/n1)
Consistency index IC = WL- W/ IP
GLOBAL ACADEMY OF TECHNOLOGY
Dept of civil engineering-15CVL57 Page 23
Graph:
Semi log graph is used and plasticity index is taken in the ordinary scale (Y-axis) and
Liquid Limit (X-axis).
(Paste the graph sheet here)
VIVA QUESTIONS:-
1) What are the practical applications of liquid limit, plastic limit and plasticity
index of soils?
2) Why do you use the soil passing from 425µ IS sieve to determine L.L., P.L. &
S.L.?
3) If a thread of 5mm is made instead of 3mm, then what is the effect of P.L.?
4) What is the degree of saturation of a soil at P.L.?
5) What is the degree of saturation of a soil at S.L.?
6) Does volume increase on addition of water at S.L.?
7) What are the factors affecting the value of S.L.?
8) What is the effect of air bubbles on S.L.?
9) Why do you use mercury to determine the volume of wet and dry soil pat?
Can you use any other material?
GLOBAL ACADEMY OF TECHNOLOGY
Dept of civil engineering-15CVL57 Page 24
5.3 SHRINKAGE LIMIT TEST
OBJECTIVE:
To determine the shrinkage limit and calculate the shrinkage ratio for the given soil.
THEORY:
As the soil loses moisture, either in its natural environment, or by artificial means in
laboratory it changes from liquid state to plastic state, from plastic state to semi-solid
state and then to solid state. Volume changes also occur with changes in water
content. But there is particular limit at which any moisture change does not cause soil
any volume change.
NEED AND SCOPE:
Soils which undergo large volume changes with change in water content may be
troublesome. Volume changes may not and usually will not be equal.
A shrinkage limit test should be performed on a soil.
1. To obtain a quantitative indication of how much change in moisture can occur
before any appreciable volume changes occurs
2. To obtain an indication of change in volume.
The shrinkage limit is useful in areas where soils undergo large volume changes when
going through wet and dry cycles (as in case of earth dams)
APPARATUS:
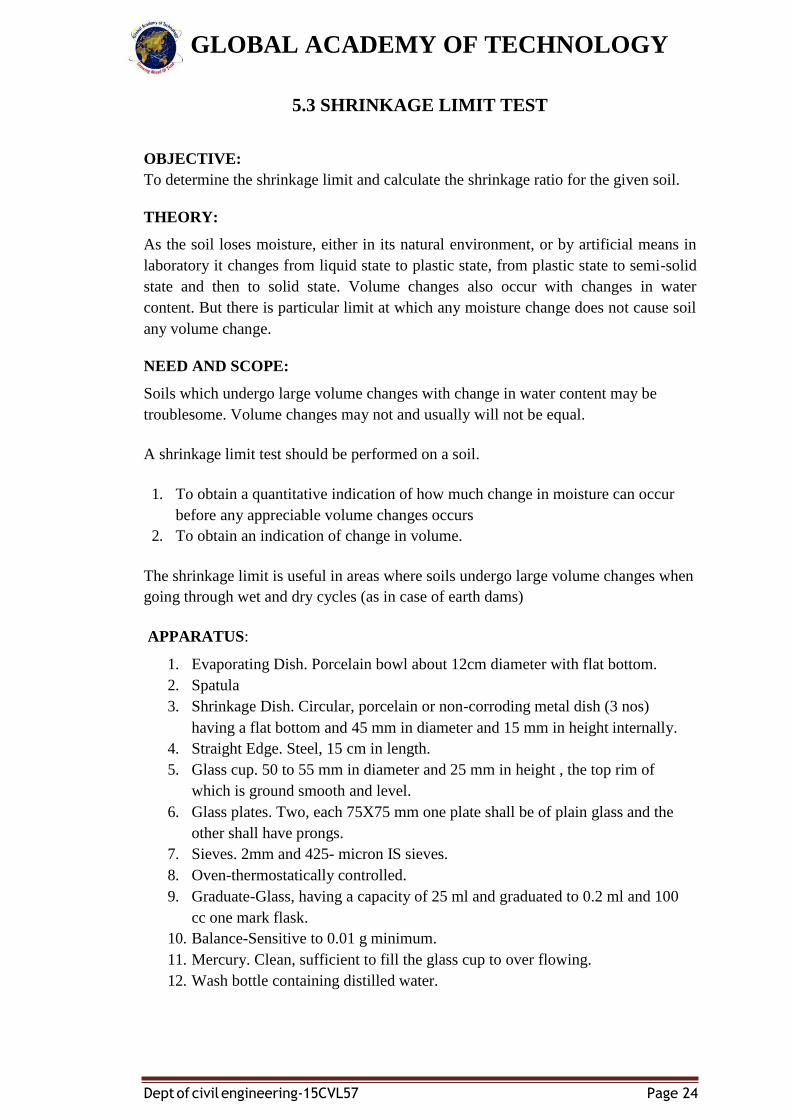
1. Evaporating Dish. Porcelain bowl about 12cm diameter with flat bottom.
2. Spatula
3. Shrinkage Dish. Circular, porcelain or non-corroding metal dish (3 nos)
having a flat bottom and 45 mm in diameter and 15 mm in height internally.
4. Straight Edge. Steel, 15 cm in length.
5. Glass cup. 50 to 55 mm in diameter and 25 mm in height , the top rim of
which is ground smooth and level.
6. Glass plates. Two, each 75X75 mm one plate shall be of plain glass and the
other shall have prongs.
7. Sieves. 2mm and 425- micron IS sieves.
8. Oven-thermostatically controlled.
9. Graduate-Glass, having a capacity of 25 ml and graduated to 0.2 ml and 100
cc one mark flask.
10. Balance-Sensitive to 0.01 g minimum.
11. Mercury. Clean, sufficient to fill the glass cup to over flowing.
12. Wash bottle containing distilled water.
GLOBAL ACADEMY OF TECHNOLOGY
Dept of civil engineering-15CVL57 Page 25
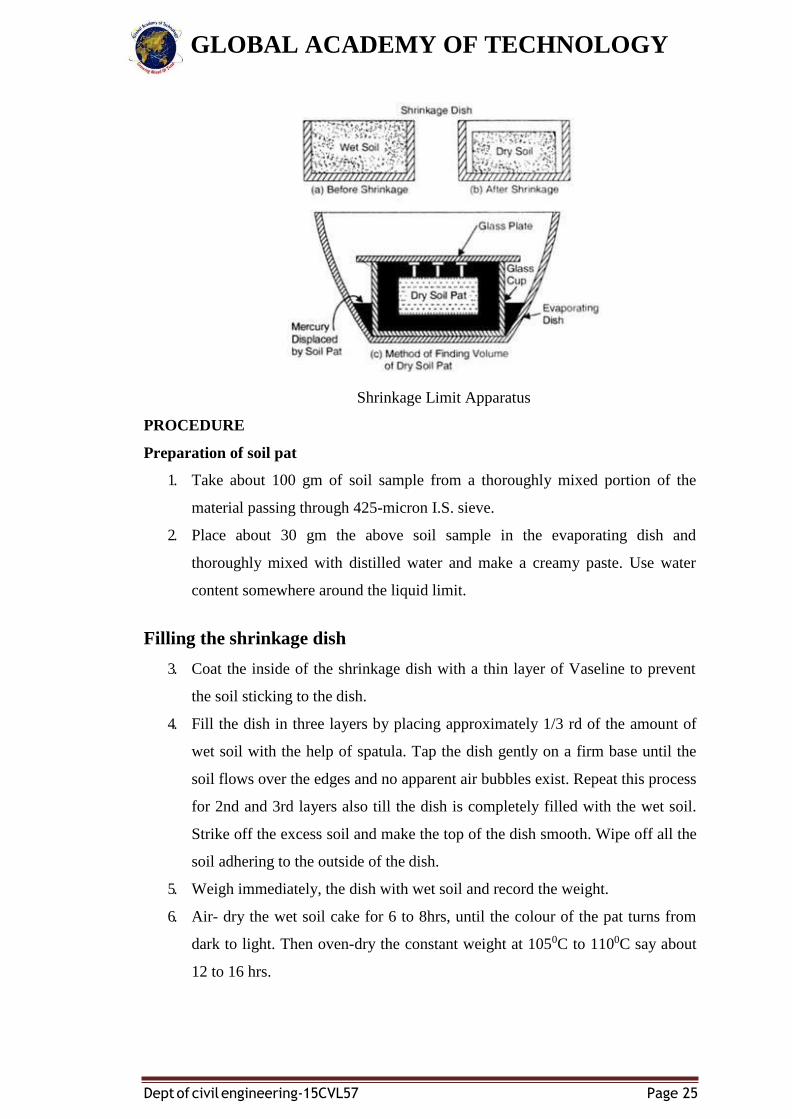
Shrinkage Limit Apparatus
PROCEDURE
Preparation of soil pat
1. Take about 100 gm of soil sample from a thoroughly mixed portion of the
material passing through 425-micron I.S. sieve.
2. Place about 30 gm the above soil sample in the evaporating dish and
thoroughly mixed with distilled water and make a creamy paste. Use water
content somewhere around the liquid limit.
Filling the shrinkage dish
3. Coat the inside of the shrinkage dish with a thin layer of Vaseline to prevent
the soil sticking to the dish.
4. Fill the dish in three layers by placing approximately 1/3 rd of the amount of
wet soil with the help of spatula. Tap the dish gently on a firm base until the
soil flows over the edges and no apparent air bubbles exist. Repeat this process
for 2nd and 3rd layers also till the dish is completely filled with the wet soil.
Strike off the excess soil and make the top of the dish smooth. Wipe off all the
soil adhering to the outside of the dish.
5. Weigh immediately, the dish with wet soil and record the weight.
6. Air- dry the wet soil cake for 6 to 8hrs, until the colour of the pat turns from
dark to light. Then oven-dry the constant weight at 1050C to 1100C say about
12 to 16 hrs.
GLOBAL ACADEMY OF TECHNOLOGY
Dept of civil engineering-15CVL57 Page 26
7. Remove the dried disk of the soil from oven. Cool it in a desiccator. Then
obtain the weight of the dish with dry sample.
8. Determine the weight of the empty dish and record.
9. Determine the volume of shrinkage dish which is evidently equal to volume of
the wet soil as follows. Place the shrinkage dish in an evaporating dish and fill
the dish with mercury till it overflows slightly. Press it with plain glass plate
firmly on its top to remove excess mercury. Pour the mercury from the
shrinkage dish into a measuring jar and find the volume of the shrinkage dish
directly. Record this volume as the volume of the wet soil pat.
Volume of the Dry Soil Pat
10. Determine the volume of dry soil pat by removing the pat from the shrinkage
dish and immersing it in the glass cup full of mercury in the following manner.
Place the glass cup in a larger one and fill the glass cup to overflowing with mercury.
Remove the excess mercury by covering the cup with glass plate with prongs and
pressing it. See that no air bubbles are entrapped. Wipe out the outside of the glass
cup to remove the adhering mercury. Then, place it in another larger dish, which is,
clean and empty carefully.
Place the dry soil pat on the mercury. It floats submerge it with the pronged glass
plate which is again made flush with top of the cup. The mercury spills over into the
larger plate. Pour the mercury that is displayed by the soil pat into the measuring jar
and find the volume of the soil pat directly.
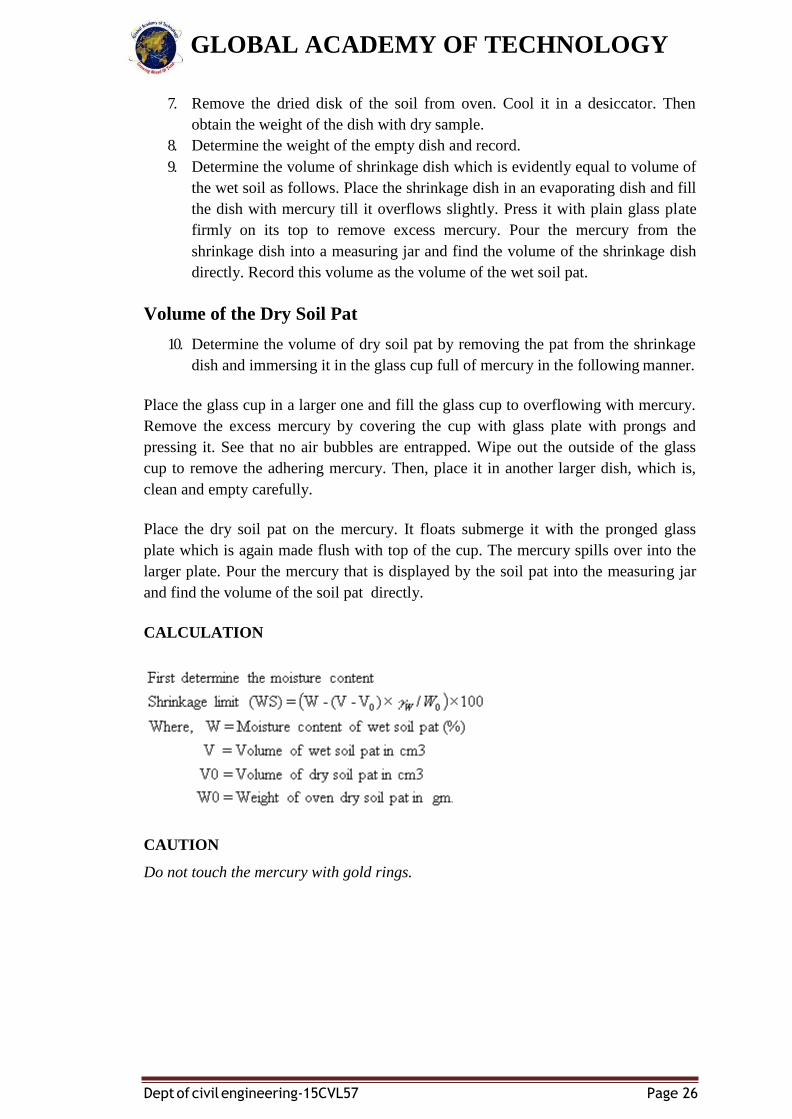
CALCULATION
CAUTION
Do not touch the mercury with gold rings.
GLOBAL ACADEMY OF TECHNOLOGY
Dept of civil engineering-15CVL57 Page 27
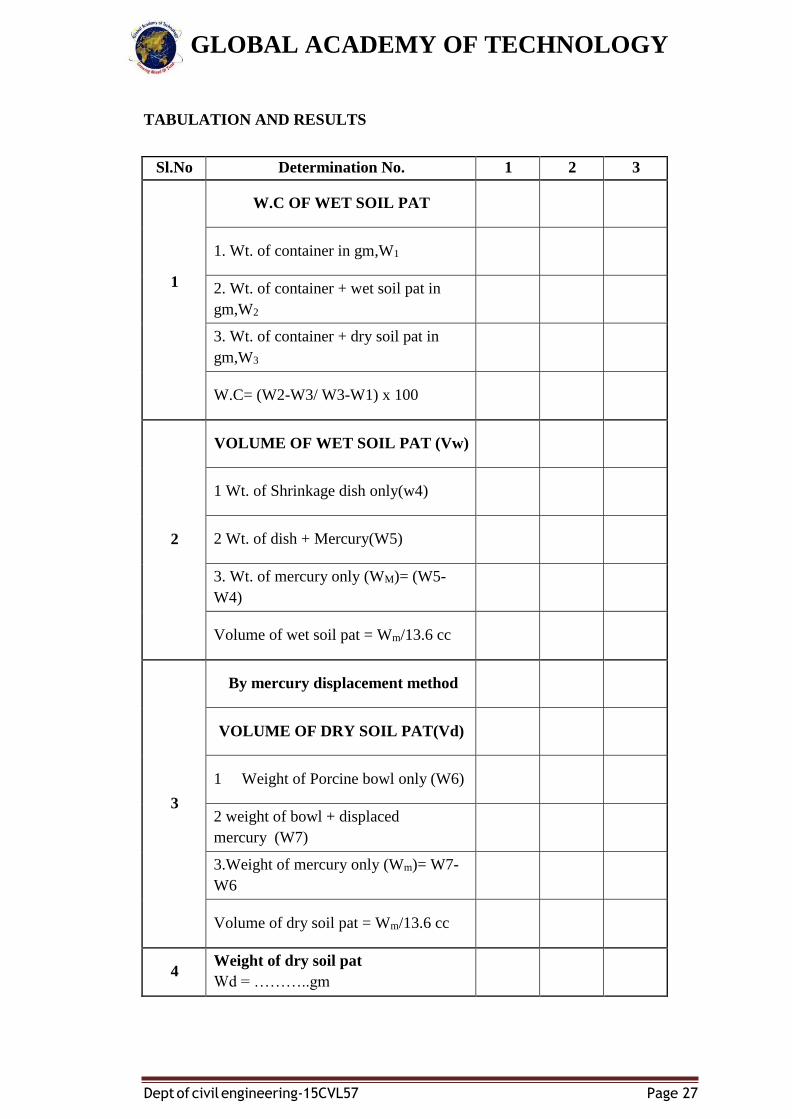
TABULATION AND RESULTS
Sl.No Determination No. 1 2 3
1
W.C OF WET SOIL PAT
1. Wt. of container in gm,W1
2. Wt. of container + wet soil pat in
gm,W2
3. Wt. of container + dry soil pat in
gm,W3
W.C= (W2-W3/ W3-W1) x 100
2
VOLUME OF WET SOIL PAT (Vw)
1 Wt. of Shrinkage dish only(w4)
2 Wt. of dish + Mercury(W5)
3. Wt. of mercury only (WM)= (W5-
W4)
Volume of wet soil pat = Wm/13.6 cc
3
By mercury displacement method
VOLUME OF DRY SOIL PAT(Vd)
1 Weight of Porcine bowl only (W6)
2 weight of bowl + displaced
mercury (W7)
3.Weight of mercury only (Wm)= W7-
W6
Volume of dry soil pat = Wm/13.6 cc
4 Weight of dry soil pat
Wd = ………..gm
GLOBAL ACADEMY OF TECHNOLOGY
Dept of civil engineering-15CVL57 Page 28
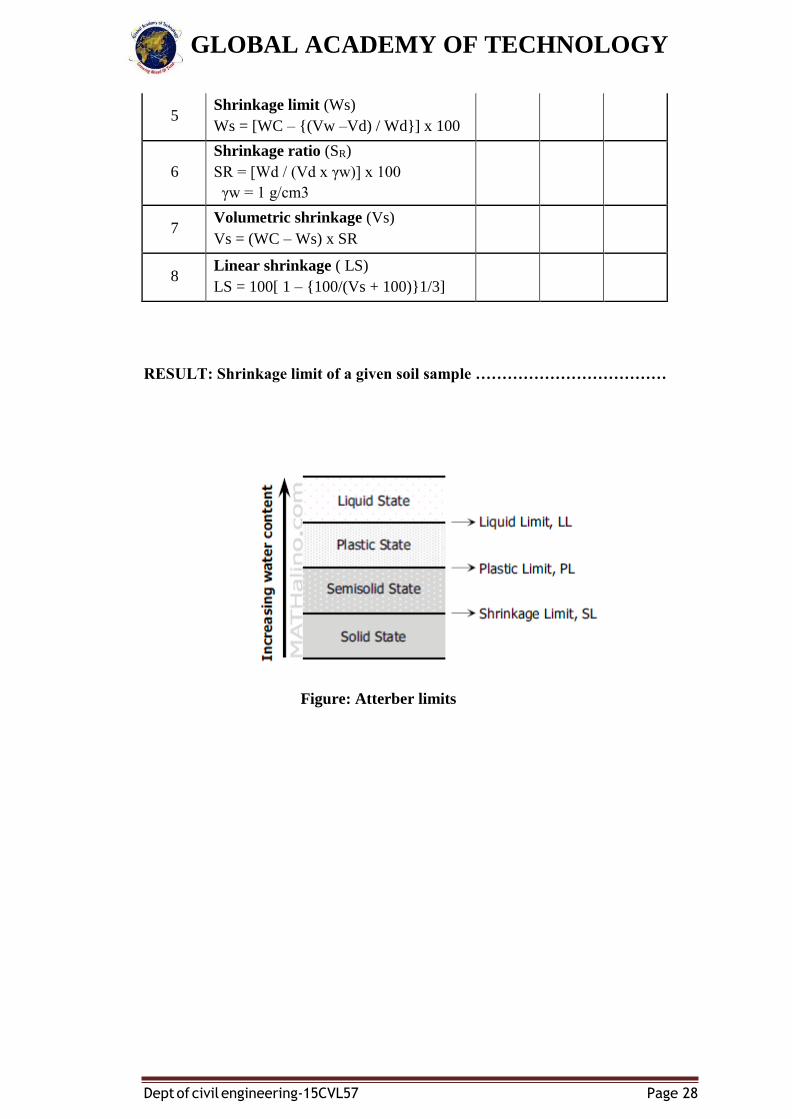
5 Shrinkage limit (Ws)
Ws = [WC – {(Vw –Vd) / Wd}] x 100
6
Shrinkage ratio (SR)
SR = [Wd / (Vd x γw)] x 100
γw = 1 g/cm3
7 Volumetric shrinkage (Vs)
Vs = (WC – Ws) x SR
8 Linear shrinkage ( LS)
LS = 100[ 1 – {100/(Vs + 100)}1/3]
RESULT: Shrinkage limit of a given soil sample ………………………………
Figure: Atterber limits
GLOBAL ACADEMY OF TECHNOLOGY
Dept of civil engineering-15CVL57 Page 29
EXPERIMENT – 6: IN SITU DENSITY BY CORE CUTTER AND
SAND REPLACEMENT METHOD
OBJECTIVE:
Determination of field density of soil by
I. Core cutter method
II. Sand replacement method
CORE CUTTER METHOD.
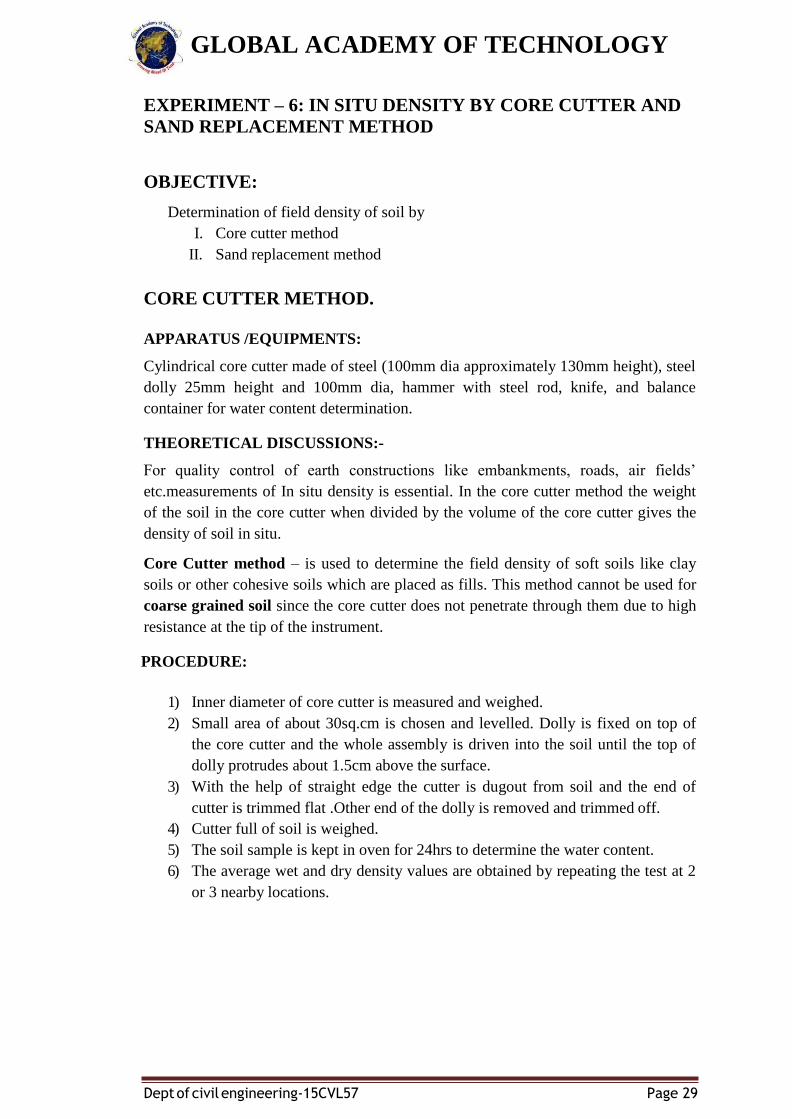
APPARATUS /EQUIPMENTS:
Cylindrical core cutter made of steel (100mm dia approximately 130mm height), steel
dolly 25mm height and 100mm dia, hammer with steel rod, knife, and balance
container for water content determination.
THEORETICAL DISCUSSIONS:-
For quality control of earth constructions like embankments, roads, air fields’
etc.measurements of In situ density is essential. In the core cutter method the weight
of the soil in the core cutter when divided by the volume of the core cutter gives the
density of soil in situ.
Core Cutter method – is used to determine the field density of soft soils like clay
soils or other cohesive soils which are placed as fills. This method cannot be used for
coarse grained soil since the core cutter does not penetrate through them due to high
resistance at the tip of the instrument.
PROCEDURE:
1) Inner diameter of core cutter is measured and weighed.
2) Small area of about 30sq.cm is chosen and levelled. Dolly is fixed on top of
the core cutter and the whole assembly is driven into the soil until the top of
dolly protrudes about 1.5cm above the surface.
3) With the help of straight edge the cutter is dugout from soil and the end of
cutter is trimmed flat .Other end of the dolly is removed and trimmed off.
4) Cutter full of soil is weighed.
5) The soil sample is kept in oven for 24hrs to determine the water content.
6) The average wet and dry density values are obtained by repeating the test at 2
or 3 nearby locations.
GLOBAL ACADEMY OF TECHNOLOGY
Dept of civil engineering-15CVL57 Page 30
Core Cutter
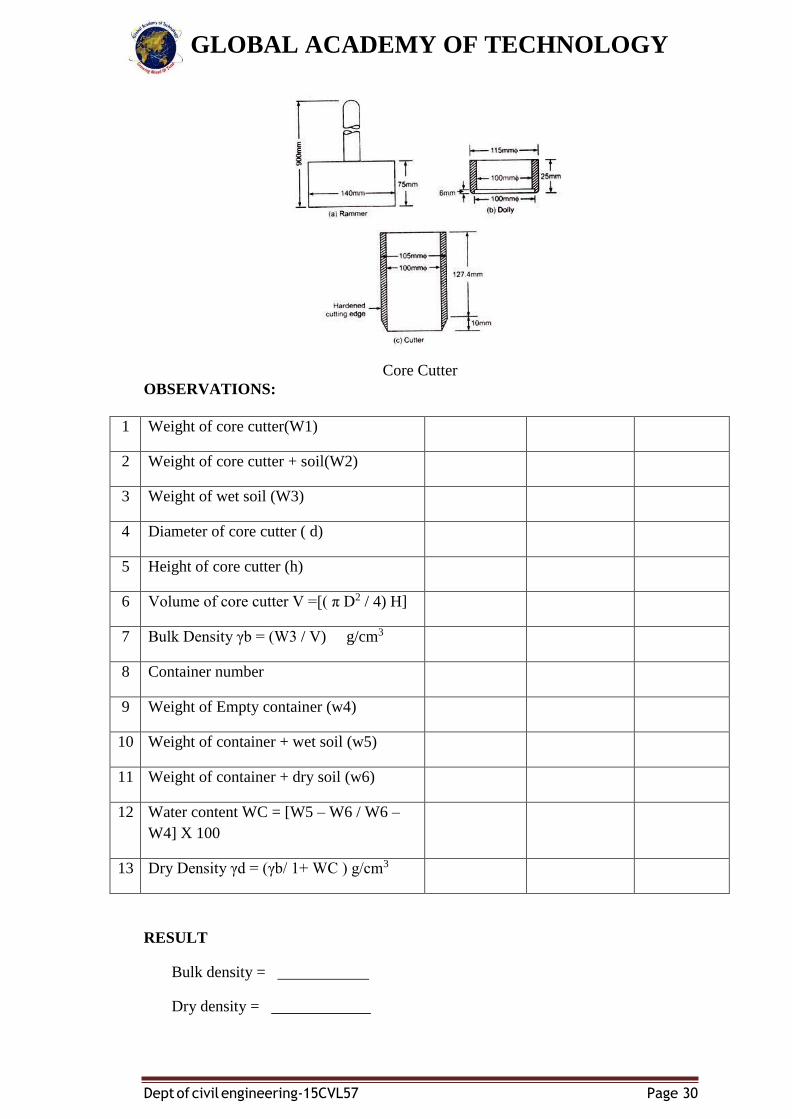
OBSERVATIONS:
1 Weight of core cutter(W1)
2 Weight of core cutter + soil(W2)
3 Weight of wet soil (W3)
4 Diameter of core cutter ( d)
5 Height of core cutter (h)
6 Volume of core cutter V =[( π D2 / 4) H]
7 Bulk Density γb = (W3 / V) g/cm3
8 Container number
9 Weight of Empty container (w4)
10 Weight of container + wet soil (w5)
11 Weight of container + dry soil (w6)
12 Water content WC = [W5 – W6 / W6 –
W4] X 100
13 Dry Density γd = (γb/ 1+ WC ) g/cm3
RESULT
Bulk density =
Dry density =
GLOBAL ACADEMY OF TECHNOLOGY
Dept of civil engineering-15CVL57 Page 31
SAND REPLACEMENT METHOD
OBJECTIVE:
Determine the in situ density of natural or compacted soils using sand pouring
cylinders.
NEED AND SCOPE:
The in situ density of natural soil is needed for the determination of bearing capacity
of soils, for the purpose of stability analysis of slopes, for the determination of
pressures on underlying strata for the calculation of settlement and the design of
underground structures.
It is very quality control test, where compaction is required, in the cases like
embankment and pavement construction.
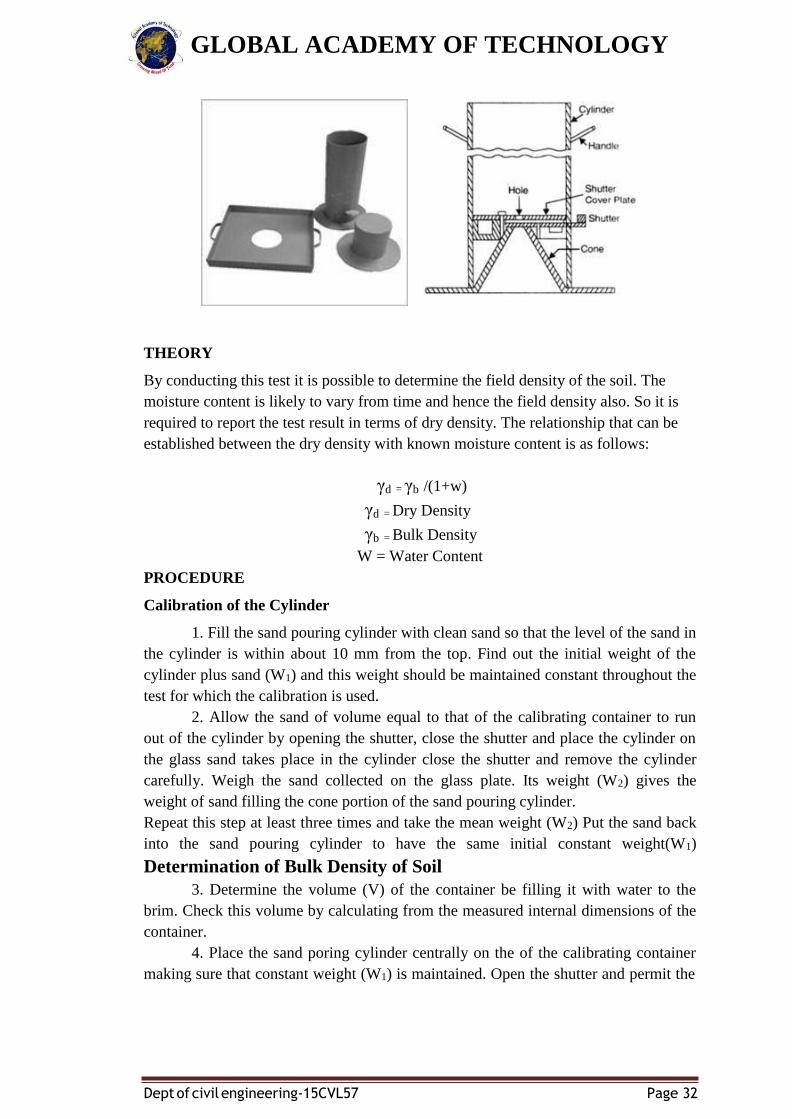
1. APPARATUS REQUIRED:
1. Sand pouring cylinder of 3 litre/16.5 litre capacity mounted above a pouring
come and separated by a shutter cover plate.
2. Tools for excavating holes; suitable tools such as scraper tool to make a level
surface.
3. Cylindrical calibrating container with an internal diameter of 100 mm/200 mm
and an internal depth of 150 mm/250 mm fitted with a flange 50 mm/75 mm
wide and about 5 mm surrounding the open end.
4. Balance to weigh unto an accuracy of 1g.
5. Metal containers to collect excavated soil.
6. Metal tray with 300 mm/450 mm square and 40 mm/50 mm deep with a 100
mm/200 mm diameter hole in the centre.
7. Glass plate about 450 mm/600 mm square and 10mm thick.
8. Clean, uniformly graded natural sand passing through 1.00 mm I.S.sieve and
retained on the 600micron I.S.sieve. It shall be free from organic matter and shall
have been oven dried and exposed to atmospheric humidity.
8. Suitable non-corrodible airtight containers.
9. Thermostatically controlled oven with interior on non-corroding material to
maintain the temperature between 1050C to 1100C.
10. Desiccators with any desiccating agent other than sulphuric acid.
GLOBAL ACADEMY OF TECHNOLOGY
Dept of civil engineering-15CVL57 Page 32
THEORY
By conducting this test it is possible to determine the field density of the soil. The
moisture content is likely to vary from time and hence the field density also. So it is
required to report the test result in terms of dry density. The relationship that can be
established between the dry density with known moisture content is as follows:
γd = γb /(1+w)
γd = Dry Density
γb = Bulk Density
W = Water Content
PROCEDURE
Calibration of the Cylinder
1. Fill the sand pouring cylinder with clean sand so that the level of the sand in
the cylinder is within about 10 mm from the top. Find out the initial weight of the
cylinder plus sand (W1) and this weight should be maintained constant throughout the
test for which the calibration is used.
2. Allow the sand of volume equal to that of the calibrating container to run
out of the cylinder by opening the shutter, close the shutter and place the cylinder on
the glass sand takes place in the cylinder close the shutter and remove the cylinder
carefully. Weigh the sand collected on the glass plate. Its weight (W2) gives the
weight of sand filling the cone portion of the sand pouring cylinder.
Repeat this step at least three times and take the mean weight (W2) Put the sand back
into the sand pouring cylinder to have the same initial constant weight(W1)
Determination of Bulk Density of Soil
3. Determine the volume (V) of the container be filling it with water to the
brim. Check this volume by calculating from the measured internal dimensions of the
container.
4. Place the sand poring cylinder centrally on the of the calibrating container
making sure that constant weight (W1) is maintained. Open the shutter and permit the
GLOBAL ACADEMY OF TECHNOLOGY
Dept of civil engineering-15CVL57 Page 33
sand to run into the container. When no further movement of sand is seen close the
shutter, remove the pouring cylinder and find its weight (W3).
Determination of Dry Density of Soil in Place
5. Approximately 60 Sqcm of area of soil to be tested should be trimmed
down to a level surface, approximately of the size of the container. Keep the metal
tray on the level surface and excavate a circular hole of volume equal to that of the
calibrating container. Collect all the excavated soil in the tray and find out the weight
of the excavated soil (Ww).
6. Remove the tray, and place the sand pouring cylinder filled to constant
weight so that the base of the cylinder covers the hole concentrically. Open the shutter
and permit the sand to run into the hole. Close the shutter when no further movement
of the sand is seen. Remove the cylinder and determine its weight (W3).
7. Keep a representative sample of the excavated sample of the soil for water
content determination.
GLOBAL ACADEMY OF TECHNOLOGY
Dept of civil engineering-15CVL57 Page 34
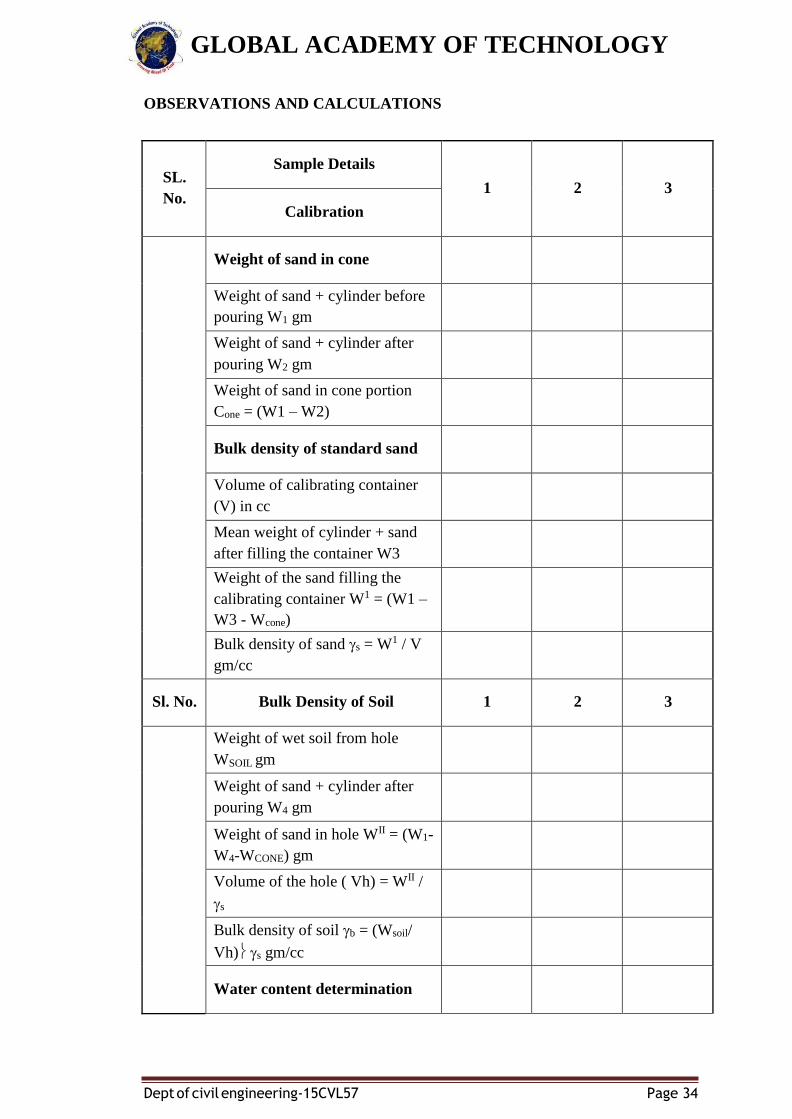
OBSERVATIONS AND CALCULATIONS
SL.
No.
Sample Details
1
2
3
Calibration
Weight of sand in cone
Weight of sand + cylinder before
pouring W1 gm
Weight of sand + cylinder after
pouring W2 gm
Weight of sand in cone portion
Cone = (W1 – W2)
Bulk density of standard sand
Volume of calibrating container
(V) in cc
Mean weight of cylinder + sand
after filling the container W3
Weight of the sand filling the
calibrating container W1 = (W1 –
W3 - Wcone)
Bulk density of sand s = W1 / V
gm/cc
Sl. No. Bulk Density of Soil 1 2 3
Weight of wet soil from hole
WSOIL gm
Weight of sand + cylinder after
pouring W4 gm
Weight of sand in hole WII = (W1-
W4-WCONE) gm
Volume of the hole ( Vh) = WII /
s
Bulk density of soil b = (Wsoil/
Vh) s gm/cc
Water content determination
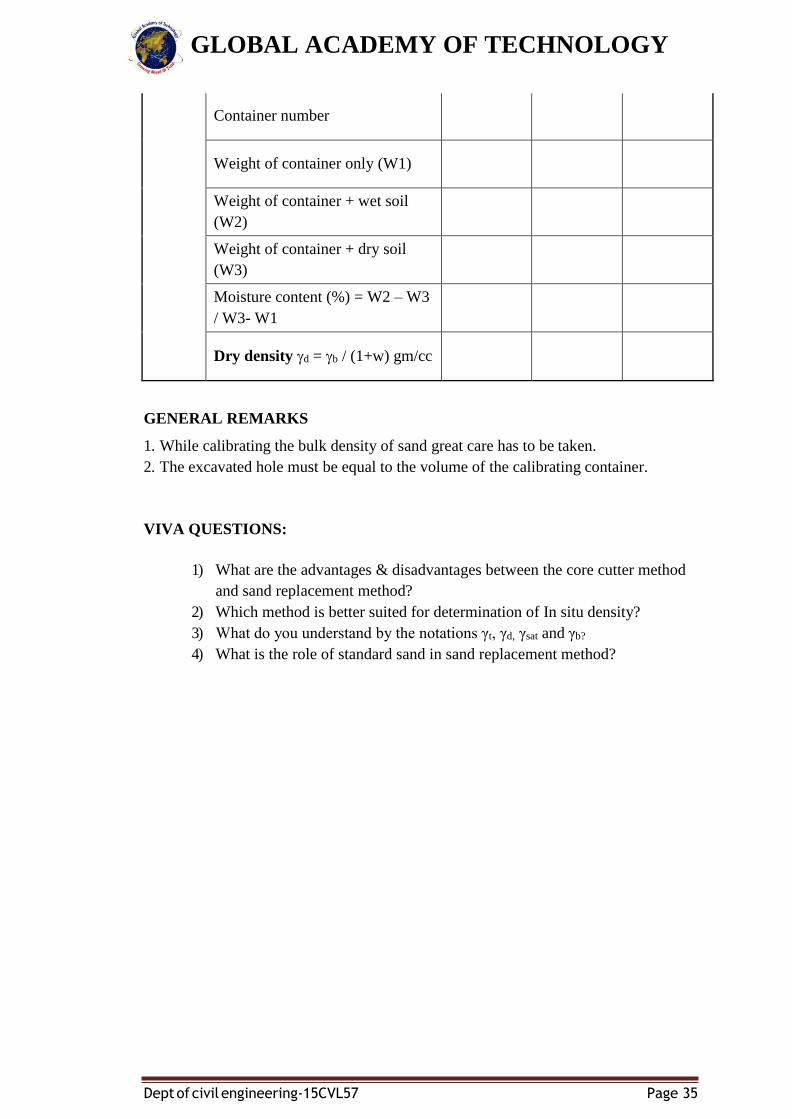
GLOBAL ACADEMY OF TECHNOLOGY
Dept of civil engineering-15CVL57 Page 35
Container number
Weight of container only (W1)
Weight of container + wet soil
(W2)
Weight of container + dry soil
(W3)
Moisture content (%) = W2 – W3
/ W3- W1
Dry density d = b / (1+w) gm/cc
GENERAL REMARKS
1. While calibrating the bulk density of sand great care has to be taken.
2. The excavated hole must be equal to the volume of the calibrating container.
VIVA QUESTIONS:
1) What are the advantages & disadvantages between the core cutter method
and sand replacement method?
2) Which method is better suited for determination of In situ density?
3) What do you understand by the notations γt, γd, γsat and γb?
4) What is the role of standard sand in sand replacement method?
GLOBAL ACADEMY OF TECHNOLOGY
Dept of civil engineering-15CVL57 Page 36
EXPERIMENT 7: STANDARD PROCTOR COMPACTION TEST
DEFINITION:
The Proctor compaction test is a laboratory method of experimentally determining the
optimal moisture content at which a given soil type will become most dense and
achieve its maximum dry density.
OBJECTIVE:
Compaction can be applied to improve the properties of an existing soil or in the
process of placing fill. The main objectives are to:
• Increase shear strength and therefore bearing capacity
• Increase stiffness and therefore reduce future settlement
• decrease voids ratio and so permeability, thus reducing potential frost heave
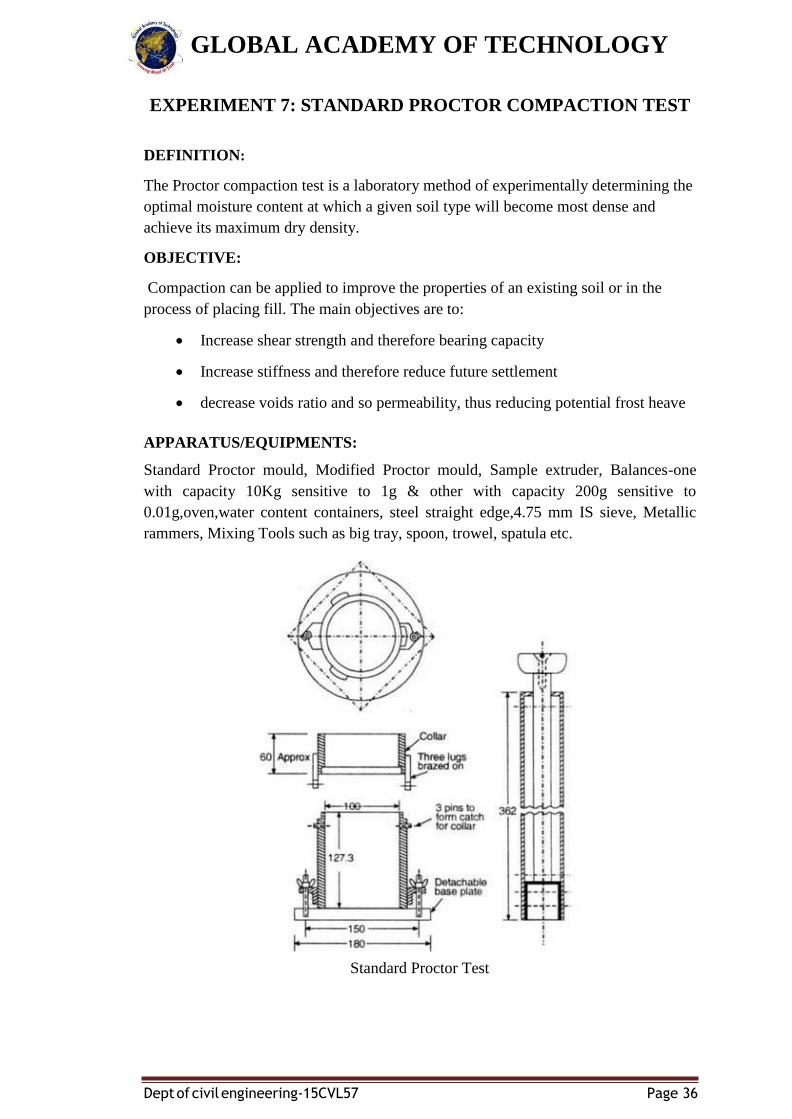
APPARATUS/EQUIPMENTS:
Standard Proctor mould, Modified Proctor mould, Sample extruder, Balances-one
with capacity 10Kg sensitive to 1g & other with capacity 200g sensitive to
0.01g,oven,water content containers, steel straight edge,4.75 mm IS sieve, Metallic
rammers, Mixing Tools such as big tray, spoon, trowel, spatula etc.
Standard Proctor Test
GLOBAL ACADEMY OF TECHNOLOGY
Dept of civil engineering-15CVL57 Page 37
THEORETICAL DISCUSSIONS:
Compaction of soil can be achieved by rolling, vibrating and damping of the soil
which is essential during the construction of earth dams, embankments etc;The factors
which affect the compaction of soil are the type of soil, method of compaction, energy
inputs and the water content. Proctor demonstrated that for a given soil and comp
active energy, the dry density attained is a maximum at a particular water content
called Optimum Moisture Content (OMC).
PROCEDURE:-
1) Measure the internal dimensions of the Proctor mould and thus calculate its
volume (V).
2) Weigh the weight of the empty mould & base plate (W1).Smear with a thin
layer of oil the inner surface of the base plate, Proctor’s mould and its collar.
3) Take 3 Kg of soil passing through 4.75mm IS sieve in a large tray. Add
enough water to bring its water content up to 7 %( sandy soil) or 10 %( clayey
soil) less than the probable OMC of the soil.
4) Attach the collar and base plate to the Proctor’s mould.
5) Mix the matured wet soil thoroughly. Take about 3 Kg of soil and compact it
in the Proctor’s mould in 3 equal layers, each layer being given 25 blows from
the rammer weighing 2.6Kg, dropping from a height of 310mm in the case of
Standard Proctor mould. In the case of Modified Proctor mould a bigger
mould of capacity 2250ml is used. In case of Modified Proctor test 5 Kg of
soil should be taken and should be compacted in 5 equal layers. The base
plate is detached and the mould is weighted with compacted soil (W2). Each
layer given 56 blows from the rammer weighing 2.6 Kg dropping from a
height of 310mm.
6) Remove the collar and cut the excess soil with the help of straight edge. Clean
the mould from outside and weigh to the nearest gram. Take out the soil from
the mould. Cut it in the middle and keep a representative soil specimen for
Water content determination.
7) Repeat the steps 5 & 6 for about 5 or 6 times using a fresh part of soil by
adding a higher Water content than the preceding specimen.
OBSERVATION AND CALCULATION
Weight of soil =
Weight of mould + base plate =
Height of the mould (H) =
Diameter of the mould =
Volume of the mould (π d2 / 4) H
GLOBAL ACADEMY OF TECHNOLOGY
Dept of civil engineering-15CVL57 Page 38
Bulk Density
Water to be added (percent)
Weight of mould only (W1)
Weight of Mould + compacted soil (W2) gms
Weight of soil only (Ws )
Bulk density of soil: γb = Ws / V (gm /cc)
Water content
Container No.
Weight of cup only (W1)
Wt. Of container + wet soil gms.(W2)
Wt. Of container + dry soil gms (W3)
WATER CONTENT W = W2 – W3 / W3 – W1 (%)
Dry Density of Soil
γd = ( γb / 1 + W) gm /cc
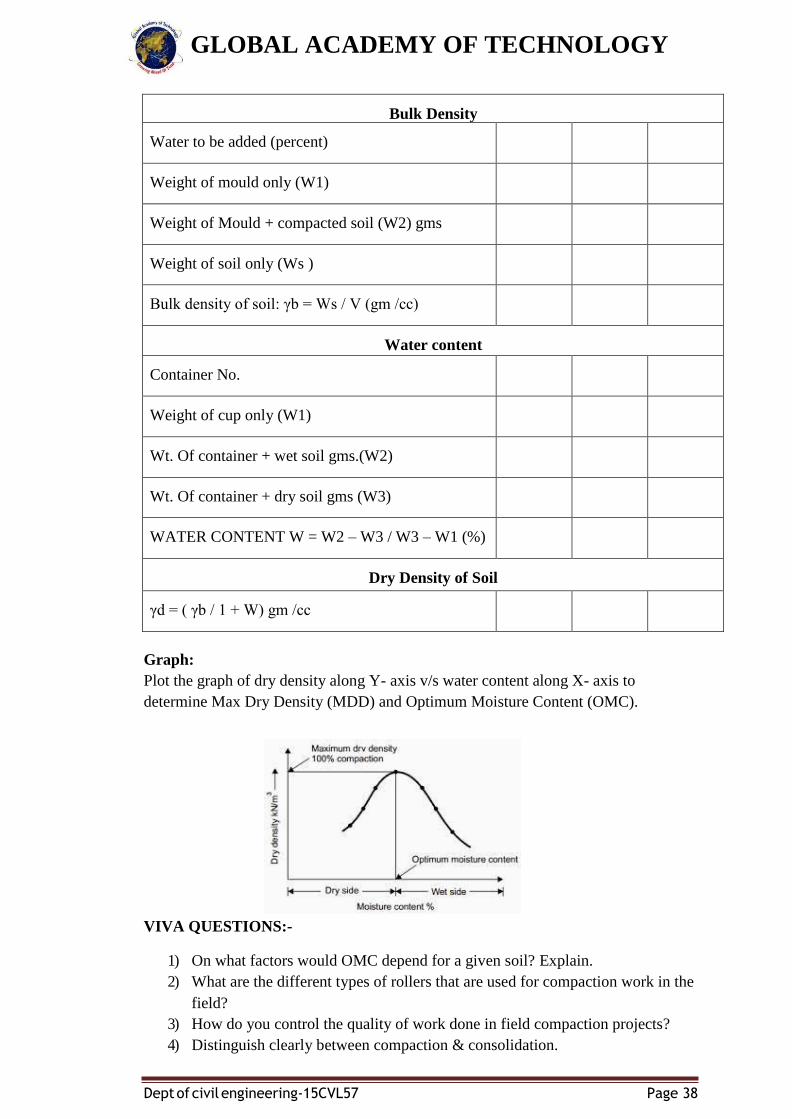
Graph:
Plot the graph of dry density along Y- axis v/s water content along X- axis to
determine Max Dry Density (MDD) and Optimum Moisture Content (OMC).
VIVA QUESTIONS:-
1) On what factors would OMC depend for a given soil? Explain.
2) What are the different types of rollers that are used for compaction work in the
field?
3) How do you control the quality of work done in field compaction projects?
4) Distinguish clearly between compaction & consolidation.
GLOBAL ACADEMY OF TECHNOLOGY
Dept of civil engineering-15CVL57 Page 39
EXPERIMENT – 8: CO-EFFICIENT OF PERMEABILITY BY
CONSTANT HEAD AND VARIABLE HEAD METHODS
OBJECTIVE:
To determine the co-efficient of permeability of coarse grain soils by the constant
head method and the co-efficient of permeability of fine grained by the variable head
methods.
APPARATUS / EQUIPMENTS:
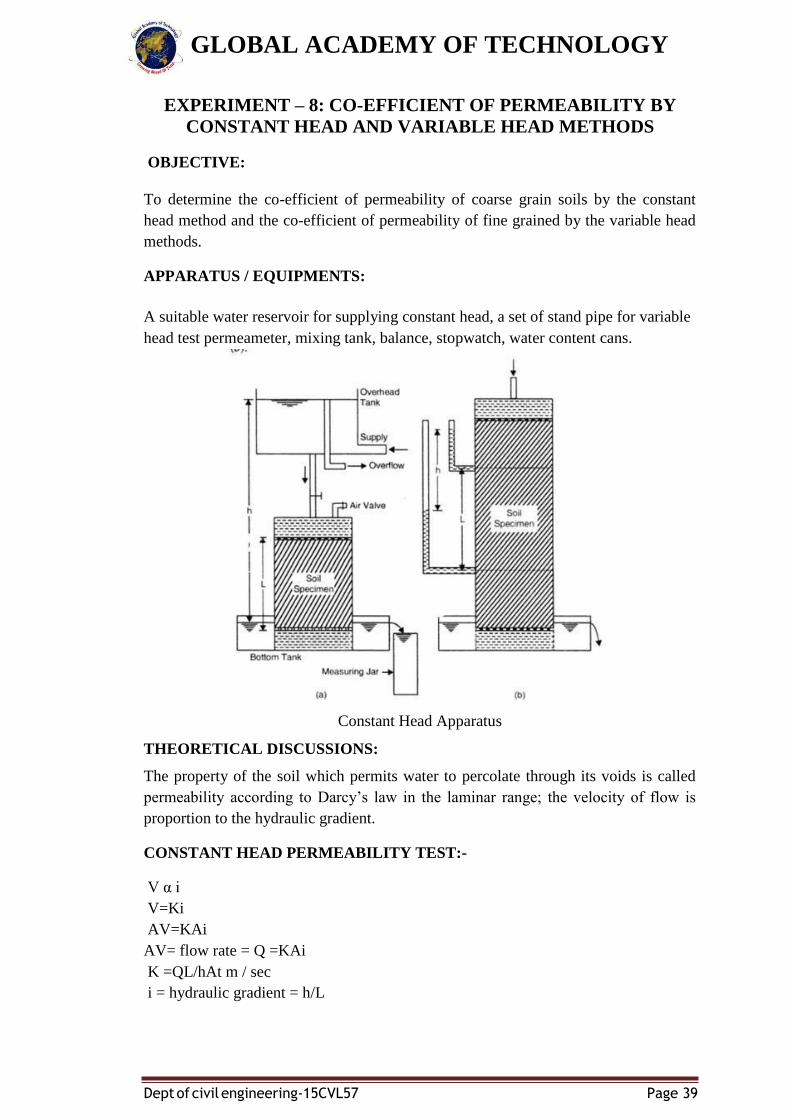
A suitable water reservoir for supplying constant head, a set of stand pipe for variable
head test permeameter, mixing tank, balance, stopwatch, water content cans.
Constant Head Apparatus
THEORETICAL DISCUSSIONS:
The property of the soil which permits water to percolate through its voids is called
permeability according to Darcy’s law in the laminar range; the velocity of flow is
proportion to the hydraulic gradient.
CONSTANT HEAD PERMEABILITY TEST:-
V α i
V=Ki
AV=KAi
AV= flow rate = Q =KAi
K =QL/hAt m / sec
i = hydraulic gradient = h/L
GLOBAL ACADEMY OF TECHNOLOGY
Dept of civil engineering-15CVL57 Page 40
A = cross section of soil mass perpendicular to the direction of flow,
V = velocity of flow,
h = head loss in a distance L along the flow path.
PROCEDURE:
I. CONSTANT HEAD METHOD:
a) Preparation Of Specimen:
1) Take about 800-1000gm of soil and mixed with water so that its water
content rises to optimum water content.
2) Grease the mould. Assemble the dynamic permeameter. Place the mould
upside down on the dynamic compaction base and weigh the assembly.
Put 3cm collar to the other end.
3) Compact the wet soil in 2-layers by applying 15 blows to each layer with
2.5kg ramming rod. Remove the collar and trim off the excess soil and
weigh the assembly filled with soil and determine the weight of the
soil,(W).
4) Place the filter paper or fine wire mesh on the top of specimen and fix
the perforated base plate on it.
5) Turn the specimen upside down. Remove the compaction plate and place
the porous stone on the top of the specimen and fix up the sealing a top
cap.
b) Saturation of compacted specimen:
Place the permeameter mould in the vacuum desiccators at the open air
valve. Fill the desiccators with desired water such that it reaches the well above
the top cap. Apply the vacuum and increase gradually to about 70cm of Hg.
TESTING:-
1) Place the mould in the bottom tank and fill it with water up to its outlet.
Connect the outlet of constant head tank to the inlet of permeameter.
2) Adjust the head by either adjusting the Relative height of mould and constant
head tank or by rising or by lowering the air intake tube within the head tank.
3) Run the test for some convenient time interval.
4) Note the duration of test by stop watch. Collect the water (V-cc) in a
beaker flowing from outlet of bottom tank and measure it.
OBSERVATIONS:-
h = head causing flow.
L = Internal length of permeameter
t = time in seconds
Q= total volume of water collected in t, sec
D = Internal dia of permeameter
A = Internal area of permeameter
GLOBAL ACADEMY OF TECHNOLOGY
Dept of civil engineering-15CVL57 Page 41
V = Internal volume of permeameter
WS = Bulk unit weight (γb)
V
w= water content
Dry unit weight (γd) = (γb)
1+w
Hydraulic gradient, i= h /L
Coefficient of Permeability of soil, K = Q / h At
Seepage velocity (Vs) = (1+ e/e)
Void ratio e = (G γW / γd) – 1
Porosity (n) = e / (1+e)
Co efficient of percolation Kp = k / n
Head causing Time taken to Discharge Coefficient of Average value
flow ( h ) collect water (t) Q = Volume of permeability K ( cc / sec) water / t K =
(cc / sec) (cc / sec )
RESULT:-
K =
VARIABLE HEAD PERMEABILITY TEST:-
According to Darcy’s law
K = 2.303 [(aL / At) log 10 (H1/H2)]
Where a = cross section area of stand pipe,
t = time of flow, = t2 – t1
H1 = initial head, H2 = final head.
GLOBAL ACADEMY OF TECHNOLOGY
Dept of civil engineering-15CVL57 Page 42
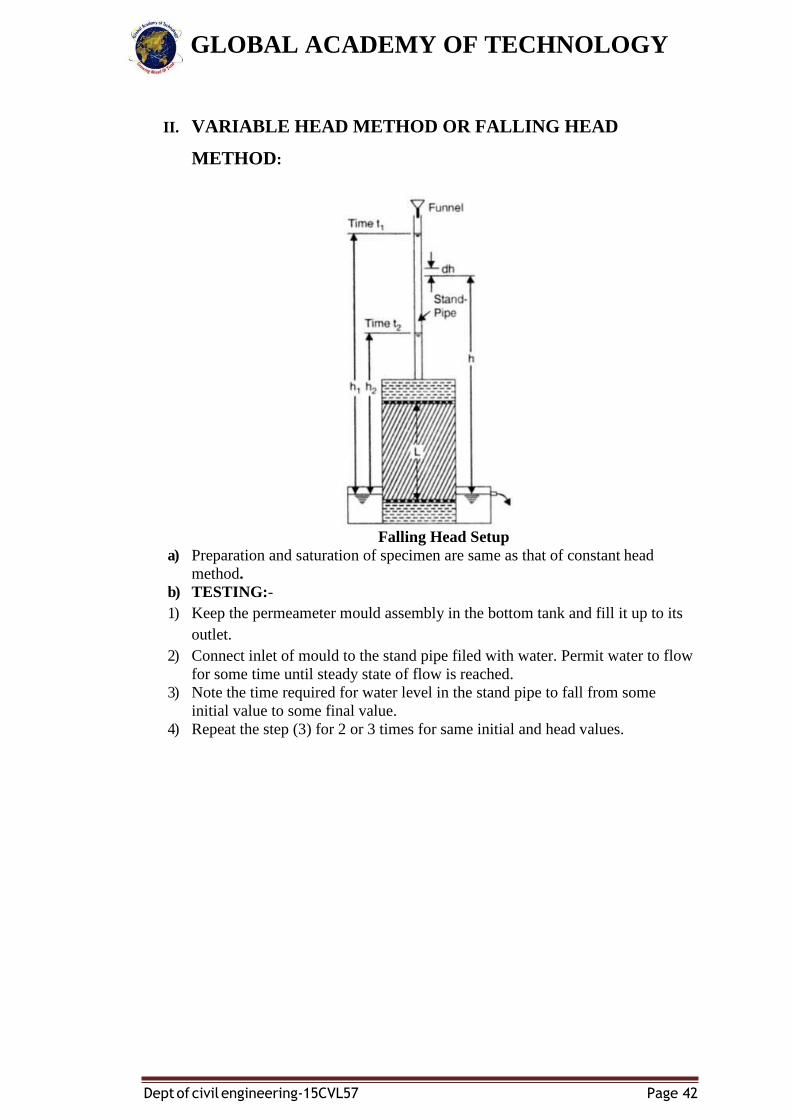
II. VARIABLE HEAD METHOD OR FALLING HEAD
METHOD:
Falling Head Setup
a) Preparation and saturation of specimen are same as that of constant head
method.
b) TESTING:-
1) Keep the permeameter mould assembly in the bottom tank and fill it up to its
outlet.
2) Connect inlet of mould to the stand pipe filed with water. Permit water to flow
for some time until steady state of flow is reached.
3) Note the time required for water level in the stand pipe to fall from some
initial value to some final value.
4) Repeat the step (3) for 2 or 3 times for same initial and head values.
GLOBAL ACADEMY OF TECHNOLOGY
Dept of civil engineering-15CVL57 Page 43
c) Determination of (a ):
Collect water contained in between 2 graduations [of the stand pipe] of
known distance apart, weigh it and determine the inside area of stand pipe.
OBSERVATIONS:-
D = internal dia of permeameter =
A = Internal cross area of permeameter =
L = internal Length of permeameter =
V = internal volume of permeameter =
d= internal diameter of stand pipe =
a= internal area of stand pipe =
h1= initial head in stand pipe =
h2 = final head in stand pipe =
Weight of empty permeameter (W1) =
Weight of permeameter (W2) =
Weight of soil = W2 – W1
Dry density γd = (W2 – W1 / V)
Void ratio e = (G γW / γd ) – 1
Porosity (n) = e / (1+e)
CALCULATIONS:-
KT= 2.303[(aL/A (t2 – t1) X Log10 (h1/h2)] =
RESULT:-
K =
PRECAUTIONS:-
Increase the conclusion slowly and in every increment sufficient time should
be given to escape the air bubbles off the specimen without vibrating the
specimen.
LIMITATIONS:-
Generally this apparatus is used for fine grained soils only.
GLOBAL ACADEMY OF TECHNOLOGY
Dept of civil engineering-15CVL57 Page 44
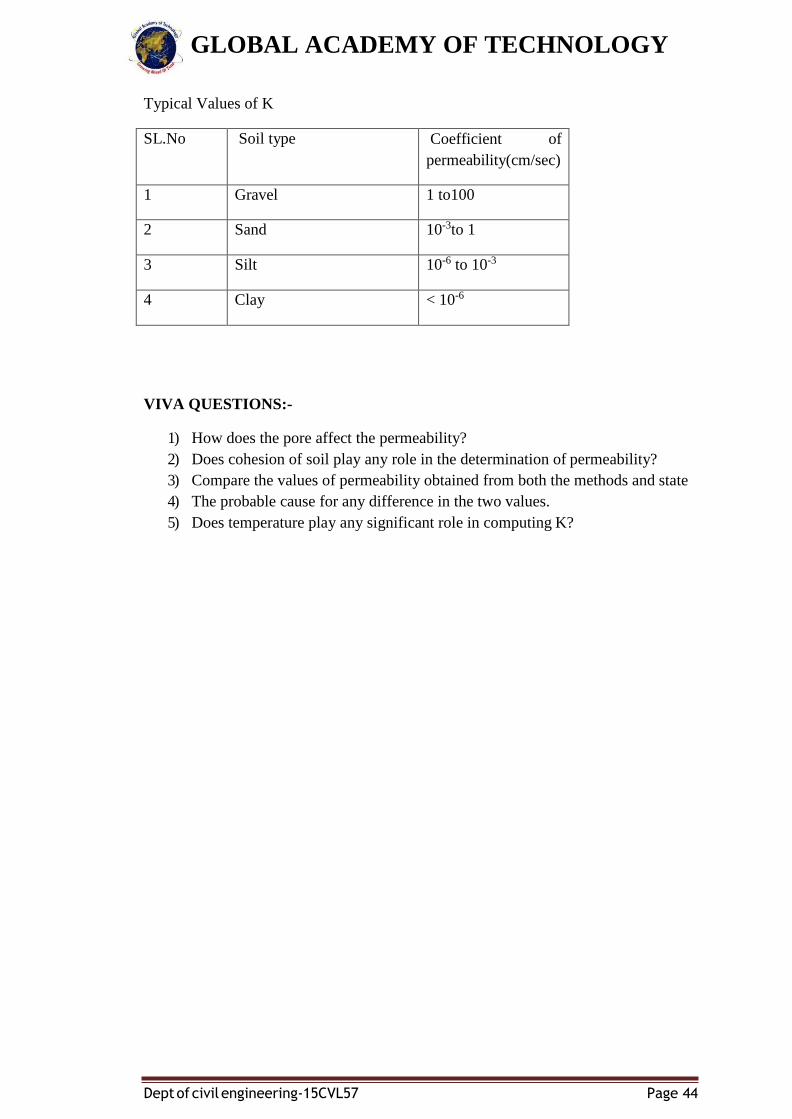
Typical Values of K
SL.No Soil type Coefficient of
permeability(cm/sec)
1 Gravel 1 to100
2 Sand 10-3to 1
3 Silt 10-6 to 10-3
4 Clay < 10-6
VIVA QUESTIONS:-
1) How does the pore affect the permeability?
2) Does cohesion of soil play any role in the determination of permeability?
3) Compare the values of permeability obtained from both the methods and state
4) The probable cause for any difference in the two values.
5) Does temperature play any significant role in computing K?
GLOBAL ACADEMY OF TECHNOLOGY
Dept of civil engineering-15CVL57 Page 45
EXPERIMENT – 9: UNCONFINED COMPRESSION TEST
AIM: To determine shear parameters of cohesive soil
NEED AND SCOPE OF THE EXPERIMENT
It is not always possible to conduct the bearing capacity test in the field. Sometimes it
is cheaper to take the undisturbed soil sample and test its strength in the laboratory.
Also to choose the best material for the embankment, one has to conduct strength tests
on the samples selected. Under these conditions it is easy to perform the unconfined
compression test on undisturbed and remolded soil sample. Now we will investigate
experimentally the strength of a given soil sample.
PLANNING AND ORGANIZATION
We have to find out the diameter and length of the specimen.
EQUIPMENT
1. Loading frame of capacity of 2 t, with constant rate of movement. What is the
least count of the dial gauge attached to the proving ring
2. Proving ring of 0.01 kg sensitivity for soft soils; 0.05 kg for stiff soils.
3. Soil trimmer.
4. Frictionless end plates of 75 mm diameter (Perspex plate with silicon grease
coating).
5. Evaporating dish (Aluminium container).
6. Soil sample of 75 mm length.
7. Dial gauge (0.01 mm accuracy).
8. Balance of capacity 200 g and sensitivity to weigh 0.01 g.
9. Oven thermostatically controlled with interior of non-corroding material to
maintain the temperature at the desired level. What is the range of the
temperature used for drying the soil.
10. Sample extractor and split sampler.
11. Dial gauge (sensitivity 0.01mm).
12. Vernier callipers
GLOBAL ACADEMY OF TECHNOLOGY
Dept of civil engineering-15CVL57 Page 46
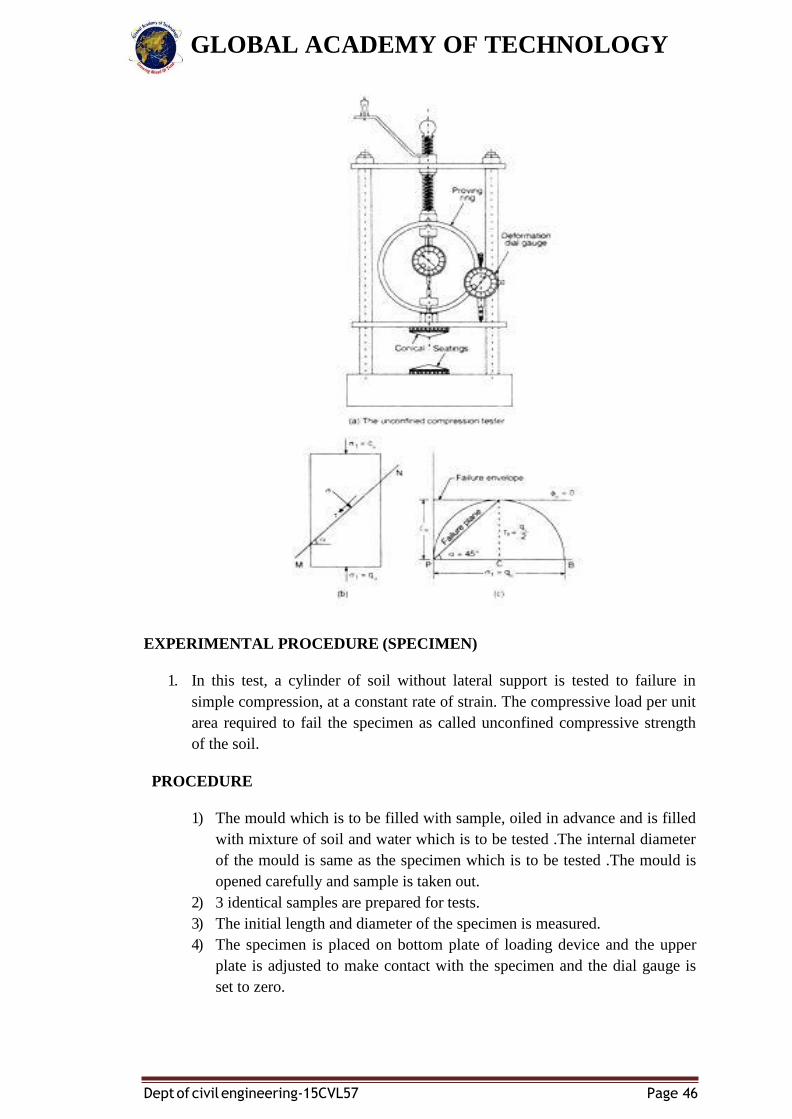
EXPERIMENTAL PROCEDURE (SPECIMEN)
1. In this test, a cylinder of soil without lateral support is tested to failure in
simple compression, at a constant rate of strain. The compressive load per unit
area required to fail the specimen as called unconfined compressive strength
of the soil.
PROCEDURE
1) The mould which is to be filled with sample, oiled in advance and is filled
with mixture of soil and water which is to be tested .The internal diameter
of the mould is same as the specimen which is to be tested .The mould is
opened carefully and sample is taken out.
2) 3 identical samples are prepared for tests.
3) The initial length and diameter of the specimen is measured.
4) The specimen is placed on bottom plate of loading device and the upper
plate is adjusted to make contact with the specimen and the dial gauge is
set to zero.
GLOBAL ACADEMY OF TECHNOLOGY
Dept of civil engineering-15CVL57 Page 47
5) The sample is compressed until cracks are developed or until a Vertical
deformation of 20% is reached in the dial gauge at its peak of stress-strain
curve is well passed.
6) Repeat the steps from 2 to 5 for other soil samples also.
7) The water content of each sample is determined.
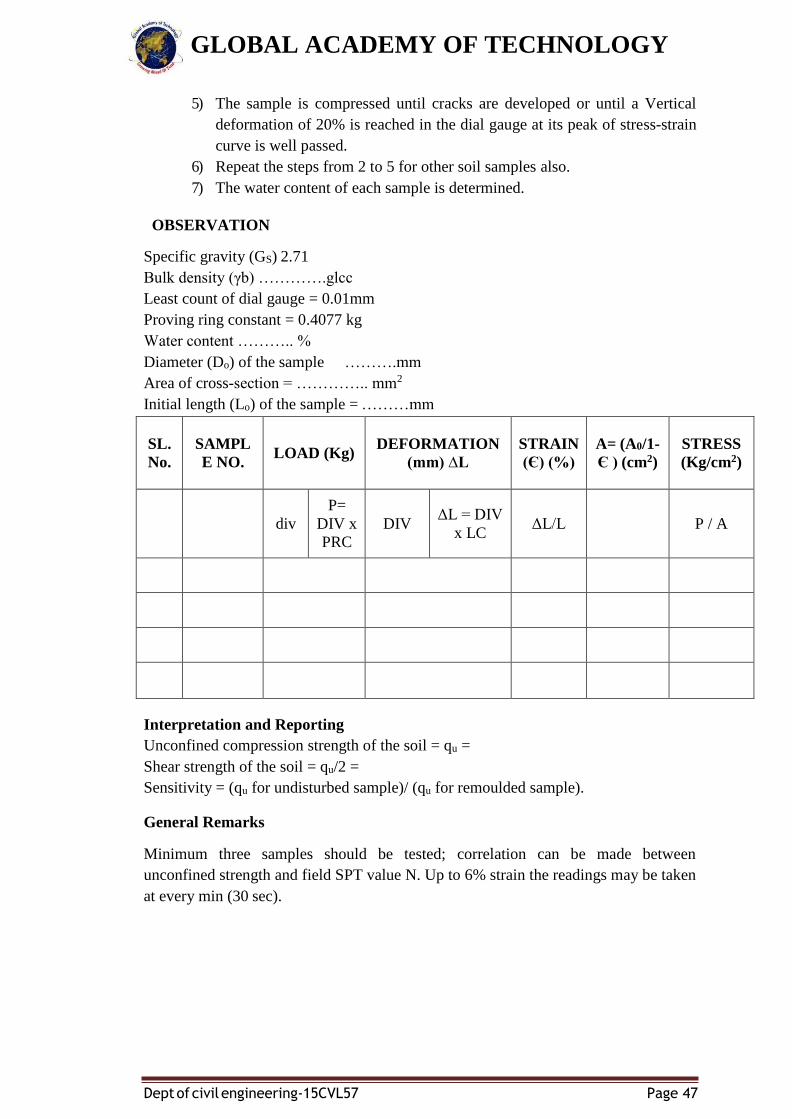
OBSERVATION
Specific gravity (GS) 2.71
Bulk density (γb) ………….glcc
Least count of dial gauge = 0.01mm
Proving ring constant = 0.4077 kg
Water content ……….. %
Diameter (Do) of the sample ……….mm
Area of cross-section = ………….. mm2
Initial length (Lo) of the sample = ………mm
SL.
No.
SAMPL
E NO.
LOAD (Kg)
DEFORMATION
(mm) ∆L
STRAIN
(Є) (%)
A= (A0/1-
Є ) (cm2)
STRESS
(Kg/cm2)
div
P=
DIV x
PRC
DIV
ΔL = DIV
x LC
ΔL/L
P / A
Interpretation and Reporting
Unconfined compression strength of the soil = qu =
Shear strength of the soil = qu/2 =
Sensitivity = (qu for undisturbed sample)/ (qu for remoulded sample).
General Remarks
Minimum three samples should be tested; correlation can be made between
unconfined strength and field SPT value N. Up to 6% strain the readings may be taken
at every min (30 sec).

GLOBAL ACADEMY OF TECHNOLOGY
Dept of civil engineering-15CVL57 Page 48
VIVA QUESTIONS:-
1) Why is this test possible for cohesive soil only?
2) Why is it called quick test?
3) When do you notice a brittle failure while conducting the unconfined
compressive strength test on cohesive soil?
4) When do you observe a bulging failure while conducting the UCC test on
cohesive soils?
GLOBAL ACADEMY OF TECHNOLOGY
Dept of civil engineering-15CVL57 Page 49
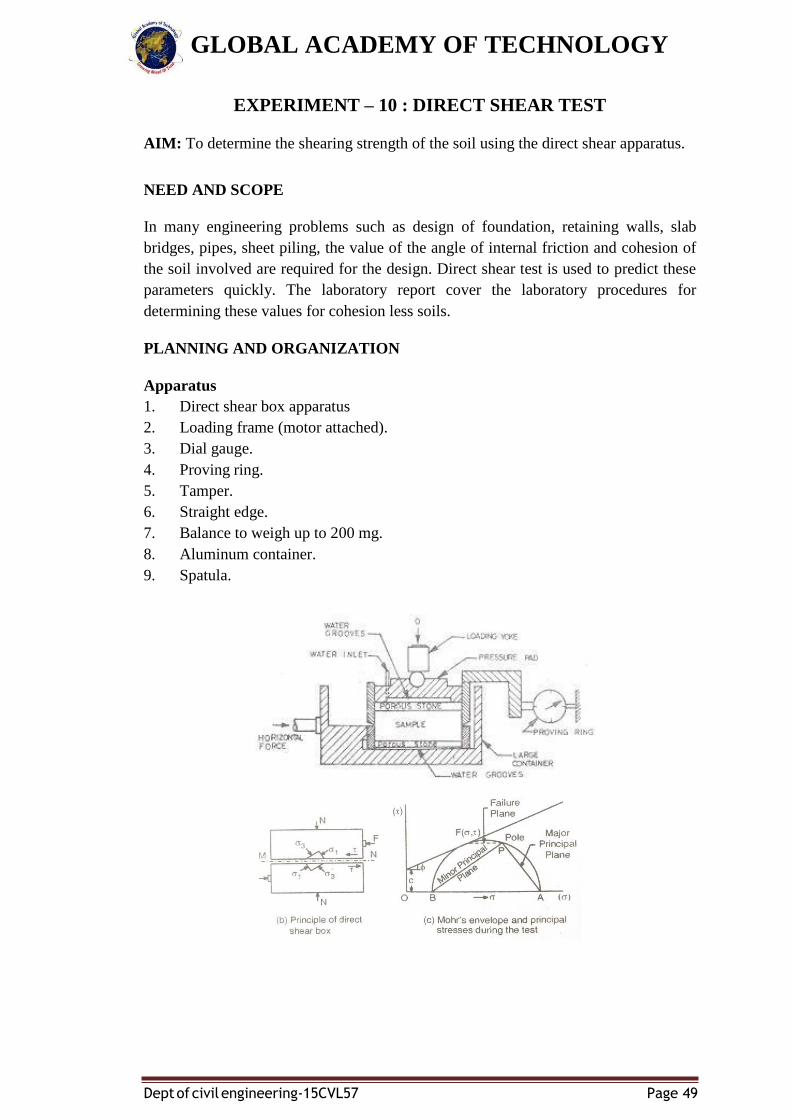
EXPERIMENT – 10 : DIRECT SHEAR TEST
AIM: To determine the shearing strength of the soil using the direct shear apparatus.
NEED AND SCOPE
In many engineering problems such as design of foundation, retaining walls, slab
bridges, pipes, sheet piling, the value of the angle of internal friction and cohesion of
the soil involved are required for the design. Direct shear test is used to predict these
parameters quickly. The laboratory report cover the laboratory procedures for
determining these values for cohesion less soils.
PLANNING AND ORGANIZATION
Apparatus
1. Direct shear box apparatus
2. Loading frame (motor attached).
3. Dial gauge.
4. Proving ring.
5. Tamper.
6. Straight edge.
7. Balance to weigh up to 200 mg.
8. Aluminum container.
9. Spatula.
GLOBAL ACADEMY OF TECHNOLOGY
Dept of civil engineering-15CVL57 Page 50
KNOWLEDGE OF EQUIPMENT:
Strain controlled direct shear machine consists of shear box, soil container, loading
unit, proving ring, dial gauge to measure shear deformation and volume changes. A
two piece square shear box is one type of soil container used. A proving ring is used
to indicate the shear load taken by the soil initiated in the shearing plane.
PROCEDURE
1) Measure the dimensions of the shear box and calculate the area of cross
section (A).
2) Insert the locking keys of the shear box.
3) Weigh a dish containing dry cohesionless soil to be tested. Place the bottom
grip plate. Place the soil in the shear box kept on a plane surface, tamp it
gently and make a level surface. Keep the top grip plate. Weigh the dish again
and get the weight of the soil used.
4) Determine the thickness of soil specimen including the thickness of grip plates
by measuring the total height of the shear box and the height above the top
grip plate. There shall be sufficient thickness of the soil sample above the
potential horizontal failure plane.
5) Place the loading block on top of the grip plate.
6) Apply the desired normal load namely, 0.5, 1.0, 1.5 and 2.0 kg/cm2, one after
the other, in the available machine.
7) Fix the dial gauges to measure the horizontal and vertical movements. Note
the initial readings.
8) Remove the locking keys of the shear box without forgetting.
9) Apply the shear stress to the sample at a specified rate of shear displacement
(usually 1.25mm/min for undrained quick tests). Take the readings on the two
dial gauges and the proving ring at suitable intervals of shear displacement
(say at every 0.2mm horizontal displacement up to about 2mm and at every
0.5mm thereafter) continue the test up to failure.
10) Repeat the above test on three more samples of the same soil, at the same
density but with different normal loads.
11) For each test, draw the shear stress v/s shear displacement graph and find the
peak value ımax. When there is no clear peak observed, the failure stress may
be taken as that corresponding to 15% shear strain.
12) Finally plot a graph between normal stress and peak value of shear stress.
Thus, find the angle of internal friction, Φ.
DATA CALCULATION SHEET FOR DIRECT SHEAR TEST
Normal load (kg) =
Loading rate (mm/min) = 1.25
Normal stress on (kg/cm2) =
Proving ring constant =
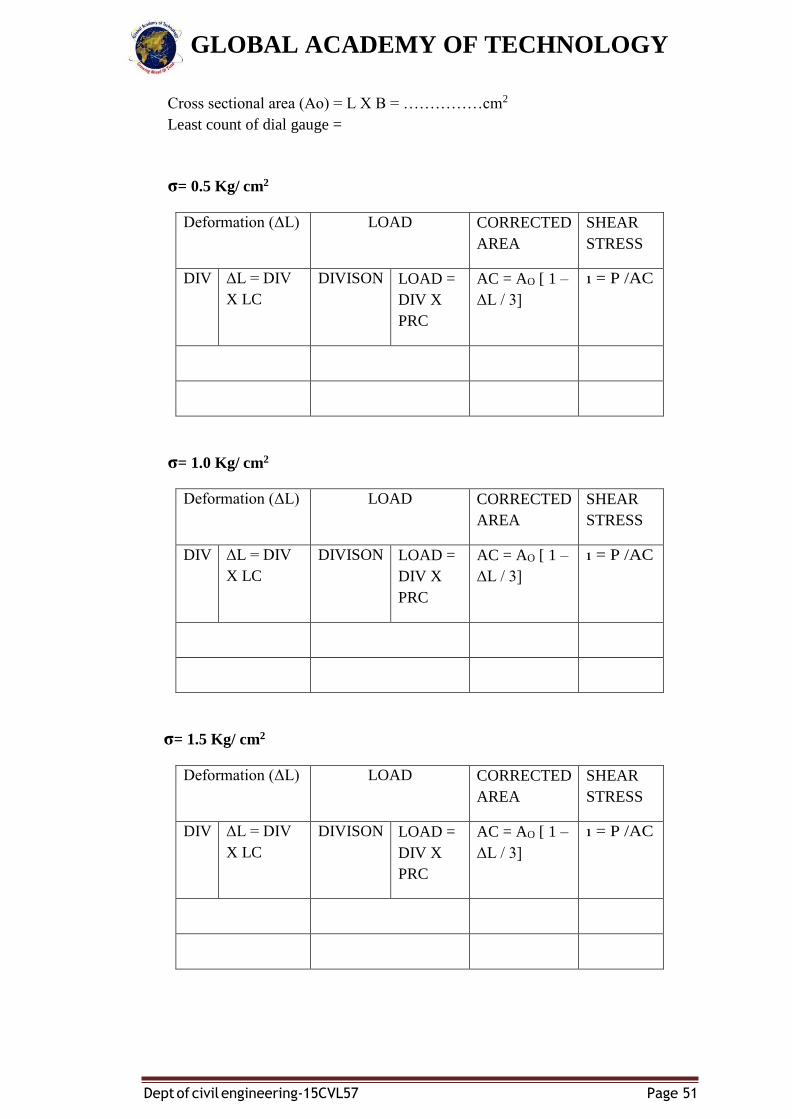
GLOBAL ACADEMY OF TECHNOLOGY
Dept of civil engineering-15CVL57 Page 51
Cross sectional area (Ao) = L X B = ……………cm2
Least count of dial gauge =
σ= 0.5 Kg/ cm2
Deformation (ΔL) LOAD CORRECTED
AREA
SHEAR
STRESS
DIV ΔL = DIV
X LC
DIVISON LOAD =
DIV X
PRC
AC = AO [ 1 –
ΔL / 3]
ı = P /AC
σ= 1.0 Kg/ cm2
Deformation (ΔL) LOAD CORRECTED
AREA
SHEAR
STRESS
DIV ΔL = DIV
X LC
DIVISON LOAD =
DIV X
PRC
AC = AO [ 1 –
ΔL / 3]
ı = P /AC
σ= 1.5 Kg/ cm2
Deformation (ΔL) LOAD CORRECTED
AREA
SHEAR
STRESS
DIV ΔL = DIV
X LC
DIVISON LOAD =
DIV X
PRC
AC = AO [ 1 –
ΔL / 3]
ı = P /AC
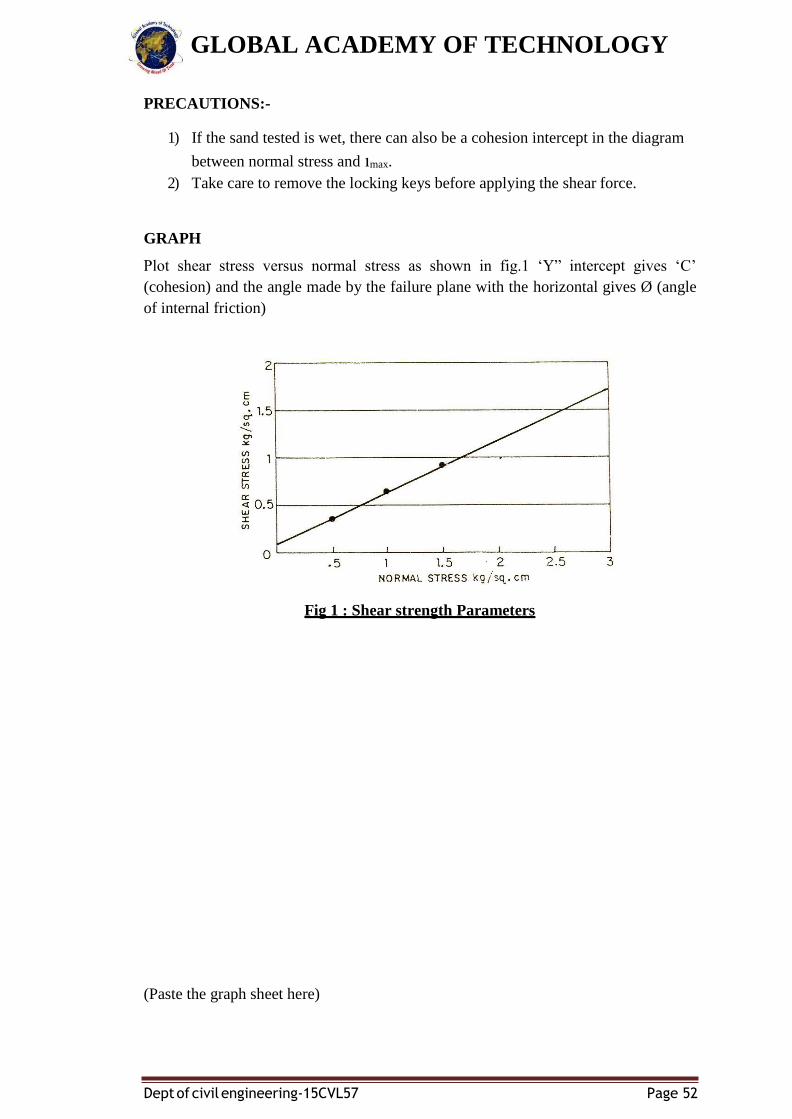
GLOBAL ACADEMY OF TECHNOLOGY
Dept of civil engineering-15CVL57 Page 52
PRECAUTIONS:-
1) If the sand tested is wet, there can also be a cohesion intercept in the diagram
between normal stress and ımax.
2) Take care to remove the locking keys before applying the shear force.
GRAPH
Plot shear stress versus normal stress as shown in fig.1 ‘Y” intercept gives ‘C’
(cohesion) and the angle made by the failure plane with the horizontal gives Ø (angle
of internal friction)
Fig 1 : Shear strength Parameters
(Paste the graph sheet here)
GLOBAL ACADEMY OF TECHNOLOGY
Dept of civil engineering-15CVL57 Page 53
Results:
From the graph
1. Cohesion C = .......................... kg/cm
2. Angle of internal friction Ø = ...................degrees
VIVA QUESTIONS
1) Give examples of practical engineering situations in which these forms of
testing are required.
2) Enumerate the types of laboratory shear tests you would specify to be carried
out in connection with the following field problems:
a. The stability of the clay foundation of an embankment, the rate of
construction being such that some consolidation of the clay occurs.
b. The initial stability of a footing on saturated clay.
The long term stability of a slope in stiff-fissured clay. Give reasons for your
choice of the test.
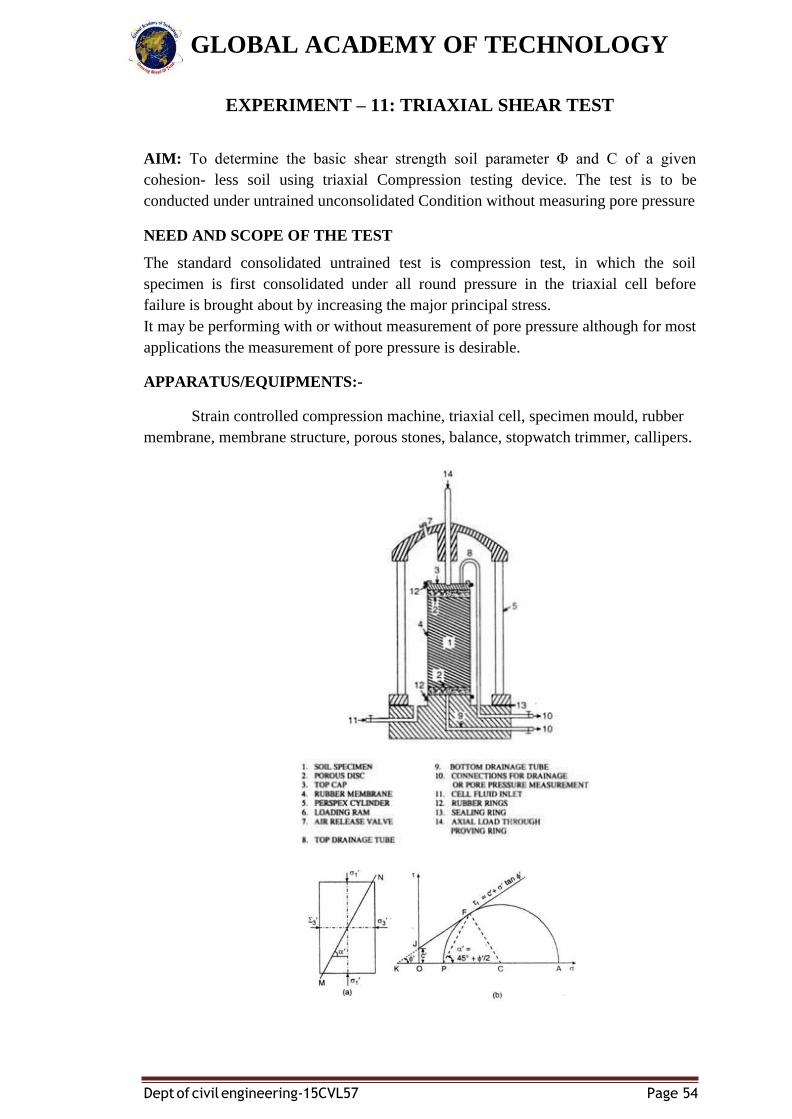
GLOBAL ACADEMY OF TECHNOLOGY
Dept of civil engineering-15CVL57 Page 54
EXPERIMENT – 11: TRIAXIAL SHEAR TEST
AIM: To determine the basic shear strength soil parameter Φ and C of a given
cohesion- less soil using triaxial Compression testing device. The test is to be
conducted under untrained unconsolidated Condition without measuring pore pressure
NEED AND SCOPE OF THE TEST
The standard consolidated untrained test is compression test, in which the soil
specimen is first consolidated under all round pressure in the triaxial cell before
failure is brought about by increasing the major principal stress.
It may be performing with or without measurement of pore pressure although for most
applications the measurement of pore pressure is desirable.
APPARATUS/EQUIPMENTS:-
Strain controlled compression machine, triaxial cell, specimen mould, rubber
membrane, membrane structure, porous stones, balance, stopwatch trimmer, callipers.
GLOBAL ACADEMY OF TECHNOLOGY
Dept of civil engineering-15CVL57 Page 55
Stress Conditions and Failure Envelops
THEORETICAL DISCUSSIONS:
A cylindrical soil specimen is subjected to direct stresses acting in three
mutually perpendicular direction and the other two principle stresses namely,
intermediate and minor, act in horizontal direction. Minor principle stress is constant
throughout the test and major principle circle is drawn for the stresses at failure. By
Mohr’s circle shear strength of soil is determined.
KNOWLEDGE OF EQUIPMENT
A constant rate of strain compression machine of which the following is a brief
description of one is in common use.
a) A loading frame in which the load is applied by yoke acting through an elastic
dynamometer, more commonly called a proving ring which used to measure
the load. The frame is operated at a constant rate by a geared screw jack. It is
preferable for the machine to be motor driven, by a small electric motor.
b) A hydraulic pressure apparatus including an air compressor and water
reservoir in which air under pressure acting on the water raises it to the
required pressure, together with the necessary control valves and pressure
dials.
A triaxial cell to take 3.8 cm dia and 7.6 cm long samples, in which the sample can be
subjected to an all round hydrostatic pressure, together with a vertical compression
load acting through a piston. The vertical load from the piston acts on a pressure cap.
The cell is usually designed with a non-ferrous metal top and base connected by
tension rods and with walls formed of Perspex.
I. SAMPLE PREPARATION
1) Mix the soil with water at desired water (optimum) content. Compact the soil
properly in the split mould which should oil properly. Trim the excess soil and
takeout the specimen mould carefully.
2) Determine the water content of the soil.
3) Place the specimen on the one of end caps and put the other end cap on top of
the specimen.
4) Filter paper and porous stone are kept on top as well as at the bottom of the
specimen.
5) Place the rubber membrane all round the specimen with the help of membrane
structure.
Seal the rubber membrane with caps by means of rubber means
II. COMPRESSION TEST
GLOBAL ACADEMY OF TECHNOLOGY
Dept of civil engineering-15CVL57 Page 56
1) Place the specimen on the pedestal in the triaxial cell.
2) Assume the cell with the loading ram.
3) Admit the operating fluid in the pressure cell and raise its pressure to the
desired value.
4) Adjust the loading machine to bring the loading ram a short distance away
from the seat on the top cap of the specimen.
5) Read the initial reading of load measuring Gauge (PRDG). Bring the loading
ram just in contact with the seat on the top of the specimen.
6) Read the initial reading of dial gauge measuring axial compression.
7) The vertical load divided by cross sectional area gives deviator stress, which is
an addition to the cell pressure that is acting in all direction.
8) Note down the failure load using proving ring dial gauge.
9) Repeat the test on three or four specimen of same water content and same soil
but under different cell pressure.
Observation and Recording
Soil Specimen measurements:-
Initial Diameter, D0 =
Initial Area, Ao =
Initial Volume, V0 =
Initial length, Lo =
Initial Cell pressure o1=
Final Cell pressure o2=
Average cell pressure o3= (o1 + o2) / 2
Corrected Area, Ac= (A0/1- Є)
Where, Є = ∆L/L0
Stress = load/corrected area = P/A
The machine is set in motion (or if hand operated the hand wheel is turned at a
constant rate) to give a rate of strain 2% per minute. The strain dial gauge reading is
then taken and the corresponding proving ring reading is taken the corresponding
proving ring chart. The load applied is known. The experiment is stopped at the strain
dial gauge reading for 15% length of the sample or 15% strain.
Size of specimen:
Length:
Proving ring constant (K) = max load / max no of divisions = ..........Kg / div
Strain dial gauge least count (const):
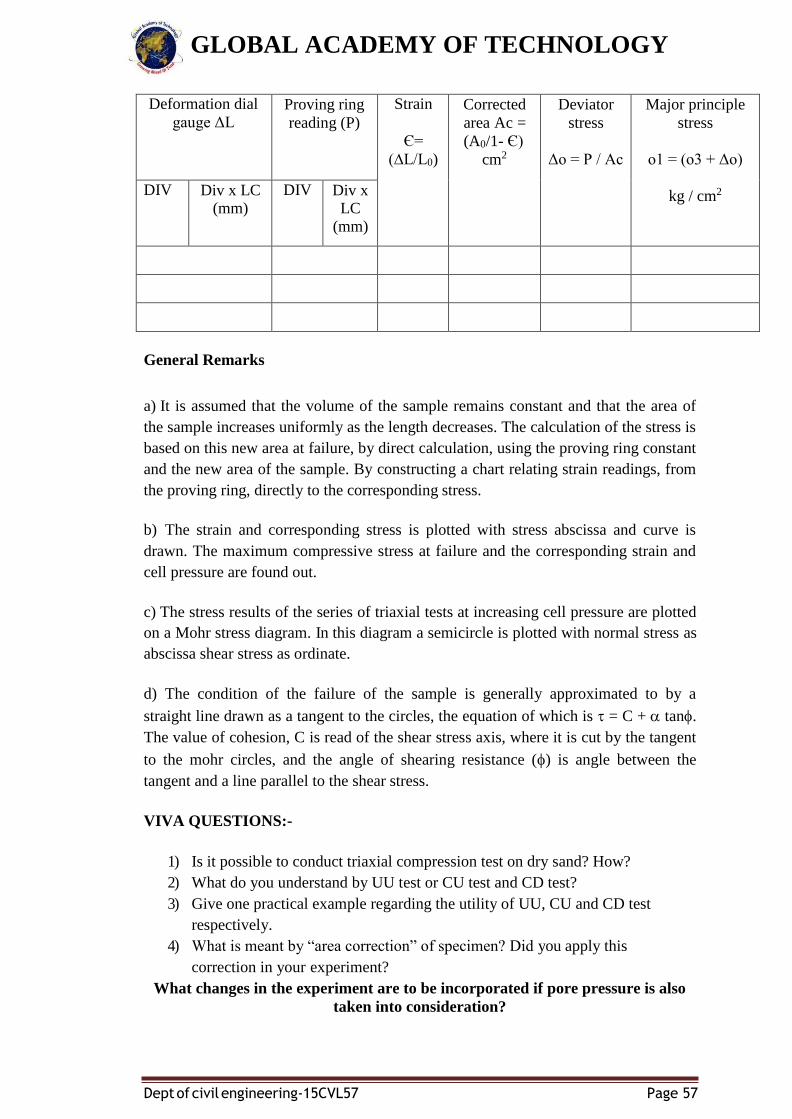
GLOBAL ACADEMY OF TECHNOLOGY
Dept of civil engineering-15CVL57 Page 57
Deformation dial
gauge ΔL Proving ring
reading (P)
Strain
Є=
(∆L/L0)
Corrected
area Ac =
(A0/1- Є)
cm2
Deviator
stress
Δo = P / Ac
Major principle
stress
o1 = (o3 + Δo)
kg / cm2 DIV Div x LC (mm)
DIV Div x LC
(mm)
General Remarks
a) It is assumed that the volume of the sample remains constant and that the area of
the sample increases uniformly as the length decreases. The calculation of the stress is
based on this new area at failure, by direct calculation, using the proving ring constant
and the new area of the sample. By constructing a chart relating strain readings, from
the proving ring, directly to the corresponding stress.
b) The strain and corresponding stress is plotted with stress abscissa and curve is
drawn. The maximum compressive stress at failure and the corresponding strain and
cell pressure are found out.
c) The stress results of the series of triaxial tests at increasing cell pressure are plotted
on a Mohr stress diagram. In this diagram a semicircle is plotted with normal stress as
abscissa shear stress as ordinate.
d) The condition of the failure of the sample is generally approximated to by a
straight line drawn as a tangent to the circles, the equation of which is = C + tan.
The value of cohesion, C is read of the shear stress axis, where it is cut by the tangent
to the mohr circles, and the angle of shearing resistance () is angle between the
tangent and a line parallel to the shear stress.
VIVA QUESTIONS:-
1) Is it possible to conduct triaxial compression test on dry sand? How?
2) What do you understand by UU test or CU test and CD test?
3) Give one practical example regarding the utility of UU, CU and CD test
respectively.
4) What is meant by “area correction” of specimen? Did you apply this
correction in your experiment?
What changes in the experiment are to be incorporated if pore pressure is also
taken into consideration?
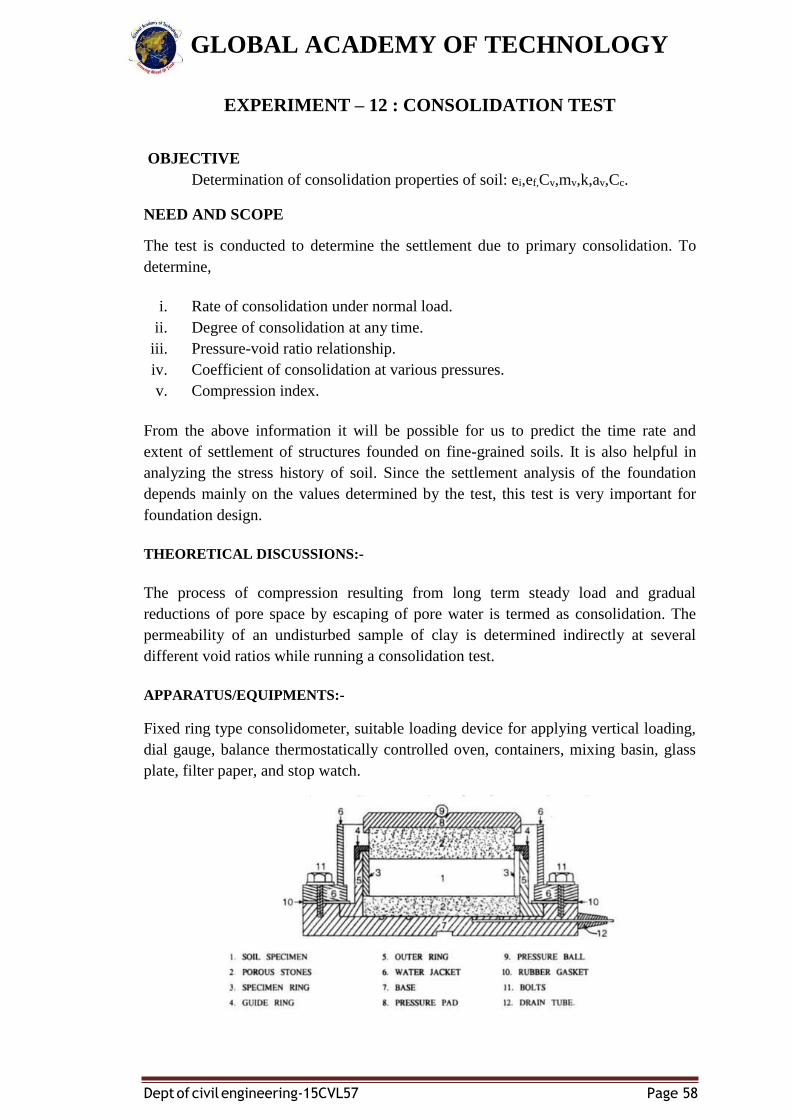
GLOBAL ACADEMY OF TECHNOLOGY
Dept of civil engineering-15CVL57 Page 58
EXPERIMENT – 12 : CONSOLIDATION TEST
OBJECTIVE
Determination of consolidation properties of soil: ei,ef,Cv,mv,k,av,Cc.
NEED AND SCOPE
The test is conducted to determine the settlement due to primary consolidation. To
determine,
i. Rate of consolidation under normal load.
ii. Degree of consolidation at any time.
iii. Pressure-void ratio relationship.
iv. Coefficient of consolidation at various pressures.
v. Compression index.
From the above information it will be possible for us to predict the time rate and
extent of settlement of structures founded on fine-grained soils. It is also helpful in
analyzing the stress history of soil. Since the settlement analysis of the foundation
depends mainly on the values determined by the test, this test is very important for
foundation design.
THEORETICAL DISCUSSIONS:-
The process of compression resulting from long term steady load and gradual
reductions of pore space by escaping of pore water is termed as consolidation. The
permeability of an undisturbed sample of clay is determined indirectly at several
different void ratios while running a consolidation test.
APPARATUS/EQUIPMENTS:-
Fixed ring type consolidometer, suitable loading device for applying vertical loading,
dial gauge, balance thermostatically controlled oven, containers, mixing basin, glass
plate, filter paper, and stop watch.
GLOBAL ACADEMY OF TECHNOLOGY
Dept of civil engineering-15CVL57 Page 59
Consolidation Apparatus
PROCEDURE:-
I. Preparation of soil specimen.
1) Preparation of specimen from undisturbed soil samples. The undisturbed
sample from the field may be circular (at least 1cm diameter) or a block
sample. Clean the specimen ring and weigh it empty. Cut off about 3cm to
5cm of soil specimen from one end of the sample by pressing with hands and
carefully removing the material around the ring. The soil specimen so obtained
should project about 1cm from either side of the ring. Trim the sample smooth
and flush at top and bottom of the ring by using glass plates. Clean the ring
from outside and weigh. Keep three specimens from the soil trimmings for
water content determination.
2) Preparation of specimen from representative soil sample. If the consolidation
properties are to be determined from a disturbed soil sample, soil is compacted
at the desired water content and density, in a separate large mould and then the
specimen is cut as explained in the step (1) above.
3) For the purpose of illustration, Remoulded clay specimen is used.
II. Preparation of mould assembly and sample.
1) Saturate the porous stones either by boiling in distilled water for about 15
minutes or by keeping them submerged in distilled water for 4 to 8 hours.
Wipe away excess water. Moisture all surfaces of the consolidometer which
are to be enclosed.
2) Measure the dimensions of the consolidation ring and weigh the ring
accurately.
3) Fill the ring with undisturbed soil sample or remoulded sample prepared
nearly at liquid limit. Trim the soil sample.
4) Note down the weight of the ring + wet sample.
5) Assemble the consolidometer with the soil specimen (in the ring) and porous
stones at top and bottom of the specimen providing a filter paper between soil
specimen and porous stone.
6) Mount the mould assembly on the loading frame and centre it such that the
applied load is axial.
7) Position the dial gauge to measure vertical compression of the specimen. The
dial gauge holder should be so set the dial is the beginning of its release run,
allowing sufficient margin for the swelling of soil, if any.
8) Apply an initial seating load of 0.05 kg/cm2 to the soil sample.
9) Connect the mould assembly to the water reservoir and allow the sample to
be saturated. The level of water in reservoir is at about the same level as the
specimen.
10) Allow the sample for saturation for 24 hrs.(not necessary for remoulded soil
sample prepared at liquid limit)
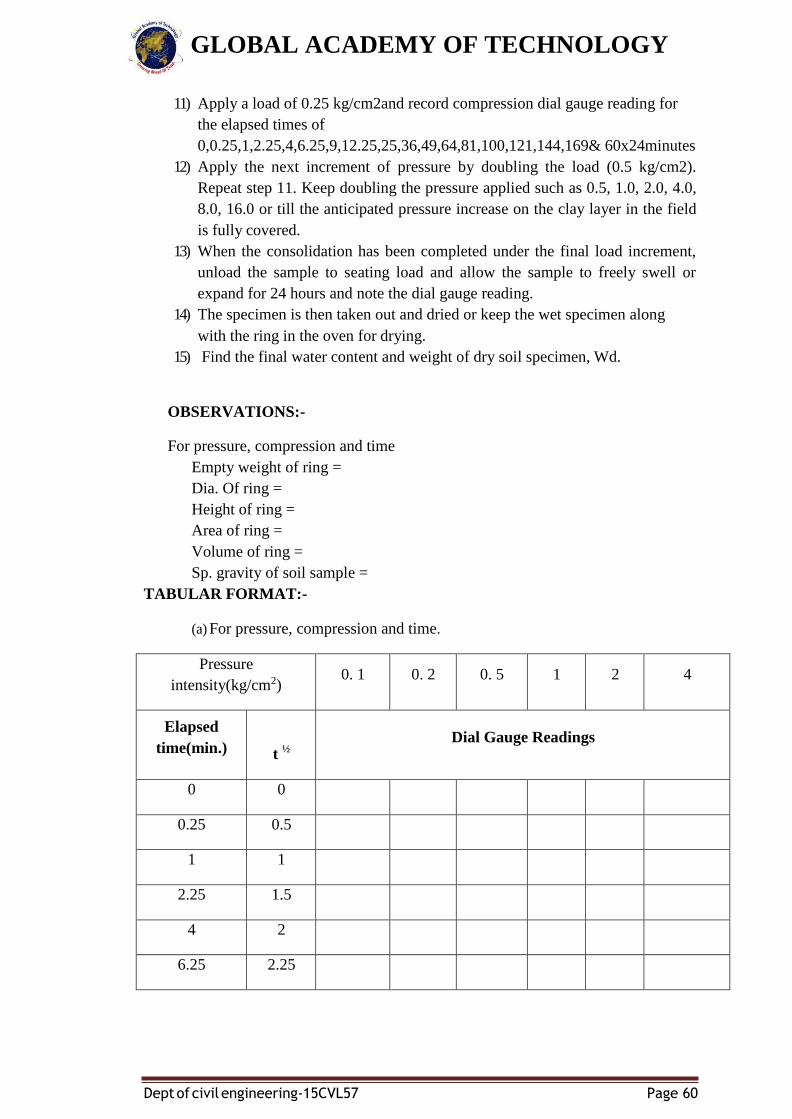
GLOBAL ACADEMY OF TECHNOLOGY
Dept of civil engineering-15CVL57 Page 60
11) Apply a load of 0.25 kg/cm2and record compression dial gauge reading for
the elapsed times of
0,0.25,1,2.25,4,6.25,9,12.25,25,36,49,64,81,100,121,144,169& 60x24minutes
12) Apply the next increment of pressure by doubling the load (0.5 kg/cm2).
Repeat step 11. Keep doubling the pressure applied such as 0.5, 1.0, 2.0, 4.0,
8.0, 16.0 or till the anticipated pressure increase on the clay layer in the field
is fully covered.
13) When the consolidation has been completed under the final load increment,
unload the sample to seating load and allow the sample to freely swell or
expand for 24 hours and note the dial gauge reading.
14) The specimen is then taken out and dried or keep the wet specimen along
with the ring in the oven for drying.
15) Find the final water content and weight of dry soil specimen, Wd.
OBSERVATIONS:-
For pressure, compression and time
Empty weight of ring =
Dia. Of ring =
Height of ring =
Area of ring =
Volume of ring =
Sp. gravity of soil sample =
TABULAR FORMAT:-
(a) For pressure, compression and time.
Pressure
intensity(kg/cm2) 0. 1 0. 2 0. 5 1 2 4
Elapsed
time(min.)
t ½
Dial Gauge Readings
0 0
0.25 0.5
1 1
2.25 1.5
4 2
6.25 2.25
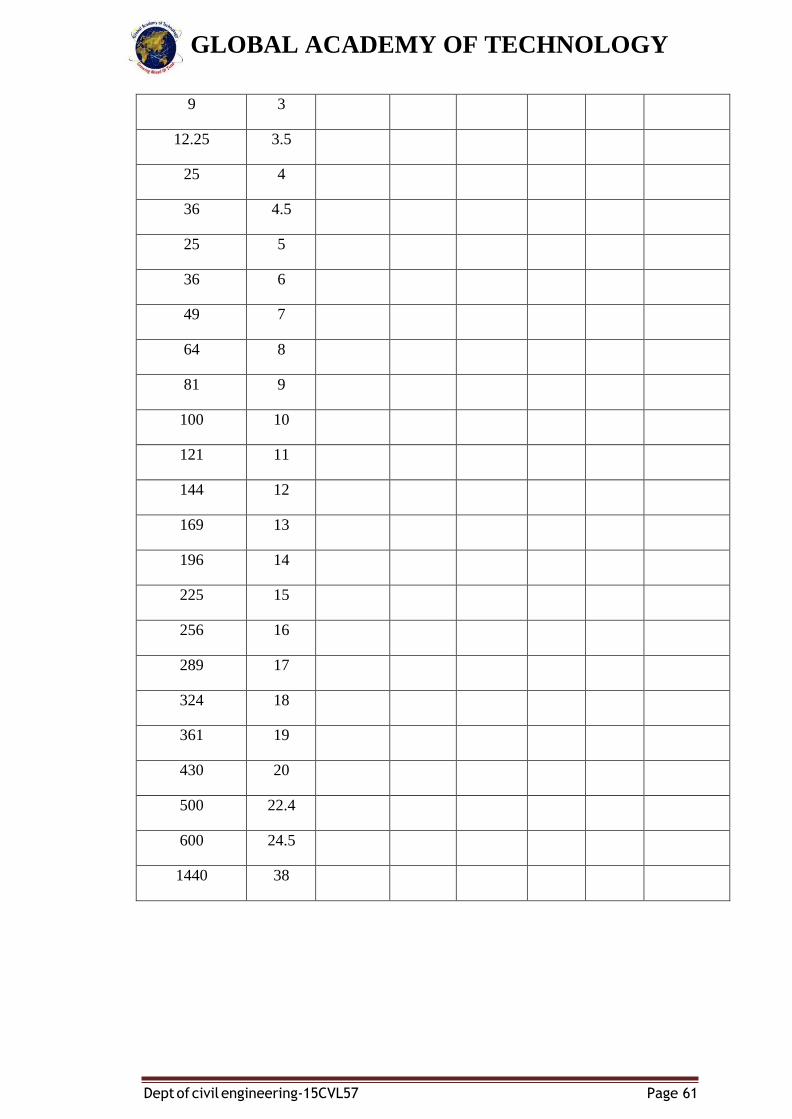
GLOBAL ACADEMY OF TECHNOLOGY
Dept of civil engineering-15CVL57 Page 61
9 3
12.25 3.5
25 4
36 4.5
25 5
36 6
49 7
64 8
81 9
100 10
121 11
144 12
169 13
196 14
225 15
256 16
289 17
324 18
361 19
430 20
500 22.4
600 24.5
1440 38
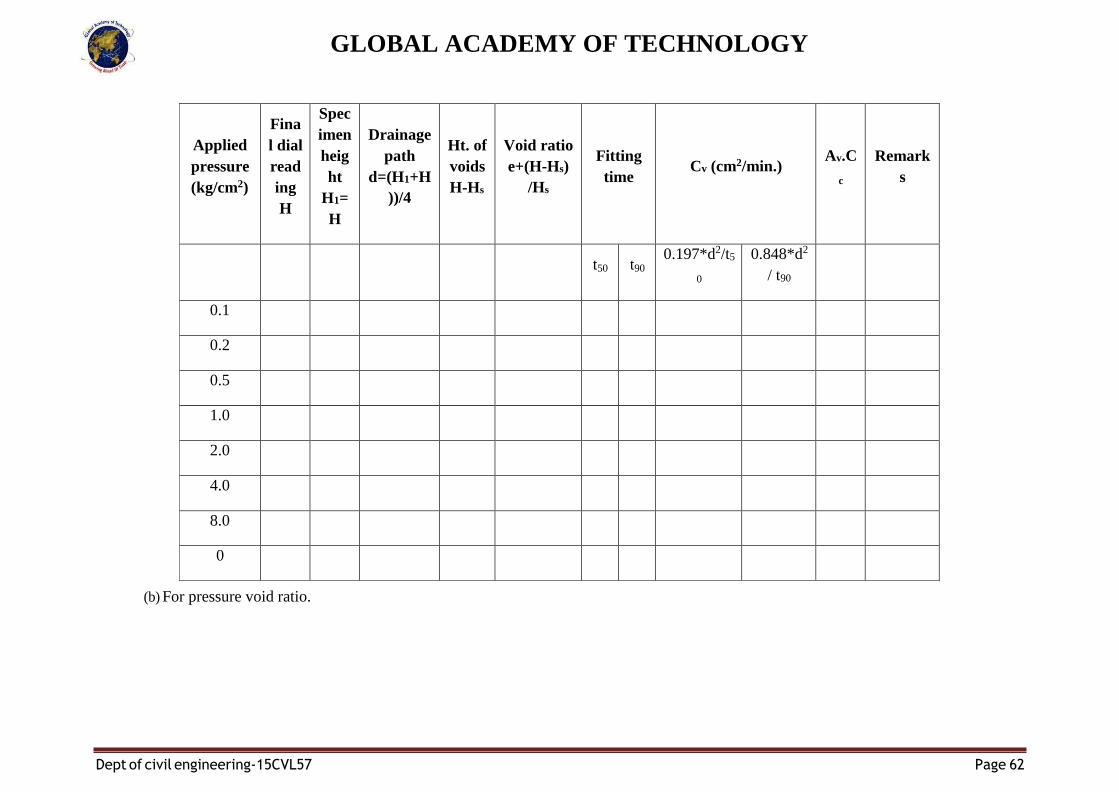
(b) For pressure void ratio.
GLOBAL ACADEMY OF TECHNOLOGY
Dept of civil engineering-15CVL57 Page 62
Applied
pressure
(kg/cm2)
Fina
l dial
read
ing
H
Spec
imen
heig
ht
H1=
H
Drainage
path
d=(H1+H
))/4
Ht. of
voids
H-Hs
Void ratio
e+(H-Hs)
/Hs
Fitting
time
Cv (cm2/min.)
Av.C
c
Remark
s
t50 t90
0.197*d2/t5
0
0.848*d2
/ t90
0.1
0.2
0.5
1.0
2.0
4.0
8.0
0
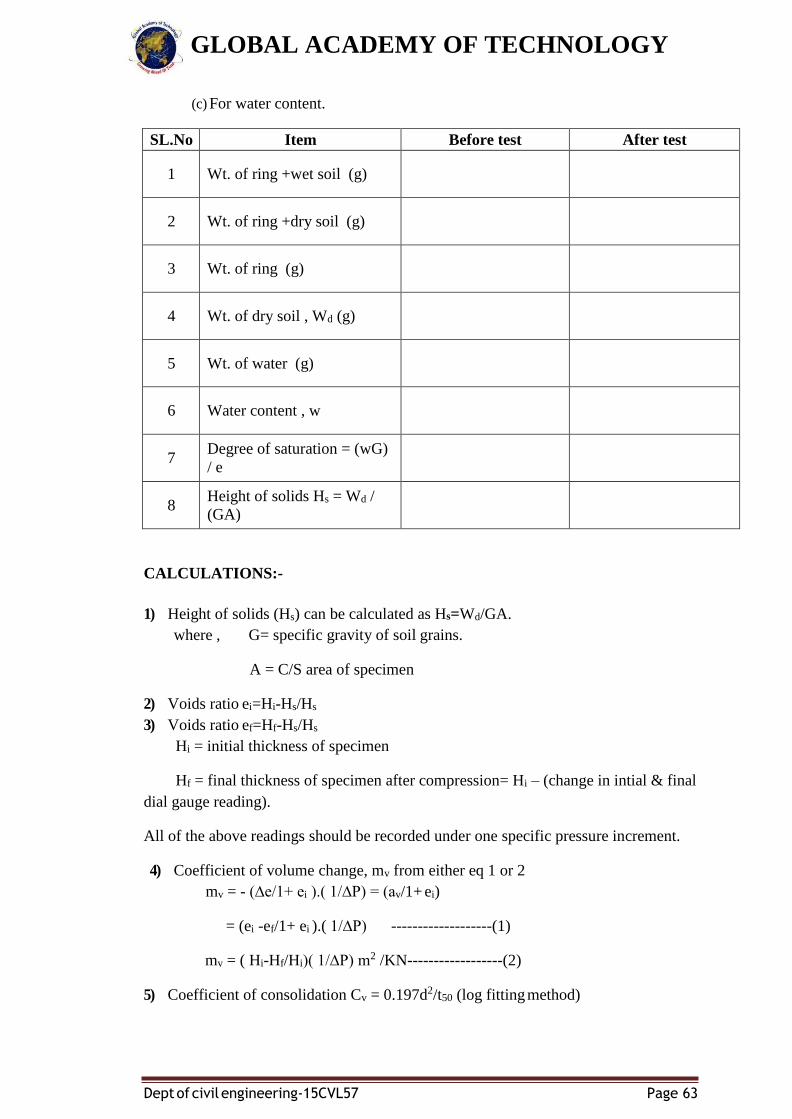
GLOBAL ACADEMY OF TECHNOLOGY
Dept of civil engineering-15CVL57 Page 63
(c) For water content.
SL.No Item Before test After test
1 Wt. of ring +wet soil (g)
2 Wt. of ring +dry soil (g)
3 Wt. of ring (g)
4 Wt. of dry soil , Wd (g)
5 Wt. of water (g)
6 Water content , w
7 Degree of saturation = (wG)
/ e
8 Height of solids Hs = Wd /
(GA)
CALCULATIONS:-
1) Height of solids (Hs) can be calculated as Hs=Wd/GA.
where , G= specific gravity of soil grains.
A = C/S area of specimen
2) Voids ratio ei=Hi-Hs/Hs
3) Voids ratio ef=Hf-Hs/Hs
Hi = initial thickness of specimen
Hf = final thickness of specimen after compression= Hi – (change in intial & final
dial gauge reading).
All of the above readings should be recorded under one specific pressure increment.
4) Coefficient of volume change, mv from either eq 1 or 2
mv = - (∆e/1+ ei ).( 1/∆P) = (av/1+ ei)
= (ei -ef/1+ ei ).( 1/∆P) -------------------(1)
mv = ( Hi-Hf/Hi)( 1/∆P) m2 /KN------------------(2)
5) Coefficient of consolidation Cv = 0.197d2/t50 (log fitting method)
GLOBAL ACADEMY OF TECHNOLOGY
Dept of civil engineering-15CVL57 Page 64
Cv = 0.848d2/t90 (square root fitting method)
In the log fitting method, a plot is made between dial reading and logarithm of time
and the time corresponding to 50% consolidation is determined. In the square root
fitting method, a plot is made between dial reading and the square root of time and the
time corresponding to 90% consolidation is determined.
6) Compression index: A plot of void ratio ‘e’versus log 1 is made. The initial
compression curve would be found to be a straight line and the slope of this line
would give you the compression index G.
7) Coefficient of compressibility (av) = 0.435Cc /
o1 where o1 = average pressure for the
increment.
Coefficient of permeability (k) = Cv. mv .γw m /sec
Where, γw = unit wt of water
Cv = coefficient of consolidation (m2 /sec)
RESULTS:-
1) Coefficient of consolidation Cv (log fitting method) =
2) Coefficient of consolidation Cv (square root fitting method) =
3) Coefficient of compressibility, av =
4) Coefficient of permeability, K =
5) Height of voids =H-Hs =
VIVA QUESTIONS:-
1) Distinguish between compaction and consolidation?
2) What do you understand by coefficient of consolidation?
3) What do you mean by corrected zero point and its significance?
4) Why the consolidation test is required?
5) Define Coefficient of compressibility.
GLOBAL ACADEMY OF TECHNOLOGY
Dept of civil engineering-15CVL57 Page 65
EXPERIMENT – 13: MODIFIED PROCTOR TEST
OBJECTIVE
To determine moisture content and dry density relationship using heavy compaction
or modified compaction method as per IS-2720-Part-8.
APPARATUS
• Metal mould (volume = 1000 cm3)
• Balance (capacity = 10 kg, least count = 1g)
• Oven (105 to 1100C)
• Sieve (19 mm)
• Metal rammer (weight = 4.9 kg)
PROCEDURE
1. Dry the soil sample by exposing it to air or sun light.
2. Sieve the air dried soil through 19 mm sieve.
3. Add suitable amount of water with the soil and mix it thoroughly. For sandy and gravelly soil
add 3% to 5% of water. For cohesive soil the amount of water to be added should be12% to
16% below the plastic limit.
4. Weigh the mould with base plate attached to the nearest 1g. Record this weight as ‘W1’.
5. Attach the extension collar with the mould.
6. Compact the moist soil into the mould in five layers of approximately equal mass, each layer
being given 25 blows, with the help of 4.9 kg rammer, dropped from a height of 450 mm above
the soil. The blows must be distributed uniformly over the surface of each layer.
7. After completion of the compaction operation, remove the extension collar and level carefully the
top of the mould by means of straightedge.
8. Weigh the mould with the compacted soil to the nearest 1 g. Record this weight as ‘W2’.
9. After weighing remove the compacted soil from the mould and place it on the mixing tray.
Determine the water content of a representative sample of the specimen. Record the moisture
content as ‘M’.
10. Broken up the remainder of the specimen and repeat step 5 to step 9 by adding suitable increment
of water to the soil. For sandy and gravelly soils the increment in general is 1% to 2%.
For cohesive soils the increment in general is 2% to 4%.
11. The total no. of determinations made shall be at least five, and the moisture contents should be
such that the optimum moisture content, at which the maximum dry density occurs, is within that
range.
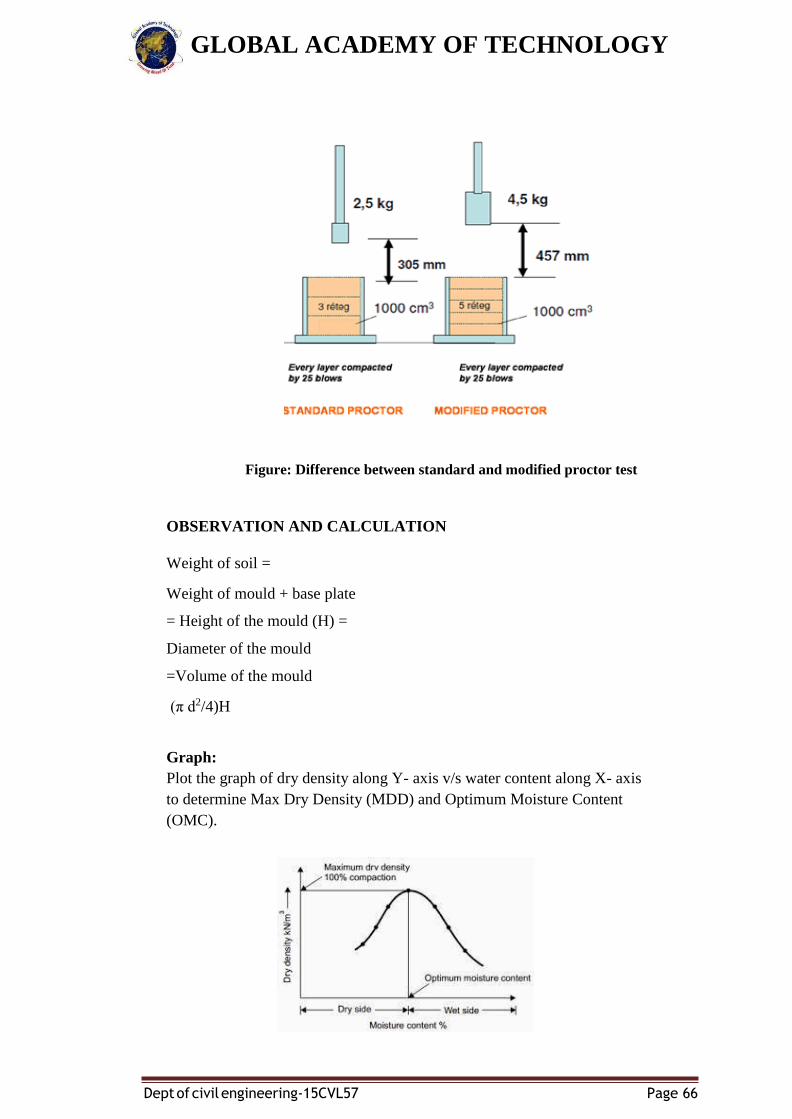
GLOBAL ACADEMY OF TECHNOLOGY
Dept of civil engineering-15CVL57 Page 66
Figure: Difference between standard and modified proctor test
OBSERVATION AND CALCULATION
Weight of soil =
Weight of mould + base plate
= Height of the mould (H) =
Diameter of the mould
=Volume of the mould
(π d2/4)H
Graph:
Plot the graph of dry density along Y- axis v/s water content along X- axis
to determine Max Dry Density (MDD) and Optimum Moisture Content
(OMC).
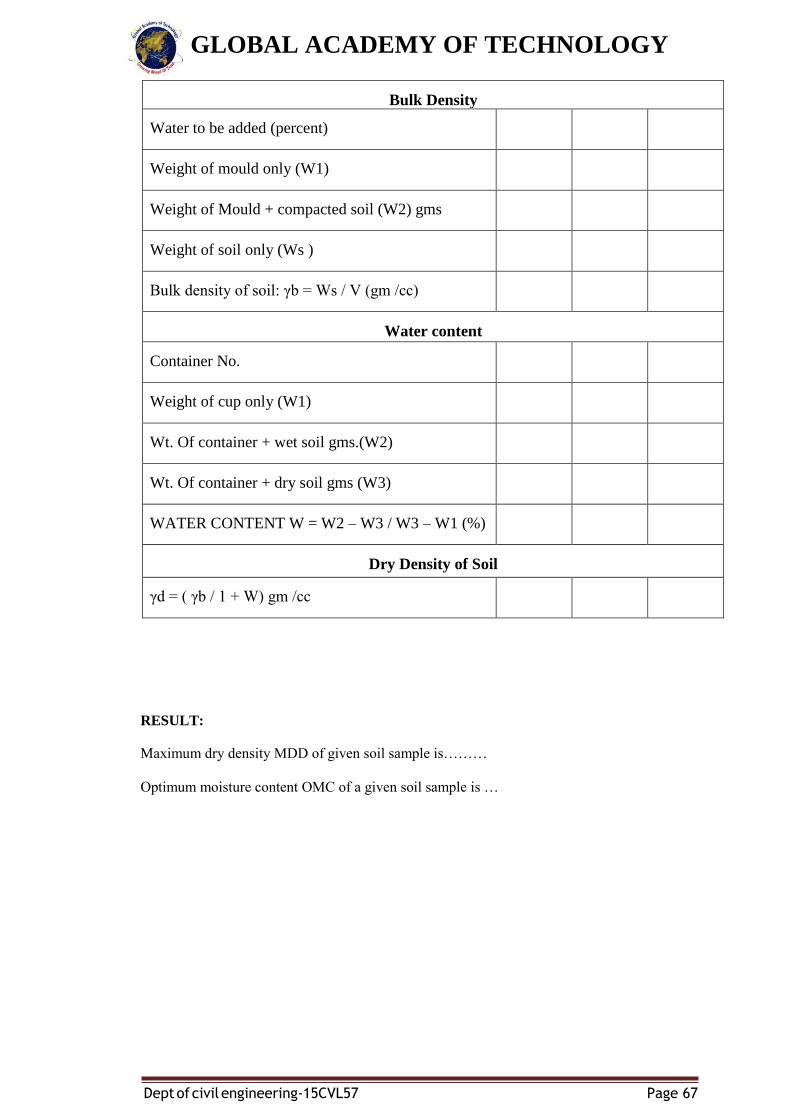
GLOBAL ACADEMY OF TECHNOLOGY
Dept of civil engineering-15CVL57 Page 67
Bulk Density
Water to be added (percent)
Weight of mould only (W1)
Weight of Mould + compacted soil (W2) gms
Weight of soil only (Ws )
Bulk density of soil: γb = Ws / V (gm /cc)
Water content
Container No.
Weight of cup only (W1)
Wt. Of container + wet soil gms.(W2)
Wt. Of container + dry soil gms (W3)
WATER CONTENT W = W2 – W3 / W3 – W1 (%)
Dry Density of Soil
γd = ( γb / 1 + W) gm /cc
RESULT:
Maximum dry density MDD of given soil sample is………
Optimum moisture content OMC of a given soil sample is …
GLOBAL ACADEMY OF TECHNOLOGY
Dept of civil engineering-15CVL57 Page 68
EXPERIMENT 14-HYDROMETER ANALYSIS
AIM: Grain size analysis of soils by hydrometer analysis test.
OBJECTIVE
1. To determine the grain size distribution of soil sample containing appreciable
amount of fines.
2. To draw a grain size distribution curve.
NEED AND SCOPE OF THE EXPERIMENT
For determining the grain size distribution of soil sample, usually mechanical analysis
(sieve analysis) is carried out in which the finer sieve used is 63 micron or the nearer
opening. If a soil contains appreciable quantities of fine fractions in (less than 63
micron) wet analysis is done. One form of the analysis is hydrometer analysis. It is
very much helpful to classify the soil as per ISI classification. The properties of the
soil are very much influenced by the amount of clay and other fractions.
APPARATUS
1. Hydrometer
2. Glass measuring cylinder-Two of 1000 ml capacity with ground glass or rubber
stoppers about 7 cm diameter and 33 cm high marked at 1000 ml volume.
3. Thermometer- To cover the range 0 to 50o C with an accuracy of 0.5 o C .
4. Water bath.
5. Stirring apparatus.
6. I.S sieves apparatus.
7. Balance-accurate to 0.01 gm.
8. Oven-105 to 110.
9. Stop watch.
10. Desiccators
11. Centimetre scale.
12. Porcelain evaporating dish.
13. Wide mouth conical flask or conical beaker of 1000 ml capacity.
14. Thick funnel-about 10 cm in diameter.
15. Filter flask-to take the funnel.
16. Measuring cylinder-100 ml capacity.
17. Wash bottle-containing distilled water.
18. Filter papers.
19. Glass rod-about 15 to 20 cm long and 4 to 5 mm in diameter.
20. Hydrogen peroxide-20 volume solution.
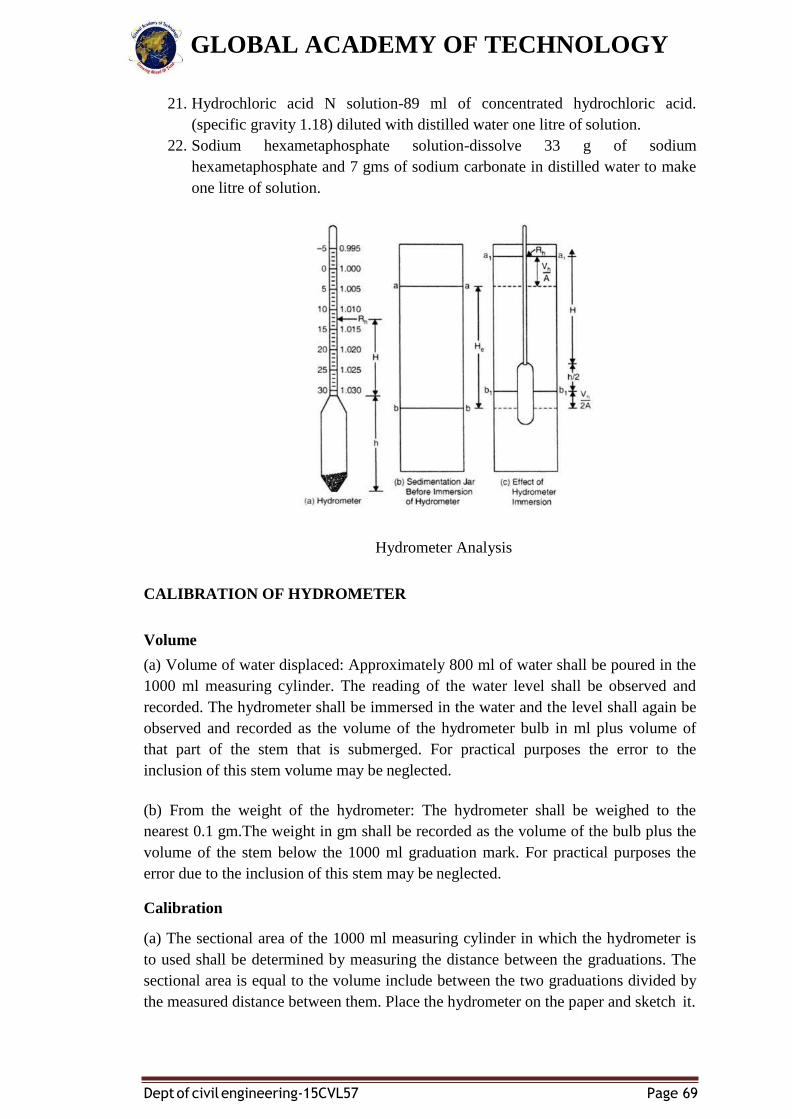
GLOBAL ACADEMY OF TECHNOLOGY
Dept of civil engineering-15CVL57 Page 69
21. Hydrochloric acid N solution-89 ml of concentrated hydrochloric acid.
(specific gravity 1.18) diluted with distilled water one litre of solution.
22. Sodium hexametaphosphate solution-dissolve 33 g of sodium
hexametaphosphate and 7 gms of sodium carbonate in distilled water to make
one litre of solution.
Hydrometer Analysis
CALIBRATION OF HYDROMETER
Volume
(a) Volume of water displaced: Approximately 800 ml of water shall be poured in the
1000 ml measuring cylinder. The reading of the water level shall be observed and
recorded. The hydrometer shall be immersed in the water and the level shall again be
observed and recorded as the volume of the hydrometer bulb in ml plus volume of
that part of the stem that is submerged. For practical purposes the error to the
inclusion of this stem volume may be neglected.
(b) From the weight of the hydrometer: The hydrometer shall be weighed to the
nearest 0.1 gm.The weight in gm shall be recorded as the volume of the bulb plus the
volume of the stem below the 1000 ml graduation mark. For practical purposes the
error due to the inclusion of this stem may be neglected.
Calibration
(a) The sectional area of the 1000 ml measuring cylinder in which the hydrometer is
to used shall be determined by measuring the distance between the graduations. The
sectional area is equal to the volume include between the two graduations divided by
the measured distance between them. Place the hydrometer on the paper and sketch it.
GLOBAL ACADEMY OF TECHNOLOGY
Dept of civil engineering-15CVL57 Page 70
On the sketch note the lowest and highest readings which are on the hydrometer and
also mark the neck of the bulb. Mark the centre of the bulb which is half of the
distance between neck of the bulb and tip of the bulb.
b) The distance from the lowest reading to the center of the bulb is (Rh) shall be
recorded (Rh =HL + L/2).
(c) The distance from the highest hydrometer reading to the center of the bulb shall be
measured and recorded.
(d) Draw graph hydrometer readings vs HH and RH. A straight line is obtained. This
calibration curve is used to calibrate the hydrometer readings which are taken within 2
minutes.
(e) From 4 minutes onwards the readings are to be taken by immersing the
hydrometer each time. This makes the soil solution to rise, there by rising distance of
free fall of the particle. So correction is applied to the hydrometer readings.
(f) Correction applied to the Rh and HH
Vh= Volume of hydrometer bulb in ml.
A =Area of measuring cylinder in cm2.
From these two corrected readings draw graph (straight line)
Grain Size Distribution in Soil-Data and Calculation Chart
Date:
Sample No:
Total weight of dry soil taken, W =
Specific Gravity of soil, G =
Hydrometer No.
Meniscus correction, Cn =
Dispersion agent correction =
Reading in water RW =
Temperature correction =
Wt. Of soil gone into solution, Ws =
% finer for wt. Of soil Ws gone into solution N = [(100G)/{Ws x (G 1)}] x R
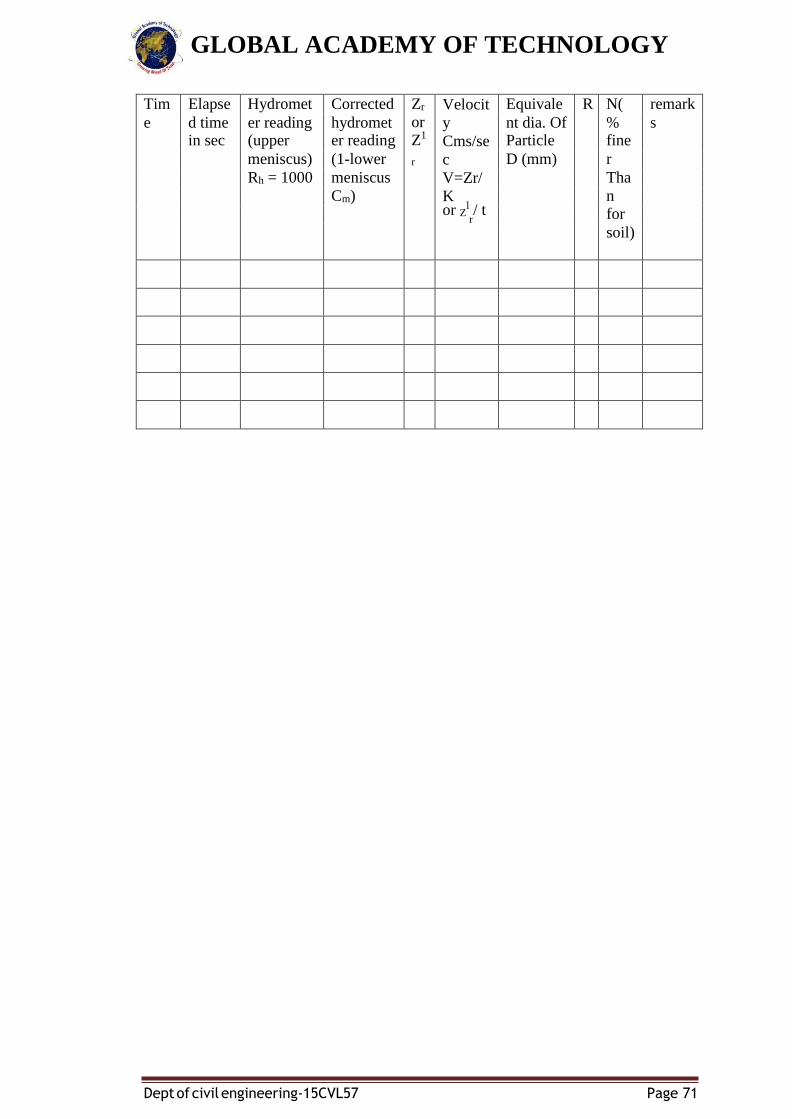
GLOBAL ACADEMY OF TECHNOLOGY
Dept of civil engineering-15CVL57 Page 71
Tim Elapse Hydromet Corrected Zr Velocit
y
Cms/se
c
V=Zr/
K or Z
l / t r
Equivale R N( remark
e d time in sec
er reading (upper
hydromet er reading
or Z1
nt dia. Of Particle
% fine
s
meniscus) (1-lower r D (mm) r
Rh = 1000 meniscus Tha
Cm) n
for
soil)
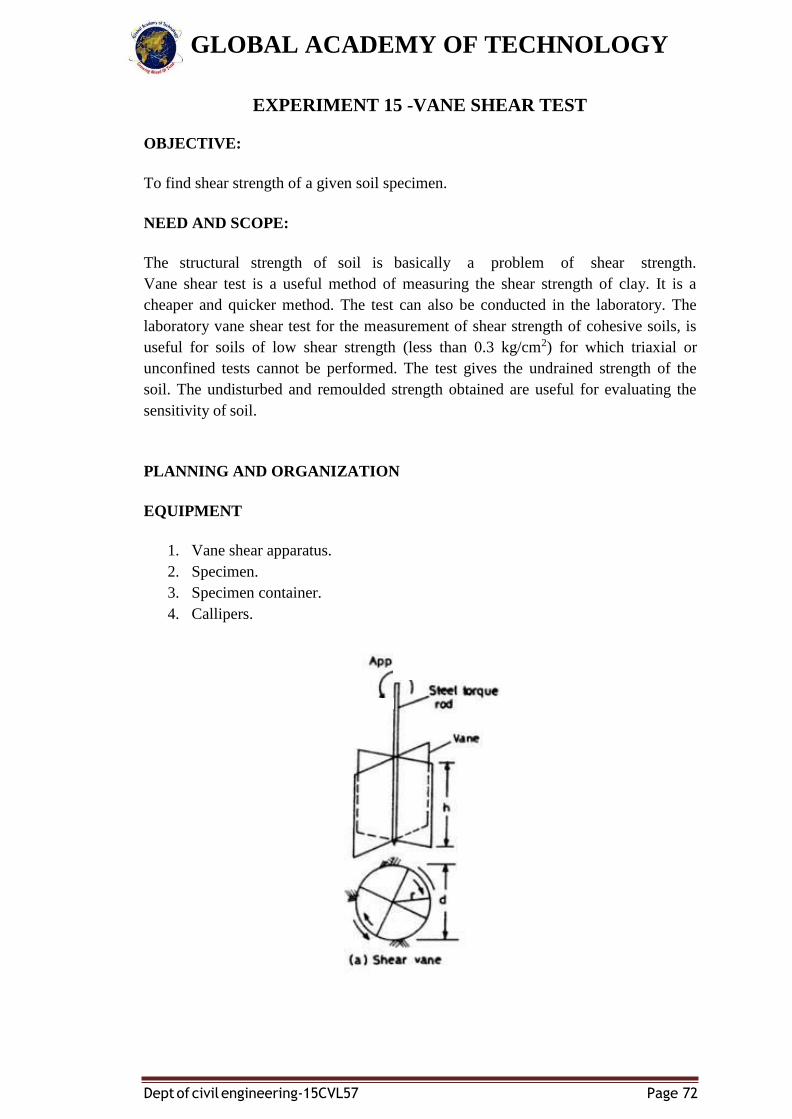
GLOBAL ACADEMY OF TECHNOLOGY
Dept of civil engineering-15CVL57 Page 72
EXPERIMENT 15 -VANE SHEAR TEST
OBJECTIVE:
To find shear strength of a given soil specimen.
NEED AND SCOPE:
The structural strength of soil is basically a problem of shear strength.
Vane shear test is a useful method of measuring the shear strength of clay. It is a
cheaper and quicker method. The test can also be conducted in the laboratory. The
laboratory vane shear test for the measurement of shear strength of cohesive soils, is
useful for soils of low shear strength (less than 0.3 kg/cm2) for which triaxial or
unconfined tests cannot be performed. The test gives the undrained strength of the
soil. The undisturbed and remoulded strength obtained are useful for evaluating the
sensitivity of soil.
PLANNING AND ORGANIZATION
EQUIPMENT
1. Vane shear apparatus.
2. Specimen.
3. Specimen container.
4. Callipers.
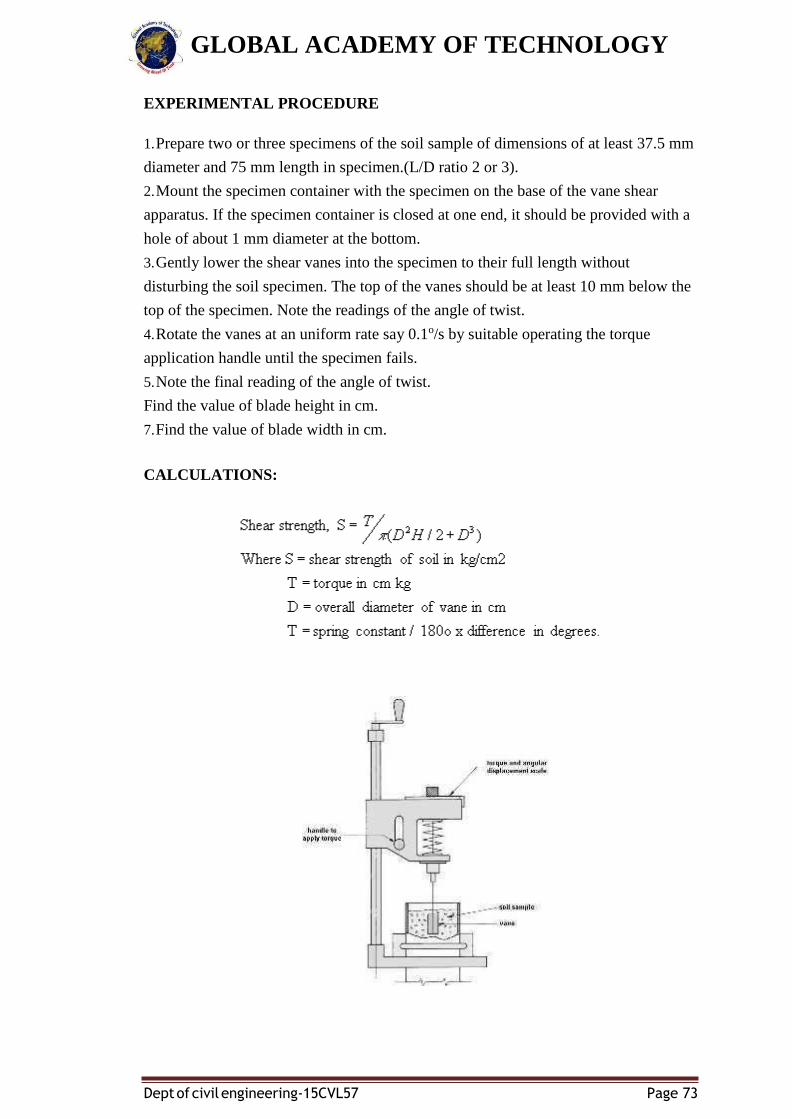
GLOBAL ACADEMY OF TECHNOLOGY
Dept of civil engineering-15CVL57 Page 73
EXPERIMENTAL PROCEDURE
1. Prepare two or three specimens of the soil sample of dimensions of at least 37.5 mm
diameter and 75 mm length in specimen.(L/D ratio 2 or 3).
2. Mount the specimen container with the specimen on the base of the vane shear
apparatus. If the specimen container is closed at one end, it should be provided with a
hole of about 1 mm diameter at the bottom.
3. Gently lower the shear vanes into the specimen to their full length without
disturbing the soil specimen. The top of the vanes should be at least 10 mm below the
top of the specimen. Note the readings of the angle of twist.
4. Rotate the vanes at an uniform rate say 0.1o/s by suitable operating the torque
application handle until the specimen fails.
5. Note the final reading of the angle of twist.
Find the value of blade height in cm.
7. Find the value of blade width in cm.
CALCULATIONS:
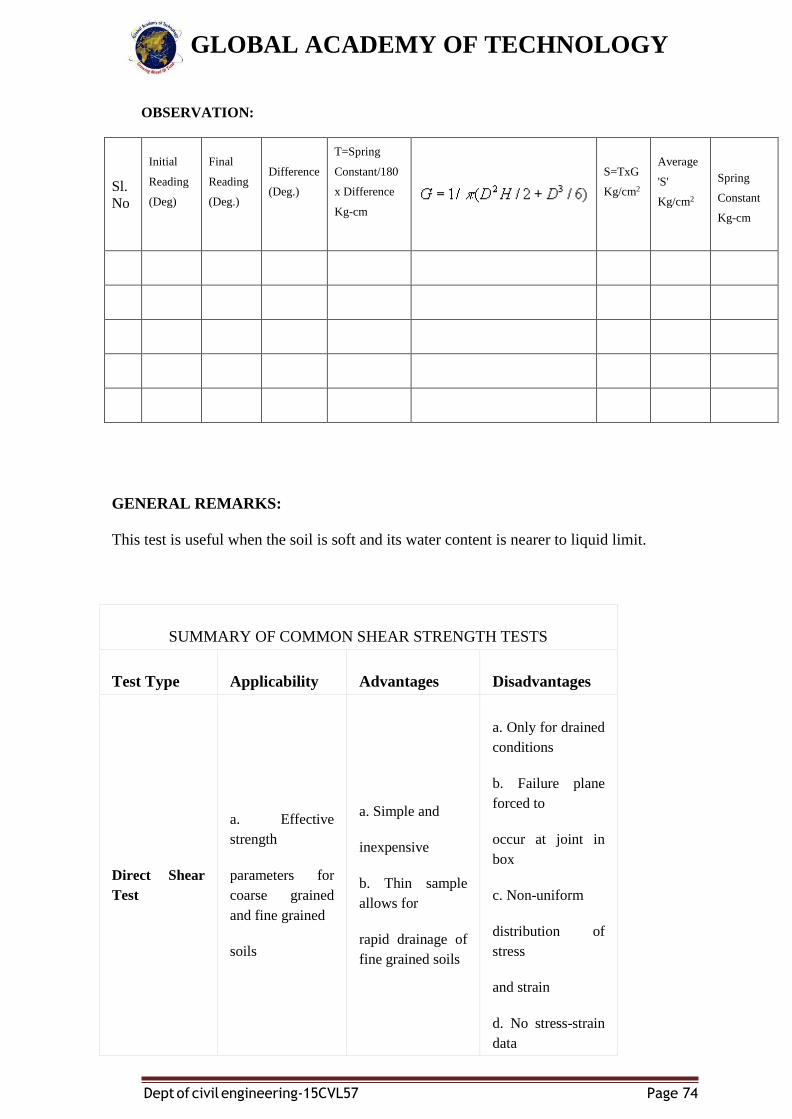
GLOBAL ACADEMY OF TECHNOLOGY
Dept of civil engineering-15CVL57 Page 74
OBSERVATION:
Sl.
No
Initial
Reading
(Deg)
Final
Reading
(Deg.)
Difference
(Deg.)
T=Spring
Constant/180
x Difference
Kg-cm
S=TxG
Kg/cm2
Average
'S'
Kg/cm2
Spring
Constant
Kg-cm
GENERAL REMARKS:
This test is useful when the soil is soft and its water content is nearer to liquid limit.
SUMMARY OF COMMON SHEAR STRENGTH TESTS
Test Type Applicability Advantages Disadvantages
Direct Shear
Test
a. Effective
strength
parameters for
coarse grained
and fine grained
soils
a. Simple and
inexpensive
b. Thin sample
allows for
rapid drainage of
fine grained soils
a. Only for drained
conditions
b. Failure plane
forced to
occur at joint in
box
c. Non-uniform
distribution of
stress
and strain
d. No stress-strain
data
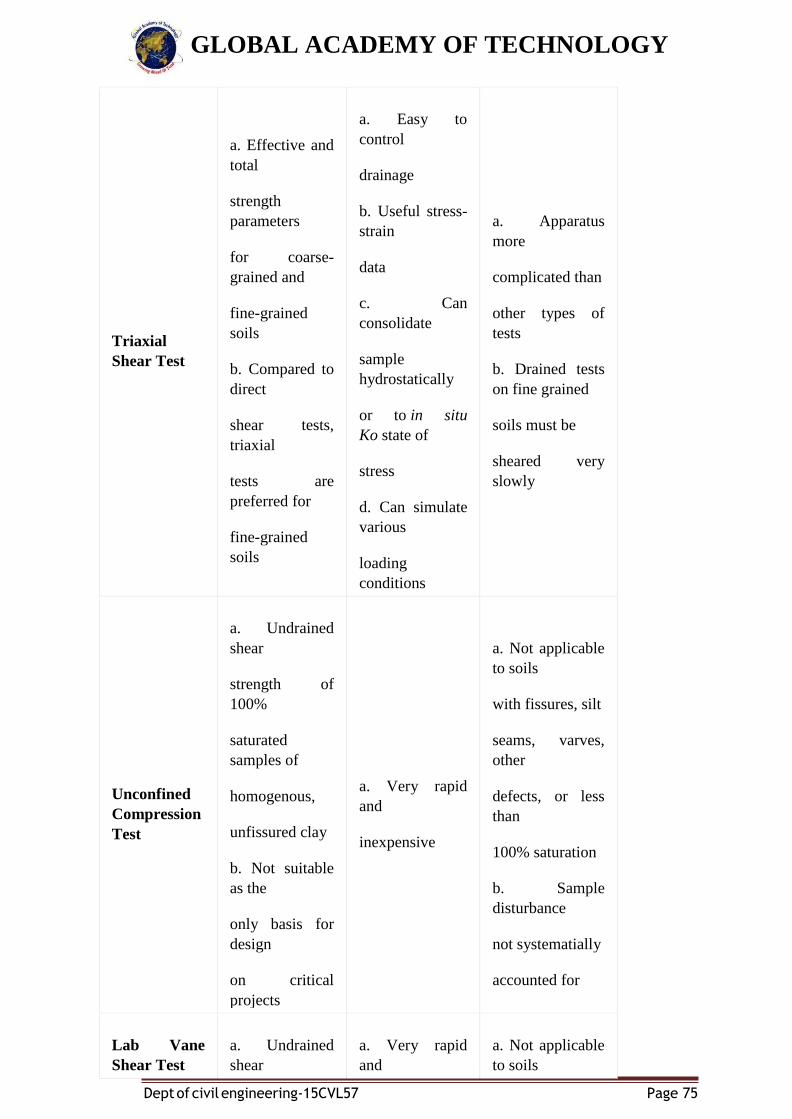
GLOBAL ACADEMY OF TECHNOLOGY
Dept of civil engineering-15CVL57 Page 75
Triaxial
Shear Test
a. Effective and
total
strength
parameters
for coarse-
grained and
fine-grained
soils
b. Compared to
direct
shear tests,
triaxial
tests are
preferred for
fine-grained
soils
a. Easy to
control
drainage
b. Useful stress-
strain
data
c. Can
consolidate
sample
hydrostatically
or to in situ
Ko state of
stress
d. Can simulate
various
loading
conditions
a. Apparatus
more
complicated than
other types of
tests
b. Drained tests
on fine grained
soils must be
sheared very
slowly
Unconfined
Compression
Test
a. Undrained
shear
strength of
100%
saturated
samples of
homogenous,
unfissured clay
b. Not suitable
as the
only basis for
design
on critical
projects
a. Very rapid
and
inexpensive
a. Not applicable
to soils
with fissures, silt
seams, varves,
other
defects, or less
than
100% saturation
b. Sample
disturbance
not systematially
accounted for
Lab Vane
Shear Test
a. Undrained
shear
a. Very rapid
and
a. Not applicable
to soils
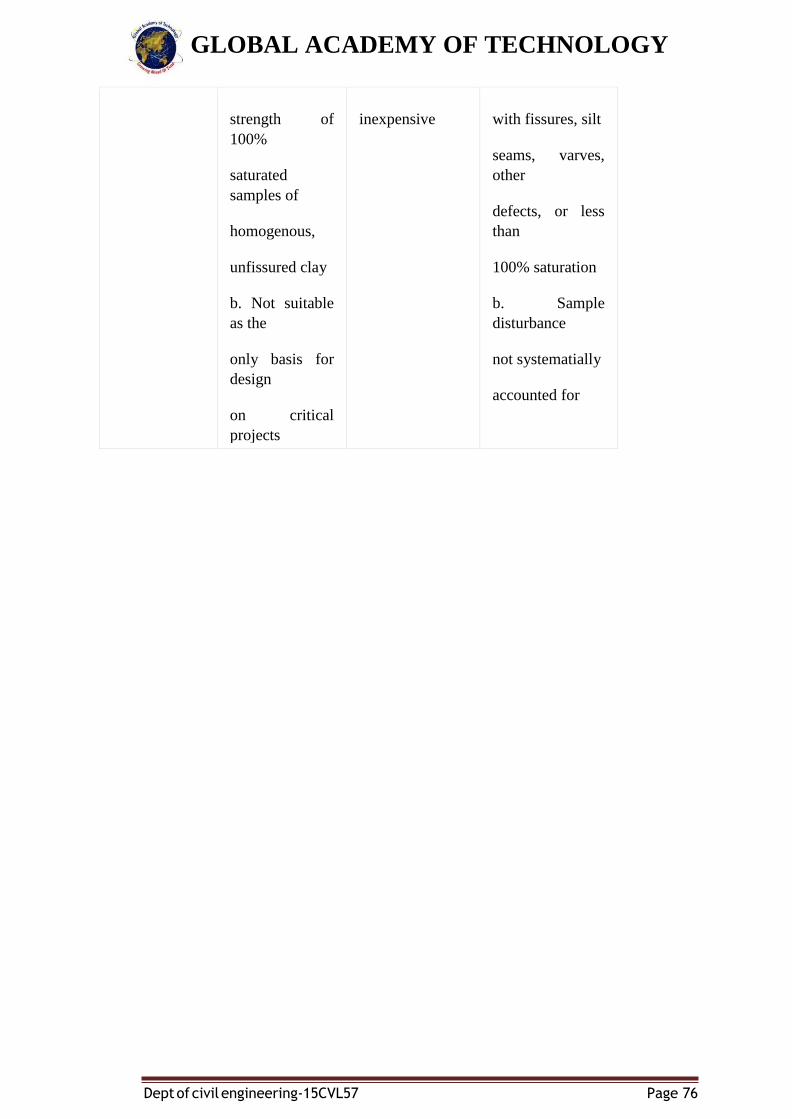
GLOBAL ACADEMY OF TECHNOLOGY
Dept of civil engineering-15CVL57 Page 76
strength of
100%
saturated
samples of
homogenous,
unfissured clay
b. Not suitable
as the
only basis for
design
on critical
projects
inexpensive with fissures, silt
seams, varves,
other
defects, or less
than
100% saturation
b. Sample
disturbance
not systematially
accounted for
GLOBAL ACADEMY OF TECHNOLOGY
Dept of civil engineering-15CVL57 Page 77
DEMONSTRATION 1: STANDARD PENETRATION TEST
AIM: To perform standard penetration to obtain the penetration resistance (N-value)
along the depth at a given site.
EQUIPMENT & APPARATUS:
▪ Tripod (to give a clear height of about 4 m; one of the legs of the tripod should
have ladder to facilitate a person to reach tripod head.)
▪ Tripod head with hook
▪ Pulley
▪ Guide pipe assembly
▪ Standard split spoon sampler
▪ A drill rod for extending the test to deeper depths
▪ Heavy duty post hole auger (100 mm to 150 mm diameter)
▪ Heavy duty helical auger
▪ Heavy duty auger extension rods
▪ Sand bailer
▪ Rope (about 15 m long & strong enough to lift 63.5 kg load repeatedly)
▪ A light duty rope to operate sand bailer
▪ Chain pulley block
▪ Casing pipes
▪ Casing couplings
▪ Casing clamps
▪ Measuring tapes
▪ A straight edge (50 cm)
▪ Tool box
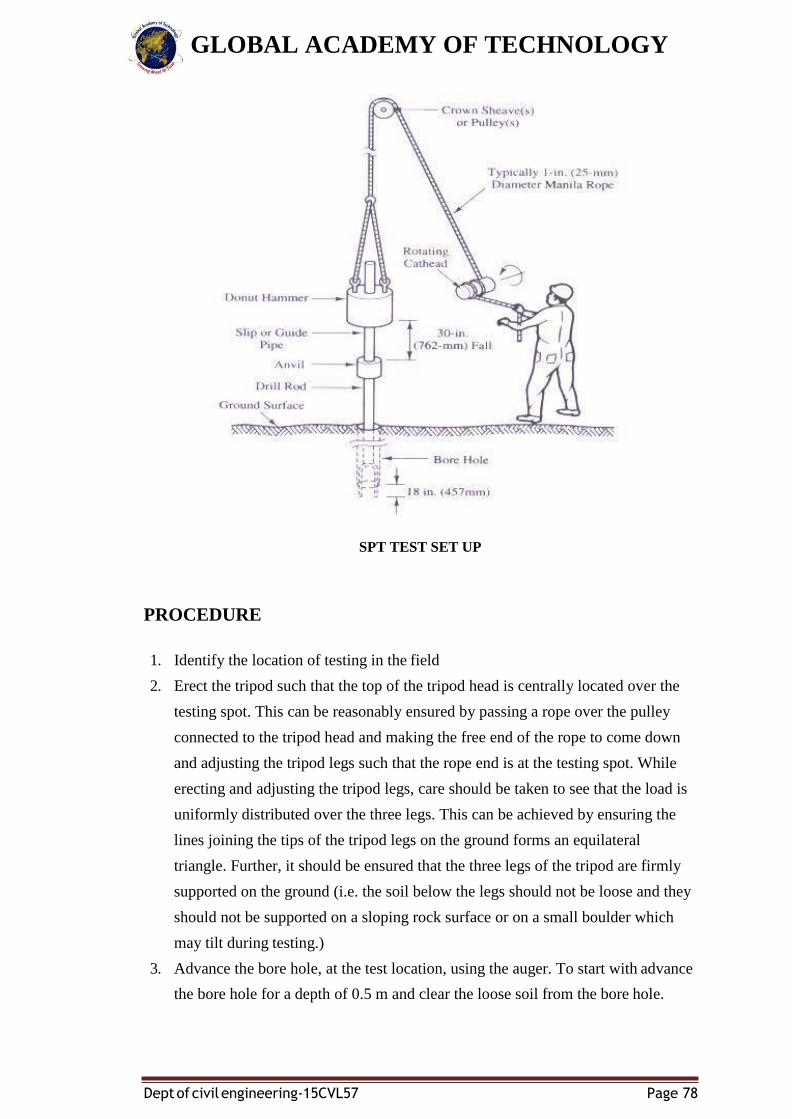
GLOBAL ACADEMY OF TECHNOLOGY
Dept of civil engineering-15CVL57 Page 78
SPT TEST SET UP
PROCEDURE
1. Identify the location of testing in the field
2. Erect the tripod such that the top of the tripod head is centrally located over the
testing spot. This can be reasonably ensured by passing a rope over the pulley
connected to the tripod head and making the free end of the rope to come down
and adjusting the tripod legs such that the rope end is at the testing spot. While
erecting and adjusting the tripod legs, care should be taken to see that the load is
uniformly distributed over the three legs. This can be achieved by ensuring the
lines joining the tips of the tripod legs on the ground forms an equilateral
triangle. Further, it should be ensured that the three legs of the tripod are firmly
supported on the ground (i.e. the soil below the legs should not be loose and they
should not be supported on a sloping rock surface or on a small boulder which
may tilt during testing.)
3. Advance the bore hole, at the test location, using the auger. To start with advance
the bore hole for a depth of 0.5 m and clear the loose soil from the bore hole.
GLOBAL ACADEMY OF TECHNOLOGY
Dept of civil engineering-15CVL57 Page 79
4. Clean the split spoon sampler and apply a thin film of oil to the inside face of the
sampler. Connect an A-drill extension rod to the split spoon sampler.
5. Slip the 63.6 kg weight on to the guide pipe assembly and connect the guide pipe
assembly to the other end of the A-drill rod.
6. The chain connected to the driving weight is tied to the rope passing over the
pulley at the tripod head. The other end of the rope is pulled down manually or
with help of mechanical winch. By pulling the rope down, the drive weight,
guide pipe assembly, A-drill rod and the split spoon sampler will get vertically
erected.
7. A person should hold the guide pipe assembly split spoon sampler to be vertical
with the falling weight lowered to the bottom of the guide assembly.
8. Now place a straight edge across the bore touching the A-drill rod. Mark the
straight edge level all round the A-drill rod with the help of a chalk or any other
marker. From this mark, measure up along the A-drill rod and mark 15 cm, 30
cm and 45 cm above the straight edge level. Lift the driving weight to reach the
top of the guide pipe assembly travel and allow it to fall freely. The fall of
driving weight will transfer the impact load to the split spoon sampler, which
drive the split spoon sampler into the ground. Again lift the drive weight to the
top of travel and allow it to fall freely under its own weight from a height of 75
cm. as the number of blows are applied, the split spoon sampler will penetrate
into the ground and the first mark (15 cm mark) on the drill rod approaches the
straight edge.
9. Count the number of blows required for the first 15 cm, second 15 cm and the
third 15 cm mark to cross down the straight edge.
10. The penetration of the first 15 cm is considered as the seating drive and the
number of blows required for this penetration is noted but not accounted in
computing penetration resistance value. The total number of blows required for
the penetration of the split spoon sampler by 2nd and 3rd 15 cm is recorded as the
penetration resistance or N-value.
11. After the completion of the split spoon sampler by 45 cm, pull out the whole
assembly. Detach the split sampler from A-drill rod and open it out. Collect the
soil sample from the split spoon sampler into a sampling bag. Store the sampling
bag safely with an identification tag for laboratory investigation.
12. Advance the bore hole by another 1 m or till a change of soil strata whichever is
early.
GLOBAL ACADEMY OF TECHNOLOGY
Dept of civil engineering-15CVL57 Page 80
13. The test is repeated with advancement of bore hole till the required depth of
exploration is reached or till a refusal condition is encountered. Refusal condition
is said to exist if the number of blows required for the last 30 cm of penetration is
more than 100.
14. The test will be repeated in number of bore holes covering the site depending on
the building area, importance of the structure and the variation of the soil
properties across the site.
15. The SPT values are presented either in the form of a table or in the form of bore
log data.
GLOBAL ACADEMY OF TECHNOLOGY
Dept of civil engineering-15CVL57 Page 81
DEMONSTRATION 2: SWELL PRESSURE
DEFNITION
Swelling pressure can be defined as the pressure required to keep a soil element. at
constant volume, when boundary conditions are such as to induce a tendency to
volume increase.
PROCEDURE
To determine the free swell index of soil as per IS: 2720 (Part XL) – 1977. Free swell
or differential free swell, also termed as free swell index, is the increase in volume of
soil without any external constraint when subjected to submergence in water. The
apparatus used :
i) IS Sieve of size 425µm
ii) Oven
iii) Balance, with an accuracy of 0.01g
iv) Graduated glass cylinder- 2 nos., each of 100ml capacity
strong>Procedure to determine Free Swell Index Of Soil
i) Take two specimens of 10g each of pulverised soil passing through 425µ m IS Sieve
and oven-dry.
ii) Pour each soil specimen into a graduated glass cylinder of 100ml capacity.
iii) Pour distilled water in one and kerosene oil in the other cylinder upto 100ml mark.
iv) Remove entrapped air by gently shaking or stirring with a glass rod.
v) Allow the suspension to attain the state of equilibrium (for not less than 24hours).
vi) Final volume of soil in each of the cylinder should be read out.
REPORTING OF RESULTS
Free swell index = [Vd – Vk] / Vk x 100%
where,
Vd = volume of soil specimen read from the graduated cylinder containing distilled
water.
Vk = volume of soil specimen read from the graduated cylinder containing kerosene.
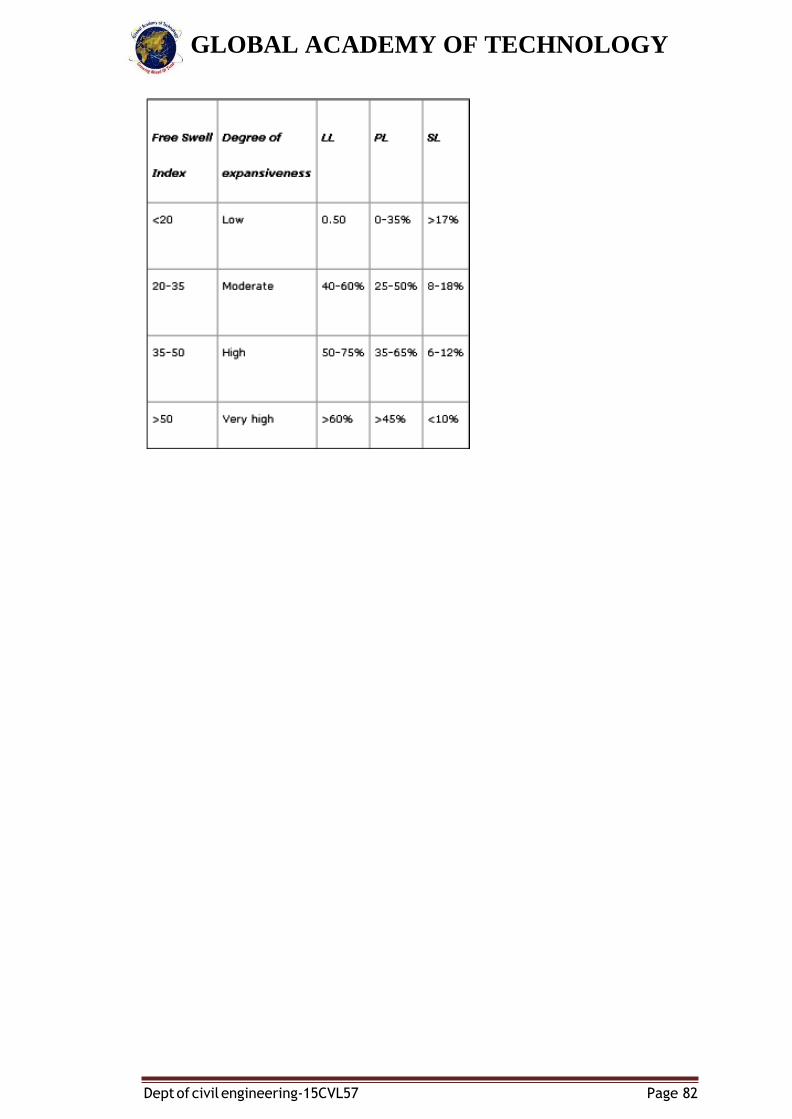
GLOBAL ACADEMY OF TECHNOLOGY
Dept of civil engineering-15CVL57 Page 82