Embed Size (px)
Citation preview

Graduate Theses, Dissertations, and Problem Reports
2017
College Students' Sleep Quality College Students' Sleep Quality
Yahya Ahmed Alamir
Follow this and additional works at: https://researchrepository.wvu.edu/etd
Recommended Citation Recommended Citation Alamir, Yahya Ahmed, "College Students' Sleep Quality" (2017). Graduate Theses, Dissertations, and Problem Reports. 5047. https://researchrepository.wvu.edu/etd/5047
This Dissertation is protected by copyright and/or related rights. It has been brought to you by the The Research Repository @ WVU with permission from the rights-holder(s). You are free to use this Dissertation in any way that is permitted by the copyright and related rights legislation that applies to your use. For other uses you must obtain permission from the rights-holder(s) directly, unless additional rights are indicated by a Creative Commons license in the record and/ or on the work itself. This Dissertation has been accepted for inclusion in WVU Graduate Theses, Dissertations, and Problem Reports collection by an authorized administrator of The Research Repository @ WVU. For more information, please contact [email protected].
i
College Students’ Sleep Quality
Yahya Ahmed Alamir, BSN, MAP, PhD
Dissertation submitted to the
School of Public Health
at West Virginia University
in partial fulfillment of the requirements for the degree of
Doctor of Philosophy
in
Public Health/ Social and Behavioral Sciences
Keith J. Zullig, M.S.P.H., Ph.D., Chair
Sijin Wen, PhD
Hawley Montgomery-Downs, PhD
Alfgeir L. Kristjansson, PhD
Ranjita Misra, PhD, CHES, FASHA
Social and Behavioral Sciences Department
Morgantown, West Virginia, 2017
Keywords: Sleep quality, College students, NMUPD, BMI, HBM, TPB
Copyright 2017 Yahya Alamir
Abstract
College Students’ Sleep Quality
Yahya Ahmed Alamir, MAP
Poor sleep quality among college students increases the risk for lower grade point
averages, compromised learning, impaired mood, and motor vehicle accidents; and associated
with several unhealthy behaviors and outcomes including substances /drugs use (alcohol and
medications), and weight gain. Therefore, we assessed college sleep quality in relation to the
NMUPD and BMI among a large sample of college students using the fall 2010-spring 2011
national survey data (American College Health Association - National College Health
Assessment (ACHA-NCHA)). In addition, we used theoretical model integrating HBM
perception constructs and behavioral intention to describe and predict college students’ sleep
quality among a sample of WVU undergraduate students. The goal of this dissertation was to
better understand students’ sleep quality. Study results can help in establishing theoretically
driven interventions to promote students’ sleep quality.
Poor sleep was common among a large national sample of college students and among
WVU college students. The NMUPD was significantly associated with poor sleep quality, and
poor sleep quality significantly increases the predicted values of BMI and increases the risk of
being overweight and obese. In addition, poor sleep quality was also associated with having
more unhealthy days among WVU students. The HBM and the behavioral intention (TPB) have
significant roles in prediction poor sleep quality among a sample of WVU college students. Our
results extend the current knowledge regarding the association between NMUPD and poor sleep
quality, the association between poor sleep quality and overweight and/or obesity, the association
between poor sleep quality and poor HRQOL, and the significant roles of HBM and behavioral
intention in explaining sleep quality among college students. Moreover, we add to the current
literature the influence of the HBM on behavioral intention, which make a very significant
combination in predicting sleep quality among college students. Therefore, assessment of college
students’ sleep quality should include screening for NMUPD, overweight and obesity, HRQOL
as potential risk factors for poor sleep, and may all be interrelated.

iii
Acknowledgement
This project would not have been possible without the love, support, and encouragement
I received from my mother, wife, kids, family, and friends. A great and special thank I must send
to my mother (Mrs. Marium Alamir) who always prays for me for success. My wife (Mrs.
Ebtehal Alamir) and my kids (Master. Ayham, Master. Ayman, and my little girl Maria) have
great contributions to my success in producing this work. Always I realize how much they
sacrificed so that I could have time away from them to do my work. I really, do not have words
to adequately describe my deep gratitude for all they have provided me, though I hope to show
them more achievements to come. I am not also forgetting my brothers and sister, my brothers in
law, who always standing by me given all kinds of support. Finally, I would like also to thank
my friend Mr. Riyadh Alhazmi, who always encourage me to keep the hard work. Thank you all
for everything I have got from you that keep me on the hard work every day.

iv
Table of Contents
Abstract ............................................................................................................................................ ii
Acknowledgement .......................................................................................................................... iii
Introduction ..................................................................................................................................... 1
Sleep: definition and significance .................................................................................................... 1
Trends and prevalence of poor sleep .............................................................................................. 4
Significance and Purpose ................................................................................................................. 5
The Relationship between the Nonmedical Use of Prescription Drugs (NMUPD) and Sleep Quality
among a National of College Students............................................................................................. 7
Introduction ..................................................................................................................................... 7
Material and Methods ................................................................................................................... 10
Instrumentation ............................................................................................................................. 10
NMUPD .......................................................................................................................................... 10
Sleep Quality .................................................................................................................................. 11
Covariates ...................................................................................................................................... 12
Data Analysis .................................................................................................................................. 12
Results ............................................................................................................................................ 12
Sample characteristics .................................................................................................................. 12
Sleep and NMUPD .......................................................................................................................... 13
Associations between NMUPD and sleep ...................................................................................... 13
Discussion ...................................................................................................................................... 14
Limitations ..................................................................................................................................... 19
Conclusion ...................................................................................................................................... 19
The Relationship between Sleep Quality and Body Mass Index (BMI) Measures among a National
Sample of College Students ........................................................................................................... 21
Introduction ................................................................................................................................... 21
BMI/Obesity ................................................................................................................................... 21
Sleep and BMI/Obesity .................................................................................................................. 22
Significance and Purpose ............................................................................................................... 25
Research Question, Aim, and Hypothesis ...................................................................................... 25
Research questions ........................................................................................................................ 25
Aim(s) and hypotheses................................................................................................................... 26

v
Method .......................................................................................................................................... 27
Study design, Data source and Population .................................................................................... 27
Instrumentation ............................................................................................................................. 28
Sleep Quality .................................................................................................................................. 28
Body Mass Index (BMI) (dependent variable) .............................................................................. 29
Covariates ...................................................................................................................................... 30
Data Analysis .................................................................................................................................. 32
Results ............................................................................................................................................ 33
Sample characteristics ................................................................................................................... 33
Sleep Quality and the Body Mass Index (BMI) description............................................................ 34
The association between sleep and BMI ....................................................................................... 35
Differences in sleep quality among the different BMI classes ....................................................... 35
The association between the different sleep quality aspects and BMI measures (multivariate
ordinal regression and Linear Regression analyses) ...................................................................... 37
Discussion ...................................................................................................................................... 38
Limitation ....................................................................................................................................... 43
Conclusion ...................................................................................................................................... 44
A Theory-based Description of Sleep Quality and Its Impact on Health-Related Quality Of Life
Using Health Belief Model and Behavioral Intention among a Sample of WVU Undergraduates
Students ......................................................................................................................................... 45
Introduction ................................................................................................................................... 45
Health Belief Model and Theory of Planned Behavior .................................................................. 45
Theory based description/prediction of sleep quality ................................................................... 45
Significance and Purpose ............................................................................................................... 46
Research questions, Aims, and Hypotheses .................................................................................. 47
Research questions, ....................................................................................................................... 47
Description of the proposed theoretical framework ..................................................................... 48
Elements of the framework ........................................................................................................... 48
Conceptual and operational definitions of the Model’s elements: ............................................... 49
External factors .............................................................................................................................. 49
HBM Constructs ............................................................................................................................. 49
Behavioral Intention (TPB Construct) ............................................................................................ 51
Sleep Quality .................................................................................................................................. 51
Health-related quality of life .......................................................................................................... 52
vi
Model assumptions ........................................................................................................................ 52
Literature Review ........................................................................................................................... 53
Model’s external factors and sleep (first research question) ........................................................ 53
Race/Ethnicity ................................................................................................................................ 53
Gender ........................................................................................................................................... 53
SES (for both research questions) .................................................................................................. 54
Other key important covariates (second research question) ........................................................ 55
Knowledge ..................................................................................................................................... 55
Sleep related factors ...................................................................................................................... 55
Bedroom environment .................................................................................................................. 56
Drinks ............................................................................................................................................. 57
HBM, Behavioral intention and Sleep ............................................................................................ 58
HBM Perception Constructs and sleep .......................................................................................... 58
Behavioral intention and sleep ...................................................................................................... 59
Sleep and HRQOL ........................................................................................................................... 60
Theoretical Rational ....................................................................................................................... 61
Method .......................................................................................................................................... 62
Study Design, Setting and Population ............................................................................................ 62
Sampling ......................................................................................................................................... 62
Sample size and Power analysis ..................................................................................................... 62
Participants’ recruitment ............................................................................................................... 63
The Survey (Instruments) ............................................................................................................... 65
(see Appendix D) ............................................................................................................................ 65
Health related quality of life: HRQOL–14 "Healthy Days Measure" .............................................. 65
Sleep Quality Scale (Pittsburgh Sleep Quality Index [PSQI]) .......................................................... 67
The Theory of Planned Behavior Instrument (Behavioral Intention) ............................................ 68
The Health Belief Model (HBM) Instrument .................................................................................. 69
Perceived susceptibility scale: ....................................................................................................... 69
Perceived severity scale: ................................................................................................................ 69
Perceived benefits scale: ............................................................................................................... 70
Perceived barriers scale: ................................................................................................................ 70
Questions related to the external variables .................................................................................. 71
Data Analyses ................................................................................................................................. 71

vii
SEM Testing .................................................................................................................................... 72
Model’s variables ........................................................................................................................... 73
Results ............................................................................................................................................ 74
Sample characteristics: .................................................................................................................. 74
Demographics ................................................................................................................................ 74
Sleep quality, HRQOL and the behavioral constructs .................................................................... 74
Structural Equation Modelling (SEM) ............................................................................................ 75
Multivariate Linear Regression Model ........................................................................................... 77
Discussion ...................................................................................................................................... 78
Conclusion ...................................................................................................................................... 83
Limitation ....................................................................................................................................... 84
Summary ........................................................................................................................................ 84
REFERENCES ................................................................................................................................... 87
Appendix A ..................................................................................................................................... 99
Aim1, Results’ Tables ..................................................................................................................... 99
Table 1. Sample Characteristics (F=Frequency, %= percentage) ............................................ 100
Appendix B ................................................................................................................................... 103
Aim2, Results’ Tables and Figures ................................................................................................ 103
Appendix C ................................................................................................................................... 124
Aim3, Results’ Tables and Figures ................................................................................................ 124
................................................................................................................................................. 133
Appendix D ................................................................................................................................... 135
Aim3, Survey ................................................................................................................................ 135
Appendix E ................................................................................................................................... 185
Corresponding letters .................................................................................................................. 185
Appendix F ................................................................................................................................... 192
IRB Approval ................................................................................................................................. 192
1
Introduction
Sleep: definition and significance
Sleep is described as a complex combination of behavioral and physiological processes
(Kryger, Roth, & Dement, 2011). Commonly, sleep is defined as a behavioral state characterized
by reduced responsiveness to stimuli, decreased awareness and interaction with the environment,
muscle relaxation, and reduced movement (Benca, 2012; Kryger et al., 2011). The physiological
definition of sleep refers to a period of intense physiological and neurological activities including
changes in the brain activities during the different stages of sleep (McLaughlin Crabtree &
Williams, 2009). A typical night’s sleep (e.g. 7-8 hours of sleep duration among adults), passes
through an average of four to five recurring cycles; each cycle comprises four stages of sleep.
The average length of the first cycle is approximately 70 to 100 minutes, which then increases to
an average of 90-110 minutes for the second and later cycles (Benca, 2012; Kryger et al., 2011).
Stages of sleep are divided into non-rapid eye movement (NREM), and rapid eye movement
(REM) (American Sleep Association [ASF], 2015; Benca, 2012; Kryger et al., 2011; National
Institute of Neurological Disorders and Stroke [NINDS], 2014; National Sleep Foundation
[NSF], 2015a; Robotham, Chakkalackal, & Cyhlarova, 2011).
NREM sleep consists of approximately 75%-80% of the total sleep duration and
comprises three stages: NREM 1 or stage 1, NREM 2 or stage 2 and NREM 3 or stage 3 (ASA,
2015; Benca, 2012; Kryger et al., 2011; NINDS, 2014; NSF, 2015a; Robotham et al., 2011). In
NREM Stage 1, individuals progress through drowsiness and then light sleep. This stage
represents an essential bridge between wakefulness and sleep; where eye movement, muscle
activity, and breathing all slow down. In general, sleep in this stage can be easily disrupted; and
individuals can be easily awakened from sleep (ASA, 2015; Benca, 2012; Kryger et al., 2011;

2
NINDS, 2014; NSF, 2015a; Robotham et al., 2011). In NREM stage 2, eye movement stops,
muscle activity decreases, breathing is regular and slow, and body temperature drops. In this
stage, individuals become disengaged from the outside world; they may still hear sounds, but are
unable to understand them. Then, individuals move into deep sleep during NREM stage 3 (it is
also called slow-wave sleep (SWS)). In this stage, there is no eye movement or muscle activity,
and breathing becomes slower. It is difficult to wake in this stage, and individuals become less
responsive to, and aware of, sounds. In fact, tissue growth and repair occurs, along with energy
restoration in this stage. Dreams can occur, but not as common as random eye movement (REM)
stage (ASA, 2015; Benca, 2012; Kryger et al., 2011; NINDS, 2014; NSF, 2015a; Robotham et
al., 2011). Finally, REM is the last stage in the sleep cycle, which describes an active stage of
the brain and accounts for around 20% to 25% of total sleep duration. In this stage, individuals’
muscle will be completely paralyzed and unresponsive; and more rapid and irregular breathing
occurred. The majority of dreams occur in this stage (ASA, 2015; Benca, 2012; Kryger et al.,
2011; NINDS, 2014; NSF, 2015a; Robotham et al., 2011). Each sleep stage provides a distinct,
significant physiological and neurological function for the health of the body and mind, making
it crucial to progress through all sleep stages many times during a single night sleep.
Sleep duration (i.e. the number of sleeping hours per night) is also significant for a
good night sleep and important for ensuring going through sleep stages in a repeated cycle. The
needed number of sleeping hours per night to complete the typical sleep cycles of sleep stages
varies by age group. For example, newborns should have between 16 to 18 hours a day,
preschool-aged children need between 11 to 12 hours, school-aged children should have at least
10 hours, teens need between 9 to 10 hours, and adults (including elderly) are recommended to
get between 7 to 8 hours of sleep per day (Centers for Disease Control and Prevention [CDC],

3
2013; National Institute of Health [NIH], 2012a). Consequently, a good night’s sleep
encompasses both adequate number of sleeping hours and the quality of sleep, as assessed by
moving through the stages of sleep. Both sleep duration and sleep quality are significant in
describing poor or good (healthy) sleep (Robotham et al., 2011). Seep quality will be used in this
document as an overall outcome of sleep behavior that involves both sleep duration and aspects
of sleep quality; accordingly, poor sleep quality will be used to describe the concept of short
sleep duration with poor aspects of sleep quality, while good, optimal and healthy sleep will be
used to describe the concept of having the recommended sleeping hours with good sleep quality
aspects.
Sleep is necessary to fight off infection, support the metabolism of sugar, perform well
in school, and work effectively and safely (Healthy People, 2015; Robotham et al., 2011).
Getting good (healthy) sleep and treating sleep disorders improves health, productivity, wellness,
quality of life, and safety on roads and in the workplace (Healthy People, 2015). Conversely,
poor sleep can cause sleep disorders such as sleep apnea, insomnia, narcolepsy, and restless legs
syndrome (Ram, Seirawan, Kumar, & Clark, 2010; Wells & Vaughn, 2012). In addition, poor
sleep has been associated with a host of negative behavioral and health outcomes including
substance use (e.g., tobacco and alcohol usage), physical inactivity, violent behavior, mental
disturbances, suicide attempts, overweight or obesity, heart disease, drowsy driving, and risk for
accidents and injuries (Benca, 2012; Fredriksen, Rhodes, Reddy, & Way, 2004; McKnight-Eily
et al., 2011; National Institute of Diabetes and Diagestive and Kidney Diseases [NIDDK], 2012).
Poor sleep has also been associated with poor school performance and lower average school
grades (Fredriksen et al., 2004; Ming et al., 2011). Collectively, poor sleep and sleep disorders
4
reduce quality of life and productivity, increase the use of health-care services, and can cause
injuries, illness, or deaths (CDC, 2008).
Trends and prevalence of poor sleep
Approximately one-quarter of the U.S. population does not get enough sleep and roughly
one in three adults gets less than seven hours of sleep per night (CDC, 2015; NIH, 2013). In
addition, nearly 50 to 70 million Americans chronically suffer from sleep and wakefulness
disorders (long-term effect of sleep deprivation and sleep disorders) (CDC, 2015; Ram et al.,
2010; Wells & Vaughn, 2012). Among adolescents (ages 13-18 years), approximately 70% get
less than 7 hours on average school nights (Chen, Wang, & Jeng, 2006; Eaton et al., 2010;
Lauderdale et al., 2009; McKnight-Eily et al., 2011; Ming et al., 2011). Moreover, sleep
disorders during adolescence may predict ongoing sleep-related problems in adulthood; such as
mood disorders, heart disease, and diabetes (Dregan & Armstrong, 2010; Fredriksen et al., 2004;
Lund, Reider, Whiting, & Prichard, 2010; Ming et al., 2011).
Indeed, poor sleep is highly prevalent health issue among college students in the United
States (Tsai & Li, 2004), with more than 60% considered poor sleepers (Lund et al., 2010). The
most common and prevalent sleep disorders among college students include: sleep apnea,
insomnia, narcolepsy, and restless legs syndrome (Fredriksen et al., 2004; Ming et al., 2011; Ram
et al., 2010; Wells & Vaughn, 2012). College students are particularly susceptible to poor sleep
quality due to several factors such as maturational changes. In addition, poor sleep in this
vulnerable population obstructs higher cognitive functions such as learning, problem solving,
and creativity, which increases their risk for lower grade point averages, compromised learning,
impaired mood, and motor vehicle accidents (Hershner & Chervin, 2014; Lund, et al., 2010).
Furthermore, poor sleep among college students also appear to bring about other unhealthy
behaviors such as use of alcohol and medications to induce sleep, and stimulants to compensate
5
sleep deprivation. Moreover, poor sleep has been connected to weight gain, and college years
appear to be an important period for increases in overweight status (Curcio, Ferrara, & De, 2006;
Lund, et al., 2010 Vela-Bueno, Fernandez-Mendoza, & Olavarrieta- Bernardino, 2009).
Significance and Purpose
Sleep health is one of the newest objectives of Healthy People 2020. The goal for sleep
health is to increase public knowledge of how adequate sleep and treatment of sleep disorders
improve health, productivity, wellness, quality of life, and safety on roads and in the workplace
(Healthy People, 2015). Four different objectives have been established for sleep health (Healthy
People, 2015):
1. Increase the proportion of persons with symptoms of obstructive sleep apnea who seek
medical evaluation.
2. Reduce the rate of vehicular crashes per 100 million miles traveled that are due to drowsy
driving.
3. Increase the proportion of students in grades 9 through 12 who get sufficient sleep.
4. Increase the proportion of adults who get sufficient sleep.
This project intends to contribute in achieving the objective of increasing the proportion
of adults (18+ years old) who get sufficient sleep (defined as 8 or more hours for those aged 18
to 21 years and 7 or more hours for those aged 22 years and older, on average, during a 24-hour
period) (Healthy People, 2015). It is crucial to study and describe sleep quality among college
students; since poor sleep among this vulnerable population increases their risk for several
unhealthy behaviors (drugs/substances and medication use), and obstruct their academic
achievements. Such research may help in attaining better understanding of students’ sleep

6
quality, in order to increase the proportion of students who get sufficient sleep, and to prevent
sleep-related disorders and/or negative health-related outcomes.
This dissertation aims at examining students’ sleep quality in relation to the nonmedical
use of prescription drugs (NMUPD) (Aim #1) and Body Mass Index (BMI) (Aim #2) among a
large sample of college students. Aim # 3 attempts to describe sleep quality of West Virginia
University (WVU) college students using the Health Belief Model (HBM) and behavioral
intention form the Theory of Planned Behavior (TPB). The three aims utilized cross-sectional
designs. Aim #1 and Aim #2 analyses was based on secondary data, using the fall 2010-spring
2011 American College Health Association - National College Health Assessment (ACHA-
NCHA). Aim #3 was based on primary data collection obtained from a sample of undergraduate
students attending WVU.

7
The Relationship between the Nonmedical Use of Prescription Drugs (NMUPD) and Sleep
Quality among a National of College Students.
Introduction
Prescription medications designed to treat pain, anxiety, sleep disorders and other
medical problems have proliferated in the U.S. However, their increased availability has also
lead to increased nonmedical use (NMU). Nonmedical use of prescription drugs (NMUPD)
refers to the use of medication for reasons, or in ways, or in amounts, not intended by a doctor;
taken without a prescription; or taken by someone other than the person for whom they are
prescribed (National Institute on Drug Abuse [NIDA], 2015; Substance Abuse and Mental
Health Services Administration [SAMHSA], 2015).
There were 15 million indiviuals, aged 12 years or older, who engaged in NMUPD, and
NMUPD is more common than use of any other drug, with the exception of marijuana (Hughes,
Williams, Lipari, Bose, Copello, & Kroutil, 2016; SAMHSA,2015). Lifetime prevalence of
NMUPD is 20% among college students for at least one prescription medication class (i.e.
sedatives, opioids, or stimulants) (McCabe, West, Teter, & Boyd, 2014). In addition, college
students also have the highest NMU of opioid painkillers (McCabe & Teter, 2007). NMU of
antidepressants is unexplored in many large-scale epidemiological surveys. However, 8% of
Americans 12 years or older used antidepressants between 2005 and 2008 for reasons other than
depression (Pratt, Brody, & Gu, 2011). Such usage increased from 2.4% to 10.8% between 2007
and 2010 among adults (National Center for Health Statistics [NCHS], 2014).
The most commonly reported reasons for NMUPD among college students are to “stay
awake to study” and/or to “increase concentration” (Clegg-Kraynok, McBean, & Montgomery-
Downs, 2011; McCabe & Teter, 2007). However, the association between NMUPD and sleep

8
quality among college students has not been generally explored, with the exception of stimulant
use. Clegg-Kraynok (2010) found that college students not only have poorer sleep quality and
shorter sleep duration than adolescents but also are more likely to use psychostimulants
nonmedically (defined as stimulants used for the treatment of Attention-Deficit/Hyperactivity
Disorder [ADHD]) to compensate for shortened sleep; students with lifetime NMU of
psychostimulants report poorer sleep quality and more sleep disturbance than nonusers (Clegg-
Kraynok, et al., 2011).
However, the association between sedative, painkiller, and antidepressant use and sleep
quality has not been explored among college students, and only sparsely in the general
population. Sedatives are often referred to as sleep aids (Chong, Fryar, & Gu, 2013). Chong et al.
(2013) reported that noninstitutionalized U.S. adults who obtain either fewer than five hours or
more than nine hours of sleep, use sleep aids in higher proportions (6.0% and 5.3% respectively).
Use of sleep aids is also high among adults who report sleep-related disorders and trouble
sleeping (Chong et al., 2013).
Painkillers can significantly disrupt sleep architecture in healthy adults ( Dimsdale,
Norman, DeJardin, & Wallace, 2007). Dimsdale et al. (2007) found both sustained-release
morphine sulfate and methadone use significantly reduced deep sleep and increased stage N2,
resulting in overall sleep quality disturbance. Studies of adolescents’ use of pain relievers
showed they have more trouble sleeping (in the past six months) than nonusers (McCabe, West,
and Boyd, 2013). Poor sleep quality was also reported by 80.6% of prescription opioid users
compared to healthy controls (Hartwell, Pfeifer, McCauley, Moran-Santa, & Back, 2014). The
prescription opioid-dependent group also had shorter sleep duration, longer sleep latency, and
more awakening times.

9
Antidepressants, on the other hand, change and improve sleep architecture, specifically
by decreasing the amount of REM sleep and increasing its onset latency in both healthy
individuals and depressed patients (Lam, 2005; Wilson & Argyropoulos, 2005). These effects
vary by drugs, with some short-term sleep disturbance early in treatment (e.g.,
clomipramine and the selective serotonin receptor inhibitors [SSRIs]), while others are
sleep-promoting (e.g., amitriptyline and the newer serotonin 5-HT2-receptor antagonists)
(Wilson & Argyropoulos, 2005). However, some antidepressants drugs may cause insomnia and
daytime sleepiness (Lam, 2005; Mayers & Baldwin, 2005). In general, sleep improved with
effective antidepressant treatment within 3–4 weeks (Wilson & Argyropoulos, 2005).
The current literature on NMUPD and sleep quality among both college students and in
the general population are limited because: (1) many large-scale epidemiological surveys of
prescription drug use have not included NMU of antidepressants; and (2) they have not explored
important demographic and behavioral covariates, including sleep disorders and other gateway
drugs (NMU of stimulants, in particular, is associated with increased use of other drugs including
alcohol, cocaine, cigarettes, and marijuana) (Hershner & Chervin, 2014; McCabe & Teter, 2007).
Therefore, our study purpose was to use a large, national college student sample to
examine the associations between four classes of NMUPD (antidepressant, painkillers,
stimulants, and sedatives) in the past 12 months and five aspects of sleep quality (Enough Sleep,
Early Awakening, Daytime Sleepiness, Difficulty Falling Asleep, and Problem associated with
Daytime Sleepiness) in the past seven days. Specifically, we sought to take into consideration
known limitations, and to include important demographic and behavioral covariates that have not
been controlled in previous studies. Given the relatively exploratory nature of the study, no
specific hypotheses were developed. However, in line with the extant literature, we expect a

10
positive association between NMUPD and sleep quality as reflected by five aspects of sleep
behavior. We examined potential associations that may exist with any NMUPD, as well as within
each drug class individually.
Material and Methods
This study utilized data from the fall 2010 and spring 2011 National American College
Health Association-National College Health Assessment (ACHA-NCHA). We were granted
access to these data through a formal request to the American College Health Association. There
were 42 and 129 institutions that participated in the fall 2010 (n=30,263) and spring 2011
(n=116,254) NCHA, respectively. However, we selected only those schools (39 and 129 during
fall-2010 and spring-2011, respectively) that surveyed all available students or used a random
sampling technique (N=135,874; ACHA, 2011). The overall response rates were 30.9% and
28.5% for fall 2010 and spring 2011, respectively. Missing values (missing at random), n=2,663
and 16,321 individuals, were excluded from descriptive analysis and from inferential analysis,
respectively.
Instrumentation
NMUPD
The independent variables included four classes of nonmedical prescription drugs:
antidepressants, painkillers, sedatives, and stimulants. The four questions used to assess NMUPD
were: “Within the last 12 months, have you taken any of the following prescription drugs that
were not prescribed to you: (1) [Antidepressants (e.g., Celexa, Lexapro, Prozac, Wellbutrin,
Zoloft)]; (2) [Pain killers (e.g., OxyContin, Vicodin, Codeine)]; (3) [Sedatives (e.g., Xanaz,
Valium)]; (4) [Stimulants (e.g., Ritalin, Adderall)]?” Response options for each question were
1) yes or 2) no.

11
Sleep Quality
The dependent variables measured aspects of sleep quality. Specifically, we assessed
sleep quality in the past seven days, as reflected by participants’ experiences with: Enough Sleep,
Early Awakening, Daytime Sleepiness (frequency), Difficulty Falling Asleep, and Problem with
Daytime Sleepiness (magnitude). Two aspects of Daytime Sleepiness have been assessed: the
frequency of feeling sleepy during the day, and the magnitude of feeling sleepy (problem
associated with sleepiness during the day). The following questions were chosen to match the
study aim: 1) Enough Sleep = “On how many of the past 7 days did you get enough sleep so that
you felt rested when you woke up in the morning?”; 2) Early Awakening = “In the past 7 days,
how often have you awaken too early in the morning and couldn’t get back to sleep?”; 3)
Daytime Sleepiness = “In the past 7 days, how often have you felt tired, dragged out, or sleepy
during the day?”; 4) Difficulty Falling Asleep = “In the past 7 days, how often have you had an
extremely hard time falling asleep?”; 5) Problem with Daytime Sleepiness = asked “In the past 7
days, how much of a problem have you had with sleepiness during your daytime activities?”
Response options for the first four questions ranged from zero to seven days; response options
for question five was: 1= no problem at all, 2= a little problem, 3= more than a little problem, 4=
a big problem, and 5= a very big problem.
For analysis purposes, particularly descriptive and Chi-square tests, we grouped each
sleep quality measure into three groups based on the literature (Becker, Adams, Orr, & Quilter,
2008): Enough Sleep (6-7 days = optimal, 2-5 days = middle, and 0-1= poor). Early Awakening,
Daytime Sleepiness, and Difficulty Falling Asleep were coded as: (6-7 days = poor, 2-5 days =
middle, and 0-1= optimal). Finally, Problem with Daytime Sleepiness was coded as: (optimal =
having no problem with sleepiness, poor = combining having a little, more than a little, a big,
and a very big problem with sleepiness during the daytime activities).
12
Covariates
Study covariates (Table 1) included gender, race, age, body mass index (BMI) (obtained
from the reported height and weight), other substance use (i.e. cigarette, alcohol, and marijuana
use in the past 30 days), diagnosed medical disorders (depression, insomnia, ADHD, sleep-
related disorder), and overall perceived stress (participants were asked to rate their overall level
of stress they have experienced in the past 12 months, on a five-point Likert scale ranges from no
stress to tremendous stress). These covariates were included because of known associations with
sleep quality, NMUPD, and to control for any interrelated effects between the proposed
covariates, NMUPD and poor sleep (Hershner & Chervin, 2014; McCabe & Teter, 2007; Tsai &
Li, 2004).
Data Analysis
Descriptive statistics were followed by inferential ordinal regression models to examine
the associations between any NMUPD (antidepressants, painkillers, sedatives, and stimulants) in
the past 12 months, and sleep quality in the past seven days (Enough Sleep, Early Awakening,
Daytime Sleepiness, Difficulty Falling Asleep, and Problem with Daytime Sleepiness) as ordinal
variables; while controlling for the study covariates using SAS 9.4. We excluded gender from the
covariates when modelling based on gender.
Results
Sample characteristics (N=135, 874)
Sample characteristics are displayed in Table 1 (Appendix A). The majority of
participants were female (65.3%), and Non-Hispanic white (68.1%). Around 66% had used
alcohol in the past 30 days, roughly 15% reported smoking cigarettes during last 30 days and
around 15.4% using marijuana during the same period.

13
Sleep and NMUPD
Table 2 (Appendix A) presents participants’ experiences with the five different aspects of
sleep quality in the past seven days; 22% of students reported not getting Enough Sleep (0-1
day/week); 24.3% reported having 2-5 days/week of Early Awakening and could not get back to
sleep; 62.3% reported Daytime Sleepiness for 2-5 days/week; and 28.5% had Difficulty Falling
Asleep during 2-5 days/week. In addition, the majority of students (90%) reported having
Problems with Daytime Sleepiness in the past seven days.
Females (69.6%) reported more frequently than males (30.4%) did that they had 0-1 days
of Enough Sleep; females also reported more days of Daytime Sleepiness (72.7%) than males
(27.3%) for 6-7 days/week. In addition, having 6-7 days of Early Awakening and 6-7 days of
having Difficulty Falling Asleep were higher among females (69.4% and 69%, respectively) than
males (30.6% and 31%, respectively). Having Problem with Daytime Sleepiness was also higher
among females (66.6%) than males (33.4%).
Fourteen percent of students reported NMUPD, in at least one class, in the past 12
months (Table 2). Among those who reported NMUPD, 7.5% reported use of painkillers, 7.4%
use of stimulants, 4% use of sedatives, and 3% use of antidepressants, with females reporting
higher usage than males in all classes.
Associations between NMUPD and sleep
Results of the ordinal regression analysis (Odds Ratio, [95% Confident Interval]) are in
Table 3 (Appendix A). Significant associations were found between NMUPD and sleep
behaviors after adjusting for covariates. Students who reported NMUPD in at least one class of
prescription drugs in the past 12 months had significantly fewer days of getting Enough Sleep
(0.86 [95% CI = 0.83-0.88]), more days of Early Awakening (1.28 [95% CI = 1.24-1.33]),
Daytime Sleepiness (1.23 [1.19-1.26]), and more days of having Difficulty Falling Asleep (1.32

14
[1.28-1.37]). Among students who reported NMUPD, males reported significantly more days of
Early Awakening (1.33 [1.26-1.41]) than females (1.26 [1.21-1.31]), and more days of having
Difficulty Falling Asleep (1.44 [1.36-1.52]), than females (1.26 [1.22-1.31]).
In general, analyses did not differ when analyzing each drug class separately, even after
controlling for covariates. Students who reported NMU of painkillers reported significantly
fewer days of getting Enough Sleep (0.84 [0.80-0.88]), significantly more days of Early
Awakening (1.28 [1.22-1.34]), more days of Daytime Sleepiness (1.16 [1.11-1.22]), and having
Difficulty Falling Asleep (1.27 [1.21-1.33]) (p<.0001). Among painkiller users, males reported
significantly more days of Early Awakening (1.34 [1.24-1.45]) than females (1.24 [1.17-1.31]),
and more days of having Difficulty Falling Asleep (OR=1.33[1.23-1.43]), than females
(OR=1.23[1.23-1.43]).
This pattern was consistent for the NMU of stimulant use with the exception that males
had fewer days of getting Enough Sleep (0.88 [0.82-0.95]), having more days of Early
Awakening (1.15 [1.06-1.25]), and having Difficulty Falling Asleep (1.21 [1.12-1.30]).
Finally, NMU of sedatives was significantly associated with Problem with Daytime
Sleepiness (1.10 [1.03-1.17]), more days of Early Awakening (1.12 [1.05-1.19]), and having
Difficulty Falling Asleep (1.17 [1.09-1.24]). Among sedatives users, only females reported
significantly more days of Early Awakening and Difficulty Falling Asleep (1.14 [1.05-1.24], and
1.18 [1.09-1.27] respectively).
Discussion
To our knowledge, this is the first study that has examined association between NMUPD
(antidepressant, painkillers, sedatives, and stimulants), and sleep quality using a large, national
sample of college students. These results have revealed that poor sleep is highly prevalent among

15
college students across all five measured aspects of sleep quality. The majority of students (90%)
reported Problems with Daytime Sleepiness, and about 62.3% reported Daytime Sleepiness for
2-5 days/week; this is consistent with prior research on poor quality sleep (Tsai & Li, 2005;
Lund et al., 2010). Female students reported poorer sleep quality, and that they felt more tired,
dragged out, or sleepy during the day (Daytime Sleepiness) than did males, suggesting females
have poorer sleep quality than males (Tsai & Li, 2005).
While 14% of students reported NMUPD in the past 12 months, this is less than a
previous report of 20% lifetime use (McCabe et al., 2014). McCabe et al. (2009) reported that
45% of college students had used painkillers, 46% had used sedatives, and 61% had used
stimulants in their lifetime. Among adults, NMUPD has increased from 2.4% to 10.8% between
2007 and 2010 (NCHS, 2014). Nevertheless, the lower prevalence of NMUPD in this study is
likely due to our assessment of NMUPD in the past 12 months as opposed to lifetime use. In
addition, the survey had included the first part of the NMUPD definition (inappropriate use of a
legitimate prescription), the numbers here may have been much higher if the other ways of
NMUPD (e.g. use of medication for reasons, or in ways, or in amounts, not intended by a doctor)
were included in the questions.
Consistent with our expectations, findings confirm a significant association between
NMUPD (during the past 12 months) and poor sleep quality, even after controlling for key
covariates (Babcock & Byrne, 2000; Chong et al., 2013; Clegg-Kraynok ,2010 & 2011;
Dimsadale et al., 2007; Hartwell et al., 2014; Hershner & Chervin, 2014; McCabe et al., 2013).
However, no significant association was found between antidepressants use and poor sleep,
possibly due to the fact that most antidepressant drugs have few short-term effects on sleep and
with longer-term use eventually promote sleep (Wilson & Argyropoulos, 2005). The most

16
consistent short-term effect of antidepressants is on REM sleep ( Lam, 2005; Wilson &
Argyropoulos, 2005). However, some classes of antidepressants may cause insomnia, and
daytime sleepiness in the early stage of treatment (Lam, 2005; Mayers & Baldwin, 2005).
Therefore, the use of antidepressants (either medical use or NMU) during the past year may have
beneficial effects on sleep among both depressed and non-depressed students (Wilson &
Argyropoulos, 2005). However, additional research on the association between antidepressants
and sleep should assess potential risks and benefits of NMU.
In our study, any NMUPD was significantly associated with reduced days of Enough
Sleep; increased days of Early Awakening, Daytime Sleepiness, and having Difficulty Falling
Asleep. Hence, our findings suggest a pattern of poor sleep quality among students who engage
in NMU of any prescription drug class.
Similar to NMUPD overall, NMU of stimulants significantly reduced days of Enough
Sleep; increased days of Early Awakening, Daytime Sleepiness, and having Difficulty Falling
Asleep; which concurs with prior studies of poorer sleep quality, shorter sleep duration, and
sleep disturbances among users than nonusers (Clegg-Kraynok ,2010 & 2011). Thus, our results
support research demonstrating that stimulants increase sleep latency, decrease sleep duration,
and lead to increase sleep disturbance (Babcock & Byrne, 2000; Hershner & Chervin, 2014).
Since stimulants increase dopamine levels in the brain, the result may be a sense of euphoria,
improved mental alertness, focus and concentration, increased physical endurance, reduced
appetite, extended wakefulness, increased energy levels, enhanced self-esteem, and elevated
mood (Caplan, Epstein, Quinn, Stevens, & Stern, 2007; Khantzian, 1997; United States Drug
Enforcement Administration [U.S. DEA], 2015). College students’ use stimulants to stay awake
and study because stimulants delay sleep and increase alertness and wakefulness (Babcock &

17
Byrne, 2000; Clegg-Kraynok, 2010 & 2011; Hershner & Cherwin, 2014). However, regular use
of stimulants may disrupt brain activity where an individual’s cycles between an improving and
worsening mood thereby negatively impacting sleep patterns. Thus, our findings extend
knowledge on the impact of stimulants on sleep patterns and sleep quality among college
students.
NMU of painkillers showed a similar pattern of associations with sleep quality and
duration as did stimulants and overall NMUPD. NMU of painkillers has been found to be
associated with less sleep duration, longer sleep latency, increase trouble sleeping and more
awake time among adults (McCabe et al., 2013; Hartwell et al., 2014). Although opioids (e.g.
hydrocodone, oxycodone, morphine, and codeine) are prescribed to relieve pain as they inhibit
the transmission of pain signals (NIH, 2016b), misuse and abuse is common because they
produce euphoria in addition to pain relief (NIH, 2016; SAMHSA, 2016). Opioid painkillers also
interrupt sleep by increasing wakefulness (which may lead to having difficulty falling asleep),
increasing the number of shifts in sleep-waking states (increasing wake time), decreasing total
sleep time (getting insufficient sleep), and affect sleep stages (reducing deep sleep and increasing
light sleep) (Dimsdale, et al., 2007; Hartwell, et al., 2014).
The interrelated effects between chronic pain/severity, painkillers, and poor sleep quality
in adults and among prescription opioid dependents are supported by previous studies (Dimsdale,
et al. 2007; Hartwell, et al., 2014). Both pain severity and opioid use disrupt sleep (Hartwell, et
al., 2014); however, opioid use disturbs sleep even in pain-free individuals (Dimsdale, et al.
2007). Although our cross-sectional research design precludes temporal conclusions regarding
the role of opioid use in sleep disruption, our analyses did control for sleep-related disorders.

18
Findings highlight the importance of including painkiller use and pain assessments when
assessing sleep quality among college students.
NMU of sedatives was significantly associated with Problem with Daytime Sleepiness;
more days of Early Awakening early; and having Difficulty Falling Asleep. Although our study
controlled for depression, a large body of literature suggests that individuals who engage in
NMU of sedatives also suffer from depression (Conway et al., 2006; Brunette et al., 2003).
Sedatives decrease central nervous system activity (Apantaku-Olajide, 2011) to produce a
drowsy or calming effect. However, risk of addiction is high, especially when used with opioids
and stimulants (SAMHSA, 2009) to compliment the psychoactive (euphoric) effects (Hernandez
& Nelson, 2010).
Sedatives slow brain activity and cause a relaxing effect that is helpful for people with
anxiety or sleep problems, but also cause sleepiness (NIDA, 2016). Therefore, dependence on
and tolerance for NMU of sedatives for euphoric effects can lead to adverse health outcomes,
including sleep disturbance (Chong et al., 2013). Interestingly, sedatives are often refereed to and
used as sleep aids, and the rate of their use is high among those who suffer from short (<5 hours)
and long (>9hours) sleep (Chong et al., 2013). This may be done to compensate for short sleep;
conversely, long sleep is non-optimal and may result from high sedatives use. Regardless,
although the current study cannot be used to deduce causation, the association between NMU of
sedatives and sleep supports the potential for drug use leading to poor sleep quality.
Finally, we found significant gender differences in NMUPD and sleep. Associations were
generally stronger among males for NMU of stimulants and among females for NMU of
sedatives. Possibly these variations can be explained by the following. Though, among the
nonmedical users of stimulants there are more females 61% (5, 881) than males’ (39%, n= 3,

19
781), the physiological characteristics of females may play an important role in the effect of
stimulants which may hinder the impact they may have on sleep. Among sedatives users there
are more females (62%) than males (37%). In addition, females had poorer sleep quality as
shown in our results and previous studies (Tsai & Li, 2004), and suffer from having more days of
Early Awakened and Difficulty Falling Asleep than males which has been exacerbated by
sedative use.
Limitations
Results should be interpreted in the context of several study limitations. These data were
cross-sectional and self-reported, and thus vulnerable to potential recall bias and socially
desirability for subjective measures. The analyses were limited to questions available from this
national survey, specifically the participants’ sleep in the past seven days. Assessing sleep over
just one week may not reflect typical sleep behavior. The ACHA did not include additional
potential confounding variables such as caffeine use, which may also influence sleep patterns
and behaviors (Hershner & Chervin, 2014). Finally, since colleges self-select to participate in the
ACHA survey, results cannot necessarily be considered generalizable to the larger U.S. college
population.
Conclusion
Despite these limitations, our study included several strengths. Among them, the finding
that poor sleep was common in this sample of college students and that these results show
significantly increased odds ratios for poor sleep with NMUPD. Our study extends the current
literature by revealing associations between NMUPD and sleep in terms of several specific
aspects of poor sleep quality, but also among several classes of prescription drugs based on
gender. We submit that assessment of both sleep quality and NMUPD behavior among college

20
students should the other, potentially synergistic, risk factor in screening and treatment initiatives
and research, toward better understanding and improving college students’ sleep health,
productivity, wellness, quality of life, and academic achievement.

21
The Relationship between Sleep Quality and Body Mass Index (BMI) Measures
among a National Sample of College Students
Introduction
BMI/Obesity
Body Mass Index (BMI) is a useful measure of overweight and obesity, and considered
as an important and reliable indicator of obesity prevalence in large populations (Carpenter et al.,
2013; NIH, 2012b). Among adults, BMI is used as a screening tool to identify possible weight
problems (CDC, 2015a; NIH, 2012b). BMI is calculated from a person's weight and height. The
standard weight status categories associated with BMI scores for adults are (CDC, 2015;
NIDDK, 2012): underweight (BMI = < 18.5), normal weight (BMI= 18.5-24.9), overweight
(BMI= 25-29.9), and obese [three classes:1,2, and 3, (BMI of 30 or greater)]. Overweight and
obesity refer to body weight that is greater than what is considered healthy for a certain height
(NIH, 2012b). In the United States, the obesity epidemic is increasing among all age groups and
remains a leading public health problem (Food Research & Action center, 2015). Among adults,
more than two-thirds are considered to be overweight or obese; and more than one-third (or 78.6
million) are obese (CDC, 2015a; NIDDK, 2012; NIH, 2012b).
Overweight and obesity increase the risk for many chronic diseases and health problems
including, but not limited to, coronary heart disease, hypertension, arthritis, diabetes, stroke,
certain cancers, kidney diseases, sleep apnea and respiratory problems (CDC, 2015; U.S.
National Library of Medicine, 2015). Several factors that contribute to weight gain and obesity
include genetics, family, environment, culture, medicine, and sleep, particularly lack of sleep.
Moreover, it has been found that lack of sleep may make it harder to lose weight (CDC, 2015;
NIDDK, 2012).

22
Sleep and BMI/Obesity
Overweight and obesity are also related to sleep problems. Poor sleep in general is
connected to overweight and obesity, as people who sleep less prefer foods that are higher in
calories and carbohydrates, which can lead to overeating, weight gain, and obesity (NIDDK,
2012). In children and adolescents, poor sleep is consistently associated with higher BMI (Magee
& Hale, 2012; Marshall, Glozier, & Grunstein, 2008; Mitchell, Rodriguez, Schmitz, & Audrain-
McGovern, 2013; Patel & Hu, 2008; Storfer-Isser, Patel, Babineau, & Redline, 2012).
Furthermore, it has been found that each additional hour of sleep is associated with decreases in
BMI at different BMI precentiles among children (from 10th to 90th) (Mitchell et al., 2013).
In the adult literature, the association between sleep quality (good or poor sleep) and
overweight or obesity is still unclear. Numerous studies have shown a strong association between
short sleep duration and elevated BMI and increased risk for obesity among adults (Anic, Titus-
Ernstoff, Newcomb, Trentham-Dietz, & Egan, 2010; Bjorvatn et al., 2007; Cappuccio et al.,
2008; Ford et al., 2014; Gangwisch, Malaspina, Boden-Albala, & Heymsfield, 2005; Lauderdale
et al., 2009; Marshall et al., 2008; Moraes et al., 2013; Patel & Hu, 2008; Wheaton et al., 2011).
However, Mezick, Wing, and McCaffery (2014) reported that shorter and less efficient sleep was
associated with increased BMI among women only. On the contrary, Meyer, Wall, Larson,
Laska, and Neumark-Sztainer (2012) found an existing association between sleep duration and
BMI in men, but not women. Other cross-sectional studies either claim a relationship between
long sleep duration and obesity, or no association between either short or long sleep duration and
BMI (Magee & Hale, 2012; Marshall et al., 2008; Nagai, Tomata, Watanabe, Kakizaki, & Tsuji,
2013; Patel & Hu, 2008; Xiang et al., 2009).
Among college students, although with obesity and lack of sleep highly prevalent in this
group, conflicting results in the association between sleep behavior and BMI, overweight, and/or

23
obesity also exist. Identical to studies with adults, the majority correlate short sleep duration with
increased BMI, and increased risk for obesity. For example, Quick et al. (2013) examined the
association between weight-related behaviors (i.e., eating, exercise), sleep duration (short : < 7
hours, adequate: 7-8 hours, and long >8 hours), and BMI of college students (N=1252; 18-24
years) from nine U.S. Universities. The results showed that as sleep duration increased to
adequate number of sleep, BMI declined and physical activity increased. This result supports the
link between short sleep duration and increased BMI. Likewise, Chang and Chen (2014) in their
examination of the association between poor sleep quality, BMI, and health-related physical
fitness among college freshmen, found that poor sleep is associated with higher BMI and low
performance of physical fitness.
In addition, among a sample of 207 college students enrolled at a large southeastern
university, Todigala, Holcomb, and Kanneganti (2008), found that 42.8% of morbidly obese
students and 50.1% of obese students reported usual sleeping hours of five or less. Similarly,
Quick et al. (2013) found that poor sleep and sleep disturbances were significantly and highly
prevalent among overweight and obese students. Moreover, Chen et al. (2013) reported in a
cross-sectional study that staying up at night (few hours of sleep) increases the risk of being
overweight. Likewise, in a prospective study of chronotype (morning [early bed- and wake time
preferences], neutral, or evening types [late bed- and wake time preferences]) as predictors of
increased weight gain and body mass index (BMI) among 137 college freshmen; Culnan, Kloss,
and Grandner (2013) concluded that evening types had a significantly greater BMI gain (p<0.05)
when compared with morning/neutral types. However, Vargas, Flores, and Robles (2014),
included sleep disturbances in the examination of the association between sleep duration and
BMI among a convenience sample of 515 college students. They concluded that only sleep

24
disturbance, and not duration, was associated with overweight status (odds ratio 1.66, 95%
confidence interval [1.08, 2.57]).
Similar to adults, other studies have found no association between sleep behaviors and
BMI, overweight and or obesity among college students (Kamath et al., 2014; Melton, Langdon,
& McDaniel, 2013; Wuertz, Chia, & Lee, 2012). Wuertz et al. (2012) investigated the
relationship between BMI and sleep quality, and between physical activity and sleep quality
among a convenience sample of 68 female students. Results indicated a significant association
between poor sleep and low physical activity, but no association with BMI. In a cross-sectional
analyses, no association was found between sleep duration and BMI (Kamath et al., 2014). In an
investigation of students' sleep disturbances and key demographics (e.g., obesity classification,
gender, race, year in college), sleep disturbance was not found to be a predictor of overweight or
obesity (Melton et al., 2013).
Other studies have examined the relationship between sleep and eating behavior among
college students. Quick et al. (2015) sugget that competent eaters (i.e., intra-individual approach
to eating and food-related attitudes and behaviors) have better overall sleep quality and fewer
sleep-related issues than less competent eaters. Accordingly, it has been concluded that poor
sleep quality and low eating competence were associated with overweight/obesity. Among
female college students, Makino, Hashizume, Yasushi, Tsuboi, and Dennerstein (2006) found
that fewer sleeping hours is one of the most important factors associated with abnormal eating
attitudes. In fact, poor sleepers suffer from high uncontrolled eating behaviors (Shoff et al.,
2009). Uncontrolled eating behaviors can be explained by the fact that short sleep duration
affects appetite regulatory hormones by decreasing leptin and elevating ghrelin, which lead to
increased appetite (Taheri, Lin, Austin, Young, & Mignot, 2004). In addition, Spaeth, Dinges,

25
and Goel (2013) claimed that the weight gain due to sleep restriction (i.e., four hours in bed for a
total of five consecutive nights) resulted from the consumption of extra calories particularly
during late night hours. This is a metabolic explanation of the reported changes in BMI and risk
for obesity due to short sleep duration. Essentially, sleep helps maintain a healthy balance of the
hormones that induce hunger (ghrelin) or feelings of being full (leptin) (CDC, 2015).
Significance and Purpose
Among college students, the association between sleep quality (poor/good) and BMI,
obesity or weight gain is still not sufficiently explored. The studies which have been conducted:
1) presented inconsistent findings, 2) have not controlled for important covariates, such exercise
and diet restriction to lose weight, and 3) most studies have used convenience or selective
samples. Therefore, additional investigation is warranted to examine the relationship between
sleep behavior and BMI among college students with paying intention to important covariates.
The main purpose of this study is to assess students’ sleep quality in relation to BMI using a
large national sample, with a long term objective of clearly supporting the literature that affirms
the association between sleep and BMI, particularly among college students. Consequently,
study results may inform strategies and /or intervention programs to enhance students’ sleep
habits and prevent weight gain and obesity among college students.
Research Question, Aim, and Hypothesis
Research questions
This aim seeks to answer the following questions:
1. Primary Questions:
1.1 Are there differences in sleep quality among the different BMI groups in
a large sample of college students in the United States?
1.2 What is the association between sleep quality and BMI amongst a large

26
sample of college students in the United States?
1.2.1 Does having more days of sleep quality impact BMI amongst a large
sample of college students in the United States?
2. Secondary Questions:
2.1. What is the prevalence of poor sleep amongst a large sample of college
students in the United States?
2.2. What is the prevalence of overweight and obesity amongst a large sample
of college students in the United States?
Aim(s) and hypotheses
1. Primary aims and hypotheses:
1.1. To assess the differences in sleep quality amongst the different BMI
categories amongst a large sample of college students in the United States.
1.2. To assess the association between sleep quality and BMI amongst a large
sample of college students in the United States
1.2.2 To determine whether having more days of sleep quality increase the
chance of decreasing or increasing BMI amongst a large sample of college
students in the United States?
Hypothesis:
1.1 We expect an existence of differences in sleep quality among the different
BMI categories, as poor sleep is expected to be prevalent in the higher levels of BMI
classes (overweight and obesity) than underweight and desired weight groups. The
expected differences may confirm the existence of association between sleep behavior

27
particularly poor sleep and BMI, especially overweight and obesity classes amongst a
large sample of college students in the United States.
1.2 We expect, based on the literature that increases in sleep quality may
associated with decreases in BMI.
2. Secondary aims and hypotheses:
2.1. To assess the prevalence of poor sleep amongst a large sample of college
students in the United States.
Hypothesis: poor sleep is expected to be prevalent amongst a large sample of
college students in the United States.
2.2. To assess the prevalence of overweight and obesity amongst a large
sample of college students in the United States.
Hypothesis: overweight and obesity is expected to be prevalent amongst a large
sample of college students in the United States.
Method
Study design, Data source and Population
This study utilized the fall 2010-spring 2011 National American College Health
Association-National College Health Assessment data (ACHA-NCHA). We were granted access
to these data through a formal request to the American College Health Association. ACHA-
NCHA provides the largest, most comprehensive data on the health of US college students. The
participating institutions in this study include 42 and 129 postsecondary institutions who self-
selected to participate in the fall 2010 and spring 2011 ACHA National College Health
Assessment, respectively, totaling 30,263 (fall, 2010) and 116,254 (spring 2011) surveys
completed by students. However, only schools that surveyed all students or used a random
sampling technique were included in the analysis of ACHA-NCHA. Therefore, the final data set
28
consisted of 30,093 (fall, 2010) and 105,781 (spring 2011) students for a total sample of 135,874
(ACHA, 2011). Nine health topics are covered in the survey including general health; diseases
and injury prevention; academic impact; violence, abusive relationships and personal safety;
alcohol, tobacco, and other drug use; sexual behavior; nutrition and exercise; mental health; and
sleep (ACHA, 2011). Both surveys (Fall 2010 and Spring 2011) have 65 questions with sub
questions that cover a variety of concepts related to the nine health topics. The overall response
proportions were 30.9%, and 28.5 % for Fall 2010 and Spring 2011 respectively. Missing values
(missing at random), n=2, 663 and 20, 419 individuals, were excluded from descriptive analysis
and from inferential analysis, respectively.
Instrumentation
Sleep Quality
The study’s independent variables measured aspects of sleep quality in the past seven
days and in the past 12 months. Specifically, (in the past seven days), we assessed sleep quality
as reflected by participants’ experiences with: Enough Sleep, Early Awakening, Daytime
Sleepiness (frequency), Difficulty Falling Asleep, and Problem with Daytime Sleepiness
(magnitude). Two aspects of Daytime Sleepiness were assessed: the frequency of feeling sleepy
during the day, and the magnitude of feeling sleepy (problem associated with sleepiness during
the day). In the past 12 months, we assessed sleep quality as reflected by participants’
experiences with Sleep Difficulties. The following questions were chosen to match the study
aim: 1) Enough Sleep = “On how many of the past 7 days did you get enough sleep so that you
felt rested when you woke up in the morning?”; 2) Early Awakening = “In the past 7 days, how
often have you awaken too early in the morning and couldn’t get back to sleep?”; 3) Daytime
Sleepiness = “In the past 7 days, how often have you felt tired, dragged out, or sleepy during the
day?”; 4) Difficulty Falling Asleep = “In the past 7 days, how often have you had an extremely

29
hard time falling asleep?”; 5) Problem with Daytime Sleepiness = “In the past 7 days, how much
of a problem have you had with sleepiness during your daytime activities?”; and 6) Sleep
Difficulties= “ Within the last 12 months, has any of the following been traumatic or very
difficult for you to handle: Sleep Difficulties?” Response options for the first four questions
ranged from zero to seven days; response options for question five was: 1= no problem at all, 2=
a little problem, 3= more than a little problem, 4= a big problem, and 5= a very big problem; and
question six has yes or no response options.
For analysis purposes, particularly descriptive and Chi-square tests, we grouped the first
four questions of sleep quality measure into three groups based on the literature (Becker, Adams,
Orr, & Quilter, 2008): Enough Sleep (6-7 days = optimal, 2-5 days = middle, and 0-1= poor).
Early Awakening, Daytime Sleepiness, and Difficulty Falling Asleep were coded as: (6-7 days =
poor, 2-5 days = middle, and 0-1= optimal). Problem with Daytime Sleepiness was coded as:
(optimal = having no problem with sleepiness, poor = combining having a little, more than a
little, a big, and a very big problem with sleepiness during the daytime activities).
Body Mass Index (BMI) (dependent variable)
BMI is the dependent variable that may be influenced by the independent sleep quality
variables. BMI was calculated from the reported height and weight, and is a continuous variable.
The calculation for computing BMI was weight (kg) / [height (m)]2. The continuous BMI
variable was recoded into the following categories identified by the World Health Organization:
Underweight (BMI <18.5), Healthy/Desired Weight (18.5-24.9), Overweight (25-29.9), Class I
Obesity (30-34.9), Class II Obesity (35-39.9), and Class III Obesity (BMI ≥40). Specifically, two
questions were designed to obtain height and weight: 1) “Height in feet and inches?”,

30
participants were asked to indicate their height in feet and inches; 2) “What is your weight in
pounds?”, participants were asked to indicate their weight in pounds.
Covariates
Study covariates (Tables 1b & 1c; Appendix B) include gender, race, age, exercise, diet
and pills to lose weight, Nonmedical use of prescription drugs [NMUPD] in the past 12 months
(Antidepressants, painkillers, sedatives and stimulants), other substance use (i.e. cigarette use,
alcohol use, and marijuana use in the past 30 days), diagnosed medical disorders (depression,
insomnia, Attention deficit Hyperactivity Disorder (ADHD), sleep-related disorder), and overall
perceived stress. These covariates were included because of known associations with sleep
quality, and to control for any interrelated effects between the proposed covariates, poor sleep
and BMI (Hershner & Chervin, 2014; McCabe & Teter, 2007; Tsai & Li, 2004). The specific
questions considered when adjusting for covariates with BMI follow:
Demographics: 1) “What is your gender? ” (Male or Female); 2) “How do you usually
describe yourself?”, responses included: White-not Hispanic, Black-not Hispanic, Hispanic or
Latino, Asian or Pacific Islander, American Indian or Alaskan, Biracial or Multiracial, and
Others; and 3) “What is your age?”.
Drugs/substance use: 1) “Within the last thirty days, on how many days did you use:
Cigarettes?”; 2) “Within the last thirty days, on how many days did you use: Alcohol (beer, wine,
liquor)?” 3) “Within the last thirty days, on how many days did you use: marijuana?”. Responses
were: Never used; have used, but not in last 30; 1 - 2 days; 3 - 5 days; 6 - 9 days; 10 - 19 days; 20
- 29 days; and/or used daily.
The NMUPD: 1) “Within the last 12 months, have you taken any of the following
prescription drugs that were not prescribed to you: [Antidepressants (e.g., Celexa, Lexapro,

31
Prozac, Wellbutrin, Zoloft)]; 2) “Within the last 12 months, have you taken any of the following
prescription drugs that were not prescribed to you [Pain killers (e.g., OxyContin, Vicodin,
Codeine)]; 3) “Within the last 12 months, have you taken any of the following prescription drugs
that were not prescribed to you [Sedatives (e.g., Xanaz, Valium)]; 4) “Within the last 12 months,
have you taken any of the following prescription drugs that were not prescribed to you
[Stimulants (e.g., Ritalin, Adderall)]?” Response options to each question were no or yes. A
separate set of questions asked about the medical use of those drugs of which data was not used
in the present analyses.
Diagnosed medical disorders and the overall stress level: 1) “Have you ever been
diagnosed with Depression?”, responses for this question were no or yes; 2) “Within the last 12
months, have you been diagnosed or treated by a professional for any of the following: Insomnia?”;
3) “Within the last 12 months, have you been diagnosed or treated by a professional for any of the
following: Attention Deficit and Hyperactivity Disorder (ADHD)?”; 4) “Within the last 12
months, have you been diagnosed or treated by a professional for any of the following: Other Sleep
Disorder?”, responses were: no; yes, diagnosed not treated; yes, treated with medication; yes,
treated with psychotherapy; yes, treated with meds+ psychotherapy; and/or yes, other treatment.
And for the overall perceived stress level the question was: “Within the last 12 months, how would
you rate the overall level of stress you have experienced?” the responses were: no stress, less than
average stress, average stress, more than average stress, and/or tremendous stress.
Exercise: 1) “On how many of the past 7 days did you: Do moderate intensity cardio or
aerobic exercises for at least 30 minutes?; 2) “On how many of the past 7 days did you: Do
vigorous intensity cardio or aerobic exercises for at least 20 minutes?” 3) “On how many of the

32
past 7 days did you: Do 8-10 strength training exercises for 8-12 repetitions each?”; responses
for those questions range from 0-7 days.
Exercise, diet and pills to lose weight: 1) “Within the last 30 days, did you do any of the
following: Exercises to lose weight?”; 2) “Within the last 30 days, did you do any of the
following: Diet to lose weight?”; 3) “Within the last 30 days, did you do any of the following:
Vomit or take laxatives to lose weight?”; 4) “Within the last 30 days, did you do any of the
following: Take pills to lose weight?”; no or yes were the responses options.
Data Analysis
Descriptive statistics were followed by Chi-square, ordinal regression models, and linear
regression models, to examine the associations between sleep quality (in the past seven days, and
past 12 months (Enough Sleep, Early Awakening, Daytime Sleepiness, Difficulty Falling Asleep,
Problem with Daytime Sleepiness, and Sleep Difficulty) as ordinal and binary variables and BMI
(as categorical and continuous variables). Chi-square was used to compare BMI categories in
term of sleep quality particularly poor sleep, followed by multivariate ordinal regression to test
the association between sleep quality and the categorical BMI variables, and multivariate linear
regression to test the association between sleep quality and the continuous BMI variable while
controlling for the study covariates using SAS 9.4. We excluded gender from the study
covariates when modelling by gender. The effect size was measured by R value, which is the
square root of R2; correlation was judged as (R=.1: small effect, R=.3: moderate effect, and
R=.5: large effect).
33
Results
Sample characteristics
Table 1 and Figures 1 & 2 (Appendix B) present sample characteristics. Participants
included 86,593 females (65.3%) and 46,062 males (34.7%) students (Mean age=22.0, SD=6.0).
Students were primarily White (68.1%). However, the lowest presentation of ethnicity has been
recorded for American Indian, Alaskan Native, or Native Hawaiian (1.6%) (Table 1a). The
majority of students (65.6%) reported using alcohol in the past 30 days; whereas 15% and
15.4%, respectively, reported cigarette smoking and marijuana use in the past 30 days (Table
1b).
Table 1b, also illustrates the frequencies and percentages of NMUPD [four classes:
Antidepressants, Painkillers, Stimulants, and Sedatives (in the past 12 months)], the diagnosed
medical disorders (in the past 12 months), and the overall perceived stress level. Approximately
14% of students reported the nonmedical use of at least one class of prescription drugs. The
highest usage rates have been reported for painkillers (7.5%; n=9,826), followed by 7.4%
(n=9,661) for stimulants. However, only 4% (n=5,338) reported sedatives use, and 3% (n=4,006)
reported antidepressants use. Gender differences reveal that females have higher usage rates than
males for all the classes; almost as twice as males. For example, 68.5% of antidepressants users
were females, compared to 31.5% males (Figure 2b).
Most students (98.3%) reported stress level of average and above; and approximately
18% reported being diagnosed with depression (Table 1b). In addition, in the past 12 months,
4.4% of students reported being diagnosed and/or treated for ADHD, 3.7% for insomnia, and
only 2% of students have been diagnosed and/or treated for sleep-related disorders (Table 1b). A
34
Females who have reported stress, depression and have been diagnosed and/or treated for
ADHD, insomnia and sleep-related disorders were higher than males, almost double (Figure 2c).
Table 1c, shows three different levels of exercise behaviors (moderate intensity, vigorous
intensity, and strength training exercises) practiced by students in the past 7 days; and four
different ways used by students to lose weight in the past 30 days (exercises, diet, vomit or
taking laxatives, and taking pills). Exercising for 2-5 days/week was reported by most students
for the three different levels of exercises. Among students who did moderate intensity cardio or
aerobic exercises for at least 30 minutes in the past 7 days, 52.8 % exercised for 2-5 days, while
only 10% did for 6-7 days. Vigorous intensity cardio or aerobic exercises for at least 20 minutes
in the past 7 days, have been reported by 39.6% students for 2-5 days, and only 5.4 % of students
who exercised for 6-7 days. In addition, 32% of students practiced 8-10 strength training
exercises for 8-12 repetitions each for 2-5 days/week, and just 3.3% who did for 6-7 days/week.
Females in general had more days of exercises of at various intensity than males, except of doing
8-10 strength training exercises for 8-12 repetitions each for 6-7 days, 54.7% were males
compared to 45.3% females (Figure 2d). The most common reported ways of losing weight were
exercise and diet (54% and 38% respectively) (Table 1c). However, using pills, vomiting or
taking laxatives to lose weight were also reported by 3.4% and 2% (respectively) of students.
Females were more likely than males in using these weight lose strategies (Figure 2e).
Sleep Quality and the Body Mass Index (BMI) description
Table 2 and Figure 3 present participants’ experiences of six different aspects of sleep
quality (in the past 7 days and past 12 months), and the overall BMI and BMI classifications
distribution among students. In the past 7 days, about 22% of students reported not getting
Enough Sleep (0-1 day/week); 24.3% reported having 2-5 days/week of Early Awaken; 62.3%

35
Daytime Sleepiness for 2-5 days/week; and about 28.5% of students had Difficulty Falling
Asleep for 2-5 days/week. However, majority of students (90%) reported having Problems with
Daytime Sleepiness in the past 7 days.
Among all the six aspects of sleep quality, the proportions of females are higher than
males (Figure 3a). For example, females reported less days of having Enough Sleep and more
days of Daytime Sleepiness (72.7%) than males (30.4% and 27.3%, respectively). In addition,
having 6-7 days of Early Awakening and 6-7 days of Difficulty Falling Asleep were higher
among females (69.4% and 69%, respectively) than males (30.6% and 31%, respectively).
Problem with Daytime Sleepiness was also higher among females (66.6%) than males (33.4%).
The overall BMI was 24.2 (SD=5.1); Table 2 and Figure 3e illustrate the distribution of
six BMI classifications (underweight, desired weight, overweight, and three classes of obesity).
Almost a third of students classified as overweight and obese (Figure 3e) distributed as 21.3%
overweight and 11.1% obese students (collectively of the three obesity classes). Distribution of
the BMI classes by gender shows that females have higher percentages than males in all classes
(Table 3d). Among overweight class there were 55.4% females compared to 44.6% males. In
addition, there were more obese females particularly in obesity class 3 (72.2%) than males (27.8
%).
The association between sleep and BMI
Differences in sleep quality among the different BMI classes
The Chi-square test of association (Table 3 a & b Appendix B) reveals significant
bivariate relationships between the different sleep quality aspects and BMI: [Enough Sleep (χ2
(10) = 308.3, p <.0001), Early Awakening (χ2 (10) = 546.0, p <.0001), Daytime Sleepiness (χ2
(10) = 425.7, p <.0001), Difficulty Falling Asleep (χ2 (10) = 678.0, p <.0001), Problem with

36
Daytime Sleepiness(χ2 (10) = 11.9, p <.05), and Sleep Difficulty (χ2 (5) = 403.9, p <.0001).
Students who reported less days of Enough Sleep (0-1 day/week) were more often in the obesity
classes and overweight categories than desired weight. Around 30% of class 3 obesity, 27.6% of
class 2 obesity, 25.5% of class 1 obesity, and 22.6% of overweight were more likely to be poor
sleepers (0-1 day/week of Enough Sleep) compared to 20.1% of desired weight group. Having
more days (2-5 days/week) of Early Awakening were reported by 30% of obesity class 3
students, followed by obesity class 2 (29.7%), obesity class 1(28.9%), and overweight (25.3%)
students, compared to the desired weight group (23%).
Daytime Sleepiness for 6-7 days/week, were reported by 25.7% of class 3 obesity, 22.4%
of class 2 obesity, and 20% of class1 obesity students, compared to only 15% of students in the
desired weight group. However, there was no significant differences among the BMI groups in
relation to having a Problem with Daytime Sleepiness. Obesity classes also have higher
proportions of students reported having 2-5 days/week of Difficulty Falling Asleep (32.4%,
31.4%, and 31.8%, class 3, 2 and 1 respectively) than other groups particularly the desired
weight group (27.8%). Finally, around 26.0%, 30.0, 33.0%, and 38.0% of overweight, obesity
(class1, 2 and 3) respectively reported having Sleep Difficulties in the past 12 months.
Analysis by gender indicated that, in general, there were more females in each BMI
group who reported poor sleep quality than males; except among class obesity 3, there were
more male (33.1%) who reported 2-5 days/week of having Difficulty Falling Asleep than
females (31.9%).

37
The association between the different sleep quality aspects and BMI measures (multivariate
ordinal regression and Linear Regression analyses)
Results of the ordinal regression analysis (Odds Ratio, [95% Confident Interval]) are
presented in Table 4a (Appendix B). Overall significant associations were found between sleep
quality and BMI classes, even after adjusting for covariates. Students who reported having
Problem with Daytime Sleepiness (1.05 [1.00-1.10]), and Sleep Difficulties (1.05 [1.01-1.08])
were significantly more likely to be in the higher BMI classes (overweight and obesity) than
those who did not. In addition, students who reported having more days of Enough Sleep (0.98
[0.98-0.99]) were less likely to be overweight and/or obese. However, students who reported
more days of Early Awakening, Daytime Sleepiness, and Difficulty Falling Asleep also were
significantly more likely to be overweight and obese 1.01(1.00-1.02), 1.03 (1.02-1.04), and 1.04
(1.03-1.05) (respectively), compared to those who reported less days.
Gender differences were found in relation to four aspects of sleep quality. Problem with
Daytime Sleepiness and Sleep Difficulties were significantly associated with the likelihood of
being in the higher levels of BMI categories (OR=1.08, and 1.05; respectively) among females
only. Among males, having more days of Enough Sleep was significantly associated with less
chances of being in the higher levels of BMI categories (OR=0.98). Also, among males only,
students who reported having more days of Early Awakening were significantly more likely to
be in the higher levels of BMI categories (OR=1.02) than those who reported less days.
Results of the multivariate linear regression analysis (Table 4b: Appendix B) reveal a
significant overall relationship between sleep quality and BMI (F (29, 115425) =372.5, p < 0001)
with an R2 of 0.086; even after controlling for covariates. The model explained 8.5% of the
variance in BMI (effect size is R= 0.3, which is moderate). Students’ BMI decreased by 0.02
units for each day increased in getting Enough Sleep. BMI would increase by 0.03 units, for each
38
day increases in getting Early Awakening. When the number of days of Daytime Sleepiness
increases by one day, the average BMI is predicted to increase by 0.10 units. And for each day
increases of having Difficulty Falling Asleep, BMI increases by 0.11 units. The predicted BMI
would be 0.11 units higher for students who had Problem with Daytime Sleepiness than those
who do not. Finally, the BMI is predicted to be 0.13 units higher for students who reported
having Sleep Difficulty in the past 12 months than those who do not have.
When analyzing by gender we found variations with the effects of the following sleep
quality aspects. The effects of having Problem with Daytime Sleepiness, and Sleep Difficulty on
BMI were significant among females only. The BMI is predicted to be 0.22 and 0.16 higher for
female students who had Problem with Daytime Sleepiness and reported Sleep Difficulty
(respectively) than those who do not. However, having more days of Early Awakening is
significant only among males; the BMI would increase by 0.04 units for each day increases in
Early Awakening.
Discussion
This is the first known study to examine the association between six aspects of sleep
quality [Enough Sleep, Early Awakening, Daytime Sleepiness, Difficulty Falling Asleep, and
Problem with Daytime Sleepiness (in the past seven days), and Sleep Difficulties (in the past 12
months)], and BMI using a large national sample of college students. The current known studies
focus on sleep duration (number of hours/days of getting enough sleep). Results revealed that
poor sleep is prevalent among college students in our sample as reflected by six aspects of sleep
quality. The majority of students (90%) reported Problems with Daytime Sleepiness, 69.4%
reported Early Awakening, 28.5 % reported Difficulty Falling Asleep, 24.8 % reported having
Sleep Difficulty, and 22% of students had few days of Enough Sleep/week. Correspondingly, the

39
literature affirmed the prevalence of poor sleep among college students, with more than 60%
classified as poor quality sleepers (Tsai & Li, 2005; Lund et al., 2010). Female students in our
sample reported poorer sleep in each aspect of sleep quality, supporting previous research
suggesting females report poorer sleep quality than males (Tsai & Li, 2005).
Overweight and obesity were also prevalent among students in our sample, almost one
third of students were classified as overweight and obese. Previous studies reported that more
than two-thirds of U.S. adults are considered to be overweight or obese (CDC, 2015a; NIDDK,
2012; NIH, 2012b).
Poor sleep has been consistently connected with higher BMI (overewight and obesity),
in children and adolescents (Magee & Hale, 2012; Marshall, Glozier, & Grunstein, 2008;
Mitchell, Rodriguez, Schmitz, & Audrain-McGovern, 2013; Patel & Hu, 2008; Storfer-Isser,
Patel, Babineau, & Redline, 2012). In adult literature, although the association is still unclear and
inconsistent, several studies have shown a strong association between poor sleep quality
(particularly shorter sleep duration) and elevated BMI and increased risk for obesity (Anic, Titus-
Ernstoff, Newcomb, Trentham-Dietz, & Egan, 2010; Bjorvatn et al., 2007; Cappuccio et al.,
2008; Ford et al., 2014; Gangwisch, Malaspina, Boden-Albala, & Heymsfield, 2005; Lauderdale
et al., 2009; Marshall et al., 2008; Moraes et al., 2013; Patel & Hu, 2008; Wheaton et al., 2011).
Consistent with study expectations and current literature, our findings also confirm the existence
of significant association between poor sleep quality (short and long term) and BMI, even after
controlling for key covariates.
Chi-square results show differences among the different BMI categories in terms of poor
sleep quality of six sleep aspects. At least a quarter of obesity class 1, class 2, class 3, and
overweight students reported having Sleep Difficulties in the past 12 months, less days of

40
Enough Sleep (0-1 day/week), more days (2-5 days/week) of Early Awaken, more days of
Daytime Sleepiness for 6-7 days/week, and more days (2-5 days/week) of having Difficulty
Falling Asleep. In line with the literature, poor sleep quality was prevalent among overweight
and obese students. Todigala, et al (2008) found that students who reported usual sleeping hours
of five or less per night were high among overweight and obese classes. In addition, Quick et al.
(2013) found that poor sleep and sleep disturbances (i.e Early Awakening, Difficulty Falling
Aleep, Daytime Sleepiness, and Sleep Difficulties) were significantly and highly prevalent
among overweight and obese students.
The multivariate regression models (ordinal logesitic and linear) also confirmed the
association between the six aspects of sleep quality and BMI, even after controlling for key
covariates. However, the overall effect is significantly weaker once the covariates are included in
the model. Overall, poor sleep qulity was significantly associated with overweight and obesity in
the logistic regression analysis. Most significantly (with the highest odds), the likelihood of
being overweight or obese is higher for studnets who had Problem with Daytime Sleepiness (in
the past seven days) and had Sleep Difficulties (in the past 12 months) than those who did not
have. In addition, students who had more days of Enough Sleep were less likely to be overweight
and/or obese. Students who reported more days of Early Awakening, Daytime Sleepiness, and
Difficulty Falling Asleep, although the odds were small, they still significantly have higher
chances of being overweight and /or obese compared to those who reported less days. In the
linear regression analysis poor sleep quality was conncetd to increases in the BMI measures.
While having more days of enough sleep (good sleep quality) was associated with decreases in
BMI. Increasing in the number of days of Daytime Sleepiness, Difficulty Falling Asleep, Early

41
Awakening were connected with increasing in BMI. In addition, increase in BMI among students
was also related to having Problem with Daytime Sleepiness and Sleep Difficulty.
Although, the current literature among college students have conflicting results in the
association between sleep quality and BMI, our findings support the literature that correlates
short sleep duration with increased BMI, and increases risk for overweight and obesity (Anic, et
al. 2010; Bjnorvatn, et al. , 2007; Chang and Chen, 2014; Culnan, et al., 2013; Gangwisch et al,
2005; Ford, et al, 2014; Mitchell et al., 2013; Mezick, et al., 2014; Quick et al., 2013). For
example, Ford, et al (2014) reported that short sleep duration was associated with increased
BMI, and short sleepers were more likely to be obese. Similarly, Chen et al. (2013) reported that
having few hours of sleep increases the risk of being overweight. Mitchell et al. (2013) and
Quick et al. (2013) concluded that as sleep duration increased, BMI declined. In addition, the
association between sleep disturbances (including Early Awakening, Daytime Sleepiness,
Difficult Falling Asleep, Problem with Daytime Sleepiness, and Sleep Difficulty) and the
increased BMI in our results, is in line with, Chang and Chen (2014), Mezick, et al., (2014), and
Quick et al. (2013) Vargas, Flores, and Robles (2014). For example, Quick et al. (2013) reported
that poor sleep quality and sleep disturbances were significantly and highly prevalent among
overweight and obese students. Chen et al. (2013) concluded that few hours of sleep per night
increases the risk of being overweight. And finally, Vargas, et al. (2014), pronounced that only
sleep disturbances, and not duration, were associated with overweight.

42
Interestingly, we have found variation in the association between sleep quality and BMI
when analysing by gender consistently in both regression models. Problem with Daytime
Sleepiness and Sleep Difficulties were significantly associated with the risk of being overweight
and obese among females only. A possible explanation for this variation may be related to the
fact that in our results, there were more females than males who reported having Problem with
Daytime Sleepiness and Sleep Difficulty. In addition, more females were in the overweight and
obesity classes than male. However, having more days of Enough Sleep was significantly
associated with less chances of being overweight and obese for males but not females. Also,
among males only, students who reported having more days of Early Awakening were
significantly more likely to be overweight and obese than those who did not. Gender variation in
our results concurs with previous reports. Conflicting results have been noted in the literature
regarding gender differences. Mezick, et al., (2014), Anic, Titus-Ernstoff, Newcomb, Trentham-
Dietz, & Egan, (2010), claimed the association between poor sleep quality and BMI, overweight
and/or obesity to be among female only as opposed to Meyer, et al., (2012) & Wuertz et al.
(2012).
In fact, there is a metabolic explanation of BMI changes and risk for obesity due to short
sleep duration. Essentially, good sleep quality helps maintain a healthy balance of the hormones
that induce hunger (ghrelin) or feelings of being full (leptin) (CDC, 2015). Poor sleep
(particularly short sleep duration) affects appetite regulatory hormones by decreasing leptin and
elevating Ghrelin, which leads to increased appetite (Taheri, Lin, Austin, Young, & Mignot,
2004). In addition, Spaeth, et al. (2013) claimed that the weight gain due to poor sleep duration is
related to the consumption of extra calories, particularly during late night hours. In general, it has
been asserted that poor sleepers suffer from high uncontrolled eating behaviors (Shoff et al.,

43
2009). This fact introduce eating behavior as an important factor that may play a mediator role in
the association between sleep quality and BMI. However, data regarding eating behavior was not
availabel in the secondary data we analysed, we recommended to be considered in future studies.
Finally, we were able to include weight loss behaviors (exercises, diet, vomit or take
laxatives, and take pills) among students as covariates in the regression model. As a result, we
found with no significant association between sleep quality and BMI except for Daytime
sleepiness and Difficulty Falling Asleep. The BMI would be increased by 0.08 and 0.09 units for
each day increases of having Daytime Sleepiness and Difficulty Falling Asleep (respectively).
The effects of the other sleep quality aspects on BMI may be hindered by including weight loss
behaviors which may explain the mederator effects of losing weight. These may have effects on
sleep quality in addition to the direct relationship with BMI.
Limitation
Study limitations are noted here. First, we utilized a cross-sectional research design,
thus, causal relationships between study variables cannot be determined. Second, because results
are based on self-reported data, potential recall bias including participants’ desire to report
socially desired behaviors and reluctance to report undesirable behavior may occur. Third, this
study relies upon the subjective measure of sleep behavior and not on objective measures such as
polysomnography which provides a more accurate and holistic picture of sleep. Finally, since
colleges self-select to participate in the ACHA survey, results cannot necessarily be considered
generalizable to the US college population. Therefore, further investigation of the association
between sleep quality and BMI among college students that take into consideration the identified
limitation is recommended.

44
Conclusion
In conclusion, poor sleep was common in this sample of college students and study
results suggest that poor sleep (short and long term) quality significantly increases the predicted
values of BMI and increases the risk of being overweight and obese. Our study extends the
current literature that support the association between poor sleep quality (including short sleep
duration) and elevated BMI. Therefore, investigations or interventions concerning college
student overweight/obesity should include screening for sleep quality to promote healthy weight.
Study results also highlight gender differences that should also be incorporated into efforts to
better understand and to improve college students’ health, sleep health, productivity, wellness,
quality of life, and academic achievement.

45
A Theory-based Description of Sleep Quality and Its Impact on Health-Related
Quality Of Life Using Health Belief Model and Behavioral Intention among a Sample of
WVU Undergraduates Students
Introduction
Health Belief Model and Theory of Planned Behavior
The Health Belief Model (HBM) and the Theory of Planned Behavior (TPB) are two of
the most common social and behavioral theories used to explain and/or predict health-related
behavioral determinants, and guide the development and implementation of health promotional
and educational interventions (Painter, Borba, Hynes, Mays, & Glanz, 2008). Social and
behavioral theories can play a significant role in changing behaviors, and it has been
demonstrated that public health interventions based on theories are more effective and powerful
than those without (Glanz & Bishop, 2010; Glanz, Rimer, & Viswanath, 2008). Both the HBM
and TPB have been used widely to understand behaviors and to inform interventions; both
theories have been supported for their ability to successfully predict behaviors in a wide range of
health behaviors including, for example, HIV prevention behaviors, mammography,
immunization, screening, dieting, smoking, and substance use (Abood, Black, & Feral, 2003;
Bashirian, Hidarnia, Allahverdipour, & Hajizadeh, 2012; Glanz & Bishop, 2010; Glanz et al.,
2008; Painter et al., 2008; Taylor et al., 2006).
Theory based description/prediction of sleep quality
Sleep quality (good/healthy or poor sleep) are outcomes of sleep practice (sleep
behavior). Sleep behavior (also called sleep hygiene) refers to practicing behaviors that facilitate
sleep, in order to have normal, quality nighttime sleep and full daytime alertness (NSF, 2015;
Riedel, 2000). Therefore, promoting good sleep quality should be based on strategies directed at

46
sleep behaviors including applying social and behavioral theories to describe, predict, and or
promote healthy sleep practice. However, to the best of the authors’ knowledge, sleep research
lacks the explanation and prediction of sleep quality, and thus potential interventions based on
contemporary science. Extant studies using both theories primarily focus on sleep disorders as
opposed to sleep hygiene and behaviors. A review of those studies follows in the literature
section of this paper.
Significance and Purpose
The sleep literature is still indigent in terms of the application of both TPB and HBM and
few studies have theoretically described sleep quality among college students using both theories
(e.g., Knowlden & Sharma, 2014). In addition, there is also no evidence of an integrated
behavioral model using constructs from both HBM and TPB to describe and promote sleep
quality among adults or college students. Thus, there is a dearth of health behavior theoretical
research exploring the behavioral determinants of sleep among college students. It is crucial to
theoretically examine and describe sleep in order to better understand sleep quality, their
behavioral determinants, and predict sleep related problems among college students. Such
research may lead to improved understanding and establish appropriate strategies and/or
interventions to enhance students’ sleep quality.
This is the first known study that will use an integrated theoretical framework to assess
sleep quality among college students. The main purpose of this study is to describe college
students’ sleep and their behavioral determinants using behavioral constructs from both the TPB
and HBM as an integrated theoretical framework. Additionally, this study will assess the
association between sleep quality, particularly poor sleep and health related quality of life
[HRQOL] (as physical and mental health perceptions and their correlates) among a sample of
47
college students from West Virginia University (WVU).
Research questions, Aims, and Hypotheses
Research questions,
This research is specifically guided by the following questions:
1. Primary Question:
1.1. Do HBM including perception constructs, and the the behavioral intention of TPB
describe and/or predict students’ sleep quality, amongst a sample of WVU college
students?
2. Secondary Questions:
2.1. What is the association between sleep quality and HRQOL amongst a sample of WVU
college students ?
2.2. What is the prevalence of poor sleep quality amongst a sample of WVU college
students?
Aim(s) and hypotheses:
1. Primary aim and hypothesis:
1.1. To explain/predict WVU students’ sleep habits using the HBM perception constructs:
(perceived susceptibility, perceived severity, perceived barriers, and perceived benefits),
and the behavioral intention from the TPB, as an integrated framework.
Hypothesis: Students’ sleep behavior can be described and or predicted by HBM and
behavioral intention constructs.
2. Secondary aims and hypotheses:
2.1. To examine the association between poor sleep quality and HRQOL as reflected by
measuring unhealthy days amongst a sample of WVU college students.
Hypothesis: poor sleep quality is associated with having more days of unhealthy days which

48
reflect poor HRQOL.
2.2. To assess the prevalence of poor sleep amongst a sample of WVU students.
Hypothesis: Poor sleep is prevalent among WVU students.
Description of the proposed theoretical framework
Elements of the framework
The framework/model consists of the folowing:
• External factors (Gender, Race, and Year of enrollment).
• HBM constructs (perceived threat, perceived benefits, and perceived barriers).
• TPB construct (behavioral intention).
• Sleep Quality (good or poor sleep).
• Unhealthy Days (HRQOL).
Sleep behavior among college students can be determined by:
• Perception, including perceived susceptibility of being poor sleepers, perceived
severity of poor sleep and its associated health outcomes, perceived benefits of having a
good night sleep, the barriers of getting good sleep (HBM)
• The perceived likelihood of performing a healthy sleep behavior (behavioral
intention) (the TPB construct).
• In addition, the proposed framework comprises some of the important factors
considered as external variables to be controlled; gender, race, and year of enrollment.
These constructs have been integrated in the theoretical framework to assess their
contribution to sleep quality and HRQOL among college students; in order to, explained and
predicted students’ sleep. The model is hypothesized to describe the behavioral determinants of
sleep quality; therefore, two theories have been integrated in the model. Figure 1 illustrates how
sleep behavior can be influenced by those behavioral constructs in addition to some important

49
external factors, leading to either good or poor sleep quality, and their impacts on HRQOL-
Unhealthy days.
Conceptual and operational definitions of the Model’s elements:
External factors
Demographic variables are considered as modifying factors that may indirectly affect the
desired behavior such as sleep by influencing the constructs of perception (threat, benefits, and
barrier) and behavioral intention, and then indirectly affect others in the model.
HBM Constructs
Perception includes perceived threat (susceptibility & severity), perceived benefits, and
perceived barriers. Perceived threat is a combination of both perceived susceptibility and
perceived severity. Perceived susceptibility or perceived vulnerability refers to ones’ own belief
and opinion about the possibility of getting an illness or condition (e.g. poor sleep quality)
(Glanz et al., 2008). Perceived severity is the perception of the significance, seriousness and
consequences of getting an illness, or leaving it untreated (e.g. poor sleep quality), including

50
evaluation of medical cost (pain, disability, or death), and social costs (effects on work, school,
family and social relations) (Glanz et al., 2008). Perceived benefits refers to the belief of the
potential benefits of the recommended action (e.g. healthy/good sleep) in reducing the risk or
severity of potential disease (reducing threat). Benefits may involve medical, financial, and
social and family lives (Glanz et al., 2008). Finally, perceived barriers refer to the perception of
the potential negative aspects of a particular health behavior/action including financial and
psychosocial costs (Glanz et al., 2008).
Operationally, these constructs are defined according to the definitions developed by
Knowlden and Sharma (2014), with some modifications based on the purpose of this study.
Originally, the HBM constructs were operationalized in relation to adequate sleep behavior.
However, for this study they will be operationalized in relation to sleep quality, which refers to
both adequate sleep (getting the recommended sleeping hours), and aspects of sleep quality as
reflected by the Pittsburgh Sleep Quality Index [PSQI] (Buysse et al.,1989). The PSQI is
considered as the “gold standard”.
Perceived susceptibility is operationalized in terms of both the short- and long-term
outcomes of poor sleep such as sleep disorders (e.g. sleep apnea, insomnia, narcolepsy, and
restless legs syndrome); several negative behavioral and health outcomes (including substance
use, physical inactivity, violence, mental disturbances, suicide attempts, overweight or obese
status, chronic diseases including heart disease, drowsy driving, and risk for accidents and
injuries); and poor school performance and lower average school grades. Accordingly, it can be
defined as a student’s own belief and opinion about the possibility of getting one or more of the
associated negatives outcomes. Perceived severity is operationalized within the context of the
personal vulnerability to the short- and long-term outcomes of poor sleep. Hence, it can be

51
defined as student’s perception of the significance, seriousness and consequences of getting one
or more of the associated negative outcomes.
The construct of perceived benefits is operationalized in terms of student’s viewpoints of
the personal short and long-term rewards in relation to health, energy levels, and school
productivity acquired from achieveing good sleep quality. It can be defined as student’s belief of
the potential rewards of practicing healthy sleep in avoiding or reducing the risk or severity of
the potential negative outcomes. Finally, the construct of perceived barriers operationally refers
to the perspective pressures that are considered as obstacles for achieving good sleep quality,
such as academic and employment responsibilities.
Behavioral Intention (TPB Construct)
Behavioral intention is the perceived likelihood of carrying out the behavior (Glanz et al.,
2008). Behavioral intention is operationalized according to Knowlden (2011), and willo be
measured as the intention to perform healthy sleep behavior to obtain good sleep quality.
Sleep Quality
Sleep quality is an overall outcome of sleep habits/behaviors as either good or poor sleep
quality. Sleep quality among adults can be defined as getting the recommended 7-8 hours of
sleep (sleep duration) with good indices of sleep quality per night (CDC, 2013; NIH, 2012a).
However, poor sleep quality can be explained as getting less or more than the recommended
range of sleeping hours between 7 and 8, with poor indices of sleep quality per night (CDC,
2013; NIH, 2012a). Sleep quality indices, as an important criterion of the overall sleep quality,
can be defined as subjective indices of sleep, and largely include the following concepts or
aspects: falling asleep and sleep latency, depth of sleep, how well rested one feels upon
awakening, problem with sleepiness during daytime activities (such as feeling tired), daytime

52
sleepiness, awakening time (number of arousal), and the general satisfaction with sleep (Buysse
et al., 1989).
Health-related quality of life
In general, quality of life is a broad concept that incorporates all aspects of life including
an overall sense of well-being, aspects of happiness, and satisfaction with life as a whole (CDC,
2000, 2011a). There are several key aspects that constitute the overall quality of life, including
for instance health, jobs, housing, schools, the neighborhood, and aspects of culture, values, and
spirituality (CDC, 2000). In this study, we assessed HRQOL (physical and mental health
perceptions and their correlates). HRQOL was defined as an individual’s or group’s perceived
physical and mental health over time (CDC, 2011a).
Model assumptions
The model assumes a relationship between the external factors, the constructs, sleep
quality, and HRQOL, as shown in Figure 1, (p 56). The effect on the desired behavior (sleep
quality) that needs to be developed, modified or changed starts with the external factors. External
factors such as demographics may directly influence perceptions (threat, benefits, and barrier). In
turn, perceptions may directly or indirectly (behavioral intention) impact sleep quality. Directly,
student’s perception of being at risk of getting sleep related disorder and the associated
complications (perceive threat), can lead one to consider the benefits of taking actions including
avoiding the threat (e.g., avoiding sleep disorders when developing healthy sleep behaviors), and
getting other positive outcomes such as having a healthy and active lifestyle. Perceived threats
and perceived benefits of taking a particular sleep behavior, may lead to outweighing the
potential benefits associated with good sleep quality, with the factors that prevent from getting
good sleep quality (such as sleep related factors, work/study load, time, and/or being unpleasant
to go early to bed). Indirectly, the influence of perception may be mediated through behavioral

53
intention. Students’ intentions to perform healthy sleep behavior or not will be affected by their
perceptions. Finally, good and poor sleep may impact students’ HRQOL.
Literature Review
Model’s external factors and sleep (first research question)
Race/Ethnicity
Different ethnic groups exhibit different sleep behaviors. For example, Ruiter, Decoster,
Jacobs, and Lichstein (2011) found significant ethnic differences in relation to good sleep quality
in a meta-analysis of an adult population. African-Americans have poorer sleep continuity and
duration, less stage 3 sleep (NREM 3: slow wave sleep or deep sleep), and a greater proportion
of stage 2 sleep (NREM 2: light sleep) than Non-Hispanic Whites (NHW). Moreover, Mezick et
al. (2008) examined the influence of race and socioeconomic status on sleep among adults, and
found that African-Americans had shorter sleep duration and efficiency, and may be at risk for
sleep disturbances and associated health consequences. In addition, Grandner et al. (2010)
reported in their assessment of the general sleep complaints (reporting trouble falling asleep,
staying asleep or sleeping too much), that Asians had the least rate of complaints, while NHWs
have more sleep complaints. The rate of sleep complaints of Hispanic/Latino and African-
Americans were more than Asians and less than NHWs. Conversly, it has been stated that
African American and Asian students sleep better than White and Latino students (Gaultney,
2010). Phillips and Mannino (2005) asserted that African-Americans have reduced risk of sleep
complaints. Moreover, according to the CDC (2015), short sleep duration was found to be more
common among non-Hispanic Blacks compared to non-Hispanic Whites.
Gender
Studies that examine gender differences in relation to sleep report contradictory findings.
The majority of literatures state that women sleep longer than men, but with lower sleep quality

54
(Burgard, Ailshire, & Hughe, 2010; Burgard & Ailshire, 2012; Natal et al., 2009; Tsai & Li,
2004). Among college students, female students report earlier bed time and getting up, longer
sleep latency and sleep duration, more awakenings, and poorer sleep quality than males (Sweileh
et al., 2012; Tsai & Li, 2004). Furthermore, Wuertz et al. (2012) concluded that sleep problems
are highly prevalent among college women. However, Ohayon (2004) found that among the
elderly (between 55 and 101years old) sleep duration was longer in men than in women. In
addition, Oginska and Pokorski (2006) found that females reported a greater need of sleep than
males, and suffer from a higher level of daytime sleepiness; consequently, they may be more
severely affected by chronic sleep loss than males.
SES (for both research questions)
Socioeconomic status has been found to be strongly associated with both subjective and
objective sleep quality (Friedman et al., 2007). Higher household income and more years of
education have been found to be significantly associated with reduced sleep latency (time taking
to fall asleep) and increased sleep efficiency (refers to the quality of sleep) (Friedman et al.,
2007). However, lower socioeconomic status has been connected to sleep complaints (as defined
as trouble falling asleep and longer sleep latency, wake up repeatedly during the night, and wake
up with a feeling of exhaustion and fatigue), and poorer sleep quality (Mezick et al., 2008;
Phillips & Mannino, 2005). In an examination of the general sleep complaints (reporting trouble
falling asleep, staying asleep or sleeping too much), Grandner et al. (2010) found that lower
income is related to more reported sleep complain. In addition, children from low-SES families
have been found to have poor sleep quality due to parental depression and family conflicts
(Buckhalt & El-Sheikh, 2013). Likewise, Mezick et al. (2008) affirm that individuals in lower
SES groups may be at risk for sleep disturbances. Several environmental factors (outside noise,
room temperature, and health worries) and emotional factors (depression, anxiety, and hostility)

55
contribute to poor sleep quality among individuals of lower SES (Mezick et al., 2008).
Other key important covariates (second research question)
Knowledge
Knowledge and awareness of healthy sleep, including significance of sleep and the
required amount of sleeping hours per night, shape the perception an individual may have
regarding his/her sleep behavior. Studies that examined the role of knowledge in predicting
sleep quality are varied, ranging from no or weak associations to strong associations. For
example, in a cross-sectional study of sleep quality among university students, Suen, Tam, and
Hon (2010) stated that knowledge has a non-significant effect on sleep quality, and claimed that
knowledge in regard to proper sleep habits/behavior does not necessarily impact sleep quality.
However, in an examination of the association between sleep behavior awareness and sleep
quality among college students, Brown, Buboltz, and Soper (2002) found a weak association
between knowledge of sleep behavior and good sleep quality. On the other hand, in a community
population of adults who have been identified as poor sleepers, sleep knowledge was found to be
a significant predictor of sleep behavior and better sleep quality (Gallasch & Gradisar, 2007). In
a motivational school-based intervention for adolescent sleep problems, Cain, Gradisar, and
Moseley (2011) stated that as a result of sleep education, students became more motivated to
regulate their out-of-bed times, and increase their average total sleep time to 9 hours. In another
educational program conducted by Azevedo et al. (2008) among high school and university
students, some aspects of sleep knowledge such as nap frequency and bedtime schedule were
promoted due to sleep educational programs. Subsequently, students’ sleep behavior such as
taking a nap and regulating bed time improved.
Sleep related factors
Acccording to Harvard Medical School (2007), sleep quality and quantity can be
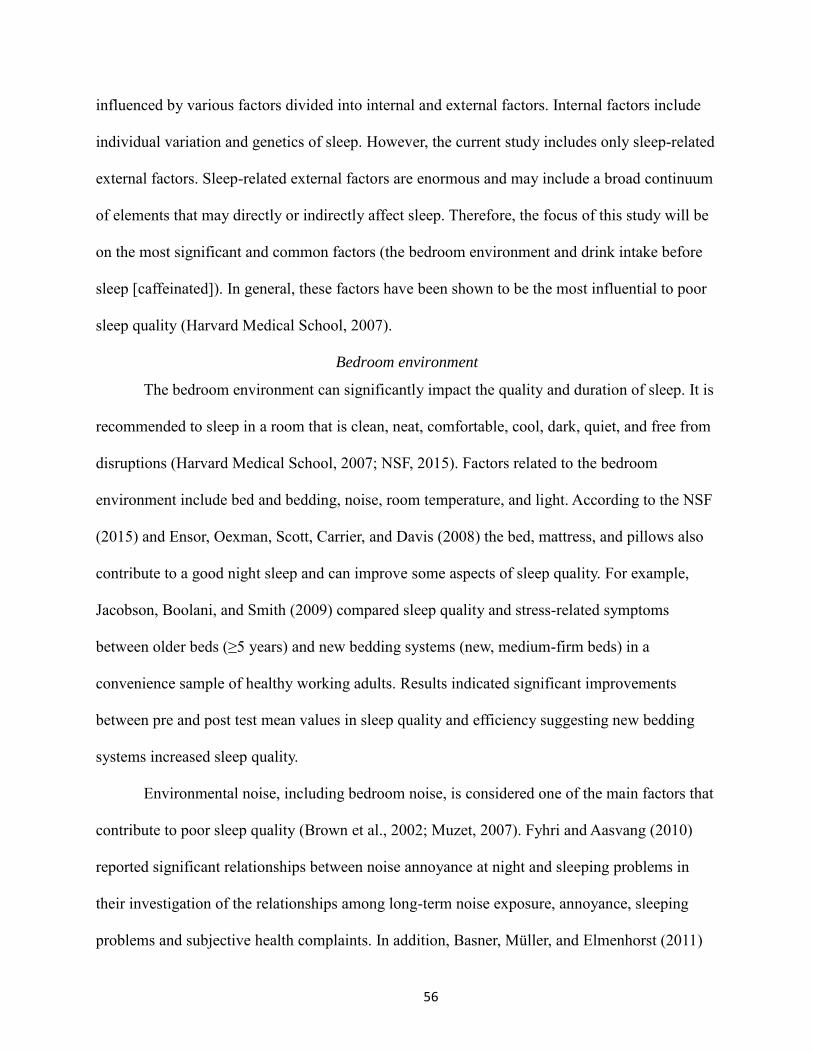
56
influenced by various factors divided into internal and external factors. Internal factors include
individual variation and genetics of sleep. However, the current study includes only sleep-related
external factors. Sleep-related external factors are enormous and may include a broad continuum
of elements that may directly or indirectly affect sleep. Therefore, the focus of this study will be
on the most significant and common factors (the bedroom environment and drink intake before
sleep [caffeinated]). In general, these factors have been shown to be the most influential to poor
sleep quality (Harvard Medical School, 2007).
Bedroom environment
The bedroom environment can significantly impact the quality and duration of sleep. It is
recommended to sleep in a room that is clean, neat, comfortable, cool, dark, quiet, and free from
disruptions (Harvard Medical School, 2007; NSF, 2015). Factors related to the bedroom
environment include bed and bedding, noise, room temperature, and light. According to the NSF
(2015) and Ensor, Oexman, Scott, Carrier, and Davis (2008) the bed, mattress, and pillows also
contribute to a good night sleep and can improve some aspects of sleep quality. For example,
Jacobson, Boolani, and Smith (2009) compared sleep quality and stress-related symptoms
between older beds (≥5 years) and new bedding systems (new, medium-firm beds) in a
convenience sample of healthy working adults. Results indicated significant improvements
between pre and post test mean values in sleep quality and efficiency suggesting new bedding
systems increased sleep quality.
Environmental noise, including bedroom noise, is considered one of the main factors that
contribute to poor sleep quality (Brown et al., 2002; Muzet, 2007). Fyhri and Aasvang (2010)
reported significant relationships between noise annoyance at night and sleeping problems in
their investigation of the relationships among long-term noise exposure, annoyance, sleeping
problems and subjective health complaints. In addition, Basner, Müller, and Elmenhorst (2011)

57
found single and combined effects of road, rail, and air traffic noise on both objective and
subjective assessments of sleep quality. Night-time exposure to traffic noise or low frequency
noise has been found to be associated with subjective reports of lower sleep quality (Waye, Clow,
Edwards, Hucklebridge, & Rylander, 2003). Gellis and Lichstein (2009) have found in their
comparison of sleep hygiene practices (sleep behavior) between good and poor sleepers that,
excessive noise and uncomfortable night-time temperature have been reported by poor sleepers.
The effect of the thermal environment is linked to the thermoregulation, which affects the
sleep regulating mechanism. Heat exposure can affect sleep stages by decreasing REM and slow
wave sleep and then increased wakefulness while exposure to cold does not impact sleep, and
that may be related to the use of clothes, bedding and blankets (Okamoto-Mizuno & Mizuno,
2012). In fact, body temperature rhythm has been associated with different types of insomnia
symptoms (Lack, Gradisar, Van Someren, Wright, & Lushington, 2008). Light (both natural and
artificial), particularly the exposure to room light, affects sleep directly by suppressing the
production of the melatonin hormone that helps to induce sleepiness and regulates the
sleep/wake cycle (Gooley et al., 2011; Schlangen, 2014). It has been reported that the circadian
cycle is enhanced by the daytime light, which also makes the rhythm earlier (lead to early sleep).
However, evening light delay the sleep/wake rhythm (lead to late sleep) (Schlangen, 2014).
Drinks
Drinks, particularly caffeinated drinks, energy drinks, and alcohol have been linked to
sleep quality and duration. Caffeine increases sleep latency and alertness, and decreases
sleepiness, which in turn affect sleep duration (Hershner & Chervin, 2014). Daytime sleepiness
also associated with increased consumption of caffeinated drinks such (Tran et al., 2014).
Consumption of energy drinks is also associated with poor sleep quality (Sanchez et al., 2013).
Malinauskas, Aeby, Overton, Carpenter-Aeby, and Barber-Heidal (2007) reported that about

58
51% of their sample of 253 college students consume more than one energy drink per month
contributing to their poor sleep. Alcohol use, specifically binge drinking (at least 4–5 drinks in a
row), has been found to have a significant positive association with sleep problems in both
adolescents and adults; as binge drinking increases, more sleep problems occur (Popovici &
French, 2013). Consumption of alcohol is linked to different aspects of sleep quality, sleep
duration, and bedtime delay (Chaput et al., 2012; Kenney et al., 2012; Singleton & Wolfson,
2009). Lund et al. (2010) found that alcohol consumption is high among poor sleepers to induce
and regulate their sleep. However, alcohol has a shortening effect on sleep latency, but then
causes disrupted sleep (fragmented) in later sleep stages, which may lead to both poor sleep
quality and short sleep duration (Hershner & Chervin, 2014). In addition, students who
frequently drink alcohol have sleep problems including later bedtimes especially on the
weekend, less nighttime sleep, and daytime sleepiness (Ehlers et al., 2010; Singleton & Wolfson,
2009). Galambos et al. (2009) suggest a decrease in both sleep quality and quantity (duration)
occur after alcohol usage. Conversely, Chaput et al. (2012) and Kenney et al. (2012) reported
that poor sleep quality and/or sleeping less than 6 hours per day lead to greater alcohol intake.
HBM, Behavioral intention and Sleep
HBM Perception Constructs and sleep
HBM constructs have a combined and single influence on the likelihood of taking a
recommended health action. High perceived threat, high benefits and low barriers together can
lead to a high probability of taking the action (Sutton, 2002). Studies show that perception
constructs were powerful and consistent significant predictors of behavior. Perceived
susceptibility was a stronger predictor in preventive health behavior while perceived severity was
a less powerful but consistent predictor (Carpenter, 2010; Glanz et al., 2008; Sutton, 2002). The
HBM was used by Olsen, Smith, Oei, and Douglas (2008) in 77 patients newly diagnosed with

59
obstructive sleep apnea to test the contribution of the constructs in the prediction of continuous
positive airway pressure (CPAP) adherence. Results indicate that high outcome expectancies (i.e.
perceived benefits) with treatment clarify the greatest proportion of adherence. Olsen, et al.
(2008) concluded that perception of risk and outcome expectancies with treatment are important
early predictors of initiating and continued use of continuous positive airway pressure (CPAP).
Among college students, Knowlden and Sharma (2014) used the HBM to measure and
predict sleep behavior (or adequate sleep behavior, defined as receiving 7-8 continuous hours of
sleep in 24 hour period) of employed students (N=188). They reported that 34% of the variance
in sleep behavior was explained by the model. The most significant predictors were perceived
severity, perceived barriers, cues to action, and self-efficacy. Individually, 22% of the variance in
sleep behavior was (of the total 34% explained by the model) explained by perceived severity
and 15 % by perceived barriers.
Behavioral intention and sleep
Attitudes about sleep behavior, subjective norms about sleep behavior, and intention of
performing healthy sleep behaviors have been found to have significant effects on sleep quality
in adolescents (Nursalam, Apriani, Has, and Efendi, 2014). Sleep behavior (poor or healthy
sleep) in adults, and among college students in particular, have been found to be best described
by measuring the TPB constructs particularly, attitude, subjective norm and behavioral intention
(Knowlden, 2011; Knowlden & Sharma, 2012; Linden, 2011; Stanko, 2013). Knowlden (2011)
was interested in operationalizing the constructs of TPB to predict sleep intentions and behaviors
of undergraduate college students (N=197). Results suggested that as a collective prediction role,
TPB accounted for 36.2% of the variance in the behavioral intention to obtain adequate sleep. In
particular, subjective norm (r = 0.321, p < 0.001 ) and attitude (r = 0.357, p < 0.001) were

60
significantly (moderate positive) correlated with behavioral intention. Behavioral intention was
significantly (moderate positive) correlated with sleep behavior (r = 0.434, p < 0.001).
Knowlden and Sharma (2012) assessed the prediction role of the TPB of sleep intentions
and behaviors among undergraduate minority students. Their results suggested that TPB
accounted for 35.8% of the variance in the behavioral intention to obtain adequate sleep and 16%
of the variance in sleep behavior was explained by behavioral intention. Finally, Stanko (2013)
found in an investigation of sleep behavior among college students using the TPB framework
that attitude and perceived norm are significant predictors of students’ intentions to engage in
sleep related behavior including intention to obtain 7-8 hours of sleep each night. Thus, the TPB
is a useful framework in prediction sleep intentions and behaviors among college students
(Knowlden & Sharma, 2012).
Sleep and HRQOL
Sleep-related problems may affect or involve all aspects of life, which shape our quality
of life (QOL). Both sleep quality and sleep duration have been linked to different aspects of
quality of life. Preišegolavičiūtė, Leskauskas, and Adomaitienė (2010) reported a significant
association between quality of sleep and subjective QOL. According to Lopes, Esteves,
Bittencourt, Tufik, and Mello (2008), excessive sleepiness and altered circadian rhythm may
negatively affect ability to learn, employment and interpersonal relations, and may directly
worsen quality of life. Lopes et al. (2008) also reported that patients with sleep apnea disorders
have low QOL in all aspects including general health.
Health is one of the most important aspects of QOL affected by sleep behavior; and
HRQOL refers to the physical and mental health aspects of QOL. In an examination of the cross-
sectional and longitudinal relationship between habitual sleep duration and HRQOL in older
adults, Faubel et al. (2009) found that extreme sleep duration [short and long (≤ 5 or ≥ 10 h)] was

61
associated with worse scores on the Short Form (SF)-36 physical and mental scales, and with a
worse score in the role-physical scale. Accordingly, it has been concluded that extreme sleep
duration is an indicator of worse HRQOL. Herrick (2010) documented significant changes in
HRQOL, including poor physical or mental health, and restricted activity, from low to medium
and medium to high associated with levels of sleep-loss. Thus, it has been asserted that poor
quality of life and sleep-loss are highly correlated. Consistently, poor sleep and/or sleep
disturbances are associated with a variety of adverse health behaviors and impairment in several
HRQOL domains including poor general health, frequent physical distress, frequent mental
distress, activity limitations, depressive symptoms, anxiety, and pain (Andruškienė, Varoneckas,
Martinkėnas, & Grabauskas, 2008; Lee et al., 2009; Strine & Chapman, 2005). However, Jean-
Louis, Kripke, and Ancoli-Israel (2000) reported an association between the quality of well-
being and sleep satisfaction (perceived sleep satisfaction).
Theoretical Rational
There is a lack of theory-based description of sleep behavior among college students. To
the best of the author’s knowledge, the only researches that developed theoretical frameworks
using the HBM and the TPB to measure and predict sleep behavior among college students were
by Knowlden and Sharma (2012), Knowlden and Sharma (2014), and Knowlden (2011).
However, there are some limitations within these studies. First, HBM and TPB have been used
independently; thus, there is no evidence of using both theories as an integrated framework
(integrating constructs from both theories) to predict sleep behavior as proposed in the current
study. Integrating constructs from both theories as one framework allows for a comprehensive
explanation of sleep behavior as suggested by the review of literature. Second, Knowlden and
Sharma (2012) and Knowlden and Sharma (2014) tested the theoretical constructs in relation to

62
adequate sleep behavior as defined as obtaining 7-8 hours of sleep within the previous 24 hours.
Assessing sleep in just one day is insufficient and may not reflect the actual sleep behavior. The
current study proposes to extend the period of assessment to 30 days. In addition, Knowlden and
Sharma only assessed sleep duration which also may give an incomplete picture of sleep quality
(good or poor). Hence, the current study will assess both sleep duration and sleep quality for a
more inclusive evaluation of overall sleep quality. Finally, no study has reported the inclusion of
demographic variables in the analysis of the model, except for the inclusion of gender in the
application of the TPB by Knowlden (2011).
Method
Study Design, Setting and Population
This study aims to describe college students’ sleep quality using behavioral constructs
from both the TPB and HBM as an integrated theoretical framework among a sample of
undergraduate West Virginia University students. Specifically, this cross-sectional study
evaluates the effectiveness of the HBM perception constructs and the TPB behavioral intention
in predicting student’s sleep quality. West Virginia University [WVU] is a public university
located in Morgantown, WV. WVU is composed of 15 colleges offering 193 Bachelor’s,
Master’s, Doctoral, and Professional degree programs (West Virginia University, 2015). In fall
2014, the main campus enrollment was 29,175 (22,563 undergraduate, 5,001 graduate, and 1,611
professional students). Of these, 52% were male, and 48% were female students; in addition,
51% of students were non-West Virginia residents (WVU, 2015).
Sampling
Sample size and Power analysis
The power and sample size estimations were based on both sampling precision and our
primary objective using a two-sided, two-sample t-test. A stratified random sampling technique

63
was conducted to secure a more potential representative sample. A sample of 363 students was
determined to be the minimum number of participants recommended based on the actual number
of undergraduate students enrolled in Fall 2014 (22,563 students), and the prevalence of poor
sleep among college students (60%) presented in the literature (with a margin of error of 0.05
and 95% confidence interval) (Raosoft, a sample size calculator software at:
http://www.raosoft.com/samplesize.html, and the National Statistical Services website:
http://www.nss.gov.au/nss/home.nsf/pages/Sample+size+calculator).
A two-sample t-test was used to assess the sleeping score between student’s
characteristics and used in the sample size and power analysis. A sample size of 363 students
will have 80% power to detect the mean difference on sleeping scores by at least 0.5 standard
deviations between two groups at a 0.05 significance level, assuming the proportion of a
dichotomized variable is 10% and 90% (high and low) between two groups. More scenarios on
proportions of a dichotomized variable are showed in the Table below.
Two-sample t-test effect size (Power: 80%, α= 0.05, N=363), where SD is the standard
deviation of the sleeping score.
Accounting for drop-off and lower response rate, our initial sampling frame included 2200
students to get the minimum 363 students.
Participants’ recruitment
As inclusion criteria, the sample involved undergraduate college students between the
ages of 18 and 24 currently enrolled as full time students. Students were accessed through the
Proportions of
independent
variables (high vs
low)
50% vs 50% 40% vs 60% 30% vs 70% 20% vs 80% 10% vs 90%
Detected differences 0.30 SD 0.31 SD 0.33 SD 0.37 SD 0.5 SD

64
Office of the University Registrar. First, we requested student data including their e-mail
addresses and student identification numbers (ID); these data are anonymous. Then, a stratified
random sample was performed as follows. The body of undergraduate students (N=13,086
students, in 2016) was divided into distinct subgroups based on their year of enrollment:
freshmen (n=4,726; 36.1%), sophomores (n=3,482; 26.6%), juniors (n= 2,685;20.5%), and
seniors (n= 2,193;16.8%). Next, a random sample from each stratum was taken based on the
ratio of the subgroup’s size to the total number of undergraduate students. Accordingly, our
initial sample frame consisted of 2200 students: 36.1% freshmen (n=795), 26.6% sophomores
(n=585), 20.5% juniors (n=451), and 16.8% seniors (n=369); as potential participants.
Then, potential participants (N=2200) were invited electronically to participate in the study
via e-mail. An email pre-notification message was sent to each selected participant (see Appendix E
for all correspondence with students) about the forthcoming survey. The invitation contained
information about him/her being selected into the study, the study’s purpose and importance, contact
information for the principal investigator, and that the information they provide will be anonymous.
The pre-notification email explained that if they participated in the study, they would have a chance
to win one of 50 Panera gift cards ($10 each). Five days after the pre-notification phase, another e
mail requesting participation in the survey was sent to the selected participants. At the bottom of the
email, a link to the questionnaire was provided through a pre-designed WVU-based website (for
student convenience and legitimacy reasons). The link directed participants to the informed consent;
by clicking “agree” on this page, students indicated their willingness to participate, and then moved
to the subsequent electronic survey.
Students who refused to participate had the option to click “disagree”, and were directed to a
thank you message, and information on how to later participate if they changed their decision. A

65
total of three follow up e-mail reminders (days 8, 15, and 21) were sent to those who had not
responded or who choose not to participate asking them to reconsider their participation. The survey
was developed using Qualtrics software (2016), and was pilot tested for accuracy in terms of skip
patterns, etc. The survey was active for 30 days (from September 22, 2016 to October 22, 2016). At
the end of October incentives were distributed among 50 winners (who were randomly selected)
based on their preferences (electronically, traditional mailing or through the University Registrar
Office). We received 494 completed surveys, yielding a random sample of 494 undergraduate
students. Response rate was 22.5%, which is greater than the reported 20% response rate of online
surveys (Sax et al., 2003). The study was approved by the Institutional Review Board (IRB) at West
Virginia University (WVU) (WVU IRB’s Research Protocol: 1603066826) (see approval letter
Appendix F).
The Survey (Instruments)
(see Appendix D)
The survey is a self-reported questionnaire that incorporated several scales to measure
Health-related quality of life (HRQOL Modules), Sleep quality (PSQI), TPB constructs
instrument, and the HBM constructs instrument; as well as questions related to the study
covariates.
Health related quality of life: HRQOL–14 "Healthy Days Measure"
HRQOL was measured using the HRQOL–14 "Healthy Days Measure" (CDC, 2011).
The HRQOL–14 "Healthy Days Measure" is an integrated set of broad questions about recent
perceived health status and activity limitation during the past 30 days. The module or scale
includes the core module of Healthy Days (CDC HRQOL– 4), and ten additional questions about
HRQOL: Activity Limitations Module and Healthy Days Symptoms Module. The expanded
HRQOL-14 questions measure the burden of both short-term and persistent physical and mental

66
health problems (CDC, 2000). The core module includes four questions that measure in general
the health status, physical health, mental health, and the usual activities. Activity Limitations
Module and the Healthy Days Symptoms Module consist of five questions each asks about
recent pain, depression, anxiety, sleeplessness, vitality, and the cause, duration, and severity of a
current activity limitation an individual may have in his or her life. Questions related to
sleeplessness were intentionally omitted, because they were assessed by the Pittsburgh Sleep
Quality Index [PSQI].
The instrument had varied response options. The core module had a 5-point Likert scale
ranging from excellent to poor for question 1; and number of days’ responses for the rest of the
questions. The activity limitation module had yes/no responses for questions 1, 3, 4, and 5; while
question 2 asked for a specific problem to be identified from a list of different health issues. The
last module of healthy days symptoms asked about number of days. The HRQOL questions were
scored using a summary "unhealthy days" index. Unhealthy days were an estimate of the overall
number of days during the previous 30 days, when the respondent felt that either his or her
physical or mental health was not good. It was computed by adding a respondent's physically and
mentally unhealthy days, with a range of 0-30 days for each person. The “Healthy days” index
can be used as a complementary form of the "unhealthy days"; it is calculated by subtracting a
respondent's unhealthy days from 30 days. This index estimates the minimum number of recent
days when a respondent had good or better health and provided a positive measure of HRQOL
(CDC, 2011; Moriarty, Zack, & Kobau, 2003).
Validity and reliability
Several studies have indicated that the CDC HRQOL- 14 has adequate construct validity
(CDC, 2000; Moriarty et al., 2003). In addition, in a general statewide population, the single

67
global measure in the CDC HRQOL-14 had acceptable criterion validity with multiple-item SF-
36 scales (CDC, 2000) in a manner consistent with expectations. The SF-36 is generally
considered the “gold standard” in HRQOL measurement. Moreover, the HRQOL-14 has
displayed estimates of acceptable test-retest reliability and construct validity in a representative
telephone sample of Missouri adults (CDC, 2000; Moriarty et al., 2003). In addition, Andresen,
Catlin, Wyrwich, and Jackson-Thompson (2003) reported an excellent retest reliability (0.75 or
higher) for Self-Reported Health and Healthy Days measures (the core module).
Sleep Quality Scale (Pittsburgh Sleep Quality Index [PSQI])
Sleep can be assessed or measured subjectively or objectively using different instruments
and scales. Subjectively, sleep can be measured by using self-report methods including: sleep
diary, sleep log, and sleep questionnaire (sleep scales). These methods assess both sleep quantity
and quality as experienced by the individual. Subjective measures are easily administered,
inexpensive, and applicable to large population (Yi, Shin, & Shin, 2006). This study subjectively
assessed sleep quality using the PSQI. The PSQI is a self-rated questionnaire that assesses sleep
and disturbances over a 30 day time interval (Buysse et al., 1989). The scale consists of 19
individual items generating seven components: subjective sleep quality, sleep latency, sleep
duration, habitual sleep efficiency, sleep disturbances, use of sleeping medication, and daytime
dysfunction (Buysse et al., 1989). There are five additional questions rated by the partner or
roommate. These questions are used for clinical information only, and are not tabulated in the
scoring of the PSQI (Buysse et al., 1989).
The scale contains different response options. Questions 1-4 ask for a specific number,
such as hours of sleep per night, bed time, and getting up time. Questions 5, 7, and 8 use a
frequency scale (not during the past month, less than ones a week, once or twice a week, or three
or more times a week). Questions 6 and 9 have two different four- point Likert-scales. The Likert

68
scale for question 6 has the following options: very good, fairly good, fairly bad, and very bad.
Question 9 Likert scale has the following options: no problem at all, only a very slight problem,
somewhat of a problem, and a very big problem. The 19 items of the scale are grouped into 7
components scores. Each component weighted equally on a 0-3 scale. Then, the 7 components
scores are summed to produce a global PSQI score ranging from 0-21, with higher scores
indicate worse sleep quality. Finally, the entire scale requires 5-10 minutes for participants to
complete, and 5 minutes for scoring (Buysse et al., 1989).
Reliability and validity
Internal consistency and test-retest were used to test the reliability of the PSQI. The scale
has demonstrated high internal consistency estimates with Cronbach’s alpha coefficients of 0.83.
In addition, it has been documented to be stable over time (Buysse et al., 1989; Yi et al., 2006).
T-test and Pearson product-moment correlations of the scale showed no significant differences
between time 1 and time 2 (an average of 28.2 days between time 1 and time 2) (Buysse et al.,
1989). In addition, the instrument has also displayed an adequate validity. Concurrent validity
has been tested to assess the degree to which the index detects differences between groups with
and without sleep problems. A global PSQI score>5 give in a diagnostic sensitivity of 89% and
sensitivity of 85% (Kappa= 0.75, p <0.001) in distinguishing good and poor sleepers (Buysse et
al., 1989).
The Theory of Planned Behavior Instrument (Behavioral Intention)
This study utilized a psychometrically robust TPB based instrument developed by
Knowlden (2011). The instrument measured the proximal TPB constructs. Behavioral intention
is measured with 3 items using 7- point semantic differential scales; the responses included, “I
intend”, “I will try”, and “I plan”, to measure the intention of the participants to engage in good

69
sleep quality behavior. Scores for behavioral intention range from 3 to 21; higher scores reflected
a greater intention to perform the target behavior (Knowlden, 2011; Knowlden & Sharma, 2012).
Validity and reliability
The instrument has been found to display satisfactory estimates of construct validity, test
retest reliability and internal consistency. In addition, face and content validity was validated by
a panel of six experts (Knowlden, 2011).
The Health Belief Model (HBM) Instrument
This study utilized the HBM scales (a 52-item instrument) developed by Knowlden and
Sharma (2014) to measure and predict the sleep behavior of employed college students who
operated motor vehicles and were not diagnosed with a sleep disorder; with some modifications
to fit the purpose of this study. The following are the scales:
Perceived susceptibility scale:
The perceived susceptibility construct stem statement, “if you were unable to sleep 7 to 8
continuous hours each day, how likely would you be to. . . ” is preceded by six 5-point semantic
differential scales. Sample scale items included, “eventually develop a sleep related disorder
(e.g. insomnia),” “engage in one or more negative health behaviors (e.g. substance use, physical
inactivity” and “eventually develop a negative health outcome (e.g. overweight or obese, chronic
diseases),” and “unintentionally fall asleep while driving a motor vehicle.” Scale endpoints
included, “not at all likely—extremely likely.” Perceived susceptibility construct has an overall
score ranges from 6 to 30, with higher score representing greater perceived susceptibility to the
consequences of poor sleep.
Perceived severity scale:
The stem statement for the perceived severity construct is: “if you were unable to sleep 7
to 8 continuous hours each day, how likely would you be to . . .” preceded by five 5-point

70
semantic differential scales. The scale items included: “maintain good physical health,” “remain
alert while driving,” and “control your appetite.” Scale endpoints included, “no effect—major
effect.” This construct has a score range of 5 to 25, with higher scores representing greater
perceived severity to the consequences of poor sleep.
Perceived benefits scale:
The stem statement of the perceived benefits construct is: “how beneficial to you is
sleeping 7 to 8 continuous hours each day for . . .” it is followed by four 5-point semantic
differential scales. Items included: “your energy levels,” “your school productivity,” and “your
general health and quality of life.” Scale endpoints included, “not at all beneficial—extremely
beneficial.” The construct has a score range of 4 to 20, with higher scores representing greater
perceived benefits of achieving good sleep quality.
Perceived barriers scale:
The perceived barriers construct stem statement is: “how likely are you to not get 7 to 8
continuous hours of sleep each day because . . .” Followed by four 5-point semantic differential
scales. Sample items included: “you feel pressured for time,” “you feel behind on your school
work,” and “it is easier to sacrifice sleep during schooldays and make up for lost sleep during the
weekend.” Scale endpoints included, “not at all beneficial—extremely beneficial.” The construct
has a score range of 4 to 20, with higher scores representing greater perceived barriers for
achieving good sleep quality.
Reliability and validity:
The instrument items were refined over two rounds by a panel of six experts. The review
process reported unanimous face and content validity. Readability of the instrument was tested
with the Flesh Reading Ease Test and Flesh-Kincaid Grade Level Test. Respective readability
71
test scores were 64.7- and 6.7-grade levels and considered adequate for college populations
(Knowlden & Sharma, 2014).
Questions related to the external variables
Questions on the external variables including demographic; sleep-related environment are
included in the PSQI and theoretical instruments. In addition, questions to assess sleep
knowledge were selected from the Views On Sleep Scale (VOSS) (Dolan, 2013). The scale
contains 25 items that measure various beliefs, attitudes, expectations, and attributions about
sleep and insomnia. The overall scale has good internal reliability (Cronbach’s α= 0.792) (Dolan,
2013). Higher scores indicate high knowledge regarding sleep and its significance.
Data Analyses
Descriptive statistics and exploratory data analysis including frequency, mean, standard
deviation, and percentage were performed to summarize students’ demographic characteristics.
Categorical data were described using contingency tables. Continuously scaled measures were
summarized also with descriptive statistical measures (i.e., mean ± s.d.). This study has two
outcomes: primary (sleep quality) and secondary HRQOL (Unhealthy days). Prediction and
correlation analysis are the main statistical interests of this study, based on the primary and
secondary research questions. In the primary research questions, we are specifically interested in
assessing whether the HBM perception constructs and behavioral intention have roles in
describing and prediction sleep quality among WVU college students. Therefore, we conducted a
structural equation modeling (SEM) using AMOS (controlling for gender, race and year of
enrollment as their potential influences on the outcomes). SEM allowed us to explicitly model
both direct and indirect effects using both measured and latent variables. Control variables for
this model were coded as: gender is 0/1 with girls = 1, enrollment is 1-4 with seniors = 4, and

72
race is white = 1, other = 0. Additionally, we assessed the relationship between all the variables
in the hypothesized model including HRQOL.
To answer the secondary research question, we conducted a multivariate linear regression
(using SAS 9.4 for Windows), to assess the link between sleep quality, particularly poor sleep
and unhealthy days (HRQOL), controlling for a list of important covariates for their potential
influences on both outcomes particularly sleep quality including: Demographics (race, gender,
age, Job, Marital Status, and Year of Enrollment); Substance use (cigarette, alcohol and
marijuana use); NMUPD (Antidepressant painkillers Sedatives Stimulants); being diagnosed for
[ADHD (Attention Deficit Hyperactivity Disorder), insomnia, sleep disorders, and depression];
the overall perceived stress level; weight and Exercises (BMI, intensity exercise, Vigorous
exercise, strength Exercises, exercise to lose weight, diet to lose weight, and pills to lose weight),
Sleep-related (use of sleep medication, sleeping on an uncomfortable bed, sleeping in an
uncomfortable bedroom); and the everyday use of caffeinated drinks (coffee, tea, soda and
energy drink); and excluding gender when modeling by gender. All statistical tests where two-
sided and P < 0.05 was considered statistically significant.
SEM Testing
A series of six measurement models were evaluated to get the best fit model using
confirmatory factor analysis. Confirmatory factor analysis was used to test the fit of the
hypothesized factor structure to the covariance matrix of the observed variables. In the
construction of all latent variables, we used confirmatory factor analysis from the beginning, as
the latent variables already made clear what indicators we should be seeking. During the model
building, perceived barriers was dropped from the model because of poorer model fit. This is not
uncommon in HBM research where barriers have often been found to be the least important of

73
the HBM indicators (Glanz et al., 2008). The final model included three indicator variables for
the latent variable Health Belief Model “HBM”, three predicted variables [Behavioral Intention
(Theory of Planned Behavior construct), Global Sleep Quality Score, and Unhealthy days]
(observed), and the control variables (including gender, race and year of enrollment at the
University). The fit of the final structural model was acceptable (χ2 = 28.543, df = 13, P <0.05;
CFI [comparative fit index] = 0.97, and RMSEA [root mean square error of approximation] =
0.065). Models are considered a good fit if the CFI is .90 or above, and very good if it reaches
.95, so this model fits very well to the data by CFI standards. Furthermore, RMSEA is a badness
of fit measure and is considered acceptable if it is .08 or below and very good if it is .05 or
below. Our model is in the “good” rank with RMSEA (Hu & Bentler,1999).
Model’s variables
The final developed model includes: Unhealthy days (measure of HRQOL) the secondary
outcome as a predicted variable, Sleep Quality (GSQS), the primary outcome as a predicted
variable, the HBM (predictor) and has three indicators: [Susceptibility (perceived susceptibility),
Severity (perceived severity), and Benefits (perceived benefits)]. Intention (measure of TPB’s
behavioral intention) as both predictor and predicted/ variable. In addition, three demographic
variables were included in the model as control variables (gender, race and year of enrollment).

74
Results
Sample characteristics:
Demographics
Table 1 and Figures 1 & 2 (Appendix C) present sample characteristics (N=494).
Participants included 211 females (61.3%) and 133 males (38.7%) students (Mean age=20,
SD=5.7). Students were primarily White (87%). However, the lowest presentation of ethnicity
has been recorded for American Indian, Alaskan Native, or Native Hawaiian (0.6%). Around
42% of students were freshman, and almost 60% were not employed (Table 1a). The majority of
students (58%) reported using alcohol in the past 30 days, and approximately 8.2 % of students
reported the nonmedical use of stimulants. Gender differences reveal that females have higher
usage rates than males for all the classes of the NMUPD. The highest difference was among
painkillers users, 80% of them were females compared to 20% males (Table 2c). In addition,
most students (97.4%) reported stress level of average and above; and approximately 14%
reported being diagnosed with depression (Table 2c) in the past 12 months. Females who have
reported stress, depression and have been diagnosed and/or treated for ADHD, insomnia and
sleep-related disorders were higher than males, almost double. Moreover, around 23% of
students were classified as overweight. Exercise was the most common way of losing weight
reported by student (44%) in the past 30 days (Table 2c).
Sleep quality, HRQOL and the behavioral constructs
Table 1b, shows the distribution of sleep-related factors including sleep knowledge,
Bedroom environment, sleep medication and the everyday use of caffeinated drinks. The average
sleep knowledge score was 20.5 (range 5-40 with higher score indicating higher sleep
knowledge). During the past 30 days, around 22% of students reported sleeping in an
uncomfortable bedroom (hot/cold, noise, light), while only 4.7% reported sleeping in an
75
uncomfortable bed. Among the caffeinated drinks, soda was the most common drinks reported
by about 54% of students. Coffee was the popular caffeinated drinks among females (67.6%),
while, soda was common among males (50.3%) (Table 1b).
Table 2b, presents sleep quality and HRQOL characteristics among students. The average
sleeping hours per night during past month was 6.7 hours. The average sleep quality scores
recorded based on the PSQI was 6.2 (SD=4.2), higher score indicates worse sleep quality. Based
on this measure of sleep, poor sleep quality was found to be prevalent among students, as 69%
has been classified as poor sleeper with 67% being female. The average number of unhealthy
days (in the past 30 days) was 13 (SD=10) days. Finally, most students (57.3%) rated their
overall health as very good, and around 17% reported fair overall health. Among students who
reported fair health, almost 68 % were females.
The HBM perception constructs and the behavioral intention have different scores ranges
(susceptibility:4-28, severity:5-25, benefits: 4-20, and behavioral intention:3-21), higher score
indicates high perception, and high behavioral intention (which is positive). The average scores
have been reported as (Table 2a):18.8 (SD=5.50) for perceived susceptibility; 17.8 (SD=4.9) for
perceived severity; 17.2 (SD=3.8) for perceived benefits; and 16.0 (SD=5.3) for behavioral
intention.
Structural Equation Modelling (SEM)
The results of the SEM presented in Figure (1) and Table (3a). Figure (1), illustrates the
hypothesized relationships between variables in this study. Table (3a1-2) represents the context
of the hypothesized relationships of our model and the standardized (β) and unstandardized
regression weights from the structural equation model, along with standard errors and critical
ratios for statistical significance. As shown in the figure, the HBM is related to the TPB intention
76
scores (Behavioral Intention), GSQS (sleep quality), and to unhealthy days. Intention score was
related to sleep quality. And finally, GSQS (sleep quality) was related to unhealthy days
(HRQOL). In other words, sleep quality was predicted by behavioral intention (TPB) and the
HBM. Unhealthy days was predicted by sleep quality, and the HBM. Behavioral intention was
predicted by the HBM. Among the control variables, only gender was related to HBM and sleep
quality. Around 20% of the variance in sleep quality was explained by the HBM, behavioral
intention and the control variables (Gender). In addition, roughly, 31% of the variance in
unhealthy days was explained by sleep quality, behavioral intention, the HBM, and the control
variables.
The HBM was created with latent loadings from perceived severity (β = .91), perceived
susceptibility (β = .74), and perceived benefits (β = .62), (P < .05)]. HBM had a negative indirect
relationship (mediated through behavioral intention) with sleep quality (standardized β = -.12,
p<.01), which suggests that if HBM increased by one standard deviation unit, sleep quality
would be expected to decline by .12 standard deviation units. HBM also had a significant
positive and direct association with behavioral intention (standardized β = .29, p<.01), for each
one standard deviation unit increases in HBM, behavioral intention increased by .29 standard
deviation units. The intention score which reflects the TPB behavioral intention, has a strong
significant direct negative association with sleep quality (standardized β = -.40, p<.01),
indicating that when the behavioral intention score increases by one standard deviation unit, the
sleep quality scores decreases by .40 standard deviation units. Based on these relationships
between HBM, behavioral intention and sleep quality, HBM contributes strongly to behavioral
intention (.29), and behavioral intention is very strongly related to sleep quality (-.40); therefore,
the impact of HBM on sleep quality is likely to be related to its impact on behavioral intention.

77
The direct relationship between HBM and sleep quality is positive (standardized β = .152,
p<.05), and it is only significant in the absence of the negative mediated effects reported earlier
(standardized β = -.12).
Unhealthy days was predicted by the HBM and sleep quality. The HBM has a direct
positive relationship with unhealthy days (standardized β = .19, p<.01), suggesting that for each
standard deviation unit increase in the HBM scores, unhealthy days increased by a standard
deviation of .19 days. Sleep quality was a very strong predictor of unhealthy days with a
standardized β = .46 (p<.01), as for each standard deviation unit increases in sleep quality,
unhealthy days increase by .46 standard deviation units. Interestingly, we found that behavioral
intention is indirectly related to unhealthy days through sleep quality. When the behavioral
intention scores increase by one standard deviation unit, unhealthy days decrease by .19 standard
deviation units. This holds despite a non-significant total effect between intention and unhealthy
days. Finally, among the control variables only gender was a significant factor in the
hypothesized relationship, and has a direct association with both HBM (β = .35, p<.01), and with
sleep quality (β = .28, p<.01).
Multivariate Linear Regression Model
Additionally, a multivariate regression model was conducted to assess the relationship
between sleep quality and unhealthy days, with the purpose of including a list of important
demographic and behavioral covariates that we were unable to include in the SEM due to model
fit issue. However, consistent with the SEM the regression results (Table 3b: Appendix C),
revealed a significant overall effect of sleep quality on unhealthy days (F (51, 238) =4.70, p <
0001) with an R2 of 0.50; even after controlling for list of covariates. The model explained 50%
of the variance in unhealthy days (with a large effect size R= 0.71). Students’ unhealthy days

78
increased by 0.82 day for each unit increase in sleep quality scores. When analyzing by gender
we found the association is only significant among females; their unhealthy days is predicted to
increase by 0.66 days for each unit increased in sleep quality scores.
Discussion
The primary purpose of this study was to use a theoretical framework to explain and or
predict sleep quality and HRQOL of a sample of WVU undergraduate college students (N=494).
Additionally, we were also interested in exploring the relationship between sleep quality and
HRQOL as reflected by unhealthy days. This is the first known study to apply a theoretical
model using the HBM (with three constructs: perceived susceptibility, perceived severity, and
perceived benefits) along with behavioral intention from the TPB. We sought to extend previous
work by estimating the prediction roles of the identified theoretical constructs using SEM; and
by assessing the relationship between sleep quality and HRQOL in a multivariate regression
model considering key demographics and behavioral covariates in both models.
Results revealed that poor sleep is prevalent among our sample of WVU undergraduate
college students. First, the reported average sleeping hours per night during past month (6.7
hours), is below the recommended 7-8 hours of sleep per night (CDC, 2013; NIH, 2012a). The
average sleep quality scores recorded based on the PSQI was 6.2 (SD=4.2), which indicates poor
sleep quality, based on the cut off (≥5) considered to be worse sleep quality (Buysse et al., 1989).
Finally, based on this cut off measures, 69% of students were classified as poor quality sleepers.
Correspondingly, the literature affirmed the prevalence of poor sleep among college students,
with more than 60% classified as poor quality sleepers (Tsai & Li, 2005; Lund et al., 2010).
Female students in our sample reported poorer sleep quality, supporting previous research
suggesting females report poorer sleep quality than males (Tsai & Li, 2005).
79
Poor sleep among our sample may be explained by several sleep-related factors,
including as an example; sleeping in an uncomfortable bedroom (during the past 30 days) which
was reported by around 22% of students, and the prevalent of caffeinated drinks: soda (reported
by 54% of student) and Coffee (reported by 53. %). Bedroom environment (including noise,
light, and temperature) and drink intake before sleep have been found to be the most influential
to poor sleep (Brown et al., 2002; Harvard Medical School, 2007; Muzet, 2007). Moreover,
caffeinated drinks, have been linked to poor sleep quality and duration, as caffeine increases
sleep latency and alertness, and decreases sleepiness, which in turn affects sleep duration
(Hershner & Chervin, 2014). In relation to the prevalence of unhealthy days among students, the
average of 13 days, which almost half of the month of having unhealthy days, may reflect poor
HRQOL among students. The reported averages of HBM perception constructs and the TPB
behavioral intention in general are high which shows that students have high perceived
susceptibility and severity toward the consequences of poor sleep, high perceived benefits
toward performing healthy sleep behavior, and have high intention to perform healthy sleep
behavior.
Consistent with study expectations, the structural equation model (controlling for gender,
race and year of enrollment), showed significant associations between the perception constructs
of the HBM, behavioral intention, sleep quality, and unhealthy days. The HBM was strongly
associated with behavioral intention, sleep quality, and unhealthy days. Behavioral intention was
directly associated with sleep quality and indirectly (through sleep quality) connected to
unhealthy days. And finally, there was a positive significant relationship between sleep quality
and unhealthy days. Thus, sleep quality was predicted by behavioral intention (TPB) and the
HBM; and unhealthy days was directly predicted by sleep quality and the HBM, and indirectly
80
by behavioral intention. The HBM was created with latent loadings from perceived severity,
perceived susceptibility, and perceived benefits. Perceived susceptibility refers to the possibility
of getting one or more of the negatives outcomes associated with poor sleep quality; perceived
severity is the perception of the significance, seriousness and consequences of getting one or
more of the associated negative outcomes; and perceived benefits is the belief of the potential
rewards of practicing healthy sleep. The behavioral intention refers to the intention to perform
healthy sleep behavior (Knowlden, 2011).
The ability of the HBM in prediction sleep has been reported by Knowlden and Sharma
(2014). They have used the HBM to measure and predict sleep behavior (refers to sleep duration:
defined as receiving 7-8 continuous hours of sleep in 24 hour period) of employed college
students. They reported that 34% of the variance in sleep behavior was explained by the model
(that included all the constructs of the HBM). Perceived severity has been found consistently to
be the most significant predictor of HBM (Carpenter, 2010; Glanz et al., 2008; Sutton, 2002;
Knowlden and Sharma, 2014). In our study, the HBM (with only three constructs) shared with
behavioral intention and gender, explained 20% of the variance in sleep quality (which is more
inclusive than sleep duration, that included both sleep duration and subjective indices of sleep
quality).
HBM constructs have a combined and single influence on the likelihood of taking a
recommended health action (Sutton, 2002). High perceived threat (combination of perceived
susceptibility and perceived severity), high benefits and low barriers together can lead to a high
probability of taking the action (Sutton, 2002). Similarly, we found that HBM (perceived
susceptibility, perceived severity, and perceived benefits) was strongly associated with
behavioral intention (TPB). Behavioral intention is defined as the perceived likelihood of

81
carrying out the behavior (Glanz et al., 2008). This association suggests that as HBM increased
(high perceived susceptibility, high perceived severity, and high benefits), the likelihood and
intention to perform healthy sleep behavior increased in the sample. However, perceived barriers
construct was not included here because of poorer model fit. Commonly, perceived barriers
known as the least important of the HBM indicators (Glanz et al., 2008).
In line with current studies, our results identified a negative association between
behavioral intention and sleep quality. This result, signifying that getting good sleep quality is
greatly associated with having high intention to perform healthy sleep behavior. Behavioral
intention is considered as the most significant indicator of the TPB (Knowlden and Sharma,
2012). Knowlden and Sharma (2012) suggested a significant prediction role of the behavioral
intention, as 16% of the variance in sleep behavior (adequate sleep duration) among
undergraduate minority students was explained by behavioral intention. Knowlden (2011) also
found a significant correlation between behavioral intention and sleep behavior (adequate sleep
duration) among undergraduate college students. In addition, Nursalam, et al. (2014) reported a
significant effect of the intention of sleep behavior on sleep quality in adolescent.
In our study, the association between the HBM perception and sleep quality was mediated
by behavioral intention. The results reveal that; sleep quality scores are expected to decrease
when HBM increased. This relationship in the present of a mediation effect, can be explained as:
high HBM perception (susceptibility, severity and benefits) toward sleep behavior increases the
intention to perform healthy sleep behavior, and then leads toward achieving good sleep quality.
Hence, good sleep quality is the outcome of having high behavioral intention, which is
significantly achieved by having high HBM perceptions toward sleep behavior. This finding is

82
unique, to the best of author knowledge, there is no evidence of existing studies that have
examined the association between HBM, behavioral intention and Sleep Quality.
Additionally, we have added unhealthy days (HRQOL) in our SEM as a secondary
outcome, with the intention to assess the association between our variables in the model
particularly sleep quality with unhealthy days. The results suggest that around 31% of the
variance in unhealthy days was explained by sleep quality, behavioral intention, the HBM and
the control variables. The HBM had a direct significant positive association with unhealthy days,
suggesting that when HBM increases, unhealthy days increase. Which means having high
perception toward sleep behavior increases unhealthy days. Although, this results is statistically
significant, practically does not make sense and considered as nonsignificant. A possible
explanation for this is that the HBM constructs were operationalized in terms of sleep quality
aspects as. On the other hand, behavioral intention had a negative indirect association with
unhealthy days. As having high intention to perform healthy sleep behavior leads to decreases in
unhealthy days. This impact is mediated by sleep quality, as high behavioral intention associated
with getting good sleep quality. Sleep quality, in turn, was positively associated with unhealthy
days, as increases in sleep quality scores (worse sleep quality) associated with increasing in the
number of unhealthy days. Finally, among the control variables, only gender was found to be
significantly related to both HBM and sleep quality.
The multivariate linear regression results confirm the association between poor sleep
quality and unhealthy days found in the SEM, even after controlling for several demographic and
behavioral covariates. The results indicated that students’ unhealthy days increased by 0.82 days
for each unit increase in sleep quality scores, suggesting that poor sleep quality (reflected by
increasing in sleep quality scores) is associated with having more days of unhealthy days (which
83
also reflect poor physical and mental health). Among gender, the association was significant
among female only. Females’ unhealthy days would be increased because of having poor sleep
quality. The base line distribution of poor sleep quality and unhealthy days in our results may
have role in this relationship as females have poorer and more unhealthy days than males.
Results of both the SEM and the regression models concurs with the current literature
asserting a significant association between sleep quality and subjective HRQOL (Andruškienė, et
al, 2008; Faubel et al., 2009; Herrick, 2010; Lee et al., 2009; Lopes, et al., 2008; Martinkėnas, &
Grabauskas, 2008; Preišegolavičiūtė, et al., 2010; Strine & Chapman, 2005; Varoneckas, et al.,
2008). For example, Faubel et al. (2009) reported that extreme sleep duration: short and long (≤
5 or ≥ 10 h) is an indicator of worse HRQOL. Herrick (2010) asserted that poor quality of life
and sleep-loss are highly correlated. On the other hand, good sleep quality has been linked with
the quality of well-being (Jean-Louis, 2000).
Conclusion
In conclusion, poor sleep quality and fair overall health was common among WVU
undergraduate college students. Study results were consistent with our hypothesized model and
in line with the existent literature. The HBM and the behavioral intention (TPB) have significant
roles in prediction poor sleep quality among our sample of college students. In addition, poor
sleep quality was associated with increased number of unhealthy days among students. Our
results extend the current knowledge regarding the prediction role of HBM and behavioral
intention separately. However, uniquely we add to the current literature the influence the HBM
on behavioral intention, which make a very significant combination in predicting sleep quality
among college students. We have also confirmed the association between poor sleep quality and
HRQOL as measured by unhealthy days during 30 days. Hence, the results of this study suggest

84
that factors, such as those that make up the HBM, and behavioral intention may play an
important role in achieving good sleep quality among college students in our sample and in
general. Therefore, investigations or interventions concerning the health of college student
should include screening for sleep quality and HRQOL. Significantly, assessment of sleep
quality and/ or HRQOL can be better achieved by involving theoretical description using the
HBM and behavioral intention. In order to, better understand and to improve college students’
health, sleep health, productivity, wellness, quality of life, and academic achievement.
Limitation
The results of this study should be considered in light of several limitations. First, we
utilized a cross-sectional research design, thus, causal relationships between study variables
cannot be determined. Second, results are based on participants’ self-report; therefore, subject to
self-reporting accuracy, integrity and honesty. Third, we did not assess the full availability of
both the HBM and TPB constructs. Finally, this study relies upon the subjective measure of sleep
quality and not on objective measures such as polysomnography which provides a more accurate
picture of sleep.
Summary
Poor sleep quality among college students increases the risk for lower grade point
averages, compromised learning, impaired mood, and motor vehicle accidents; and associated
with several unhealthy behaviors and outcomes including substances /drugs use (alcohol and
medications), and weight gain. Therefore, we assessed college sleep quality in relation to the
NMUPD and BMI among a large sample of college students using the fall 2010-spring 2011
national survey data (American College Health Association - National College Health
Assessment (ACHA-NCHA)) (Aims1 & 2). In aim # 3, we used theoretical model integrating
85
HBM perception constructs and behavioral intention to describe and predict college students’
sleep quality among a sample of WVU undergraduate students. The goal of this dissertation was
to better understand students’ sleep quality. Study results can help in establishing theoretically
driven interventions to promote students’ sleep quality.
In summary, poor sleep was common among a large national sample of college students
and among WVU college students. The NMUPD was significantly associated with poor sleep
quality, and poor sleep quality significantly increases the predicted values of BMI and increases
the risk of being overweight and obese. In addition, poor sleep quality was also associated with
having more unhealthy days among WVU students. The HBM and the behavioral intention
(TPB) have significant roles in prediction poor sleep quality among a sample of WVU college
students. Our results extend the current knowledge regarding the association between NMUPD
and poor sleep quality, the association between poor sleep quality and overweight and/or obesity,
the association between poor sleep quality and poor HRQOL, and the significant roles of HBM
and behavioral intention in explaining sleep quality among college students. Moreover, we add
to the current literature the influence of the HBM on behavioral intention, which make a very
significant combination in predicting sleep quality among college students. Therefore,
assessment of college students’ sleep quality should include screening for NMUPD, overweight
and obesity, HRQOL as potential risk factors for poor sleep, and may all be interrelated. Such
assessment can be better achieved by involving theoretical description using the HBM and
behavioral intention, in order to, better understand and to improve college students’ health, sleep
quality, productivity, wellness, quality of life, and academic achievement.
In addition, dissertation findings could serve as base for further research including,
applying experimental studies to objectively describe sleep behavior, in order to get more

86
accurate measures of sleep quality, and to establish causal relationships between sleep and the
proposed variables. In addition, this is the first known study that integrates the HBM and the
behavioral intention constructs; therefore, this study will serve as a ground for additional
theoretical testing using both subjective and objective measures of sleep. Finally, because the
field of sleep behavior among college students particularly applying social and behavioral
theories still in its infancy phase, further studies are needed to boost understanding of students’
sleep and prevent the associated health issues.

87
REFERENCES
Abood, D. A., Black, D. R., & Feral, D. (2003). Nutrition Education Worksite Intervention for
University Staff: Application of the Health Belief Model. Journal of Nutrition Education
and Behavior, 35(5), 260-267. doi: 10.1016/s1499-4046(06)60057-2
Alexander, L., LaRosa, G., Bader, H., Garfield, S., & Alexander, w. (2010). New Dimensions in
Women's Health (5th ed). Jones & Bartlett Learning, LLC.
American College Health Association. (2011). Spring 2011Reference Group Executive
Summery. In A. C. H. A. N. C. H. Assessment (Ed.).
American Sleep Association. (2015). What is Sleep? , 2015, from
https://www.sleepassociation.org/patients-general-public/what-is-sleep/
Andresen, E., Catlin, T., Wyrwich, K., & Jackson-Thompson, J. (2003). Retest reliability of
surveillance questions on health related quality of life. J Epidemiol Community Health,
57, 339–343.
Andruškienė, J., Varoneckas, G., Martinkėnas, A., & Grabauskas, V. (2008). Factors associated
with poor sleep and health-related quality of life. Medicina (Kaunas), 44(3).
Anic, G. M., Titus-Ernstoff, L., Newcomb, P. A., Trentham-Dietz, A., & Egan, K. M. (2010).
Sleep duration and obesity in a population-based study. Sleep Med, 11(5), 447-451. doi:
10.1016/j.sleep.2009.11.013
Apantaku-Olajide, T.D. (2011). Abuse of prescription and over-the-counter drugs. Retrieved
June 7, 2011, from
www.irishpsychiatry.ie/.../forensic_essy_prize_winner_2011_web.sflb.ashx
Azevedo, C., Sousa, I., Paul, K., MacLeish, M., Mondéjar, T., Sarabia, J., . . . Madrid, J. (2008).
Teaching Chronobiology and Sleep Habits in School and University. Journal
Compilation, 2(1).
Babcock, Q., & Byrne, T. (2000). Student perceptions of methylphenidate abuse at a public
liberal arts college. J Am Coll Health, 49(3), 143-145. doi: 10.1080/07448480009596296
Bashirian, S., Hidarnia, A., Allahverdipour, H., & Hajizadeh, E. (2012). Application of the
Theory of Planned Behavior to Predict Drug
Abuse Related Behaviors among Adolescents. Journal of Research in Health Sciences, 12(1),
54-60.
Basner, M., Müller, U., & Elmenhorst, E.-M. (2011). Single and Combined Effects of Air, Road,
and Rail Traffic Noise on Sleep and Recuperation. Sleep, 34(1), 11-23.
Benca, R. M. (2012). Sleep Disorders:The Clinician's Guide to Diagnosis and Management.
New York: Oxford.
Bjorvatn, B., Sagen, I. M., Oyane, N., Waage, S., Fetveit, A., Pallesen, S., & Ursin, R. (2007).
The association between sleep duration, body mass index and metabolic measures in the
Hordaland Health Study. European Sleep Research Society, 16(66-76).
Brown, F., Buboltz, W., C.,, & Soper, B. (2002). Relationship of Sleep Hygiene Awareness,
Sleep Hygiene Practices, and Sleep Quality in University Students. Behavioral Medicine,
28.
Buboltz, W., C.,, Loveland, J., Jenkins, S., M,, Brown, F., Soper, B., & Hodges, J. (2006).
College student sleep: Relationship to health and academic performance. In M. Landaw,
V., (Ed.), College Students: Mental Health and Coping strategies (pp. 1-39). Hauppauge,
NY: Nova Science.

88
Buckhalt, J., & El-Sheikh, M. (2013). The SES Indicator. Sleep and Poverty. 2015, from
http://www.apa.org/pi/ses/resources/indicator/2013/11/sleep-poverty.aspx
Burgard, S., Ailshire, J. A., & Hughe, M. (2010). Gender and Sleep Duration among American
Adults Population Studies Center: University of Michiga.
Burgard, S. A., & Ailshire, J. A. (2012). Gender and Time for Sleep among U.S. Adults. Am
Sociol Rev, 78(1), 51-69. doi: 10.1177/0003122412472048
Buysse, D. J., Reynolds, C. F., 3rd, Monk, T. H., Berman, S. R., & Kupfer, D. J. (1989). The
Pittsburgh Sleep Quality Index: a new instrument for psychiatric practice and research.
Psychiatry Res, 28(2), 193-213.
Cain, N., Gradisar, M., & Moseley, L. (2011). A motivational school-based intervention for
adolescent sleep problems. Sleep Med, 12(3), 246-251. doi: 10.1016/j.sleep.2010.06.008
Cappuccio, F. P., Taggart, F. M., Kandala, N.-B., Currie, A., Peile, E., Stranges, S., & Miller, M.
A. (2008). Meta-Analysis of Short Sleep Duration and Obesity in Children and Adults.
Sleep, 31(5), 619-626.
Carpenter, C. J. (2010). A meta-analysis of the effectiveness of health belief model variables in
predicting behavior. Health Commun, 25(8), 661-669. doi:
10.1080/10410236.2010.521906
Carpenter, C. L., Yan, E., Chen, S., Hong, K., Arechiga, A., Kim, W. S., . . . Heber, D. (2013).
Body fat and body-mass index among a multiethnic sample of college-age men and
women. J Obes, 2013, 790654. doi: 10.1155/2013/790654
Centers for Disease Control and Prevention. (2000). Measuring Healthy Days: Population
Assessment of Health-Related Quality of Life. Atlanta, Georgia: CDC.
Centers for Disease Control and Prevention. (2008). Perceived Insufficient Rest or Sleep --- Four
States, 2006 Mortality and Morbidiy Weekly Report [MMWR] (Vol. 2015).
Centers for Disease Control and Prevention. (2011a). Health-Related Quality of Life (HRQOL).
HRQOL Concepts. from http://www.cdc.gov/hrqol/concept.htm
Centers for Disease Control and Prevention. (2011). Health-Related Quality of Life (HRQOL).
CDC HRQOL–14 "Healthy Days Measure". from
http://www.cdc.gov/hrqol/hrqol14_measure.htm
Centers for Disease Control and Prevention. (2011). Methods and Measures. Health-Related
Quality of Life (HRQOL). 2015, from http://www.cdc.gov/hrqol/methods.htm
Centers for Disease Control and Prevention. (2013). How Much Sleep Do I Need? Sleep and
Sleep Disorders. 2015, from
http://www.cdc.gov/sleep/about_sleep/how_much_sleep.htm
Centers for Disease Control and Prevention. (2015). About adult BMI. Healthy Weight:
Assessing Your Weight. 2015, from
http://www.cdc.gov/healthyweight/assessing/bmi/adult_bmi/index.html
Centers for Disease Control and Prevention. (2015a). Adult Obesity Facts. Overweight and
Obesity. 2015, from http://www.cdc.gov/obesity/data/adult.html
Centers for Disease Control and Prevention. (2015). Insufficient Sleep Is a Public Health
Problem. Data & Statistics. 2015, from http://www.cdc.gov/features/dssleep/
Centers for Disease Control and Prevention. (2015). Understanding the Epidemic. Prescription
Drug Overdose. Retrieved January 2, 2015, 2015, from
http://www.cdc.gov/drugoverdose/epidemic/index.html

89
Chang, S.-P., & Chen, Y.-H. (2014). Relationships between Sleep Quality, Physical Fitness, and
Body Mass Index in College Freshmen. The Journal of Sports medicine and Physical
Fitness.
Chaput, J. P. (2014). Sleep patterns, diet quality and energy balance. Physiol Behav, 134, 86-91.
doi: 10.1016/j.physbeh.2013.09.006
Chaput, J. P., McNeil, J., Despres, J. P., Bouchard, C., & Tremblay, A. (2012). Short sleep
duration is associated with greater alcohol consumption in adults. Appetite, 59(3), 650-
655. doi: 10.1016/j.appet.2012.07.012
Chen, J., Yi, H., Liu, Z., Fan, Y., Bian, J., Guo, W., . . . Sun, J. (2013). Factors associated with
being overweight among Inner Mongolia medical students in China. BMJ Open, 3(12),
e003900. doi: 10.1136/bmjopen-2013-003900
Chen, M. Y., Wang, E. K., & Jeng, Y. J. (2006). Adequate sleep among adolescents is positively
associated with health status and health-related behaviors. BMC Public Health, 6, 59. doi:
10.1186/1471-2458-6-59
Chong, Y., Fryar, C. D., & Gu, Q. (2013). Prescription Sleep Aid Use Among Adults: United
States, 2005–2010. In N. C. f. H. Statistics (Ed.), NCHS data brief, no 127. Hyattsville,
MD.
Clegg-Kraynok, M. (2010). Nonmedical Psychostimulant Use and Sleep among Adolescents and
Emerging Adults. Dessertation. (3448180). Ann Arbor, MI.
Clegg-Kraynok, M., McBean, A. L., & Montgomery-Downs, H. E. (2011). Sleep quality and
characteristics of college students who use prescription psychostimulants nonmedically.
Sleep Med, 12(6), 598-602. doi: 10.1016/j.sleep.2011.01.012
Crispim, C. A., Zimberg, I. Z., dos Reis, B. G., Diniz, R. M., Tufik, S., & de Mello, M. T.
(2011). Relationship between food intake and sleep pattern in healthy individuals. J Clin
Sleep Med, 7(6), 659-664. doi: 10.5664/jcsm.1476
Culnan, E., Kloss, J. D., & Grandner, M. (2013). A prospective study of weight gain associated
with chronotype among college freshmen. Chronobiol Int, 30(5), 682-690. doi:
10.3109/07420528.2013.782311
Curcio G, Ferrara M, De Gennaro L. Sleep loss, learning capacity and academic performance.
Sleep Med Rev. 2006;10(5):323-337.
Dennis-Antwi, J., Adjei, S., Asare, J. B., & Twene, R. (2003). A National Survey on Prevalenc
and Social Consequencies of Substance (Drugs) use among Second Cycle and Out of
School Youth in Ghana. Ghana: Ministry of Health/Ghana: World Health Organization.
Dimsdale, J. E., Norman, D., DeJardin, D., & Wallace, M. S. (2007). The Effect of Opioids on
Sleep Architecture. Journal of Clinical Sleep Medicine, 3(1), 33-36.
Dolan, C. (2013). Developmental Perspectives on Community Beliefs and Attitudes about Sleep.
(Doctor of Psychology), Victoria University.
Dregan, A., & Armstrong, D. (2010). Adolescence sleep disturbances as predictors of adulthood
sleep disturbances--a cohort study. J Adolesc Health, 46(5), 482-487. doi:
10.1016/j.jadohealth.2009.11.197
Eaton, D. K., McKnight-Eily, L. R., Lowry, R., Perry, G. S., Presley-Cantrell, L., & Croft, J. B.
(2010). Prevalence of insufficient, borderline, and optimal hours of sleep among high
school students - United States, 2007. J Adolesc Health, 46(4), 399-401. doi:
10.1016/j.jadohealth.2009.10.011

90
Edens, K. M. (2006). The Relationship of University Students' Sleep Habits and Academic
Motivation. Journal of Student Affairs Research and Practice, 43(3). doi: 10.2202/1949-
6605.1677
Ehlers, C., Gilder, D., Criado, J., & Caetan, R. (2010). Sleep Quality and Alcohol-Use Disorders
in a Select
Population of Young-Adult Mexican Americans. Journal of Studies on Alcohol and Drugs, 71,
879-884.
Ensor, J., Oexman, R., Scott, D., Carrier, J., & Davis, J. (2008). Evaluation of a Custom Fit Solo
Construction Sleep Surface using Objective and Subjective Measures of Sleep Quality.
Evans, E. A., & Sullivan, M. A. (2014). Abuse and misuse of antidepressants. Subst Abuse
Rehabil, 5, 107-120. doi: 10.2147/SAR.S37917
Fakier, N., & Wild, L. G. (2011). Associations among sleep problems, learning difficulties and
substance use in adolescence. J Adolesc, 34(4), 717-726. doi:
10.1016/j.adolescence.2010.09.010
Faubel, R., Lopez-Garcia, E., Guallar-Castillón, P., Balboa-Castillo, T., Gutiérrez-Fisac, J.,
Banegas, J., & Rodríguez-Artalejo, F. (2009). Sleep Duration and Health-Related Quality
of Life among Older Adults: A Population-Based Cohort in Spain. Sleep, 32(8), 1059-
1068.
Food Research & Action center. (2015). Initiatives. Obesity in the U.S., 2015, from
http://frac.org/initiatives/hunger-and-obesity/obesity-in-the-us/
Ford, E. S., Li, C., Wheaton, A. G., Chapman, D. P., Perry, G. S., & Croft, J. B. (2014). Sleep
duration and body mass index and waist circumference among U.S. adults. Obesity
(Silver Spring), 22(2), 598-607. doi: 10.1002/oby.20558
Fredriksen, K., Rhodes, J., Reddy, R., & Way, N. (2004). Sleepless in Chicago: Tracking the
Effects of Adolescent Sleep Loss During the Middle School Years. Child Development,
75(1), 84 – 95.
Friedman, E. M., Love, G. D., Rosenkranz, M. A., Urry, H. L., Davidson, R. J., Singer, B. H., &
Ryff, C. D. (2007). Socioeconomic status predicts objective and subjective sleep quality
in aging women. Psychosom Med, 69(7), 682-691. doi: 10.1097/PSY.0b013e31814ceada
Fyhri, A., & Aasvang, G. M. (2010). Noise, sleep and poor health: Modeling the relationship
between road traffic noise and cardiovascular problems. Sci Total Environ, 408(21),
4935-4942. doi: 10.1016/j.scitotenv.2010.06.057
Galambos, N., Dalton, A., & Maggs, J. (2009). Losing Sleep Over It: Daily Variation in Sleep
Quantity and Quality in Canadian Students’ First Semester of University. Journal of
Research on Adolescence, 19(4), 741–761.
Gallasch, J., & Gradisar, M. (2007). Relationships between sleep knowledge, sleep practice and
sleep quality. Sleep and Biological Rhythms, 5(1), 63-73. doi: 10.1111/j.1479-
8425.2006.00248.x
Gangwisch, J. E., Malaspina, D., Boden-Albala, B., & Heymsfield, S. B. (2005). Inadequate
Sleep as a Risk Factor for Obesity: Analyses of the NHANES I. Sleep, 28(10), 1289-
1296.
Gaultney, J. F. (2010). The prevalence of sleep disorders in college students: impact on academic
performance. J Am Coll Health, 59(2), 91-97. doi: 10.1080/07448481.2010.483708
Gellis, L., & Lichstein, K. (2009). Sleep Hygiene Practices of Good and Poor Sleepers in the
United States: An Internet-Based Study. Behavior Therapy, 40, 1–9.

91
Glanz, K., & Bishop, D. B. (2010). The role of behavioral science theory in development and
implementation of public health interventions. Annu Rev Public Health, 31, 399-418. doi:
10.1146/annurev.publhealth.012809.103604
Glanz, K., Rimer, B., & Viswanath, K. (2008). Health Behavior and Health Education: Theory,
Research, and Practic. San Francisco, CA: Jossey-Bass: A Wiley Imprint.
Gooley, J. J., Chamberlain, K., Smith, K. A., Khalsa, S. B., Rajaratnam, S. M., Van Reen, E., . . .
Lockley, S. W. (2011). Exposure to room light before bedtime suppresses melatonin
onset and shortens melatonin duration in humans. J Clin Endocrinol Metab, 96(3), E463-
472. doi: 10.1210/jc.2010-2098
Grandner, M. A., Patel, N. P., Gehrman, P. R., Xie, D., Sha, D., Weaver, T., & Gooneratne, N.
(2010). Who gets the best sleep? Ethnic and socioeconomic factors related to sleep
complaints. Sleep Med, 11(5), 470-478. doi: 10.1016/j.sleep.2009.10.006
Hall, K. M., Irwin, M. M., Bowman, K. A., Frankenberger, W., & Jewett, D. C. (2010). Illicit use
of prescribed stimulant medication among college students. J Am Coll Health, 53(4),
167-174. doi: 10.3200/JACH.53.4.167-174
Halson, S. L. (2013). Nutritional Interventions to Enhance Sleep. Sports Science Exchange,
26(116), 1-5.
Hartwell, E. E., Pfeifer, J. G., McCauley, J. L., Moran-Santa Maria, M., & Back, S. E. (2014).
Sleep disturbances and pain among individuals with prescription opioid dependence.
Addict Behav, 39(10), 1537-1542. doi: 10.1016/j.addbeh.2014.05.025
Harvard Medical School. (2007). Healthy Sleep. External factors that Influence Sleep. 2015
Healthy People. (2015). 2020 Topics & Objectives. Sleep Health. Retrieved January, 2015,
2015, from http://www.healthypeople.gov/2020/topics-objectives/topic/sleep-health
Herrick, H. (2010). The Association of Insufficient Sleep with Smoking, Obesity, Physical
Inactivity, and Poor Quality of Life: Results from the 2008 North Carolina Behavorial
Risk Factor Surveillance System (BRFSS) Survey. Raleigh, NC: State Center for Health
Statistics.
Hershner, S. D., & Chervin, R. D. (2014). Causes and consequences of sleepiness among college
students. Nat Sci Sleep, 6, 73-84. doi: 10.2147/NSS.S62907
Ho, S. C., & Chung, J. W. (2013). The effects of caffeine abstinence on sleep: a pilot study. Appl
Nurs Res, 26(2), 80-84. doi: 10.1016/j.apnr.2012.08.004
Hu, L & Bentler, B. (1999). Cutoff criteria for fit indexes in covariance structure analysis:
Conventional criteria versus new alternatives.Structural Equation Modeling: A
Multidisciplinary Journal, 6(1), 1-55, DOI: 10.1080/10705519909540118
Institute of Diabetes and Diagestive and Kidney Diseases. (2012). Overweight and Obesity
Statistics. Health Statistics 2015, from http://www.niddk.nih.gov/health-
information/health-statistics/Pages/overweight-obesity-statistics.aspx
Jacobson, B. H., Boolani, A., & Smith, D. B. (2009). Changes in back pain, sleep quality, and
perceived stress after introduction of new bedding systems. J Chiropr Med, 8(1), 1-8. doi:
10.1016/j.jcm.2008.09.002
Jean-Louis, G., Kripke, D. F., & Ancoli-Israel, S. (2000). Sleep and Quality of Well-Being.
Sleep, 23(8).
Kaloyanides, K., McCabe, S., Cranford, J., & Teter, C. (2007). Prevalence of Illicit Use and
Abuse of Prescription Stimulants, Alcohol, and Other Drugs Among College Students:
Relationship with Age at Initiation of Prescription Stimulants. Pharmacotherapy, 27(5),
666–674.

92
Kamath, M. G., Prakash, J., Dash, S., Chowdhury, S., Ahmed, Z. B., & Yusof, M. Z. (2014). "Is
there an Association Between Self-Reported Sleep Duration, Body Mass Index and
Waist-Hip Ratio in Young Adults? A Cross-Sectional Pilot Study". J Clin Diagn Res,
8(9), BC05-07. doi: 10.7860/JCDR/2014/8918.4808
Kenney, S., Lac, A., Labrie, J., Hummer, J., & Phan, A. (2013). Mental Health, Sleep Quality,
Drinking Motives, and Alcohol-Related Consequences: A Path-Analytic Model. Journal
of Studies on Alcohol and Drugs, 74, 841–851.
Kenney, S. R., LaBrie, J. W., Hummer, J. F., & Pham, A. T. (2012). Global sleep quality as a
moderator of alcohol consumption and consequences in college students. Addict Behav,
37(4), 507-512. doi: 10.1016/j.addbeh.2012.01.006
Knowlden, A. (2011). Theory of Planned Behavior Based Predictors of Sleep Intentions and
Behaviors in Undergraduate College Students at a Midwestern University. University of
Cincinnati.
Knowlden, A., & Sharma, M. (2012). The Theory of Planned Behavior as a Model for Predicting
the Sleep Intentions and Behaviors of Undergraduate Minority Students. International
Journal of Medicine and Molecular Medicine.
Knowlden, A., & Sharma, M. (2014). Health belief structural equation model predicting sleep
behavior of employed college students. Fam Community Health, 37(4), 271-278. doi:
10.1097/FCH.0000000000000043
Kryger, M. H., Roth, T., & Dement, W. C. (2011). Principles and Practice of Sleep Medicine. St.
Louis, Missouri: Elsevier.
Lack, L. C., Gradisar, M., Van Someren, E. J., Wright, H. R., & Lushington, K. (2008). The
relationship between insomnia and body temperatures. Sleep Med Rev, 12(4), 307-317.
doi: 10.1016/j.smrv.2008.02.003
Lam, r. (2005). Sleep disturbances abd depression: a challenge for antidepressants. International
Clinical Psychopharmacology, 21(Suppl. 1), S25-S29.
Lauderdale, D. S., Knutson, K. L., Rathouz, P. J., Yan, L. L., Hulley, S. B., & Liu, K. (2009).
Cross-sectional and longitudinal associations between objectively measured sleep
duration and body mass index: the CARDIA Sleep Study. Am J Epidemiol, 170(7), 805-
813. doi: 10.1093/aje/kwp230
Lee, M., Choh, A., Demerath, E., Knuston, K., Duren, D., Sherwood, R., . . . Czerwinski, S.
(2009). Sleep Disturbance in Relation to Health-Related Quality of Life in Adults: The
Fels Longitudinal Study. The Journal of Nutrition, Health and Aging, 13(6).
Linden, M. (2011). The Theory of Planned Behavior as a Predictor of Sleep Hygiene and Sleep
Quality. (3465528). Ann Arbor, MI.
Looby, A., Kassman, K. T., & Earleywine, M. (2014). Do negative stimulant-related attitudes
vary for prescription stimulants and cocaine among college students? Addict Behav,
39(6), 1100-1105. doi: 10.1016/j.addbeh.2014.03.012
Lopes, C., Esteves, A., Bittencourt, L., Tufik, S., & Mello, M. (2008). Relationship between the
quality of life and the severity of obstructive sleep apnea syndrome. Brazilian Journal of
Medical and Biological Research, 41, 908-913.
Lund, H. G., Reider, B. D., Whiting, A. B., & Prichard, J. R. (2010). Sleep patterns and
predictors of disturbed sleep in a large population of college students. J Adolesc Health,
46(2), 124-132. doi: 10.1016/j.jadohealth.2009.06.016

93
Magee, L., & Hale, L. (2012). Longitudinal associations between sleep duration and subsequent
weight gain: a systematic review. Sleep Med Rev, 16(3), 231-241. doi:
10.1016/j.smrv.2011.05.005
Makino, M., Hashizume, M., Yasushi, M., Tsuboi, K., & Dennerstein, L. (2006). Factors
associated with abnormal eating attitudes among female college students in Japan. Arch
Womens Ment Health, 9(4), 203-208. doi: 10.1007/s00737-006-0128-x
Malinauskas, B. M., Aeby, V. G., Overton, R. F., Carpenter-Aeby, T., & Barber-Heidal, K.
(2007). A survey of energy drink consumption patterns among college students. Nutr J, 6,
35. doi: 10.1186/1475-2891-6-35
Marshall, N. S., Glozier, N., & Grunstein, R. R. (2008). Is sleep duration related to obesity? A
critical review of the epidemiological evidence. Sleep Med Rev, 12(4), 289-298. doi:
10.1016/j.smrv.2008.03.001
Mayers, A. G., & Baldwin, D. S. (2005). Antidepressants and their effect on sleep. Hum
Psychopharmacol, 20(8), 533-559. doi: 10.1002/hup.726
McCabe, S. E., Boyd, C. J., & Teter, C. J. (2009). Subtypes of nonmedical prescription drug
misuse. Drug Alcohol Depend, 102(1-3), 63-70. doi: 10.1016/j.drugalcdep.2009.01.007
McCabe, S. E., & Teter, C. J. (2007). Drug use related problems among nonmedical users of
prescription stimulants: a web-based survey of college students from a Midwestern
university. Drug Alcohol Depend, 91(1), 69-76. doi: 10.1016/j.drugalcdep.2007.05.010
McCabe, S. E., West, B. T., & Boyd, C. J. (2013). Medical use, medical misuse, and nonmedical
use of prescription opioids: results from a longitudinal study. Pain, 154(5), 708-713. doi:
10.1016/j.pain.2013.01.011
McCabe, S. E., West, B. T., Teter, C. J., & Boyd, C. J. (2014). Trends in medical use, diversion,
and nonmedical use of prescription medications among college students from 2003 to
2013: Connecting the dots. Addict Behav, 39(7), 1176-1182. doi:
10.1016/j.addbeh.2014.03.008
McKnight-Eily, L. R., Eaton, D. K., Lowry, R., Croft, J. B., Presley-Cantrell, L., & Perry, G. S.
(2011). Relationships between hours of sleep and health-risk behaviors in US adolescent
students. Prev Med, 53(4-5), 271-273. doi: 10.1016/j.ypmed.2011.06.020
McLaughlin Crabtree, V., & Williams, N. A. (2009). Normal sleep in children and adolescents.
Child Adolesc Psychiatr Clin N Am, 18(4), 799-811. doi: 10.1016/j.chc.2009.04.013
Melton, B., Langdon, J., & McDaniel, T. (2013). Sleep Trends And College Students: Does It
Connect To Obesity? College Student Journal, 47(3).
Meyer, K. A., Wall, M. M., Larson, N. I., Laska, M. N., & Neumark-Sztainer, D. (2012). Sleep
duration and BMI in a sample of young adults. Obesity (Silver Spring), 20(6), 1279-1287.
doi: 10.1038/oby.2011.381
Mezick, E. J., Matthews, K. A., Hall, M., Strollo, P. J., Jr., Buysse, D. J., Kamarck, T. W., . . .
Reis, S. E. (2008). Influence of race and socioeconomic status on sleep: Pittsburgh
SleepSCORE project. Psychosom Med, 70(4), 410-416. doi:
10.1097/PSY.0b013e31816fdf21
Mezick, E. J., Wing, R. R., & McCaffery, J. M. (2014). Associations of self-reported and
actigraphy-assessed sleep characteristics with body mass index and waist circumference
in adults: moderation by gender. Sleep Med, 15(1), 64-70. doi:
10.1016/j.sleep.2013.08.784

94
Ming, X., Koransky, R., Kang, V., Buchman, S., Sarris, C. E., & Wagner, G. C. (2011). Sleep
insufficiency, sleep health problems and performance in high school students. Clin Med
Insights Circ Respir Pulm Med, 5, 71-79. doi: 10.4137/CCRPM.S7955
Mitchell, J. A., Rodriguez, D., Schmitz, K. H., & Audrain-McGovern, J. (2013). Sleep duration
and adolescent obesity. Pediatrics, 131(5), e1428-1434. doi: 10.1542/peds.2012-2368
Moore, D. R., Burgard, D. A., Larson, R. G., & Ferm, M. (2014). Psychostimulant use among
college students during periods of high and low stress: an interdisciplinary approach
utilizing both self-report and unobtrusive chemical sample data. Addict Behav, 39(5),
987-993. doi: 10.1016/j.addbeh.2014.01.021
Moraes, W., Poyares, D., Zalcman, I., de Mello, M. T., Bittencourt, L. R., Santos-Silva, R., &
Tufik, S. (2013). Association between body mass index and sleep duration assessed by
objective methods in a representative sample of the adult population. Sleep Med, 14(4),
312-318. doi: 10.1016/j.sleep.2012.11.010
Moriarty, D., Zack, M., & Kobau, R. (2003). The Centers for Disease Control and Prevention's
Healthy Days Measures – Population tracking of perceived physical and mental
health over time. Health and Quality of Life Outcomes, 1(37).
Muzet, A. (2007). Environmental noise, sleep and health. Sleep Med Rev, 11(2), 135-142. doi:
10.1016/j.smrv.2006.09.001
Nagai, M., Tomata, Y., Watanabe, T., Kakizaki, M., & Tsuji, I. (2013). Association between
sleep duration, weight gain, and obesity for long period. Sleep Med, 14(2), 206-210. doi:
10.1016/j.sleep.2012.09.024
Natal, C., Lourenco, T., Silva, L., Boscolo, R., Silva, A., Tufik, S., & Mello, M. (2009). Gender
differences in the sleep habits of 11-13 year olds. Rev Bras Psiquiatr, 31(4).
National Center for Health Statistics. (2014). Health, United States, 2013: With Special
Featureon Prescription Drugs. Hyattsville, MD.
National Institute of Diabetes and Diagestive and Kidney Diseases. (2012). Understanding adult
Overweight and Obesity. Weight Control & Healthy Living. 2015, from
http://www.niddk.nih.gov/health-information/health-topics/weight-
control/understanding/Pages/understanding-adult-overweight-and-obesity.aspx
National Institute of Health. (2012a). How Much Sleep Is Enough? Sleep Deprivation and
Deficiency. from https://www.nhlbi.nih.gov/health/health-topics/topics/sdd/howmuch
National Institute of Health. (2012b). What are Overweight and Obesity? Overweight and
Obesity. 2015, from http://www.nhlbi.nih.gov/health/health-topics/topics/obe/
National Institute of Health. (2013). Sleep Disorders & Insufficient Sleep: Improving Health
through Research. Fact Sheet. 2015, from http://www.nhlbi.nih.gov/news/spotlight/fact-
sheet/sleep-disorders-insufficient-sleep-improving-health-through-research
National Institute of Neurological Disorders and Stroke. (2014). Disorders A-Z. Brain Basics:
Understanding Sleep. 2015, from
http://www.ninds.nih.gov/disorders/brain_basics/understanding_sleep.htm
National Institute on Drug Abuse. (2014a). Waht are CNS depressants? Prescription Drug
Abuse. Retrieved January 4, 2015, 2015, from
http://www.drugabuse.gov/publications/research-reports/prescription-drugs/cns-
depressants/what-are-cns-depressants
National Institute on Drug Abuse. (2014b). What are Stimulants? Prescription Drug Abuse.
Retrieved 01/02/2015, 2015, from http://www.drugabuse.gov/publications/research-
reports/prescription-drugs/stimulants/what-are-stimulants

95
National Institute on Drug Abuse. (2015). Drugs of abuse. Commonly Abused Drugs Charts.
2015, from http://www.drugabuse.gov/drugs-abuse/commonly-abused-drugs-charts
National Sleep Foundation. (2015). Bedroom. Touch. 2015, from
https://sleepfoundation.org/bedroom/touch.php
National Sleep Foundation. (2015a). How Sleep Works. What Happens When You Sleep? ,
2015, from http://sleepfoundation.org/how-sleep-works/what-happens-when-you-sleep
National Sleep Foundation. (2015). Sleep Hygiene. from https://sleepfoundation.org/ask-the-
expert/sleep-hygiene
Newbury-Birch, D., White, M., & Kamali, F. (2000). Factors influencing alcohol and illicit drug
use amongst medical students. Drug and Alcohol Dependence, 59, 125–130.
Nursalam, M., Apriani, N. K., Has, E. M. M. a., & Efendi, F. (2014). Sleep hygiene behavior
among Balinese adolescent. Journal of Nursing Education and Practice, 4(3). doi:
10.5430/jnep.v4n3p155
Oginska, H., & Pokorski, J. (2006). Fatigue and mood correlates of sleep length in three age-
social groups: School children, students, and employees. Chronobiol Int, 23(6), 1317-
1328. doi: 10.1080/07420520601089349
Ohayon, M. M. (2004). Interactions between sleep normative data and sociocultural
characteristics in the elderly. J Psychosom Res, 56(5), 479-486. doi:
10.1016/j.psychores.2004.04.365
Okamoto-Mizuno, K., & Mizuno, K. (2012). Effects of thermal environment on sleep and
circadian rhythm. Journal of Physiological Anthropolo, 31(14).
Olsen, S., Smith, S., Oei, T., & Douglas, J. (2008). Health belief model predicts adherence to
CPAP before experience with CPAP. Eur Respir J, 32(3), 710-717. doi:
10.1183/09031936.00127507
Olsen, S., Smith, S., & Oei, T. P. (2008). Adherence to continuous positive airway pressure
therapy in obstructive sleep apnoea sufferers: a theoretical approach to treatment
adherence and intervention. Clin Psychol Rev, 28(8), 1355-1371. doi:
10.1016/j.cpr.2008.07.004
Painter, J. E., Borba, C. P., Hynes, M., Mays, D., & Glanz, K. (2008). The use of theory in health
behavior research from 2000 to 2005: a systematic review. Ann Behav Med, 35(3), 358-
362. doi: 10.1007/s12160-008-9042-y
Pasch, K., Laska, M., Lytle, L., & Moe, S. (2010). Adolescent Sleep, Risk Behaviors, and
Depressive Symptoms:
Are They Linked? Am J Health Behav., 34(2), 237–248.
Patel, S. R., & Hu, F. B. (2008). Short sleep duration and weight gain: a systematic review.
Obesity (Silver Spring), 16(3), 643-653. doi: 10.1038/oby.2007.118
Peuhkuri, K., Sihvola, N., & Korpela, R. (2012). Diet promotes sleep duration and quality. Nutr
Res, 32(5), 309-319. doi: 10.1016/j.nutres.2012.03.009
Phillips, B., & Mannino, D. (2005). Correlates of Sleep Complaints in Adults: The ARIC Study.
Journal of Clinical Sleep Medicine, 1(3), 277-283.
Popovici, I., & French, M. T. (2013). Binge drinking and sleep problems among young adults.
Drug & Alcohol Dependence, 132(1), 207-215. doi: 10.1016/j.drugalcdep.2013.02.001
Pratt, L. A., Brody, D. J., & Gu, Q. (2011). Antidepressant Use in Persons Aged 12 and Over:
United States, 2005–2008 NCHS Data Brief, No.76. Hyattsville, MD: National Center for
Health Statistics.

96
Preišegolavičiūtė, E., Leskauskas, D., & Adomaitienė, V. (2010). Associations of quality of
sleep with lifestyle factors and profile of studies among Lithuanian students. Medicina
(Kaunas), 46(7), 482-489.
Quick, V., Byrd-Bredbenner, C., Brown, O., Colby, S., Horacek, T., Shoff, S., . . . Kidd, T.
(2013). Relationships among Sleep Duration, Weight-Related Behaviors, and BMI in
College Students. Journal of the Academy of Nutrition and Dietetics, 113(9), A78. doi:
10.1016/j.jand.2013.06.270
Quick, V., Shoff, S., Lohse, B., White, A., Horacek, T., & Greene, G. (2015). Relationships of
eating competence, sleep behaviors and quality, and overweight status among college
students. Eat Behav, 19, 15-19. doi: 10.1016/j.eatbeh.2015.06.012
Ram, S., Seirawan, H., Kumar, S. K., & Clark, G. T. (2010). Prevalence and impact of sleep
disorders and sleep habits in the United States. Sleep Breath, 14(1), 63-70. doi:
10.1007/s11325-009-0281-3
Riedel, B. W. (2000). Sleep hygiene. In K. L. L. C. M. Morin (Ed.), Treatment of late-life
insomnia (pp. 125-146). Thousand Oaks, CA, US: Sage Publications, Inc.
Robotham, D., Chakkalackal, L., & Cyhlarova, E. (2011). Sleep Matters: The impact of sleep on
health and wellbeing.
Ruiter, M. E., Decoster, J., Jacobs, L., & Lichstein, K. L. (2011). Normal sleep in African-
Americans and Caucasian-Americans: A meta-analysis. Sleep Med, 12(3), 209-214. doi:
10.1016/j.sleep.2010.12.010
Sanchez, S. E., Martinez, C., Oriol, R. A., Yanez, D., Castaneda, B., Sanchez, E., Williams, M.
A. (2013). Sleep Quality, Sleep Patterns and Consumption of Energy Drinks and Other
Caffeinated Beverages among Peruvian College Students. Health (Irvine Calif), 5(8B),
26-35. doi: 10.4236/health.2013.58A2005
Sax, L.,Gilmartin, S., & Bryant, A. (2003). Asswssing Response Rates and Nonresponse Bias in
Web and paper Surveys. in Higher Education, 44(4), 209-214. doi:
10.1016/j.sleep.2010.12.010
Schlangen, L. (2014). The effect of light on our sleep/wake cycle: Philips.
Schlarb, A. A., Kulessa, D., & Gulewitsch, M. D. (2012). Sleep characteristics, sleep problems,
and associations of self-efficacy among German university students. Nat Sci Sleep, 4, 1-7.
doi: 10.2147/NSS.S27971
Shoff, S., Nuss, E., Horacek, T., Boyle, C., Lohse, B., Patterson, J., . . . Greene, G. (2009). Sleep
Quality is Associated with Eating Behavior in 18-24 year old College Students. Journal
of Nutrition Education and Behavior, 41(4), S8-S9. doi: 10.1016/j.jneb.2009.03.117
Singleton, R. A., & Wolfson, A. (2009). Alcohol Consumption, Sleep, and Academic
PerformanceAmong College Students. Journal of Studies on Alcohol and Drugs, 70, 355-
363.
Spaeth, A. M., Dinges, D. F., & Goel, N. (2013). Effects of Experimental Sleep Restriction on
Weight Gain, Caloric Intake, and Meal Timing in Healthy Adults. Sleep, 36(7), 981-990.
doi: 10.5665/sleep.2792
Stanko, K. (2013). Predicting Sleep Duration in College Students: A Reasoned Action approach.
(Master), Ball State University MUNCIE, INDIANA.
Storfer-Isser, A., Patel, S. R., Babineau, D. C., & Redline, S. (2012). Relation between sleep
duration and BMI varies by age and sex in youth age 8-19. Pediatr Obes, 7(1), 53-64.
doi: 10.1111/j.2047-6310.2011.00008.x
97
Strine, T. W., & Chapman, D. P. (2005). Associations of frequent sleep insufficiency with
health-related quality of life and health behaviors. Sleep Med, 6(1), 23-27. doi:
10.1016/j.sleep.2004.06.003
Substanc Abuse and Mental Health Services Administration. (2015). Prescription Drug Misuse
and abuse. Topics. Retrieved January, 2015, 2015, from
http://www.samhsa.gov/prescription-drug-misuse-abuse
Suen, L., Tam, W., & Hon, K. (2010). Association of sleep hygiene–related factors and sleep
quality among university students in Hong Kong. Hong Kong Med J, 16(3).
Sutton, S. (2002). Health Behavior: Psychosocial Theories.
Sweileh, W. M., Ali, I., Sawalha, A. F., Abu-Tah, A. S., Zyoud, S. e. H., & Al-Jabi, S. W.
(2012). Gender differences in sleep habits and sleep-related problems in Arab Palestinian
university students. International Journal on Disability and Human Development, 11(3).
doi: 10.1515/ijdhd-2012-0041
Taheri, S., Lin, L., Austin, D., Young, T., & Mignot, E. (2004). Short sleep duration is associated
with reduced leptin, elevated ghrelin, and increased body mass index. PLoS Med, 1(3),
e62. doi: 10.1371/journal.pmed.0010062
Taylor, D., Bury, M., Campling, N., Carter, S., Garfied, S., Newbould, J., & Rennie, T. (2006).
A Review of the use of the Health Belief Model (HBM), the Theory of Reasoned Action
(TRA), the Theory of Planned Behavior (TPB) and the Trans-Theoretical Model (TTM)
to study and predict health related behavior change.
Taylor, D. J., & Bramoweth, A. D. (2010). Patterns and consequences of inadequate sleep in
college students: substance use and motor vehicle accidents. J Adolesc Health, 46(6),
610-612. doi: 10.1016/j.jadohealth.2009.12.010
Teter, C., McCabe, S., LaGrange, K., Cranford, J., & Boyd, C. (2006). Illicit Use of Specific
Prescription Stimulants Among College Students: Prevalence, Motives, and Routes of
Administration. Pharmacotherapy, 26(10).
Teter, C. J., McCabe, S. E., Cranford, J. A., Boyd, C. J., & Guthrie, S. K. (2010). Prevalence and
motives for illicit use of prescription stimulants in an undergraduate student sample. J Am
Coll Health, 53(6), 253-262. doi: 10.3200/JACH.53.6.253-262
Todigala, K., Holcomb, D., & Kanneganti, M. (2008). Relationship between sleep and body mass
index (BMI) among college students. Paper presented at the 136th APHA Annual Meeting
and Exposition, San Diego.
Tran, J., Lertmaharit, S., Lohsoonthorn, V., Pensuksan, W. C., Rattananupong, T., Tadesse, M.
G., . . . Williams, M. A. (2014). Daytime Sleepiness, Circadian Preference, Caffeine
Consumption and Use of Other Stimulants among Thai College Students. J Public Health
Epidemiol, 8(6), 202-210. doi: 10.5897/JPHE2014.0620
Tsai, L.-L., & Li, S.-P. (2004). Sleep patterns in college students. Journal of Psychosomatic
Research, 56(2), 231-237. doi: 10.1016/s0022-3999(03)00507-5
United State National Library of Medicine. (2015). ObesityHealth Topics. 2015, from
https://www.nlm.nih.gov/medlineplus/obesity.html#
United States Drug Enforcement Administration. (2015). Drugs of Abuse—A DEA Resource
Guide. Retrieved December 8, 2016, from https://www.dea.gov/pr/multimedia-
library/publications/drug_of_abuse.pdf#page=46
Vargas, P. A., Flores, M., & Robles, E. (2014). Sleep quality and body mass index in college
students: the role of sleep disturbances. J Am Coll Health, 62(8), 534-541. doi:
10.1080/07448481.2014.933344

98
Vela-Bueno A, Fernandez-Mendoza J, Olavarrieta-Bernardino S. Sleep patterns in the transition
from adolescence to young adulthood. Sleep Med Clin. 2009;4(1):77-85.
Waye, K., Clow, A., Edwards, S., Hucklebridge, F., & Rylander, R. (2003). Effects of nighttime
low frequency noise on the cortisol response to awakening and subjective sleep quality.
Life Science, 72, 863–875.
Wechsler, H., & Wuethrich, B. (2002). Dying to Drink: Confronting Binge Drinking on College
Campuses. Emmaus, PA: Rodale.
Wells, M., & Vaughn, B. (2012). Poor Sleep Challenging the Health of a Nation. Neurodiagn J,
52, 233-249.
West Virginia University. (2015). About WVU. WVU Facts. 2015, from
http://about.wvu.edu/wvu-facts
Wheaton, A. G., Perry, G. S., Chapman, D. P., McKnight-Eily, L. R., Presley-Cantrell, L. R., &
Croft, J. B. (2011). Relationship between body mass index and perceived insufficient
sleep among U.S. adults: an analysis of 2008 BRFSS data. BMC Public Health, 11, 295.
doi: 10.1186/1471-2458-11-295
Wilens, T. E., Adler, L. A., Adams, J., Sgambati, S., Rotrosen, J., Sawtelle, R., . . . Fusillo, S.
(2008). Misuse and diversion of stimulants prescribed for ADHD: a systematic review of
the literature. J Am Acad Child Adolesc Psychiatry, 47(1), 21-31. doi:
10.1097/chi.0b013e31815a56f1
Wilson, S., & Argyropoulos, S. (2005). Antidepressants and Sleep: A Qualitative Review of the
Literature. Drugs, 65(7).
Wong, M. M., Brower, K. J., Nigg, J. T., & Zucker, R. A. (2010). Childhood sleep problems,
response inhibition, and alcohol and drug outcomes in adolescence and young adulthood.
Alcohol Clin Exp Res, 34(6), 1033-1044. doi: 10.1111/j.1530-0277.2010.01178.x
World Health Organization. (2015). Substance abuse. Health Topics. 2015, from
http://www.who.int/topics/substance_abuse/en/
Wuertz, C., Chia, Y., & Lee, J. (2012). Relationship of Body Mass Index and Activity Level
with Sleep Quality Among College Women. DISCOVERY: Georgia State Honors
College UndergraduateResearch Journal, 1(1).
Xiang, Y. T., Ma, X., Lu, J. Y., Cai, Z. J., Li, S. R., Xiang, Y. Q., . . . Ungvari, G. S. (2009).
Relationships of sleep duration with sleep disturbances, basic socio-demographic factors,
and BMI in Chinese people. Sleep Med, 10(10), 1085-1089. doi:
10.1016/j.sleep.2009.03.002
Yamaguchi, M., Uemura, H., Katsuura-Kamano, S., Nakamoto, M., Hiyoshi, M., Takami, H., . . .
Arisawa, K. (2013). Relationship of dietary factors and habits with sleep-wake regularity.
Asia Pac J Clin Nutr, 22(3), 457-465. doi: 10.6133/apjcn.2013.22.3.01
Yi, H., Shin, K., & Shin, C. (2006). Development of the Sleep Quality Scale. J. Sleep Res, 15,
309–316.

99
Appendix A
Aim1, Results’ Tables

100
Table 1. Sample Characteristics (F=Frequency, %= percentage)
Characteristic Male
[n = 46, 062 (34.7 %)]
Female
[n = 86, 593 (65.3 %)]
Overall
[N=133, 211 (100%)]
Frequency Missing = 2, 663
Demographic
N = 135,874; Age M(SD) = 22(6)
Race/Ethnicity F (%) White 31037 (34.6) 58566 (65.4) 89, 603 (68.1)
Black 2125 (29.6) 5045 (70.4) 7, 170 (5.5)
Hispanic or Latino 3208 (33.7) 6324 (66.3) 9, 532 (7.2)
Asian or Pacific
Islander 5794 (38.2) 9374 (61.8)
15, 168 (11.5)
American Indian,
Alaskan Native, or
Native Hawaiian
727 (34.8) 1361 (65.2) 2, 088 (1.6)
Biracial or
Multiracial 1370 (29.4) 3285 (70.6)
4, 655 (3.6)
Other 1337 (40.1) 2001 (59.9) 3, 338 (2.5)
BMI M(SD) 24.8 (4.8) 23.9 (5.2) 24.2 (5.1)
Substance use (past 30 days) F (%)
Cigarette smoking 8, 543 (43.0) 11, 344 (57.0) 19, 887 (15.0)
Alcohol use 29, 542 (34.8) 55, 353 (65.2) 84, 895 (65.6)
Marijuana use 8, 599 (42.4) 11, 698 (57.6) 20, 297 (15.4)
Diagnosed Medical Disorders in the Past 12 Months and the perceived overall stress level F (%)
Attention Deficit Hyperactivity Disorder (ADHD) 2, 258 (38.7) 3, 579 (61.3) 5, 837 (4.4)
Insomnia 1, 358 (27.9) 3, 511 (72.1) 4, 869 (3.7)
Sleep-related Disorders 921 (35.0) 1, 709 (65.0) 2, 630 (2.0)
Depression 6, 014 (26.0) 17, 115 (74.0) 23, 129 (18.0)
Stress 44, 162 (34.0) 85, 487 (66.0) 129, 649 (98.3)

101
Table.2 Overall and By Gender Distribution of Sample Sleep Behaviors (Dependent variables) and
Non-Medical Use of Prescription Drugs [NMUPD] (Independent Variables),
(F=Frequency, %=percentage)
Variable
Male (%) Female (%) Overall (%)
Sleep Variables (in the past 7 days), Number of Days
Enough Sleep 0-1 Day “Poor” 8865 (30.4) 20280 (69.6) 29145 (22.1)
2-5 Days “Middle” 30633 (34.8) 57254 (65.2) 87887 (66.6)
6-7 Days “Optimal” 6239 (42.0) 8626 (58.0) 14865 (11.3)
Early Awakening 0-1 Day “Optimal” 34842 (36.3) 61197 (63.7) 96039 (72.9)
2-5 Days “Middle” 9698 (30.3) 22304 (69.7) 32002 (24.3)
6-7 Days “Poor” 1113 (30.6) 2523 (69.4) 3636 (2.8)
Daytime Sleepiness 0-1 Day “Optimal” 12398 (43.8) 15926 (56.2) 28324 (21.5)
2-5 Days “Middle” 27496 (33.5) 54691 (66.5) 82187 (62.3)
6-7 Days “Poor” 5834 (27.3) 15527 (72.7) 21361 (16.2)
Difficulty Falling
Asleep
0-1 Day “Optimal” 30547 (36.1) 53981 (63.9) 84528 (64.1)
2-5 Days “Middle” 12140 (32.3) 25447 (67.7) 37587 (28.5)
6-7 Days “Poor” 3021 (31.0) 6697 (69.0) 9718 (7.4)
Problem with
Daytime sleepiness
No Problem
“Optimal”
6198 (46.4) 7168 (53.6) 13366 (10.1)
Little to Very big
problem “Poor”
39573 (33.4) 78990 (66.6) 118563 (89.9)
Prescription drugs (past 12 months)
Antidepressant use 1, 264 (31.5) 2, 742 (68.5) 4, 006 (3.0)
Painkiller use 3, 915 (39.8) 5, 911 (60.2) 9, 826 (7.5)
Sedative use 3, 781 (39.1) 5, 881 (60.9) 9, 661 (7.4)
Stimulant use 1, 998 (37.4) 3,340 (62.6) 5, 338 (4.1)
Any NMUPD 6, 786 (36.8) 11, 651 (63.2) 18, 437 (14.1)

102
Table 3. Overall and by gender Ordinal Regression Analysis (OR (95% CI)) for the non-medical use of
prescription drugs (NMUPD) as variables predicting sleep behaviors among college students (N=135, 874;
adjusting for covariates ∆)
*p<.01; **p<.001; ***p<.0001
OR interpretation:
^ Less days of having Enough Sleep “Poor” < 1 > More days of having Enough Sleep “Optimal”.
^ ^ No problem with Daytime Sleepiness “Optimal” < 1 > little to a very big problem with Daytime
Sleepiness “Poor”.
^ ^ ^ Less days of Early Awakening, Daytime Sleepiness, and Difficulty Falling Asleep “Optimal” < 1 >
more days of Early Awakening, Daytime Sleepiness, and Difficulty Falling Asleep “Poor”.
∆ Controlling for race; gender; age; BMI; cigarette, alcohol and marijuana use; being diagnosed for
ADHD (Attention Deficit Hyperactivity Disorder), insomnia, sleep disorders, and depression; and the
overall stress level. We excluded gender when modelling by gender. And, when we modelled one of the
NMUPD as a predictor we controlled for the other NMUPD.
NMUPD
Variables
Yes vs. No
Responses: Sleep Variables
Enough Sleep
(OR^)
Problem with
Daytime Sleepiness
(OR^^)
Early Awakening
(OR^^^)
Daytime Sleepiness
(OR^^^)
Difficulty Falling
Asleep (OR^^^)
Antidepressants
Overall 0.98 (0.92 -1.05) 0.99 (0.93-1.07) 1.02 (0.95-1.09) 1.07 (0.99-1.14) 1.04 (0.97-1.11)
Male 0.96 (0.85-1.08) 1.04 (0.92-1.18) 1.07 (0.95-1.22) 1.01 (0.89-1.13) 1.01 (0.89-1.14)
Female 0.99 (0.92-1.08) 0.97 (0.89-1.05) 0.99 (0.91-1.07) 1.08 (0.99-1.17) 1.05 (0.97-1.14)
Painkillers
Overall 0.84***(0.80-0.88) 0.98 (0.93-1.02) 1.28*** (1.22-1.34) 1.16*** (1.11-1.22) 1.27***(1.21-1.33)
Male 0.87** (0.80-0.93) 0.98 (0.91-1.06) 1.34*** (1.24-1.45) 1.16*** (1.08-1.25) 1.33***(1.23-1.43)
Female 0.83***(0.78-0.87) 0.98 (0.92-1.04) 1.24*** (1.17-1.31) 1.17*** (1.11-1.24) 1.23***(1.16-1.30)
Sedatives
Overall 1.07 (1.01- 1.14) 1.10* (1.03-1.17) 1.12 ** (1.05-1.19)
0.98 (0.92-1.04)
1.17***(1.09-1.24)
Male 1.08 (0.97-1.19) 1.09 (0.98-1.22) 1.07 (0.96-1.19) 0.96 (0.86-1.06) 1.13 (1.02-1.26)
Female 1.07 (0.99-1.16) 1.09 (1.00-1.18) 1.14* (1.05-1.24) 0.99 (0.92-1.07) 1.18***(1.09-1.27)
Stimulants
Overall 0.93* (0.89-0.97) 0.97 (0.93-1.02) 1.10*** (1.05-1.16) 1.13*** (1.08-1.18) 1.10***(1.05-1.15)
Male 0.88** (0.82-0.95) 0.93 (0.86-1.01) 1.15** (1.06-1.25) 1.20***(1.11-1.29) 1.21***(1.12-1.30)
Female 0.96 (0.91-1.01) 0.99 (0.94-1.06) 1.07 (1.01-1.14) 1.09**(1.04-1.16) 1.04 (0.99-1.11)
Use at least one
Overall 0.86***(0.83-0.88) 0.98 (0.95-1.02) 1.28***(1.24-1.33) 1.23***(1.19-1.26) 1.32***(1.28-1.37)
Male 0.84***(0.80-0.89) 0.97(0.92-1.03) 1.33***(1.26-1.41) 1.22***(1.16-1.29) 1.44***(1.36-1.52)
Female 0.87***(0.83-0.90) 0.99 (0.95-1.03) 1.26***(1.21-1.31) 1.23***(1.18-1.28) 1.26***(1.22-1.31)

103
Appendix B
Aim2, Results’ Tables and Figures
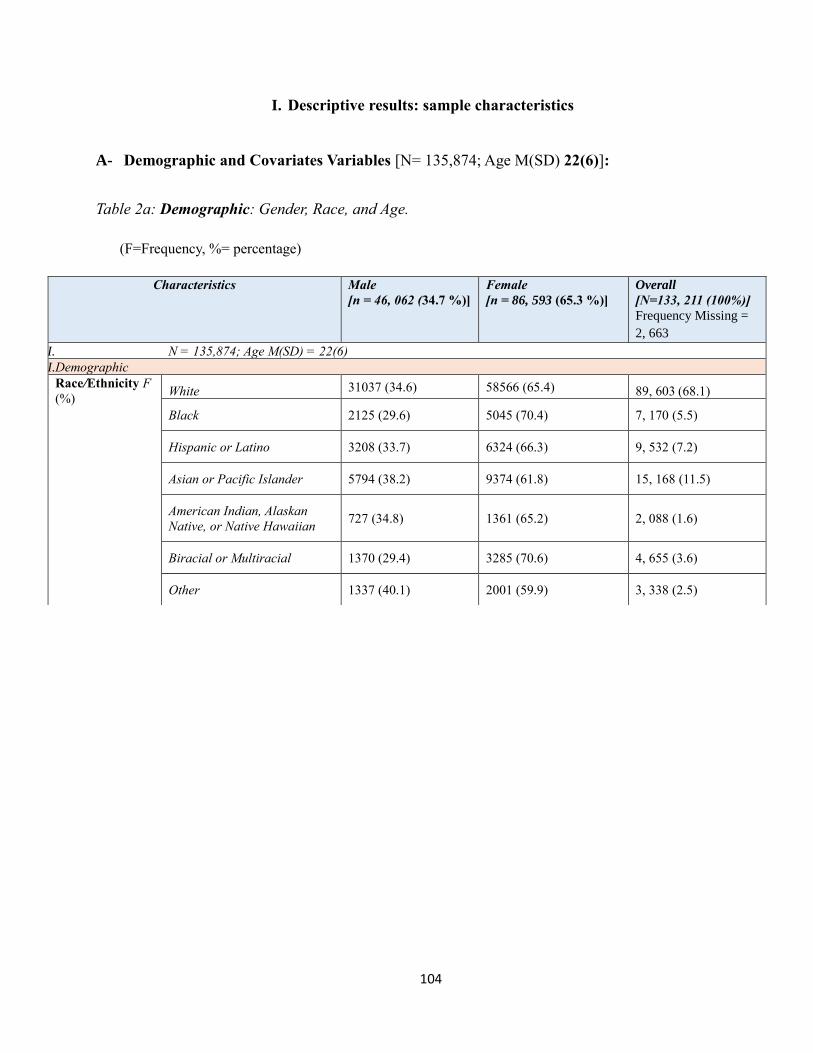
104
I. Descriptive results: sample characteristics
A- Demographic and Covariates Variables [N= 135,874; Age M(SD) 22(6)]:
Table 2a: Demographic: Gender, Race, and Age.
(F=Frequency, %= percentage)
Characteristics Male
[n = 46, 062 (34.7 %)]
Female
[n = 86, 593 (65.3 %)]
Overall
[N=133, 211 (100%)]
Frequency Missing =
2, 663
I. N = 135,874; Age M(SD) = 22(6)
II.Demographic
Race/Ethnicity F
(%) White 31037 (34.6) 58566 (65.4) 89, 603 (68.1)
Black 2125 (29.6) 5045 (70.4) 7, 170 (5.5)
Hispanic or Latino 3208 (33.7) 6324 (66.3) 9, 532 (7.2)
Asian or Pacific Islander 5794 (38.2) 9374 (61.8) 15, 168 (11.5)
American Indian, Alaskan
Native, or Native Hawaiian 727 (34.8) 1361 (65.2) 2, 088 (1.6)
Biracial or Multiracial 1370 (29.4) 3285 (70.6) 4, 655 (3.6)
Other 1337 (40.1) 2001 (59.9) 3, 338 (2.5)

105
Table 1b: Covariates: Substance use (Cigarette, Alcohol, and Marijuana) the Nonmedical use of
prescription drugs (Antidepressants, Painkiller, Stimulants, and Sedatives), Diagnosed Medical
Disorders, and the Overall Perceived Stress Level.
Characteristics Male Female Overall
Substance use (past 30 days) F (%)
Cigarette smoking Use 8, 543 (43.0) 11, 344 (57.0) 19, 887 (15.0)
No 37, 254 (33.2) 74, 915 (66.8) 112, 169 (85.0)
Alcohol use Use 29, 542 (34.8) 55, 353 (65.2) 84, 895 (65.6)
No 16, 101 (34.6) 30, 504 (65.4) 46, 605 (35.4)
Marijuana use
Use 8, 599 (42.4) 11, 698 (57.6) 20, 297 (15.4)
No 37, 117 (33.3) 74, 367 (66.7) 111, 484 (84.6)
The Nonmedical Use of Prescription Drugs (past 12 months) F (%)
Antidepressant use Use 1, 264 (31.5) 2, 742 (68.5) 4, 006 (3.0)
No 44, 492 (34.8) 83, 397 (65.2) 127, 889 (97.0)
Painkillers use Use 3, 915 (39.8) 5, 911 (60.2) 9, 826 (7.5)
No 41, 763 (34.3) 80, 162 (65.7) 121, 925 (92.5)
Stimulants use Use 3, 781 (39.1) 5, 881 (60.9) 9, 661 (7.4)
No 41, 810 (34.3) 80, 020 (65.7) 121, 830 (92.6)
Sedatives use Use 1, 998 (37.4) 3,340 (62.6) 5, 338 (4.1)
No 43, 620 (34.6) 82, 634 (65.4) 126, 254 (95.9)
Use at least one Use 6, 786 (36.8) 11, 651 (63.2) 18, 437 (14.1)
No 38, 609 (34.3) 73, 848 (65.7) 112, 457 (85.9)
Diagnosed Medical Disorders in the Past 12 Months and the perceived overall stress level F (%)
Attention Deficit Hyperactivity Disordr (ADHD) Yes 2, 258 (38.7) 3, 579 (61.3) 5, 837 (4.4)
No 43, 366 (34.5) 82, 396 (65.5) 125, 762 (95.6)
Insomnia Yes 1, 358 (27.9) 3, 511 (72.1) 4, 869 (3.7)
No 44, 234 (34.9) 82, 404 (65.1) 126, 638 (96.3)
Sleep-related Disorders Yes 921 (35.0) 1, 709 (65.0) 2, 630 (2.0)
No 44, 525 (34.6) 84, 001 (65.4) 128, 536 (98.0)
Depression
Yes 6, 014 (26.0) 17, 115 (74.0) 23, 129 (18.0)
No 37, 947 (36.0) 67, 211 (64.0) 105, 158 (82.0)
Stress
Yes 44, 162 (34.0) 85, 487 (66.0) 129, 649 (98.3)
No 1, 562 (70.1) 666 (29.9) 2, 228 (1.7)

106
Table 2c: Covariates: Exercise (in the past 7 days); and exercise, diet and pills used to lose
weight (within the last 30 days).
Characteristics Male Female Overall
Exercise (in the past 7 days), Number of Days
Moderate intensity cardio or
aerobic exercises for at least 30
minutes
M(SD) 2.5 (2.1)
F (%) 0-1 Day 16, 566 (33.9) 32, 362 (66.1) 48, 928 (37.2)
2-5 Days 23, 788 (34.3) 45, 614 (65.7) 69, 402 (52.8)
6-7 Days 5, 100 (39.4) 7, 851 (60.6) 12, 951 (10.0)
Vigorous intensity cardio or
aerobic exercises for at least 20
minutes
M(SD) 1.7 (1.9)
F (%) 0-1 Day 22, 643 (31.4) 49, 487 (68.6) 72, 130 (55.0)
2-5 Days 19, 940 (38.5) 31, 911 (61.5) 51, 851 (39.6)
6-7 Days 2, 889 (40.8) 4, 200 (59.2) 7, 089 (5.4)
8-10 strength training exercises for
8-12 repetitions each
M(SD) 1.3 (1.8)
F (%) 0-1 Day 25, 318 (29.9) 59, 414 (70.1) 84, 732 (64.7)
2-5 Days 17, 867 (42.5) 24, 120 (57.5) 41, 987 (32.0)
6-7 Days 2, 330 (54.7) 1, 930 (45.3) 4, 260 (3.3)
Exercise, diet and pills used to lose weight (within the last 30 days)
Exercises to lose weight Yes 19, 856 (27.8) 51, 444 (72.2) 71, 300 (54.0)
No 25879 (42.7) 34, 734 (57.3) 60, 613 (46.0)
Diet to lose weight Yes 12, 497 (24.8) 37, 872 (75.2) 50, 369 (38.3)
No 33, 061 (40.7) 48, 068 (59.3) 81, 129 (61.7)
Vomit or take laxatives to lose weight Yes 404 (11.5) 3, 114 (88.5) 3, 518 (2.7)
No 45, 102 (35.3) 82, 757 (64.7) 127, 859 (97.3)
Take pills to lose weight Yes 942 (21.5) 3, 450 (78.5) 4, 392 (3.4)
No 44, 421 (35.0) 82, 176 (65.0) 126, 597 (96.6)

107
B- Sleep Behaviors and The Body Mass Index [BMI]:
Table 2: Overall and by Gender Distribution of Sample Sleep Behaviors (IV) and the BMI (DV).
(M= Mean, SD= Standard Deviation, F=Frequency, %= percentage)
Characteristics Male Female Overall
Sleep Variables (in the past 7 days), Number of Days
Enough Sleep
(Number of days
of having enough
sleep)
M(SD) 3.3 (1.9) 3.0 (1.9) 3.1 (1.9)
F (%) 0-1 Day “Poor” 8865 (30.4) 20280 (69.6) 29145 (22.1)
2-5 Days “Middle” 30633 (34.8) 57254 (65.2) 87887 (66.6)
6-7 Days “Optimal” 6239 (42.0) 8626 (58.0) 14865 (11.3)
Early Awakening M(SD) 0.9 (1.5) 1.1 (1.6) 1.1 (1.6)
F (%) 0-1 Day “Optimal” 34842 (36.3) 61197 (63.7) 96039 (72.9)
2-5 Days “Middle” 9698 (30.3) 22304 (69.7) 32002 (24.3)
6-7 Days “Poor” 1113 (30.6) 2523 (69.4) 3636 (2.8)
Daytime
Sleepiness
M(SD) 3.0 (2.0) 3.5 (2.0) 3.3 (2.0)
F (%) 0-1 Day “Optimal” 12398 (43.8) 15926 (56.2) 28324 (21.5)
2-5 Days “Middle” 27496 (33.5) 54691 (66.5) 82187 (62.3)
6-7 Days “Poor” 5834 (27.3) 15527 (72.7) 21361 (16.2)
Difficulty Falling
Asleep
M(SD) 1.4 (1.9) 1.6 (2.0) 1.6 (2.0)
F (%) 0-1 Day “Optimal” 30547 (36.1) 53981 (63.9) 84528 (64.1)
2-5 Days “Middle” 12140 (32.3) 25447 (67.7) 37587 (28.5)
6-7 Days “Poor” 3021 (31.0) 6697 (69.0) 9718 (7.4)
Problem with Daytime
Sleepiness
No Problem “Optimal” 6198 (46.4) 7168 (53.6) 13366 (10.1)
Little to Very big problem
“Poor”
39573 (33.4) 78990 (66.6) 118563 (89.9)
Sleep Difficulty (within the last 12 months) F (%) 10190 (31.2) 22517 (68.8) 32707 (24.8)
Body Mass Index [BMI]), Overall BMI and BMI Classifications
Overall M(SD) 24.8 (4.8) 23.9 (5.2) 24.2 (5.1)
Underweight F (%) 1490 (22.8) 5035 (77.2) 6525 (5.0)
Desired weight F (%) 25893 (31.8) 55561 (68.2) 81454 (62.6)
Overweight F (%) 12368 (44.6) 15357 (55.4) 27725 (21.3)
Overall obesity 15, 859 (11.1)
Class I obesity F (%) 3659 (40.5) 5372 (59.5) 9031 (7.0)
Class II obesity F (%) 1241 (36.4) 2173 (63.6) 3414 (2.6)
Class III obesity F (%) 550 (27.8) 1431 (72.2) 1981 (1.5)

108
II. Inference Analysis
A. Differences in sleep behaviors among the different BMI classes:
1. Chi-square test:
Table 3a: Frequencies and percentages [F (%)] of different sleep behaviors among the different classes of BMI (Chi-square <.0001).
BMI Classes
Sleep Behaviors
Enough sleep Early Awakening Daytime Sleepiness Difficulty Falling Asleep Problem with Daytime
Sleepiness
0-1 Day
2-5
Days
6-7
Days
0-1
Day
2-5
Days
6-7
Days
0-1
Day
2-5
Days
6-7
Days
0-1
Day
2-5
Days
6-7
Days
No
Problem
Little to
Very big
problem
Poor Middle Optimal Optimal Middle Poor Optimal Middle Poor Optimal Middle Poor Optimal Poor
Un
der
wei
gh
t
M
326
(22.0)
955
(64.4)
202
(13.6)
1151
(77.8)
287
(19.4)
41
(2.8)
418
(28.2)
862
(58.0)
204
(13.8)
1004
(67.8)
355
(24.0)
121
(8.2)
200
(13.5) ***
1280
(86.5)
***
F 1241
(24.8)
3269
(65.3)
494
(9.9)
3585
(71.6)
1269
(25.3)
155
(3.1)
981
(19.6)
3106
(61.9)
929
(18.5)
3172
(63.2)
1436
(28.6)
410
(8.2)
457
(9.1) **
4551
(90.9) **
O 1582
(24.2)
4249
(65.1)
700
(10.7)
4766
(72.9)
1564
(24.0)
202
(3.1)
1409
(21.5)
3992
(61.0)
1143
(17.5)
4203
(64.3)
1801
(27.5)
538
(8.2)
662
(10.1) *
5870
(89.9) *
Des
ired
wei
gh
t
M 4696
(18.3)
17384
(67.6)
3640
(14.1)
20176
(78.6)
4992
(19.4)
507
(2.0)
7109
(27.6)
15589
(60.6)
3027
(11.8)
17680
(68.7)
6546
(25.5)
1485
(5.8)
3467
(13.5) ***
22274
(86.5)
***
F 12220
(22.1)
37334
(67.5)
5757
(10.4)
40106
(72.6)
13688
(24.8)
1433
(2.6)
10622
(19.2)
35374
(64.0)
9297
(16.8)
35580
(64.3)
15961
(28.9)
3743
(6.8)
4635
(8.4) **
50673
(91.6) **
O 17030
(20.89)
55041
(67.52)
9444
(11.59)
60613
(74.5)
18805
(23.1)
1961
(2.4)
17845
(22.0)
51244
(62.8)
12408
(15.2)
53551
(65.7)
22648
(27.8)
5272
(6.5)
8166
(10.0) *
73366
(90.0) *
Ove
rwei
gh
t
M 2434
(19.8)
8255
(67.2)
1597
(13.0)
9134
(74.4)
2817
(23.0)
320
(2.6)
3243
(26.4)
7479
(60.8)
1573
(12.8)
8084
(65.8)
3382
(27.5)
827
(6.7)
1656
(13.5) ***
10645
(86.5)
***
F 3804
(24.9)
10001
(65.4)
1481
(9.7)
10665
(69.8)
4162
(27.3)
443
(2.9)
2626
(17.1)
9769
(63.9)
2905
(19.0)
9269
(60.6)
4676
(30.6)
1346
(8.8)
1202
(7.9) **
14091
(92.1) **
O 6285
(22.6)
18379
(66.2)
3109
(11.2)
19945
(71.9)
7027
(25.3)
771
(2.8)
5920
(21.3)
17368
(62.5)
4510
(16.2)
17475
(62.9)
8115
(29.2)
2197
(7.9)
2892
(10.4) *
24904
(89.6) *
Cl
as
s I
ob
esi
ty M 777
(21.3)
2404
(65.9)
465
(12.8)
2554
(70.1)
939
(25.8)
149
(4.1)
956
(26.3)
2119
(58.3)
560
(15.4)
2189
(60.2)
1094
(30.1)
354
(9.7)
483
(13.2) ***
3164
(86.8)

109
***
F 1512
(28.2)
3404
(63.6)
437
(8.2)
3429
(64.3)
1659
(31.0)
248
(4.7)
836
(15.6)
3281
(61.4)
1229
(23.0)
2983
(55.8)
1759
(32.9)
602
(11.3)
416
(7.8) **
4929
(92.2) **
O 2316
(25.5)
5846
(64.5)
905
(10.0)
6026
(66.6)
2615
(28.9)
405
(4.5)
1809
(20.0)
5429
(60.0)
1811
(20.0)
5207
(57.5)
2873
(31.8)
968
(10.7)
910
(10.0) *
8151
(90.0) *
Cla
ss I
I o
bes
ity M 291
(23.7)
785
(63.8)
154
(12.5)
849
(69.)
334
(27.1)
48
(3.9)
281
(22.7)
713
(57.8)
240
(19.5)
732
(59.3)
376
(30.5)
126
(10.2)
150
(12.2) ***
1083
(87.8)
***
F 642
(29.7)
1345
(62.2)
175
(8.1)
1387
(64.2)
668
(30.9)
106
(4.9)
311
(14.4)
1332
(61.6)
519
(24.0)
1207
(55.8)
692
(31.9)
265
(12.3)
173
(8.0) **
1990
(92.0) **
O 947
(27.6)
2147
(62.7)
333
(9.7)
2253
(65.7)
1016
(29.7)
158
(4.6)
599
(17.5)
2063
(60.1)
769
(22.4)
1956
(56.9)
1077
(31.4)
400
(11.7)
329
(9.6) *
3101
(90.4) *
Cla
ss I
II o
bes
ity
M 152
(27.9)
342
(62.6)
52
(9.5)
385
(70.9)
141
(26.0)
17
(3.1)
121
(22.2)
300
(55.2)
123
(22.6)
304
(55.9)
180
(33.1)
60
(11.0)
68
(12.5) ***
477
(87.5)
***
F 434
(30.4)
887 (62.3) 104
(7.3)
894
(62.8)
450
(31.7)
78
(5.5)
179
(12.5)
867
(60.8)
380
(26.7)
759
(53.3)
454
(31.9)
211
(14.8)
93
(6.5) **
1329
(93.5) **
O
602
(30.1)
1243
(62.1)
62.06
(7.8)
1294
(64.8)
602
(30.1)
101
(5.1)
305
(15.2)
1183
(59.1)
514
(25.7)
1074
(53.7)
648
(32.4)
278
(13.9)
165
(8.3) *
1834
(91.7) *
(M=Male, F=Female, O=Overall)
* Chi-square <.0.05 (=0.03) ** Chi-square <.0.01 *** Chi-square = 0.81
Table 3b: Frequencies and percentages [F (%)] of sleep difficulties (in the last 12 months) among the different classes of BMI (Chi-square
<.0001).
Sleep
BMI Classes
Underweight
Desired weight Overweight Class I obesity Class II obesity Class III obesity
Sleep Difficulty
(in the past 12 months)
Male
338
(23.0)
5341
(20.8)
2856
(23.3)
974
(26.8)
351
(28.5)
184
(33.8)
Female 1298
(25.9)
13531
(24.5)
4248
(27.8)
1714
(32.1)
760
(35.2)
549
(38.6)
Overall 1652
(25.3)
19007
(23.3)
7154
(25.8)
2715
(30.0)
1126
(32.9)
748
(37.5)
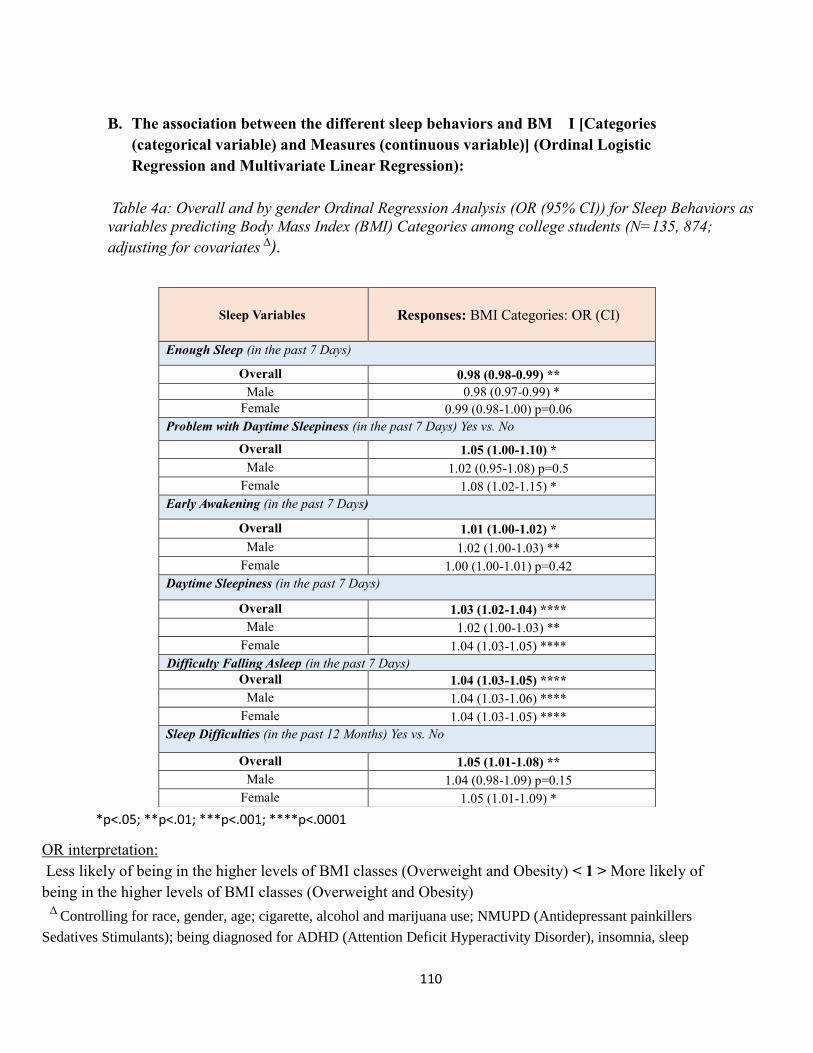
110
B. The association between the different sleep behaviors and BM I [Categories
(categorical variable) and Measures (continuous variable)] (Ordinal Logistic
Regression and Multivariate Linear Regression):
Table 4a: Overall and by gender Ordinal Regression Analysis (OR (95% CI)) for Sleep Behaviors as
variables predicting Body Mass Index (BMI) Categories among college students (N=135, 874;
adjusting for covariates ∆).
*p<.05; **p<.01; ***p<.001; ****p<.0001
OR interpretation:
Less likely of being in the higher levels of BMI classes (Overweight and Obesity) < 1 > More likely of
being in the higher levels of BMI classes (Overweight and Obesity)
∆ Controlling for race, gender, age; cigarette, alcohol and marijuana use; NMUPD (Antidepressant painkillers
Sedatives Stimulants); being diagnosed for ADHD (Attention Deficit Hyperactivity Disorder), insomnia, sleep
Sleep Variables
Responses: BMI Categories: OR (CI)
Enough Sleep (in the past 7 Days)
Overall 0.98 (0.98-0.99) **
Male 0.98 (0.97-0.99) *
Female 0.99 (0.98-1.00) p=0.06
Problem with Daytime Sleepiness (in the past 7 Days) Yes vs. No
Overall 1.05 (1.00-1.10) *
Male 1.02 (0.95-1.08) p=0.5
Female 1.08 (1.02-1.15) *
Early Awakening (in the past 7 Days)
Overall 1.01 (1.00-1.02) *
Male 1.02 (1.00-1.03) **
Female 1.00 (1.00-1.01) p=0.42
Daytime Sleepiness (in the past 7 Days)
Overall 1.03 (1.02-1.04) ****
Male 1.02 (1.00-1.03) **
Female 1.04 (1.03-1.05) ****
Difficulty Falling Asleep (in the past 7 Days)
Overall 1.04 (1.03-1.05) ****
Male 1.04 (1.03-1.06) ****
Female 1.04 (1.03-1.05) ****
Sleep Difficulties (in the past 12 Months) Yes vs. No
Overall 1.05 (1.01-1.08) **
Male 1.04 (0.98-1.09) p=0.15
Female 1.05 (1.01-1.09) *

111
disorders, and depression; the overall perceived stress level; and three different exercises behaviors, in the overall
analysis model, and excluding gender when modelling by gender. And, when we modelled one of the sleep
behavior as a predictor we controlled for the other sleep behaviors.
Table 4b: An overall and by gender Multivariate Linear Regression Analysis for the different sleep
behaviors as variables predicting BMI among college students (N=135, 874) ∆
Predictors
Sleep Variables
Responses: BMI
Estimate (Standard Error): B(SD)
Male Female Overall
Enough Sleep -0.02 (0.02) p=0.13 -0.02 (0.01) p=0.09 -0.02 (0.01) *
Early Awakening 0.04 (0.02) ** 0.02 (0.01) p=0.13 0.03 (0.10) **
Daytime Sleepiness 0.06 (0.02) **** 0.12 (0.01) **** 0.10 (0.01) ****
Difficulty Falling Asleep 0.11 (0.01) **** 0.11 (0.01) **** 0.11 (0.01) ****
Problem with Daytime Sleepiness -0.01 (0.08) p=0.9 0.22 (0.07) ** 0.11 (0.05) *
Sleep Difficulty 0.07 (0.07) p=0.3 0.16 (0.05) *** 0.13 (0.04) ***
*p<.05; **p<.01; ***p<.001; ****p<.0001
∆ Controlling for race, gender, age; cigarette, alcohol and marijuana use; NMUPD (Antidepressant
painkillers Sedatives Stimulants); being diagnosed for ADHD (Attention Deficit Hyperactivity Disorder),
insomnia, sleep disorders, and depression; the overall perceived stress level; and three different exercises
behaviors, in the overall analysis model, and excluding gender when modelling by gender. And, when we
modelled one of the sleep behavior as a predictor we controlled for the other sleep behaviors.

112
Figures:
I. Sample characteristics [N= 135,874; Age M(SD) 22(6)]
Figure 1: Demographic
Figure ia: Race distribution by gender
Figure iib: Gender distribution
0
10
20
30
40
50
60
70
80
White Black Hispanic orLatino
Asian or PacificIslander
AmericanIndian, Alaskan
Native, orNative
Hawaiian
Biracial orMultiracial
Other
Pe
rce
nta
ge %
Race Distribution %
Male Female Overall
Male35%
Female65%
Percent %
Male
Female

113
Figure 2: Covariates
Figure 2a: Percentages of Users and Non-users of Marijuana, Alcohol, and Cigarettes
among students, by gender and overall.
0
10
20
30
40
50
60
70
80
90
Use No Use No Use No
Cigarette smoking Alcohol use Marijuana use
Substance use (past 30 days) (%)
Male Female Overall

114
Figure 2b: Overall and by gender distribution of the non-medical use of prescription
drugs [NMUPD] in the past 12 months.
0
20
40
60
80
100
120
Use No Use No Use No Use No Use No
Antidepressant use Painkiller use Sedative use Stimulant use Any NMUPD
%
The Non-Medical Use of Prescription Drugs [NMUPD] %
Male Female Overall
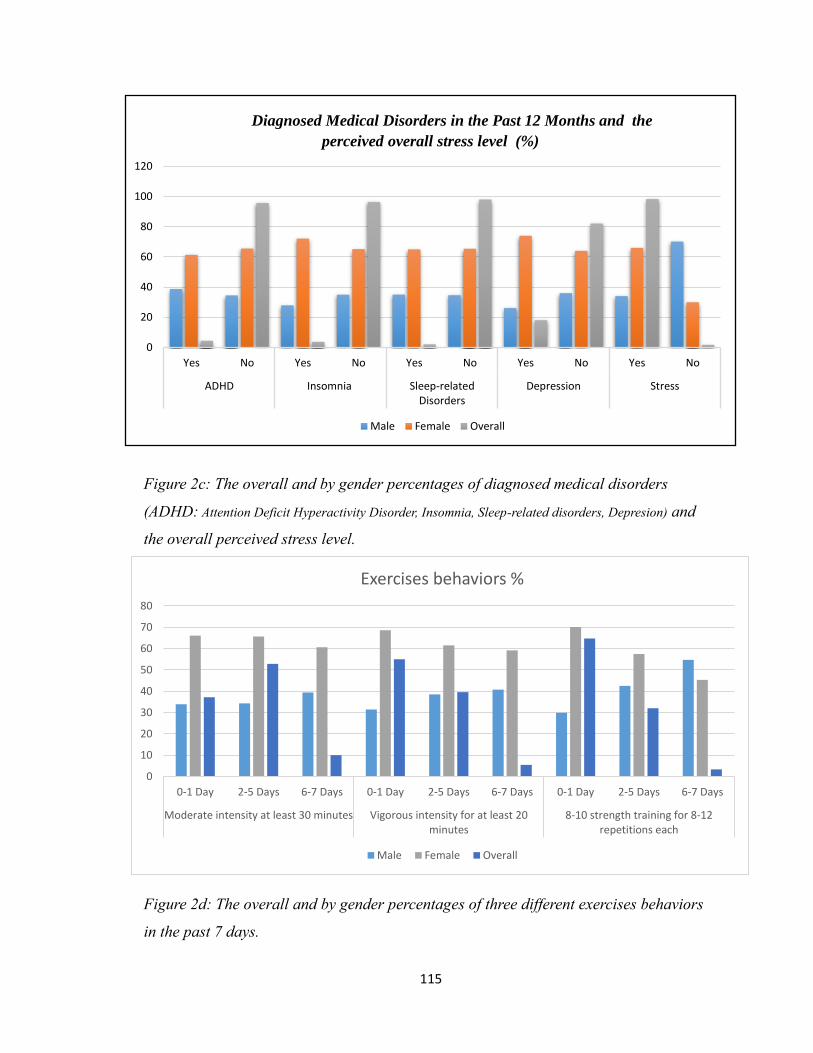
115
Figure 2c: The overall and by gender percentages of diagnosed medical disorders
(ADHD: Attention Deficit Hyperactivity Disorder, Insomnia, Sleep-related disorders, Depresion) and
the overall perceived stress level.
Figure 2d: The overall and by gender percentages of three different exercises behaviors
in the past 7 days.
0
20
40
60
80
100
120
Yes No Yes No Yes No Yes No Yes No
ADHD Insomnia Sleep-relatedDisorders
Depression Stress
Diagnosed Medical Disorders in the Past 12 Months and the
perceived overall stress level (%)
Male Female Overall
0
10
20
30
40
50
60
70
80
0-1 Day 2-5 Days 6-7 Days 0-1 Day 2-5 Days 6-7 Days 0-1 Day 2-5 Days 6-7 Days
Moderate intensity at least 30 minutes Vigorous intensity for at least 20minutes
8-10 strength training for 8-12repetitions each
Exercises behaviors %
Male Female Overall

116
Figure 2e: The overall and by gender percentages of four different behaviors used by
students to lose weight in the past 30 days.
0102030405060708090
100
YES NO YES NO YES NO YES NO
EXERCISES TO LOSE WEIGHT
DIET TO LOSE WEIGHT VOMIT OR LAXATIVES TO LOSE WEIGHT
PILLS TO LOSE WEIGHT
Losing weight behaviors %
Male Female Overall
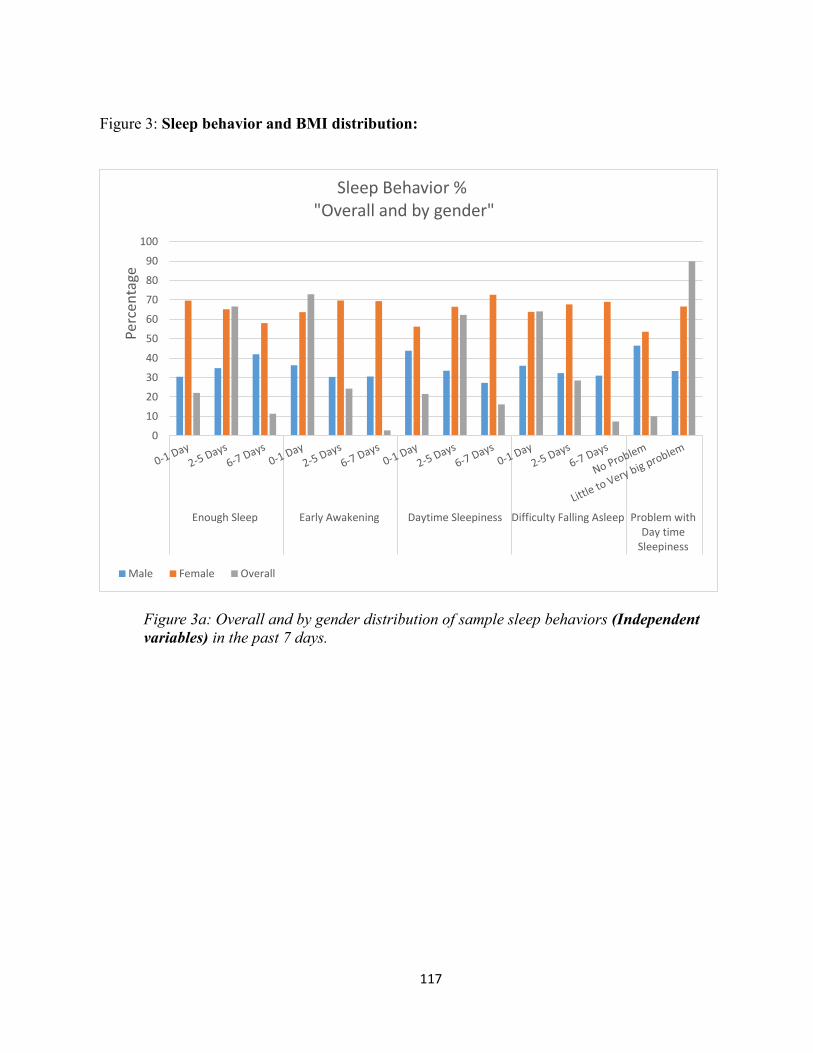
117
Figure 3: Sleep behavior and BMI distribution:
Figure 3a: Overall and by gender distribution of sample sleep behaviors (Independent
variables) in the past 7 days.
0
10
20
30
40
50
60
70
80
90
100
Enough Sleep Early Awakening Daytime Sleepiness Difficulty Falling Asleep Problem withDay time
Sleepiness
Perc
enta
ge
Sleep Behavior % "Overall and by gender"
Male Female Overall

118
Figure 3b: Distribution of sleep behaviors (Independent variables) among male in the
past 7 days.
Figure 3c: Distribution of sleep behaviors (Independent variables) among female in the
past 7 days.
0
10
20
30
40
50
60
70
80
90
100
Enough Sleep Early Awakening Daytime Sleepiness Difficulty FallingAsleep
Problem withDaytime
Sleepiness
Perc
enta
ge
Males' Sleep Behavior
0
10
20
30
40
50
60
70
80
90
100
Enough Sleep Early Awakening Daytime Sleepiness Difficulty Falling Asleep Problem withDaytime
Sleepiness
Per
cen
tage
Females' Sleep Behavior

119
Figure 3d: An overall and by gender distribution (%) of having sleep difficulties in the
past 12 months.
Figure 3e: Overall and by gender distribution of BMI Classifications
31.2
68.8
24.8
0
10
20
30
40
50
60
70
80
1
%Sleep Difficulties in the past 12 Months
Male Female Overall
0 10 20 30 40 50 60 70 80 90
Underweight
Desired weight
Overweight
Class I obesity
Class II obesity
Class III obesity
BMI Classification %
Overall Female Male

120
Figure 3f: Overall distribution of BMI Classifications
Figure 3g: Distribution of the different BMI Classifications among male
5
62.6
21.3
7
2.6 1.5
Overall BMI classes
Underweight Desired weight Overweight Class I obesity Class II obesity Class III obesity
3.3
57.3
27.4
8
2.8 1.2
BMI Classification Among Male %
Underweight Desired weight Overweight Class I obesity Class II obesity Class III obesity

121
Figure 3h: Distribution of the different BMI Classifications among female
5.9
65.4
18.1
6.3
2.61.7
BMI Classification Among Female %
Underweight Desired weight Overweight Class I obesity Class II obesity Class III obesity

122
II. Association between sleep behaviors and BMI:
Figure 4: The relationship between sleep behavior and BMI (Multivariate Ordinal
Regression and Multivariate Linear Regression analysis)
Figure 4a: Ordinal Regression Analysis (OR (95% CI)) for the non-medical use of
prescription drugs (NMUPD) as variables predicting sleep behaviors among college
students
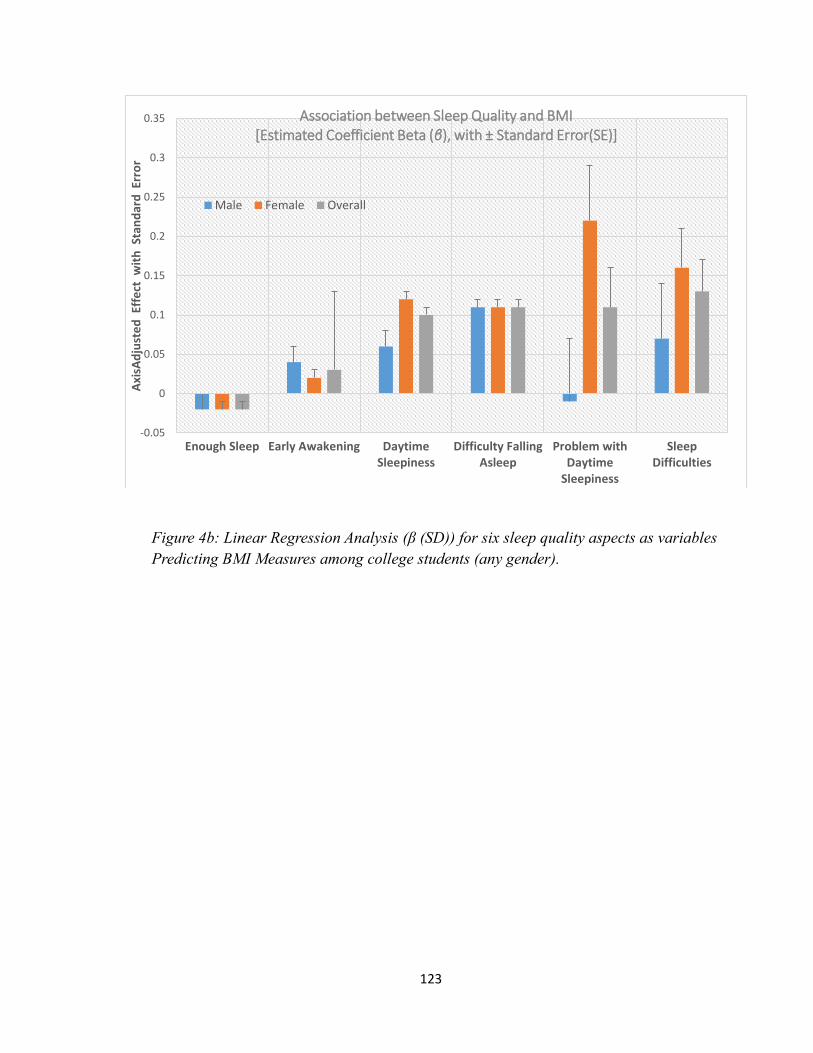
123
Figure 4b: Linear Regression Analysis (β (SD)) for six sleep quality aspects as variables
Predicting BMI Measures among college students (any gender).
-0.05
0
0.05
0.1
0.15
0.2
0.25
0.3
0.35
Enough Sleep Early Awakening DaytimeSleepiness
Difficulty FallingAsleep
Problem withDaytime
Sleepiness
SleepDifficulties
Axi
sAd
just
ed
Eff
ect
wit
h S
tan
dar
d E
rro
r
Association between Sleep Quality and BMI[Estimated Coefficient Beta (β), with ± Standard Error(SE)]
Male Female Overall
124
Appendix C
Aim3, Results’ Tables and Figures

125
III. Descriptive results: sample characteristics
Table 3: External/Covariates Variables
Table 1a: Demographic (F (%): F=Frequency, %= percentage)
Characteristics Male F(%)
[n = 133 (38. 7)]
Female F(%)
[n = 211 (61. 3)]
Overall F(%)
[N=494 (100)]
Age M(SD) = 20(5.7)
Race/Ethnicity White 106 (35.8) 190 (64.2) 296 (87.0)
Black or African American 10 (71.4) 4 (28.6) 14 (4.0)
Asian 6 (60.0) 4 (40.0) 10 (2.9)
American Indian, Alaskan
Native 0 (0.0) 2 (100) 2 (0.6)
Other 11 (57.9) 8 (42.1) 19 (5.5)
Year of Enrollment Freshman 64 (44.1) 81 (55.9) 145 (42.4)
Sophomore 32 (41.0) 46 (59.0) 78 (22.8)
Junior 20 (29) 49 (71.0) 69 (20.2)
Senior 16 (32.0) 34 (68.0) 50 (14.6)
Job Fulltime 6 (31.6) 13 (68.4) 19 (5.5)
Part-time 38 (31.7) 82 (68.3) 120 (35.0)
Unemployed 89 (43.4) 116 (56.6) 205 (59.5)
Annual Income <$10.000 107 (37.0) 182 (63.0) 289 (85.8)
$10.000-$19.999 12 (57.1) 9 (42.9) 21 (6.2)
$20.0000-$29.999 8 (50.0) 8 (50.0) 16 (4.7)
$30.000-$39.999 2 (50.0) 2 (50.0) 4 (1.2)
>$40.000 3 (42.9) 4 (57.1) 7 (2.1)
Marital Status Married 2 (33.3) 4 (66.7) 6 (1.7)
separated 1 (100) 0 (0.0) 1 (0.3)
Divorced 1 (33.3) 2 (66.7) 3 (0.9)
Never married 128 (38.4) 205 (61.6) 333 (97.1)
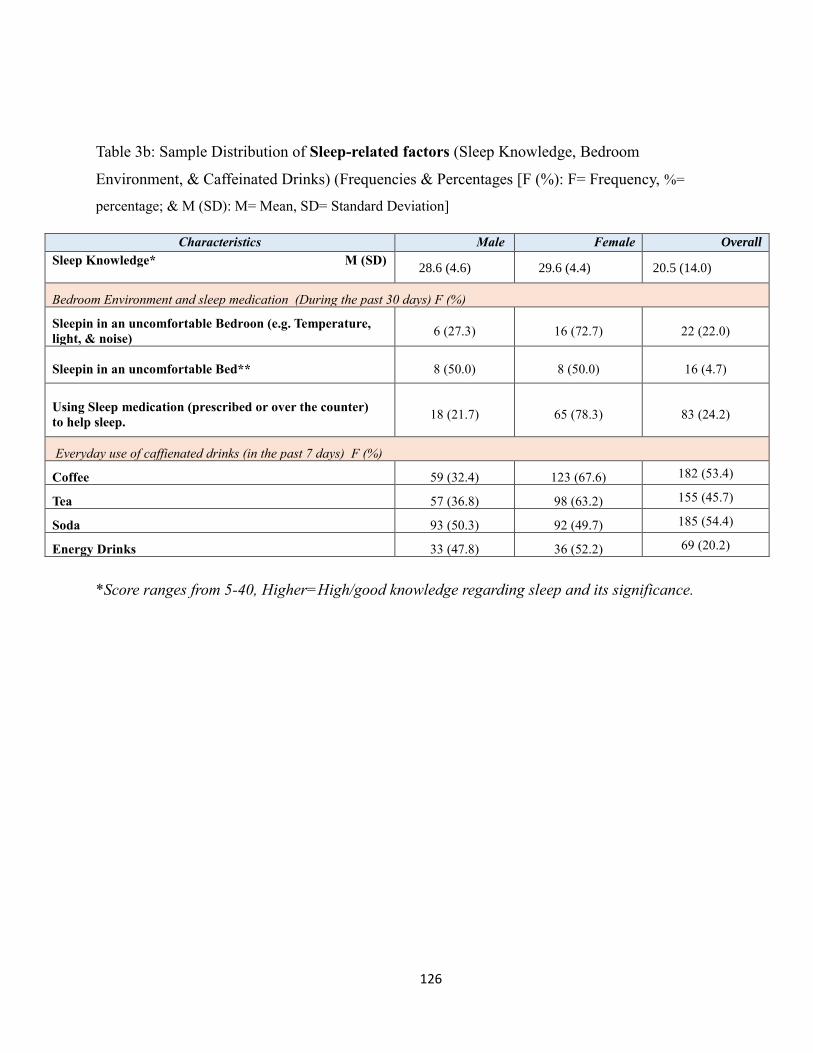
126
Table 3b: Sample Distribution of Sleep-related factors (Sleep Knowledge, Bedroom
Environment, & Caffeinated Drinks) (Frequencies & Percentages [F (%): F= Frequency, %=
percentage; & M (SD): M= Mean, SD= Standard Deviation]
*Score ranges from 5-40, Higher=High/good knowledge regarding sleep and its significance.
Characteristics Male Female Overall
Sleep Knowledge* M (SD)
28.6 (4.6) 29.6 (4.4) 20.5 (14.0)
Bedroom Environment and sleep medication (During the past 30 days) F (%)
Sleepin in an uncomfortable Bedroon (e.g. Temperature,
light, & noise) 6 (27.3) 16 (72.7) 22 (22.0)
Sleepin in an uncomfortable Bed** 8 (50.0) 8 (50.0) 16 (4.7)
Using Sleep medication (prescribed or over the counter)
to help sleep. 18 (21.7) 65 (78.3) 83 (24.2)
Everyday use of caffienated drinks (in the past 7 days) F (%)
Coffee 59 (32.4) 123 (67.6) 182 (53.4)
Tea 57 (36.8) 98 (63.2) 155 (45.7)
Soda 93 (50.3) 92 (49.7) 185 (54.4)
Energy Drinks 33 (47.8) 36 (52.2) 69 (20.2)

127
Table 1c: Sample Distribution of Substance use (Cigarette, Alcohol, and Marijuana) The
Nonmedical use of prescription drugs (Antidepressants, Painkiller, Stimulants, and Sedatives),
Diagnosed Medical Disorders, and the Overall Perceived Stress Level (F (%): F=Frequency, %=
percentage)
Table 1d: Sample Distribution of Other Covariates (BMI & BMI Classifications, Exercises, and
Ways to lose weight [F (%): F= Frequency, %= percentage; & M (SD): M= Mean, SD= Standard
Deviation]
Characteristics
Male Female
Overall
Substance use (past 30 days)
Cigarette smoking 38 (41.3) 54 (58.7) 92 (27.5)
Marijuana use 51 (33.6) 101 (66.4) 152 (44.4)
Alcohol use (on average reported use of 1-7 days/week) 64 (32.3) 134 (67.7) 198 (58.0)
The Nonmedical Use of Prescription Drugs (past 12 months)
Antidepressants use 4 (25.0) 12 (75.0) 16 (4.7)
Painkillers use 3 (20.0) 12 (80.0) 15 (4.4)
Stimulants use 13 (46.4) 15 (53.6) 28 (8.2)
Sedatives use 5 (38.5) 8 (61.5) 13 (3.8)
Diagnosed Medical Disorders in the Past 12 Months and the perceived overall stress level
Attention Deficit Hyperactivity Disordr (ADHD) 7 (31.8) 15 (68.2) 22 (6.4)
Insomnia 4 (26.7) 11 (73.3) 14 (4.5)
Sleep-related Disorders 4 (33.3) 8 (66.7) 12 (3.6)
Depression 10 (20.0) 40 (80.0) 50 (14.6)
Stress 125 (37.4) 210 (62.6) 335 (97.4)
Characteristics Male Female Overall
Body Mass Index [BMI]), Overall BMI and BMI Classifications
Overall M(SD) 24.7 (5.2) 24.3 (4.7) 24.4 (4.9)
BMI Classifications F (%)
Underweight 13 (65.0) 7 (35.0) 20 (6.0)
Normal weight 59 (30.7) 133 (69.3) 192 (57.3)
Overweight 40 (51.3) 38 (48.7) 78 (23.3)
Obesity 17 (37.8) 28 (62.2) 45 (13.4)
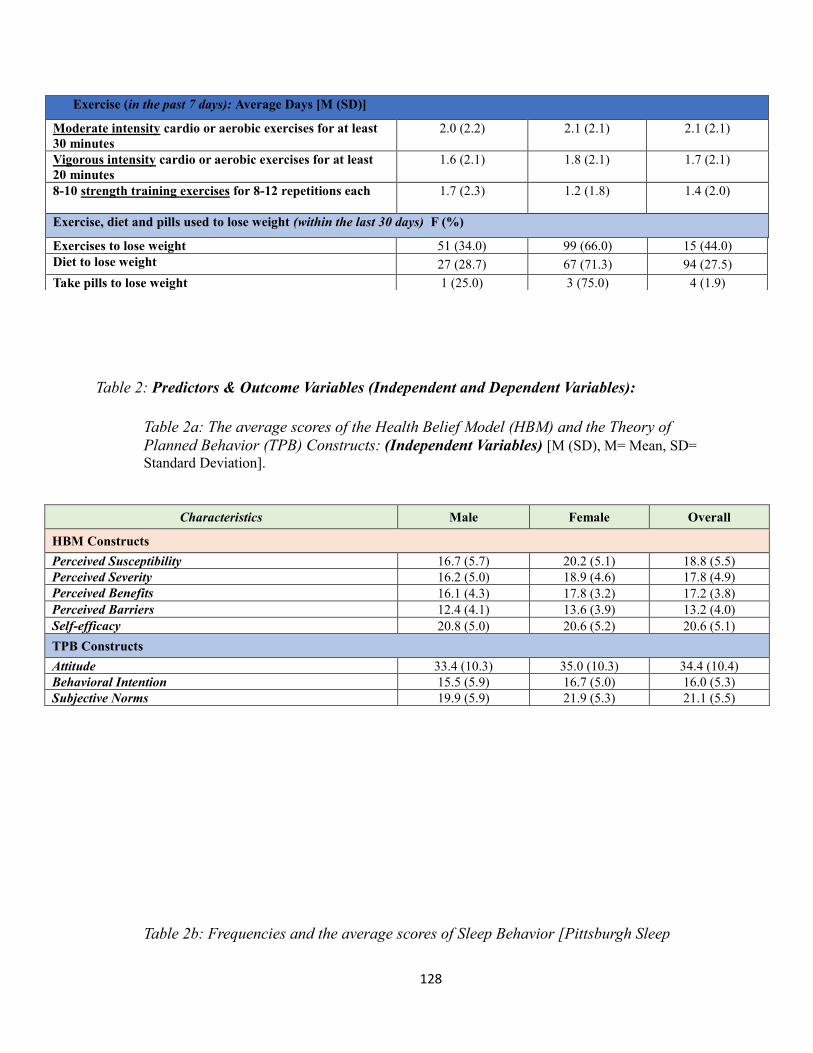
128
Table 2: Predictors & Outcome Variables (Independent and Dependent Variables):
Table 2a: The average scores of the Health Belief Model (HBM) and the Theory of
Planned Behavior (TPB) Constructs: (Independent Variables) [M (SD), M= Mean, SD=
Standard Deviation].
Table 2b: Frequencies and the average scores of Sleep Behavior [Pittsburgh Sleep
Exercise (in the past 7 days): Average Days [M (SD)]
Moderate intensity cardio or aerobic exercises for at least
30 minutes
2.0 (2.2) 2.1 (2.1) 2.1 (2.1)
Vigorous intensity cardio or aerobic exercises for at least
20 minutes
1.6 (2.1) 1.8 (2.1) 1.7 (2.1)
8-10 strength training exercises for 8-12 repetitions each
1.7 (2.3) 1.2 (1.8) 1.4 (2.0)
Exercise, diet and pills used to lose weight (within the last 30 days) F (%)
Exercises to lose weight 51 (34.0) 99 (66.0) 15 (44.0)
Diet to lose weight 27 (28.7) 67 (71.3) 94 (27.5)
Take pills to lose weight 1 (25.0) 3 (75.0) 4 (1.9)
Characteristics Male Female Overall
HBM Constructs
Perceived Susceptibility 16.7 (5.7) 20.2 (5.1) 18.8 (5.5)
Perceived Severity 16.2 (5.0) 18.9 (4.6) 17.8 (4.9)
Perceived Benefits 16.1 (4.3) 17.8 (3.2) 17.2 (3.8)
Perceived Barriers 12.4 (4.1) 13.6 (3.9) 13.2 (4.0)
Self-efficacy 20.8 (5.0) 20.6 (5.2) 20.6 (5.1)
TPB Constructs
Attitude 33.4 (10.3) 35.0 (10.3) 34.4 (10.4)
Behavioral Intention 15.5 (5.9) 16.7 (5.0) 16.0 (5.3)
Subjective Norms 19.9 (5.9) 21.9 (5.3) 21.1 (5.5)

129
Quality Index (PSQI]) (Main outcome) and Health Related Quality of Life (HRQOL)
(Secondary outcome) [F (%): F= Frequency, %= percentage; & M (SD): M= Mean, SD=
Standard Deviation]
*Higher Score= worse sleep quality: > 5 (based on the cutoff point of the PSQI) = Poor sleep Quality
** Higher Score= More Unhealthy days
IV. Inferential Analysis
Characteristics (during the past 30 days) Male Female Overall
Sleep Behavior
Actual Sleep Hours/night M (SD) 6.7 (1.2) 6.7 (1.3) 6.7 (1.3)
Global Sleep Quality Score*
M(SD) 6.5 (3.1) 8.0 (3.4) 6.2 (4.2)
Sleep Quality F (%) Good Sleep Quality 55 (51.4) 52 (48.6) 107 (31.0)
Poor Sleep Quality 78 (33.0) 159 (67.0) 237 (69.0)
HRQOL
Unhealthy Days**
M(SD) 8.2 (8.8) 13.0 (10.0) 10.7 (9.7)
Self-rated Health F (%) Poor 0 (0.0) 1 (100) 1 (0.3)
Fair 19 (32.2) 40 (67.8) 59 (17.2)
Good 19 (45.2) 23 (54.8) 42 (12.2)
Very Good 68 (34.5) 129 (65.5) 197 (57.3)
Excellent 27 (60.0) 18 (40.0) 45 (13.0)

130
Table 3: SEM and Logistic Regression
The prediction role of the HBM and the TPB of Sleep quality (SEM):
Table 3a1: Regression Weights: (all - Default model) – UNSTANDARDIZED REGRESSION
PARAMETERS Estimate = regression coefficient, SE = Standard Error, CR = Critical Ratio, P =
p-value.
Model
variables
Estimate S.E. C.R. P Label
HBM <--- enrollment2 -.201 .130 -1.549 .121 par_6
HBM <--- race2 -.187 .442 -.422 .673 par_7
HBM <--- gender2 1.696 .333 5.096 *** par_17
IntentionScore <--- HBM .657 .158 4.157 *** par_3
IntentionScore <--- enrollment2 -.335 .278 -1.204 .228 par_8
IntentionScore <--- race2 -.202 .948 -.213 .831 par_10
IntentionScore <--- gender2 .558 .693 .806 .420 par_18
GSQS <--- IntentionScore -.253 .036 -7.101 *** par_4
GSQS <--- HBM .218 .094 2.314 .021 par_5
GSQS <--- enrollment2 -.011 .165 -.069 .945 par_9
GSQS <--- race2 .345 .561 .615 .539 par_16
GSQS <--- gender2 1.509 .409 3.687 *** par_19
BenefitsScore <--- HBM 1.000
SeverityScore <--- HBM 1.915 .191 10.020 *** par_1
SusceptScore <--- HBM 1.763 .178 9.880 *** par_2
Unhealthydays <--- GSQS 1.368 .164 8.325 *** par_11
Unhealthydays <--- HBM .808 .267 3.031 .002 par_12
Unhealthydays <--- IntentionScore -.017 .107 -.158 .874 par_13
Unhealthydays <--- enrollment2 .314 .455 .689 .491 par_14
Unhealthydays <--- race2 .217 1.549 .140 .889 par_15
Unhealthydays <--- gender2 1.734 1.155 1.501 .133 par_20

131
Table 3a2: Standardized Regression Weights: (all - Default model) – STANDARDIZED
REGRESSON PARAMETERS
Model Variables Estimate
HBM <--- enrollment2 -.095
HBM <--- race2 -.026
HBM <--- gender2 .350
IntentionScore <--- HBM .288
IntentionScore <--- enrollment2 -.069
IntentionScore <--- race2 -.012
IntentionScore <--- gender2 .051
GSQS <--- IntentionScore -.402
GSQS <--- HBM .152
GSQS <--- enrollment2 -.004
GSQS <--- race2 .033
GSQS <--- gender2 .217
BenefitsScore <--- HBM .619
SeverityScore <--- HBM .906
SusceptScore <--- HBM .742
Unhealthydays <--- GSQS .461
Unhealthydays <--- HBM .190
Unhealthydays <--- IntentionScore -.009
Unhealthydays <--- enrollment2 .035
Unhealthydays <--- race2 .007
Unhealthydays <--- gender2 .084
Table 3a3: Squared Multiple Correlations: (all - Default model) R2 FOR PREDICTED
VARIABLES AND LATENT INDICATORS
Estimate
HBM .121
IntentionScore .101
GSQS .196
Unhealthydays .306
SusceptScore .550
SeverityScore .821
BenefitsScore .383
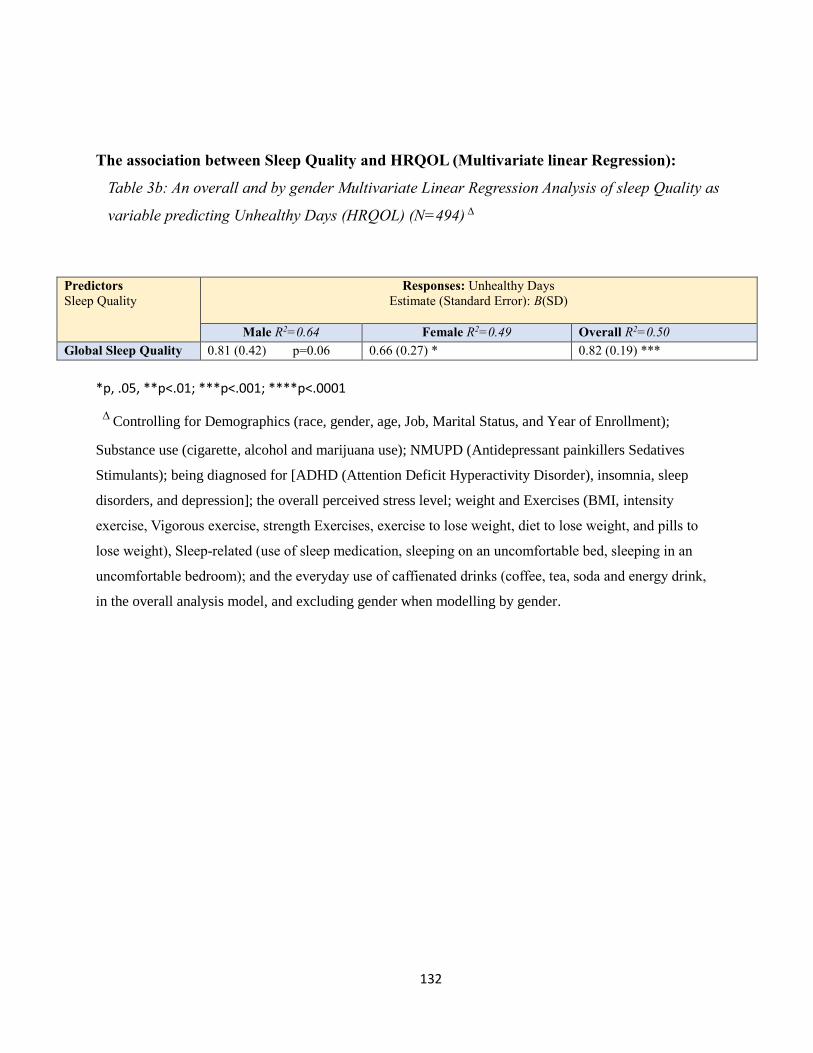
132
The association between Sleep Quality and HRQOL (Multivariate linear Regression):
Table 3b: An overall and by gender Multivariate Linear Regression Analysis of sleep Quality as
variable predicting Unhealthy Days (HRQOL) (N=494) ∆
Predictors
Sleep Quality
Responses: Unhealthy Days
Estimate (Standard Error): B(SD)
Male R2=0.64 Female R2=0.49 Overall R2=0.50
Global Sleep Quality 0.81 (0.42) p=0.06 0.66 (0.27) * 0.82 (0.19) ***
*p, .05, **p<.01; ***p<.001; ****p<.0001
∆ Controlling for Demographics (race, gender, age, Job, Marital Status, and Year of Enrollment);
Substance use (cigarette, alcohol and marijuana use); NMUPD (Antidepressant painkillers Sedatives
Stimulants); being diagnosed for [ADHD (Attention Deficit Hyperactivity Disorder), insomnia, sleep
disorders, and depression]; the overall perceived stress level; weight and Exercises (BMI, intensity
exercise, Vigorous exercise, strength Exercises, exercise to lose weight, diet to lose weight, and pills to
lose weight), Sleep-related (use of sleep medication, sleeping on an uncomfortable bed, sleeping in an
uncomfortable bedroom); and the everyday use of caffienated drinks (coffee, tea, soda and energy drink,
in the overall analysis model, and excluding gender when modelling by gender.
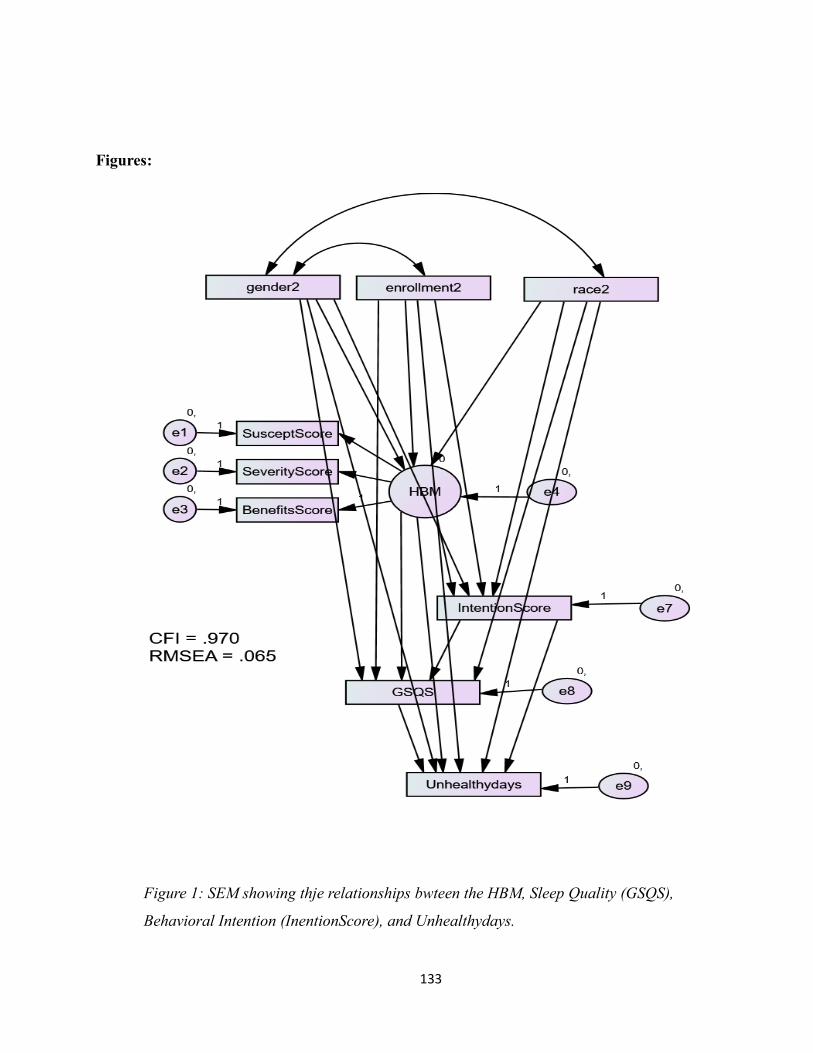
133
Figures:
Figure 1: SEM showing thje relationships bwteen the HBM, Sleep Quality (GSQS),
Behavioral Intention (InentionScore), and Unhealthydays.

Yahya Alamir College Students’ Sleep Quality 134
134
Figure 3b: By gender and overall Multivariate Linear Regression Analysis (Point
estimate (SE)) for sleep quality (poor) as variables predicting unhealthy days (HRQOL).
0
0.2
0.4
0.6
0.8
1
1.2
1.4
Ad
just
ed
Eff
ect
wit
h S
tan
dar
d E
rro
rAssociation between Sleep Quality and HRQOL (Unhealthydays)
[Estimated Coefficient Beta (β), with ± Standard Error(SE)]
Male
Female
Overall

Yahya Alamir College Students’ Sleep Quality 135
135
Appendix D
Aim3, Survey

Yahya Alamir College Students’ Sleep Quality 136
136
Undergraduate Students' Sleep Behavior Survey
1 IC Welcome..and thank you for your interest in taking the survey. The following informed
consent explain what this survey is, how it works, and how your privacy will be protected. We want you
to understand what are you being asked to do and what risks and benefits-if any- are associated with
this survey. This will help you decide whether or not to participate. Please read the following
document carefully.
1.2 IC
1.3 IC Human Research Protocol Only Minimal Risk Consent Form (With HIPAA)
1.4 IC Principal Investigator: Keith Zullig
Department: Social and Behavioral Sciences/ School of Public Health
Protocol Number: 1603066826
Study Title: A Theory-Based Description of Sleep Behavior and its Impact on Health-Related
Quality Of Life Using the Health Belief Model and the Theory of Planned Behavior
Co-Investigator(s): Yahya Alamir
Contact Persons: If you have any questions, concerns, or complaints about this research, you
can contact Dr. Keith Zullig at (304) 293- 1091 or Yahya Alamir at (681) 753-8223. For information
regarding your rights as a research subject, to discuss problems, concerns, or suggestions related to the
research, or would like to offer input about the research, contact the Office of Research Integrity and
Compliance at (304) 293-7073. Introduction: You, ______________________, have been asked to
participate in this research study, which has been explained to you by Yahya Alamir. This study is being
conducted by Dr. Keith Zullig and a PhD student Yahya Alamir in the Department of Social and
Behavioral Sciences/ School of Public Health at West Virginia University. Purpose(s) of the
Study: The project is intended to describe college students’ sleep and their behavioral determinants in
order to better understand sleep behavior of undergraduate college students. Additionally, we are
interested in assessing the association between sleep behavior, particularly poor sleep and health
related quality of life. Description of Procedures: This study involves a self-reported questionnaire
that incorporates several scales measuring health-related quality of life, sleep behavior, and constructs
from the Theory of Planned Behavior and Health Belief Model. You will be asked to answer questions
regarding your sleep behavior, quality of life, drug and alcohol use, some medical disorders, your life at
West Virginia University, and demographic information. The questionnaire will take approximately 30-
40 minutes for you to complete. Although it would be helpful, you do not have to answer all the
Yahya Alamir College Students’ Sleep Quality 137
137
questions. You will have the opportunity to see the questionnaire before providing your consent for this
research. Discomforts: There are no known or expected risks from participating in this study, except
for the mild frustration associated with answering some of the questions. Alternatives: You do not
have to participate in this study. You have the right to refuse to participate and /or withdraw at any
time.
1.5 IC Benefits: Information about the significance of sleep in addition guidelines to achieve
healthy sleep behavior will be learned from this research, which in turn may improve general health and
academic performance. Financial Considerations: You will have a chance to win one of one of 50 Panera
gift cards ($ 10 value each) for your participation in this project. Confidentiality: Any information about
you that is obtained as a result of your participation in this research will be kept as confidential as legally
possible. Once all incentives have been dispersed, data collected through Qualtrics will be exported to
Excel and then formatted for analysis in SAS. Privacy and anonymity will be maintained by replacing
students’ e mail addresses and other information with encoded identifiers. Then the data in Qualtrics
will be destroyed, rendering all collected data anonymous. All data will be kept on a designed WVU
computer located in PhD students’ office, and assigned to be used only by Yahya Alamir. These files will
be encrypted or password protected, and only accessed Dr. Keith Zullig, and the co-investigators, Yahya
Alamir and Dr. Sijin Wen. WVU IT, keeps updated anti-virus protection on every computer, maintains up-
to-date versions of all software and media storage devices, and updates firewall. Computer files will be
backed up and the backup data stored in a secure place physically removed from the original data. Data
backups are secured and disaster recovery is routinely tested. In addition, any paper copies of research
material will be kept in a locked cabinet. In any publications that result from this research, neither your
name nor any information from which you might be identified will be published without your consent.

Yahya Alamir College Students’ Sleep Quality 138
138
1.6 IC HIPAA: We know that information about you and your health is private. We are dedicated
to protecting the privacy of that information. Because of this promise, we must get your written
authorization (permission) before we may use or disclose your protected health information or share it
with others for research purposes. You can decide to sign or not to sign this authorization section.
However, if you choose not to sign this authorization, you will not be able to take part in the research
study. Whatever choice you make about this research study will not have an effect on your access to
medical care.
Persons/Organizations Providing the Information: You as Student
Persons/Organizations Receiving the Information:
• The research team carrying out this study. This includes Dr. Keith Zullig, Yahya Alamir, and
Dr. Sijin Wen.
• The members and staff of any Institutional Review Board (IRB) that oversees this research
study.
• West Virginia University Office of Research Integrity and Compliance and Office of Sponsored
Programs. The Following Information Will Be Used: Information from you about your sleep health,
quality of life, diagnosed medical disorders, alcohol and drugs use, your life at West Virginia, knowledge
regarding sleep, sleep related factors existing medical records and demographic data. The Information is
Being Disclosed for the Following Reasons: Publication of study results (without identifying you). You
May Cancel this Authorization at Any Time by Writing to the Principal Investigator: Keith J. Zullig, MSPH,
PhD Tel: (304) 293-1091; E-mail: [email protected]
If you cancel this authorization, any information that was collected already for this study cannot
be withdrawn. Once information is disclosed, according to this authorization, the recipient may
redisclose it and then the information may no longer be protected by federal regulations. This
authorization will expire at the end of the study unless you cancel it before that time (or has a specific
expiration date).

Yahya Alamir College Students’ Sleep Quality 139
139
1.7 IC Voluntary Participation: Participation in this study is voluntary. You are free to withdraw
your consent to participate in this study at any time. Refusal to participate or withdrawal will not affect
your class standing or grades, and will involve no penalty to you. Refusal to participate or withdrawal
will not affect your future care, or your employee status at West Virginia University. In the event new
information becomes available that may affect your willingness to participate in this study, this
information will be given to you so that you can make an informed decision about whether or not to
continue your participation. You have been given the opportunity to ask questions about the research,
and you have received answers concerning areas you did not understand. By clicking Agree on the next
page (Electronic Consent) you are willingly consent to participate in this research. The participant has
had the opportunity to have questions addressed. The participant willingly agrees to be in the study.
2EC Electronic Consent "Your decision":
Agree (1)
Disagree (2)
Instructions: Thank you for agreeing to take part in our study on sleep behavior! Your valuable
responses to our questionnaire will help us better understand factors that influence your sleep so we
learn how to promote students’ sleep health. The results of this survey will help in proposing and
developing health promotion programs to improve the quality of college students’ sleep. The
questionnaire will take you about 35 minutes to complete. Please follow the instructions for each
question. If you are not comfortable answering a particular question, you may leave it blank. You may
choose to stop this questionnaire at any time.

Yahya Alamir College Students’ Sleep Quality 140
140
AQ1 Would you say that in general your health is:
Excellent (5)
Good (4)
Very good (3)
Fair (2)
Poor (1)
AQ2 Now thinking about your physical health, which includes physical illness and injury, for how
many days during the past 30 days was your physical health not good?
Number of days (1) ____________________
None (2)
AQ3 Now thinking about your mental health, which includes stress, depression, and problem
with emotion, for how many days during the past 30 days was your mental health not good?
Number of days (1) ____________________
None (2)
AQ4 During the past 30 days, for about how many days did poor physical or mental health keep
you from doing your usual activities, such as self-care, work, or recreation?
Number of days (1) ____________________
None (2)
These next questions are about physical, mental, or emotional problems or limitations you may
have in your daily life
AQ5 Are you LIMITED in any way in any activities because of any impairment or health
problem?
Yes (1)
No (2)

Yahya Alamir College Students’ Sleep Quality 141
141
AQ6 What is the MAJOR impairment or health problem that limits your activities?
Arthritis/rheumatism (1)
Back or neck problem (2)
Fractures, bone/joint injury (3)
Walking problem (4)
Lung/breathing problem (5)
Hearing problem (6)
Eye/vision problem (7)
Heart problem (8)
Stroke problem (9)
Hypertension/high blood pressure (10)
Diabetes (11)
Cancer (12)
Depression/anxiety/emotional problem (13)
Other impairment/problem (14)
Good Start..Keep going

Yahya Alamir College Students’ Sleep Quality 142
142
AQ7 For HOW LONG have your activities been limited because of your major impairment or
health problem?
Days (4) ____________________
Weeks (3) ____________________
Months (2) ____________________
Years (1) ____________________
AQ8 Because of any impairment or health problem, do you need the help of other persons with
your PERSONAL CARE needs, such as eating, bathing, dressing, or getting around the house?
Yes (1)
No (2)
AQ9 Because of any impairment or health problem, do you need the help of other persons in
handling your ROUTINE needs, such as everyday household chores, doing necessary business, shopping,
or getting around for other purposes?
Yes (1)
No (2)
AQ10 During the past 30 days, for about how many days did PAIN make it hard for you to do
your usual activities, such as self-care, work, or recreation?
Number of days (1) ____________________
None (2)
AQ11 During the past 30 days, for about how many days have you felt SAD, BLUE, or
DEPRESSED?
Number of days (1) ____________________
None (2)
AQ12 During the past 30 days, for about how many days have you felt WORRIED, TENSE, or
ANXIOUS?
Number of days (1) ____________________
None (2)

Yahya Alamir College Students’ Sleep Quality 143
143
AQ13 During the past 30 days, for about how many days have you felt VERY HEALTHY AND FULL
OF ENERGY?
Number of days (2) ____________________
None (1)
Great....Now you will move to Sleep Health section that assesses your sleep

Yahya Alamir College Students’ Sleep Quality 144
144
The following questions relate to your usual sleep habits during the past month only. Your
answers should indicate the most accurate reply for the majority of days and nights in the past
month. Please answer all questions.
BQ1 During the past month, what time have you usually gone to bed at night? BED TIME:
BQ2 During the past month, how long (in minutes) has it usually taken you to fall asleep each
night? NUMBER OF MINUTES:
BQ3 During the past month,what time have you usually gotten up in the
morning? GETTING UP TIME :
BQ4 During the past month, how many hours of actual sleep did you get at night? (This may be
different than the number of hours you spent in bed.) HOURS OF SLEEP PER NIGHT:
For each of the remaining questions, check the one best response. Please answer all questions.
BQ5 During the past month, how often have you had trouble sleeping because you:
BQ5a Cannot get to sleep within 30 minutes
Not during the past month (4)
Less than once a week (3)
Once or twice a week (2)
Three or more times a week (1)
BQ5b Wake up in the middle of the night or early morning
Not during the past month (4)
Less than once a week (3)
Once or twice a week (2)
Three or more times a week (1)
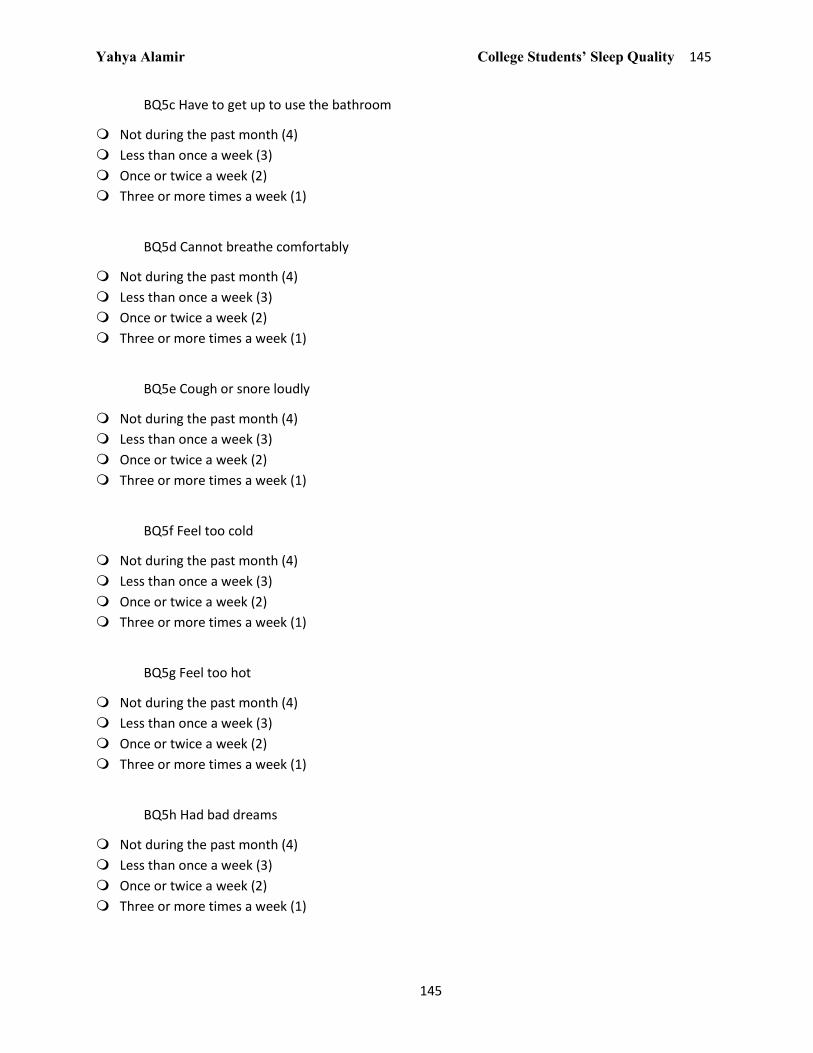
Yahya Alamir College Students’ Sleep Quality 145
145
BQ5c Have to get up to use the bathroom
Not during the past month (4)
Less than once a week (3)
Once or twice a week (2)
Three or more times a week (1)
BQ5d Cannot breathe comfortably
Not during the past month (4)
Less than once a week (3)
Once or twice a week (2)
Three or more times a week (1)
BQ5e Cough or snore loudly
Not during the past month (4)
Less than once a week (3)
Once or twice a week (2)
Three or more times a week (1)
BQ5f Feel too cold
Not during the past month (4)
Less than once a week (3)
Once or twice a week (2)
Three or more times a week (1)
BQ5g Feel too hot
Not during the past month (4)
Less than once a week (3)
Once or twice a week (2)
Three or more times a week (1)
BQ5h Had bad dreams
Not during the past month (4)
Less than once a week (3)
Once or twice a week (2)
Three or more times a week (1)

Yahya Alamir College Students’ Sleep Quality 146
146
BQ5i Have pain
Not during the past month (4)
Less than once a week (3)
Once or twice a week (2)
Three or more times a week (1)
BQ5j Other reason(s), please describe
BQ5j How often during the past month have you had trouble sleeping because of this?
Not during the past month (4)
Less than once a week (3)
Once or twice a week (2)
Three or more times a week (1)
BQ6 During the past month, how would you rate your sleep quality overall?
Very good (4)
Fairly good (3)
Fairly bad (2)
Very bad (1)
BQ7 During the past month, how often have you taken medicine to help you sleep (prescribed
or "over the counter")?
Not during the past month (4)
Less than once a week (3)
Once or twice a week (2)
Three or more times a week (1)
BQ8 During the past month, how often have you had trouble staying awake while driving, eating
meals, or engaging in social activity?
Not during the past month (4)
Less than once a week (3)
Once or twice a week (2)
Three or more times a week (1)

Yahya Alamir College Students’ Sleep Quality 147
147
BQ9 During the past month, how much of a problem has it been for you to keep up enough
enthusiasm to get things done?
No problem at all (4)
Only a very slight problem (3)
Somewhat of a problem (2)
A very big problem (1)
BQ10 Do you have a bed partner or roommate?
No bed partner or roommate (4)
Partner/roommate in other room (3)
Partner in same room, but not same bed (2)
Partner in same bed (1)
You are doing Great! Keep going.....In the next two sections we are interesting in
understanding your sleep behavior
The questions in this section make use of rating scales with seven (7) answers. Please indicate
where you fall on the scale. In this first set of questions, please consider how much control you feel
you have over your sleeping habits
CQ1 For me, to sleep 7 to 8 hours every night is: (one being extremely not practical and 7 being
extremely practical)
1
(1) 2
(2) 3
(3) 4
(4) 5
(5) 6
(6) 8
(7)
Not Practical: Practical (CQ1_1)

Yahya Alamir College Students’ Sleep Quality 148
148
CQ2 If I wanted to, I am sure I could sleep for 7 to 8 hours every night... (one being completely
disagree and 7 being completely agree)
1
(1) 2
(2) 3
(3) 4
(4) 5
(5) 6
(6) 7
(7)
Completely Disagree:
Completely Agree
(CQ2_1)
CQ3 It is up to me whether or not I sleep 7 to 8 hours every night... (one being completely
disagree and 7 being completely agree)
1
(1) 2
(2) 3
(3) 4
(4) 5
(5) 6
(6) 7
(7)
Completely Disagree:
Completely Agree
(CQ3_1)
CQ4 I have complete control over my ability to sleep 7 to 8 hours every night... (one being
having no control and 7 being having complete control)
1
(1) 2
(2) 3
(3) 4
(4) 5
(5) 6
(6) 7
(7)
No Control:
Complete Control (CQ4_1)

Yahya Alamir College Students’ Sleep Quality 149
149
CQ5 In this question, please consider how you feel about sleeping for 7 to 8 hours every
night. (one being an extremely negative option and 7 being an extremely positive option) For me to
sleep 7 to 8 hours every night would be...
1
(1) 2
(2) 3
(3) 4
(4) 5
(5) 6
(6) 7
(7)
Bad: Good (CQ5_1)
Unhealthy: Healthy (CQ5_2)
Not Refreshing: Refreshing
(CQ5_3)
Unnecessary: Necessary (CQ5_4)
Not enjoyable :Enjoyable
(CQ5_5)
Detrimental to my social
life: Beneficial to my social life
(CQ5_6)
In this next set of questions, please consider those individuals whose opinions you value most.
On a scale of 1-7, with one being completely disagree and 7 being completely agree, please indicate to
what extent you agree or disagree with each statement:
CQ6 My friend(s) want me to sleep 7 to 8 hours every night
1
(1) 2
(2) 3
(3) 4
(4) 5
(5) 6
(6) 7
(7)
Completely Disagree:
Completely Agree
(CQ6_1)

Yahya Alamir College Students’ Sleep Quality 150
150
CQ7 My parent(s)/guardian(s) want me to sleep 7 to 8 hours every night
1
(1) 2
(2) 3
(3) 4
(4) 5
(5) 6
(6) 7
(7)
Completely Disagree:
Completely Agree
(CQ7_1)
CQ8 My supervisors (e.g. professors/employers) want me to sleep 7 to 8 hours every night
1
(1) 2
(2) 3
(3) 4
(4) 5
(5) 6
(6) 7
(7)
Completely Disagree:
Completely Agree
(CQ8_1)
CQ9 Most people who are important to me want me to sleep 7 to 8 hours every night
1
(1) 2
(2) 3
(3) 4
(4) 5
(5) 6
(6) 7
(7)
Completely Disagree:
Completely Agree
(CQ9_1)
You are about half way done

Yahya Alamir College Students’ Sleep Quality 151
151
In this set of questions, please consider your personal sleeping habits. As the same scale of 1-
7, one being completely disagree and 7 being completely agree, please indicate to what extent you
agree or disagree with each statement:
CQ10 In the next 24 hours, I intend to sleep 7 to 8 hours at night time
1
(1) 2
(2) 3
(3) 4
(4) 5
(5) 6
(6) 7
(7)
Completely Disagree:
Completely Agree
(CQ10_1)
CQ11 In the next 24 hours, I plan to sleep 7 to 8 hours at night time
1
(1) 2
(2) 3
(3) 4
(4) 5
(5) 6
(6) 7
(7)
Completely Disagree:
Completely Agree
(CQ11_1)
CQ12 In the next 24 hours, I will try to sleep 7 to 8 hours at night time
1
(1) 2
(2) 3
(3) 4
(4) 5
(5) 6
(6) 7
(7)
Completely Disagree:
Completely Agree
(CQ12_1)
In this set of questions, please consider your daily sleeping habits On a scale of 1-7, with one
being always and 7 being never, please indicate how often you perform the following habits:

Yahya Alamir College Students’ Sleep Quality 152
152
CQ13 I take daytime naps lasting two or more hours
1
(1) 2
(2) 3
(3) 4
(4) 5
(5) 6
(6) 7
(7)
Always: Never
(CQ13_1)
CQ14 I go to bed at different times from day to day
1
(1) 2
(2) 3
(3) 4
(4) 5
(5) 6
(6) 7
(7)
Always Never
(CQ14_1)
CQ15 I get out of bed at different times from day to day
1
(1) 2
(2) 3
(3) 4
(4) 5
(5) 6
(6) 7
(7)
Always: Never
(CQ15_1)
CQ16 I exercise to the point of sweating within one hour of going to bed
1
(1) 2
(2) 3
(3) 4
(4) 5
(5) 6
(6) 7
(7)
Always: Never
(CQ16_1)

Yahya Alamir College Students’ Sleep Quality 153
153
CQ17 I stay in bed longer than I should two or three times a week
1
(1) 2
(2) 3
(3) 4
(4) 5
(5) 6
(6) 7
(7)
Always: Never
(CQ17_1)
CQ18 I use alcohol, tobacco, or caffeine within four hours of going to bed or after going to bed.
1
(1) 2
(2) 3
(3) 4
(4) 5
(5) 6
(6) 7
(7)
Always: Never
(CQ18_1)
CQ19 I do something that may wake me up before bedtime (e.g., play video games, use the
Internet, or clean)
1
(1) 2
(2) 3
(3) 4
(4) 5
(5) 6
(6) 7
(7)
Always: Never
(CQ19_1)
CQ20 I go to bed feeling stressed, angry, upset, or nervous
1
(1) 2
(2) 3
(3) 4
(4) 5
(5) 6
(6) 7
(7)
Always :Never
(CQ20_1)

Yahya Alamir College Students’ Sleep Quality 154
154
CQ21 I use my bed for things other than sleeping or sex (e.g., watch television, read, eat, or
study)
1
(1) 2
(2) 3
(3) 4
(4) 5
(5) 6
(6) 7
(7)
Always: Never
(CQ21_1)
CQ22 I sleep on an uncomfortable bed (e.g., poor mattress or pillow, too much or not enough
blankets)
1
(1) 2
(2) 3
(3) 4
(4) 5
(5) 6
(6) 7
(7)
Always: Never
(CQ22_1)
CQ23 I sleep in an uncomfortable bedroom (e.g., too bright, too stuffy, too hot, too cold, or too
noisy)
1
(1) 2
(2) 3
(3) 4
(4) 5
(5) 6
(6) 7
(7)
Always: Never
(CQ23_1)
CQ24 I do important work before bedtime (e.g., pay bills, schedule, or study)
1
(1) 2
(2) 3
(3) 4
(4) 5
(5) 6
(6) 7
(7)
Always: Never
(CQ24_1)

Yahya Alamir College Students’ Sleep Quality 155
155
CQ25 I think, plan, or worry when I am in bed
1
(1) 2
(2) 3
(3) 4
(4) 5
(5) 6
(6) 7
(7)
Always: Never
(CQ25_1)
Keep Going....

Yahya Alamir College Students’ Sleep Quality 156
156
The following questions make use of rating scales with five (5) response options. Please indicate
where you fall on the scale. Many different factors, such as exercise and diet, impact our overall
health. As you read each question please consider how sleep alone affects the given area of health.
DQ1 If you were unable to sleep 7 to 8 continuous hours each day, how likely would you be
to... (with one being not at all likely and 5 being extremely likely)
Not
at all likely (1)
(2) (3) (4) Extremely
likely (5)
Eventually develop an illness (for example, the common
cold). (DQ1_1)
Eventually develop a disease (for
example, heart disease). (DQ1_2)
Gain weight over time. (DQ1_3)
Unintentionally fall asleep while driving
a motor vehicle. (DQ1_4)
Have a difficult time focusing at work.
(DQ1_5)
Feel more stressed. (DQ1_6)

Yahya Alamir College Students’ Sleep Quality 157
157
DQ2 If you were unable to sleep 7 to 8 continuous hours each day, how much would it affect
your ability to… (with one being having no affect and 5 being having major affect)
No
affect (1) (2) (3) (4)
Major affect (5)
Manage stress (DQ2_1)
Maintain good physical
health.. (DQ2_2)
Remain alert while driving.
(DQ2_3)
Concentrate at work. (DQ2_4)
Control your appetite.
(DQ2_5)
DQ3 How beneficial to you is sleeping 7 to 8 continuous hours each day for…(with one being not
at all beneficial and 5 being extremely beneficial)
Not at
all beneficial (1)
(2) (3) (4) Extremely
beneficial (5)
Your energy levels.
(DQ3_1)
Your quality of life.
(DQ3_2)
Your work
productivity. (DQ3_3)
Your emotional well-being (DQ3_4)

Yahya Alamir College Students’ Sleep Quality 158
158
DQ4 How likely are you to not to get 7 to 8 continuous hours of sleep each day because…(with
one being not at all likely and 5 being extremely likely)
Not at
all likely (1) (2) (3) (4)
Extremely likely (5)
You feel pressured
for time. (DQ4_1)
You feel behind on
your work. (DQ4_2)
Getting 7 to 8 hours of
continuous sleep each day would require starting a new habit, which is
difficult. (DQ4_3)
It is easier to
sacrifice sleep during work
days and make up for lost sleep during days off
work (for example, the weekend)..
(DQ4_4)

Yahya Alamir College Students’ Sleep Quality 159
159
DQ5 How likely are you to get 7 to 8 continuous hours of sleep each day because you feel…(with
one being not at all likely and 5 being extremely likely)
Not
at all likely (1) (2) (3) (4)
Extremely likely (5)
Up-to-date with your
work responsibilities.
(DQ5_1)
Up-to-date with your
personal responsibilities (for example,
chores). (DQ5_2)
Confident in your finances.
(DQ5_3)
Confident in the success of your future job-
related goals (for example, receiving
a raise or promotion).
(DQ5_4)
Physically tired (DQ5_5)
Mentally tired (DQ5_6)

Yahya Alamir College Students’ Sleep Quality 160
160
DQ6 In order to help you sleep 7 to 8 continuous hours each day, how confident are you that
you can… (with one being not at all confident and 5 being extremely confident)
Not at
all confident (1)
(2) (3) (4) Extremely
confident (5)
Create a bedroom
environment suitable for
receiving good sleep. (DQ6_1)
Relax your mind before
bedtime. (DQ6_2)
Relax your body before
bedtime. (DQ6_3)
Maintain a consistent sleep
schedule. (for example, going to bed and waking
up at approximately the same time
each day). (DQ6_4)
Not consume
caffeine, alcohol, or tobacco within
4 hours of bedtime. (DQ6_5)
Develop goals to improve your sleep habits.
(DQ6_6)

Yahya Alamir College Students’ Sleep Quality 161
161
DQ7 How often do you… (with one being never and 5 being always)
Never
(1) (2) (3) (4)
Always (5)
Sleep 7 to 8 continuous hours each day.
(DQ7_1)
Sleep less than 7 continuous
hours each day. (DQ7_2)
Sleep more than 8 continuous
hours each day. (DQ7_3)
DQ8 The following questions make use of "yes" and "no" responses.
Yes (1) No (2)
Is getting enough sleep as important to your overall health as
eating right and exercising regularly? (DQ8_1)
Do you consume at least 5 servings of fruits and vegetables
per day? (DQ8_2)
Have you ever unintentionally fallen asleep while
operating a motor vehicle? (DQ8_3)

Yahya Alamir College Students’ Sleep Quality 162
162
Next.. we have few questions about your knowledge regarding sleep, drug use, medical
disorders, and your weight and exercise habits.

Yahya Alamir College Students’ Sleep Quality 163
163
EQ1 The following questions assess your sleep health knowledge (The questions in this section
make use of rating scale with five (5) answers, ranging from strongly agree to strongly disagree) Please
indicate to what extent you agree or disagree with each statement

Yahya Alamir College Students’ Sleep Quality 164
164
Strongly agree (5)
Agree (4)
Neither agree nor
disagree (3)
Disagree (2)
Strongly disagree (1)
People need 8 hours of
sleep to feel refreshed and function well
during the day. (EQ1_1)
When people feel
tired, have no energy, or just
seem not to function well
during the day, it is generally
because they did not sleep well
the night before. (EQ1_2)
A poor night’s sleep will
interfere with activities the
next day. (EQ1_3)
When people feel
irritable, depressed, or anxious during
the day, it is mostly because
they did not sleep well the night before.
(EQ1_4)
A good night’s sleep
means sleeping like a log all
night. (EQ1_5)
Healthy sleep means falling asleep
quickly. (EQ1_6)

Yahya Alamir College Students’ Sleep Quality 165
165
Faulty practices around
sleep-wake behaviors can cause ongoing
sleep problems. (EQ1_7)
Without an adequate
night’s sleep it is hard to function
the next day. (EQ1_8)
The following questions assess the use of different drugs within the last 30 days
FQ1 This question ask about the Non-Medical use of Antidepressants, Painkillers, Sedatives,
and Stimulants in the last 30 days: Within the last thirty days, have you taken any of the following
prescription drugs that were not prescribed to you?
Yes (1) No (2)
Antidepressants ( e.g., Celexa, Lexapro, , Prozac,
Wellbutrin, Zoloft) (FQ1_1)
Pain killers ( e.g., OxyContin, Vicodin, Codeine)
(FQ1_2)
Sedatives ( e.g., Xanaz, Valium) (FQ1_3)
Stimulants ( e.g., Ritalin, Adderall) (FQ1_4)

Yahya Alamir College Students’ Sleep Quality 166
166
FQ2 The following questions ask about Other drugs/substances use including Marijuana and
Cigarette. The question make use of a scales with eight (8) response options range from Never used to
use Daily. Please indicate where you fall on the scale
Within the last thirty days, on how many days did you use:
N
ever used (8)
Have used, but not in last 30 (7)
1 - 2 days
(6)
3 - 5 days
(5)
6 - 9 days
(4)
10 - 19
days (3)
20 - 29
days (2)
Used daily
(1)
Marijuana (FQ2_1)
Cigarettes (FQ2_2)
The following questions are related to alcohol drinking habits, and
Caffeinated and decaffeinate drinking habits. "A standard drink is defined as a 12 ounce bottle of
beer, a 5 ounce glass of wine, or a 1.5 ounce shot of 80 proof liquor."
FQ3-1 Alcohol: In a TYPICAL WEEK, on how many days did you have a least one drink containing
alcohol? Answers can range from zero (0) (you don’t drink) to 7 days a week
FQ3-2 How many drinks do you have on a TYPICAL DAY when you are drinking? Put zero if you
do not drink.
FQ3-3 During the last 30 days, what is the HIGHEST number of drinks that you consumed on any
one occasion? Put zero if you do not drink.
FQ3-4 Please indicate how many drinks you have on average for each day of the week? Put zero
if you do not drink.
Monday (1)
Tuesday (2)
Wednesday (3)
Thursday (4)
Friday (5)
Saturday (6)
Sunday (7)

Yahya Alamir College Students’ Sleep Quality 167
167
FQ4 During the last 7 days, how much in the equivalent of 12oz cans/glasses, did you drink of
the following drinks every day?
FQ4-1 Coffee (not de-caffeinated)
I did not (7)
One can/glass (6)
Two cans/glasses (5)
Three cans/glasses (4)
Four cans/glasses (3)
Five cans/glasses (2)
Six cans/glasses or more (1)
FQ4-2 De-caffeinated coffee
I did not (7)
One can/glass (6)
Two cans/glasses (5)
Three cans/glasses (4)
Four cans/glasses (3)
Five cans/glasses (2)
Six cans/glasses or more (1)
FQ4-3 Tea
I did not (7)
One can/glass (6)
Two cans/glasses (5)
Three cans/glasses (4)
Four cans/glasses (3)
Five cans/glasses (2)
Six cans/glasses or more (1)

Yahya Alamir College Students’ Sleep Quality 168
168
FQ4-4 Soda/Pop that contains caffeine (Coca Cola, Pepsi Cola, Dr. Pepper, Mountain Dew, etc).
I did not (7)
One can/glass (6)
Two cans/glasses (5)
Three cans/glasses (4)
Four cans/glasses (3)
Five cans/glasses (2)
Six cans/glasses or more (1)
FQ4-5 Energy drinks that contain caffeine (Red Bull, Monster, Rockstar, etc.).
I did not (7)
One can/glass (6)
Two cans/glasses (5)
Three cans/glasses (4)
Four cans/glasses (3)
Five cans/glasses (2)
Six cans/glasses or more (1)
You are almost done...Few more questions

Yahya Alamir College Students’ Sleep Quality 169
169
G This section is interested in knowing whether you have one or more of the following
disorders: Depression, Attention Deficit and Hyperactivity Disorder (ADHD), Insomnia, Sleep Disorders,
and Stress.
GQ1 Have you ever been diagnosed with Depression?
Yes (1)
No (2)
GQ2 The following questions make use of a scale with 6 response options, please indicate
where you fall on the scale Within the last 12 months, have you been diagnosed or treated by a
professional for any of the following:
N
O (6)
Yes, diagnosed not treated
(5)
Yes, treated
with medication
(4)
Yes, treated with
psychotherapy (3)
Yes, treated with
meds+ psychotherap
y (2)
Yes, other
treatment (1)
Attention Deficit and Hyperactivity
Disorder (ADHD) (GQ2_1)
Insomnia (GQ2_2)
Sleep Disorder (GQ2_3)
GQ3 Within the last 12 months, how would you rate the overall level of stress you have
experienced?
No stress (5)
Less than average stress (4)
Average stress (3)
More than average stress (2)
Tremendous stress (1)
Here we would like to know your height, weight, and exercises; and doing exercises, diet or
using pills to lose weight.
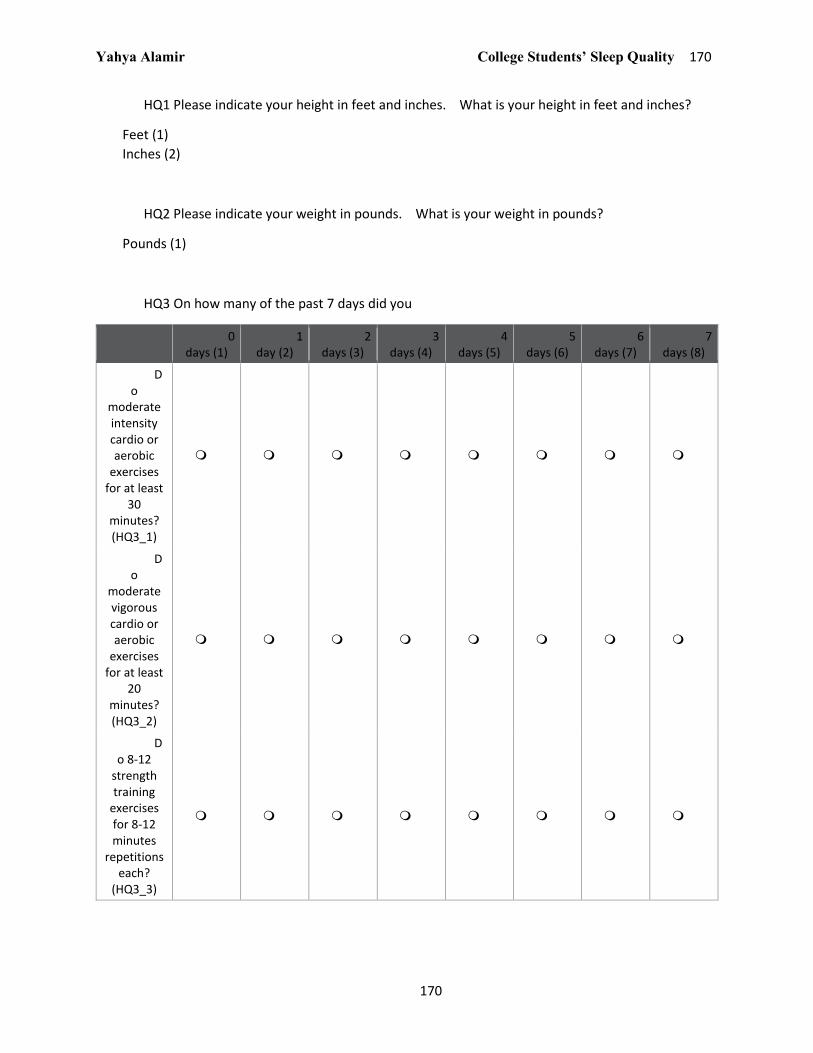
Yahya Alamir College Students’ Sleep Quality 170
170
HQ1 Please indicate your height in feet and inches. What is your height in feet and inches?
Feet (1)
Inches (2)
HQ2 Please indicate your weight in pounds. What is your weight in pounds?
Pounds (1)
HQ3 On how many of the past 7 days did you
0
days (1) 1
day (2) 2
days (3) 3
days (4) 4
days (5) 5
days (6) 6
days (7) 7
days (8)
Do
moderate intensity cardio or aerobic
exercises for at least
30 minutes? (HQ3_1)
Do
moderate vigorous cardio or aerobic
exercises for at least
20 minutes? (HQ3_2)
Do 8-12
strength training
exercises for 8-12 minutes
repetitions each?
(HQ3_3)
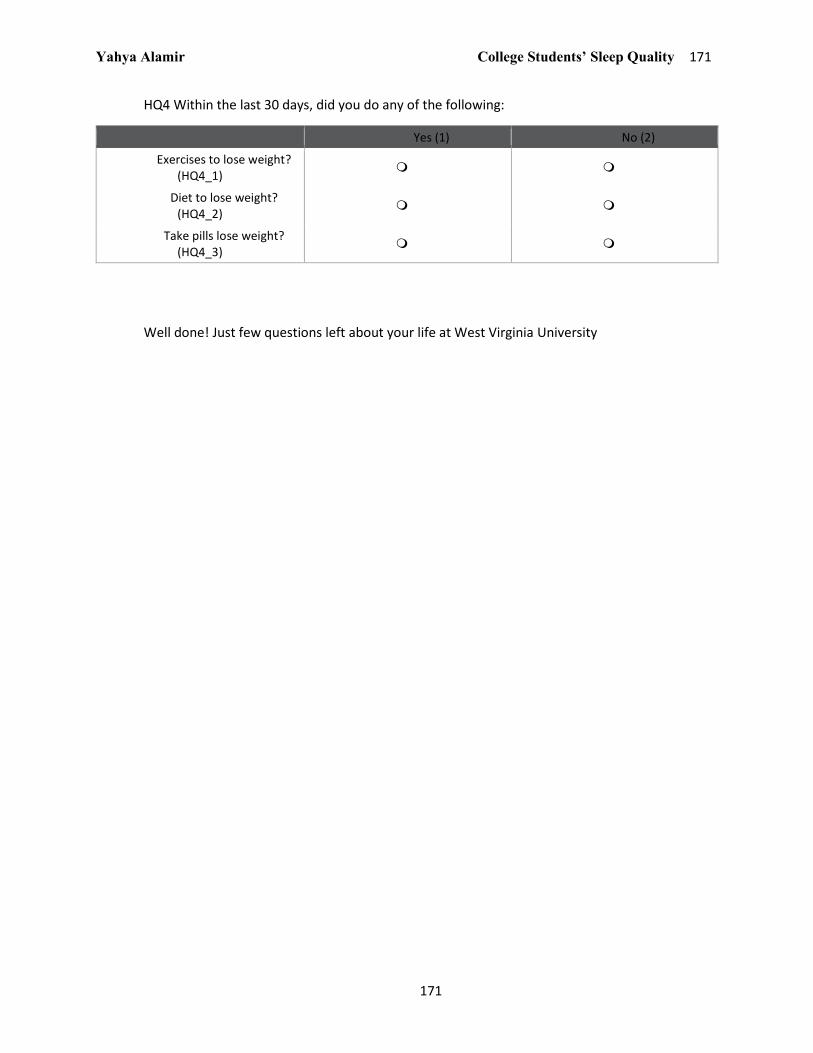
Yahya Alamir College Students’ Sleep Quality 171
171
HQ4 Within the last 30 days, did you do any of the following:
Yes (1) No (2)
Exercises to lose weight? (HQ4_1)
Diet to lose weight? (HQ4_2)
Take pills lose weight? (HQ4_3)
Well done! Just few questions left about your life at West Virginia University

Yahya Alamir College Students’ Sleep Quality 172
172
The next set of questions ask you general questions about yourself and your life at West Virginia
University. These questions are designed to allow you to provide your thoughts and opinions about the
school climate here at West Virginia University. (All questions in this section make use of rating scales
with five (5) answers, ranging from strongly agree to strongly disagree)
IQ1 The next group of questions asks about your relationships with your
professors. Your Professor Relationships
Strongly
agree (A) (5)
Agree (B) (4)
Neither agree nor
disagree (C) (3)
Disagree (D) (2)
Strongly disagree (E) (1)
Professors understand my
problems. (IQ1_20)
Professors and staff seem to
take a real interest in my future.
(IQ1_21)
Professors are available when I need to talk with
them. (IQ1_22)
It is easy to talk with professors.
(IQ1_23)
Students get along well with
professors. (IQ1_24)
Professors at my school help
us with our problems. (IQ1_25)
My professors care
about me. (IQ1_26)
My professor makes
me feel good about myself.
(IQ1_27)

Yahya Alamir College Students’ Sleep Quality 173
173
IQ2 The next group of questions asks about your feelings of connectedness to West Virginia
University (WVU). Your Connection to WVU
Strongly
agree (A) (5) Agree
(B) (4)
Neither agree nor
disagree (C) (3)
Disagree (D) (2)
Strongly disagree (E) (1)
My schoolwork is
exciting. (IQ2_28)
Students can make
suggestions on courses that are
offered. (IQ2_29)
WVU makes students
enthusiastic about learning.
(IQ2_30)
Students are frequently rewarded or
praised by faculty and staff for
following university rules.
(IQ2_31)

Yahya Alamir College Students’ Sleep Quality 174
174
IQ3 The next group of questions asks about your feelings of academic support at
WVU. Your Academic Support
Strongly
agree (A) (5)
Agree (B) (4)
Neither agree nor
disagree (C) (3)
Disagree (D) (2)
Strongly disagree (E) (1)
I usually understand my
homework assignments.
(IQ3_32)
Professors make it clear what work needs to be done to get the
grade I want. (IQ3_33)
I believe that professors
expect all students to learn. (IQ3_34)
I feel that I can do well at WVU. (IQ3_35)

Yahya Alamir College Students’ Sleep Quality 175
175
IQ4 The next group of questions asks about your feelings of order, safety, and discipline at
WVU. WVU Rules, Safety, and Discipline
Strongly
agree (A) (5)
Agree (B) (4)
Neither agree nor
disagree (C) (3)
Disagree (D) (2)
Strongly disagree (E) (1)
Classroom rules are applied equally. (IQ4_36)
Problems at WVU are solved
by students and faculty. (IQ4_37)
The rules of the university are fair. (IQ4_38)
WVU rules are enforced consistently and fairly. (IQ4_39)
My professors make it clear to me when I have misbehaved in class. (IQ4_40)
Discipline is fair. (IQ4_41)

Yahya Alamir College Students’ Sleep Quality 176
176
IQ5 The next group of questions asks about your feelings of WVU’s physical
appearance. WVU’s Physical Appearance
Strongly
agree (A) (5) Agree
(B) (4)
Neither agree nor
disagree (C) (3)
Disagree (D) (2)
Strongly disagree (E) (1)
The university
grounds are kept clean. (IQ5_42)
WVU is neat and clean.
(IQ5_43)
WVU’s buildings are
generally pleasant and
well maintained.
(IQ5_44)
WVU is usually clean
and tidy.. (IQ5_45)
IQ6 The next group of questions asks about your feelings of WVU’s social
atmosphere. WVU’s Social Atmosphere
Strongly
agree (A) (5) Agree
(B) (4)
Neither agree nor
disagree (C) (3)
Disagree (D) (2)
Strongly disagree (E) (1)
I am happy with
kinds of students who go to WVU.
(IQ6_46)
I am happy, in
general, with the other
students who go to WVU.
(IQ6_47)

Yahya Alamir College Students’ Sleep Quality 177
177
IQ7 The next group of questions asks about your feelings of your ability to participate in WVU
activities. Your WVU Participation

Yahya Alamir College Students’ Sleep Quality 178
178
Strongly
agree (A) (5) Agree
(B) (4)
Neither agree nor
disagree (C) (3)
Disagree (D) (2)
Strongly disagree (E) (1)
At WVU, the same person
always gets to help the
professor. (IQ7_49)
. At WVU, the same
students get chosen every
time to take part in after-school or special activities.
(IQ7_50)
The same students
always get to use things, like a computer, or
other resources when we interact
(IQ7_51)
Students have the same opportunity to speak, and be listened to, in class. (IQ7_52)
Students can express their
feelings and thoughts about school work and
life. (IQ7_53)
Students who are
‘different’ in any way are treated
with respect. (IQ7_54)
Nobody at WVU is
excluded from being successful.
(IQ7_55)
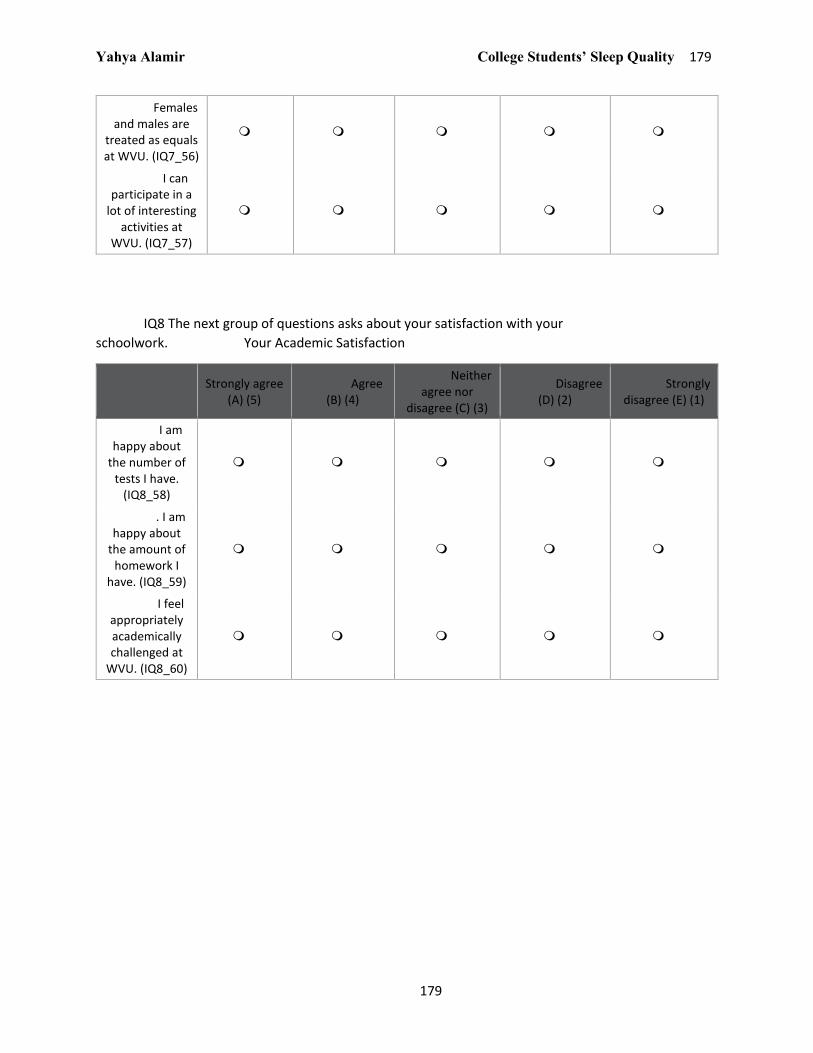
Yahya Alamir College Students’ Sleep Quality 179
179
Females and males are
treated as equals at WVU. (IQ7_56)
I can participate in a
lot of interesting activities at
WVU. (IQ7_57)
IQ8 The next group of questions asks about your satisfaction with your
schoolwork. Your Academic Satisfaction
Strongly agree
(A) (5) Agree
(B) (4)
Neither agree nor
disagree (C) (3)
Disagree (D) (2)
Strongly disagree (E) (1)
I am happy about
the number of tests I have.
(IQ8_58)
. I am happy about
the amount of homework I
have. (IQ8_59)
I feel appropriately academically challenged at
WVU. (IQ8_60)

Yahya Alamir College Students’ Sleep Quality 180
180
You are moving to the last section ( Demographic Information)...you will be done

Yahya Alamir College Students’ Sleep Quality 181
181
All responses in this section will be kept confidential and private. Only group data will be
reported.
JQ1 What is your gender?
Male (1)
Female (2)
JQ2 What is your age?
JQ3 How do you usually describe yourself?
White (1)
Black or African American (2)
American Indian or Alaska Native (3)
Asian (4)
Native Hawaiian or Pacific Islander (5)
Other (6)
JQ4 Do you have a part-time or full-time job?
Employed full time (1)
Employed part time (2)
Unemployed (3)
JQ5 What is your annual income?
Less than $10,000 (1)
$10,000 - $19,999 (2)
$20,000 - $29,999 (3)
$30,000 - $39,999 (4)
More than $40,000 (5)
JQ6 What is your marital status?
Married (1)
Widowed (2)
Divorced (3)
Separated (4)
Never married (5)
Yahya Alamir College Students’ Sleep Quality 182
182
JQ7 What is your year of enrollment?
Freshman (1)
Sophomore (2)
junior (3)
Senior (4)
JQ8 What is your college major?
JQ9 What is your current overall Grade Point Average? (please write your response using a 4.0
scale)
JQ10 What time do your Friday classes start?
8 am (1)
Between 8 AM and 10 AM (2)
Between 10 AM and noon (3)
Afternoon (4)
I do not have Friday classes (5)
You are done...Great Job! Thank you for your time and participation! NOW....Click next to be
entered in a drawing for Panera gift card

Yahya Alamir College Students’ Sleep Quality 183
183
PC1 If you wish to be entered in a drawing to receive a Panera gift card...Click Yes Clicking NO
will end the survey without...
Yes (28)
No (29)

Yahya Alamir College Students’ Sleep Quality 184
184
PC2 Please enter your e-mail address, so that you can be included in a drawing for a Panera gift-
card. This information will not be associated with your data.
E-mail address (1)

Yahya Alamir College Students’ Sleep Quality 185
185
Appendix E
Corresponding letters

Yahya Alamir College Students’ Sleep Quality 186
186
PRENOTIFICATION E-MAIL MESSAGE
Dear student,
We need your help! You have been randomly selected to participate in an important university-
wide web-based Sleep Behavior Questionnaire of West Virginia undergraduate students. It has been
developed so you, the student body here at West Virginia University, can tell us what you think, believe
and do that may affect your sleep. This study is being conducted by Dr. Keith Zullig and PhD student
Yahya Alamir at West Virginia University. This study has been reviewed and approved by the
Institutional Review Boards (IRB) at West Virginia University (WVU) IRB’s Research Protocol: (WVU IRB’s
Research Protocol: 1603066826).
This research is part of a larger study, and it is being conducted in partial fulfillment of the
requirements for the degree of Doctor of Philosophy in Public Health / Social and Behavioral Sciences.
The project is intended to describe college students’ sleep and their behavioral determinants in order to
better understand sleep behavior of undergraduate college students. Additionally, we are interested in
assessing the association between sleep behavior, particularly poor sleep and health related quality of
life. Your involvement in this study is voluntary and your responses will be kept confidential. In addition,
you do not have to answer every question in the survey. Therefore, if you are not comfortable with a
particular question, simply leave it blank and go on to the next. No action will be taken against you;
your class standing and grades will not be affected whether you complete this questionnaire, choose not
to participate, or by withdrawal from the study.
In order to participate in this study, you must be:
• 18 years old or older
• A full time, undergraduate student at West Virginia University.
The information you provide will assist our university health community to develop better
health education/wellness efforts at the University. Your participation is very important to us.
Doing this web-based questionnaire will cause no risk to you and your results will be held strictly
confidential. As a token of our appreciation for your participation, you will have a chance to win one of
50 Panera gift cards ($ 10 value each). In five days, you will receive an e-mail requesting your
participation. We hope you will take the time to participate. Please call or e-mail us with questions or
concerns. You may also contact the Office of Research Integrity and Compliance (293-7073,
[email protected]) for any questions about your rights as a participant in this study.
Sincerely,
Keith J. Zullig, MSPH, PhD Tel: (304) 293-1091; E-mail: [email protected]
Yahya A. Alamir, MAP, PhD Candidate Tel: (681) 753-8223; E-mail: [email protected]

Yahya Alamir College Students’ Sleep Quality 187
187
REQUESTING SURVEY PARTICIPATION
Dear Student,
Five days ago, you were sent an e-mail requesting your participation in the University-wide
Web-based Sleep Behavior Questionnaire of West Virginia Undergraduate Students. Our hopes
are that you are excited about being selected to participate in this opportunity to represent the
West Virginia student body. We are certainly excited to be able to gather information that will
continue to help make your experience at West Virginia University an enjoyable one and to
make the University a better place for future classes.
Please click on the web link below to get to the informed consent form and questionnaire
(or you may copy the link and past the link into your internet browser).
It is very important that you read and understand what the informed consent form states. We take
your responses very seriously and have taken every precaution to assure the confidentiality
of your results. But most all, enjoy the experience, and please call or e-mail us with any
questions or concerns. You may also contact the Office of Research Integrity and Compliance
(293-7073, [email protected]) for any questions about your rights as a participant in this
study.
http://wvu.qualtrics.com/SE/?SID=SV_831B1OeyAYK4bgF
Sincerely
Keith J. Zullig, MSPH, PhD Tel: (304) 293-1091; E-mail: [email protected]
Yahya A. Alamir, MAP, PhD Student Tel: (681) 753-8223; E-mail: [email protected]
Yahya Alamir College Students’ Sleep Quality 188
188
“Please ignore this letter if you have already completed the survey”
Dear Student,
One week ago, you were sent an e-mail asking for your participation in a Web-based university-
wide sleep behavior questionnaire. If you have not yet had a chance to complete the
questionnaire, won’t you please take a few minutes now to fill it out. Simply click on the link
below to get started!
Because you are one of a small selected group to participate in this important study, your
response is essential to assure valid results. Furthermore, you will have a chance to win one of
50 Panera gift cards ($ 10 value each), for your time!
If you have already replied, thank you for your cooperation. Please contact Yahya Alamir or
Keith Zullig if you have any additional questions about the study or the Office of Research
Integrity and Compliance (293-7073, [email protected]) about your rights as a participant in
this study.
http://wvu.qualtrics.com/SE/?SID=SV_831B1OeyAYK4bgF
Sincerely,
Keith J. Zullig, MSPH, PhD Tel: (304) 293-1091; E-mail: [email protected]
Yahya A. Alamir, MAP, PhD Student Tel: (681) 753-8223; E-mail: [email protected]

Yahya Alamir College Students’ Sleep Quality 189
189
SECOND E-MAIL REMINDER “Please ignore this letter if you have already completed the
survey”
Dear Student,
If you have not yet had a chance to complete the West Virginia University sleep behavior
questionnaire, this is your second chance to not only represent your student body, but also to
better assist our university health community in developing better health education/wellness
efforts at the University.
Won’t you please take a few minutes now to fill it out? You can begin by going to the website
below. Your response is essential to assure valid results.
Thank you again for your cooperation if you have already replied. Please contact Yahya Alamir
or Keith Zullig if you have any additional questions about the study or the Office of Research
Integrity and Compliance (293-7073, [email protected]) about your rights as a participant in
this study.
http://wvu.qualtrics.com/SE/?SID=SV_831B1OeyAYK4bgF
Sincerely,
Keith J. Zullig, MSPH, PhD Tel: (304) 293-1091; E-mail: [email protected]
Yahya A. Alamir, MAP, PhD Student Tel: (681) 753-8223; E-mail: [email protected]

Yahya Alamir College Students’ Sleep Quality 190
190
LAST REMINDER “Please ignore this letter if you have already completed the survey”
Dear student ,
If you have not yet had a chance to complete the West Virginia University sleep behavior
questionnaire, this is your last chance to not only represent your student body, but also to better
assist our university health community in developing better health education/wellness efforts at
the University.
Won’t you please take a few minutes now to fill it out? You can begin by going to the website
below. Your response is essential to assure valid results.
Thank you again for your cooperation if you have already replied. Please contact Yahya Alamir
or Keith Zullig if you have any additional questions about the study or the Office of Research
Integrity and Compliance (293-7073, [email protected]) about your rights as a participant in
this study.
http://wvu.qualtrics.com/SE/?SID=SV_831B1OeyAYK4bgF
Sincerely,
Keith J. Zullig, MSPH, PhD Tel: (304) 293-1091; E-mail: [email protected]
Yahya A. Alamir, MAP, PhD Student Tel: (681) 753-8223; E-mail: [email protected]

Yahya Alamir College Students’ Sleep Quality 191
191
WVU Registrar letter aproval
From: Thomas Snider [mailto:[email protected]]
Sent: Monday, May 16, 2016 10:38 AM
To: Zullig, Keith <[email protected]>
Subject: Re: WVU-Office of the University Registrar Internal Data Request Good morning Keith, Per our conversation, the Office of the University Registrar would be happy to provide you with a list of student MIX email addresses necessary to complete your research project after we receive the approval from the Institutional Review Board. The approval is necessary before we can disseminate any information that is to be used in research from our office. If you have any questions, etc., please contact me directly.
Thomas L. Snider Assistant Registrar West Virginia University P: (304)293-5355 F: (304)293-9891

Yahya Alamir College Students’ Sleep Quality 192
192
Appendix F
IRB Approval

Yahya Alamir College Students’ Sleep Quality 193
193
Approval Letter Full Board
Action Date 07/06/2016
To Keith Zullig
From WVU Office of Research Integrity and Compliance
Approval Date 05/25/2016
Expiration Date 05/24/2017
Subject Protocol Approval Letter
Protocol Number 1603066826
Title A Theory-based Description of Sleep Behavior and Its Impact on Health-Related
Quality Of Life Using the Health Belief Model and the Theory of Planned Behavior
The above-referenced research study was reviewed by the West Virginia University Institutional Review
Board IRB via full board review procedures and was approved.
• At the full Board meeting of May 25, 2016 of the WVU IRB the Board reviewed the above-referenced
study and voted to approve pending modifications. In response to the IRB's requested modifications, the
researcher submitted revisions to the IRB. Based on the response, the IRB has approved the above-
referenced study for a period of twelve months. The review of this protocol was conducted and approved
in accordance with the federally defined categories of expedited review outlined in 45 CFR
46.110(a) on July 6, 2016. The approval period is from May 25, 2016 through May 24, 2017.
Documents reviewed and/or approved as part of this submission:
E-MAIL MESSAGE REQUESTING SURVEY PARTICIPATION.pdf: 2016-07-01-04:00
Updated first Email reminder.pdf: 2016-05-30-04:00
SECOND EMAIL REMINDER (1).pdf: 2016-05-30-04:00
THIRD EMAIL REMINDER.pdf: 2016-05-30-04:00

Yahya Alamir College Students’ Sleep Quality 194
194
E-MAIL MESSAGE REQUESTING SURVEY PARTICIPATION.pdf: 2016-05-30-04:00