Embed Size (px)
Citation preview
College Readiness Data: Fairfax County High Schools
Research Report No. 18-09
Office of Institutional Research, Planning, and Assessment Northern Virginia Community College
October 2009
NORTHERN VIRGINIA COMMUNITY COLLEGE
OFFICE OF INSTITUTIONAL RESEARCH, PLANNING, AND ASSESSMENT The purpose of the Office of Institutional Research, Planning, and Assessment is to conduct analytical studies and provide information in support of institutional planning, policy formulation and decision making. In addition, the office provides leadership and support in research related activities to members of the NOVA community engaged in planning and evaluating the institution’s success in accomplishing its mission.
4001 Wakefield Chapel Road Annandale, VA 22003-3796
(703) 323-3129 www.nvcc.edu/oir
When citing data from this report, the Northern Virginia Community College (NOVA) Office of Institutional Research,
Planning, and Assessment must be cited as the source.

i
Table of Contents
Page
Introduction .................................................................................................................................. 1
Explanatory Notes for Tables ....................................................................................................... 2
Fairfax County .............................................................................................................................. 4
ii
List of Tables
Page Table FCPS 1. Fairfax County School Division Number of Graduates by High School from
DOE Website ......................................................................................................... 5
Table FCPS 2. Fairfax County School Division Number of Students Who Were Dual Enrolled in
High School Entering Fall 2008 ............................................................................. 6
Table FCPS 3. Fairfax County School Division Distribution of GPA Ranges Fall 2008 ................ 7
Table FCPS 4. Fairfax County School Division Distribution of Grades Earned in Developmental
Courses Fall 2008 ................................................................................................. 8
Table FCPS 5. Fairfax County School Division Distribution of Passing Grades Earned in
College-Level Courses Fall 2008 ........................................................................ 10
Table FCPS 6. Fairfax County School Division Distribution of Unsuccessful Grades Earned in
College-Level Courses Fall 2008 ........................................................................ 12
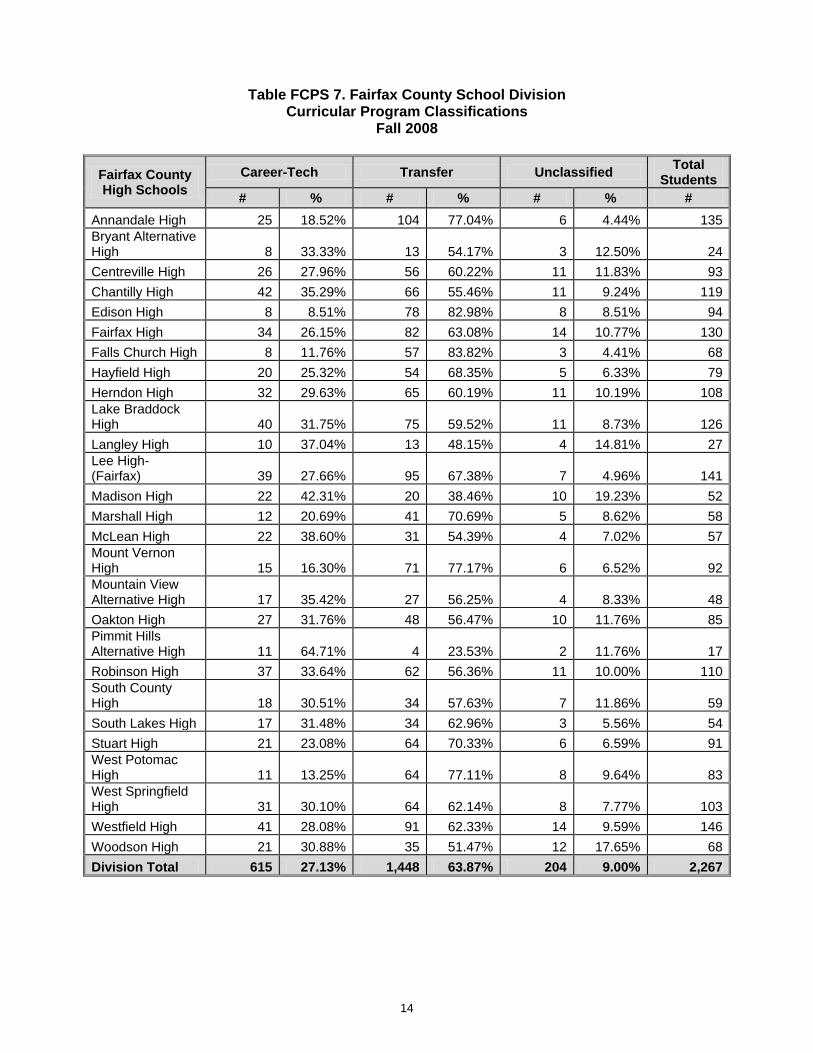
Table FCPS 7. Fairfax County School Division Curricular Program Classifications
Fall 2008 .............................................................................................................. 14
Fairfax County School Division Curricular Program Selections Fall 2008 .................................. 15
Table FCPS 8. High School: Annandale High ..................................................... 15
Table FCPS 9. High School: Bryant Alternative High .......................................... 15
Table FCPS 10. High School: Centreville High ................................................... 16
Table FCPS 11. High School: Chantilly High ...................................................... 16
Table FCPS 12. High School: Edison High ......................................................... 17
Table FCPS 13. High School: Fairfax High ......................................................... 18
Table FCPS 14. High School: Falls Church High ................................................ 18
Table FCPS 15. High School: Hayfield High ....................................................... 19
Table FCPS 16. High School: Herndon High ...................................................... 19
Table FCPS 17. High School: Lake Braddock High ............................................ 20
Table FCPS 18. High School: Langley High........................................................ 21
Table FCPS 19. High School: Lee High .............................................................. 21
Table FCPS 20. High School: Madison High ....................................................... 22
Table FCPS 21. High School: Marshall High ....................................................... 22
Table FCPS 22. High School: McLean High ....................................................... 23
iii
Table FCPS 23. High School: Mount Vernon High .............................................. 23
Table FCPS 24. High School: Mountain View Alternative High ........................... 24
Table FCPS 25. High School: Oakton High......................................................... 24
Table FCPS 26. High School: Pimmit Hills Alternative High ............................... 25
Table FCPS 27. High School: Robinson High ..................................................... 25
Table FCPS 28. High School: South County High .............................................. 26
Table FCPS 29. High School: South Lakes High ................................................ 27
Table FCPS 30. High School: Stuart High........................................................... 27
Table FCPS 31. High School: West Potomac High ............................................. 28
Table FCPS 32. High School: West Springfield High .......................................... 28
Table FCPS 33. High School: Westfield High ..................................................... 29
Table FCPS 34. High School: Woodson High ..................................................... 30
Table FCPS 35. Fairfax County School Division Number of Graduates by High School
From DOE Website ............................................................................................. 31
Table FCPS 36. Fairfax County School Division Entering Fall Number of Students Who Were
Dual Enrolled in High School Five-Year Aggregation Fall 04 through Fall 08 ..... 32
Table FCPS 37. Fairfax County School Division Distribution of Fall Term GPA Ranges Five-
Year Aggregation Fall 04 through Fall 08 ............................................................ 33
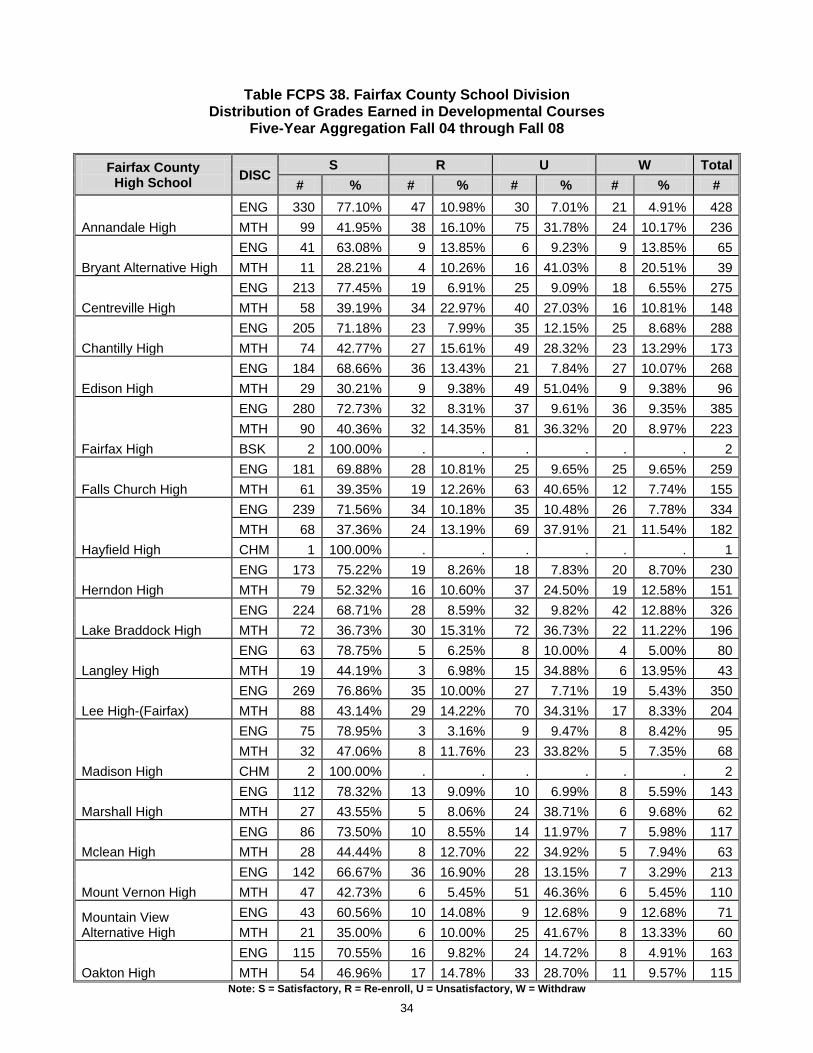
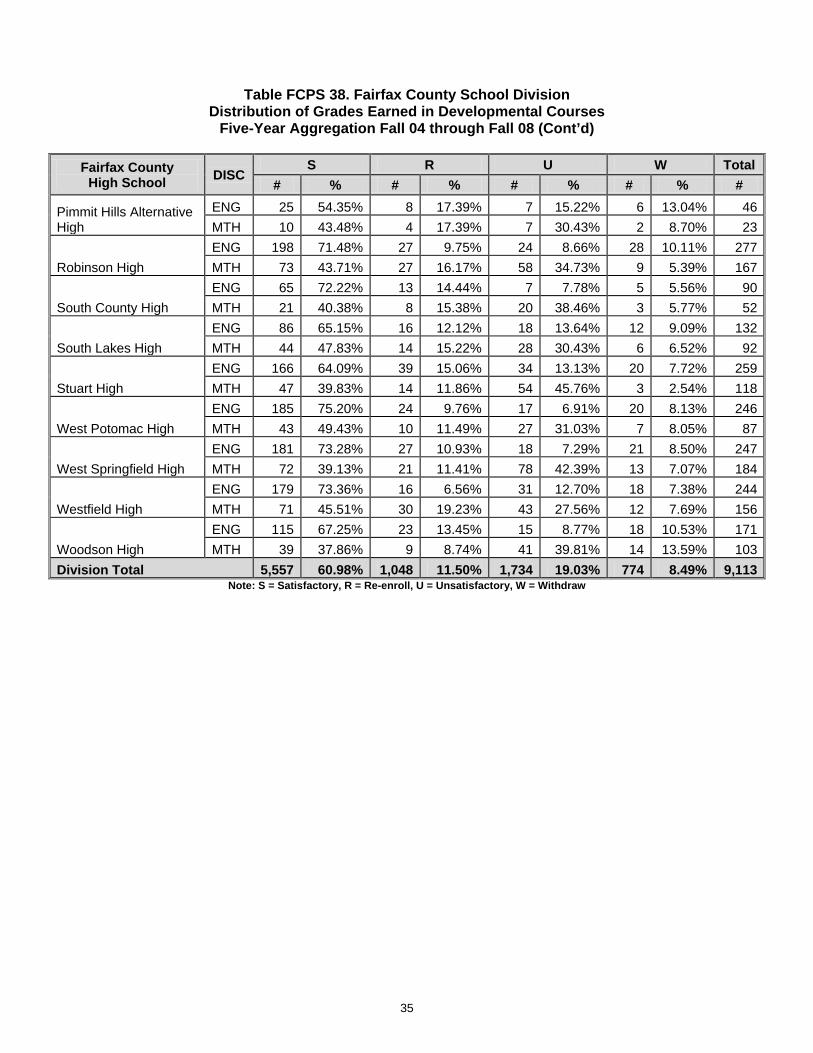
Table FCPS 38. Fairfax County School Division Distribution of Grades Earned in Developmental
Courses Five-Year Aggregation Fall 04 through Fall 08 ..................................... 34
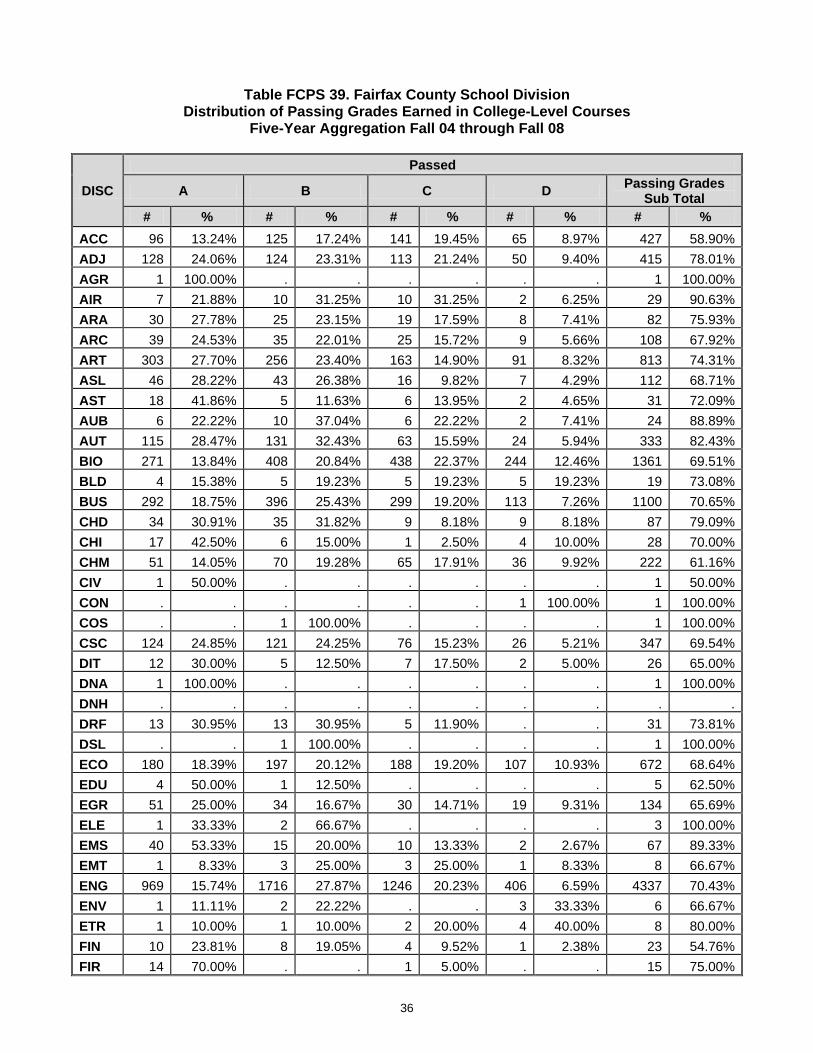
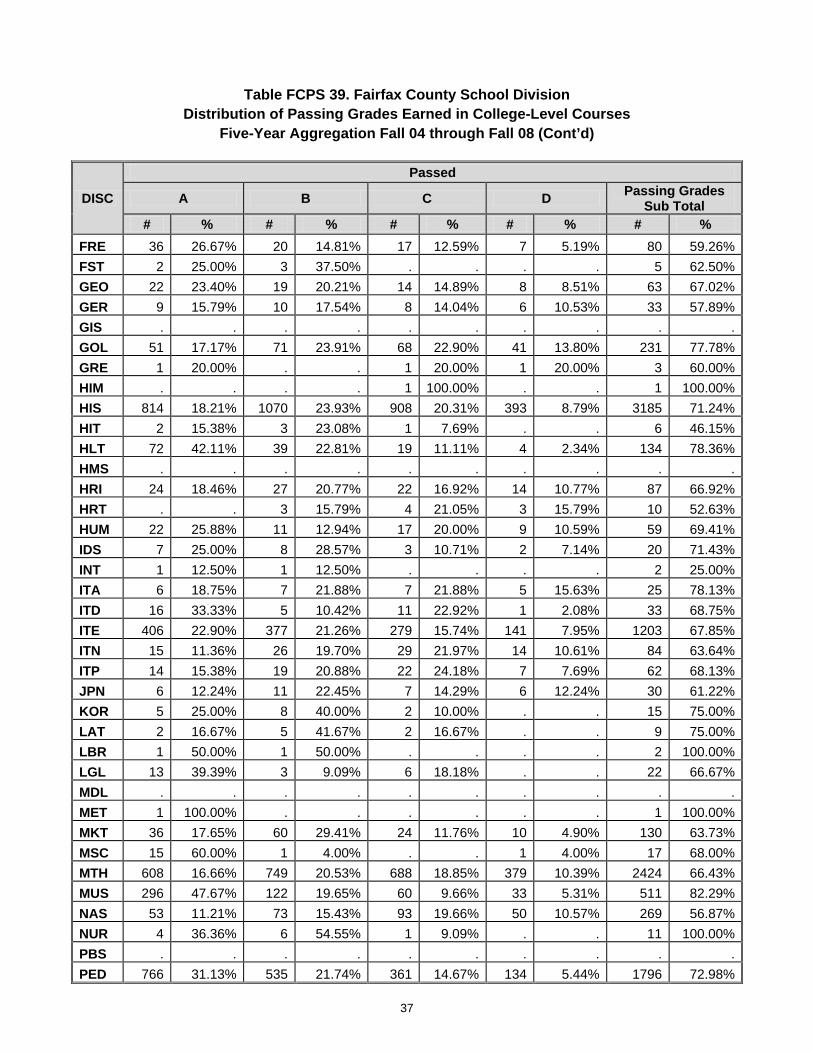
Table FCPS 39. Fairfax County School Division Distribution of Passing Grades Earned in
College-Level Courses Five-Year Aggregation Fall 04 through Fall 08 .............. 36
Table FCPS 40. Fairfax County School Division Distribution of Unsuccessful Grades Earned in
College-Level Courses Five-Year Aggregation Fall 04 through Fall 08 .............. 39
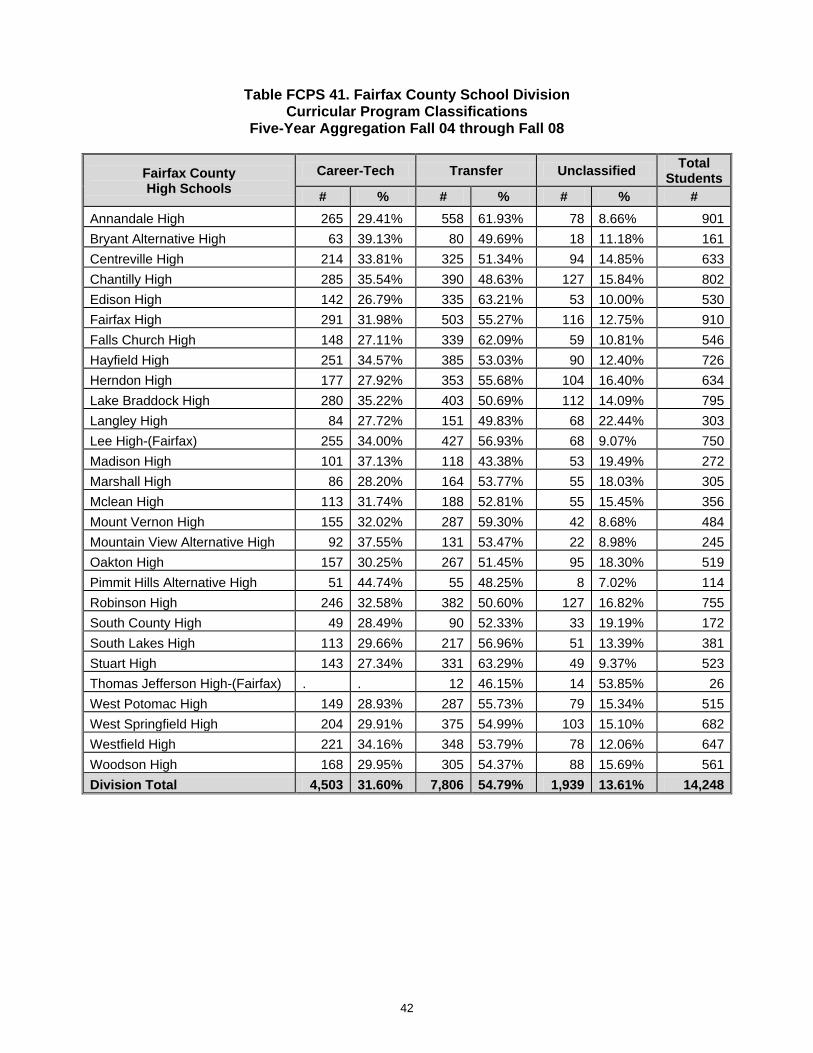
Table FCPS 41. Fairfax County School Division Curricular Program Classifications Five-Year
Aggregation Fall 04 through Fall 08 .................................................................... 42
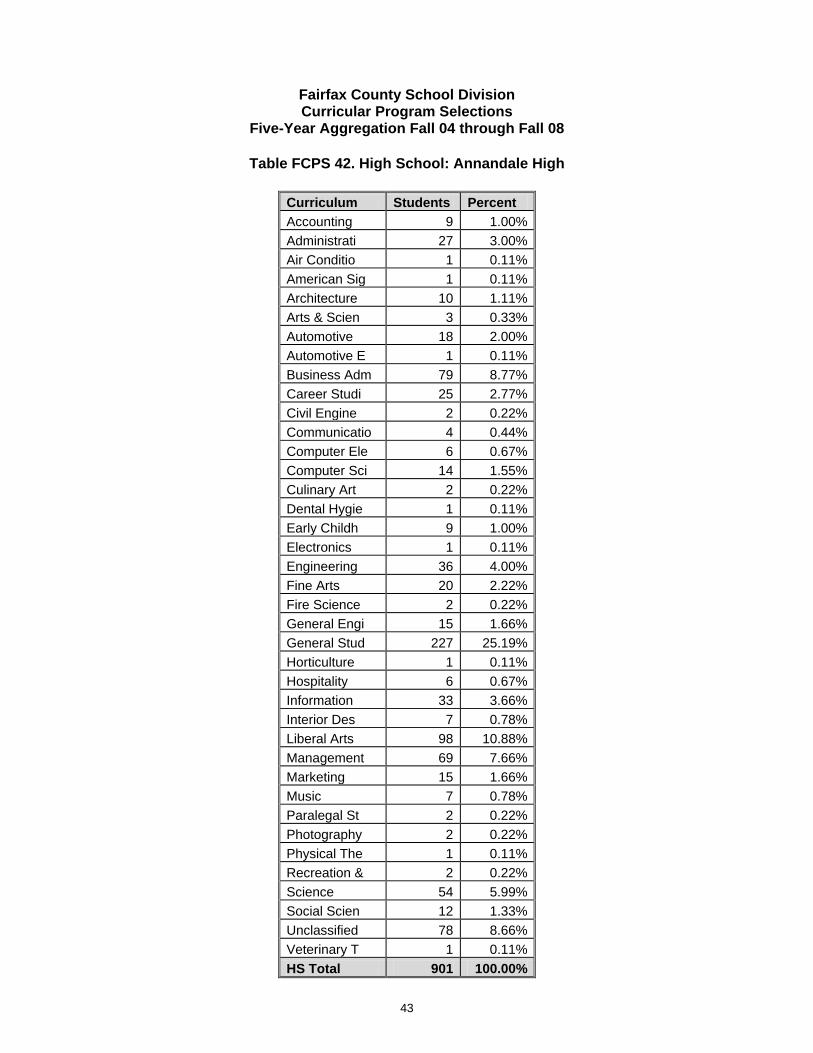
Fairfax County School Division Curricular Program Selections Five-Year Aggregation Fall 04
through Fall 08 .................................................................................................... 43
Table FCPS 42. High School: Annandale High ................................................... 43
Table FCPS 43. High School: Bryant Alternative High ........................................ 44
Table FCPS 44. High School: Centreville High ................................................... 45
iv
Table FCPS 45. High School: Chantilly High ...................................................... 46
Table FCPS 46. High School: Edison High ......................................................... 47
Table FCPS 47. High School: Fairfax High ......................................................... 48
Table FCPS 48. High School: Falls Church High ................................................ 49
Table FCPS 49. High School: Hayfield High ....................................................... 50
Table FCPS 50. High School: Herndon High ...................................................... 51
Table FCPS 51. High School: Lake Braddock High ............................................ 52
Table FCPS 52. High School: Langley High........................................................ 53
Table FCPS 53. High School: Lee High (Fairfax) ................................................ 54
Table FCPS 54. High School: Madison High ....................................................... 55
Table FCPS 55. High School: Marshall High ....................................................... 56
Table FCPS 56. High School: McLean High ....................................................... 57
Table FCPS 57. High School: Mount Vernon High .............................................. 58
Table FCPS 58. High School: Mountain View Alternative High ........................... 59
Table FCPS 59. High School: Oakton High......................................................... 60
Table FCPS 60. High School: Pimmit Hills Alternative High ............................... 61
Table FCPS 61. High School: Robinson High ..................................................... 62
Table FCPS 62. High School: South County High .............................................. 63
Table FCPS 63. High School: South Lakes High ................................................ 64
Table FCPS 64. High School: Stuart High........................................................... 65
Table FCPS 65. High School: Thomas Jefferson High (Fairfax) ......................... 65
Table FCPS 66. High School: West Potomac High ............................................. 66
Table FCPS 67. High School: West Springfield High .......................................... 67
Table FCPS 68. High School: Westfield High ..................................................... 68
Table FCPS 69. High School: Woodson High ..................................................... 69
1
College Readiness Data: Fairfax County High Schools
Introduction This report presents data from the Virginia Community College System (VCCS) on students’ level of preparedness for college, or college readiness. Information is included for students enrolled in a VCCS college who graduated from high schools served by Northern Virginia Community College (NOVA). Because the data is shown for students who had previously attended a high school within NOVA’s jurisdiction, the majority of data in this report will represent NOVA students. However, it is possible that some students who attended a Northern Virginia high school may have enrolled in a VCCS college other than NOVA. These students would be included in the tables in this report also. The data in this report, presented in table format, provide information on indicators of college preparedness which shows how well high school graduates are prepared for college. This information includes the student outcomes of recent high school graduates during their first semester at a VCCS college. The tables in this report consist of two types: a one year profile for 2007-08 high school graduates enrolled at a VCCS college during Fall 2008, and a 5-year aggregated profile (Fall 2004 through Fall 2008) of high school graduates enrolled at a VCCS college. The following categories are included:
a. Number of high school graduates by high school; b. Dual enrolled students; c. Grade Point Average (GPA) ranges; d. Course grades; e. Curricular program classifications; and f. Curricular program selections.
This report presents the data for Fairfax County. Fairfax City data is included in this report as well. Data for the other public school districts in NOVA’s service area (Alexandria City, Arlington County, Falls Church City, Loudoun County, Manassas City, Manassas Park City, and Prince William County) are presented in separate reports. The information in these College Readiness reports includes only the data provided by VCCS on this subject area.
2
Explanatory Notes for Tables
The tables in this report consist of two types: a one year profile and a 5-year aggregated profile. The first series of tables for each school district present results from the 2007-2008 academic year. The second series of tables for each school district repeat the same type of information presented in the first series, however, the data is aggregated by high school for the 5-year period of Fall 2004 through Fall 2008. A brief explanation of each table within each series is provided below.
Series 1: A one-year profile for the 2007-2008 academic year
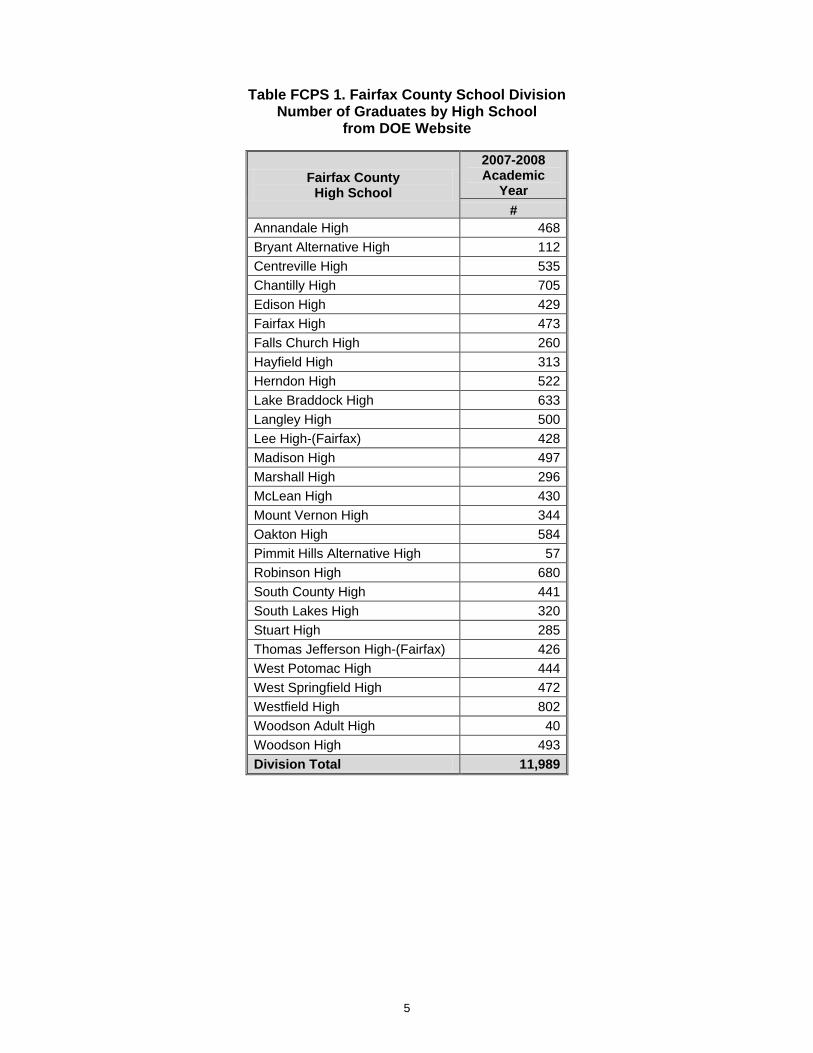
This table shows the number of high school graduates from each high school within the school district during the 2007 through 2008 academic year.
Number of Graduates by High School
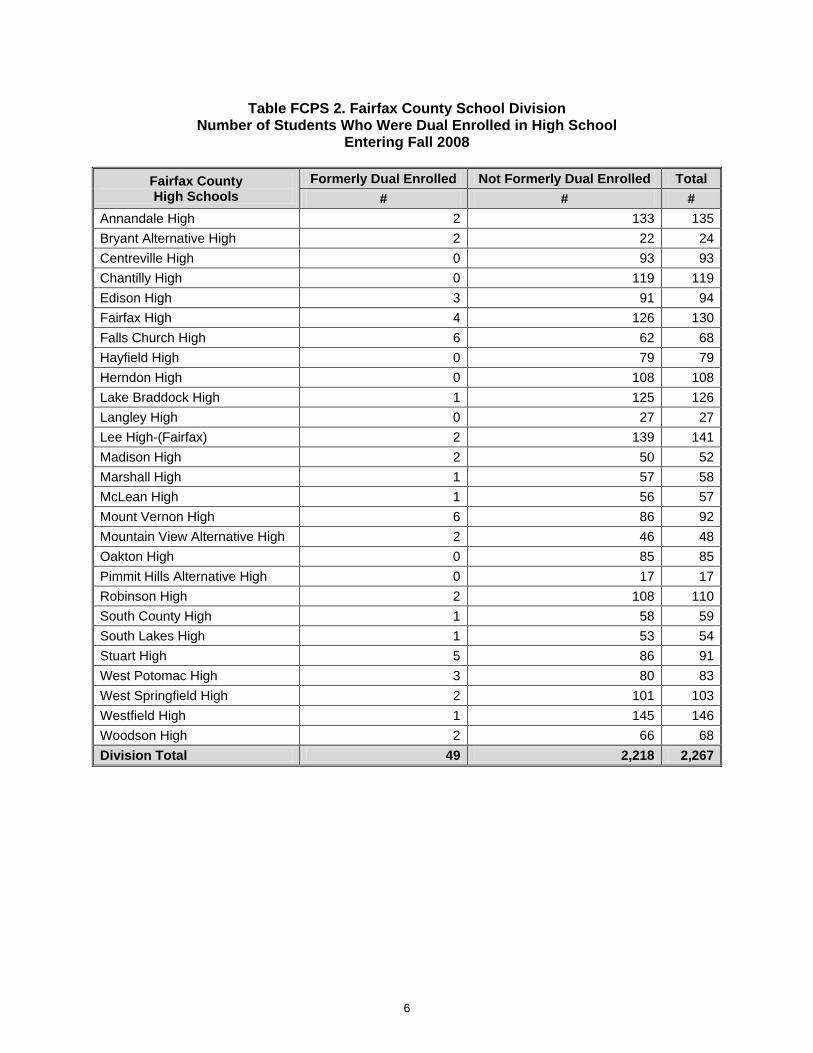
This table presents the number of students entering community college in Fall 2008 who were dual enrolled during high school.
Number of Students Who Were Dual Enrolled in High School
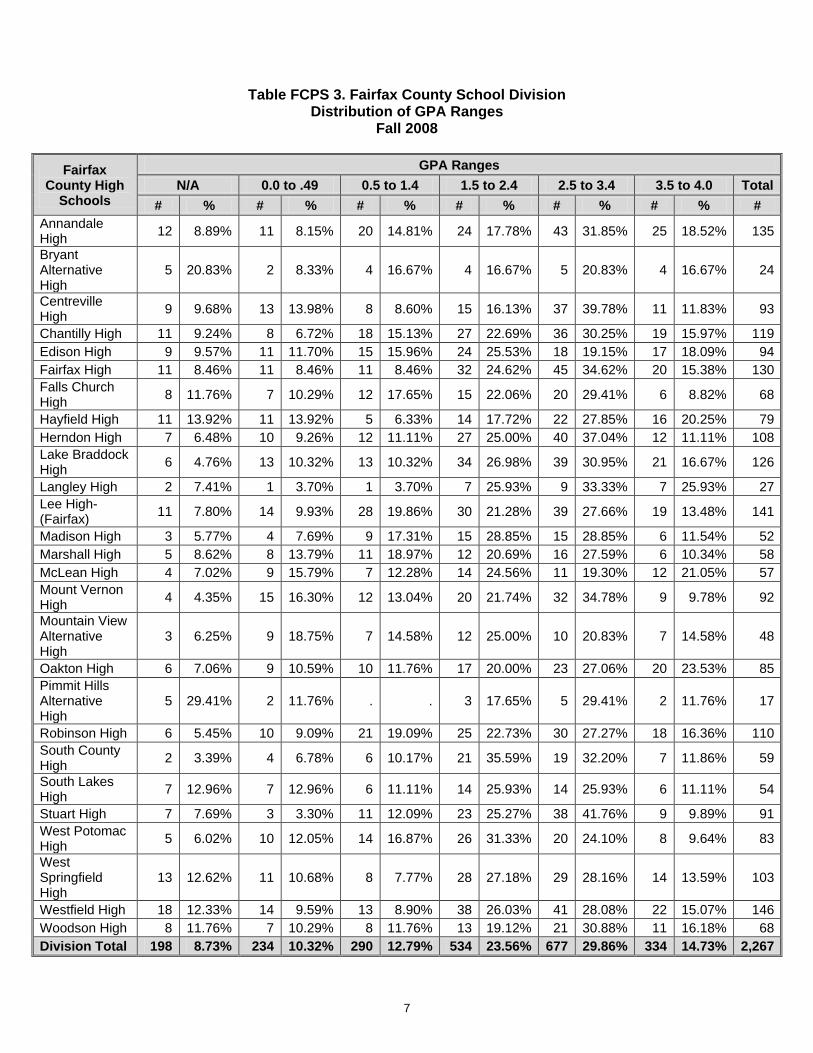
This table shows the distribution of GPA (grade point average) ranges for community college students in Fall 2008 by the high school from which they graduated.
Distribution of GPA Ranges
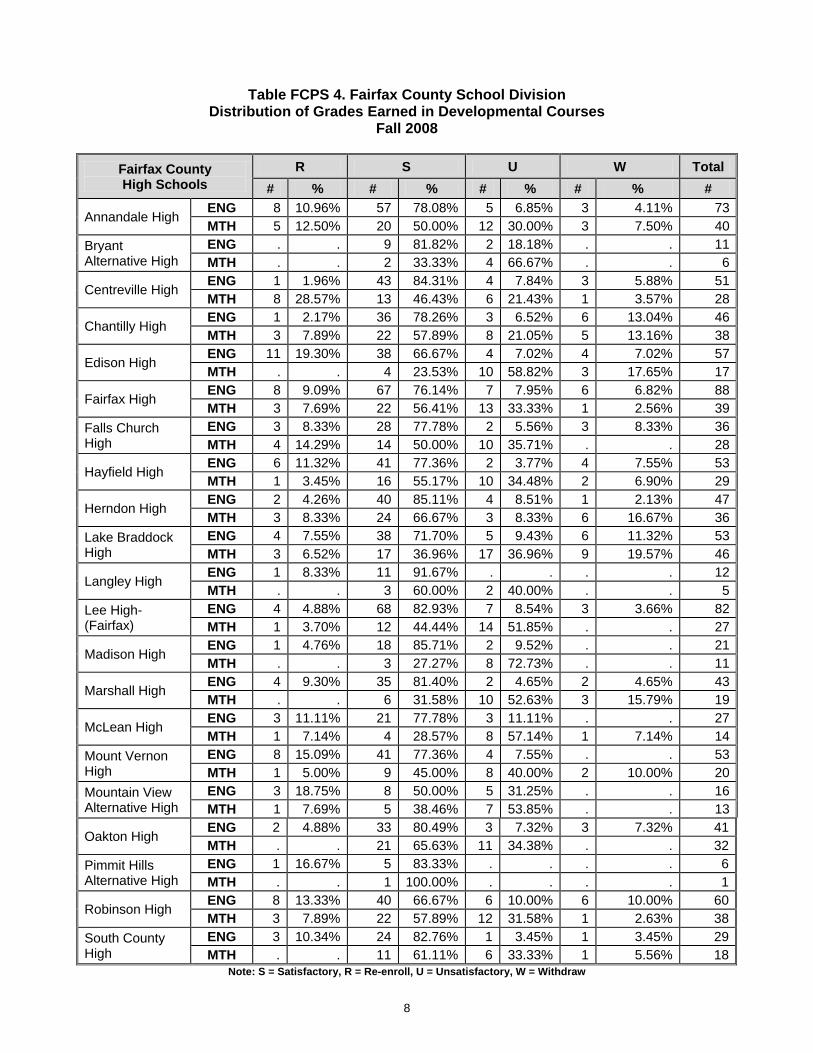
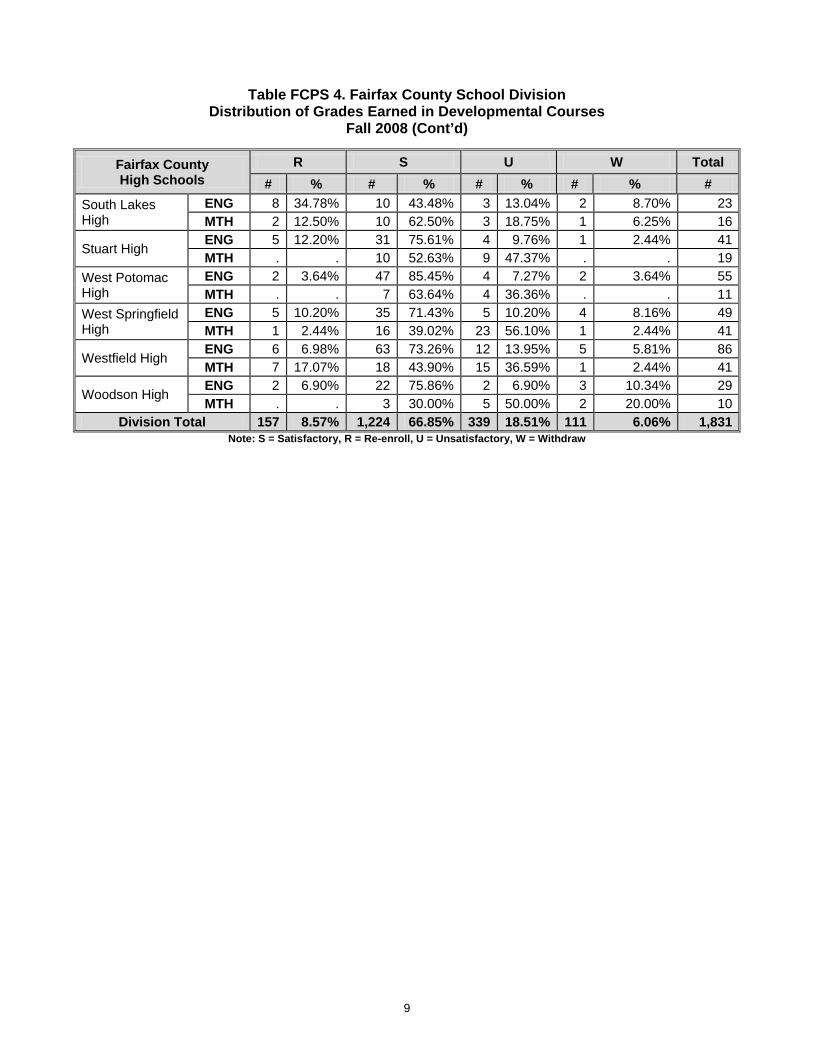
This table presents the distribution of grades earned by community college students in developmental courses in Fall 2008 by the high school from which they graduated.
Distribution of Grades Earned in Developmental Courses
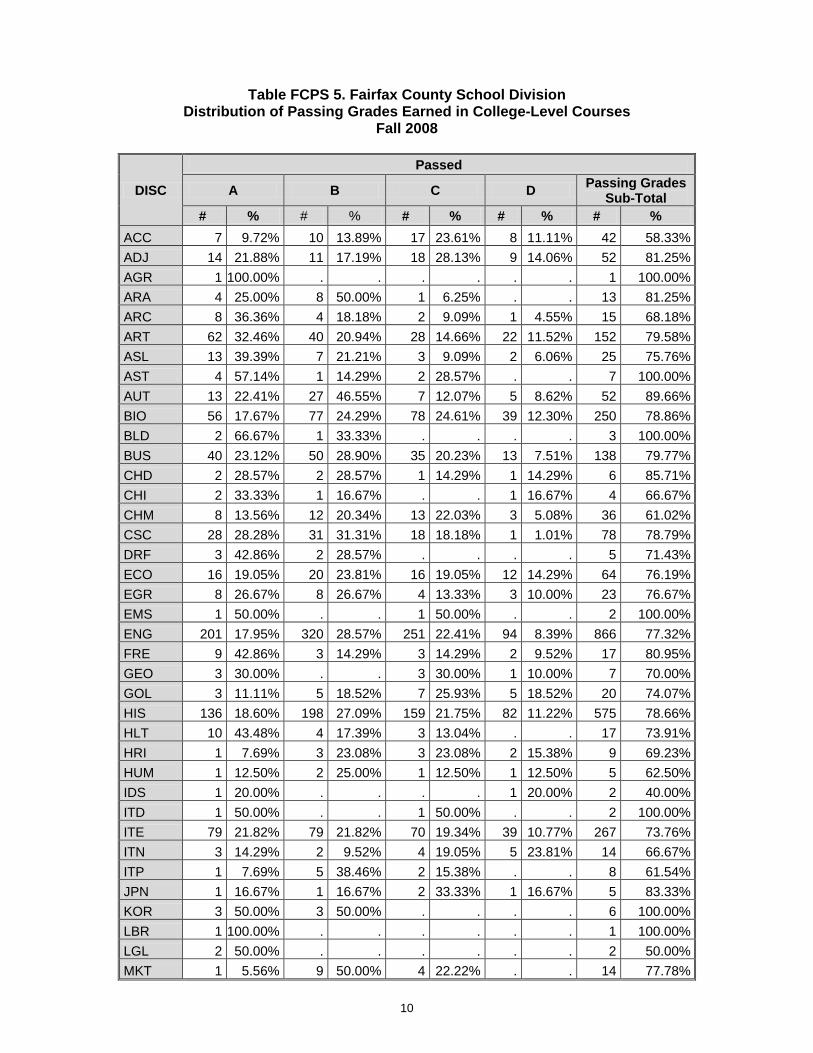
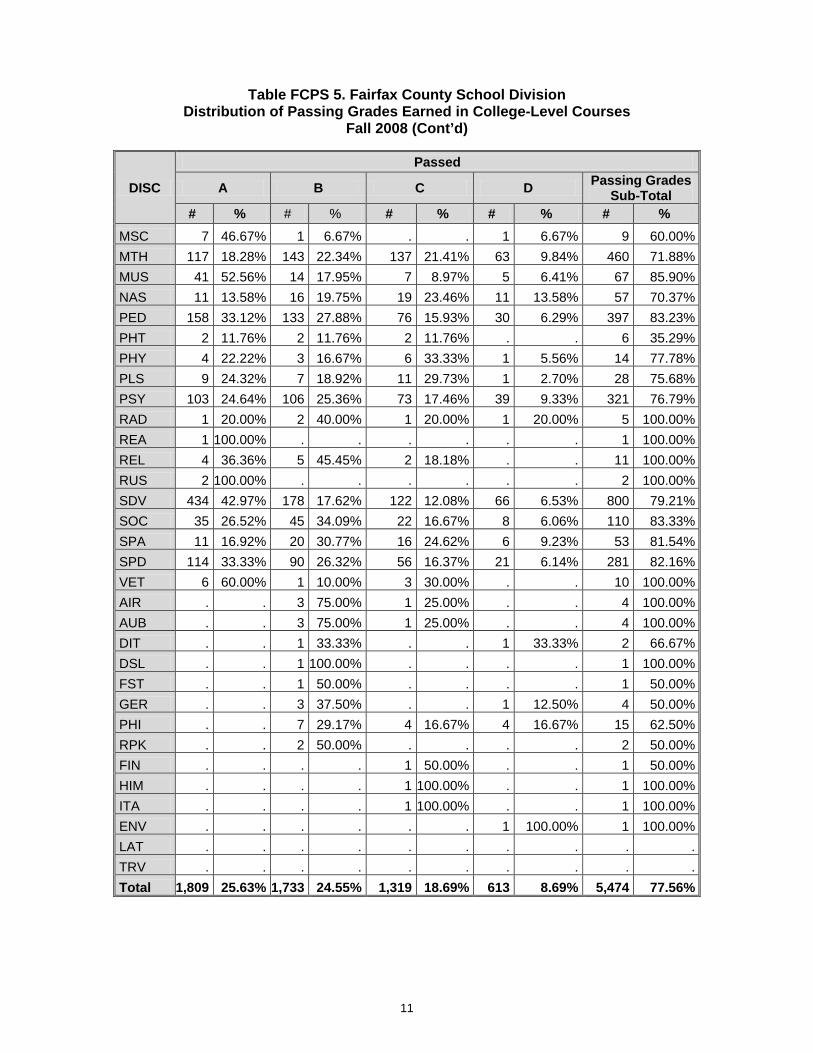
This table presents the distribution of passing grades (A, B, C, D) earned by community college students in college-level courses in Fall 2008 by discipline. The grades are aggregated for all students in all high schools within a school district.
Distribution of Passing Grades Earned in College-Level Courses
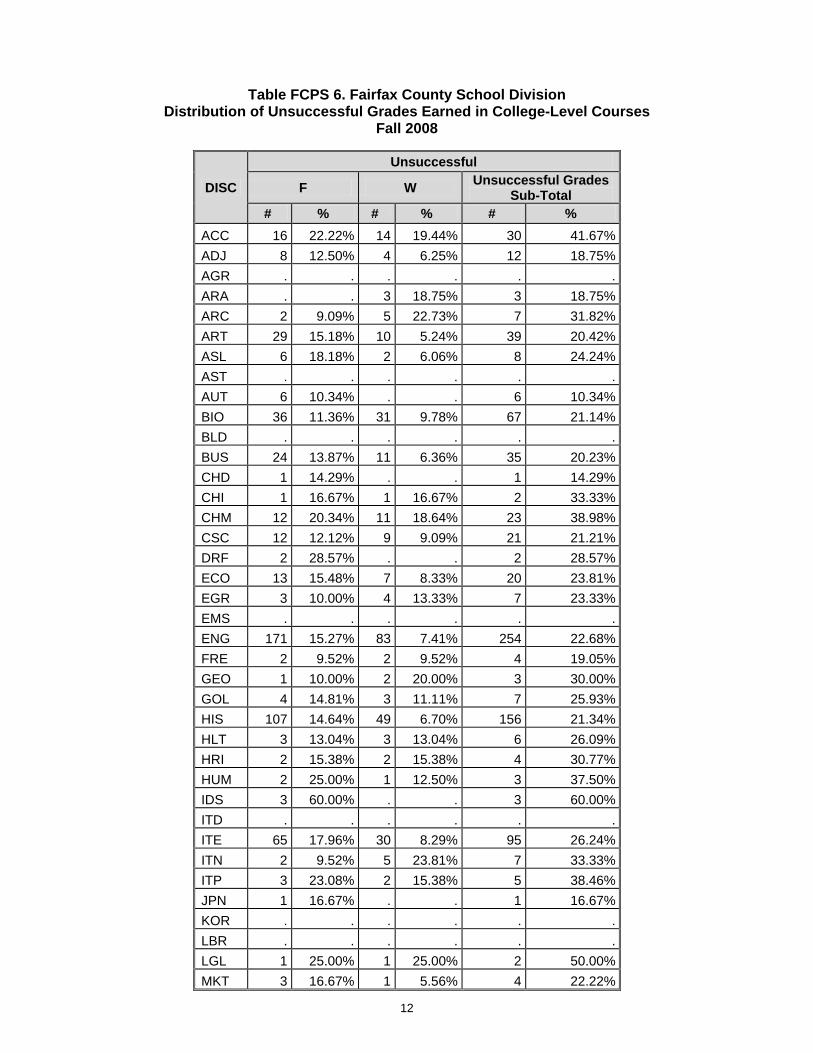
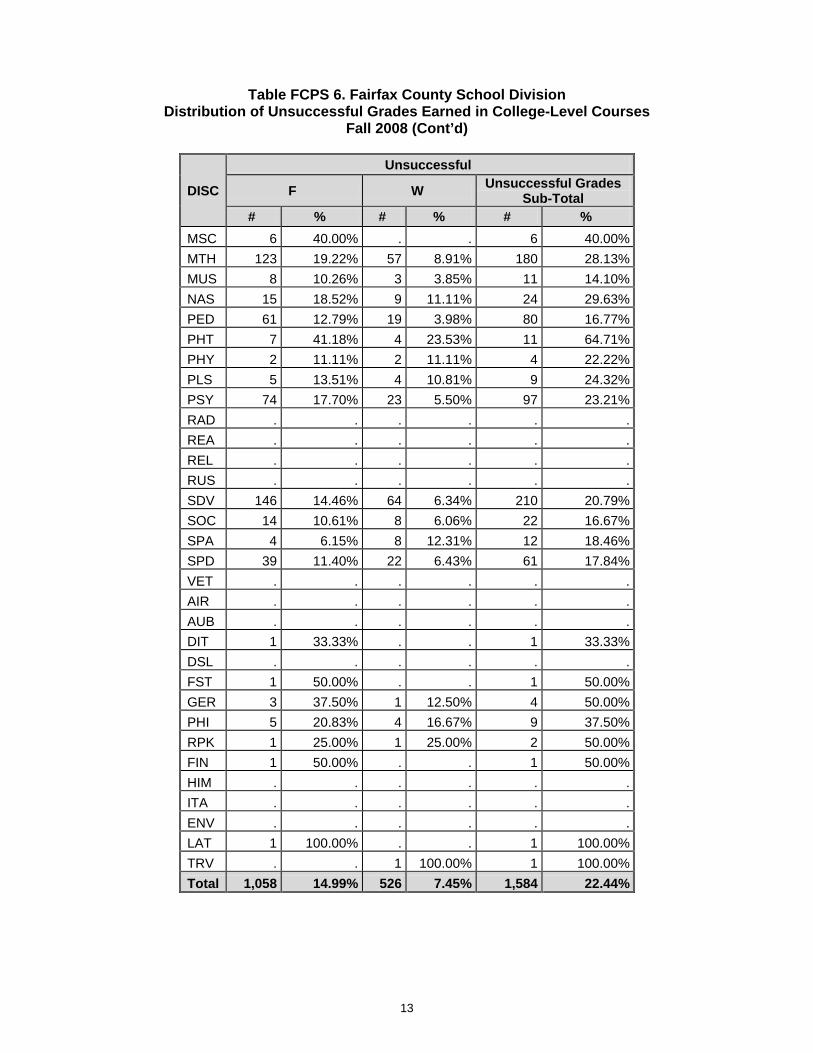
This table presents the distribution of unsuccessful grades (F, W) earned by community college students in college-level courses in Fall 2008 by discipline. The grades are aggregated for all students in all high schools within a school district.
Distribution of Unsuccessful Grades Earned in College-Level Courses
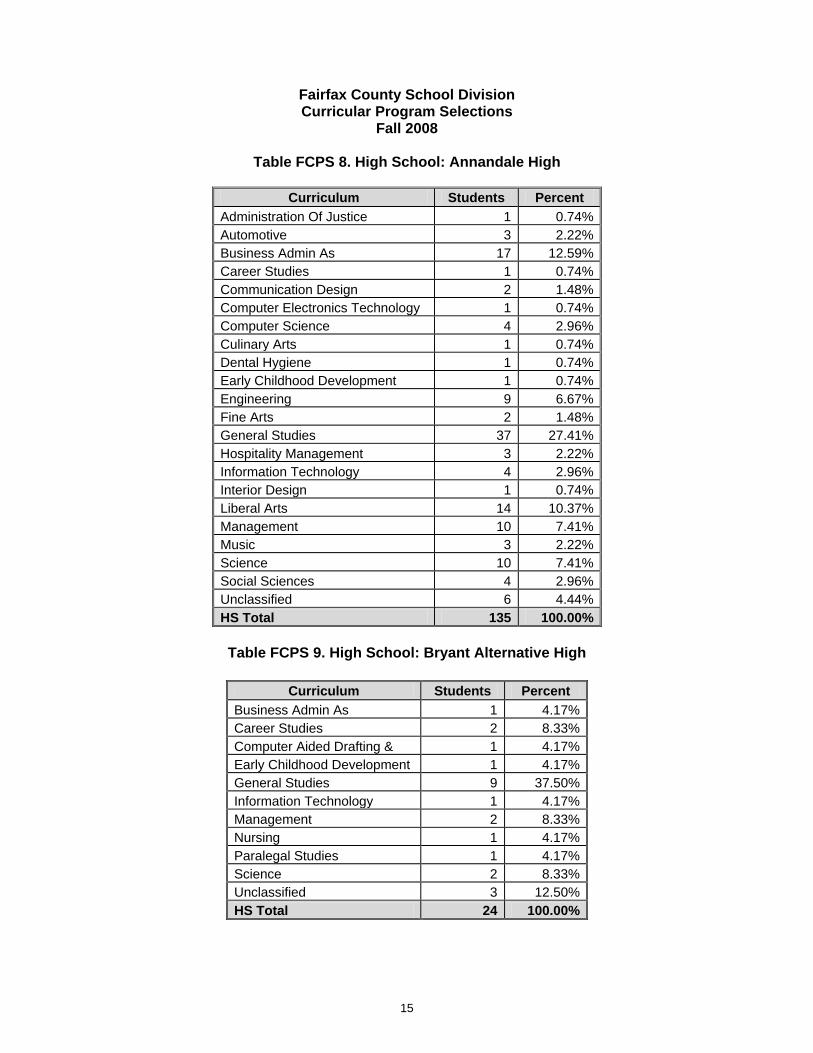
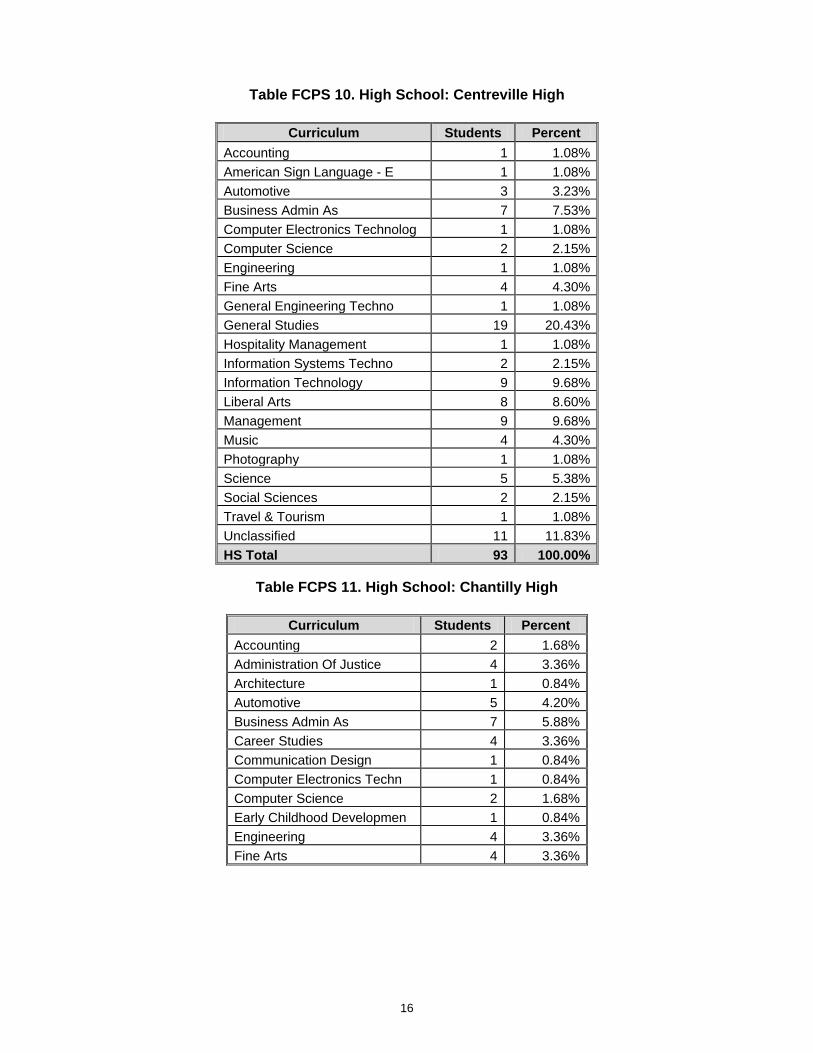
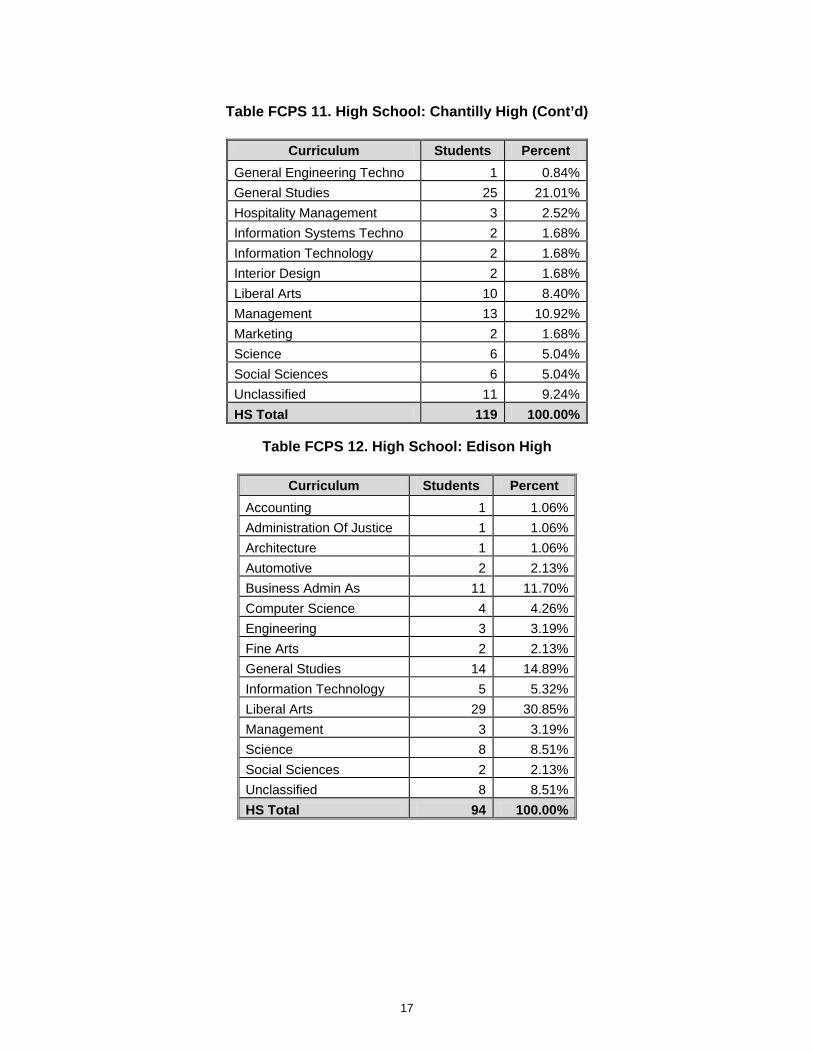
There are two tables titled ‘Curricular Program Selections’ for each high school within a school district. The first table presents community college students who chose a curricular program (career-tech, transfer, or unclassified) during the Fall 2008 semester by the high school from which they graduated. The second table specifies the discipline that was selected by those students.
Curricular Program Selections
3
Series 2: A five-year aggregate profile from Fall 2004 through Fall 2008
This table shows the number of high school graduates from each high school within the school district from the 2003-2004 academic year through the 2007-2008 academic year.
Number of Graduates by High School
This table presents the number of students who entered community college between Fall 2004 and Fall 2008 who were dual enrolled while in high school.
Entering Fall Number of Students Who Were Dual Enrolled in High School
This table shows the distribution of GPA (grade point average) ranges for students who entered community college between Fall 2004 and Fall 2008 by the high school from which they graduated.
Distribution of GPA Ranges
This table presents the distribution of grades earned in developmental courses by students who entered community college between Fall 2004 and Fall 2008 by the high school from which they graduated.
Distribution of Grades Earned in Developmental Courses
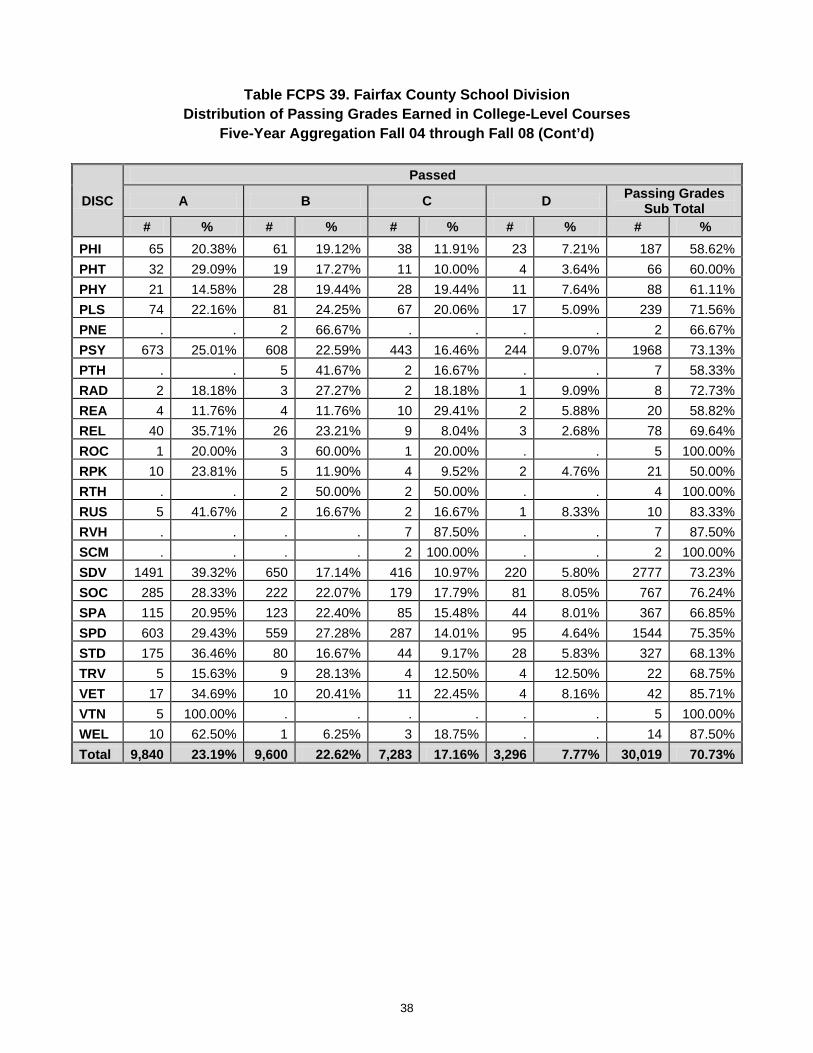
This table presents the distribution of passing grades (A, B, C, D) earned in college-level courses by students who entered community college between Fall 2004 and Fall 2008 by discipline. The grades are aggregated for all students in all high schools within a school district.
Distribution of Passing Grades Earned in College-Level Courses
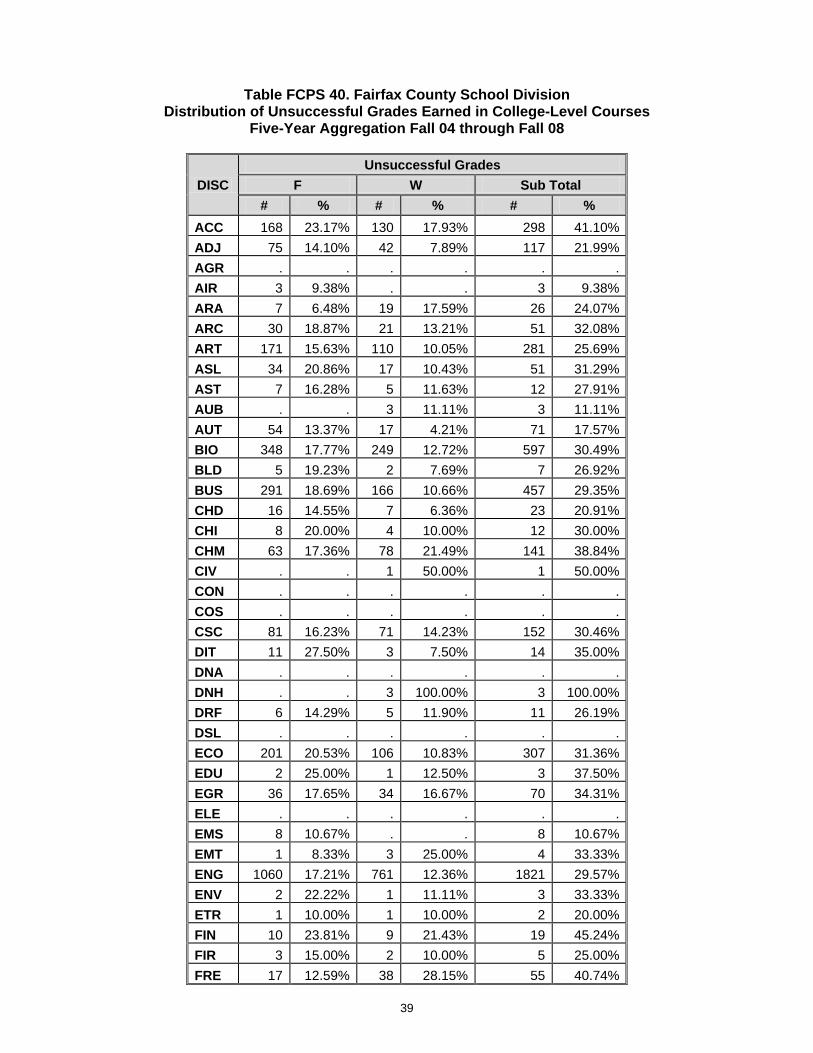
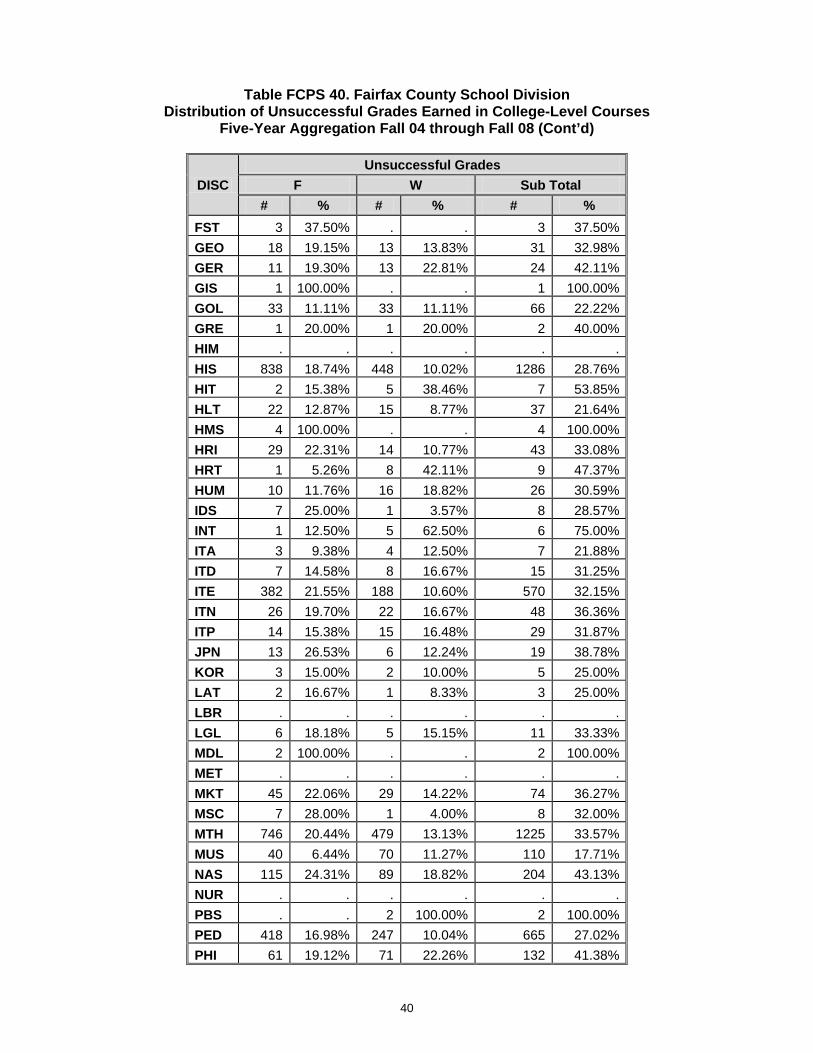
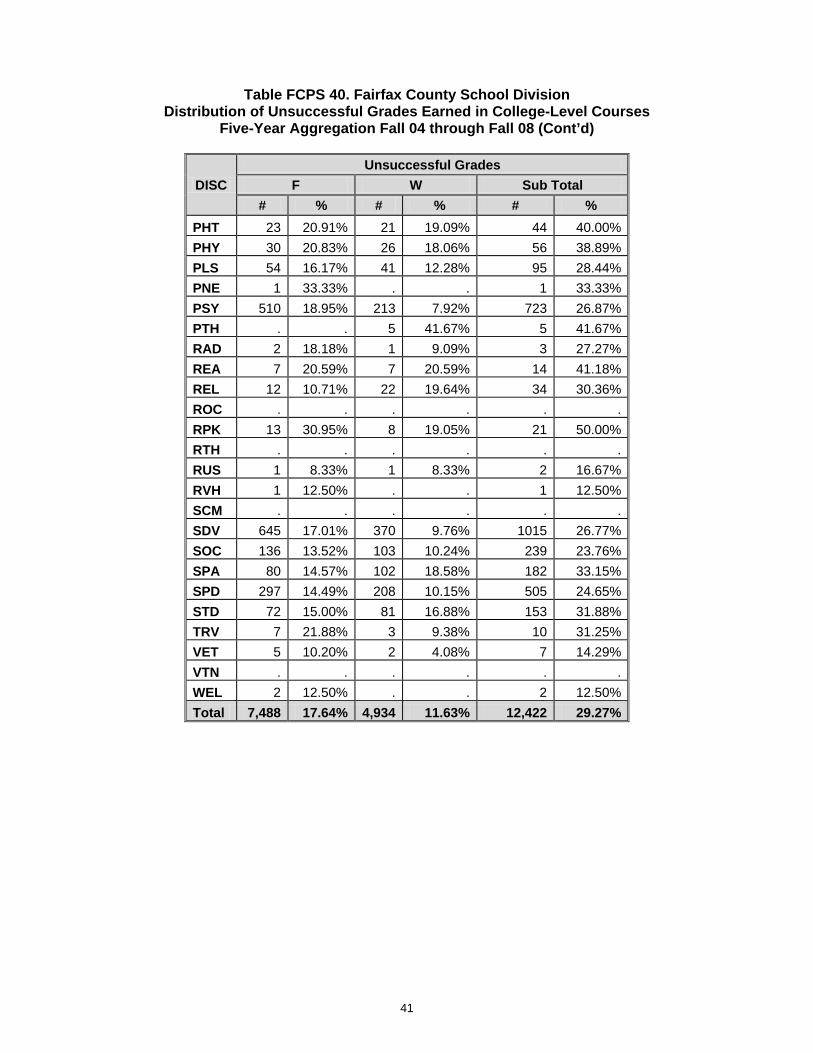
This table presents the distribution of unsuccessful grades (F, W) earned in college-level courses by students who entered community college between Fall 2004 and Fall 2008 by discipline. The grades are aggregated for all students in all high schools within a school district.
Distribution of Unsuccessful Grades Earned in College-Level Courses
This table presents the curricular programs (career-tech, transfer, or unclassified) chosen by students who entered community college between Fall 2004 and Fall 2008 by the high school from which they graduated.
Curricular Program Classifications
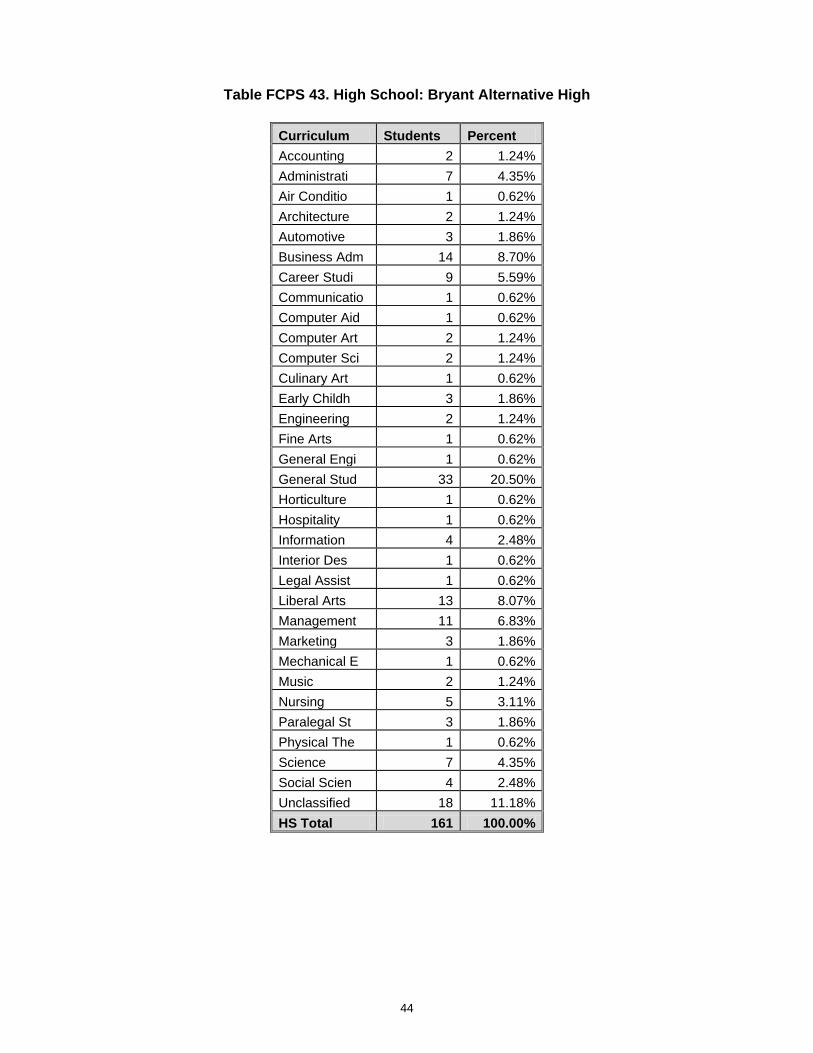
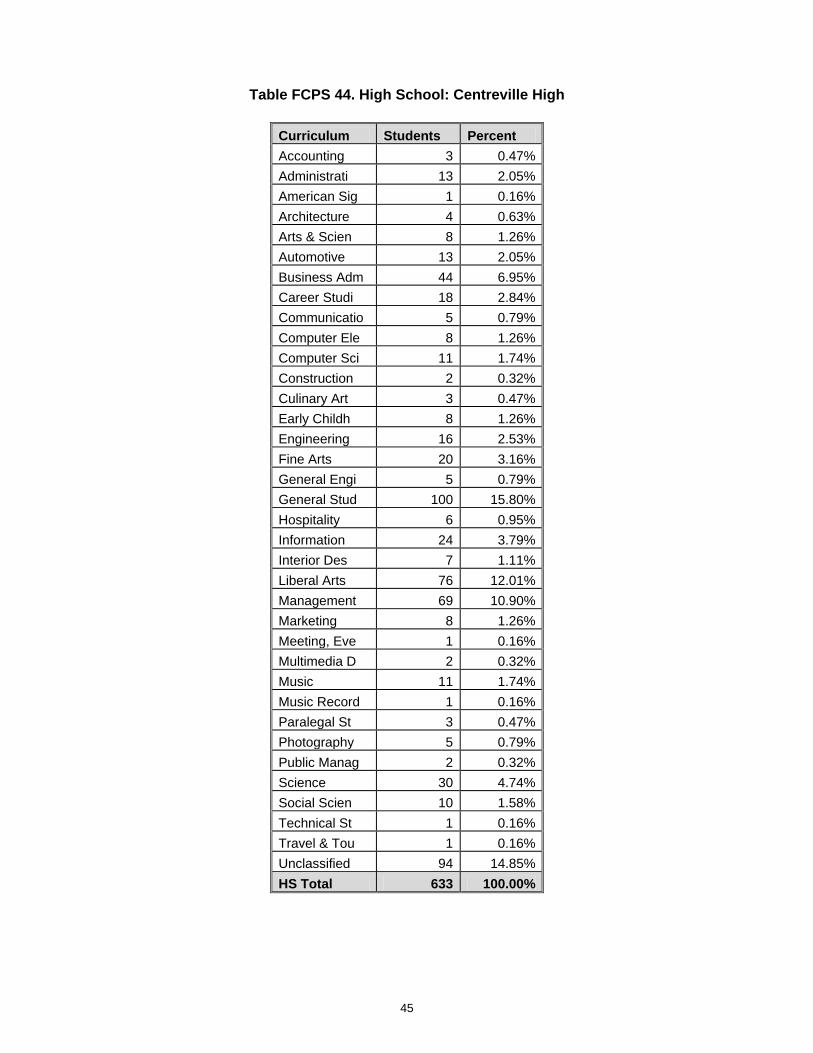
This table specifies the discipline that was selected by community college students in curricular programs from Fall 2004 through Fall 2008.
Curricular Program Selections

Fairfax County
5
Table FCPS 1. Fairfax County School Division Number of Graduates by High School
from DOE Website
Fairfax County High School
2007-2008 Academic
Year #
Annandale High 468 Bryant Alternative High 112 Centreville High 535 Chantilly High 705 Edison High 429 Fairfax High 473 Falls Church High 260 Hayfield High 313 Herndon High 522 Lake Braddock High 633 Langley High 500 Lee High-(Fairfax) 428 Madison High 497 Marshall High 296 McLean High 430 Mount Vernon High 344 Oakton High 584 Pimmit Hills Alternative High 57 Robinson High 680 South County High 441 South Lakes High 320 Stuart High 285 Thomas Jefferson High-(Fairfax) 426 West Potomac High 444 West Springfield High 472 Westfield High 802 Woodson Adult High 40 Woodson High 493 Division Total 11,989
6
Table FCPS 2. Fairfax County School Division
Number of Students Who Were Dual Enrolled in High School Entering Fall 2008
Fairfax County High Schools
Formerly Dual Enrolled Not Formerly Dual Enrolled Total # # #
Annandale High 2 133 135 Bryant Alternative High 2 22 24 Centreville High 0 93 93 Chantilly High 0 119 119 Edison High 3 91 94 Fairfax High 4 126 130 Falls Church High 6 62 68 Hayfield High 0 79 79 Herndon High 0 108 108 Lake Braddock High 1 125 126 Langley High 0 27 27 Lee High-(Fairfax) 2 139 141 Madison High 2 50 52 Marshall High 1 57 58 McLean High 1 56 57 Mount Vernon High 6 86 92 Mountain View Alternative High 2 46 48 Oakton High 0 85 85 Pimmit Hills Alternative High 0 17 17 Robinson High 2 108 110 South County High 1 58 59 South Lakes High 1 53 54 Stuart High 5 86 91 West Potomac High 3 80 83 West Springfield High 2 101 103 Westfield High 1 145 146 Woodson High 2 66 68 Division Total 49 2,218 2,267
7
Table FCPS 3. Fairfax County School Division Distribution of GPA Ranges
Fall 2008
Fairfax County High
Schools
GPA Ranges N/A 0.0 to .49 0.5 to 1.4 1.5 to 2.4 2.5 to 3.4 3.5 to 4.0 Total
# % # % # % # % # % # % # Annandale High 12 8.89% 11 8.15% 20 14.81% 24 17.78% 43 31.85% 25 18.52% 135
Bryant Alternative High
5 20.83% 2 8.33% 4 16.67% 4 16.67% 5 20.83% 4 16.67% 24
Centreville High 9 9.68% 13 13.98% 8 8.60% 15 16.13% 37 39.78% 11 11.83% 93
Chantilly High 11 9.24% 8 6.72% 18 15.13% 27 22.69% 36 30.25% 19 15.97% 119 Edison High 9 9.57% 11 11.70% 15 15.96% 24 25.53% 18 19.15% 17 18.09% 94 Fairfax High 11 8.46% 11 8.46% 11 8.46% 32 24.62% 45 34.62% 20 15.38% 130 Falls Church High 8 11.76% 7 10.29% 12 17.65% 15 22.06% 20 29.41% 6 8.82% 68
Hayfield High 11 13.92% 11 13.92% 5 6.33% 14 17.72% 22 27.85% 16 20.25% 79 Herndon High 7 6.48% 10 9.26% 12 11.11% 27 25.00% 40 37.04% 12 11.11% 108 Lake Braddock High 6 4.76% 13 10.32% 13 10.32% 34 26.98% 39 30.95% 21 16.67% 126
Langley High 2 7.41% 1 3.70% 1 3.70% 7 25.93% 9 33.33% 7 25.93% 27 Lee High-(Fairfax) 11 7.80% 14 9.93% 28 19.86% 30 21.28% 39 27.66% 19 13.48% 141
Madison High 3 5.77% 4 7.69% 9 17.31% 15 28.85% 15 28.85% 6 11.54% 52 Marshall High 5 8.62% 8 13.79% 11 18.97% 12 20.69% 16 27.59% 6 10.34% 58 McLean High 4 7.02% 9 15.79% 7 12.28% 14 24.56% 11 19.30% 12 21.05% 57 Mount Vernon High 4 4.35% 15 16.30% 12 13.04% 20 21.74% 32 34.78% 9 9.78% 92
Mountain View Alternative High
3 6.25% 9 18.75% 7 14.58% 12 25.00% 10 20.83% 7 14.58% 48
Oakton High 6 7.06% 9 10.59% 10 11.76% 17 20.00% 23 27.06% 20 23.53% 85 Pimmit Hills Alternative High
5 29.41% 2 11.76% . . 3 17.65% 5 29.41% 2 11.76% 17
Robinson High 6 5.45% 10 9.09% 21 19.09% 25 22.73% 30 27.27% 18 16.36% 110 South County High 2 3.39% 4 6.78% 6 10.17% 21 35.59% 19 32.20% 7 11.86% 59
South Lakes High 7 12.96% 7 12.96% 6 11.11% 14 25.93% 14 25.93% 6 11.11% 54
Stuart High 7 7.69% 3 3.30% 11 12.09% 23 25.27% 38 41.76% 9 9.89% 91 West Potomac High 5 6.02% 10 12.05% 14 16.87% 26 31.33% 20 24.10% 8 9.64% 83
West Springfield High
13 12.62% 11 10.68% 8 7.77% 28 27.18% 29 28.16% 14 13.59% 103
Westfield High 18 12.33% 14 9.59% 13 8.90% 38 26.03% 41 28.08% 22 15.07% 146 Woodson High 8 11.76% 7 10.29% 8 11.76% 13 19.12% 21 30.88% 11 16.18% 68 Division Total 198 8.73% 234 10.32% 290 12.79% 534 23.56% 677 29.86% 334 14.73% 2,267
8
Table FCPS 4. Fairfax County School Division Distribution of Grades Earned in Developmental Courses
Fall 2008
Fairfax County High Schools
R S U W Total # % # % # % # % #
Annandale High ENG 8 10.96% 57 78.08% 5 6.85% 3 4.11% 73 MTH 5 12.50% 20 50.00% 12 30.00% 3 7.50% 40
Bryant Alternative High
ENG . . 9 81.82% 2 18.18% . . 11 MTH . . 2 33.33% 4 66.67% . . 6
Centreville High ENG 1 1.96% 43 84.31% 4 7.84% 3 5.88% 51 MTH 8 28.57% 13 46.43% 6 21.43% 1 3.57% 28
Chantilly High ENG 1 2.17% 36 78.26% 3 6.52% 6 13.04% 46 MTH 3 7.89% 22 57.89% 8 21.05% 5 13.16% 38
Edison High ENG 11 19.30% 38 66.67% 4 7.02% 4 7.02% 57 MTH . . 4 23.53% 10 58.82% 3 17.65% 17
Fairfax High ENG 8 9.09% 67 76.14% 7 7.95% 6 6.82% 88 MTH 3 7.69% 22 56.41% 13 33.33% 1 2.56% 39
Falls Church High
ENG 3 8.33% 28 77.78% 2 5.56% 3 8.33% 36 MTH 4 14.29% 14 50.00% 10 35.71% . . 28
Hayfield High ENG 6 11.32% 41 77.36% 2 3.77% 4 7.55% 53 MTH 1 3.45% 16 55.17% 10 34.48% 2 6.90% 29
Herndon High ENG 2 4.26% 40 85.11% 4 8.51% 1 2.13% 47 MTH 3 8.33% 24 66.67% 3 8.33% 6 16.67% 36
Lake Braddock High
ENG 4 7.55% 38 71.70% 5 9.43% 6 11.32% 53 MTH 3 6.52% 17 36.96% 17 36.96% 9 19.57% 46
Langley High ENG 1 8.33% 11 91.67% . . . . 12 MTH . . 3 60.00% 2 40.00% . . 5
Lee High-(Fairfax)
ENG 4 4.88% 68 82.93% 7 8.54% 3 3.66% 82 MTH 1 3.70% 12 44.44% 14 51.85% . . 27
Madison High ENG 1 4.76% 18 85.71% 2 9.52% . . 21 MTH . . 3 27.27% 8 72.73% . . 11
Marshall High ENG 4 9.30% 35 81.40% 2 4.65% 2 4.65% 43 MTH . . 6 31.58% 10 52.63% 3 15.79% 19
McLean High ENG 3 11.11% 21 77.78% 3 11.11% . . 27 MTH 1 7.14% 4 28.57% 8 57.14% 1 7.14% 14
Mount Vernon High
ENG 8 15.09% 41 77.36% 4 7.55% . . 53 MTH 1 5.00% 9 45.00% 8 40.00% 2 10.00% 20
Mountain View Alternative High
ENG 3 18.75% 8 50.00% 5 31.25% . . 16 MTH 1 7.69% 5 38.46% 7 53.85% . . 13
Oakton High ENG 2 4.88% 33 80.49% 3 7.32% 3 7.32% 41 MTH . . 21 65.63% 11 34.38% . . 32
Pimmit Hills Alternative High
ENG 1 16.67% 5 83.33% . . . . 6 MTH . . 1 100.00% . . . . 1
Robinson High ENG 8 13.33% 40 66.67% 6 10.00% 6 10.00% 60 MTH 3 7.89% 22 57.89% 12 31.58% 1 2.63% 38
South County High
ENG 3 10.34% 24 82.76% 1 3.45% 1 3.45% 29 MTH . . 11 61.11% 6 33.33% 1 5.56% 18
Note: S = Satisfactory, R = Re-enroll, U = Unsatisfactory, W = Withdraw
9
Table FCPS 4. Fairfax County School Division Distribution of Grades Earned in Developmental Courses
Fall 2008 (Cont’d)
Fairfax County High Schools
R S U W Total # % # % # % # % #
South Lakes High
ENG 8 34.78% 10 43.48% 3 13.04% 2 8.70% 23 MTH 2 12.50% 10 62.50% 3 18.75% 1 6.25% 16
Stuart High ENG 5 12.20% 31 75.61% 4 9.76% 1 2.44% 41 MTH . . 10 52.63% 9 47.37% . . 19
West Potomac High
ENG 2 3.64% 47 85.45% 4 7.27% 2 3.64% 55 MTH . . 7 63.64% 4 36.36% . . 11
West Springfield High
ENG 5 10.20% 35 71.43% 5 10.20% 4 8.16% 49 MTH 1 2.44% 16 39.02% 23 56.10% 1 2.44% 41
Westfield High ENG 6 6.98% 63 73.26% 12 13.95% 5 5.81% 86 MTH 7 17.07% 18 43.90% 15 36.59% 1 2.44% 41
Woodson High ENG 2 6.90% 22 75.86% 2 6.90% 3 10.34% 29 MTH . . 3 30.00% 5 50.00% 2 20.00% 10
Division Total 157 8.57% 1,224 66.85% 339 18.51% 111 6.06% 1,831 Note: S = Satisfactory, R = Re-enroll, U = Unsatisfactory, W = Withdraw
10
Table FCPS 5. Fairfax County School Division Distribution of Passing Grades Earned in College-Level Courses
Fall 2008
DISC
Passed
A B C D Passing Grades Sub-Total
# % # % # % # % # % ACC 7 9.72% 10 13.89% 17 23.61% 8 11.11% 42 58.33% ADJ 14 21.88% 11 17.19% 18 28.13% 9 14.06% 52 81.25% AGR 1 100.00% . . . . . . 1 100.00% ARA 4 25.00% 8 50.00% 1 6.25% . . 13 81.25% ARC 8 36.36% 4 18.18% 2 9.09% 1 4.55% 15 68.18% ART 62 32.46% 40 20.94% 28 14.66% 22 11.52% 152 79.58% ASL 13 39.39% 7 21.21% 3 9.09% 2 6.06% 25 75.76% AST 4 57.14% 1 14.29% 2 28.57% . . 7 100.00% AUT 13 22.41% 27 46.55% 7 12.07% 5 8.62% 52 89.66% BIO 56 17.67% 77 24.29% 78 24.61% 39 12.30% 250 78.86% BLD 2 66.67% 1 33.33% . . . . 3 100.00% BUS 40 23.12% 50 28.90% 35 20.23% 13 7.51% 138 79.77% CHD 2 28.57% 2 28.57% 1 14.29% 1 14.29% 6 85.71% CHI 2 33.33% 1 16.67% . . 1 16.67% 4 66.67% CHM 8 13.56% 12 20.34% 13 22.03% 3 5.08% 36 61.02% CSC 28 28.28% 31 31.31% 18 18.18% 1 1.01% 78 78.79% DRF 3 42.86% 2 28.57% . . . . 5 71.43% ECO 16 19.05% 20 23.81% 16 19.05% 12 14.29% 64 76.19% EGR 8 26.67% 8 26.67% 4 13.33% 3 10.00% 23 76.67% EMS 1 50.00% . . 1 50.00% . . 2 100.00% ENG 201 17.95% 320 28.57% 251 22.41% 94 8.39% 866 77.32% FRE 9 42.86% 3 14.29% 3 14.29% 2 9.52% 17 80.95% GEO 3 30.00% . . 3 30.00% 1 10.00% 7 70.00% GOL 3 11.11% 5 18.52% 7 25.93% 5 18.52% 20 74.07% HIS 136 18.60% 198 27.09% 159 21.75% 82 11.22% 575 78.66% HLT 10 43.48% 4 17.39% 3 13.04% . . 17 73.91% HRI 1 7.69% 3 23.08% 3 23.08% 2 15.38% 9 69.23% HUM 1 12.50% 2 25.00% 1 12.50% 1 12.50% 5 62.50% IDS 1 20.00% . . . . 1 20.00% 2 40.00% ITD 1 50.00% . . 1 50.00% . . 2 100.00% ITE 79 21.82% 79 21.82% 70 19.34% 39 10.77% 267 73.76% ITN 3 14.29% 2 9.52% 4 19.05% 5 23.81% 14 66.67% ITP 1 7.69% 5 38.46% 2 15.38% . . 8 61.54% JPN 1 16.67% 1 16.67% 2 33.33% 1 16.67% 5 83.33% KOR 3 50.00% 3 50.00% . . . . 6 100.00% LBR 1 100.00% . . . . . . 1 100.00% LGL 2 50.00% . . . . . . 2 50.00% MKT 1 5.56% 9 50.00% 4 22.22% . . 14 77.78%
11
Table FCPS 5. Fairfax County School Division Distribution of Passing Grades Earned in College-Level Courses
Fall 2008 (Cont’d)
DISC
Passed
A B C D Passing Grades Sub-Total
# % # % # % # % # % MSC 7 46.67% 1 6.67% . . 1 6.67% 9 60.00% MTH 117 18.28% 143 22.34% 137 21.41% 63 9.84% 460 71.88% MUS 41 52.56% 14 17.95% 7 8.97% 5 6.41% 67 85.90% NAS 11 13.58% 16 19.75% 19 23.46% 11 13.58% 57 70.37% PED 158 33.12% 133 27.88% 76 15.93% 30 6.29% 397 83.23% PHT 2 11.76% 2 11.76% 2 11.76% . . 6 35.29% PHY 4 22.22% 3 16.67% 6 33.33% 1 5.56% 14 77.78% PLS 9 24.32% 7 18.92% 11 29.73% 1 2.70% 28 75.68% PSY 103 24.64% 106 25.36% 73 17.46% 39 9.33% 321 76.79% RAD 1 20.00% 2 40.00% 1 20.00% 1 20.00% 5 100.00% REA 1 100.00% . . . . . . 1 100.00% REL 4 36.36% 5 45.45% 2 18.18% . . 11 100.00% RUS 2 100.00% . . . . . . 2 100.00% SDV 434 42.97% 178 17.62% 122 12.08% 66 6.53% 800 79.21% SOC 35 26.52% 45 34.09% 22 16.67% 8 6.06% 110 83.33% SPA 11 16.92% 20 30.77% 16 24.62% 6 9.23% 53 81.54% SPD 114 33.33% 90 26.32% 56 16.37% 21 6.14% 281 82.16% VET 6 60.00% 1 10.00% 3 30.00% . . 10 100.00% AIR . . 3 75.00% 1 25.00% . . 4 100.00% AUB . . 3 75.00% 1 25.00% . . 4 100.00% DIT . . 1 33.33% . . 1 33.33% 2 66.67% DSL . . 1 100.00% . . . . 1 100.00% FST . . 1 50.00% . . . . 1 50.00% GER . . 3 37.50% . . 1 12.50% 4 50.00% PHI . . 7 29.17% 4 16.67% 4 16.67% 15 62.50% RPK . . 2 50.00% . . . . 2 50.00% FIN . . . . 1 50.00% . . 1 50.00% HIM . . . . 1 100.00% . . 1 100.00% ITA . . . . 1 100.00% . . 1 100.00% ENV . . . . . . 1 100.00% 1 100.00% LAT . . . . . . . . . . TRV . . . . . . . . . . Total 1,809 25.63% 1,733 24.55% 1,319 18.69% 613 8.69% 5,474 77.56%
12
Table FCPS 6. Fairfax County School Division Distribution of Unsuccessful Grades Earned in College-Level Courses
Fall 2008
DISC
Unsuccessful
F W Unsuccessful Grades Sub-Total
# % # % # % ACC 16 22.22% 14 19.44% 30 41.67% ADJ 8 12.50% 4 6.25% 12 18.75% AGR . . . . . . ARA . . 3 18.75% 3 18.75% ARC 2 9.09% 5 22.73% 7 31.82% ART 29 15.18% 10 5.24% 39 20.42% ASL 6 18.18% 2 6.06% 8 24.24% AST . . . . . . AUT 6 10.34% . . 6 10.34% BIO 36 11.36% 31 9.78% 67 21.14% BLD . . . . . . BUS 24 13.87% 11 6.36% 35 20.23% CHD 1 14.29% . . 1 14.29% CHI 1 16.67% 1 16.67% 2 33.33% CHM 12 20.34% 11 18.64% 23 38.98% CSC 12 12.12% 9 9.09% 21 21.21% DRF 2 28.57% . . 2 28.57% ECO 13 15.48% 7 8.33% 20 23.81% EGR 3 10.00% 4 13.33% 7 23.33% EMS . . . . . . ENG 171 15.27% 83 7.41% 254 22.68% FRE 2 9.52% 2 9.52% 4 19.05% GEO 1 10.00% 2 20.00% 3 30.00% GOL 4 14.81% 3 11.11% 7 25.93% HIS 107 14.64% 49 6.70% 156 21.34% HLT 3 13.04% 3 13.04% 6 26.09% HRI 2 15.38% 2 15.38% 4 30.77% HUM 2 25.00% 1 12.50% 3 37.50% IDS 3 60.00% . . 3 60.00% ITD . . . . . . ITE 65 17.96% 30 8.29% 95 26.24% ITN 2 9.52% 5 23.81% 7 33.33% ITP 3 23.08% 2 15.38% 5 38.46% JPN 1 16.67% . . 1 16.67% KOR . . . . . . LBR . . . . . . LGL 1 25.00% 1 25.00% 2 50.00% MKT 3 16.67% 1 5.56% 4 22.22%
13
Table FCPS 6. Fairfax County School Division Distribution of Unsuccessful Grades Earned in College-Level Courses
Fall 2008 (Cont’d)
DISC
Unsuccessful
F W Unsuccessful Grades Sub-Total
# % # % # % MSC 6 40.00% . . 6 40.00% MTH 123 19.22% 57 8.91% 180 28.13% MUS 8 10.26% 3 3.85% 11 14.10% NAS 15 18.52% 9 11.11% 24 29.63% PED 61 12.79% 19 3.98% 80 16.77% PHT 7 41.18% 4 23.53% 11 64.71% PHY 2 11.11% 2 11.11% 4 22.22% PLS 5 13.51% 4 10.81% 9 24.32% PSY 74 17.70% 23 5.50% 97 23.21% RAD . . . . . . REA . . . . . . REL . . . . . . RUS . . . . . . SDV 146 14.46% 64 6.34% 210 20.79% SOC 14 10.61% 8 6.06% 22 16.67% SPA 4 6.15% 8 12.31% 12 18.46% SPD 39 11.40% 22 6.43% 61 17.84% VET . . . . . . AIR . . . . . . AUB . . . . . . DIT 1 33.33% . . 1 33.33% DSL . . . . . . FST 1 50.00% . . 1 50.00% GER 3 37.50% 1 12.50% 4 50.00% PHI 5 20.83% 4 16.67% 9 37.50% RPK 1 25.00% 1 25.00% 2 50.00% FIN 1 50.00% . . 1 50.00% HIM . . . . . . ITA . . . . . . ENV . . . . . . LAT 1 100.00% . . 1 100.00% TRV . . 1 100.00% 1 100.00% Total 1,058 14.99% 526 7.45% 1,584 22.44%
14
Table FCPS 7. Fairfax County School Division Curricular Program Classifications
Fall 2008
Fairfax County High Schools
Career-Tech Transfer Unclassified Total Students
# % # % # % # Annandale High 25 18.52% 104 77.04% 6 4.44% 135 Bryant Alternative High 8 33.33% 13 54.17% 3 12.50% 24 Centreville High 26 27.96% 56 60.22% 11 11.83% 93 Chantilly High 42 35.29% 66 55.46% 11 9.24% 119 Edison High 8 8.51% 78 82.98% 8 8.51% 94 Fairfax High 34 26.15% 82 63.08% 14 10.77% 130 Falls Church High 8 11.76% 57 83.82% 3 4.41% 68 Hayfield High 20 25.32% 54 68.35% 5 6.33% 79 Herndon High 32 29.63% 65 60.19% 11 10.19% 108 Lake Braddock High 40 31.75% 75 59.52% 11 8.73% 126 Langley High 10 37.04% 13 48.15% 4 14.81% 27 Lee High-(Fairfax) 39 27.66% 95 67.38% 7 4.96% 141 Madison High 22 42.31% 20 38.46% 10 19.23% 52 Marshall High 12 20.69% 41 70.69% 5 8.62% 58 McLean High 22 38.60% 31 54.39% 4 7.02% 57 Mount Vernon High 15 16.30% 71 77.17% 6 6.52% 92 Mountain View Alternative High 17 35.42% 27 56.25% 4 8.33% 48 Oakton High 27 31.76% 48 56.47% 10 11.76% 85 Pimmit Hills Alternative High 11 64.71% 4 23.53% 2 11.76% 17 Robinson High 37 33.64% 62 56.36% 11 10.00% 110 South County High 18 30.51% 34 57.63% 7 11.86% 59 South Lakes High 17 31.48% 34 62.96% 3 5.56% 54 Stuart High 21 23.08% 64 70.33% 6 6.59% 91 West Potomac High 11 13.25% 64 77.11% 8 9.64% 83 West Springfield High 31 30.10% 64 62.14% 8 7.77% 103 Westfield High 41 28.08% 91 62.33% 14 9.59% 146 Woodson High 21 30.88% 35 51.47% 12 17.65% 68 Division Total 615 27.13% 1,448 63.87% 204 9.00% 2,267
15
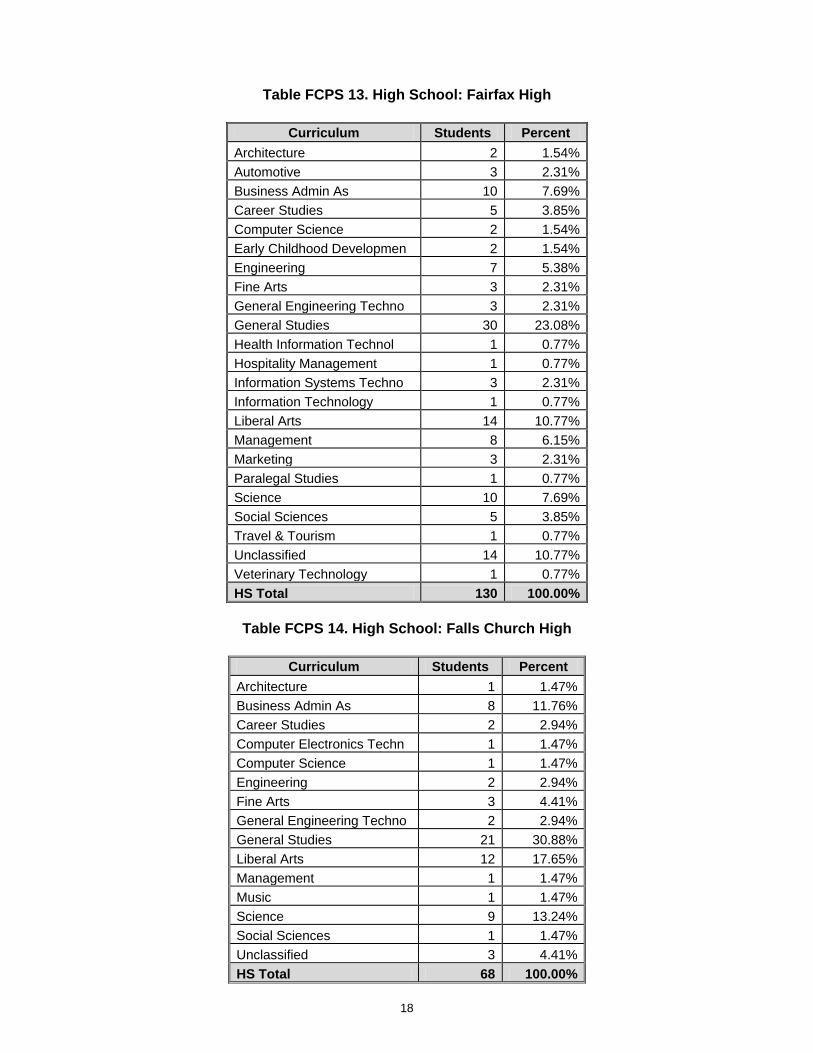
Fairfax County School Division Curricular Program Selections
Fall 2008
Table FCPS 8. High School: Annandale High
Curriculum Students Percent Administration Of Justice 1 0.74% Automotive 3 2.22% Business Admin As 17 12.59% Career Studies 1 0.74% Communication Design 2 1.48% Computer Electronics Technology 1 0.74% Computer Science 4 2.96% Culinary Arts 1 0.74% Dental Hygiene 1 0.74% Early Childhood Development 1 0.74% Engineering 9 6.67% Fine Arts 2 1.48% General Studies 37 27.41% Hospitality Management 3 2.22% Information Technology 4 2.96% Interior Design 1 0.74% Liberal Arts 14 10.37% Management 10 7.41% Music 3 2.22% Science 10 7.41% Social Sciences 4 2.96% Unclassified 6 4.44% HS Total 135 100.00%
Table FCPS 9. High School: Bryant Alternative High
Curriculum Students Percent
Business Admin As 1 4.17% Career Studies 2 8.33% Computer Aided Drafting & 1 4.17% Early Childhood Development 1 4.17% General Studies 9 37.50% Information Technology 1 4.17% Management 2 8.33% Nursing 1 4.17% Paralegal Studies 1 4.17% Science 2 8.33% Unclassified 3 12.50% HS Total 24 100.00%
16
Table FCPS 10. High School: Centreville High
Curriculum Students Percent Accounting 1 1.08% American Sign Language - E 1 1.08% Automotive 3 3.23% Business Admin As 7 7.53% Computer Electronics Technolog 1 1.08% Computer Science 2 2.15% Engineering 1 1.08% Fine Arts 4 4.30% General Engineering Techno 1 1.08% General Studies 19 20.43% Hospitality Management 1 1.08% Information Systems Techno 2 2.15% Information Technology 9 9.68% Liberal Arts 8 8.60% Management 9 9.68% Music 4 4.30% Photography 1 1.08% Science 5 5.38% Social Sciences 2 2.15% Travel & Tourism 1 1.08% Unclassified 11 11.83% HS Total 93 100.00%
Table FCPS 11. High School: Chantilly High
Curriculum Students Percent
Accounting 2 1.68% Administration Of Justice 4 3.36% Architecture 1 0.84% Automotive 5 4.20% Business Admin As 7 5.88% Career Studies 4 3.36% Communication Design 1 0.84% Computer Electronics Techn 1 0.84% Computer Science 2 1.68% Early Childhood Developmen 1 0.84% Engineering 4 3.36% Fine Arts 4 3.36%
17
Table FCPS 11. High School: Chantilly High (Cont’d)
Curriculum Students Percent
General Engineering Techno 1 0.84% General Studies 25 21.01% Hospitality Management 3 2.52% Information Systems Techno 2 1.68% Information Technology 2 1.68% Interior Design 2 1.68% Liberal Arts 10 8.40% Management 13 10.92% Marketing 2 1.68% Science 6 5.04% Social Sciences 6 5.04% Unclassified 11 9.24% HS Total 119 100.00%
Table FCPS 12. High School: Edison High
Curriculum Students Percent
Accounting 1 1.06% Administration Of Justice 1 1.06% Architecture 1 1.06% Automotive 2 2.13% Business Admin As 11 11.70% Computer Science 4 4.26% Engineering 3 3.19% Fine Arts 2 2.13% General Studies 14 14.89% Information Technology 5 5.32% Liberal Arts 29 30.85% Management 3 3.19% Science 8 8.51% Social Sciences 2 2.13% Unclassified 8 8.51% HS Total 94 100.00%
18
Table FCPS 13. High School: Fairfax High
Curriculum Students Percent Architecture 2 1.54% Automotive 3 2.31% Business Admin As 10 7.69% Career Studies 5 3.85% Computer Science 2 1.54% Early Childhood Developmen 2 1.54% Engineering 7 5.38% Fine Arts 3 2.31% General Engineering Techno 3 2.31% General Studies 30 23.08% Health Information Technol 1 0.77% Hospitality Management 1 0.77% Information Systems Techno 3 2.31% Information Technology 1 0.77% Liberal Arts 14 10.77% Management 8 6.15% Marketing 3 2.31% Paralegal Studies 1 0.77% Science 10 7.69% Social Sciences 5 3.85% Travel & Tourism 1 0.77% Unclassified 14 10.77% Veterinary Technology 1 0.77% HS Total 130 100.00%
Table FCPS 14. High School: Falls Church High
Curriculum Students Percent
Architecture 1 1.47% Business Admin As 8 11.76% Career Studies 2 2.94% Computer Electronics Techn 1 1.47% Computer Science 1 1.47% Engineering 2 2.94% Fine Arts 3 4.41% General Engineering Techno 2 2.94% General Studies 21 30.88% Liberal Arts 12 17.65% Management 1 1.47% Music 1 1.47% Science 9 13.24% Social Sciences 1 1.47% Unclassified 3 4.41% HS Total 68 100.00%
19
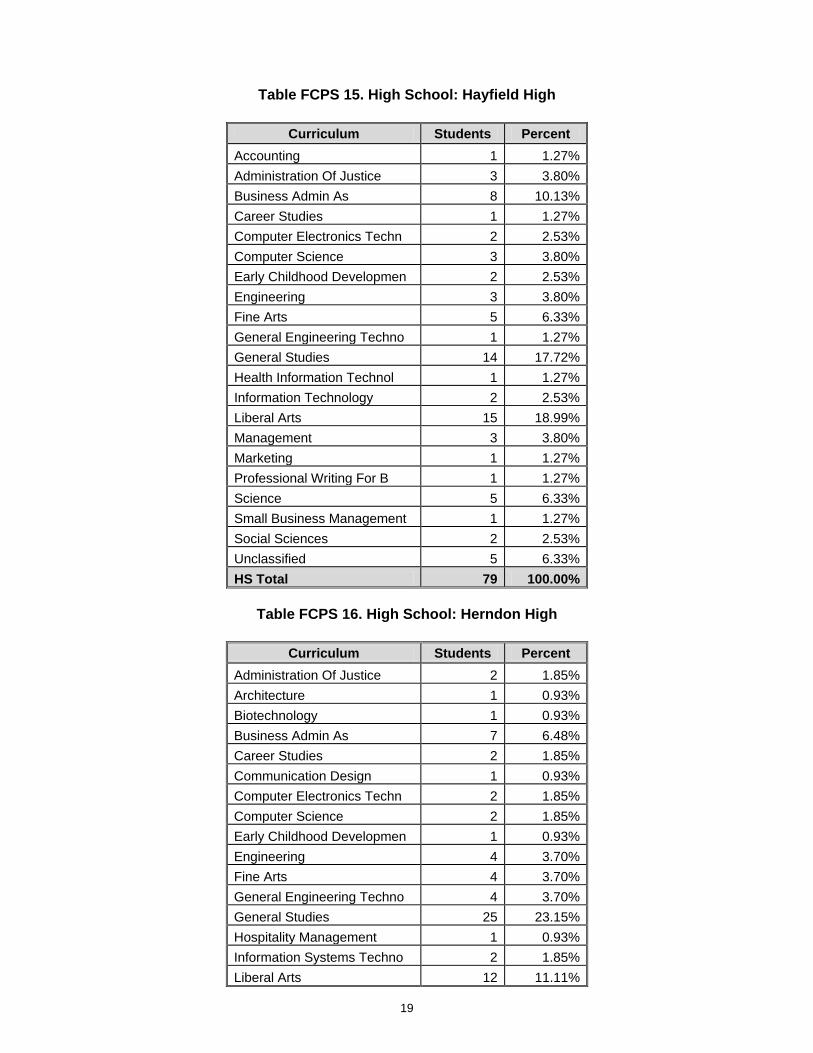
Table FCPS 15. High School: Hayfield High
Curriculum Students Percent Accounting 1 1.27% Administration Of Justice 3 3.80% Business Admin As 8 10.13% Career Studies 1 1.27% Computer Electronics Techn 2 2.53% Computer Science 3 3.80% Early Childhood Developmen 2 2.53% Engineering 3 3.80% Fine Arts 5 6.33% General Engineering Techno 1 1.27% General Studies 14 17.72% Health Information Technol 1 1.27% Information Technology 2 2.53% Liberal Arts 15 18.99% Management 3 3.80% Marketing 1 1.27% Professional Writing For B 1 1.27% Science 5 6.33% Small Business Management 1 1.27% Social Sciences 2 2.53% Unclassified 5 6.33% HS Total 79 100.00%
Table FCPS 16. High School: Herndon High
Curriculum Students Percent
Administration Of Justice 2 1.85% Architecture 1 0.93% Biotechnology 1 0.93% Business Admin As 7 6.48% Career Studies 2 1.85% Communication Design 1 0.93% Computer Electronics Techn 2 1.85% Computer Science 2 1.85% Early Childhood Developmen 1 0.93% Engineering 4 3.70% Fine Arts 4 3.70% General Engineering Techno 4 3.70% General Studies 25 23.15% Hospitality Management 1 0.93% Information Systems Techno 2 1.85% Liberal Arts 12 11.11%
20
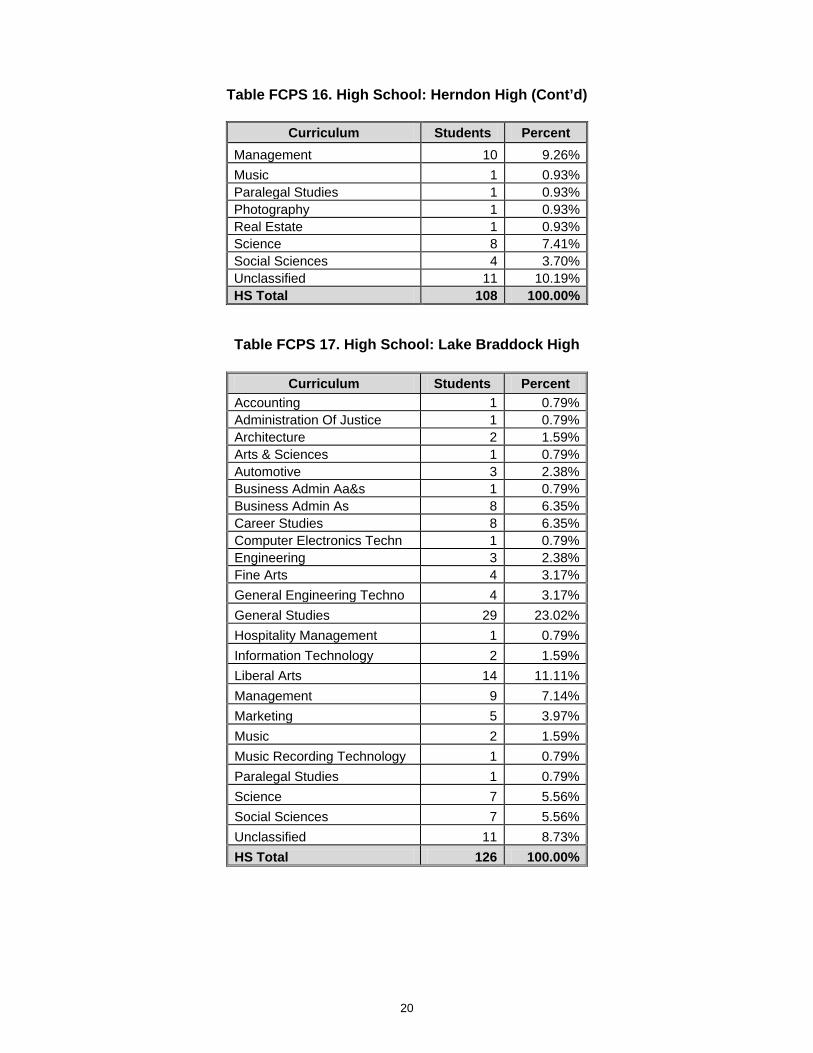
Table FCPS 16. High School: Herndon High (Cont’d)
Curriculum Students Percent Management 10 9.26% Music 1 0.93% Paralegal Studies 1 0.93% Photography 1 0.93% Real Estate 1 0.93% Science 8 7.41% Social Sciences 4 3.70% Unclassified 11 10.19% HS Total 108 100.00%
Table FCPS 17. High School: Lake Braddock High
Curriculum Students Percent Accounting 1 0.79% Administration Of Justice 1 0.79% Architecture 2 1.59% Arts & Sciences 1 0.79% Automotive 3 2.38% Business Admin Aa&s 1 0.79% Business Admin As 8 6.35% Career Studies 8 6.35% Computer Electronics Techn 1 0.79% Engineering 3 2.38% Fine Arts 4 3.17% General Engineering Techno 4 3.17% General Studies 29 23.02% Hospitality Management 1 0.79% Information Technology 2 1.59% Liberal Arts 14 11.11% Management 9 7.14% Marketing 5 3.97% Music 2 1.59% Music Recording Technology 1 0.79% Paralegal Studies 1 0.79% Science 7 5.56% Social Sciences 7 5.56% Unclassified 11 8.73% HS Total 126 100.00%
21
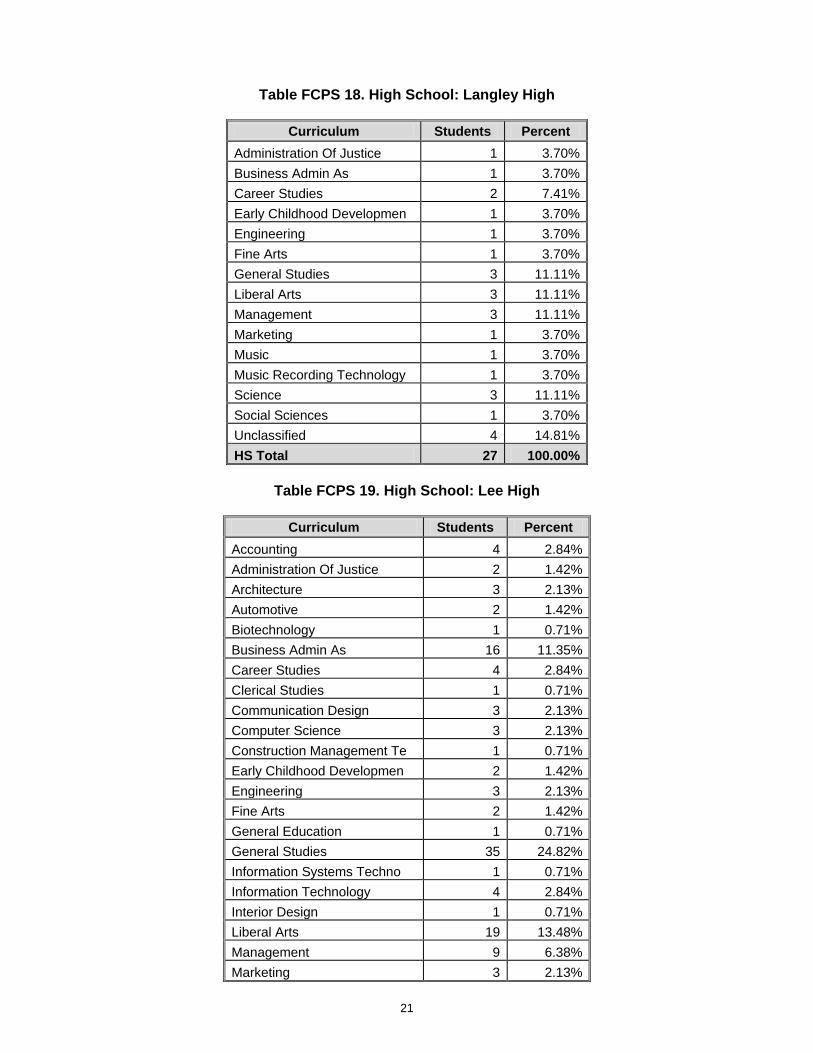
Table FCPS 18. High School: Langley High
Curriculum Students Percent Administration Of Justice 1 3.70% Business Admin As 1 3.70% Career Studies 2 7.41% Early Childhood Developmen 1 3.70% Engineering 1 3.70% Fine Arts 1 3.70% General Studies 3 11.11% Liberal Arts 3 11.11% Management 3 11.11% Marketing 1 3.70% Music 1 3.70% Music Recording Technology 1 3.70% Science 3 11.11% Social Sciences 1 3.70% Unclassified 4 14.81% HS Total 27 100.00%
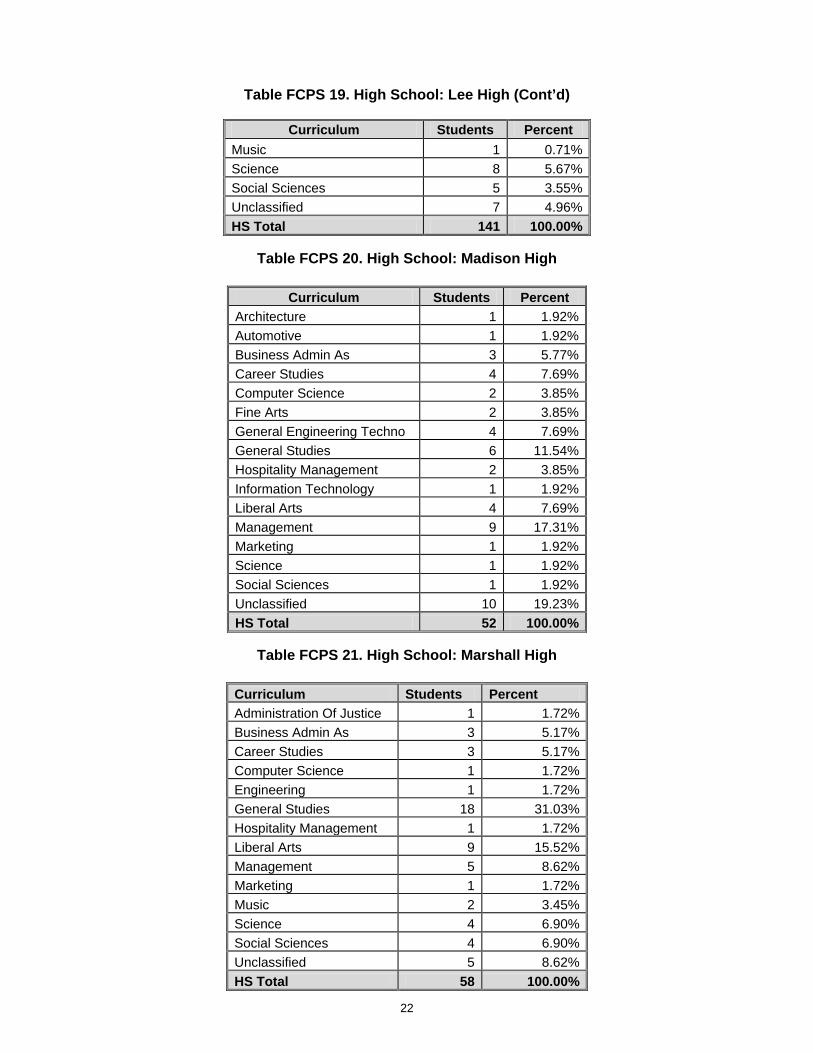
Table FCPS 19. High School: Lee High
Curriculum Students Percent
Accounting 4 2.84% Administration Of Justice 2 1.42% Architecture 3 2.13% Automotive 2 1.42% Biotechnology 1 0.71% Business Admin As 16 11.35% Career Studies 4 2.84% Clerical Studies 1 0.71% Communication Design 3 2.13% Computer Science 3 2.13% Construction Management Te 1 0.71% Early Childhood Developmen 2 1.42% Engineering 3 2.13% Fine Arts 2 1.42% General Education 1 0.71% General Studies 35 24.82% Information Systems Techno 1 0.71% Information Technology 4 2.84% Interior Design 1 0.71% Liberal Arts 19 13.48% Management 9 6.38% Marketing 3 2.13%
22
Table FCPS 19. High School: Lee High (Cont’d)
Curriculum Students Percent Music 1 0.71% Science 8 5.67% Social Sciences 5 3.55% Unclassified 7 4.96% HS Total 141 100.00%
Table FCPS 20. High School: Madison High
Curriculum Students Percent
Architecture 1 1.92% Automotive 1 1.92% Business Admin As 3 5.77% Career Studies 4 7.69% Computer Science 2 3.85% Fine Arts 2 3.85% General Engineering Techno 4 7.69% General Studies 6 11.54% Hospitality Management 2 3.85% Information Technology 1 1.92% Liberal Arts 4 7.69% Management 9 17.31% Marketing 1 1.92% Science 1 1.92% Social Sciences 1 1.92% Unclassified 10 19.23% HS Total 52 100.00%
Table FCPS 21. High School: Marshall High
Curriculum Students Percent Administration Of Justice 1 1.72% Business Admin As 3 5.17% Career Studies 3 5.17% Computer Science 1 1.72% Engineering 1 1.72% General Studies 18 31.03% Hospitality Management 1 1.72% Liberal Arts 9 15.52% Management 5 8.62% Marketing 1 1.72% Music 2 3.45% Science 4 6.90% Social Sciences 4 6.90% Unclassified 5 8.62% HS Total 58 100.00%
23
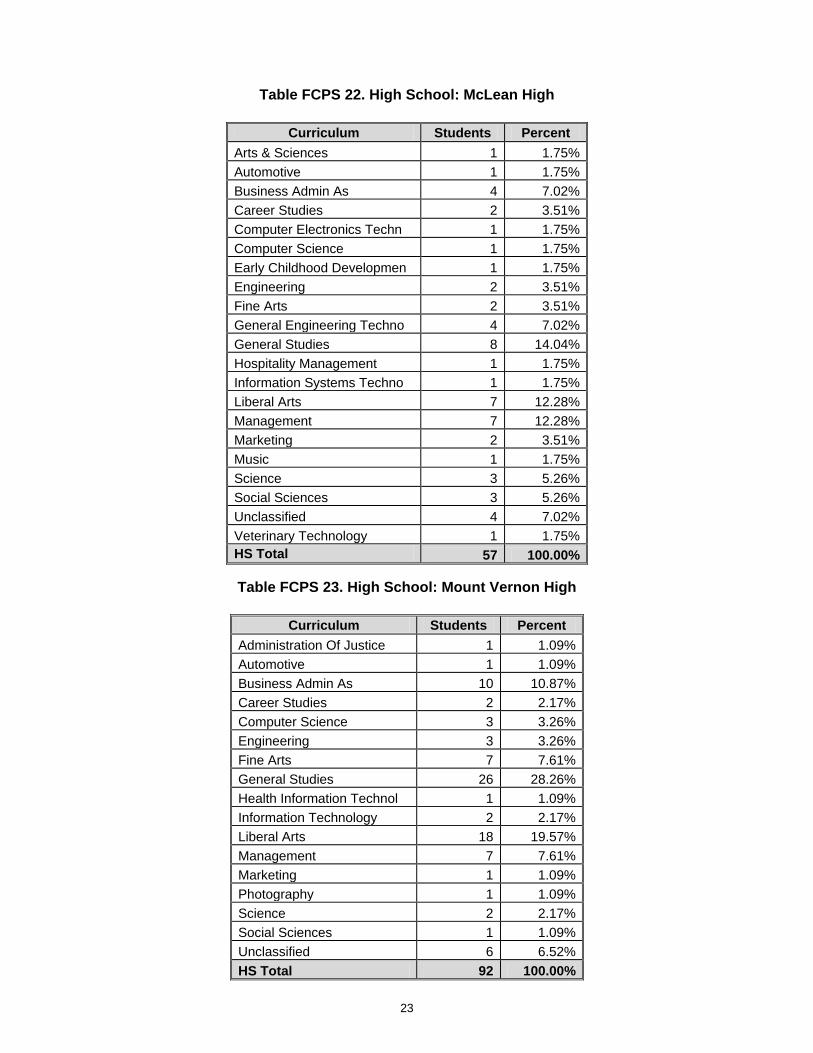
Table FCPS 22. High School: McLean High
Curriculum Students Percent Arts & Sciences 1 1.75% Automotive 1 1.75% Business Admin As 4 7.02% Career Studies 2 3.51% Computer Electronics Techn 1 1.75% Computer Science 1 1.75% Early Childhood Developmen 1 1.75% Engineering 2 3.51% Fine Arts 2 3.51% General Engineering Techno 4 7.02% General Studies 8 14.04% Hospitality Management 1 1.75% Information Systems Techno 1 1.75% Liberal Arts 7 12.28% Management 7 12.28% Marketing 2 3.51% Music 1 1.75% Science 3 5.26% Social Sciences 3 5.26% Unclassified 4 7.02% Veterinary Technology 1 1.75% HS Total 57 100.00%
Table FCPS 23. High School: Mount Vernon High
Curriculum Students Percent
Administration Of Justice 1 1.09% Automotive 1 1.09% Business Admin As 10 10.87% Career Studies 2 2.17% Computer Science 3 3.26% Engineering 3 3.26% Fine Arts 7 7.61% General Studies 26 28.26% Health Information Technol 1 1.09% Information Technology 2 2.17% Liberal Arts 18 19.57% Management 7 7.61% Marketing 1 1.09% Photography 1 1.09% Science 2 2.17% Social Sciences 1 1.09% Unclassified 6 6.52% HS Total 92 100.00%
24
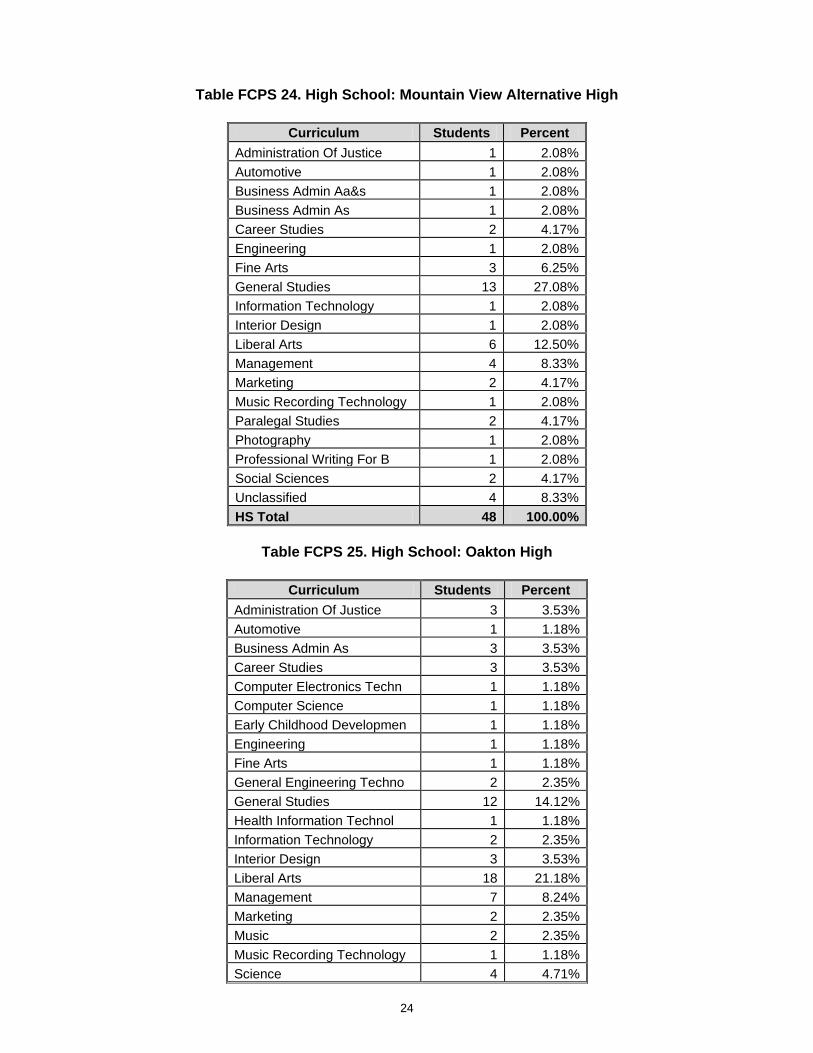
Table FCPS 24. High School: Mountain View Alternative High
Curriculum Students Percent Administration Of Justice 1 2.08% Automotive 1 2.08% Business Admin Aa&s 1 2.08% Business Admin As 1 2.08% Career Studies 2 4.17% Engineering 1 2.08% Fine Arts 3 6.25% General Studies 13 27.08% Information Technology 1 2.08% Interior Design 1 2.08% Liberal Arts 6 12.50% Management 4 8.33% Marketing 2 4.17% Music Recording Technology 1 2.08% Paralegal Studies 2 4.17% Photography 1 2.08% Professional Writing For B 1 2.08% Social Sciences 2 4.17% Unclassified 4 8.33% HS Total 48 100.00%
Table FCPS 25. High School: Oakton High
Curriculum Students Percent
Administration Of Justice 3 3.53% Automotive 1 1.18% Business Admin As 3 3.53% Career Studies 3 3.53% Computer Electronics Techn 1 1.18% Computer Science 1 1.18% Early Childhood Developmen 1 1.18% Engineering 1 1.18% Fine Arts 1 1.18% General Engineering Techno 2 2.35% General Studies 12 14.12% Health Information Technol 1 1.18% Information Technology 2 2.35% Interior Design 3 3.53% Liberal Arts 18 21.18% Management 7 8.24% Marketing 2 2.35% Music 2 2.35% Music Recording Technology 1 1.18% Science 4 4.71%
25
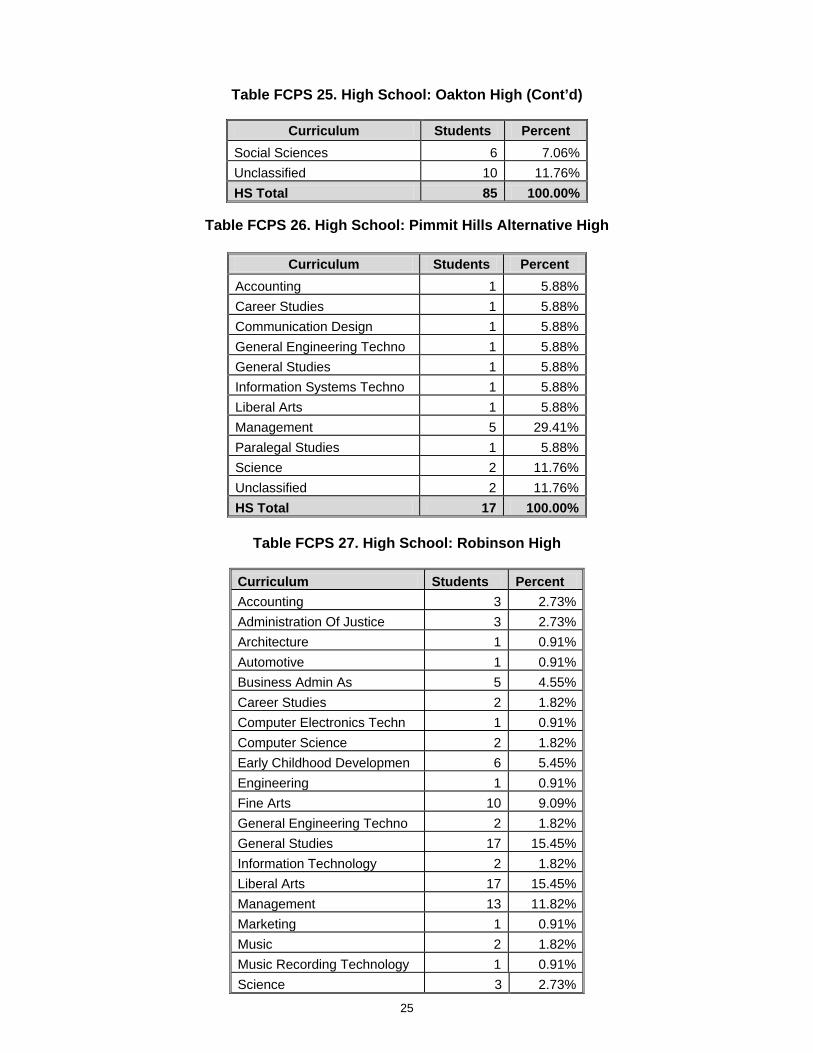
Table FCPS 25. High School: Oakton High (Cont’d)
Curriculum Students Percent Social Sciences 6 7.06% Unclassified 10 11.76% HS Total 85 100.00%
Table FCPS 26. High School: Pimmit Hills Alternative High
Curriculum Students Percent
Accounting 1 5.88% Career Studies 1 5.88% Communication Design 1 5.88% General Engineering Techno 1 5.88% General Studies 1 5.88% Information Systems Techno 1 5.88% Liberal Arts 1 5.88% Management 5 29.41% Paralegal Studies 1 5.88% Science 2 11.76% Unclassified 2 11.76% HS Total 17 100.00%
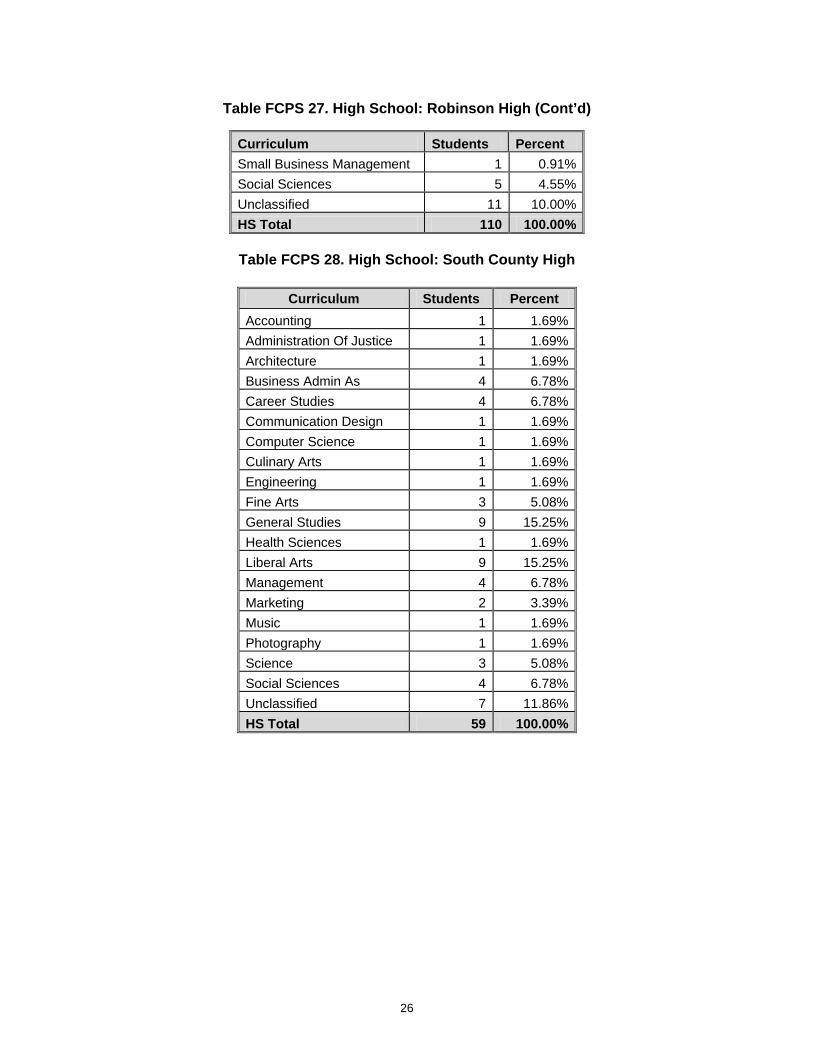
Table FCPS 27. High School: Robinson High
Curriculum Students Percent Accounting 3 2.73% Administration Of Justice 3 2.73% Architecture 1 0.91% Automotive 1 0.91% Business Admin As 5 4.55% Career Studies 2 1.82% Computer Electronics Techn 1 0.91% Computer Science 2 1.82% Early Childhood Developmen 6 5.45% Engineering 1 0.91% Fine Arts 10 9.09% General Engineering Techno 2 1.82% General Studies 17 15.45% Information Technology 2 1.82% Liberal Arts 17 15.45% Management 13 11.82% Marketing 1 0.91% Music 2 1.82% Music Recording Technology 1 0.91% Science 3 2.73%
26
Table FCPS 27. High School: Robinson High (Cont’d)
Curriculum Students Percent Small Business Management 1 0.91% Social Sciences 5 4.55% Unclassified 11 10.00% HS Total 110 100.00%
Table FCPS 28. High School: South County High
Curriculum Students Percent
Accounting 1 1.69% Administration Of Justice 1 1.69% Architecture 1 1.69% Business Admin As 4 6.78% Career Studies 4 6.78% Communication Design 1 1.69% Computer Science 1 1.69% Culinary Arts 1 1.69% Engineering 1 1.69% Fine Arts 3 5.08% General Studies 9 15.25% Health Sciences 1 1.69% Liberal Arts 9 15.25% Management 4 6.78% Marketing 2 3.39% Music 1 1.69% Photography 1 1.69% Science 3 5.08% Social Sciences 4 6.78% Unclassified 7 11.86% HS Total 59 100.00%
27
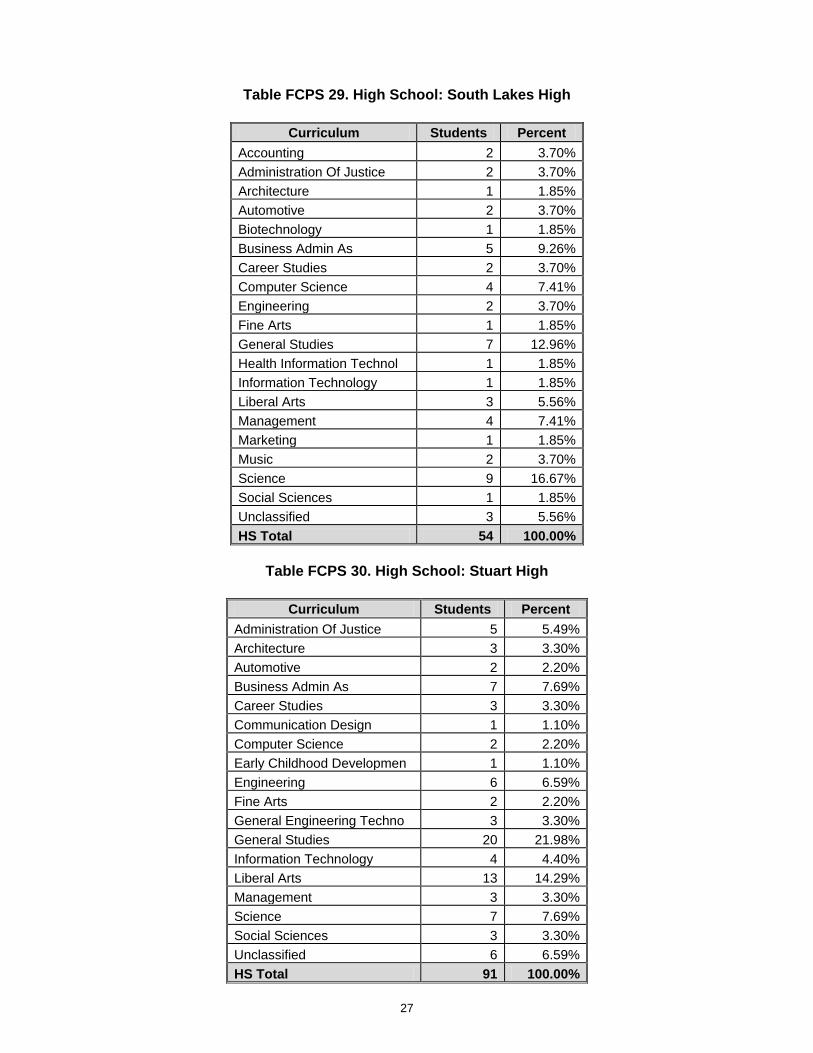
Table FCPS 29. High School: South Lakes High
Curriculum Students Percent Accounting 2 3.70% Administration Of Justice 2 3.70% Architecture 1 1.85% Automotive 2 3.70% Biotechnology 1 1.85% Business Admin As 5 9.26% Career Studies 2 3.70% Computer Science 4 7.41% Engineering 2 3.70% Fine Arts 1 1.85% General Studies 7 12.96% Health Information Technol 1 1.85% Information Technology 1 1.85% Liberal Arts 3 5.56% Management 4 7.41% Marketing 1 1.85% Music 2 3.70% Science 9 16.67% Social Sciences 1 1.85% Unclassified 3 5.56% HS Total 54 100.00%
Table FCPS 30. High School: Stuart High
Curriculum Students Percent
Administration Of Justice 5 5.49% Architecture 3 3.30% Automotive 2 2.20% Business Admin As 7 7.69% Career Studies 3 3.30% Communication Design 1 1.10% Computer Science 2 2.20% Early Childhood Developmen 1 1.10% Engineering 6 6.59% Fine Arts 2 2.20% General Engineering Techno 3 3.30% General Studies 20 21.98% Information Technology 4 4.40% Liberal Arts 13 14.29% Management 3 3.30% Science 7 7.69% Social Sciences 3 3.30% Unclassified 6 6.59% HS Total 91 100.00%
28
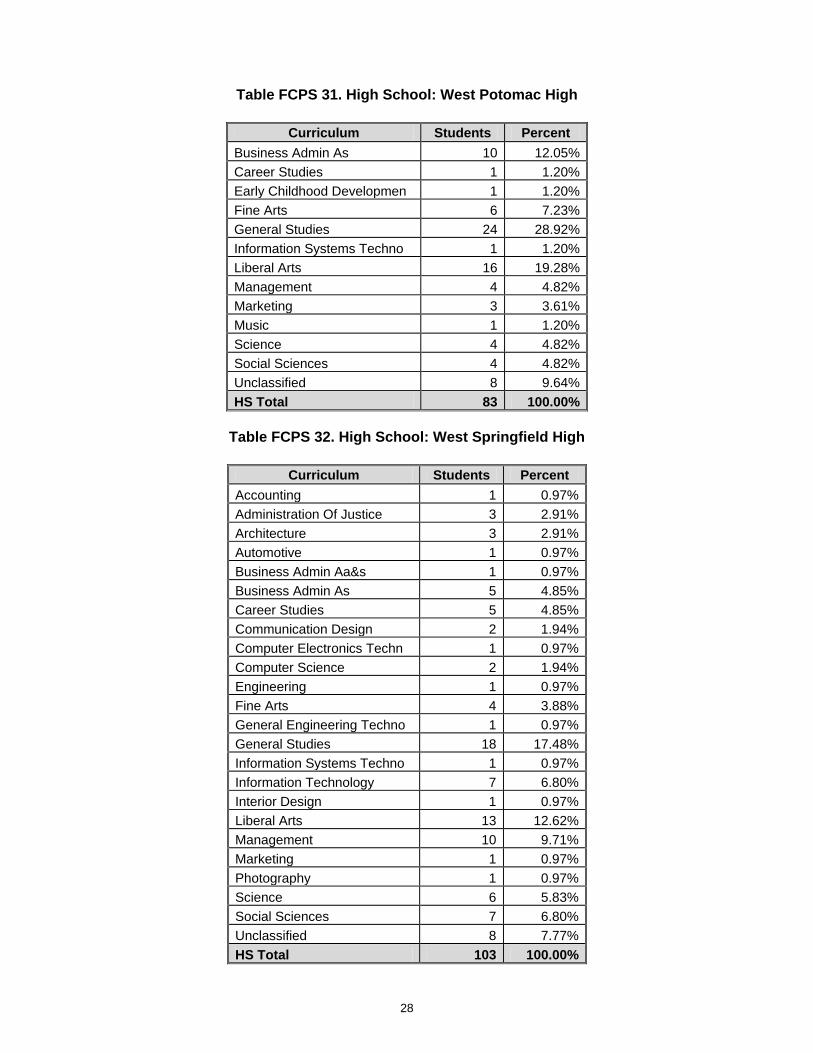
Table FCPS 31. High School: West Potomac High
Curriculum Students Percent Business Admin As 10 12.05% Career Studies 1 1.20% Early Childhood Developmen 1 1.20% Fine Arts 6 7.23% General Studies 24 28.92% Information Systems Techno 1 1.20% Liberal Arts 16 19.28% Management 4 4.82% Marketing 3 3.61% Music 1 1.20% Science 4 4.82% Social Sciences 4 4.82% Unclassified 8 9.64% HS Total 83 100.00%
Table FCPS 32. High School: West Springfield High
Curriculum Students Percent
Accounting 1 0.97% Administration Of Justice 3 2.91% Architecture 3 2.91% Automotive 1 0.97% Business Admin Aa&s 1 0.97% Business Admin As 5 4.85% Career Studies 5 4.85% Communication Design 2 1.94% Computer Electronics Techn 1 0.97% Computer Science 2 1.94% Engineering 1 0.97% Fine Arts 4 3.88% General Engineering Techno 1 0.97% General Studies 18 17.48% Information Systems Techno 1 0.97% Information Technology 7 6.80% Interior Design 1 0.97% Liberal Arts 13 12.62% Management 10 9.71% Marketing 1 0.97% Photography 1 0.97% Science 6 5.83% Social Sciences 7 6.80% Unclassified 8 7.77% HS Total 103 100.00%
29
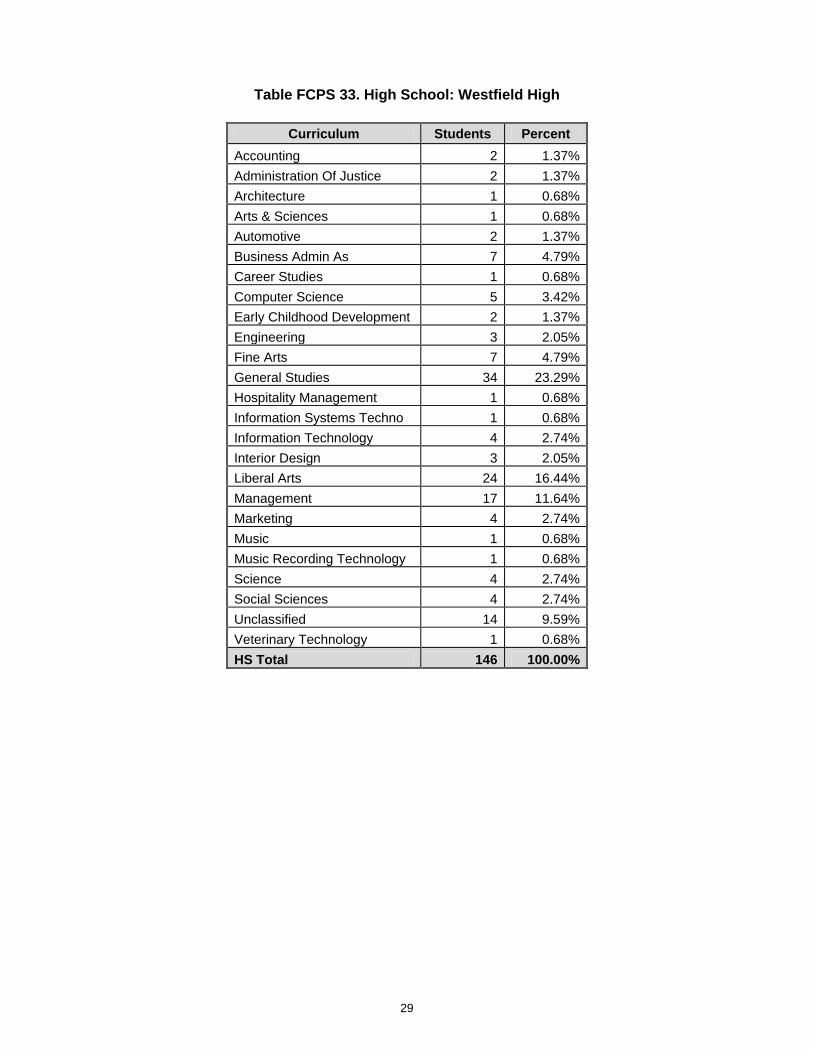
Table FCPS 33. High School: Westfield High
Curriculum Students Percent Accounting 2 1.37% Administration Of Justice 2 1.37% Architecture 1 0.68% Arts & Sciences 1 0.68% Automotive 2 1.37% Business Admin As 7 4.79% Career Studies 1 0.68% Computer Science 5 3.42% Early Childhood Development 2 1.37% Engineering 3 2.05% Fine Arts 7 4.79% General Studies 34 23.29% Hospitality Management 1 0.68% Information Systems Techno 1 0.68% Information Technology 4 2.74% Interior Design 3 2.05% Liberal Arts 24 16.44% Management 17 11.64% Marketing 4 2.74% Music 1 0.68% Music Recording Technology 1 0.68% Science 4 2.74% Social Sciences 4 2.74% Unclassified 14 9.59% Veterinary Technology 1 0.68% HS Total 146 100.00%
30
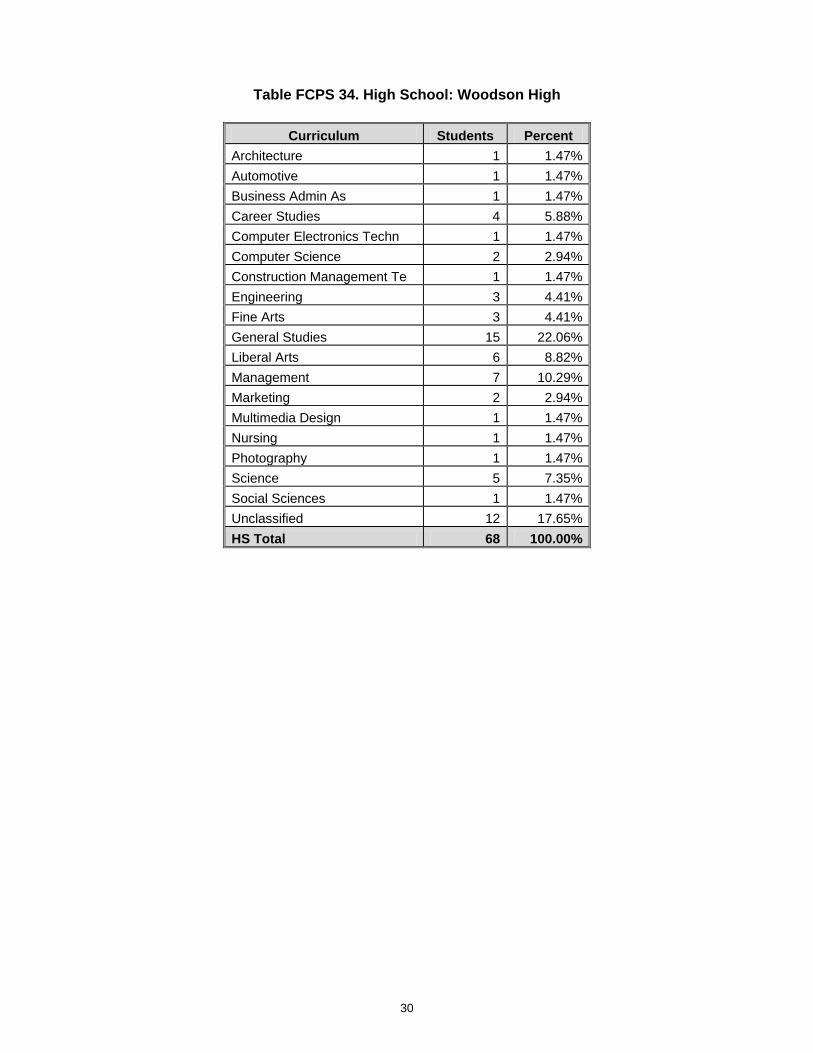
Table FCPS 34. High School: Woodson High
Curriculum Students Percent Architecture 1 1.47% Automotive 1 1.47% Business Admin As 1 1.47% Career Studies 4 5.88% Computer Electronics Techn 1 1.47% Computer Science 2 2.94% Construction Management Te 1 1.47% Engineering 3 4.41% Fine Arts 3 4.41% General Studies 15 22.06% Liberal Arts 6 8.82% Management 7 10.29% Marketing 2 2.94% Multimedia Design 1 1.47% Nursing 1 1.47% Photography 1 1.47% Science 5 7.35% Social Sciences 1 1.47% Unclassified 12 17.65% HS Total 68 100.00%
31
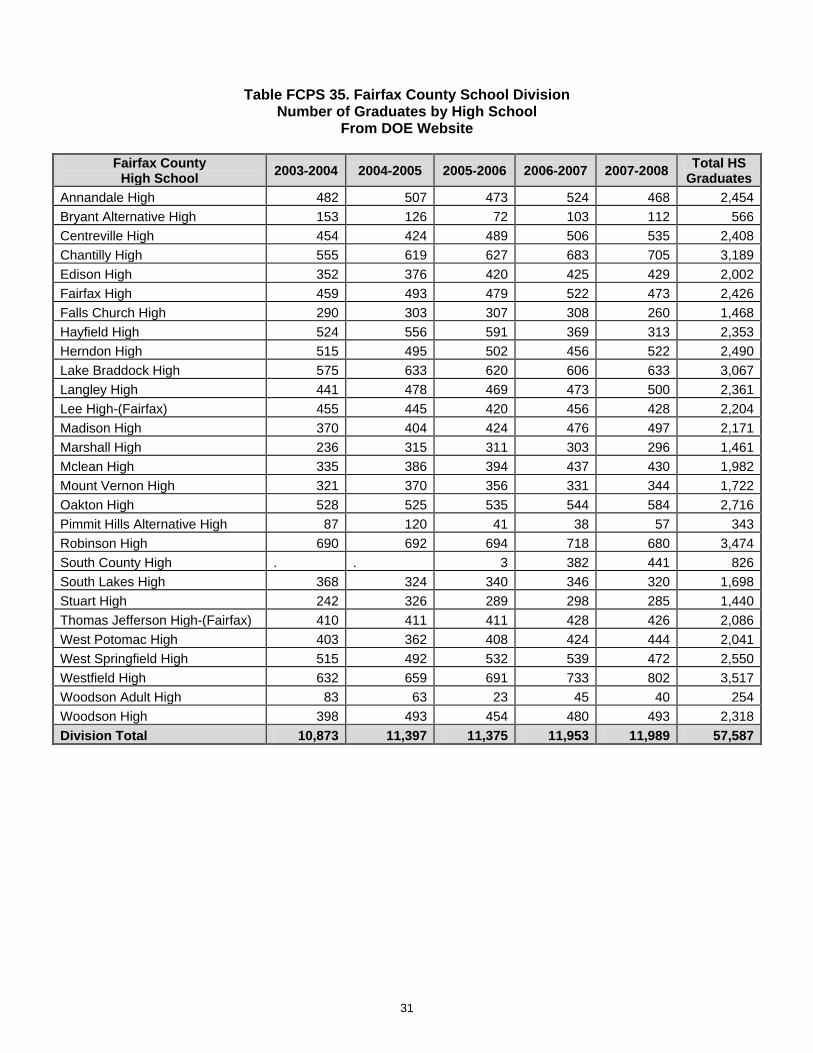
Table FCPS 35. Fairfax County School Division Number of Graduates by High School
From DOE Website
Fairfax County High School 2003-2004 2004-2005 2005-2006 2006-2007 2007-2008 Total HS
Graduates Annandale High 482 507 473 524 468 2,454 Bryant Alternative High 153 126 72 103 112 566 Centreville High 454 424 489 506 535 2,408 Chantilly High 555 619 627 683 705 3,189 Edison High 352 376 420 425 429 2,002 Fairfax High 459 493 479 522 473 2,426 Falls Church High 290 303 307 308 260 1,468 Hayfield High 524 556 591 369 313 2,353 Herndon High 515 495 502 456 522 2,490 Lake Braddock High 575 633 620 606 633 3,067 Langley High 441 478 469 473 500 2,361 Lee High-(Fairfax) 455 445 420 456 428 2,204 Madison High 370 404 424 476 497 2,171 Marshall High 236 315 311 303 296 1,461 Mclean High 335 386 394 437 430 1,982 Mount Vernon High 321 370 356 331 344 1,722 Oakton High 528 525 535 544 584 2,716 Pimmit Hills Alternative High 87 120 41 38 57 343 Robinson High 690 692 694 718 680 3,474 South County High . . 3 382 441 826 South Lakes High 368 324 340 346 320 1,698 Stuart High 242 326 289 298 285 1,440 Thomas Jefferson High-(Fairfax) 410 411 411 428 426 2,086 West Potomac High 403 362 408 424 444 2,041 West Springfield High 515 492 532 539 472 2,550 Westfield High 632 659 691 733 802 3,517 Woodson Adult High 83 63 23 45 40 254 Woodson High 398 493 454 480 493 2,318 Division Total 10,873 11,397 11,375 11,953 11,989 57,587
32
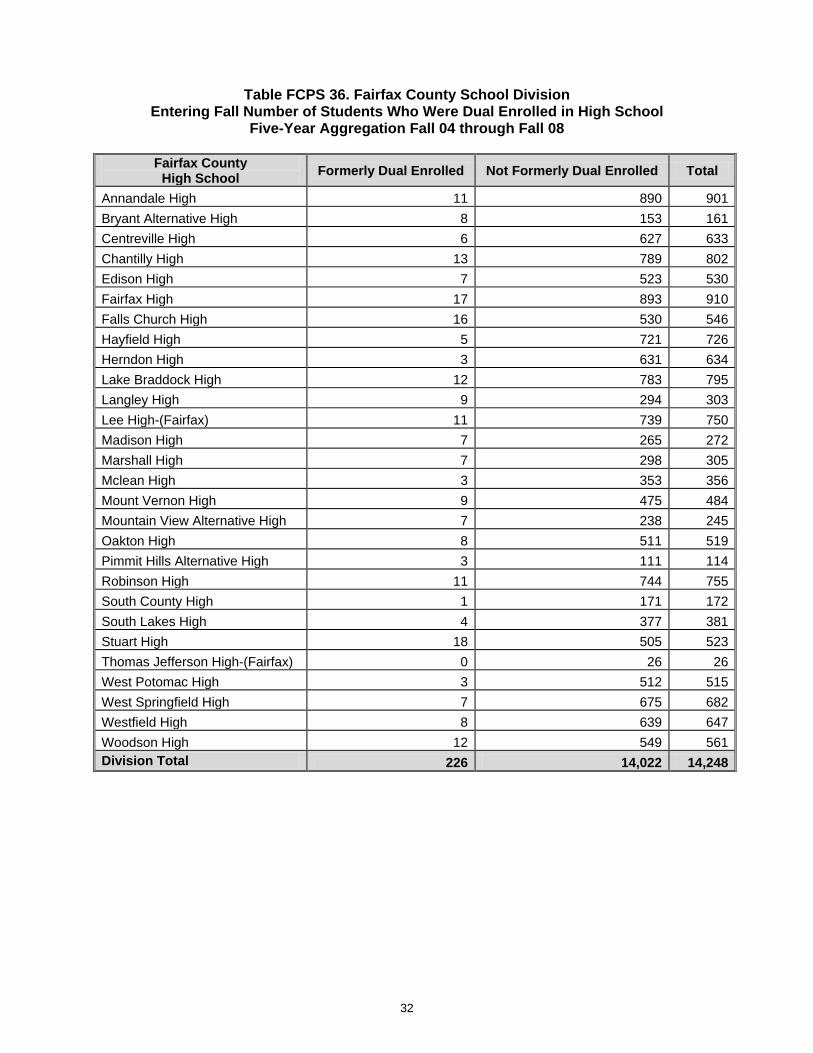
Table FCPS 36. Fairfax County School Division Entering Fall Number of Students Who Were Dual Enrolled in High School
Five-Year Aggregation Fall 04 through Fall 08
Fairfax County High School Formerly Dual Enrolled Not Formerly Dual Enrolled Total
Annandale High 11 890 901 Bryant Alternative High 8 153 161 Centreville High 6 627 633 Chantilly High 13 789 802 Edison High 7 523 530 Fairfax High 17 893 910 Falls Church High 16 530 546 Hayfield High 5 721 726 Herndon High 3 631 634 Lake Braddock High 12 783 795 Langley High 9 294 303 Lee High-(Fairfax) 11 739 750 Madison High 7 265 272 Marshall High 7 298 305 Mclean High 3 353 356 Mount Vernon High 9 475 484 Mountain View Alternative High 7 238 245 Oakton High 8 511 519 Pimmit Hills Alternative High 3 111 114 Robinson High 11 744 755 South County High 1 171 172 South Lakes High 4 377 381 Stuart High 18 505 523 Thomas Jefferson High-(Fairfax) 0 26 26 West Potomac High 3 512 515 West Springfield High 7 675 682 Westfield High 8 639 647 Woodson High 12 549 561 Division Total 226 14,022 14,248
33
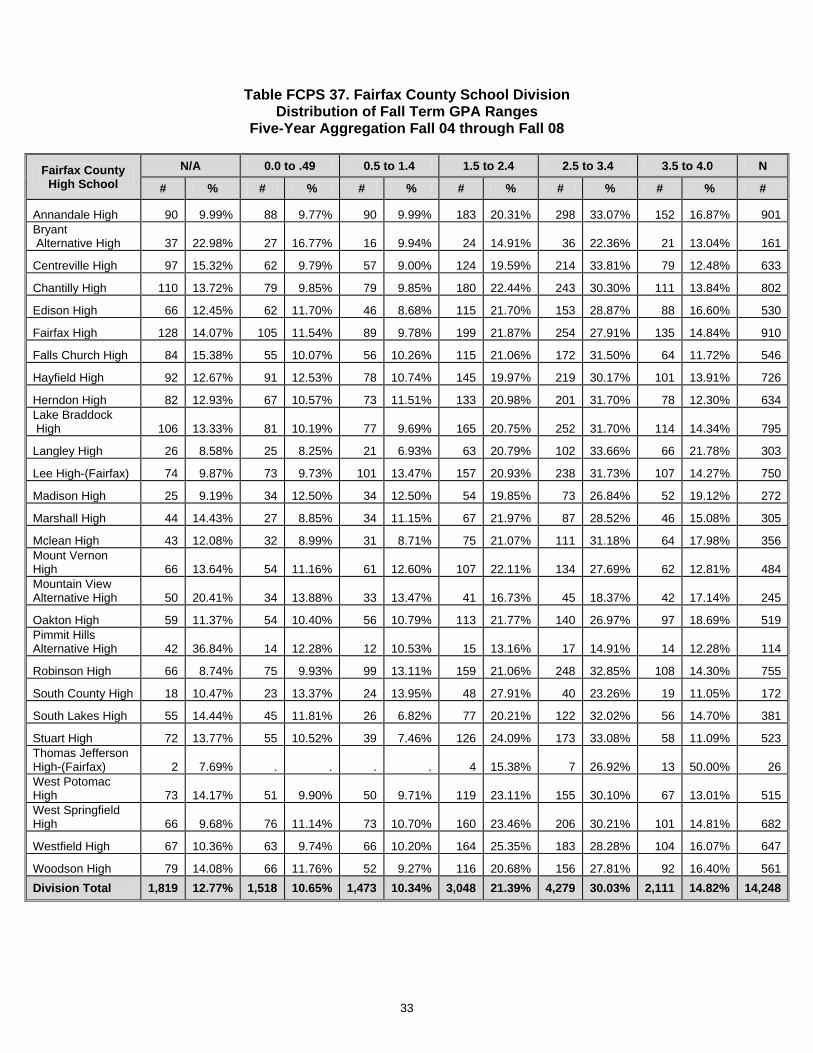
Table FCPS 37. Fairfax County School Division Distribution of Fall Term GPA Ranges
Five-Year Aggregation Fall 04 through Fall 08
Fairfax County High School
N/A 0.0 to .49 0.5 to 1.4 1.5 to 2.4 2.5 to 3.4 3.5 to 4.0 N
# % # % # % # % # % # % #
Annandale High 90 9.99% 88 9.77% 90 9.99% 183 20.31% 298 33.07% 152 16.87% 901 Bryant Alternative High 37 22.98% 27 16.77% 16 9.94% 24 14.91% 36 22.36% 21 13.04% 161
Centreville High 97 15.32% 62 9.79% 57 9.00% 124 19.59% 214 33.81% 79 12.48% 633
Chantilly High 110 13.72% 79 9.85% 79 9.85% 180 22.44% 243 30.30% 111 13.84% 802
Edison High 66 12.45% 62 11.70% 46 8.68% 115 21.70% 153 28.87% 88 16.60% 530
Fairfax High 128 14.07% 105 11.54% 89 9.78% 199 21.87% 254 27.91% 135 14.84% 910
Falls Church High 84 15.38% 55 10.07% 56 10.26% 115 21.06% 172 31.50% 64 11.72% 546
Hayfield High 92 12.67% 91 12.53% 78 10.74% 145 19.97% 219 30.17% 101 13.91% 726
Herndon High 82 12.93% 67 10.57% 73 11.51% 133 20.98% 201 31.70% 78 12.30% 634 Lake Braddock High 106 13.33% 81 10.19% 77 9.69% 165 20.75% 252 31.70% 114 14.34% 795
Langley High 26 8.58% 25 8.25% 21 6.93% 63 20.79% 102 33.66% 66 21.78% 303
Lee High-(Fairfax) 74 9.87% 73 9.73% 101 13.47% 157 20.93% 238 31.73% 107 14.27% 750
Madison High 25 9.19% 34 12.50% 34 12.50% 54 19.85% 73 26.84% 52 19.12% 272
Marshall High 44 14.43% 27 8.85% 34 11.15% 67 21.97% 87 28.52% 46 15.08% 305
Mclean High 43 12.08% 32 8.99% 31 8.71% 75 21.07% 111 31.18% 64 17.98% 356 Mount Vernon High 66 13.64% 54 11.16% 61 12.60% 107 22.11% 134 27.69% 62 12.81% 484 Mountain View Alternative High 50 20.41% 34 13.88% 33 13.47% 41 16.73% 45 18.37% 42 17.14% 245
Oakton High 59 11.37% 54 10.40% 56 10.79% 113 21.77% 140 26.97% 97 18.69% 519 Pimmit Hills Alternative High 42 36.84% 14 12.28% 12 10.53% 15 13.16% 17 14.91% 14 12.28% 114
Robinson High 66 8.74% 75 9.93% 99 13.11% 159 21.06% 248 32.85% 108 14.30% 755
South County High 18 10.47% 23 13.37% 24 13.95% 48 27.91% 40 23.26% 19 11.05% 172
South Lakes High 55 14.44% 45 11.81% 26 6.82% 77 20.21% 122 32.02% 56 14.70% 381
Stuart High 72 13.77% 55 10.52% 39 7.46% 126 24.09% 173 33.08% 58 11.09% 523 Thomas Jefferson High-(Fairfax) 2 7.69% . . . . 4 15.38% 7 26.92% 13 50.00% 26 West Potomac High 73 14.17% 51 9.90% 50 9.71% 119 23.11% 155 30.10% 67 13.01% 515 West Springfield High 66 9.68% 76 11.14% 73 10.70% 160 23.46% 206 30.21% 101 14.81% 682
Westfield High 67 10.36% 63 9.74% 66 10.20% 164 25.35% 183 28.28% 104 16.07% 647
Woodson High 79 14.08% 66 11.76% 52 9.27% 116 20.68% 156 27.81% 92 16.40% 561 Division Total 1,819 12.77% 1,518 10.65% 1,473 10.34% 3,048 21.39% 4,279 30.03% 2,111 14.82% 14,248
34
Table FCPS 38. Fairfax County School Division Distribution of Grades Earned in Developmental Courses
Five-Year Aggregation Fall 04 through Fall 08
Fairfax County High School DISC
S R U W Total # % # % # % # % #
Annandale High ENG 330 77.10% 47 10.98% 30 7.01% 21 4.91% 428 MTH 99 41.95% 38 16.10% 75 31.78% 24 10.17% 236
Bryant Alternative High ENG 41 63.08% 9 13.85% 6 9.23% 9 13.85% 65 MTH 11 28.21% 4 10.26% 16 41.03% 8 20.51% 39
Centreville High ENG 213 77.45% 19 6.91% 25 9.09% 18 6.55% 275 MTH 58 39.19% 34 22.97% 40 27.03% 16 10.81% 148
Chantilly High ENG 205 71.18% 23 7.99% 35 12.15% 25 8.68% 288 MTH 74 42.77% 27 15.61% 49 28.32% 23 13.29% 173
Edison High ENG 184 68.66% 36 13.43% 21 7.84% 27 10.07% 268 MTH 29 30.21% 9 9.38% 49 51.04% 9 9.38% 96
Fairfax High
ENG 280 72.73% 32 8.31% 37 9.61% 36 9.35% 385 MTH 90 40.36% 32 14.35% 81 36.32% 20 8.97% 223 BSK 2 100.00% . . . . . . 2
Falls Church High ENG 181 69.88% 28 10.81% 25 9.65% 25 9.65% 259 MTH 61 39.35% 19 12.26% 63 40.65% 12 7.74% 155
Hayfield High
ENG 239 71.56% 34 10.18% 35 10.48% 26 7.78% 334 MTH 68 37.36% 24 13.19% 69 37.91% 21 11.54% 182 CHM 1 100.00% . . . . . . 1
Herndon High ENG 173 75.22% 19 8.26% 18 7.83% 20 8.70% 230 MTH 79 52.32% 16 10.60% 37 24.50% 19 12.58% 151
Lake Braddock High ENG 224 68.71% 28 8.59% 32 9.82% 42 12.88% 326 MTH 72 36.73% 30 15.31% 72 36.73% 22 11.22% 196
Langley High ENG 63 78.75% 5 6.25% 8 10.00% 4 5.00% 80 MTH 19 44.19% 3 6.98% 15 34.88% 6 13.95% 43
Lee High-(Fairfax) ENG 269 76.86% 35 10.00% 27 7.71% 19 5.43% 350 MTH 88 43.14% 29 14.22% 70 34.31% 17 8.33% 204
Madison High
ENG 75 78.95% 3 3.16% 9 9.47% 8 8.42% 95 MTH 32 47.06% 8 11.76% 23 33.82% 5 7.35% 68 CHM 2 100.00% . . . . . . 2
Marshall High ENG 112 78.32% 13 9.09% 10 6.99% 8 5.59% 143 MTH 27 43.55% 5 8.06% 24 38.71% 6 9.68% 62
Mclean High ENG 86 73.50% 10 8.55% 14 11.97% 7 5.98% 117 MTH 28 44.44% 8 12.70% 22 34.92% 5 7.94% 63
Mount Vernon High ENG 142 66.67% 36 16.90% 28 13.15% 7 3.29% 213 MTH 47 42.73% 6 5.45% 51 46.36% 6 5.45% 110
Mountain View Alternative High
ENG 43 60.56% 10 14.08% 9 12.68% 9 12.68% 71 MTH 21 35.00% 6 10.00% 25 41.67% 8 13.33% 60
Oakton High ENG 115 70.55% 16 9.82% 24 14.72% 8 4.91% 163 MTH 54 46.96% 17 14.78% 33 28.70% 11 9.57% 115
Note: S = Satisfactory, R = Re-enroll, U = Unsatisfactory, W = Withdraw
35
Table FCPS 38. Fairfax County School Division Distribution of Grades Earned in Developmental Courses
Five-Year Aggregation Fall 04 through Fall 08 (Cont’d)
Fairfax County High School DISC
S R U W Total # % # % # % # % #
Pimmit Hills Alternative High
ENG 25 54.35% 8 17.39% 7 15.22% 6 13.04% 46 MTH 10 43.48% 4 17.39% 7 30.43% 2 8.70% 23
Robinson High ENG 198 71.48% 27 9.75% 24 8.66% 28 10.11% 277 MTH 73 43.71% 27 16.17% 58 34.73% 9 5.39% 167
South County High ENG 65 72.22% 13 14.44% 7 7.78% 5 5.56% 90 MTH 21 40.38% 8 15.38% 20 38.46% 3 5.77% 52
South Lakes High ENG 86 65.15% 16 12.12% 18 13.64% 12 9.09% 132 MTH 44 47.83% 14 15.22% 28 30.43% 6 6.52% 92
Stuart High ENG 166 64.09% 39 15.06% 34 13.13% 20 7.72% 259 MTH 47 39.83% 14 11.86% 54 45.76% 3 2.54% 118
West Potomac High ENG 185 75.20% 24 9.76% 17 6.91% 20 8.13% 246 MTH 43 49.43% 10 11.49% 27 31.03% 7 8.05% 87
West Springfield High ENG 181 73.28% 27 10.93% 18 7.29% 21 8.50% 247 MTH 72 39.13% 21 11.41% 78 42.39% 13 7.07% 184
Westfield High ENG 179 73.36% 16 6.56% 31 12.70% 18 7.38% 244 MTH 71 45.51% 30 19.23% 43 27.56% 12 7.69% 156
Woodson High ENG 115 67.25% 23 13.45% 15 8.77% 18 10.53% 171 MTH 39 37.86% 9 8.74% 41 39.81% 14 13.59% 103
Division Total 5,557 60.98% 1,048 11.50% 1,734 19.03% 774 8.49% 9,113 Note: S = Satisfactory, R = Re-enroll, U = Unsatisfactory, W = Withdraw
36
Table FCPS 39. Fairfax County School Division Distribution of Passing Grades Earned in College-Level Courses
Five-Year Aggregation Fall 04 through Fall 08
DISC
Passed
A B C D Passing Grades Sub Total
# % # % # % # % # % ACC 96 13.24% 125 17.24% 141 19.45% 65 8.97% 427 58.90% ADJ 128 24.06% 124 23.31% 113 21.24% 50 9.40% 415 78.01% AGR 1 100.00% . . . . . . 1 100.00% AIR 7 21.88% 10 31.25% 10 31.25% 2 6.25% 29 90.63% ARA 30 27.78% 25 23.15% 19 17.59% 8 7.41% 82 75.93% ARC 39 24.53% 35 22.01% 25 15.72% 9 5.66% 108 67.92% ART 303 27.70% 256 23.40% 163 14.90% 91 8.32% 813 74.31% ASL 46 28.22% 43 26.38% 16 9.82% 7 4.29% 112 68.71% AST 18 41.86% 5 11.63% 6 13.95% 2 4.65% 31 72.09% AUB 6 22.22% 10 37.04% 6 22.22% 2 7.41% 24 88.89% AUT 115 28.47% 131 32.43% 63 15.59% 24 5.94% 333 82.43% BIO 271 13.84% 408 20.84% 438 22.37% 244 12.46% 1361 69.51% BLD 4 15.38% 5 19.23% 5 19.23% 5 19.23% 19 73.08% BUS 292 18.75% 396 25.43% 299 19.20% 113 7.26% 1100 70.65% CHD 34 30.91% 35 31.82% 9 8.18% 9 8.18% 87 79.09% CHI 17 42.50% 6 15.00% 1 2.50% 4 10.00% 28 70.00% CHM 51 14.05% 70 19.28% 65 17.91% 36 9.92% 222 61.16% CIV 1 50.00% . . . . . . 1 50.00% CON . . . . . . 1 100.00% 1 100.00% COS . . 1 100.00% . . . . 1 100.00% CSC 124 24.85% 121 24.25% 76 15.23% 26 5.21% 347 69.54% DIT 12 30.00% 5 12.50% 7 17.50% 2 5.00% 26 65.00% DNA 1 100.00% . . . . . . 1 100.00% DNH . . . . . . . . . . DRF 13 30.95% 13 30.95% 5 11.90% . . 31 73.81% DSL . . 1 100.00% . . . . 1 100.00% ECO 180 18.39% 197 20.12% 188 19.20% 107 10.93% 672 68.64% EDU 4 50.00% 1 12.50% . . . . 5 62.50% EGR 51 25.00% 34 16.67% 30 14.71% 19 9.31% 134 65.69% ELE 1 33.33% 2 66.67% . . . . 3 100.00% EMS 40 53.33% 15 20.00% 10 13.33% 2 2.67% 67 89.33% EMT 1 8.33% 3 25.00% 3 25.00% 1 8.33% 8 66.67% ENG 969 15.74% 1716 27.87% 1246 20.23% 406 6.59% 4337 70.43% ENV 1 11.11% 2 22.22% . . 3 33.33% 6 66.67% ETR 1 10.00% 1 10.00% 2 20.00% 4 40.00% 8 80.00% FIN 10 23.81% 8 19.05% 4 9.52% 1 2.38% 23 54.76% FIR 14 70.00% . . 1 5.00% . . 15 75.00%
37
Table FCPS 39. Fairfax County School Division Distribution of Passing Grades Earned in College-Level Courses
Five-Year Aggregation Fall 04 through Fall 08 (Cont’d)
DISC
Passed
A B C D Passing Grades Sub Total
# % # % # % # % # % FRE 36 26.67% 20 14.81% 17 12.59% 7 5.19% 80 59.26% FST 2 25.00% 3 37.50% . . . . 5 62.50% GEO 22 23.40% 19 20.21% 14 14.89% 8 8.51% 63 67.02% GER 9 15.79% 10 17.54% 8 14.04% 6 10.53% 33 57.89% GIS . . . . . . . . . . GOL 51 17.17% 71 23.91% 68 22.90% 41 13.80% 231 77.78% GRE 1 20.00% . . 1 20.00% 1 20.00% 3 60.00% HIM . . . . 1 100.00% . . 1 100.00% HIS 814 18.21% 1070 23.93% 908 20.31% 393 8.79% 3185 71.24% HIT 2 15.38% 3 23.08% 1 7.69% . . 6 46.15% HLT 72 42.11% 39 22.81% 19 11.11% 4 2.34% 134 78.36% HMS . . . . . . . . . . HRI 24 18.46% 27 20.77% 22 16.92% 14 10.77% 87 66.92% HRT . . 3 15.79% 4 21.05% 3 15.79% 10 52.63% HUM 22 25.88% 11 12.94% 17 20.00% 9 10.59% 59 69.41% IDS 7 25.00% 8 28.57% 3 10.71% 2 7.14% 20 71.43% INT 1 12.50% 1 12.50% . . . . 2 25.00% ITA 6 18.75% 7 21.88% 7 21.88% 5 15.63% 25 78.13% ITD 16 33.33% 5 10.42% 11 22.92% 1 2.08% 33 68.75% ITE 406 22.90% 377 21.26% 279 15.74% 141 7.95% 1203 67.85% ITN 15 11.36% 26 19.70% 29 21.97% 14 10.61% 84 63.64% ITP 14 15.38% 19 20.88% 22 24.18% 7 7.69% 62 68.13% JPN 6 12.24% 11 22.45% 7 14.29% 6 12.24% 30 61.22% KOR 5 25.00% 8 40.00% 2 10.00% . . 15 75.00% LAT 2 16.67% 5 41.67% 2 16.67% . . 9 75.00% LBR 1 50.00% 1 50.00% . . . . 2 100.00% LGL 13 39.39% 3 9.09% 6 18.18% . . 22 66.67% MDL . . . . . . . . . . MET 1 100.00% . . . . . . 1 100.00% MKT 36 17.65% 60 29.41% 24 11.76% 10 4.90% 130 63.73% MSC 15 60.00% 1 4.00% . . 1 4.00% 17 68.00% MTH 608 16.66% 749 20.53% 688 18.85% 379 10.39% 2424 66.43% MUS 296 47.67% 122 19.65% 60 9.66% 33 5.31% 511 82.29% NAS 53 11.21% 73 15.43% 93 19.66% 50 10.57% 269 56.87% NUR 4 36.36% 6 54.55% 1 9.09% . . 11 100.00% PBS . . . . . . . . . . PED 766 31.13% 535 21.74% 361 14.67% 134 5.44% 1796 72.98%
38
Table FCPS 39. Fairfax County School Division Distribution of Passing Grades Earned in College-Level Courses
Five-Year Aggregation Fall 04 through Fall 08 (Cont’d)
DISC
Passed
A B C D Passing Grades Sub Total
# % # % # % # % # % PHI 65 20.38% 61 19.12% 38 11.91% 23 7.21% 187 58.62% PHT 32 29.09% 19 17.27% 11 10.00% 4 3.64% 66 60.00% PHY 21 14.58% 28 19.44% 28 19.44% 11 7.64% 88 61.11% PLS 74 22.16% 81 24.25% 67 20.06% 17 5.09% 239 71.56% PNE . . 2 66.67% . . . . 2 66.67% PSY 673 25.01% 608 22.59% 443 16.46% 244 9.07% 1968 73.13% PTH . . 5 41.67% 2 16.67% . . 7 58.33% RAD 2 18.18% 3 27.27% 2 18.18% 1 9.09% 8 72.73% REA 4 11.76% 4 11.76% 10 29.41% 2 5.88% 20 58.82% REL 40 35.71% 26 23.21% 9 8.04% 3 2.68% 78 69.64% ROC 1 20.00% 3 60.00% 1 20.00% . . 5 100.00% RPK 10 23.81% 5 11.90% 4 9.52% 2 4.76% 21 50.00% RTH . . 2 50.00% 2 50.00% . . 4 100.00% RUS 5 41.67% 2 16.67% 2 16.67% 1 8.33% 10 83.33% RVH . . . . 7 87.50% . . 7 87.50% SCM . . . . 2 100.00% . . 2 100.00% SDV 1491 39.32% 650 17.14% 416 10.97% 220 5.80% 2777 73.23% SOC 285 28.33% 222 22.07% 179 17.79% 81 8.05% 767 76.24% SPA 115 20.95% 123 22.40% 85 15.48% 44 8.01% 367 66.85% SPD 603 29.43% 559 27.28% 287 14.01% 95 4.64% 1544 75.35% STD 175 36.46% 80 16.67% 44 9.17% 28 5.83% 327 68.13% TRV 5 15.63% 9 28.13% 4 12.50% 4 12.50% 22 68.75% VET 17 34.69% 10 20.41% 11 22.45% 4 8.16% 42 85.71% VTN 5 100.00% . . . . . . 5 100.00% WEL 10 62.50% 1 6.25% 3 18.75% . . 14 87.50% Total 9,840 23.19% 9,600 22.62% 7,283 17.16% 3,296 7.77% 30,019 70.73%
39
Table FCPS 40. Fairfax County School Division Distribution of Unsuccessful Grades Earned in College-Level Courses
Five-Year Aggregation Fall 04 through Fall 08
DISC Unsuccessful Grades
F W Sub Total # % # % # %
ACC 168 23.17% 130 17.93% 298 41.10% ADJ 75 14.10% 42 7.89% 117 21.99% AGR . . . . . . AIR 3 9.38% . . 3 9.38% ARA 7 6.48% 19 17.59% 26 24.07% ARC 30 18.87% 21 13.21% 51 32.08% ART 171 15.63% 110 10.05% 281 25.69% ASL 34 20.86% 17 10.43% 51 31.29% AST 7 16.28% 5 11.63% 12 27.91% AUB . . 3 11.11% 3 11.11% AUT 54 13.37% 17 4.21% 71 17.57% BIO 348 17.77% 249 12.72% 597 30.49% BLD 5 19.23% 2 7.69% 7 26.92% BUS 291 18.69% 166 10.66% 457 29.35% CHD 16 14.55% 7 6.36% 23 20.91% CHI 8 20.00% 4 10.00% 12 30.00% CHM 63 17.36% 78 21.49% 141 38.84% CIV . . 1 50.00% 1 50.00% CON . . . . . . COS . . . . . . CSC 81 16.23% 71 14.23% 152 30.46% DIT 11 27.50% 3 7.50% 14 35.00% DNA . . . . . . DNH . . 3 100.00% 3 100.00% DRF 6 14.29% 5 11.90% 11 26.19% DSL . . . . . . ECO 201 20.53% 106 10.83% 307 31.36% EDU 2 25.00% 1 12.50% 3 37.50% EGR 36 17.65% 34 16.67% 70 34.31% ELE . . . . . . EMS 8 10.67% . . 8 10.67% EMT 1 8.33% 3 25.00% 4 33.33% ENG 1060 17.21% 761 12.36% 1821 29.57% ENV 2 22.22% 1 11.11% 3 33.33% ETR 1 10.00% 1 10.00% 2 20.00% FIN 10 23.81% 9 21.43% 19 45.24% FIR 3 15.00% 2 10.00% 5 25.00% FRE 17 12.59% 38 28.15% 55 40.74%
40
Table FCPS 40. Fairfax County School Division Distribution of Unsuccessful Grades Earned in College-Level Courses
Five-Year Aggregation Fall 04 through Fall 08 (Cont’d)
DISC Unsuccessful Grades
F W Sub Total # % # % # %
FST 3 37.50% . . 3 37.50% GEO 18 19.15% 13 13.83% 31 32.98% GER 11 19.30% 13 22.81% 24 42.11% GIS 1 100.00% . . 1 100.00% GOL 33 11.11% 33 11.11% 66 22.22% GRE 1 20.00% 1 20.00% 2 40.00% HIM . . . . . . HIS 838 18.74% 448 10.02% 1286 28.76% HIT 2 15.38% 5 38.46% 7 53.85% HLT 22 12.87% 15 8.77% 37 21.64% HMS 4 100.00% . . 4 100.00% HRI 29 22.31% 14 10.77% 43 33.08% HRT 1 5.26% 8 42.11% 9 47.37% HUM 10 11.76% 16 18.82% 26 30.59% IDS 7 25.00% 1 3.57% 8 28.57% INT 1 12.50% 5 62.50% 6 75.00% ITA 3 9.38% 4 12.50% 7 21.88% ITD 7 14.58% 8 16.67% 15 31.25% ITE 382 21.55% 188 10.60% 570 32.15% ITN 26 19.70% 22 16.67% 48 36.36% ITP 14 15.38% 15 16.48% 29 31.87% JPN 13 26.53% 6 12.24% 19 38.78% KOR 3 15.00% 2 10.00% 5 25.00% LAT 2 16.67% 1 8.33% 3 25.00% LBR . . . . . . LGL 6 18.18% 5 15.15% 11 33.33% MDL 2 100.00% . . 2 100.00% MET . . . . . . MKT 45 22.06% 29 14.22% 74 36.27% MSC 7 28.00% 1 4.00% 8 32.00% MTH 746 20.44% 479 13.13% 1225 33.57% MUS 40 6.44% 70 11.27% 110 17.71% NAS 115 24.31% 89 18.82% 204 43.13% NUR . . . . . . PBS . . 2 100.00% 2 100.00% PED 418 16.98% 247 10.04% 665 27.02% PHI 61 19.12% 71 22.26% 132 41.38%
41
Table FCPS 40. Fairfax County School Division Distribution of Unsuccessful Grades Earned in College-Level Courses
Five-Year Aggregation Fall 04 through Fall 08 (Cont’d)
DISC Unsuccessful Grades
F W Sub Total # % # % # %
PHT 23 20.91% 21 19.09% 44 40.00% PHY 30 20.83% 26 18.06% 56 38.89% PLS 54 16.17% 41 12.28% 95 28.44% PNE 1 33.33% . . 1 33.33% PSY 510 18.95% 213 7.92% 723 26.87% PTH . . 5 41.67% 5 41.67% RAD 2 18.18% 1 9.09% 3 27.27% REA 7 20.59% 7 20.59% 14 41.18% REL 12 10.71% 22 19.64% 34 30.36% ROC . . . . . . RPK 13 30.95% 8 19.05% 21 50.00% RTH . . . . . . RUS 1 8.33% 1 8.33% 2 16.67% RVH 1 12.50% . . 1 12.50% SCM . . . . . . SDV 645 17.01% 370 9.76% 1015 26.77% SOC 136 13.52% 103 10.24% 239 23.76% SPA 80 14.57% 102 18.58% 182 33.15% SPD 297 14.49% 208 10.15% 505 24.65% STD 72 15.00% 81 16.88% 153 31.88% TRV 7 21.88% 3 9.38% 10 31.25% VET 5 10.20% 2 4.08% 7 14.29% VTN . . . . . . WEL 2 12.50% . . 2 12.50% Total 7,488 17.64% 4,934 11.63% 12,422 29.27%
42
Table FCPS 41. Fairfax County School Division Curricular Program Classifications
Five-Year Aggregation Fall 04 through Fall 08
Fairfax County High Schools
Career-Tech Transfer Unclassified Total Students
# % # % # % # Annandale High 265 29.41% 558 61.93% 78 8.66% 901 Bryant Alternative High 63 39.13% 80 49.69% 18 11.18% 161 Centreville High 214 33.81% 325 51.34% 94 14.85% 633 Chantilly High 285 35.54% 390 48.63% 127 15.84% 802 Edison High 142 26.79% 335 63.21% 53 10.00% 530 Fairfax High 291 31.98% 503 55.27% 116 12.75% 910 Falls Church High 148 27.11% 339 62.09% 59 10.81% 546 Hayfield High 251 34.57% 385 53.03% 90 12.40% 726 Herndon High 177 27.92% 353 55.68% 104 16.40% 634 Lake Braddock High 280 35.22% 403 50.69% 112 14.09% 795 Langley High 84 27.72% 151 49.83% 68 22.44% 303 Lee High-(Fairfax) 255 34.00% 427 56.93% 68 9.07% 750 Madison High 101 37.13% 118 43.38% 53 19.49% 272 Marshall High 86 28.20% 164 53.77% 55 18.03% 305 Mclean High 113 31.74% 188 52.81% 55 15.45% 356 Mount Vernon High 155 32.02% 287 59.30% 42 8.68% 484 Mountain View Alternative High 92 37.55% 131 53.47% 22 8.98% 245 Oakton High 157 30.25% 267 51.45% 95 18.30% 519 Pimmit Hills Alternative High 51 44.74% 55 48.25% 8 7.02% 114 Robinson High 246 32.58% 382 50.60% 127 16.82% 755 South County High 49 28.49% 90 52.33% 33 19.19% 172 South Lakes High 113 29.66% 217 56.96% 51 13.39% 381 Stuart High 143 27.34% 331 63.29% 49 9.37% 523 Thomas Jefferson High-(Fairfax) . . 12 46.15% 14 53.85% 26 West Potomac High 149 28.93% 287 55.73% 79 15.34% 515 West Springfield High 204 29.91% 375 54.99% 103 15.10% 682 Westfield High 221 34.16% 348 53.79% 78 12.06% 647 Woodson High 168 29.95% 305 54.37% 88 15.69% 561 Division Total 4,503 31.60% 7,806 54.79% 1,939 13.61% 14,248
43
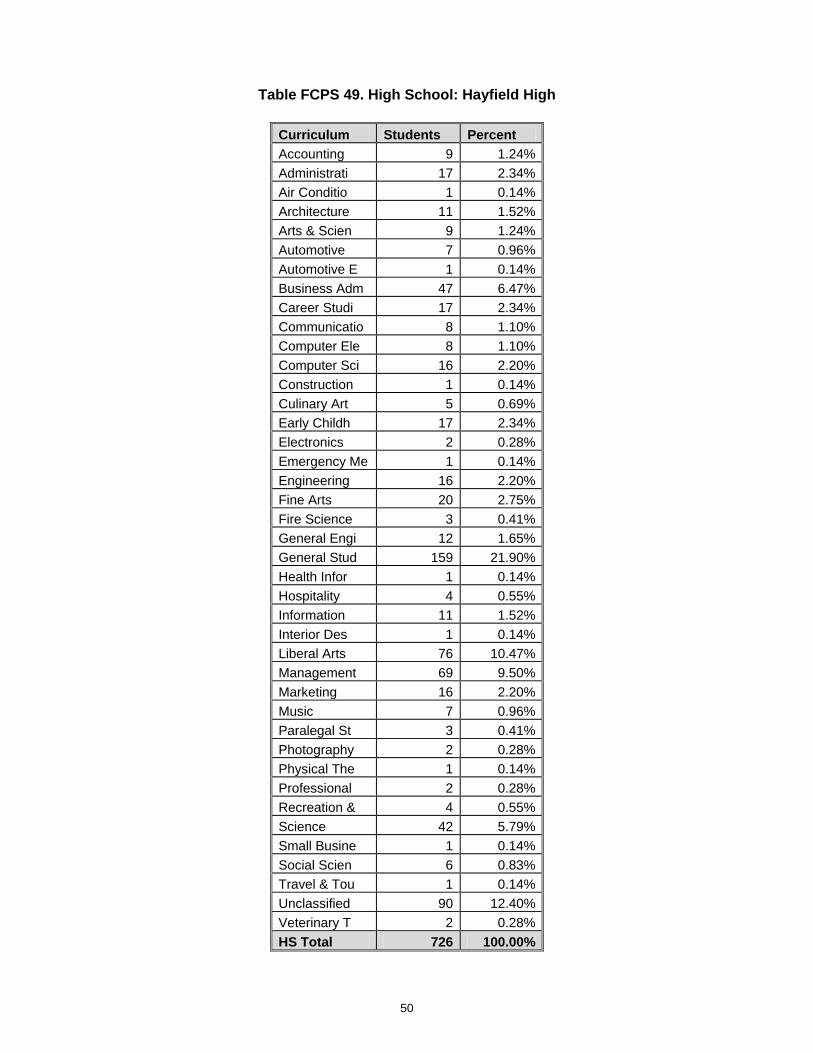
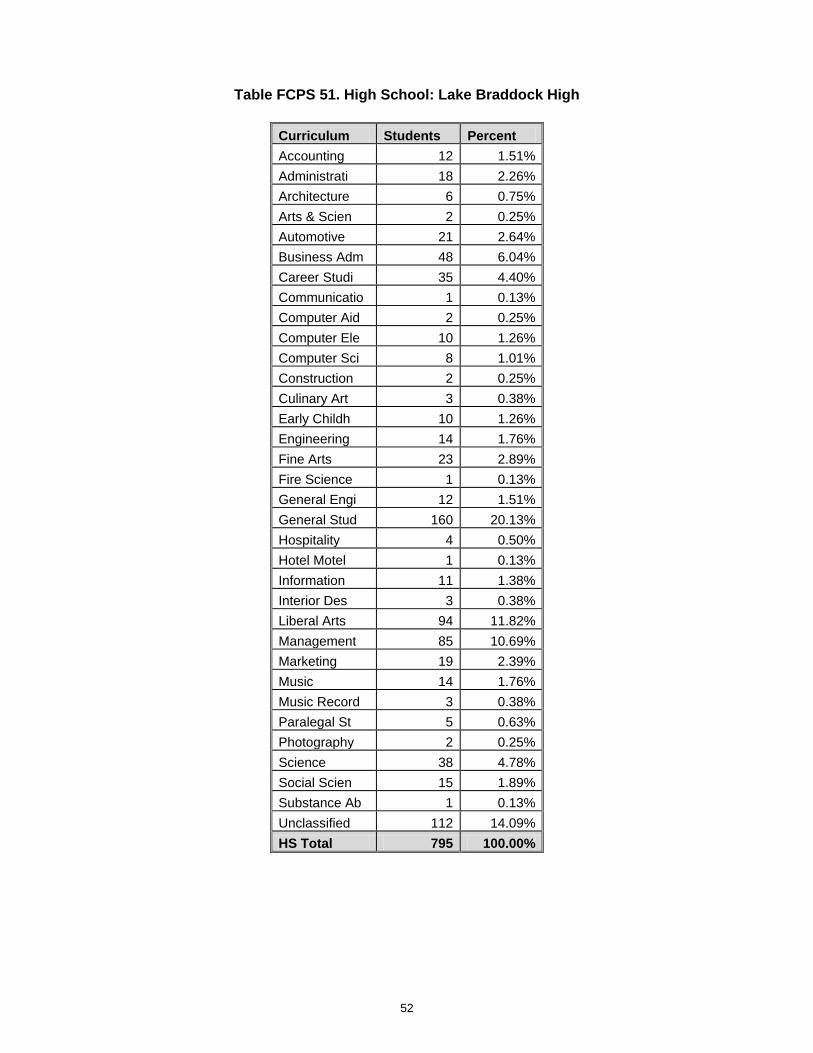
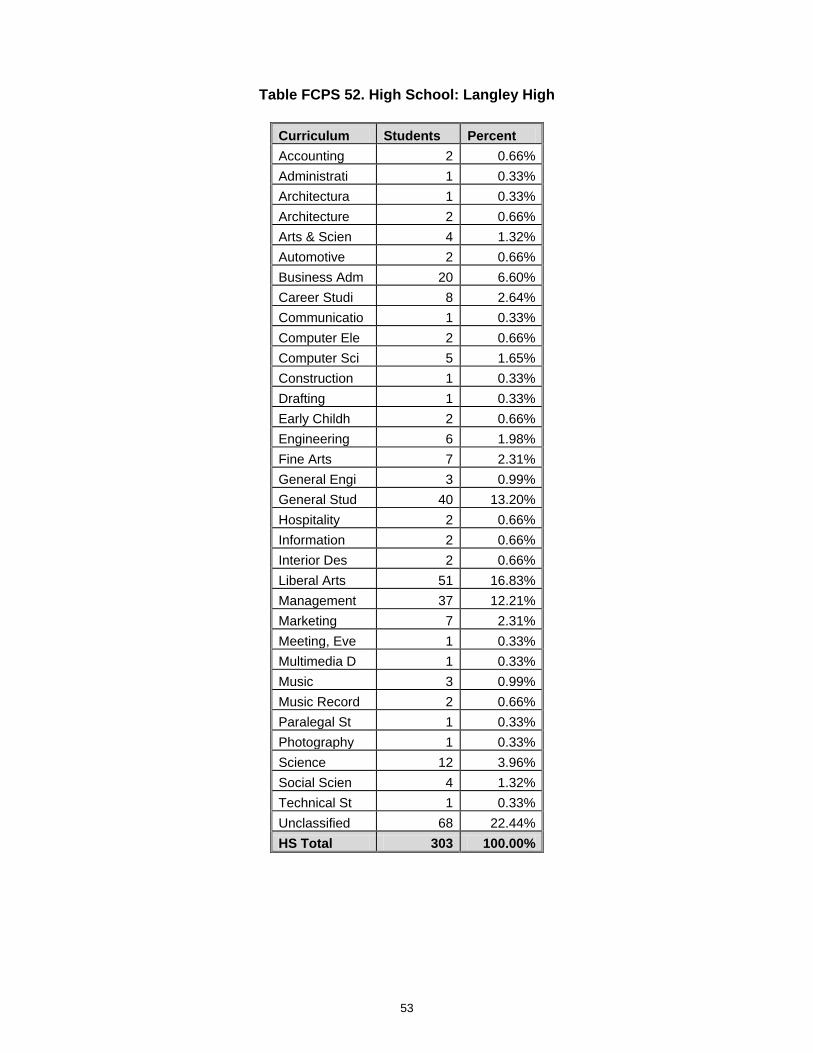
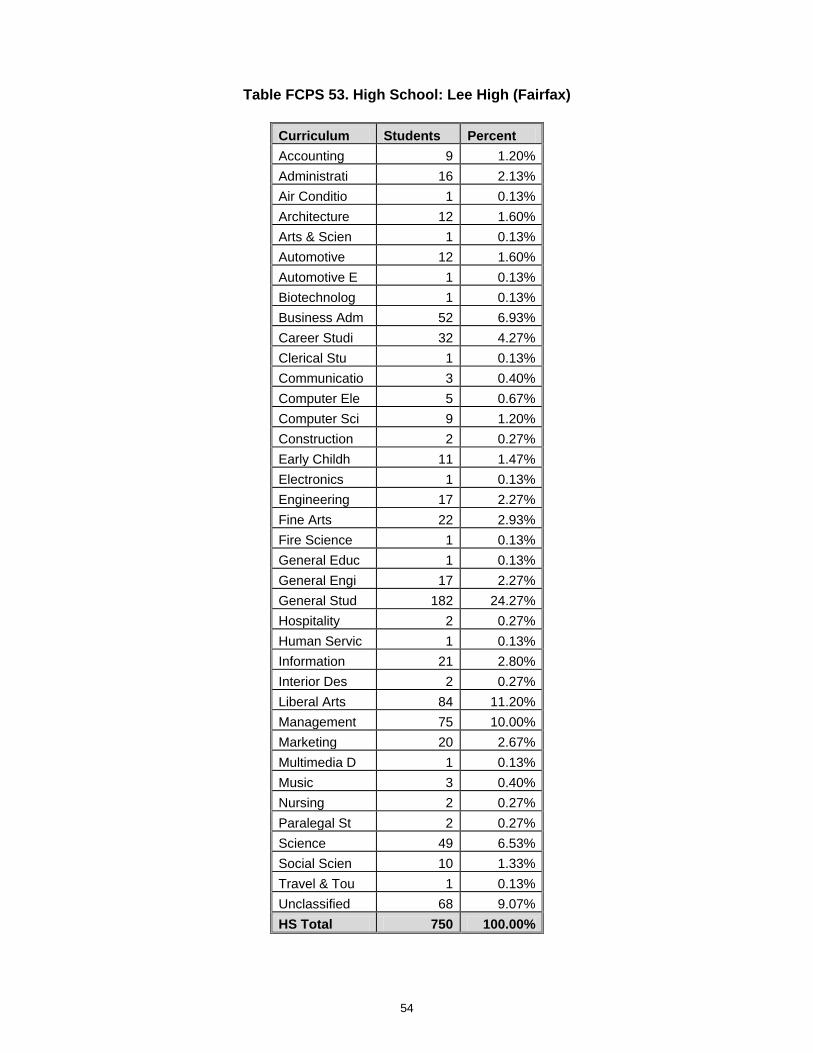
Fairfax County School Division Curricular Program Selections
Five-Year Aggregation Fall 04 through Fall 08
Table FCPS 42. High School: Annandale High
Curriculum Students Percent Accounting 9 1.00% Administrati 27 3.00% Air Conditio 1 0.11% American Sig 1 0.11% Architecture 10 1.11% Arts & Scien 3 0.33% Automotive 18 2.00% Automotive E 1 0.11% Business Adm 79 8.77% Career Studi 25 2.77% Civil Engine 2 0.22% Communicatio 4 0.44% Computer Ele 6 0.67% Computer Sci 14 1.55% Culinary Art 2 0.22% Dental Hygie 1 0.11% Early Childh 9 1.00% Electronics 1 0.11% Engineering 36 4.00% Fine Arts 20 2.22% Fire Science 2 0.22% General Engi 15 1.66% General Stud 227 25.19% Horticulture 1 0.11% Hospitality 6 0.67% Information 33 3.66% Interior Des 7 0.78% Liberal Arts 98 10.88% Management 69 7.66% Marketing 15 1.66% Music 7 0.78% Paralegal St 2 0.22% Photography 2 0.22% Physical The 1 0.11% Recreation & 2 0.22% Science 54 5.99% Social Scien 12 1.33% Unclassified 78 8.66% Veterinary T 1 0.11% HS Total 901 100.00%
44
Table FCPS 43. High School: Bryant Alternative High
Curriculum Students Percent Accounting 2 1.24% Administrati 7 4.35% Air Conditio 1 0.62% Architecture 2 1.24% Automotive 3 1.86% Business Adm 14 8.70% Career Studi 9 5.59% Communicatio 1 0.62% Computer Aid 1 0.62% Computer Art 2 1.24% Computer Sci 2 1.24% Culinary Art 1 0.62% Early Childh 3 1.86% Engineering 2 1.24% Fine Arts 1 0.62% General Engi 1 0.62% General Stud 33 20.50% Horticulture 1 0.62% Hospitality 1 0.62% Information 4 2.48% Interior Des 1 0.62% Legal Assist 1 0.62% Liberal Arts 13 8.07% Management 11 6.83% Marketing 3 1.86% Mechanical E 1 0.62% Music 2 1.24% Nursing 5 3.11% Paralegal St 3 1.86% Physical The 1 0.62% Science 7 4.35% Social Scien 4 2.48% Unclassified 18 11.18% HS Total 161 100.00%
45
Table FCPS 44. High School: Centreville High
Curriculum Students Percent Accounting 3 0.47% Administrati 13 2.05% American Sig 1 0.16% Architecture 4 0.63% Arts & Scien 8 1.26% Automotive 13 2.05% Business Adm 44 6.95% Career Studi 18 2.84% Communicatio 5 0.79% Computer Ele 8 1.26% Computer Sci 11 1.74% Construction 2 0.32% Culinary Art 3 0.47% Early Childh 8 1.26% Engineering 16 2.53% Fine Arts 20 3.16% General Engi 5 0.79% General Stud 100 15.80% Hospitality 6 0.95% Information 24 3.79% Interior Des 7 1.11% Liberal Arts 76 12.01% Management 69 10.90% Marketing 8 1.26% Meeting, Eve 1 0.16% Multimedia D 2 0.32% Music 11 1.74% Music Record 1 0.16% Paralegal St 3 0.47% Photography 5 0.79% Public Manag 2 0.32% Science 30 4.74% Social Scien 10 1.58% Technical St 1 0.16% Travel & Tou 1 0.16% Unclassified 94 14.85% HS Total 633 100.00%
46
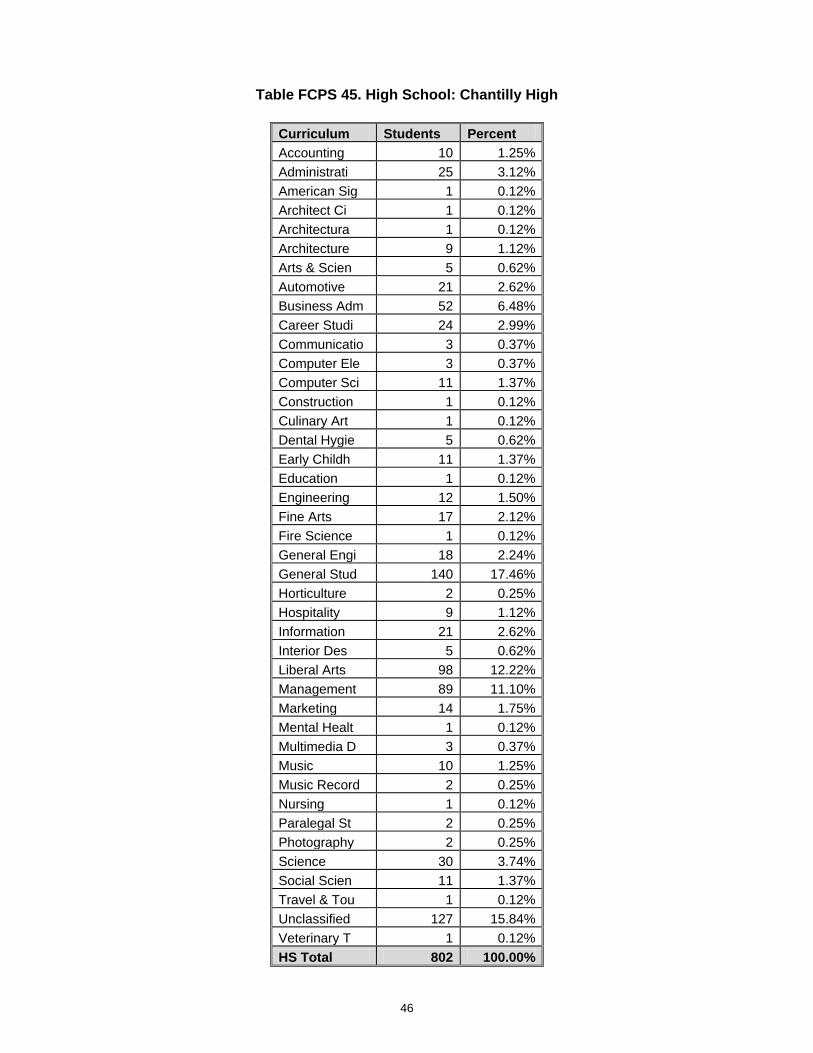
Table FCPS 45. High School: Chantilly High
Curriculum Students Percent Accounting 10 1.25% Administrati 25 3.12% American Sig 1 0.12% Architect Ci 1 0.12% Architectura 1 0.12% Architecture 9 1.12% Arts & Scien 5 0.62% Automotive 21 2.62% Business Adm 52 6.48% Career Studi 24 2.99% Communicatio 3 0.37% Computer Ele 3 0.37% Computer Sci 11 1.37% Construction 1 0.12% Culinary Art 1 0.12% Dental Hygie 5 0.62% Early Childh 11 1.37% Education 1 0.12% Engineering 12 1.50% Fine Arts 17 2.12% Fire Science 1 0.12% General Engi 18 2.24% General Stud 140 17.46% Horticulture 2 0.25% Hospitality 9 1.12% Information 21 2.62% Interior Des 5 0.62% Liberal Arts 98 12.22% Management 89 11.10% Marketing 14 1.75% Mental Healt 1 0.12% Multimedia D 3 0.37% Music 10 1.25% Music Record 2 0.25% Nursing 1 0.12% Paralegal St 2 0.25% Photography 2 0.25% Science 30 3.74% Social Scien 11 1.37% Travel & Tou 1 0.12% Unclassified 127 15.84% Veterinary T 1 0.12% HS Total 802 100.00%
47
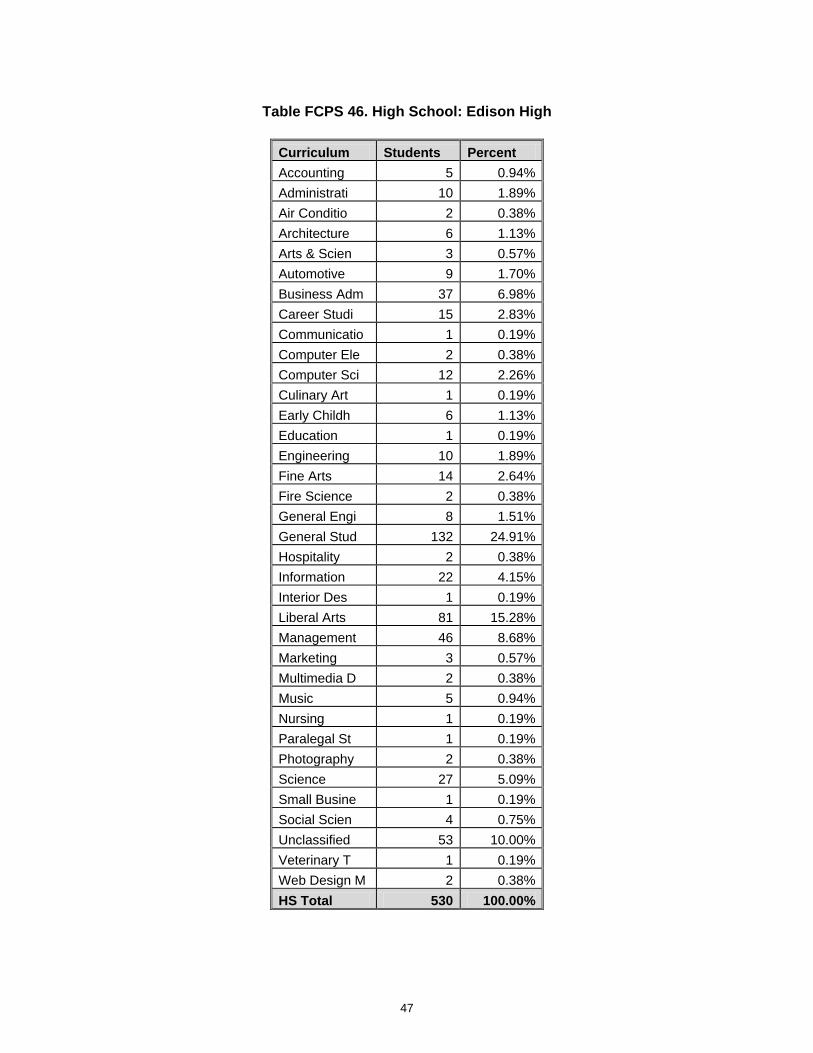
Table FCPS 46. High School: Edison High
Curriculum Students Percent Accounting 5 0.94% Administrati 10 1.89% Air Conditio 2 0.38% Architecture 6 1.13% Arts & Scien 3 0.57% Automotive 9 1.70% Business Adm 37 6.98% Career Studi 15 2.83% Communicatio 1 0.19% Computer Ele 2 0.38% Computer Sci 12 2.26% Culinary Art 1 0.19% Early Childh 6 1.13% Education 1 0.19% Engineering 10 1.89% Fine Arts 14 2.64% Fire Science 2 0.38% General Engi 8 1.51% General Stud 132 24.91% Hospitality 2 0.38% Information 22 4.15% Interior Des 1 0.19% Liberal Arts 81 15.28% Management 46 8.68% Marketing 3 0.57% Multimedia D 2 0.38% Music 5 0.94% Nursing 1 0.19% Paralegal St 1 0.19% Photography 2 0.38% Science 27 5.09% Small Busine 1 0.19% Social Scien 4 0.75% Unclassified 53 10.00% Veterinary T 1 0.19% Web Design M 2 0.38% HS Total 530 100.00%
48
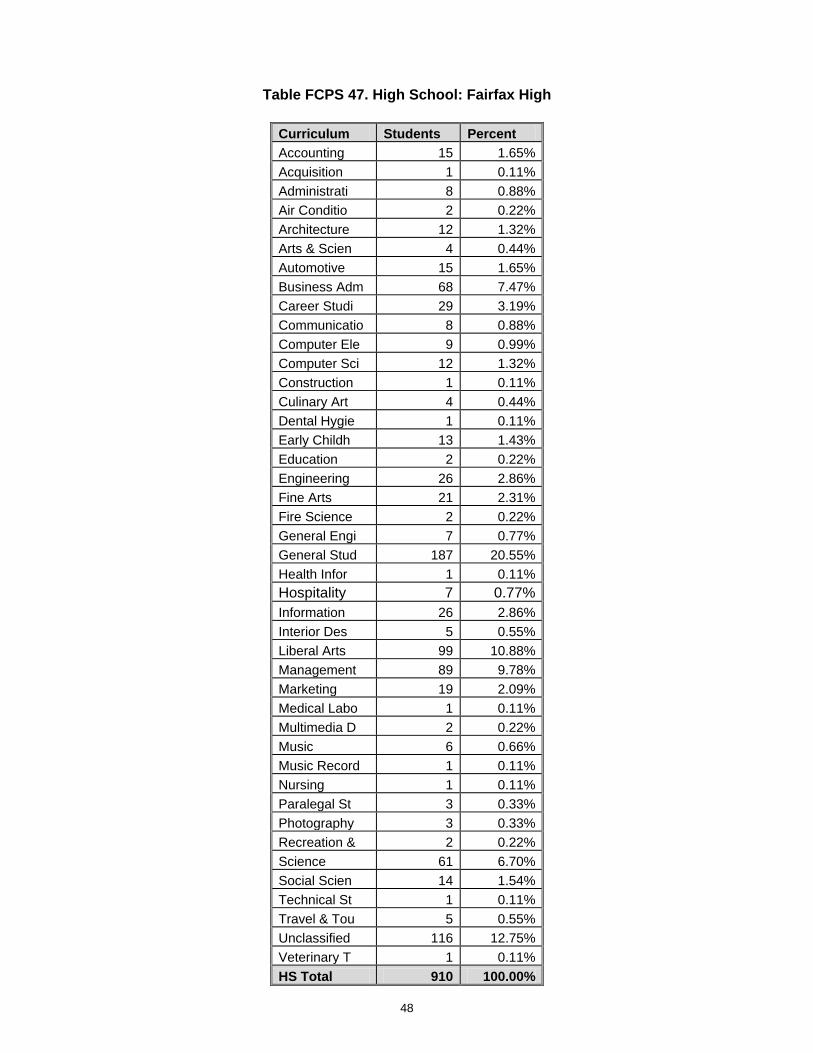
Table FCPS 47. High School: Fairfax High
Curriculum Students Percent Accounting 15 1.65% Acquisition 1 0.11% Administrati 8 0.88% Air Conditio 2 0.22% Architecture 12 1.32% Arts & Scien 4 0.44% Automotive 15 1.65% Business Adm 68 7.47% Career Studi 29 3.19% Communicatio 8 0.88% Computer Ele 9 0.99% Computer Sci 12 1.32% Construction 1 0.11% Culinary Art 4 0.44% Dental Hygie 1 0.11% Early Childh 13 1.43% Education 2 0.22% Engineering 26 2.86% Fine Arts 21 2.31% Fire Science 2 0.22% General Engi 7 0.77% General Stud 187 20.55% Health Infor 1 0.11% Hospitality 7 0.77% Information 26 2.86% Interior Des 5 0.55% Liberal Arts 99 10.88% Management 89 9.78% Marketing 19 2.09% Medical Labo 1 0.11% Multimedia D 2 0.22% Music 6 0.66% Music Record 1 0.11% Nursing 1 0.11% Paralegal St 3 0.33% Photography 3 0.33% Recreation & 2 0.22% Science 61 6.70% Social Scien 14 1.54% Technical St 1 0.11% Travel & Tou 5 0.55% Unclassified 116 12.75% Veterinary T 1 0.11% HS Total 910 100.00%
49
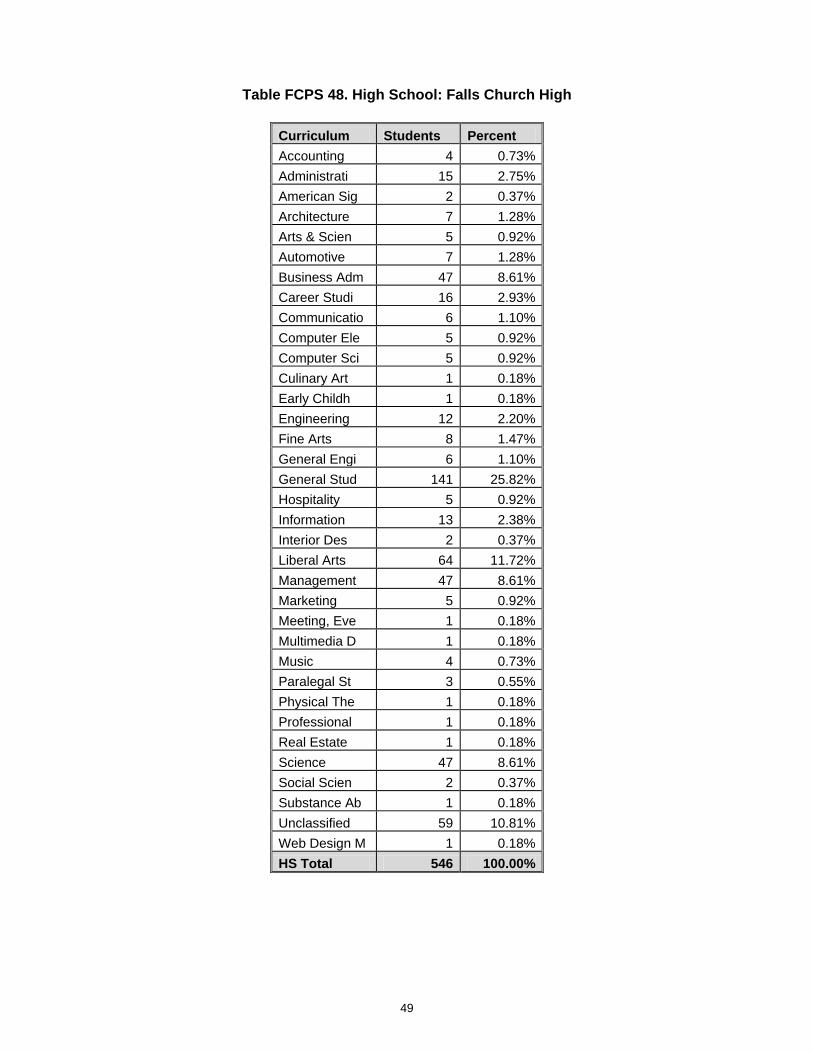
Table FCPS 48. High School: Falls Church High
Curriculum Students Percent Accounting 4 0.73% Administrati 15 2.75% American Sig 2 0.37% Architecture 7 1.28% Arts & Scien 5 0.92% Automotive 7 1.28% Business Adm 47 8.61% Career Studi 16 2.93% Communicatio 6 1.10% Computer Ele 5 0.92% Computer Sci 5 0.92% Culinary Art 1 0.18% Early Childh 1 0.18% Engineering 12 2.20% Fine Arts 8 1.47% General Engi 6 1.10% General Stud 141 25.82% Hospitality 5 0.92% Information 13 2.38% Interior Des 2 0.37% Liberal Arts 64 11.72% Management 47 8.61% Marketing 5 0.92% Meeting, Eve 1 0.18% Multimedia D 1 0.18% Music 4 0.73% Paralegal St 3 0.55% Physical The 1 0.18% Professional 1 0.18% Real Estate 1 0.18% Science 47 8.61% Social Scien 2 0.37% Substance Ab 1 0.18% Unclassified 59 10.81% Web Design M 1 0.18% HS Total 546 100.00%
50
Table FCPS 49. High School: Hayfield High
Curriculum Students Percent Accounting 9 1.24% Administrati 17 2.34% Air Conditio 1 0.14% Architecture 11 1.52% Arts & Scien 9 1.24% Automotive 7 0.96% Automotive E 1 0.14% Business Adm 47 6.47% Career Studi 17 2.34% Communicatio 8 1.10% Computer Ele 8 1.10% Computer Sci 16 2.20% Construction 1 0.14% Culinary Art 5 0.69% Early Childh 17 2.34% Electronics 2 0.28% Emergency Me 1 0.14% Engineering 16 2.20% Fine Arts 20 2.75% Fire Science 3 0.41% General Engi 12 1.65% General Stud 159 21.90% Health Infor 1 0.14% Hospitality 4 0.55% Information 11 1.52% Interior Des 1 0.14% Liberal Arts 76 10.47% Management 69 9.50% Marketing 16 2.20% Music 7 0.96% Paralegal St 3 0.41% Photography 2 0.28% Physical The 1 0.14% Professional 2 0.28% Recreation & 4 0.55% Science 42 5.79% Small Busine 1 0.14% Social Scien 6 0.83% Travel & Tou 1 0.14% Unclassified 90 12.40% Veterinary T 2 0.28% HS Total 726 100.00%

51
Table FCPS 50. High School: Herndon High
Curriculum Students Percent Accounting 5 0.79% Administrati 10 1.58% Architecture 4 0.63% Arts & Scien 1 0.16% Automotive 3 0.47% Automotive A 1 0.16% Biotechnolog 1 0.16% Business Adm 45 7.10% Career Studi 12 1.89% Communicatio 4 0.63% Computer Ele 8 1.26% Computer Sci 16 2.52% Construction 1 0.16% Early Childh 8 1.26% Engineering 16 2.52% Fine Arts 20 3.15% Fire Science 1 0.16% General Engi 12 1.89% General Stud 130 20.50% Hospitality 3 0.47% Information 11 1.74% Interior Des 2 0.32% Liberal Arts 83 13.09% Management 65 10.25% Marketing 7 1.10% Multimedia D 1 0.16% Music 3 0.47% Music Record 2 0.32% Nursing 1 0.16% Paralegal St 9 1.42% Photography 1 0.16% Real Estate 2 0.32% Science 35 5.52% Social Scien 6 0.95% Unclassified 104 16.40% Veterinary T 1 0.16% HS Total 634 100.00%
52
Table FCPS 51. High School: Lake Braddock High
Curriculum Students Percent Accounting 12 1.51% Administrati 18 2.26% Architecture 6 0.75% Arts & Scien 2 0.25% Automotive 21 2.64% Business Adm 48 6.04% Career Studi 35 4.40% Communicatio 1 0.13% Computer Aid 2 0.25% Computer Ele 10 1.26% Computer Sci 8 1.01% Construction 2 0.25% Culinary Art 3 0.38% Early Childh 10 1.26% Engineering 14 1.76% Fine Arts 23 2.89% Fire Science 1 0.13% General Engi 12 1.51% General Stud 160 20.13% Hospitality 4 0.50% Hotel Motel 1 0.13% Information 11 1.38% Interior Des 3 0.38% Liberal Arts 94 11.82% Management 85 10.69% Marketing 19 2.39% Music 14 1.76% Music Record 3 0.38% Paralegal St 5 0.63% Photography 2 0.25% Science 38 4.78% Social Scien 15 1.89% Substance Ab 1 0.13% Unclassified 112 14.09% HS Total 795 100.00%
53
Table FCPS 52. High School: Langley High
Curriculum Students Percent Accounting 2 0.66% Administrati 1 0.33% Architectura 1 0.33% Architecture 2 0.66% Arts & Scien 4 1.32% Automotive 2 0.66% Business Adm 20 6.60% Career Studi 8 2.64% Communicatio 1 0.33% Computer Ele 2 0.66% Computer Sci 5 1.65% Construction 1 0.33% Drafting 1 0.33% Early Childh 2 0.66% Engineering 6 1.98% Fine Arts 7 2.31% General Engi 3 0.99% General Stud 40 13.20% Hospitality 2 0.66% Information 2 0.66% Interior Des 2 0.66% Liberal Arts 51 16.83% Management 37 12.21% Marketing 7 2.31% Meeting, Eve 1 0.33% Multimedia D 1 0.33% Music 3 0.99% Music Record 2 0.66% Paralegal St 1 0.33% Photography 1 0.33% Science 12 3.96% Social Scien 4 1.32% Technical St 1 0.33% Unclassified 68 22.44% HS Total 303 100.00%
54
Table FCPS 53. High School: Lee High (Fairfax)
Curriculum Students Percent Accounting 9 1.20% Administrati 16 2.13% Air Conditio 1 0.13% Architecture 12 1.60% Arts & Scien 1 0.13% Automotive 12 1.60% Automotive E 1 0.13% Biotechnolog 1 0.13% Business Adm 52 6.93% Career Studi 32 4.27% Clerical Stu 1 0.13% Communicatio 3 0.40% Computer Ele 5 0.67% Computer Sci 9 1.20% Construction 2 0.27% Early Childh 11 1.47% Electronics 1 0.13% Engineering 17 2.27% Fine Arts 22 2.93% Fire Science 1 0.13% General Educ 1 0.13% General Engi 17 2.27% General Stud 182 24.27% Hospitality 2 0.27% Human Servic 1 0.13% Information 21 2.80% Interior Des 2 0.27% Liberal Arts 84 11.20% Management 75 10.00% Marketing 20 2.67% Multimedia D 1 0.13% Music 3 0.40% Nursing 2 0.27% Paralegal St 2 0.27% Science 49 6.53% Social Scien 10 1.33% Travel & Tou 1 0.13% Unclassified 68 9.07% HS Total 750 100.00%
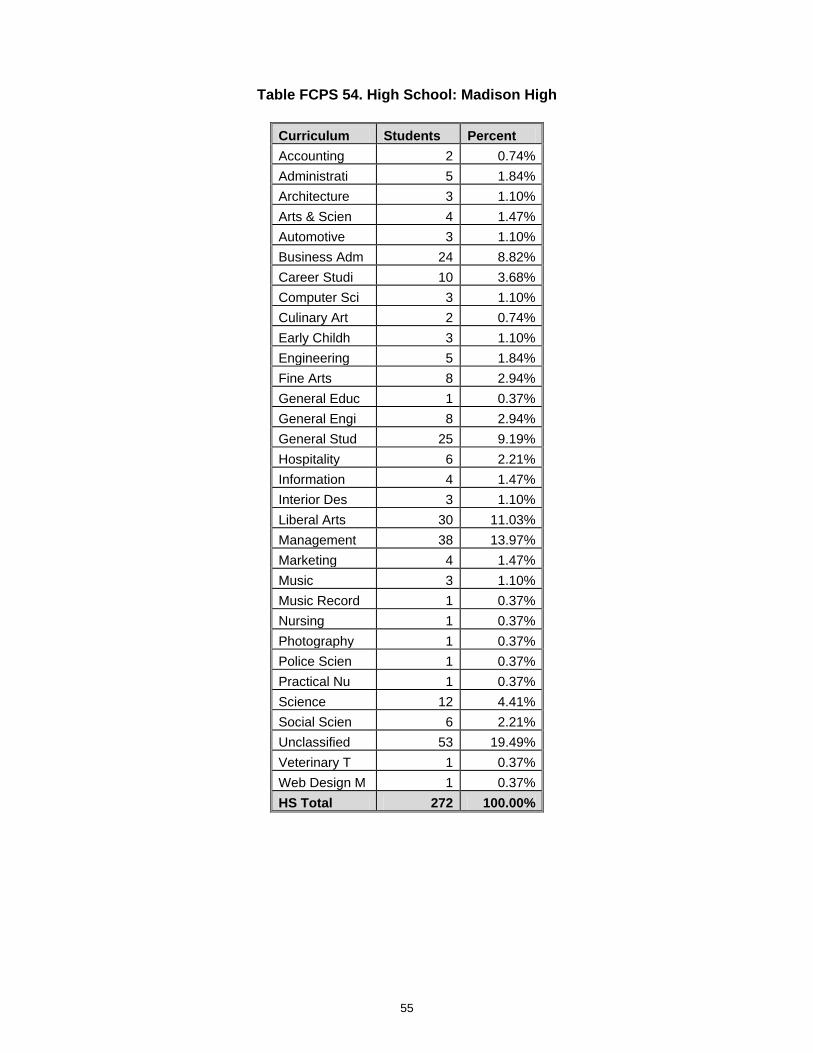
55
Table FCPS 54. High School: Madison High
Curriculum Students Percent Accounting 2 0.74% Administrati 5 1.84% Architecture 3 1.10% Arts & Scien 4 1.47% Automotive 3 1.10% Business Adm 24 8.82% Career Studi 10 3.68% Computer Sci 3 1.10% Culinary Art 2 0.74% Early Childh 3 1.10% Engineering 5 1.84% Fine Arts 8 2.94% General Educ 1 0.37% General Engi 8 2.94% General Stud 25 9.19% Hospitality 6 2.21% Information 4 1.47% Interior Des 3 1.10% Liberal Arts 30 11.03% Management 38 13.97% Marketing 4 1.47% Music 3 1.10% Music Record 1 0.37% Nursing 1 0.37% Photography 1 0.37% Police Scien 1 0.37% Practical Nu 1 0.37% Science 12 4.41% Social Scien 6 2.21% Unclassified 53 19.49% Veterinary T 1 0.37% Web Design M 1 0.37% HS Total 272 100.00%
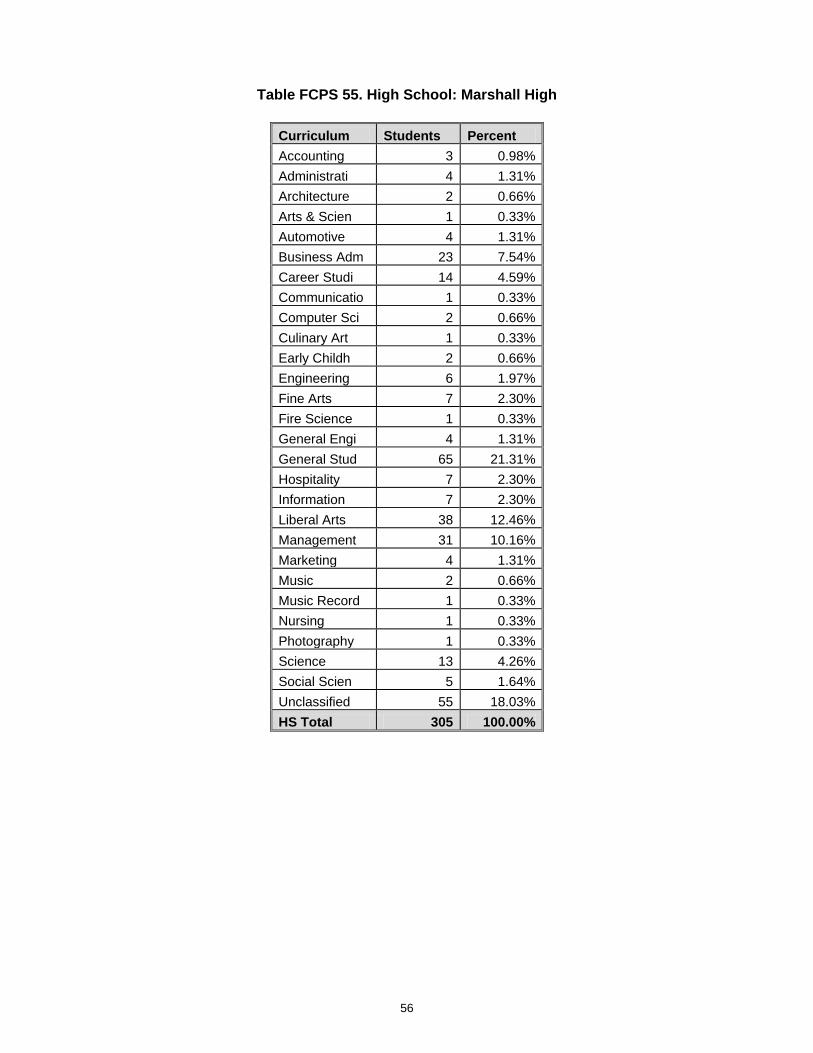
56
Table FCPS 55. High School: Marshall High
Curriculum Students Percent Accounting 3 0.98% Administrati 4 1.31% Architecture 2 0.66% Arts & Scien 1 0.33% Automotive 4 1.31% Business Adm 23 7.54% Career Studi 14 4.59% Communicatio 1 0.33% Computer Sci 2 0.66% Culinary Art 1 0.33% Early Childh 2 0.66% Engineering 6 1.97% Fine Arts 7 2.30% Fire Science 1 0.33% General Engi 4 1.31% General Stud 65 21.31% Hospitality 7 2.30% Information 7 2.30% Liberal Arts 38 12.46% Management 31 10.16% Marketing 4 1.31% Music 2 0.66% Music Record 1 0.33% Nursing 1 0.33% Photography 1 0.33% Science 13 4.26% Social Scien 5 1.64% Unclassified 55 18.03% HS Total 305 100.00%

57
Table FCPS 56. High School: McLean High
Curriculum Students Percent Accounting 5 1.40% Administrati 7 1.97% American Sig 1 0.28% Architectura 1 0.28% Architecture 2 0.56% Arts & Scien 2 0.56% Automotive 6 1.69% Business Adm 25 7.02% Career Studi 11 3.09% Computer Ele 2 0.56% Computer Sci 4 1.12% Culinary Art 2 0.56% Early Childh 5 1.40% Engineering 12 3.37% Fine Arts 7 1.97% General Engi 8 2.25% General Stud 50 14.04% Hospitality 7 1.97% Information 11 3.09% Liberal Arts 53 14.89% Management 33 9.27% Marketing 10 2.81% Music 5 1.40% Music Record 1 0.28% Paralegal St 3 0.84% Science 20 5.62% Small Busine 2 0.56% Social Scien 5 1.40% Unclassified 55 15.45% Veterinary T 1 0.28% HS Total 356 100.00%
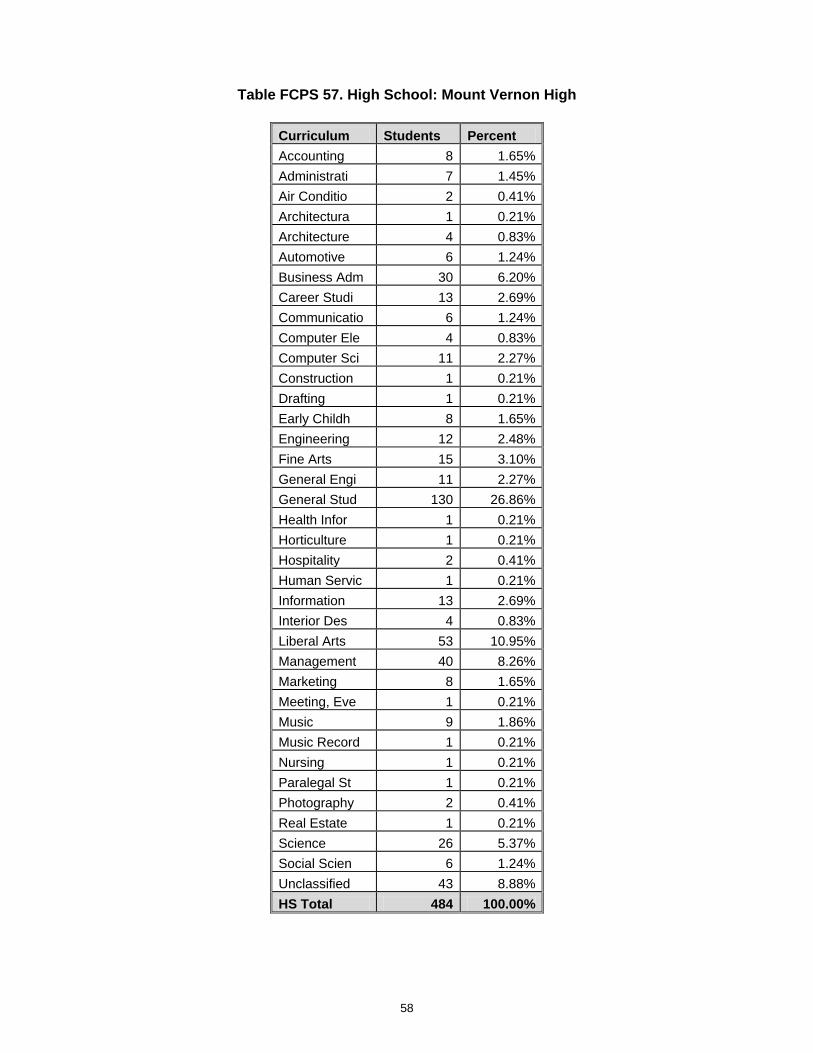
58
Table FCPS 57. High School: Mount Vernon High
Curriculum Students Percent Accounting 8 1.65% Administrati 7 1.45% Air Conditio 2 0.41% Architectura 1 0.21% Architecture 4 0.83% Automotive 6 1.24% Business Adm 30 6.20% Career Studi 13 2.69% Communicatio 6 1.24% Computer Ele 4 0.83% Computer Sci 11 2.27% Construction 1 0.21% Drafting 1 0.21% Early Childh 8 1.65% Engineering 12 2.48% Fine Arts 15 3.10% General Engi 11 2.27% General Stud 130 26.86% Health Infor 1 0.21% Horticulture 1 0.21% Hospitality 2 0.41% Human Servic 1 0.21% Information 13 2.69% Interior Des 4 0.83% Liberal Arts 53 10.95% Management 40 8.26% Marketing 8 1.65% Meeting, Eve 1 0.21% Music 9 1.86% Music Record 1 0.21% Nursing 1 0.21% Paralegal St 1 0.21% Photography 2 0.41% Real Estate 1 0.21% Science 26 5.37% Social Scien 6 1.24% Unclassified 43 8.88% HS Total 484 100.00%

59
Table FCPS 58. High School: Mountain View Alternative High
Curriculum Students Percent Accounting 3 1.22% Administrati 9 3.67% Air Conditio 1 0.41% American Sig 1 0.41% Architecture 1 0.41% Arts & Scien 1 0.41% Automotive 6 2.45% Business Adm 11 4.49% Career Studi 9 3.67% Communicatio 3 1.22% Computer Sci 6 2.45% Construction 3 1.22% Culinary Art 1 0.41% Drafting 1 0.41% Early Childh 3 1.22% Engineering 3 1.22% Fine Arts 4 1.63% General Engi 1 0.41% General Stud 61 24.90% Hospitality 2 0.82% Information 5 2.04% Interior Des 1 0.41% Liberal Arts 28 11.43% Management 32 13.06% Marketing 2 0.82% Music Record 3 1.22% Paralegal St 3 1.22% Photography 2 0.82% Professional 1 0.41% Science 9 3.67% Social Scien 6 2.45% Technical St 1 0.41% Unclassified 22 8.98% HS Total 245 100.00%
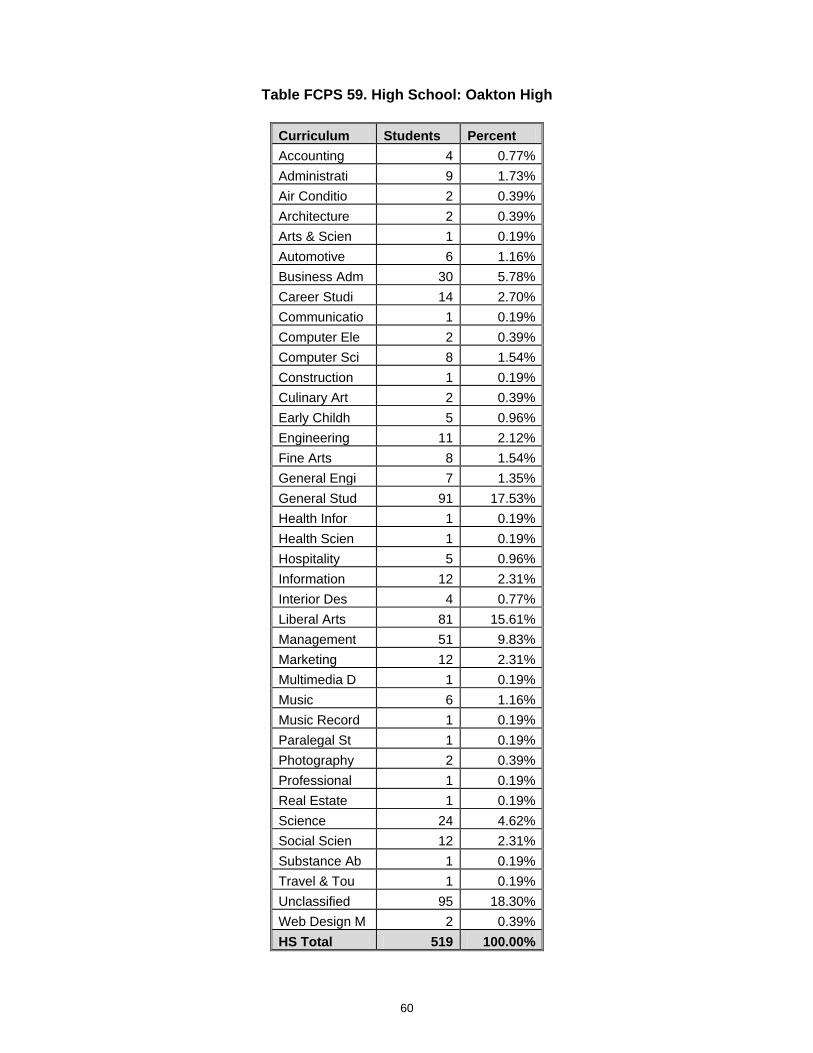
60
Table FCPS 59. High School: Oakton High
Curriculum Students Percent Accounting 4 0.77% Administrati 9 1.73% Air Conditio 2 0.39% Architecture 2 0.39% Arts & Scien 1 0.19% Automotive 6 1.16% Business Adm 30 5.78% Career Studi 14 2.70% Communicatio 1 0.19% Computer Ele 2 0.39% Computer Sci 8 1.54% Construction 1 0.19% Culinary Art 2 0.39% Early Childh 5 0.96% Engineering 11 2.12% Fine Arts 8 1.54% General Engi 7 1.35% General Stud 91 17.53% Health Infor 1 0.19% Health Scien 1 0.19% Hospitality 5 0.96% Information 12 2.31% Interior Des 4 0.77% Liberal Arts 81 15.61% Management 51 9.83% Marketing 12 2.31% Multimedia D 1 0.19% Music 6 1.16% Music Record 1 0.19% Paralegal St 1 0.19% Photography 2 0.39% Professional 1 0.19% Real Estate 1 0.19% Science 24 4.62% Social Scien 12 2.31% Substance Ab 1 0.19% Travel & Tou 1 0.19% Unclassified 95 18.30% Web Design M 2 0.39% HS Total 519 100.00%
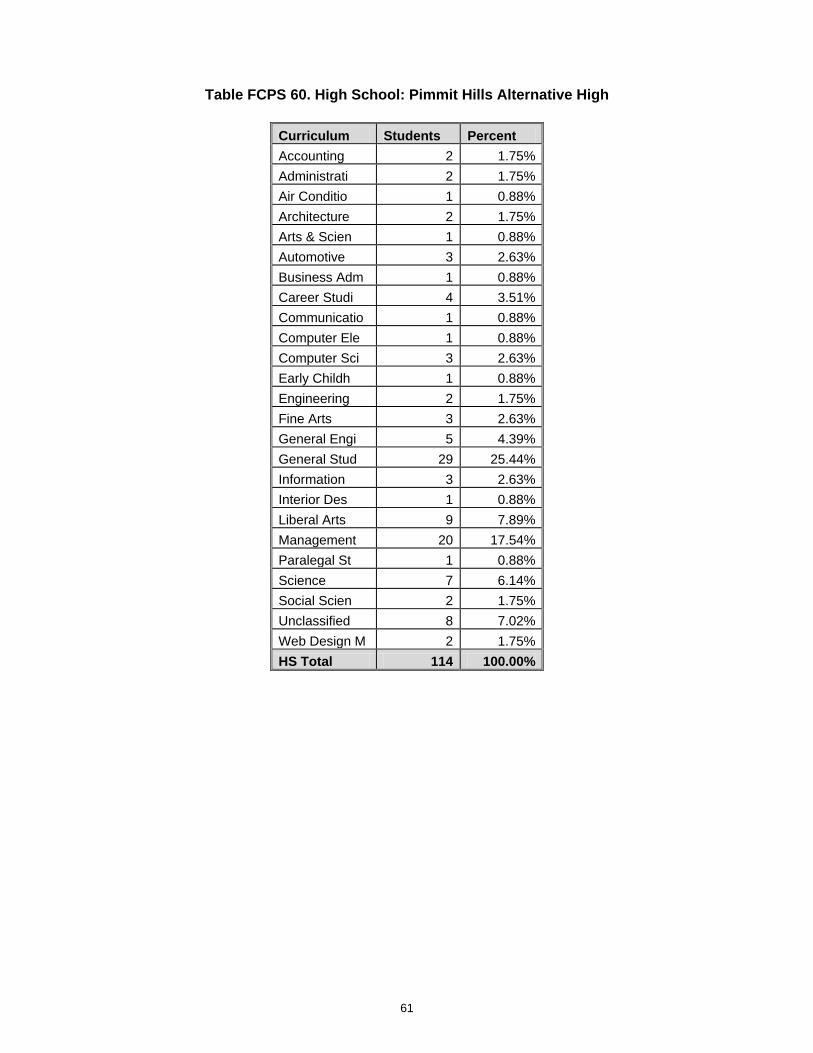
61
Table FCPS 60. High School: Pimmit Hills Alternative High
Curriculum Students Percent Accounting 2 1.75% Administrati 2 1.75% Air Conditio 1 0.88% Architecture 2 1.75% Arts & Scien 1 0.88% Automotive 3 2.63% Business Adm 1 0.88% Career Studi 4 3.51% Communicatio 1 0.88% Computer Ele 1 0.88% Computer Sci 3 2.63% Early Childh 1 0.88% Engineering 2 1.75% Fine Arts 3 2.63% General Engi 5 4.39% General Stud 29 25.44% Information 3 2.63% Interior Des 1 0.88% Liberal Arts 9 7.89% Management 20 17.54% Paralegal St 1 0.88% Science 7 6.14% Social Scien 2 1.75% Unclassified 8 7.02% Web Design M 2 1.75% HS Total 114 100.00%
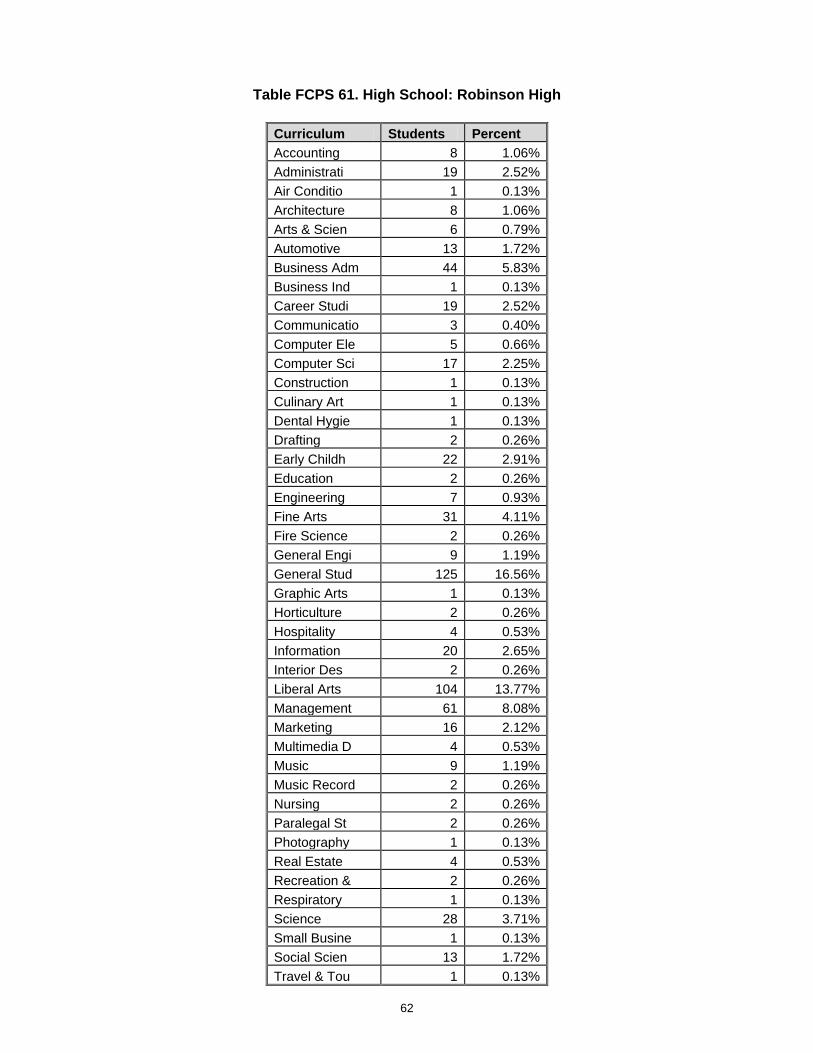
62
Table FCPS 61. High School: Robinson High
Curriculum Students Percent Accounting 8 1.06% Administrati 19 2.52% Air Conditio 1 0.13% Architecture 8 1.06% Arts & Scien 6 0.79% Automotive 13 1.72% Business Adm 44 5.83% Business Ind 1 0.13% Career Studi 19 2.52% Communicatio 3 0.40% Computer Ele 5 0.66% Computer Sci 17 2.25% Construction 1 0.13% Culinary Art 1 0.13% Dental Hygie 1 0.13% Drafting 2 0.26% Early Childh 22 2.91% Education 2 0.26% Engineering 7 0.93% Fine Arts 31 4.11% Fire Science 2 0.26% General Engi 9 1.19% General Stud 125 16.56% Graphic Arts 1 0.13% Horticulture 2 0.26% Hospitality 4 0.53% Information 20 2.65% Interior Des 2 0.26% Liberal Arts 104 13.77% Management 61 8.08% Marketing 16 2.12% Multimedia D 4 0.53% Music 9 1.19% Music Record 2 0.26% Nursing 2 0.26% Paralegal St 2 0.26% Photography 1 0.13% Real Estate 4 0.53% Recreation & 2 0.26% Respiratory 1 0.13% Science 28 3.71% Small Busine 1 0.13% Social Scien 13 1.72% Travel & Tou 1 0.13%
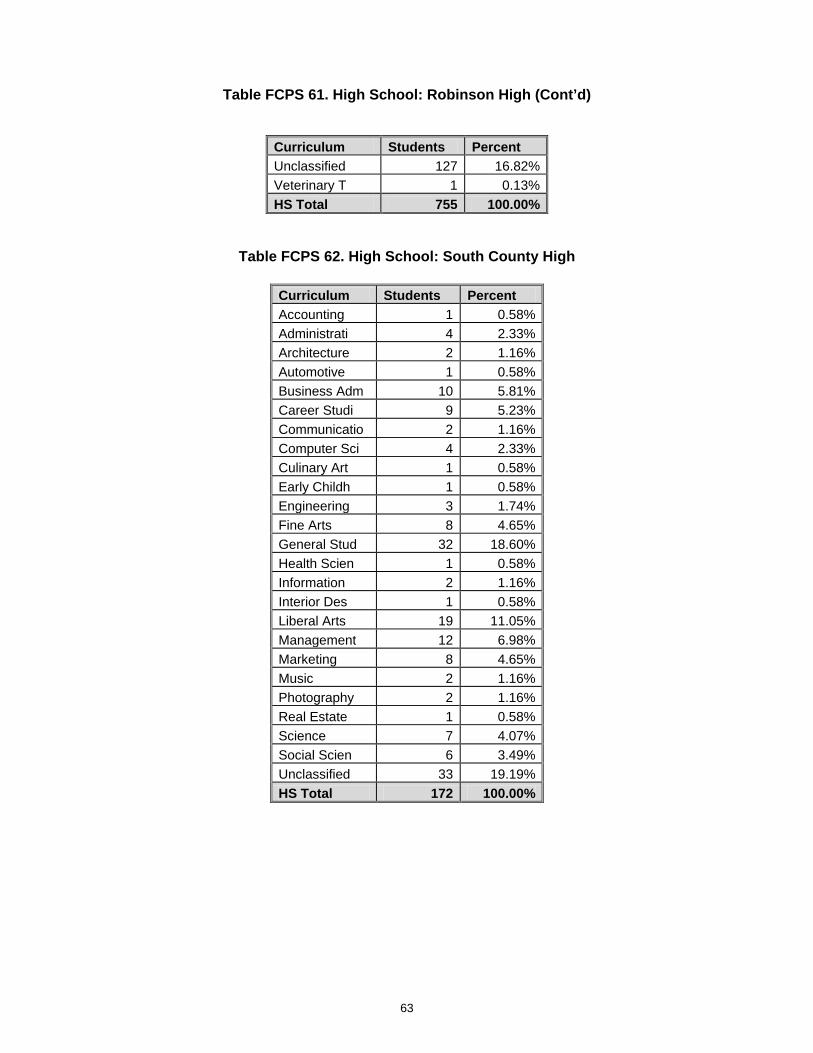
63
Table FCPS 61. High School: Robinson High (Cont’d)
Curriculum Students Percent Unclassified 127 16.82% Veterinary T 1 0.13% HS Total 755 100.00%
Table FCPS 62. High School: South County High
Curriculum Students Percent Accounting 1 0.58% Administrati 4 2.33% Architecture 2 1.16% Automotive 1 0.58% Business Adm 10 5.81% Career Studi 9 5.23% Communicatio 2 1.16% Computer Sci 4 2.33% Culinary Art 1 0.58% Early Childh 1 0.58% Engineering 3 1.74% Fine Arts 8 4.65% General Stud 32 18.60% Health Scien 1 0.58% Information 2 1.16% Interior Des 1 0.58% Liberal Arts 19 11.05% Management 12 6.98% Marketing 8 4.65% Music 2 1.16% Photography 2 1.16% Real Estate 1 0.58% Science 7 4.07% Social Scien 6 3.49% Unclassified 33 19.19% HS Total 172 100.00%
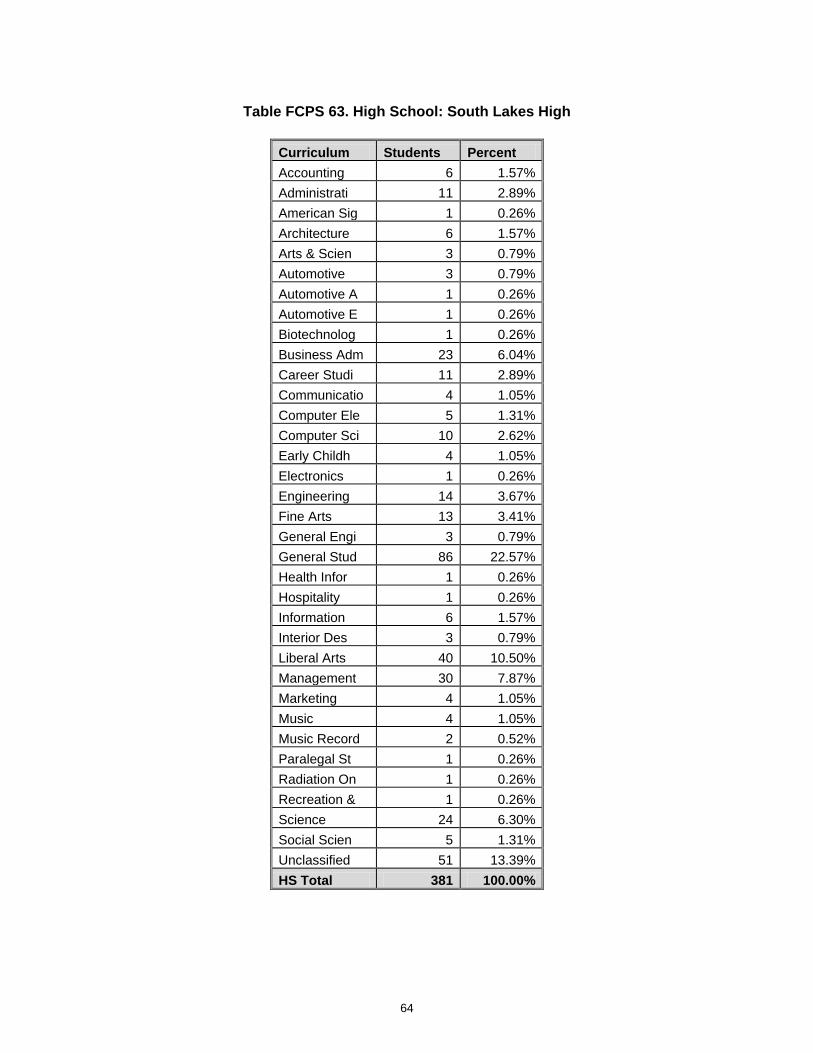
64
Table FCPS 63. High School: South Lakes High
Curriculum Students Percent Accounting 6 1.57% Administrati 11 2.89% American Sig 1 0.26% Architecture 6 1.57% Arts & Scien 3 0.79% Automotive 3 0.79% Automotive A 1 0.26% Automotive E 1 0.26% Biotechnolog 1 0.26% Business Adm 23 6.04% Career Studi 11 2.89% Communicatio 4 1.05% Computer Ele 5 1.31% Computer Sci 10 2.62% Early Childh 4 1.05% Electronics 1 0.26% Engineering 14 3.67% Fine Arts 13 3.41% General Engi 3 0.79% General Stud 86 22.57% Health Infor 1 0.26% Hospitality 1 0.26% Information 6 1.57% Interior Des 3 0.79% Liberal Arts 40 10.50% Management 30 7.87% Marketing 4 1.05% Music 4 1.05% Music Record 2 0.52% Paralegal St 1 0.26% Radiation On 1 0.26% Recreation & 1 0.26% Science 24 6.30% Social Scien 5 1.31% Unclassified 51 13.39% HS Total 381 100.00%
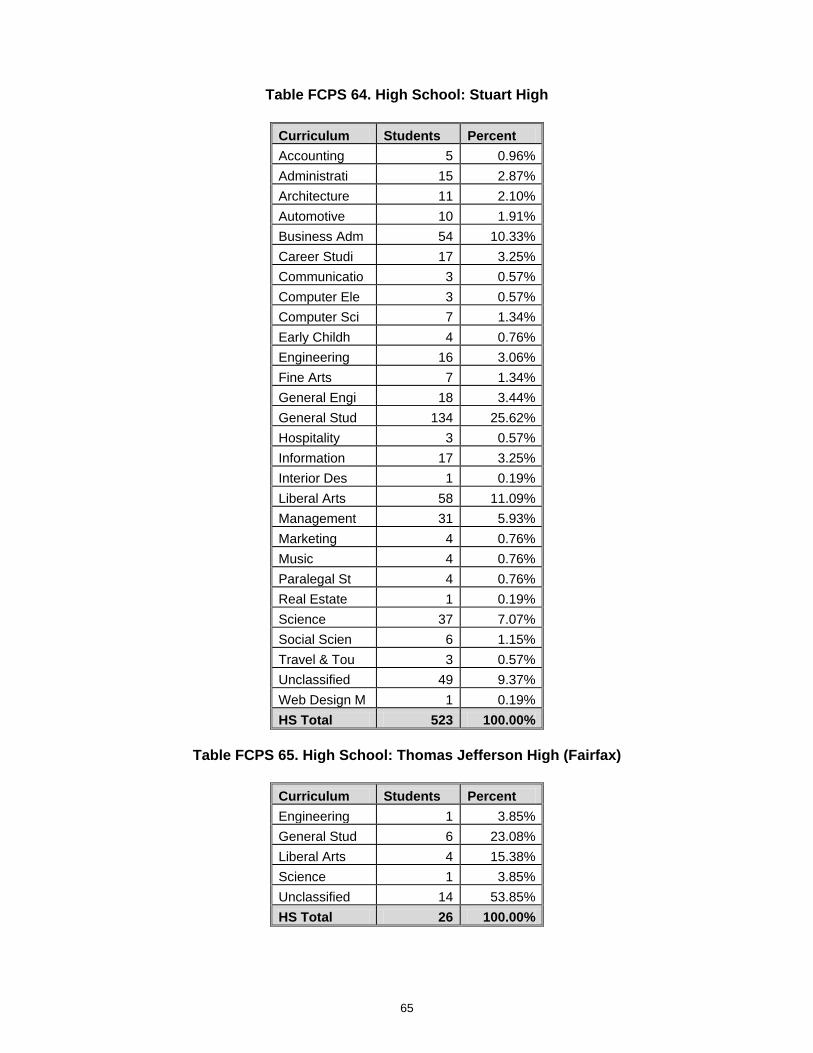
65
Table FCPS 64. High School: Stuart High
Curriculum Students Percent Accounting 5 0.96% Administrati 15 2.87% Architecture 11 2.10% Automotive 10 1.91% Business Adm 54 10.33% Career Studi 17 3.25% Communicatio 3 0.57% Computer Ele 3 0.57% Computer Sci 7 1.34% Early Childh 4 0.76% Engineering 16 3.06% Fine Arts 7 1.34% General Engi 18 3.44% General Stud 134 25.62% Hospitality 3 0.57% Information 17 3.25% Interior Des 1 0.19% Liberal Arts 58 11.09% Management 31 5.93% Marketing 4 0.76% Music 4 0.76% Paralegal St 4 0.76% Real Estate 1 0.19% Science 37 7.07% Social Scien 6 1.15% Travel & Tou 3 0.57% Unclassified 49 9.37% Web Design M 1 0.19% HS Total 523 100.00%
Table FCPS 65. High School: Thomas Jefferson High (Fairfax)
Curriculum Students Percent Engineering 1 3.85% General Stud 6 23.08% Liberal Arts 4 15.38% Science 1 3.85% Unclassified 14 53.85% HS Total 26 100.00%
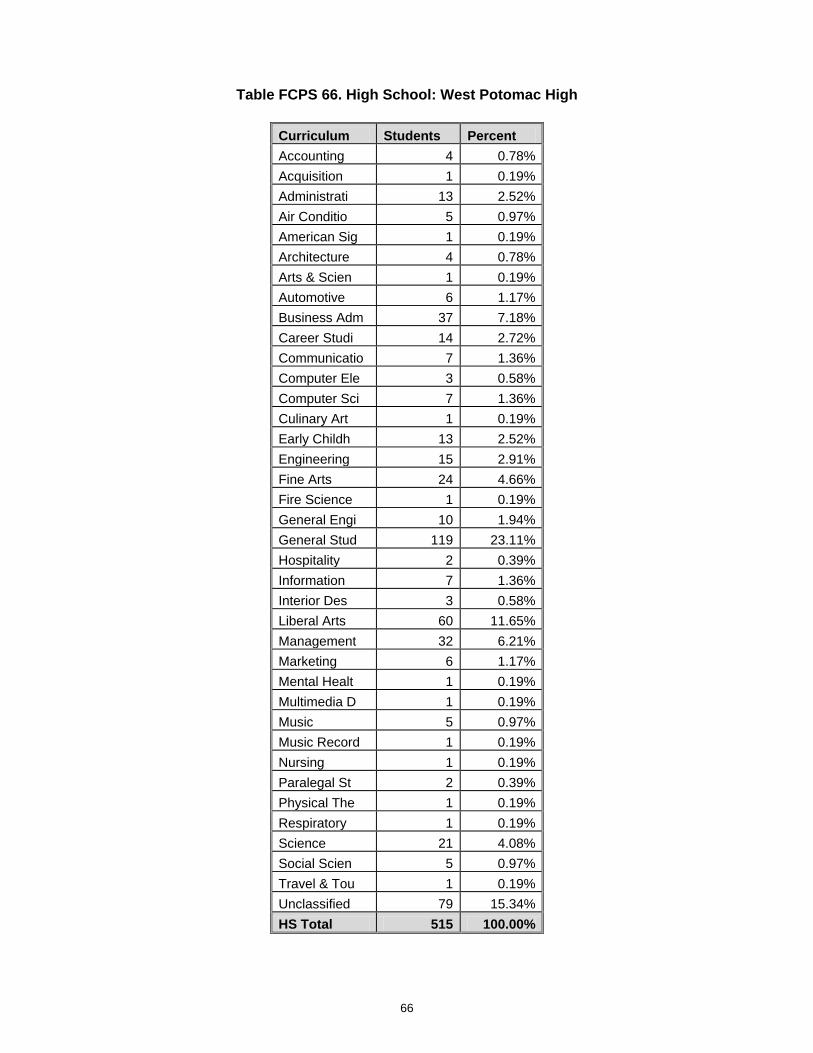
66
Table FCPS 66. High School: West Potomac High
Curriculum Students Percent Accounting 4 0.78% Acquisition 1 0.19% Administrati 13 2.52% Air Conditio 5 0.97% American Sig 1 0.19% Architecture 4 0.78% Arts & Scien 1 0.19% Automotive 6 1.17% Business Adm 37 7.18% Career Studi 14 2.72% Communicatio 7 1.36% Computer Ele 3 0.58% Computer Sci 7 1.36% Culinary Art 1 0.19% Early Childh 13 2.52% Engineering 15 2.91% Fine Arts 24 4.66% Fire Science 1 0.19% General Engi 10 1.94% General Stud 119 23.11% Hospitality 2 0.39% Information 7 1.36% Interior Des 3 0.58% Liberal Arts 60 11.65% Management 32 6.21% Marketing 6 1.17% Mental Healt 1 0.19% Multimedia D 1 0.19% Music 5 0.97% Music Record 1 0.19% Nursing 1 0.19% Paralegal St 2 0.39% Physical The 1 0.19% Respiratory 1 0.19% Science 21 4.08% Social Scien 5 0.97% Travel & Tou 1 0.19% Unclassified 79 15.34% HS Total 515 100.00%
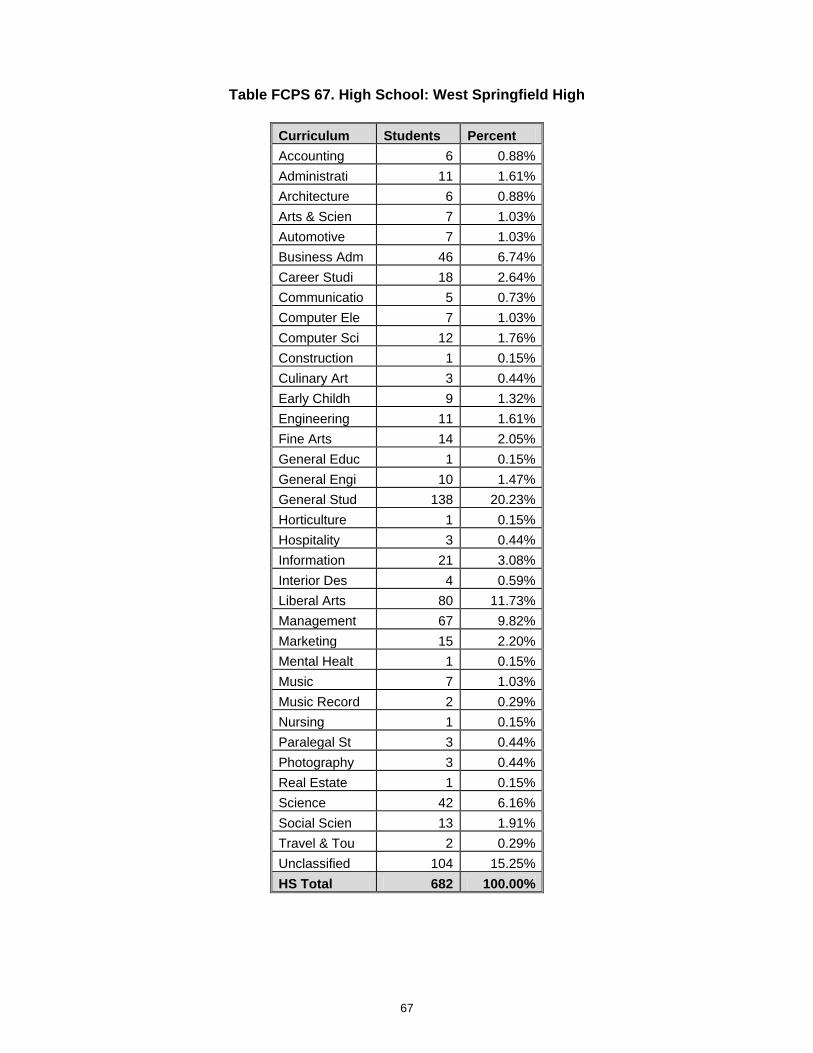
67
Table FCPS 67. High School: West Springfield High
Curriculum Students Percent Accounting 6 0.88% Administrati 11 1.61% Architecture 6 0.88% Arts & Scien 7 1.03% Automotive 7 1.03% Business Adm 46 6.74% Career Studi 18 2.64% Communicatio 5 0.73% Computer Ele 7 1.03% Computer Sci 12 1.76% Construction 1 0.15% Culinary Art 3 0.44% Early Childh 9 1.32% Engineering 11 1.61% Fine Arts 14 2.05% General Educ 1 0.15% General Engi 10 1.47% General Stud 138 20.23% Horticulture 1 0.15% Hospitality 3 0.44% Information 21 3.08% Interior Des 4 0.59% Liberal Arts 80 11.73% Management 67 9.82% Marketing 15 2.20% Mental Healt 1 0.15% Music 7 1.03% Music Record 2 0.29% Nursing 1 0.15% Paralegal St 3 0.44% Photography 3 0.44% Real Estate 1 0.15% Science 42 6.16% Social Scien 13 1.91% Travel & Tou 2 0.29% Unclassified 104 15.25% HS Total 682 100.00%
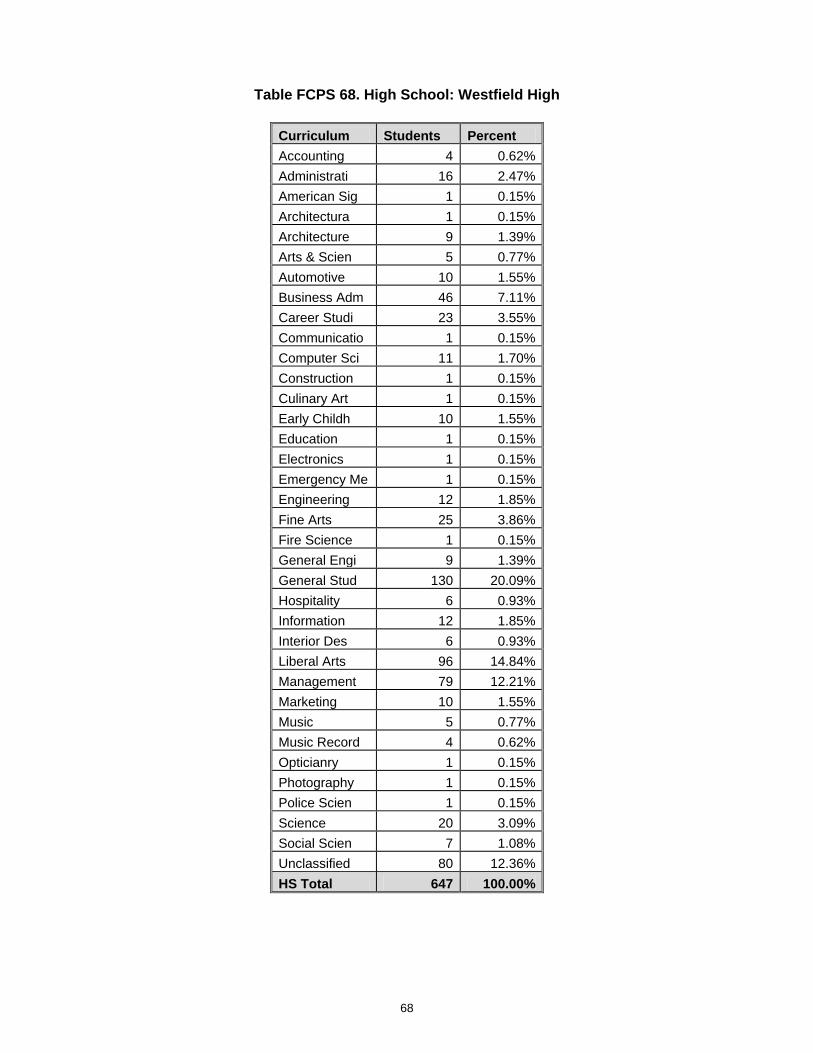
68
Table FCPS 68. High School: Westfield High
Curriculum Students Percent Accounting 4 0.62% Administrati 16 2.47% American Sig 1 0.15% Architectura 1 0.15% Architecture 9 1.39% Arts & Scien 5 0.77% Automotive 10 1.55% Business Adm 46 7.11% Career Studi 23 3.55% Communicatio 1 0.15% Computer Sci 11 1.70% Construction 1 0.15% Culinary Art 1 0.15% Early Childh 10 1.55% Education 1 0.15% Electronics 1 0.15% Emergency Me 1 0.15% Engineering 12 1.85% Fine Arts 25 3.86% Fire Science 1 0.15% General Engi 9 1.39% General Stud 130 20.09% Hospitality 6 0.93% Information 12 1.85% Interior Des 6 0.93% Liberal Arts 96 14.84% Management 79 12.21% Marketing 10 1.55% Music 5 0.77% Music Record 4 0.62% Opticianry 1 0.15% Photography 1 0.15% Police Scien 1 0.15% Science 20 3.09% Social Scien 7 1.08% Unclassified 80 12.36% HS Total 647 100.00%
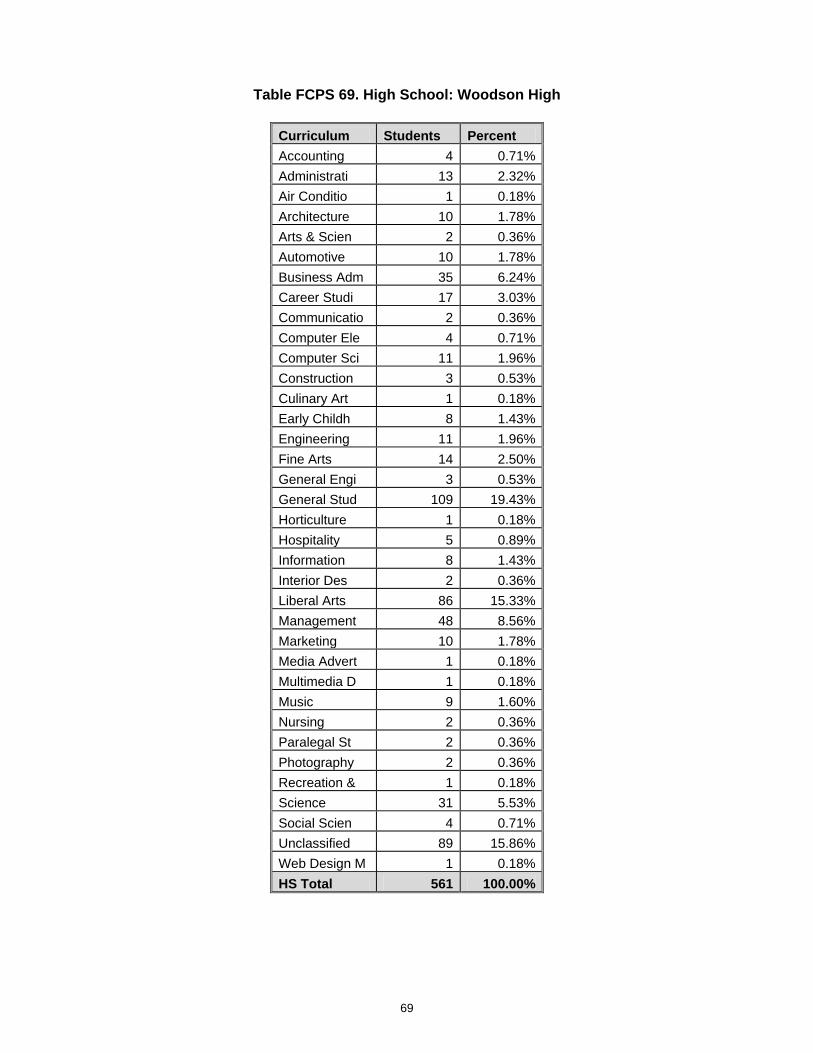
69
Table FCPS 69. High School: Woodson High
Curriculum Students Percent Accounting 4 0.71% Administrati 13 2.32% Air Conditio 1 0.18% Architecture 10 1.78% Arts & Scien 2 0.36% Automotive 10 1.78% Business Adm 35 6.24% Career Studi 17 3.03% Communicatio 2 0.36% Computer Ele 4 0.71% Computer Sci 11 1.96% Construction 3 0.53% Culinary Art 1 0.18% Early Childh 8 1.43% Engineering 11 1.96% Fine Arts 14 2.50% General Engi 3 0.53% General Stud 109 19.43% Horticulture 1 0.18% Hospitality 5 0.89% Information 8 1.43% Interior Des 2 0.36% Liberal Arts 86 15.33% Management 48 8.56% Marketing 10 1.78% Media Advert 1 0.18% Multimedia D 1 0.18% Music 9 1.60% Nursing 2 0.36% Paralegal St 2 0.36% Photography 2 0.36% Recreation & 1 0.18% Science 31 5.53% Social Scien 4 0.71% Unclassified 89 15.86% Web Design M 1 0.18% HS Total 561 100.00%
NOVA Mission and Strategic Goals: 2005 – 2015
Mission The mission of Northern Virginia Community College is to respond to the educational needs of its dynamic and diverse constituencies through an array of comprehensive programs and services that facilitate learning and workforce development in an environment of open access and lifelong educational opportunities.
Strategic Goals
I. STUDENT SUCCESS – Northern Virginia Community College will move into the top tier of community colleges with respect to the college readiness, developmental course completion, retention, graduation, transfer, and career placement of its students.
II. ACCESS – Northern Virginia Community College will increase the number and diversity
of students being served to mirror the population growth of the region.
III. TEACHING AND LEARNING – Northern Virginia Community College will focus on student success by creating an environment of world-class teaching and learning.
IV. EXCELLENCE – Northern Virginia Community College will develop ten focal points of
excellence in its educational programs and services that will be benchmarked to the best in the nation and strategic to building the College's overall reputation for quality.
V. LEADERSHIP – Northern Virginia Community College will serve as a catalyst and a
leader in developing educational and economic opportunities for all Northern Virginians and in maintaining the quality of life and economic competitiveness of the region.
VI. PARTNERSHIPS – Northern Virginia Community College will develop strategic
partnerships to create gateways of opportunity and an integrated educational system for Northern Virginians who are pursuing the American Dream.
VII. RESOURCES – Northern Virginia Community College will increase its annual funding
by $100 million and expand its physical facilities by more than one million square feet in new and renovated space. This includes the establishment of two additional campuses at epicenters of the region’s population growth, as well as additional education and training facilities in or near established population centers.
VIII. EMERGENCY PREPAREDNESS AND CONTINUITY OF OPERATIONS – Northern
Virginia Community College will be recognized as a leader among institutions of higher education in Virginia for its development and testing of emergency response and continuity of operation plans.