Embed Size (px)
Citation preview
PERFORMANCE OF AMMONIA-FIREDGAS-TURBINE COMBUSTORS
by
D. T. Pratt
Report No. TS-67-5*~fl - Contract DA-O4-2OO-A4C-7'91 Cx)
-'ID
- -rP August 1967
'SEP 8 1
COLLEGE OF ENGINEERINGUNIVERSITY OF CALIFORNIA, Bterke ley
Reproduced by rho 'A ~
CLEA RINCHOUSF, ~*I4
--
$;7r
UNIVERSITY OF CALIFOIINIArepartment of Mechanical Engineering
Thermal Systemu Division
PERFORMANCE OF AMMONIA-FIRED GAS-TURBINE COMBUSTORS
by
D. T. Pratt
Technical Report No. 9
Under ContractDA-04-200-AMC-791(x) Ammonia Fuel
Army Materiel Command2 & D Directorate
Chemistry and Materials Branch
Project DirectorE. S. Starkman
August, 1967
hf
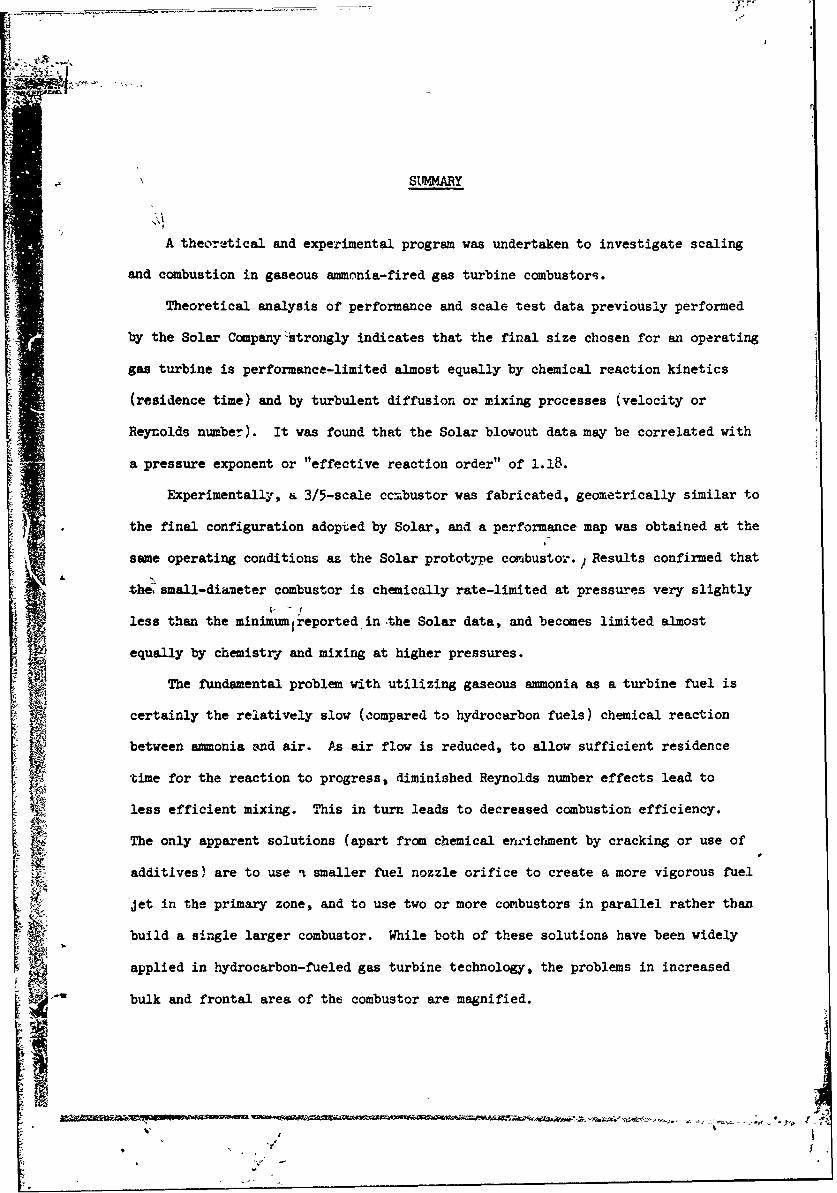
SULMRY
A theoretical and experimental program was undertaken to investigate scaling
and combustion in gaseous ammnia-fired gas turbine combustors.
Theoretical analysis of performance and scale test data previously performed
by the Solar Companystrongly indicates that the final size chosen for an operating
gas turbine is performance-limited almost equally by chemical reaction kinetics
(residence time) and by turbulent diffusion or mixing processes (velocity or
Reynolds number). It was found that the Solar blowout data may be correlated with
a pressure exponent or "effective reaction order" of 1.18.
Experimentally, a 3/5-scale ccmbustor was fabricated, geometrically similar to
the final configuration adopted by Solar, and a performance map was obtained at the
same operating conditions as the Solar prototyp'e cobustor./ Results confirmed that
the small-dianeter combustor is chemically rate-limited at pressures very slightly
less than the minimumreported, in-the Solar data, and becomes limited almost
equally by chemistry and mixing at higher pressures.
The fundamental problem with utilizing gaseous ammonia as a turbine fuel is
certainly the relatively slow (compared to hydrocarbon fuels) chemical reaction
between ammonia and air. As air flow is reduced, to allow sufficient residence
time for the reaction to progress, diminished Reynolds number effects lead to
less efficient mixing. This in turn leads to decreased combustion efficiency.
The only apparent solutions (apart from chemical enr icbment by cracking or use of
additives) are to use t smaller fuel nozzle orifice to create a more vigorous fuel
Jet in the primary zone, and to use two or more combustors in parallel rather than
build a single larger combustor. While both of these solutions have been widely
applied in hydrocarbon-fueled gas turbine technology, the problems in increased
bulk and frontal area of the combustor are magnified.
-"' DI
it
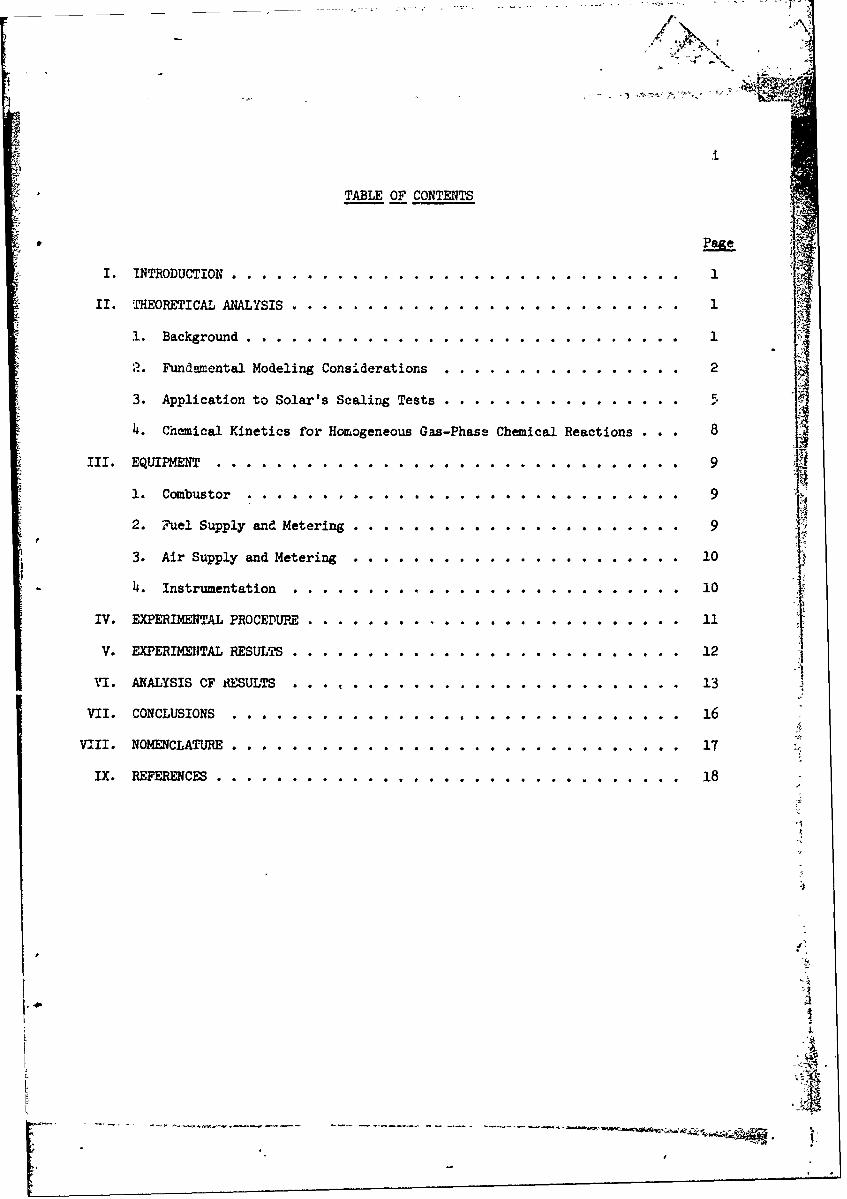
TABLE OF CONTENTS
I INTRODUCTION ............................. .
II. THEORETICAL ANALYSIS ......... .......................... . I..
1. Background ..............................
2. Fundamental Modeling Considerations ........ ................ 2
3. Application to Solar's Scaling Tests .......... . . . . ..
4. Chemical Kinetics for Homogeneous Gas-Phase Chemical Reactions . . . 8
III. EQUIPMENT . .................. .......... . . . 9
1. Combustor . . . . . ......................... 9 9
2. Fruel Supply and Metering ..................... 9
3. Air Supply and Metering .i.....................10
4. Instrumentation ............. .......................... 10
IV. EXPERIMENTAL PROCEDUPR. ............................... 11
V. EXPERIMEUTAL RESULTS ......... .......................... ... 12
VI. ANALYSIS CF RESULTS .................................. 13
VII. CONCLUSIONS .................................. 16
VIII. NOMENCLATURE . . ..... . . . ................. . . 17
IX. REFERENCES ............................... . 18
'3
I,
i •
Ir
ii
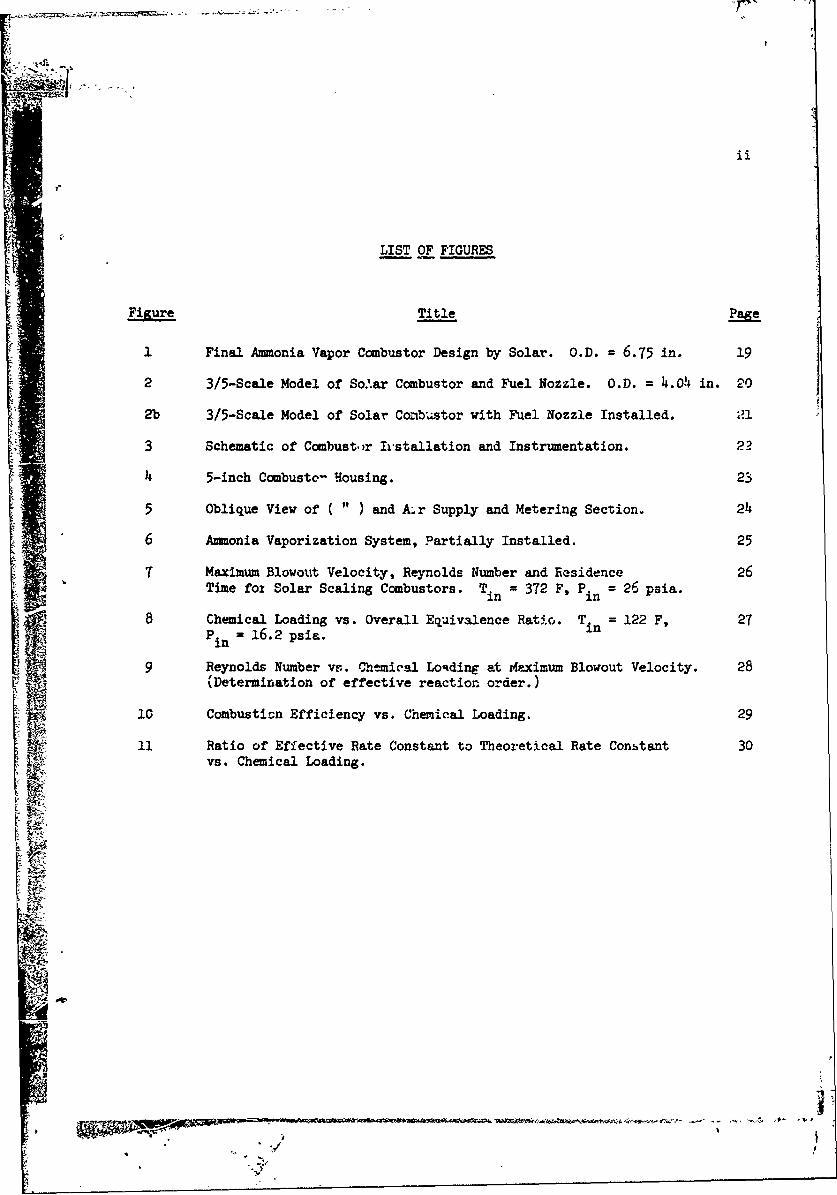
LIST OF FIGURES
Figure Title Page
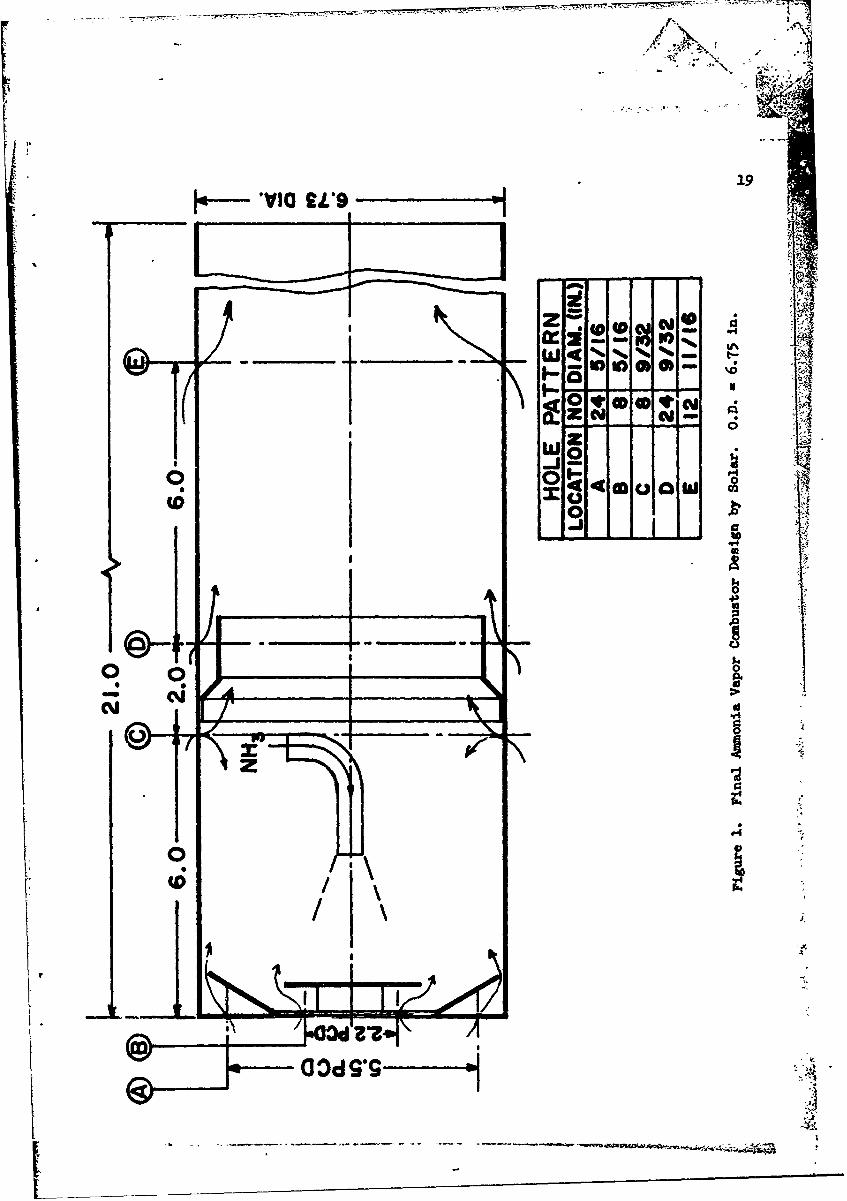
1 Final Ammonia Vapor Combustor Design by Solar. O.D. 6.75 in. 19
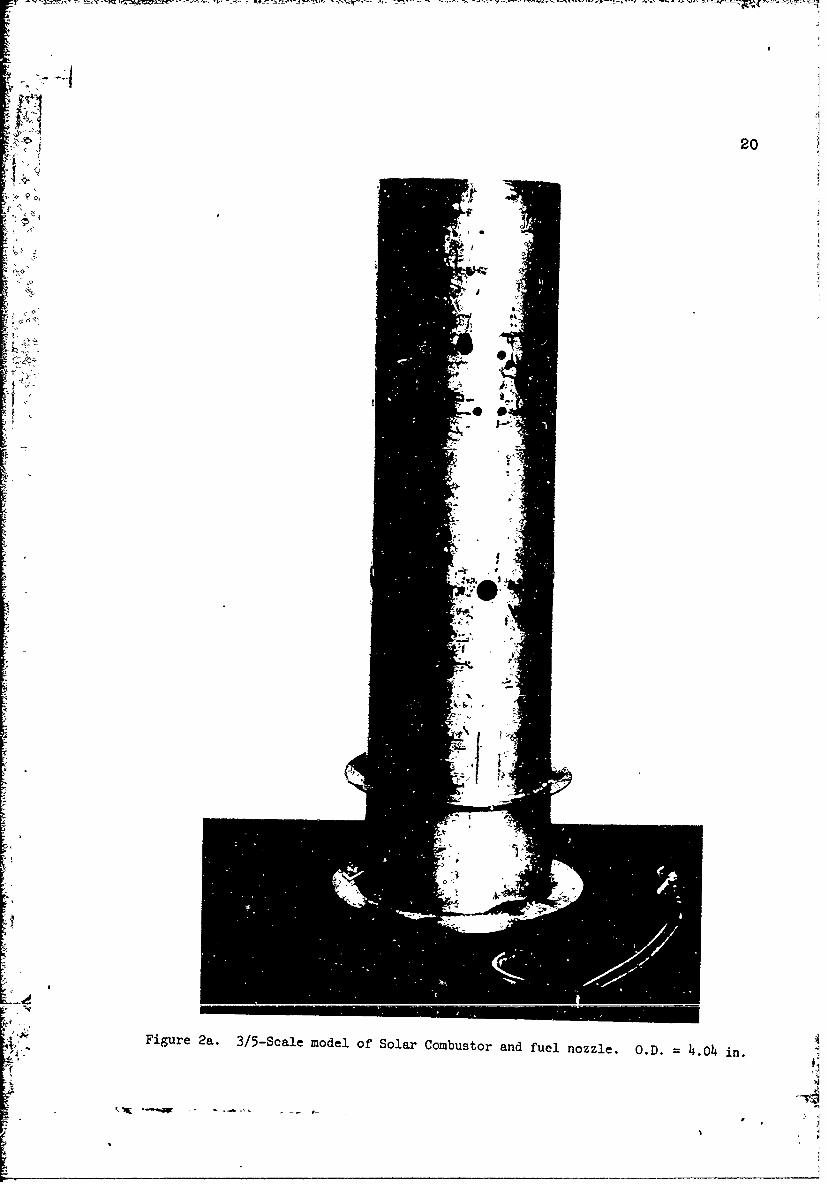
2 3/5-Scale Model of So.ar Combustor and Fuel Nozzle. O.D. = 4.04 in. 20
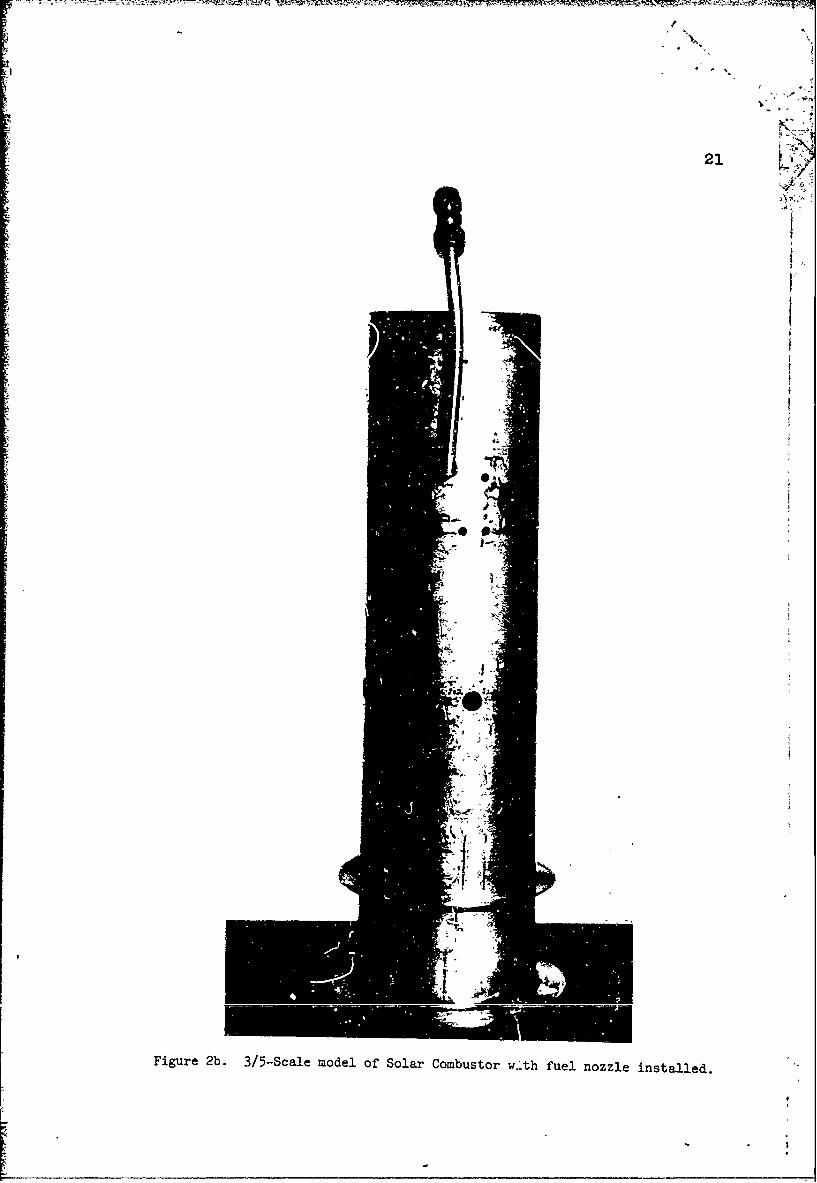
2b 3/5-Scale Model of Solar Comb~stor with Fuel Nozzle Installed.
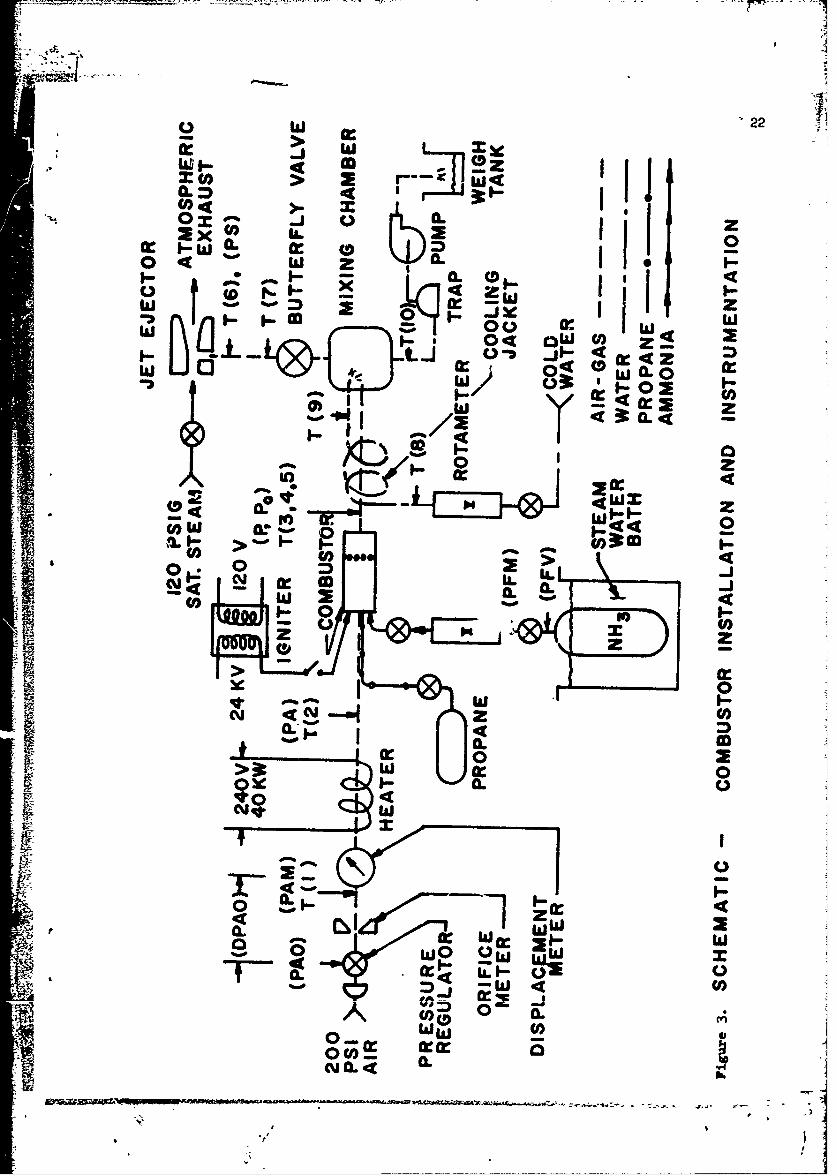
3 Schematic of Combusto r Ii-stallation and Instrumentation. 22
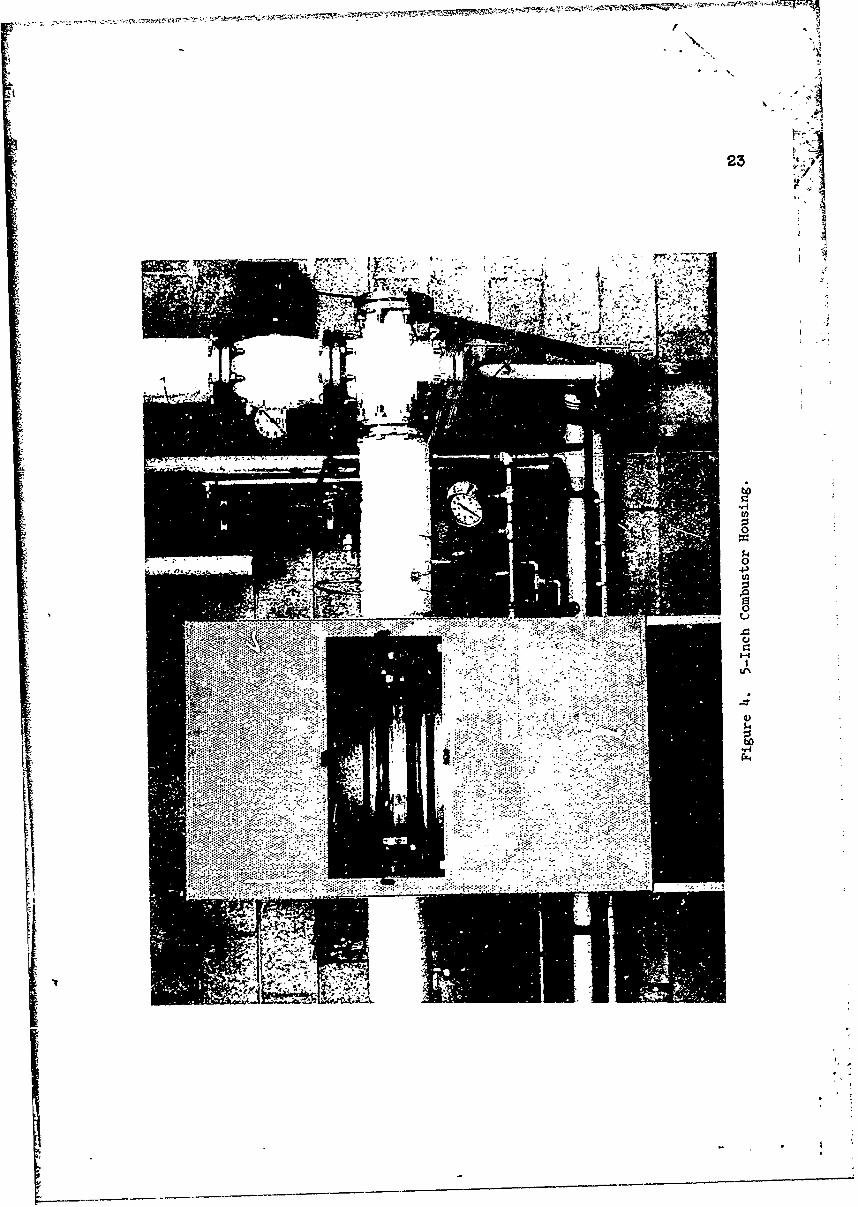
4 5-inch Combustc- Housing. 23
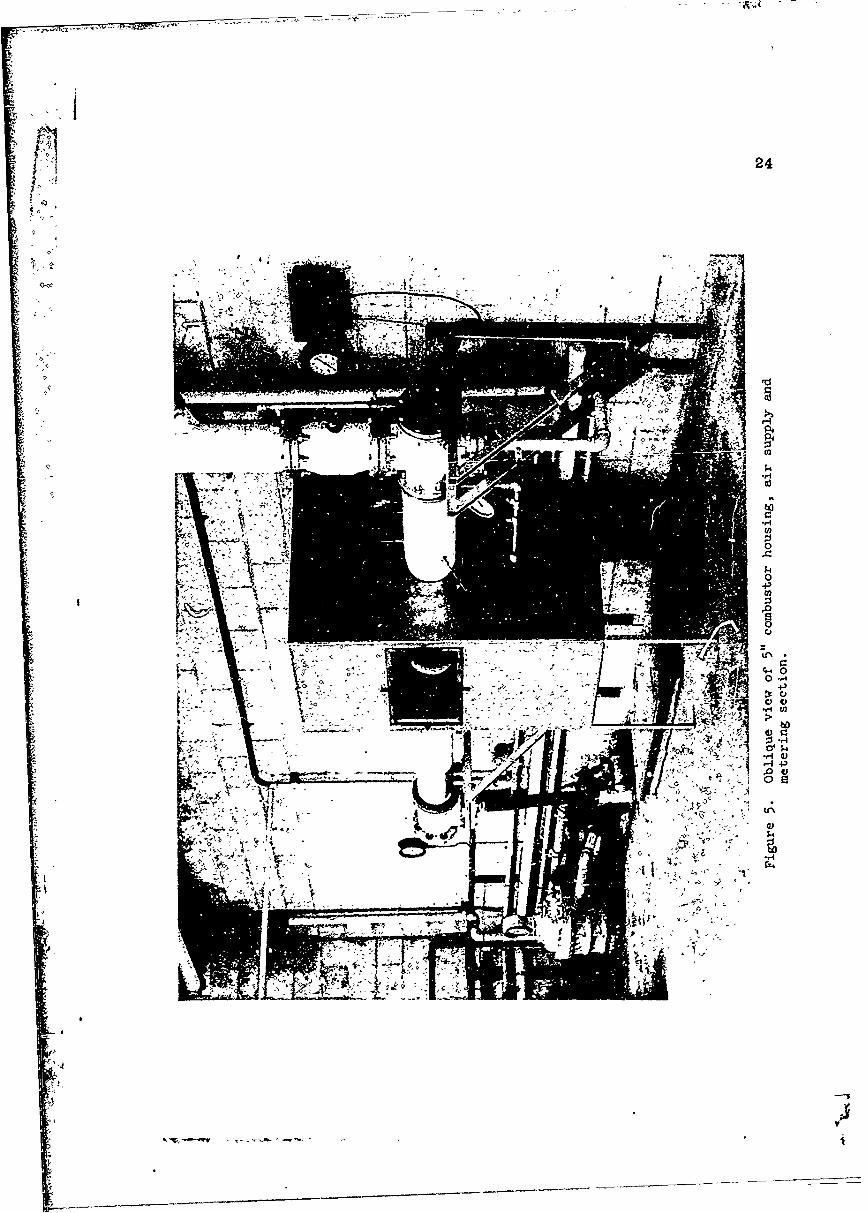
5 Oblique View of ( " ) and Ar Supply and Metering Section. 24
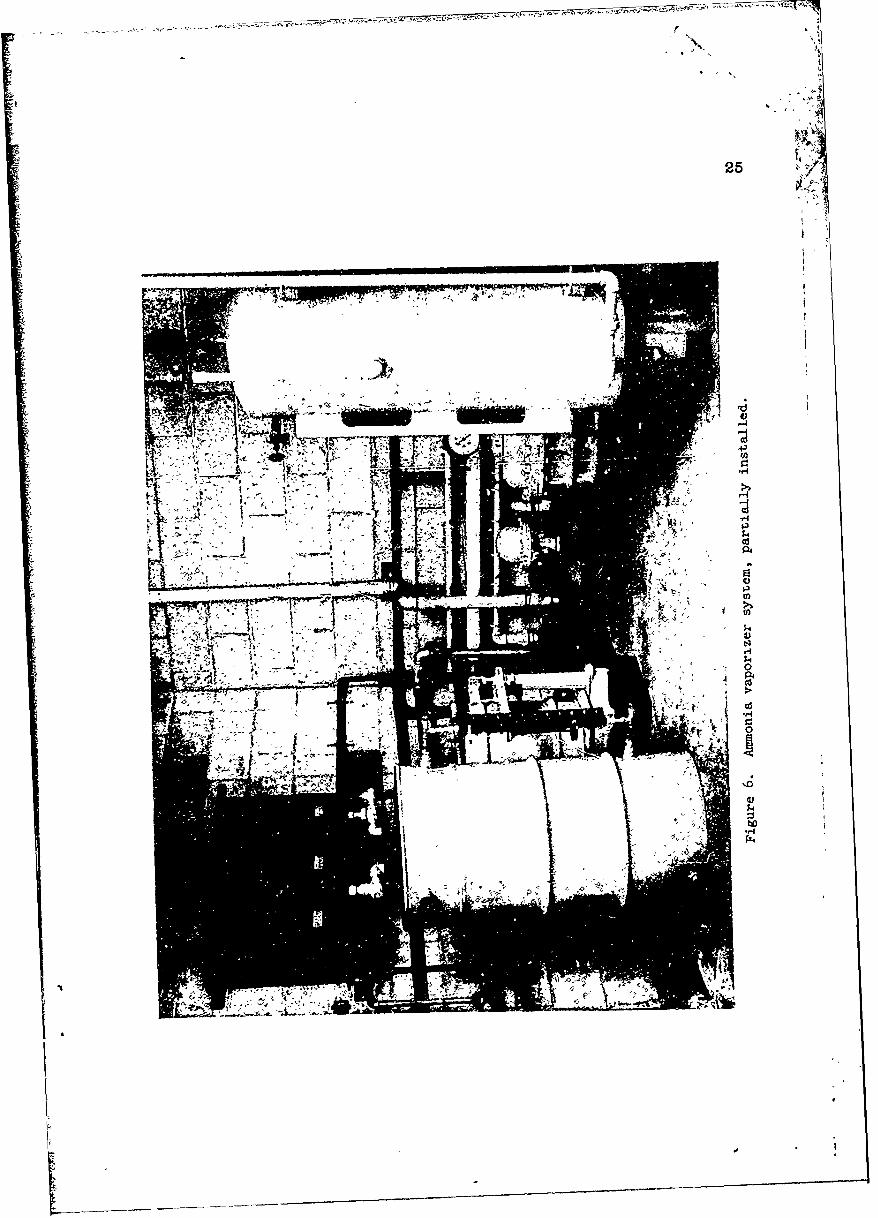
6 Ammonia Vaporization System, Partially Installed. 25
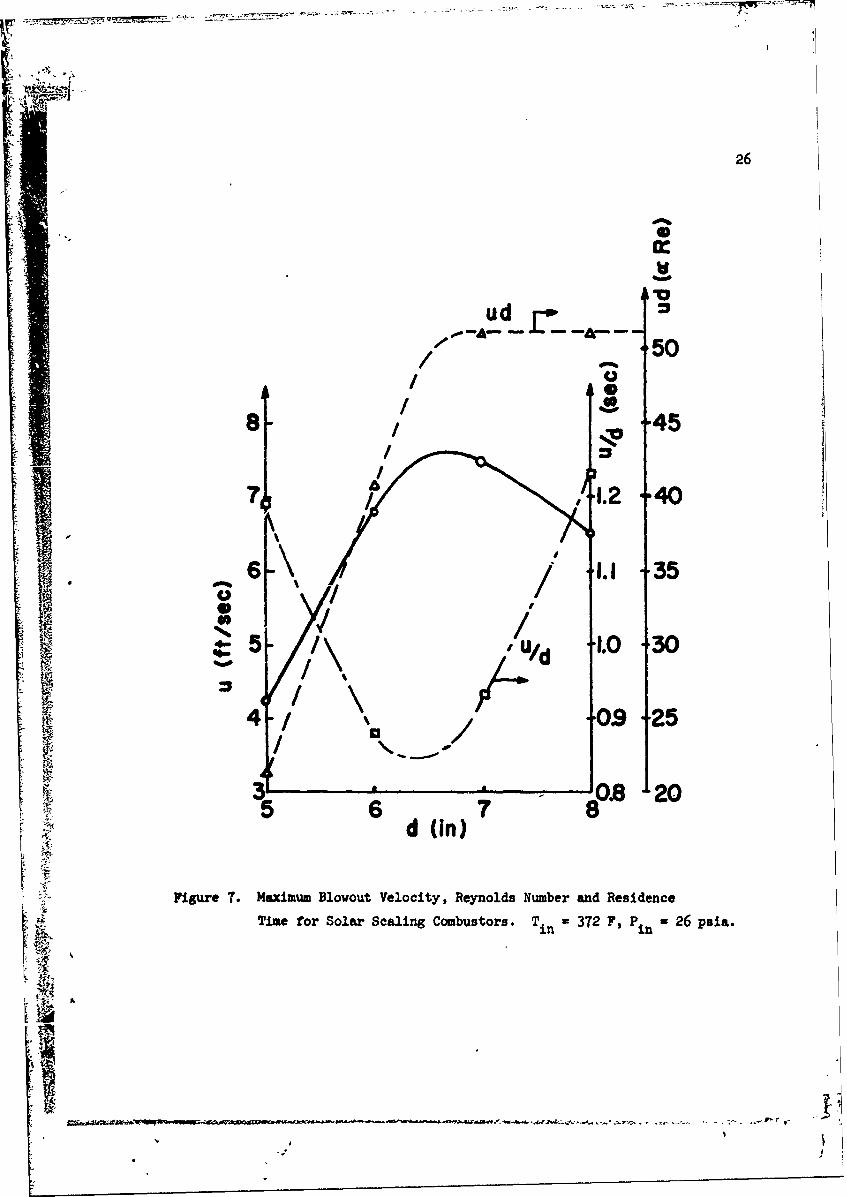
7 Maximum Blowout Velocity, Reynolds Number and Residence 26Time fox Solar Scaling Combustors. Tin 2 372 F, P = 26 psia.
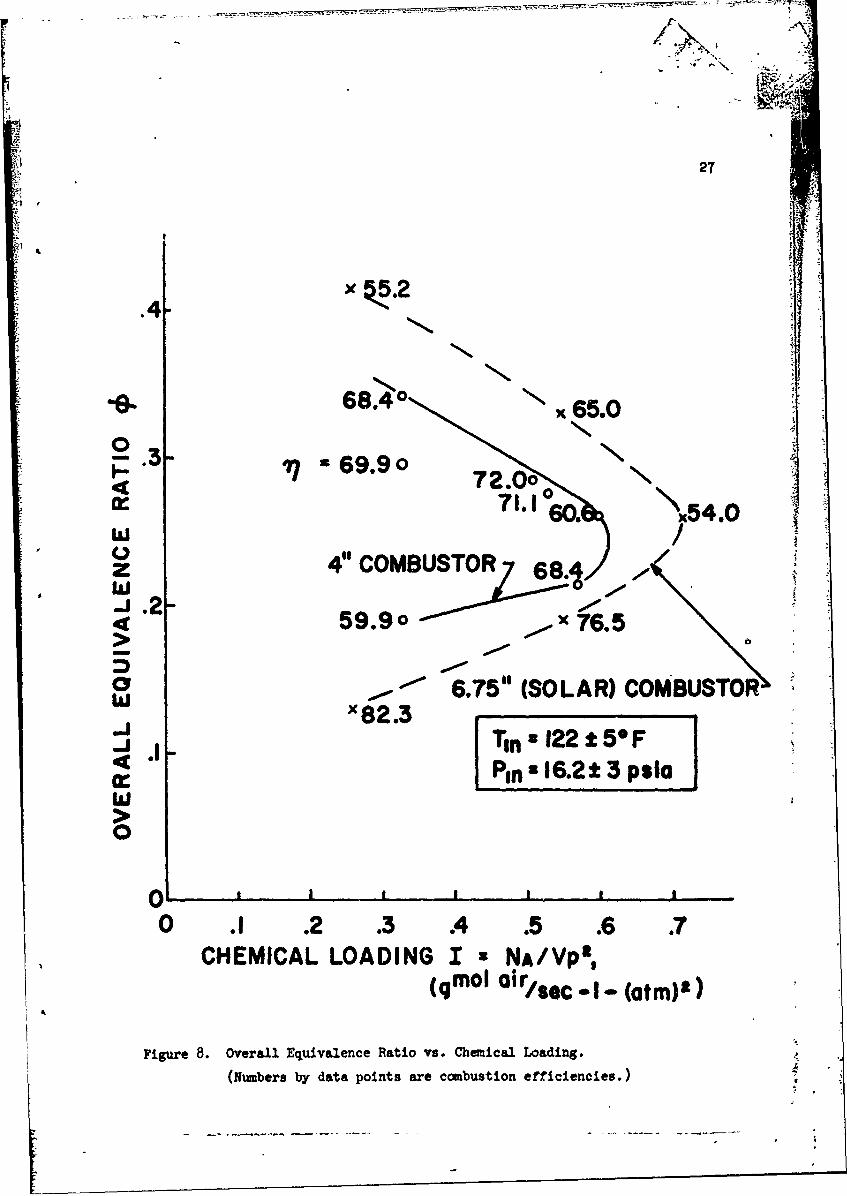
Chemical Loading vs. Overall Equivalence Ratio. Tin = 122 F, 27P in = 16.2 psi&.
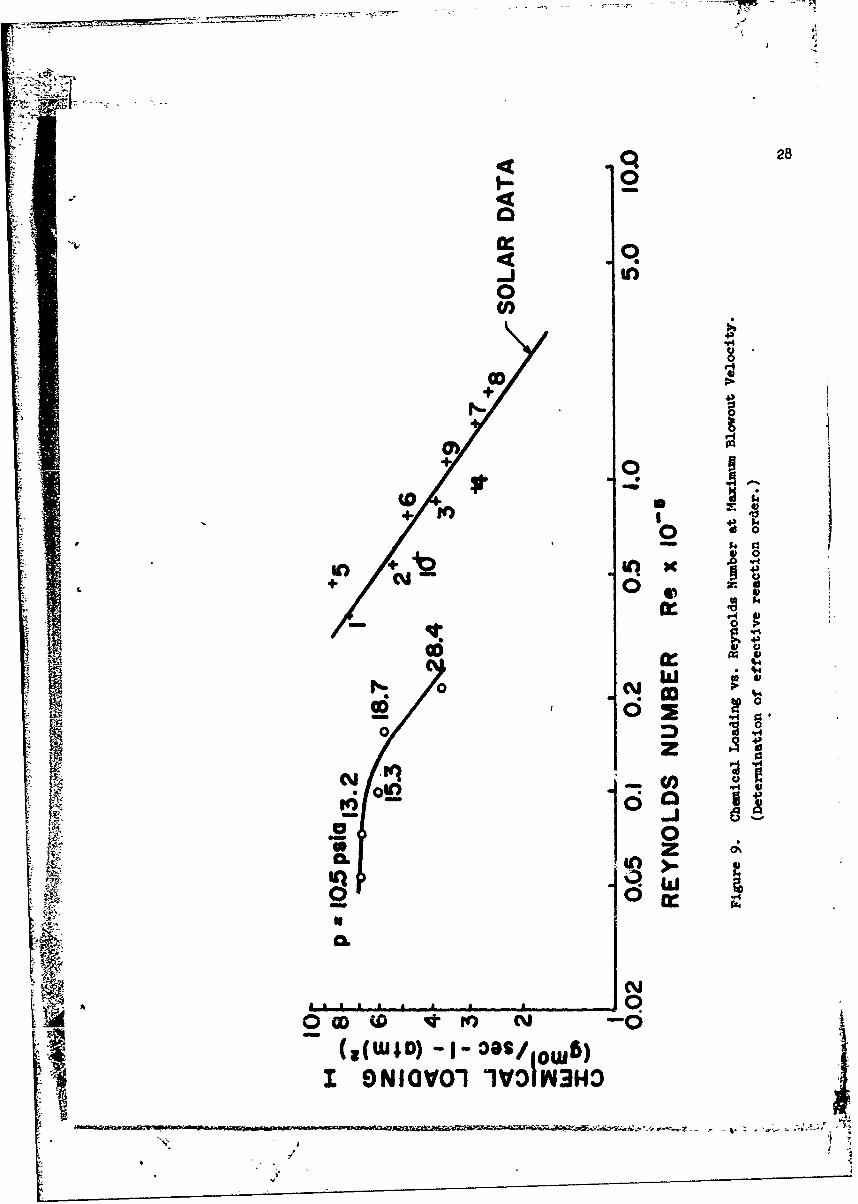
9 Reynolds Number vs. Chemical Loading at Maximum Blowout Velocity. 28(Determination of effective reaction order.)
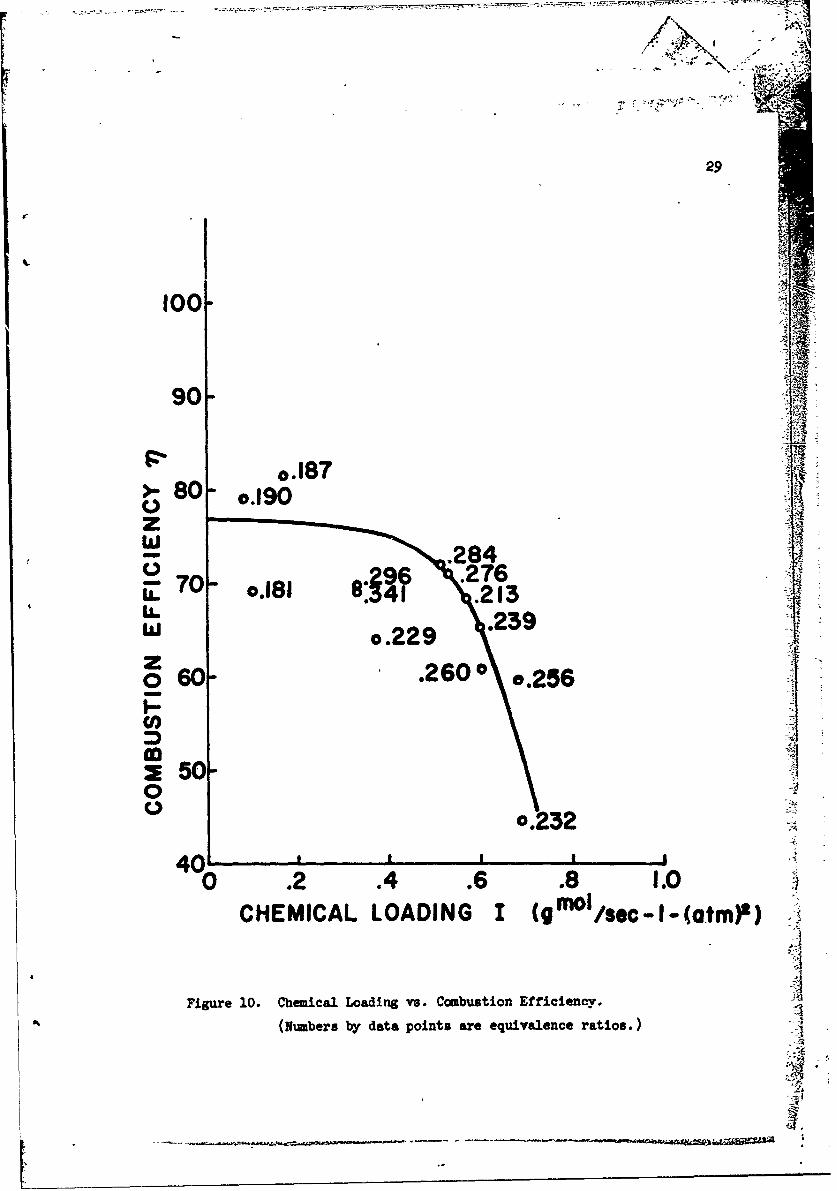
10 Combusticn Efficiency vs. Chemical Loading. 29
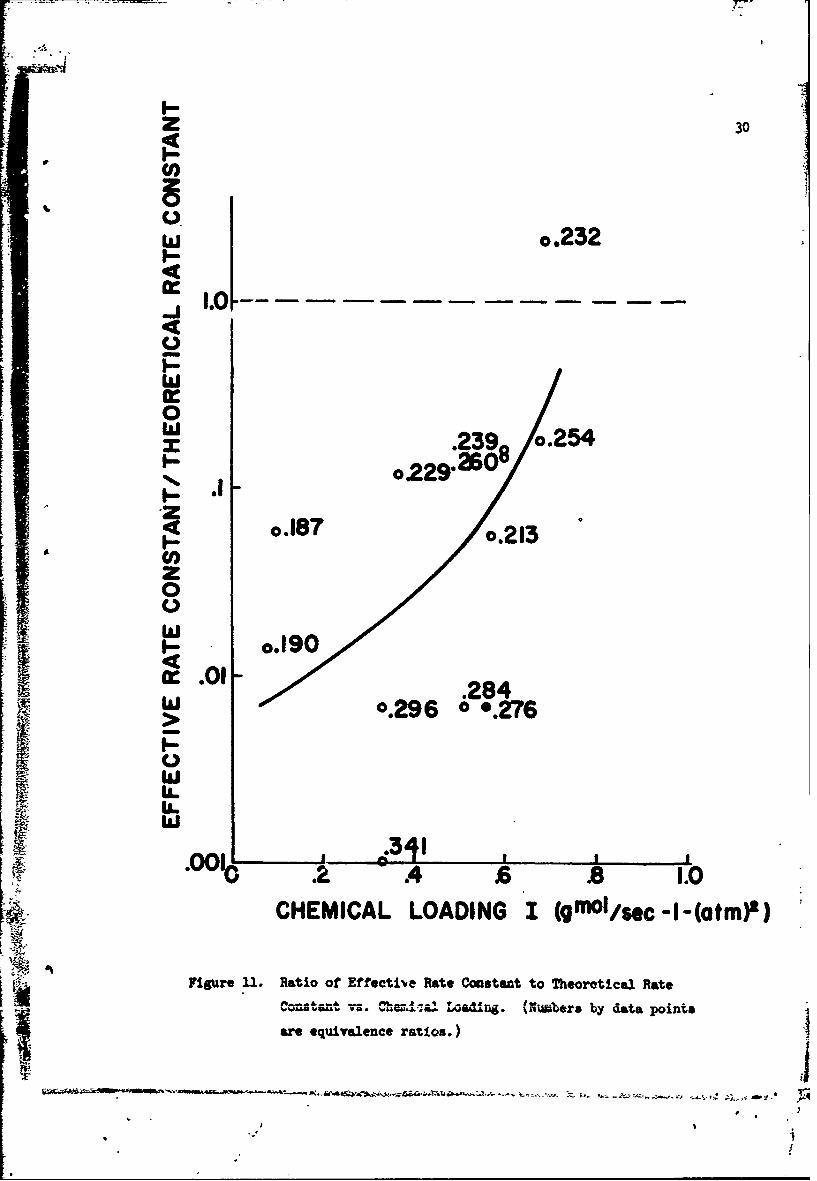
11 Ratio of Effective Rate Constant to Theoretical Rate Constant 30vs. Chemical Loading.
"'1
I. INTRODUCTION
9
This is the final report on research undertaken at the University of
California at Berkeley to investigate properties of ammonia as a fuel for
internal combustioi engines, under contract number DA-04-200-AMC-91(x) of
the Army Materiel Command. This report is concerned with problems of aero- ,
dynamical and chemical processes encountered in designing ammonia-fired gas Iiturbine combustion chambers. 12
In report number DA-0990-AMC dated 23 July, 1967, "Development of an
Ammonia-Burning Gas Turbine Engine," (Reference 1) the Solar company reported
difficulties in obtaining scaling laws required to predict performance of
scaled ammonia-fired combustors from performance data obtained from a proto-
type combustor. Specifically, it was st.ted that "at present, it is not
known whether velocity or residence time is the major influence." (p. 30,
Reference 1). The present investigation of this problem was undertaken along
two lines: first, to perform an analytical investigation of the results
presented by Solar, and second, to build a reduced-scale model of the final
configuration adopted by Solar, obtain performance data from it and determine
whether or not the theoretical conclusions concerning the model laws were
supported.
II. THEORETICAL ANALYSIS
1. Background. Model scaling laws have been only moderately successful for
liquid hydrocarbon-fueled combustors, due to nuch difficult-tc-scale phenomena
az carbon deposition and fuel atomization and distribution. However, gas-fired -
combustors, which lack these problems, are somewhat more amenable to theoretical
analysis. The final comoustor configuration adopted by Solar (Figure 1) is
4
* 2
especially "clean" from this standpoint; the very constrictive primary and
secondar7- air admission holes (necessitated by the relatively low approach
velocities) insure that the fraction of air in the primary zone is virtually
constant and predictable from design area ratios, and the open-tube fuel nozzle
(Figure 2) simplifies or eliminates nozzle-jet scaling problems.
2. Fundamental Modeling Considerations. In Reference 2, Spalding discussed
the general problem of modeling in combustion systems. He pointed out taat the
strict requirements of similarity are so numerous as to be impossible of ob-
taining. The limited success of modeling lies in the "art", that is, in
determining which dimensionless groups can be ignored.
Fifteen years of work by many investigators showed that in liquid and
gas-fired hydrocarbon-fueled combustors, similarity could be adequately modeled
by Reynolds number and a "chemical loading group", or ratio of residence time
to some measure of chracteristic reaction time. Strict application of these
criteria led to the formulation of "p-d" scaling, in which a geometrically
similar model and prototype vould be effectively similar if fired with the
same fuel at the same inlet te,.perature and pnuivalence ratio, and (if the
chemical reaction is ass,...od to be a second-order reaction overall) the same
primary zone velocity, and pressures in inverse ratio to the linear diameter or
characteristic dimensions. Scaling on the basis of "p-d" has been very
successfully applied to afterburners and ramjet combustors, but somewhat less
so to gas-turbine combustors. (2,3,4,5).
A description of the role of Reynolds number and chemical loading in
hydrocarbon-fueled gas turbine combustors was given by Herbert (3,6), in
which he concluded that for model and prototype with the same fuel, equivalence
ratio and inlet temperature, combustion efficiencies and blowout conditionsj could be correlated by
i(Re)b * const.
where I is the chemical loading group,
3 2I =ui/dp eu/pd
and Re the Reynolds number,
Re udp/i £ udp
and b is an experimentally determined constant.
Therefore
I(Re)b (pdu)b Ub+ (pd)bl,
and since the absolute value of the exponent or the entire group is of no con-
sequence, it is permisnible to take the "b+l"-th root of the expression:
~b-1
u(pd) = const.'
b-l_Denoting c-1,
the correlating group takes the form
d (pd)0 u const." (i)
with no loss of generality, where the exponent c reflects the influence of mixing
processes on the chemical loading: b a c - 0 imp]a.: ' hat the reaction is entire-
ly chemically limited. Herbert (3) gives b a c a 1 an upper limit. (Presumably,
if mixing processes were limiting, b * and c a 2. However, this regime is not
of much practical interest because the flow rates at which entirely aerolynamic
blowoff occurs are usually greater than those encountered in practical combustor
technology.) Therefore it is apparent that this correlation is applicable only
to high-output systems in which chemical loading plays an essential role, 45
modified by Reynolds number effects. Herbert pointed out that for Longwell's
stirred reactor (7), c a 0.2, while for some practical turbojet combustors,
c - 0.5. In theory, c should not be expected to be constant over a wide range
of operating conditions for any given reactor (the analysis of Reference B
in fact shows this variation), but Herbert concluded that, for the data at
handr Reynolds number was always sufficiently high that the nature of the
influence of mixing on chemical loading was more or less constant.
Alternately, the effect of the exponent b or c is often expressed as the
"effective reaction order" for the overall chemical reaction, defined as follows:
Rewriting equation (1) in terms of the mass or molar flow rate 2,
( u =_.... a = const.,,(pd) l c pd 2(pd)l c d3-Cp 2 - c
and if the primary zone volume is substituted in the expression in place of
the combustor diameter,
3z3 _ 3 ,,
cc d3-cp2-c " -C/3p2-c = const.
Identifying the exponents of V and p as m aid n respectively,
- const. (2)Vmpn
where b, c, m and n correspond as follows:
b c m na 2b/b+l a bc/c(b+l) = 2/b+l
0 0 1 21 1 2/3 1
K 2 1/3 0
and n is called the "p.-essure exponent" or "effective reaction order."I!
' i.
j 5
All of the above theory and experiment was carried out specifically for
aydrocarbon-fueled combustors, and should not be expected to hold rigorously -
for ammonia-fueled combustors, since both laminar and turbulent flame speeds
for ammonia have long been known to be much smaller than for hydrocarbons,
(9,10), indicating a significantly slower chemical reaction. In particular, it
is to be expected that slower reactions would require lower combustor velocities
and hence lower Reynolds numbers, which in turn suggests that the exponent c
might be strongly variable for ammonia-air combustion systems over a wide range
of operating conditions.
3. Application to Solar's Scaling Tests. To evaluate scale effects, Solar -
tested 4 combustors of liner diameter 5, 6, 7, and 8 inches (Figure 9 of
Reference 1), all apparently housed in an 8.5-inch outer casing. Their performance Iresults are summarized in Figure 10 of Reference 1. From these results, 6.75 inches
was chosen as optimum liner diameter. Solar reported that "There is no obvious
explanation of the relative vertical shifts of the steoility loops or of the
reduced loop obtained with the 8-inch diameter combustor."
Since inlet pressure and temperature are fixed, for this data,
Re a ud
and
I c u/d= (mran residence time)-
The latter expression holds only if the fuel-air equivalence ratio and combustion
efficiencies are constant. If the "nose" of each stability loop is regarded ast i
the data point for comparison, then the primary zone fuel-air ratio may be assumed
to be near the stoichiometric value, or an equivalence ratio of unity (6). Howeve: ,
no data are given concerning combustion efficiencies.
The following values are readily obtained from Figure 10 of Reference 1:
6
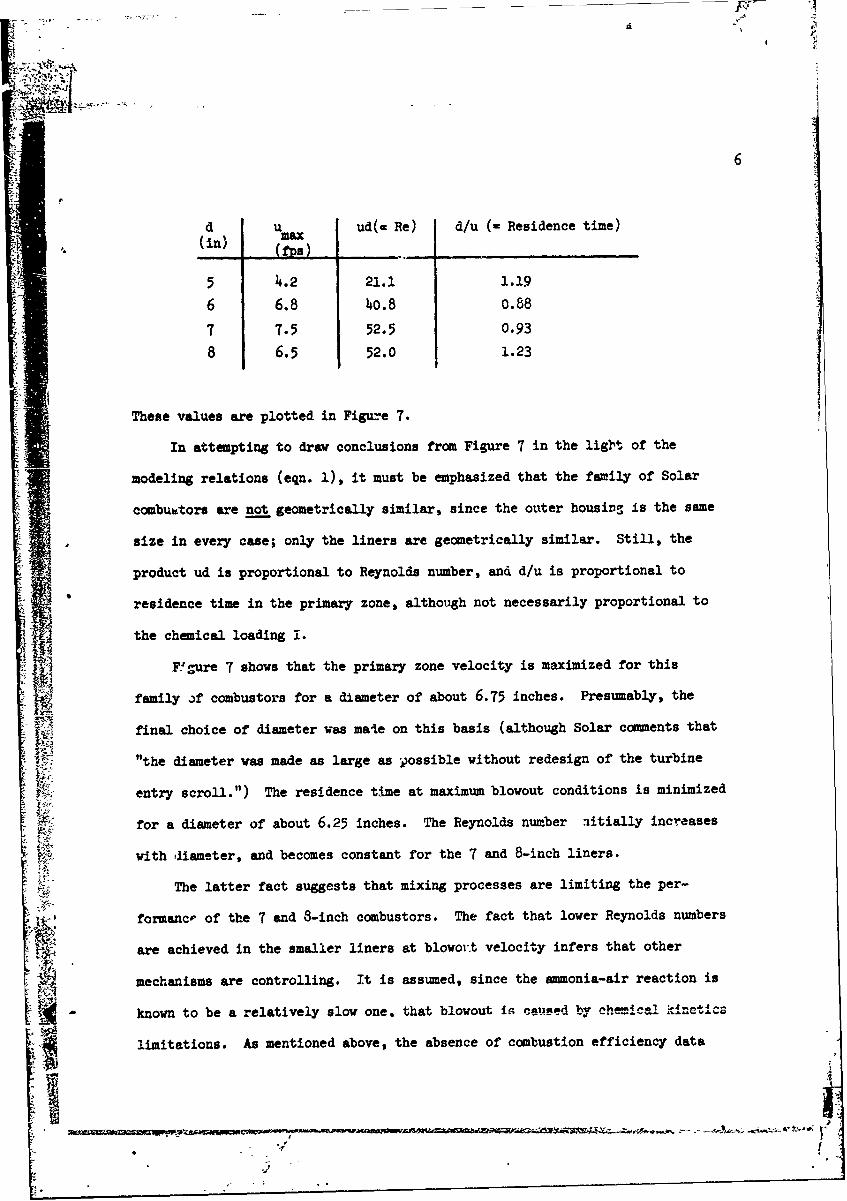
d u ud(- Re) d/u (= Residence time)(in) max
5 4.2 21.1 1.19
6 6.8 14o.8 0.88
7 7.5 52.5 0.93
8 6.5 52.0 1.23
These values are plotted in Figure 7.
In attempting to draw conclusions from Figure 7 in the ligbt of the
modeling relations (eqn. 1), it must be emphasized that the family of Solar
combuutors are not geometrically similar, since the outer housino is the same
size in every case; only the liners are geometrically similar. Still, the
product ud is proportional to Reynolds number, and d/u is proportional to
residence time in the primary zone, although not necessarily proportional to
the chemical loading I.
F!.-ure 7 shows that the primary zone velocity is maximized for this
family )f combustors for a diameter of about 6.75 inches. Presumably, the
final choice of diameter was male on this basis (although Solar comnents that
"the diameter was made as large as possible without redesign of the turbine
entry scroll.") The residence time at maximum blowout conditions is minimized
W" for a diameter of about 6.25 inches. The Reynolds number aitially increases
with diameter, and becomes constant for the 7 and 8-inch liners.
The latter fact suggests that mixing processes are limiting the per-
formancr of the 7 and 8-inch combustors. The fact that lower Reynolds numbers
are achieved in the smaller liners at blowor t velocity infers that other
mechanisms are controlling. It is assumed, since the ammonia-air reaction is
I known to be a relatively slow one, that blowout is ca_-ed b1y chemical kinctics
limitations. As mentioned above, the absence of combustion efficiency data
I
V
7
orecludes a direct conclusion concerning the chemical loading, but there is
nothing apparent in the data to contradict this conclusion.
It would seem, then, that for the ialet temperature and pressure at which
the tests were made, a liner smaller than about 6.5 inches is primarily chemi-
cally rate-limited at maximum blowout velocity. For larger diameters, the
blowout velocity is primarily diffusion-limited. While the design details of
the final liner configuration are different from those used in the series of a-model tests, it is probabi3 that chemical kinetics and turbulent mixing pro- 1cesses are of approximately equal importance, at least for inlet pressures and
temperatures near those of the scaling tests: P = 26 psia and T s 3700 F. If
this is the case, one would expect a value of approximately unity for the
bexponent b in the correlating group I(Re) const.
A plausible explanation for the vertical shift of the maximum blowout
points is as follows: The upward shift from 5-in to 6-in could be simply due
zo the fact that the increased liner frontal area, with the housing area constant,
entrained more primary air. Thus an equivalence ratio of unity in the primary
zone would correspond to an increased overall equivalence ratio. The downward
shift from 6" to 7" to 8" is somewhat more puzzling. However, if the mixing
processes are becoming less efficient with increased diameter (i.e., unable to
properly mix cold reactants and hot products, causing extinction), more of the
primary air would pass through unreacted. Thus an increase of primary air/fuel
ratio (required to achieve an equivalence ratio of unity in the fraction of air
that reacts) would lead to a reduced overall equivalence ratio. This behavior
b = 1 in effect gives equal weight to chemical and aerodynamical processes. 'The difference between this and "p-d" scaling is that b 1 requires only -,Athe nroduct I(Re) c Vnt., W,1.1.e p-d" scaling requires I * const. andRe a const.2 independently.
2
8
is consistent with known effects of increasing liner diameter (with fixed housing
diameter) on jet penetration and mixing in parallel-walled combustors with flush
secondary air holes (1i).
4. Chemical Kinetics for Homogeneous Gas-phase Chemical Reactions. Assuming
complete homogeneity in the primary reaction zone and second-order chemical
reaction, the theoretical dependence of chemical loading on equivalence ratio *,
inlet conditions and oxygen (or fuel) consumption efficiency c is readily
obtained from stoichiometry (for the particular reaction of interest) and basic
definitions of reaction rates in a perfect-stirred reactor (7):
NA k *42.8 14 ( - YC)( -yc) g mol
(7T)2 y:[4, + 14.28 + y ]2 cc-sec-atm
e yif < 1 and k a014.61 ,-38,7000) ,.c
wl if exp( RT g mol-sec
from Reference 12, and T is the actual reaction zone temperature, obtained from
the energy equation with equivalence ratic- fuel consumption effiziency and
inlet T and P.
In practice, the loading I can be obtained experimentally, the reactant
consumption efficiency e calculated from measured temperature-rise combustion
efficiency n, equivalence ratio, and the assumption that incomplete combustion
results in the presence of unburned fuel alone (an assumption strongly supported
by the odor of ammonia in the exhaust quenching water). The above equation can
then be solved for an effective rate constant Leff which can then b.- compared
with the value from Reference 12 also cited above. The ratio keff/ktheo then
serves as an index of how close the blowout point is to being chemi,:ally
1 ,4.
9
III. EQUIPMENT
1. Combustor. The combustor liner was a 3/5-scale model of the final design
adopted by Solar, as shown in Figures 1 and 2. The housing was a 5.1 inch I.D.
Pyrex "Double-Tough" pipe, 16 inches long (Figure 4). To avoid penetrating
the wall of the Pyrex housing, the fuel was introduced through a 5/16 inch
Inconel .,ozzle shown in Figure 2. Ignition was accomplished by a spark-iguited
propane torch. The propane was introduced to the primary zone of the combustor
through En 8 mm quartz tube on the axial centerline of the assembly, the tube
terminating Just inside the upstream end of the liner, facing the fuel nozzle
opening. The ignition spark was supplied from a 120/12,000 volt AC transformer,
with the electrode passing down the center of the 8 mm quartz propane tube. The
spark gap was about 1/8 inch, from the electrode to the inner wall of the
grounded liner. Propane and ignition spark were used only briefly to ignite
the ammonia-air mixture. No data were taken with propane flow and/or spark
energized. 241
2. Fuel Supply and Metering. The ammonia was vaporized in a steam-water bath
(Figures 3 an-i 6), the rate of vaporization and hence the vaporization pressure
being controlled by the rate of heat supply and fuel flow. Meteving was accom-
plished by &a aJr-c&Jlibrated Fischer-Porter "Stable-Vis" rotameter immediately
downstream of a pres:;ure regulating valve (Figure 3). The rotameter float was
chosen for its insensitivity to viscosity changes, hence only density corrections
were required to the %ir-calibrated apparent flow rate. Density was determined
from the vaporization .d delivery pressures of the pressure regulator, a pressure-
enthalpy diagram for atmonia, and the assumption of an equal-enthalp- throttiliag
process across the regn-±Lator. (This calculation was performed in the data re-
duction program.) A solenoid valve was installed in the fuel line to permit
quick shutdown, and a temperature-sensor in the exhaust line was preset to actuate
10
the valve at 325 F in the event of failure of the cooling water system. Coarse
control was achieved by the pressure regulator setting, and fine control by a
nefdle valve immediately prior to entry into the combustor housing.
3. Air Suvoly and Metering. Air was obtained from house air supply, fed by
a single compressor which supplIed 415 SCFM at 100 psig. After regulation to
desired pressure, the air passed through a 0.6 inch diameter sharp-edged orifice
in a 2.5 foot section of 2 inch rlpe, then through a positive displacement meter
(which could be bypassed for high flow rates), through a fine and coarse control
valve, and finally into a 5-foot long approach section of 5 Inch steel pipe
containing six 220 volt 6 KW air heaters (calrod units) extending 4 feet into
the approach section and covered with 1 inch of "Kaolin" insulation. The six
heaters were individually switched, and one was connected to a "Variac" trans-
former to allow fine temperature control for fixed air mass-flow rates. A
pitot-tube rake assumbly of three tubes, located on area-centerlines of three
equal areas, was installed at the exit end of the air approach section.
4. Instrumentation. All temperatures were reasured with Chromel-Alumel thermo-
couples, of simple exposed-Junction type, except for the three hot gas measuring
thermocouples, numbers 3, 4, and 5. These three were radiation-shielded by an
open tee-shield of i/ 4-inch Inconel tube, so that the junction did not "see"
the cold walls of the exhaust gas section. Thermocouple output emf's were read
from a Wheatstone-bridge null-balance potentiometer to the nearest one-hundredth
of a millivolt.
All static prcsures were measured with standard process-grade Bourdon
pressure gages; pressure differentials were measured by U-tube manometers with
fluids appropriate to the pressure differential level.
,V. EPERIKEWTAL PROCEDURE
Blowout data were obtained by first fixing the inlet air mass flow rate
and temperature and then adjusting the ammonia flow rate until either rich
or lean blowout occurred. The pressure level was then readjusted to the desired
value while burning just below blowout conditions. This procedure was repeated
typically three or four times until a reproducible stable burning configuration
was obtained with the desired values of inlet conditions and mass flow rate, j
such that a small increase in air flow rate would cause blowout. In many case., .5
blowout would not occur for as long as two minutes after adjustment from atable
burning, a time lag being required for low frequency pulsations to grow' in aapli-
tude until the flame was finally extinguished.
Maximum blowout date were obtained in the same manner, except that the
air flow rate was advanced on each trial until there was no distinction between
rich and lean blowout; that is, a single blowout point was obtained for the
fixed inlet mass flow rate of air.
For each stable blowout point, temperatures were monitored until no time
variations occurred, at which time all thermocouple outputs, pressures, and
mass flow rates of air, fuel, cooling water and condensate were recorded.
(Measurements of the latter two quantities, along with their respective tem-
peratures and pressures, were used to check the observed gas temperatures by
performing an energy balance on the system.)
I
V. EXPERIMENTAL RESULTS
1. Rich and lean blowout data were obtained for the 3/5-scale combustor at
the same in2et temperature and pressure as the Solar prototype operhcing at
25% load. Results are presented as overall equivalence ratio vs. chemical
loading (Figure 8). The stability loop obtained fits slightly within the
Solar data loop. The maximum loading was .60, compared to 0.72 for the Solar
combustor. The data obtained give the following ratios at maximum blowout:Re2 12- a0.29 and- .83, where 2 denotes tne smaller combustor. The maximumRe1blowout velocities were V1 = 11.4 fps and V2 = 5.5 fps.
All blowout points were characterized by low-frequency pulsations (1/2
to 1 Hz), most strongly with lean blowout conditions, which made accurate
determination of blowout limits difficult. The data presented in Figure 4
represent stable burning, hence may be considered to be conservative. This Fobservation is strengthened by the fact that the maximum blowout combustion
efficiency was greater for the smaller coubustor than for tie prototype. Other
investigators also reported low frequency pulsations at some lean blowout
conditions (1,10). The presence of low-frequency acoustic instabilities in
three independent sets of data indicates an - :ortant problem area in which
little work has been done (13). There is reason to suspect that the solution
at- to this problem lies in redesign of the fuel nozzle.
2. To Investigate further the relative influences of Reynolds number and
chemical loading, a series of tests Vas made with a constant inlet temperature
of 122 + 2 degrees F, varying the pressure and obtaining values of chemical
loading, Reynolds number, equivalence ratio and combustion efficiency at maximum
blowout conditions. The results of these tests, as well as the same data
inferred from the Solar data, is presented as Figure 9, for which the slope of
the best-fit line through the data points is the exponent b referred to earlier.
. -. .. . - 2
13
The Solar data, which represents a wide range of inlet temperatures and pressures,
are fit well by a value of b = 0.7, which corresponds to an effective reaction
order n = 1.18. For the smaller combustor, a distinct change of slope is evident,
decreasing from b = 1 (n = 1) to b = 0.7 (n = 1.18) as the pressure was decreased from
28.4 psia to 10.5 psia, clearly indicating a transition from chemical and mixing
limiting to purely chemical limiting at sub-atmospheric pressures. Fuel mass
flow limitations prevented obtaining data points for higher Reynolds numbers
(and pressures) at stoichiometric equivalence ratio.
3. Combustion efficiencies for all data points collected are plotted vs.
chemical loading in Figure 10.
4. Effective rate constants were calculated from collected data end the ratio
of effective rate constant to theoretical rate constant at measured temperature
(with values from Reference 12) are plotted versus caemical loading in Figure 11.
VI. ANALYSIS OF RESULTS
1. Solar Performance Data. Performance of the 6.75-inch diameter liner designed
by Solar was presented as primary zone velocity vs. temperature rise (Figures 13
through 22 of Reference 1), from which chemical loading I and Reynolds number at
maximum blowout conditions were readily obtained. These values are plotted in
Figure 9, from which the slope of the log-log plot gives a value of 0.7 for the
exponent b of equation (1), and hence a value of c = 2b/b+l = 0.83 and effective
reaction order n = 2 - c = 1.18, which implies that chemical kinetics and mixing
effects are of about equal importance in determining maximum blowout. Since
values of of O.'5 to . . .7 have been reported for non-premixed hydrocarbon-fueled
combustors (3,8), this suggests that there is perhaps room for improvement for the 4effectiveness of the mixing processes in the Solar designed combustor. The fact
that lower flame speeds require lower velocities and hence less efficient mixing
processes is reflected in Solar's design by the fact that the ratio of secondary
air hole area to housing cross-sectional area is only 0.114, compared to a value
of typically 0.8 for a hydrocarbon-fueled combuotor. The result ia that the
pressure loss is still about of the same order of magnitude as with a hydrocarbon
ccmbustor; if it were necessary to use this liner for burning hydrocarbon fuels,
the pressure loss would be unacceptably high.
2. Combusticn Efficiency. Figure 10 shows a decrease in combustion efficiency
with increased chemical loading, as should be expected. The highest combustion
efficiency recorded was 83% at very low loading. Apparently, the mixing pro-
cesses are not efficient enough to produce high combustion efficiencies. These
values were influenced by non-uniform temperature gradients in the outlet station,
where the three temperatures recorded at the same axial station showed differences
of as much as 1000F in the cross-sectional outlet stream. Typically, the station
at 12 o'clock (facing downstream) was 75 to 100OF cooler than the stations at
8 o'clock and 5 o'clock, which were usually within 250F of each other. Thermo-
couple error was suspected, but interchanging thermocouples confirmed that the
temperature differences were real; the upper portion of the exhaust stream was
consistently cooler than the lower part in every run. However, this could not
have affected values of combustion efficiency by more than + 5%. Since the
surface-to-volume ratio of the model was 5/3 that of the Solar combustor, it
would be expected that flame quenching at the liner walls would lead to a lower
combustion efficiency. On the other hand, the smaller combustor would be
expected to have somewhat more efficient mixing processes, due to the smaller
scale of turbulence and the reduced radius of the liner into which mixing jets
must penetrate. In fact, these scale effects apparently did not affect the
results greatly, as Solar reported similar values of combustion efficiencies
- 'I} '
15
for the same inlet conditions. However, from the Solar and Allison reports itlappears that combustion efficiencies increased markedly with increased inlet
temperature, values in excess of 100% having been reported by both groups (1,10).
3. Effective Reaction Order. At present, the chemical reaction of amonia with
oxygen in the presence of nitrogen is thought to be an overall second-order
reaction (5). Therefore, the effective reaction order n is a direct measure of
the relative influence of chemical and aerodynamical processes in determining the
efficiency of reaction completion, as explained earlier. The Solar data is
shown in Figure 9 to correlate very well with an effective reaction order of 1.18,
which indicates about equal influences of chemical and aerodynamic processes at
blowout conditions. The model data shows this trend at atmospheric pressure and
higher, but shows a rapid transition to almost completely chemical control at even
slightly sub-atmospheric pressures.
4. Effective Rate Constant. It is apparent from Figure 11 that, for a given loading,
the effective rate constant is nearer the theoretical chemical value for small
equivalence ratios. This is because the abundance of oxidizer makes intimate con-
tact of fuel and oxidizer more likely, and less fuel passes through the combustor
inreacted. While the results are considerably scattered, which in part reflects
the many assumptions required to calculate the.m, the overall trend is of great
importance: as loading increases, the rate constant gets closer to the theoretical
or homogeneous mixing value.
-S
16
VII. CONCLUSIONS
I. Scaling. Both scaling tests conducted were less than perfect: Solar's
lacked geometric similarity, and the present tests were not performed on the
same test rig as- the Solar tests, so that only tentative conclusions can be
drawn:
A. For diameter scaliog, the model can be expected to have the same
stability limits as the prototype when both are operating at the same inlet
temperature, pressure and equivalence ratio, and at the same value of chemical
loading I.
B. For a given qombustor, with varying inlet pressure and temperature,
but with a fixed equivalence ratio, flame extinction or blowout will occur at
0.7the same value of I(Re)
2. Combustion Efficiency. Values of combustion efficiencies measured, at
air inlet conditions Qf 1220F and 16.2 psa, even for low loadings (i.e., far
from blowout condition), were unacceptably low for gas turbine cycle operation.
This, with the fact that aerodynamic processes were observed to play a co-equal
role with chemical kinetics in limiting operation of the combustor f6r, atl.....
inlet temperatures and pressures, indicates a major problem in mixing fuel,,
air and hot products in the primary zone. These mixing processes are obviously
muu.h less effective than in a hydrocarbon-fueled combustor, and will probably
require some moderately extensive development to become optimized. Because of
the much lower flame speed of the ammonia-air reaction (compared to hydrocarbons),
new ad unique techniques may be required to achieve this mixing.
17VIII. NOMENCLATUREI I
b Influence exponent, defined in Section 11.2.
c 2b/b + 1.
d Diameter.
I Chemical loading. I (g mol/cc-sec-atm2).
k Chemical-kinetic rate constant, defined in Section I.1..
Mass flow rate.
N Molar flow rate of air, gram-moles/sec.
NA
n Effective reaction order or pressure exponent, defined in Section 11.2.n = 2/b + 1.
P Absolute pressure.
Re Reynolds Number. Re ud.
T Temperature.
u Velocity.
V Volume of primary reaction zone.
Reactant consumption efficiency. (c - 1 implies reaction has goneto completion. )
Combustion efficiency, defined as ratio actual temperature increaseto maximum theoretical temperature increase.
*Fuel-air equivalence ratio, defined as ratio of actual fuel-airratio to stoichiometric fuel-air ratio. I
11 Viscosity. -
REFERENCE
1."Development of an Ammonia-Burning Gas Turbine Engine," Report No. DA-44-O09-AMC,Solaro Inc., July 1965.
2. Spalding, D. B., "The Art of Partial Modeling," 9th Symposium on Combustion,Academic Press, 1963.
3. Herbert, M4. V., "Aerodynamic Influences on Flame Stability," Progress inCombustion Science and Technology, Vol. I, Pergamon Press, 1960.
14. Stewart, D. G. and Quigg, G. C., "Similarity and Scale Effects in RamjetCombustors," 9th Symposium on Combustion, Academic Press, 1963.
5. Lefebvre, A. F, and Halls, G. A., "Some Experiences in Combustion Scaling,"Advanced Aero, Engine Testin, Pergamon Pres3, 1959.
6. Herbert, M. V-, "A Theoretical Analysis of Reaction Rate CotrolledSystems - Part I," A1GARD Combustion Researches and Reviews 1957, ButtervorthsScientific Publications, 1957.
7. Longwell, J. P. and Weiss, '4. A., "High Temperature Reaction Rates inHydrocarbon Combustion," Journal of Industrial and Engineering Chemistry,vol. 47, No. 8, 1955.
8. Childs, J. H. and Graves, C. C., "Correlation of Tuxeoine-Engine CombustionEfficiency with Theoretical Equations," 6th SMsium on Combustion,Reinhold Publishing Co., 1957.
9. Samuelson, G. S., "Flame Propagation Rates in the Combustion of Ammonia,"1Report No. Ts-65-'. (DA-0l-20G-AMC-91(x)), University of California,Berkeley, 1965.
10. Verkazxp, F. J., Hardin, M. C. and Williams, J. R., "Ammonia CombustionProperties and Performance in Gas Turbine Burners," lith Symposium onCombustion, The Combusti on Institute, 196T.
11. Graves, C. C. and Grolmian, J. S., "Theoretical Analysis of Pressure Lossand Airflov Distribution in Tubular Parallel-Walled Turbojet Combustors,"1NACA Report 1373, 1958.
12. Sawyer, R. F., "The Homogeneous Gas Phase Kinetics of Reaction Rates inthe Hydrazine-Nitrogen Tet:.-uxide Propellant System," Ph.D. Thesis,Princeton University, !965.
13. 'Ifg M. W., "A Non-acoustic Theory of Oscillations in Presasure-jetOil-fired Combustion Chambers," 7th Symposium on Combustion, ButterworthsScientific Puiblications, 1959.
19
OV- 2- - -9-
z ft.4
* O~ol*aleowc
(0
40 a w s 4
00
-
0U
ow
oPd
- ~dG*
20
4:'
4
I
u a m
-t K'"
*i, Figure 2a. 3/5-Scale model of Solar Combustor and fuel nozzle. .D. =4.04 in.--
k•
.
-
-
21
Figure 2b. 3/5-Scale model of Solar Combustor w..th fuel nozzle installed.
51,
~224
0 = .4 130 o qx I-
0 #% 0 W CL 0
- J Ix0
0 40z%.0 - -
. ou 0.It 49
0) w 0
0 z
Wcr W
4L I-
w ~ -w0________00 ~ li 0
-~ A w ~ -- ~I
23
4
wl4,
jl 24
.44
0L
0 4
4 - ---- t- n
VC,4
rt0
- _ -~-~-- - -~.- --- 25
i T-;
1.41 7 .....
26
go
ud £ _ -
-A4- -A-/ 50
048 / 4
! 'I A '1.2 ,-40
I- , 1.0 30
a /
"4-/ ..09 -25
5 6 78d (in)
Figure 7. Maximum Blowout Velocity, Reynolds Number and Residence
Time for Solar Scaling Combustors. T in 32 F, P in 26 psia.
IiA
27
084bE /z4" COMBUSTOR 64 - /
n2 59.9o x 76.5720
w6.75" (SOLAR) COMBUSTOR
X82.3.. I Tn a 122 t 5 F4-ol Pin 16.2t 3 psio
wi
0
1 ,O .1 .2 .3 .4 .5 .6 .7
CHEMICAL LOADING I x NA/Vp',NMol air/Sac .I,. (WWm)
Figure 8. Overall Equivalence Ratio vs. Chemical Loading.
(Numbers by data points are combustion efficiencies.) 4
4 28
I.- 041
44
0 C
to
z Ch060
060
ow w
( W 0 -I 61o$
I~ ONOV WVI4H
29
100-
90 4
z
7'0- 0.181 .7
28R .2621325
0C.:
p 0. 32
Ae
CHEMICAL LOADING 1I 9 /a OWt
Figure 10. Chemical Loading vs. Combustion Efficiency.
(Numbers by data points are equivalence ratios.)
I-2 30
,., o.232
w
I-
.. 1.0 - - -a a a a
0mp
0:ii: .239,8 o.254I-o2~
o
01- .21-
Z o.187 o.213I-
0
C.,
U.
.28
S.%.00 .311 1s .I J
c' .4 S 1.0CHEMICAL LOADING I (gmi/sec-iatm)a)
Figure 1. Ratio of Effectiwe Rate Constant to Theoretical Rate
Consant i . CV.%"a Loading. (Nu&b,6r by data points
are equivalence ratios.)
-* z I9!