Embed Size (px)
Citation preview
College Hockey & Scholarship Opportunities ScholarshipStats.com
168 schools sponsored varsity level Ice Hockey teams during 2015:
Athletic Scholarships Average Athletic Number Number of teams Varsity Athletes (1) Average team size limit per team ** Scholarship (2) Division of Schools Men's Women's Men Women Men's Women's Men Women Men Women NCAA I 61 60 36 1,649 869 27 24 18 18 $ 14,945 $ 14,456NCAA II * 8 7 5 204 95 29 24 13.5 18 $ 4,840 $ 5,880NCAA III 81 79 59 2,314 1,341 30 23 - - $ - $ -NAIA 10 10 3 343 58 34 19 - - $ 5,720 $ 6,920NJCAA 8 7 1 157 12 22 12 16 - $ 501 $ 677Totals 168 163 104 4,667 2,375 29 23 $ 5,914 $ 5,871
(1) Varsity Rosters may include redshirt, reserve and/or practice squad players and do not reflect club or intramural participants. * Hockey teams at most NCAA II member schools compete at the NCAA I level.
** Ice Hockey is an equivalency sport for NCAA scholarship purposes, so partial scholarships can be awarded (up to 30 per team in NCAA Division I) tomeet the limit per school. For example, an NCAA Division I school can award 27 ice Hockey players each a 2/3 scholarship and still meet the limit of18 per school. Ice Hockey is not an official NAIA sport. NAIA member institutions with varsity hockey programs compete in the American CollegiateHockey Association (ACHA) which includes both varsity and club programs from US colleges nationwide.
(2) Average Athletic Scholarship is the average award per athlete for ALL varsity sports sponsored by the specific school. Some athletes receive fullawards, some receive partial and many receive none. Additionally some sports within a school may be fully funded, some partially and some sportsprovide no athletic scholarships. Private schools generally have higher tuition than public schools and the average award will reflect this.
2016
Odds of a high school athlete playing College Hockey * Men WomenNumber of US High School Hockey players 35,875 9,418Number of US College Hockey Players (See table above) 4,667 2,375% of foreign students playing NCAA Hockey * 21.0% 26.9%% of US High School Players competing at any College level 10.3% 18.4%% of US High School Players competing at NCAA I Schools 3.1% 5.1% * See our page on the chances of a High School Athlete playing in College for more information.
New Data! 2016 Athletic Scholarship Averages for NCAA I Hockey teams
The following are the results of our 2016 survey of NCAA I schools that sponsored varsity hockey teams during their 2015-16 fiscalyears. The results reflect the average number of athletic scholarships and the average award by responding schools, as well as thelow and high range for the number and average amount of scholarships awarded per team:2016 NCAA GolfMen's NCAA I Hockey Teams Average Low HighScholarships awarded per team 22 16 25Average Scholarship per team $ 31,756 $ 19,934 $ 35,986
Women's NCAA I Hockey Teams Average Low HighScholarships awarded per team 20 20 20Average Scholarship per team $ 41,693 $ 41,208 $ 42,179
Number of scholarships awarded is per team, so for 4 year schools typically only 25% or so will be available for the incoming (i.e. freshmen)class. Data includes responding schools only, programs that do not award athletic scholarships (Ivy League, etc.) are not included in theseresults.
NCAA I Hockey Players - Demographics 2016-17
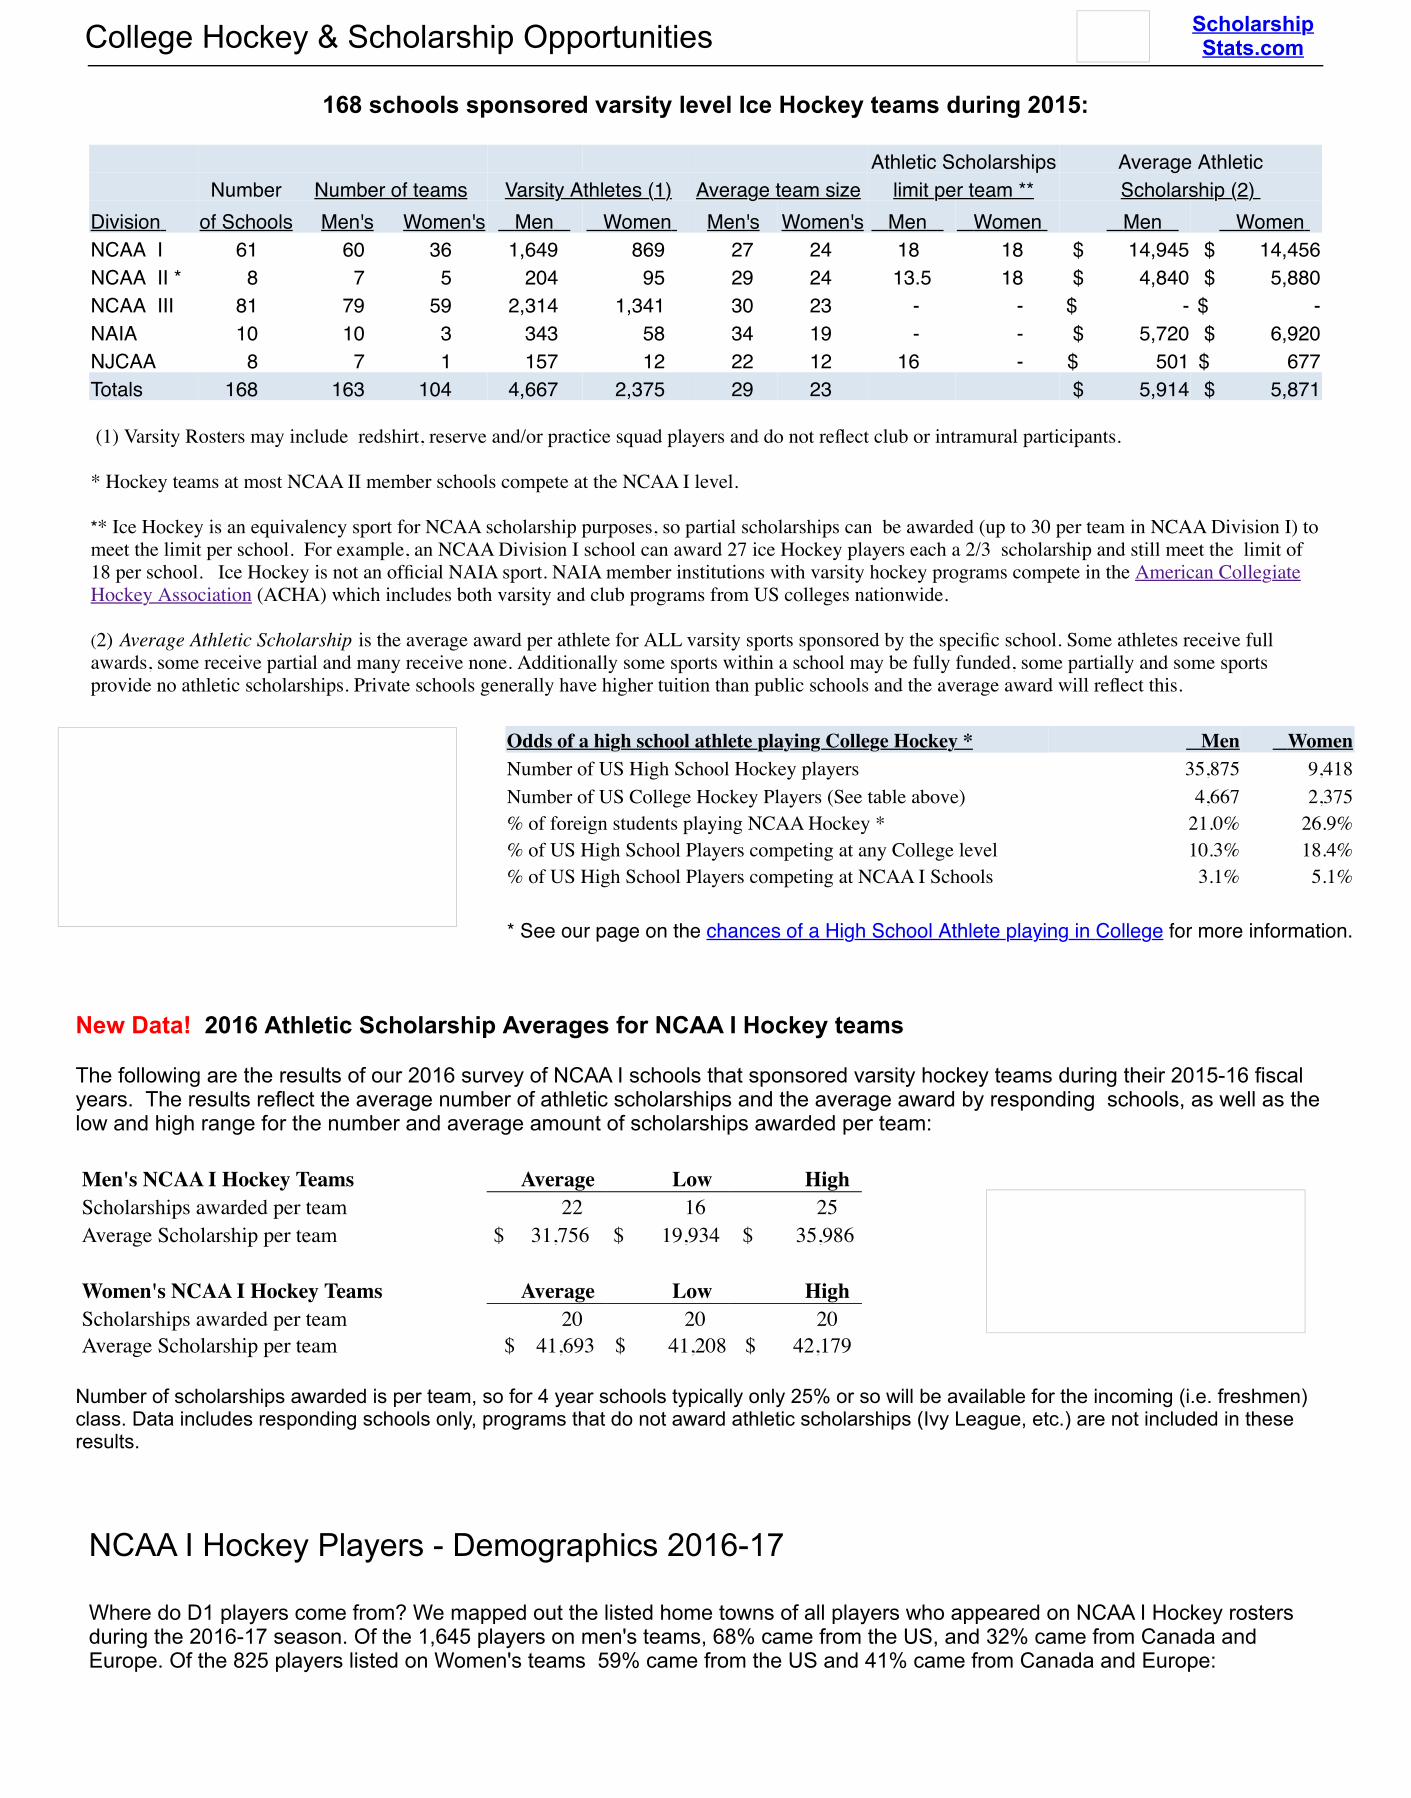
Where do D1 players come from? We mapped out the listed home towns of all players who appeared on NCAA I Hockey rostersduring the 2016-17 season. Of the 1,645 players on men's teams, 68% came from the US, and 32% came from Canada andEurope. Of the 825 players listed on Women's teams 59% came from the US and 41% came from Canada and Europe:
US Players Men Women 17 Canadian Players Men Women 17 European Players Men Women
Minnesota 201 145 Ontario 188 176 Sweden 27 8Michigan 145 30 British Columbia 95 29 Finland 21 5Massachusetts 113 72 Alberta 94 25 Russia 7 - New York 92 32 Quebec 47 17 Germany 6 3Illinois 84 35 Manitoba 16 35 Czech Republic 4 7Other States (see below) 483 170 Other Provinces 22 29 Other Countries - 7Totals 1,118 484 Totals 462 311 Totals 65 30
Home States: NCAA I US Hockey Players 2016-17 Season
NCAA I Players Men Women NCAA I Players Men Women NCAA I Players Men Women
Minnesota 201 145 North Dakota 10 4 Alabama 1 - Michigan 145 30 Washington 9 2 District of Columbia 1 - Massachusetts 113 72 Georgia 8 1 Kansas 1 - New York 92 32 Indiana 7 1 Kentucky 1 1Illinois 84 35 Maryland 7 5 Mississippi 1 - Wisconsin 67 21 Nebraska 7 1 Montana 1 - New Jersey 46 4 North Carolina 6 4 New Mexico 1 - Pennsylvania 46 9 Rhode Island 6 8 Oklahoma 1 - Colorado 39 7 Arizona 5 5 Oregon 1 1California 38 15 Iowa 5 1 South Dakota 1 2Connecticut 30 15 Utah 5 - Arkansas - - Florida 23 4 Virginia 5 2 Hawaii - - Missouri 23 6 Maine 4 7 Louisiana - - Texas 21 3 Vermont 3 10 South Carolina - 1
Ohio 17 7 Delaware 2 - Tennessee - - Alaska 16 9 Idaho 2 - West Virginia - - New Hampshire 14 13 Nevada 2 1 Wyoming - - By a wide margin Minnesota was the home state listed by the most players competing on men's and women'sNCAA I hockey teams during the 2016-17 season - fair to say the US hotbed for producing college players.Louisiana topped our list of NCAA I basketball hotbeds, but is clearly not a big state for producing collegehockey players.
&
NCAA I Players - Team experience prior to CollegeThe following is a summary of where NCAA I players played prior to joining their college teams:
NCAA I Players - Prior team Men % Women %Club / League Teams 1,492 90.7% 481 58.3%HS / Prep School Teams 80 4.9% 317 38.4%National Teams / U-18 73 4.4% 27 3.3%
Totals 1,645 100.0% 825 100.0%
Over 90% of men's teams players competed on club teams prior to college. Club players are also the primary source for Women'sNCAA I teams (the Toronto Jr. Aeros alone has 27 former players on NCAA I rosters), but prep and high schools teams are amajor source of players as well: Shattuck-St Mary's and Minnetonka High School respectively have 26 and 11 former players on2016-17 NCAA I women's team rosters. Both schools are located in Minnesota.
Men's players on 2016-17 rosters played in the following leagues prior to college:
Club / League Players # %United States Hockey League (USHL) 554 37%North American Hockey League (NAHL) 248 17%US Premier Hockey League (USPHL) 123 8%British Columbia Hockey League (BCHL) 255 17%Other Canadian Leagues 282 19%Other Clubs / Leagues 30 2%Totals 1,492 100%
&
Interactive Map - All US College Hockey Programs:
Quick Stats - all US Colleges that sponsored varsity Hockey teams in 2015:
Average Athletic SAT Math Schools with Varsity Roster Size (1) Scholarship (2) Annual Tuition & Fees Average (3) %Hockey Programs City State Division Men Women Men Women In-State Out-of-State 25% 75% Admitted
University of Alaska Anchorage Anchorage AK NCAA I 27 - 14,155 13,705 4,608 15,264University of Alaska Fairbanks Fairbanks AK NCAA I 28 - 12,233 10,094 4,176 14,832University of Alabama in Huntsville Huntsville AL NCAA I 26 - 18,925 14,761 9,158 21,232 530 650 82%Arizona State University Tempe AZ NCAA I 26 - 19,723 19,685 9,484 23,830 520 640 84%Colorado College Colorado Springs CO NCAA I 26 - 39,954 - 46,000 46,000 18%U.S. Air Force Academy Colorado Springs CO NCAA I 27 - full ride! full ride! - - 620 710 17%University of Denver Denver CO NCAA I 27 - 25,155 36,432 41,112 41,112 560 660 76%Connecticut College New London CT NCAA III 33 25 - - 47,420 47,420 38%Post University Waterbury CT NCAA II 24 new 6,502 7,877 15,310 15,310 380 480 87%Quinnipiac University Hamden CT NCAA I 28 25 24,271 28,116 39,170 39,170 500 610 66%Sacred Heart University Fairfield CT NCAA I 29 29 11,559 10,357 35,500 35,500 57%Trinity College Hartford CT NCAA III 29 23 - - 46,796 46,796 33%University of Connecticut Storrs CT NCAA I 26 25 19,347 19,239 9,858 30,038 590 690 50%Wesleyan University Middletown CT NCAA III 23 25 - - 47,702 47,702 24%Yale University New Haven CT NCAA I 28 30 - - 45,800 45,800 700 800 6%Aurora University Aurora IL NCAA III 40 - - - 21,120 21,120 460 560 81%Lake Forest College Lake Forest IL NCAA III 29 21 - - 40,448 40,448 55%Lindenwood University Belleville IL NAIA 33 26 2,744 4,575 15,230 15,230 450 540 53%Robert Morris University - Chicago Chicago IL NAIA 87 15 7,608 8,790 23,700 23,700 24%Robert Morris University -Peoria Peoria IL NAIA 17 - 7,608 8,790 23,700 23,700 24%Holy Cross College Notre Dame IN NAIA 18 - 6,492 7,746 26,200 26,200 410 520 93%Indiana Institute of Technology Fort Wayne IN NAIA 47 - 8,166 11,113 24,450 24,450 420 540 71%University of Notre Dame Notre Dame IN NCAA I 28 - 28,988 25,998 45,730 45,730 680 770 21%American International College Springfield MA NCAA I 27 - 9,334 10,827 30,940 30,940 390 495 68%
Average Athletic SAT Math Schools with Varsity Roster Size (1) Scholarship (2) Annual Tuition & Fees Average (3) %Hockey Programs City State Division Men Women Men Women In-State Out-of-State 25% 75% AdmittedAmherst College Amherst MA NCAA III 24 21 - - 47,720 47,720 680 770 14%Assumption College Worcester MA NCAA II 30 - 4,646 4,572 35,510 35,510 81%Babson College Wellesley MA NCAA III 27 - - - 45,120 45,120 610 710 26%Becker College Worcester MA NCAA III 43 17 - - 31,320 31,320 440 560 62%Bentley University Waltham MA NCAA I 26 - 4,684 6,109 40,990 40,990 610 690 46%Boston College Chestnut Hill MA NCAA I 24 23 28,665 23,613 46,670 46,670 640 740 34%Boston University Boston MA NCAA I 27 25 22,453 28,224 45,686 45,686 620 730 35%College of the Holy Cross Worcester MA NCAA I 28 24 13,571 11,260 45,080 45,080 43%Curry College Milton MA NCAA III 27 - - - 33,750 33,750 430 520 87%Endicott College Beverly MA NCAA III 32 29 - - 28,994 28,994 73%Fitchburg State University Fitchburg MA NCAA III 28 - - - 8,773 14,913 460 560 72%Framingham State University Framingham MA NCAA III 30 - - - 8,773 14,913 460 550 62%Harvard University Cambridge MA NCAA I 32 26 - - 40,418 40,418 710 800 6%Merrimack College North Andover MA NCAA I 28 22 14,123 11,676 34,615 34,615 78%Nichols College Dudley MA NCAA III 38 26 - - 32,070 32,070 76%Northeastern University Boston MA NCAA I 29 25 26,196 27,450 42,534 42,534 680 760 32%Salem State University Salem MA NCAA III 28 24 - - 8,773 14,913 448 540 71%Stonehill College Easton MA NCAA II 29 - 6,096 5,837 37,426 37,426 77%Suffolk University Boston MA NCAA III 33 - - - 32,530 32,530 460 590 84%Tufts University Medford MA NCAA III 28 - - - 47,596 47,596 680 760 17%University of Massachusetts-Amherst Amherst MA NCAA I 26 - 15,670 14,269 11,684 28,017 570 670 61%University of Massachusetts-Boston Boston MA NCAA III 29 28 - - 11,684 28,017 490 580 71%University of Massachusetts-Dartmouth North Dartmouth MA NCAA III 26 - - - 12,252 27,950 470 570 77%University of Massachusetts-Lowell Lowell MA NCAA I 29 - 9,055 8,894 12,252 27,950 540 640 62%
Average Athletic SAT Math Schools with Varsity Roster Size (1) Scholarship (2) Annual Tuition & Fees Average (3) %Hockey Programs City State Division Men Women Men Women In-State Out-of-State 25% 75% AdmittedWentworth Institute of Technology Boston MA NCAA III 34 - - - 29,320 29,320 530 630 83%Western New England University Springfield MA NCAA III 23 - - - 31,200 31,200 500 600 80%Westfield State University Westfield MA NCAA III 25 - - - 8,773 14,913 460 550 75%Williams College Williamstown MA NCAA III 26 25 - - 48,030 48,030 670 770 19%Worcester State University Worcester MA NCAA III 30 - - - 8,773 14,913 450 560 61%Stevenson University Stevenson MD NCAA III new 22 - - 26,976 26,976 450 550 62%Bowdoin College Brunswick ME NCAA III 34 21 - - 46,354 46,354 15%Colby College Waterville ME NCAA III 26 23 - - 45,360 45,360 620 720 28%
University of Maine Orono ME NCAA I 27 26 14,873 13,166 8,370 26,250 480 600 83%University of New England Biddeford ME NCAA III 29 24 - - 32,880 32,880 490 580 86%University of Southern Maine Portland ME NCAA III 29 19 - - 6,578 17,290 440 550 84%Adrian College Adrian MI NCAA III 27 26 - - 31,870 31,870 450 530 62%Aquinas College Grand Rapids MI NAIA 35 - 2,343 2,684 27,332 27,332 65%Ferris State University Big Rapids MI NCAA I 27 - 6,066 7,683 10,677 16,467 78%Finlandia University Hancock MI NCAA III 27 16 - - 20,980 20,980 45%Lake Superior State University Sault Ste Marie MI NCAA I 29 - 9,155 8,164 10,128 15,192 470 540 91%Lawrence Technological University Southfield MI NAIA 21 - 5,736 8,600 29,580 29,580 540 650 57%Michigan State University East Lansing MI NCAA I 27 - 18,627 15,244 13,200 34,965 540 690 66%Michigan Technological University Houghton MI NCAA I 32 - 8,947 11,270 13,740 29,220 570 680 76%Northern Michigan University Marquette MI NCAA I 31 - 9,394 10,402 8,664 13,896 72%University of Michigan Ann Arbor MI NCAA I 27 - 24,756 21,622 13,158 41,578 660 760 32%University of Michigan-Dearborn Dearborn MI NAIA 23 - 753 2,442 10,542 22,740 523 658 63%Western Michigan University Kalamazoo MI NCAA I 29 - 21,617 19,520 9,794 24,026 84%Augsburg College Minneapolis MN NCAA III 27 23 - - 33,766 33,766 485 630 68%
Average Athletic SAT Math Schools with Varsity Roster Size (1) Scholarship (2) Annual Tuition & Fees Average (3) %Hockey Programs City State Division Men Women Men Women In-State Out-of-State 25% 75% AdmittedBemidji State University Bemidji MN NCAA I 28 26 3,669 4,234 7,146 7,146 94%Bethel University Saint Paul MN NCAA III 32 23 - - 32,840 32,840 520 640 95%College of Saint Benedict St. Joseph MN NCAA III - 25 - - 38,428 38,428 480 615 82%College of Saint Scholastica Duluth MN NCAA III 27 22 - - 32,642 32,642 490 630 66%Concordia College at Moorhead Moorhead MN NCAA III 29 26 - - 33,900 33,900 620 660 64%Gustavus Adolphus College Saint Peter MN NCAA III 65 24 - - 39,930 39,930 61%Hamline University Saint Paul MN NCAA III 28 25 - - 35,710 35,710 490 570 70%Minnesota State University Mankato MN NCAA I 26 24 4,369 4,828 6,667 14,146 67%Rainy River Community College International Falls MN NJCAA - 12 - - 4,729 5,911Saint Cloud State University Saint Cloud MN NCAA I 26 22 3,679 4,514 6,584 14,226 82%Saint John's University Collegeville MN NCAA III 29 - - - 38,024 38,024 490 595 79%Saint Mary's University of Minnesota Winona MN NCAA III 31 22 - - 29,790 29,790 473 573 74%St Catherine University Saint Paul MN NCAA III - 23 - - 35,840 35,840 473 620 67%St Olaf College Northfield MN NCAA III 36 26 - - 41,700 41,700 570 690 51%University of Minnesota-Duluth Duluth MN NCAA I 26 25 4,549 6,915 11,720 15,385 510 640 77%University of Minnesota-Twin Cities Minneapolis MN NCAA I 27 21 11,185 9,927 12,060 19,310 620 750 45%University of St Thomas Saint Paul MN NCAA III 29 24 - - 35,872 35,872 430 530 87%Lindenwood University Saint Charles MO NCAA II - 20 2,744 4,575 15,230 15,230 450 540 53%Dakota College at Bottineau Bottineau ND NJCAA 21 - 562 1,133 3,301 4,952University of Jamestown Jamestown ND NAIA 34 - 3,952 3,379 18,650 18,650 548 624 64%University of North Dakota Grand Forks ND NCAA I 26 26 8,705 10,125 6,388 17,056 490 600 86%Williston State College Williston ND NJCAA 24 - 3,268 3,578 3,235 3,623Midland University Fremont NE NAIA 28 17 11,799 11,078 27,750 27,750 60%University of Nebraska at Omaha Omaha NE NCAA I 26 - 11,224 10,102 5,312 16,632 79%
Average Athletic SAT Math Schools with Varsity Roster Size (1) Scholarship (2) Annual Tuition & Fees Average (3) %Hockey Programs City State Division Men Women Men Women In-State Out-of-State 25% 75% AdmittedDaniel Webster College Nashua NH NCAA III 35 13 - - 15,630 15,630 63%Dartmouth College Hanover NH NCAA I 29 21 - - 46,764 46,764 680 770 12%Franklin Pierce University Rindge NH NCAA II 34 22 4,000 4,853 29,682 29,682 430 530 84%New England College Henniker NH NCAA III 36 22 - - 33,300 33,300 96%Plymouth State University Plymouth NH NCAA III 25 22 - - 10,410 18,320 75%Saint Anselm College Manchester NH NCAA II 30 27 4,946 6,518 35,396 35,396 76%Southern New Hampshire University Manchester NH NCAA II 29 - 7,077 10,551 29,274 29,274 84%University of New Hampshire Durham NH NCAA I 29 25 16,319 17,549 13,670 26,650 510 610 80%County College of Morris Randolph NJ NJCAA 18 - 147 549 7,080 10,080Princeton University Princeton NJ NCAA I 28 25 - - 41,820 41,820 710 800 7%Canisius College Buffalo NY NCAA I 28 - 11,315 12,996 32,630 32,630 490 600 80%Clarkson University (Hockey) Potsdam NY NCAA I 27 20 38,950 47,016 41,690 41,690 570 670 62%Colgate University Hamilton NY NCAA I 27 23 20,572 19,981 47,855 47,855 650 750 26%Cornell University Ithaca NY NCAA I 27 20 - - 47,050 47,050 680 770 14%Elmira College Elmira NY NCAA III 28 26 - - 36,600 36,600 470 590 82%Erie Community College Buffalo NY NJCAA 26 - 32 156 4,295 8,590
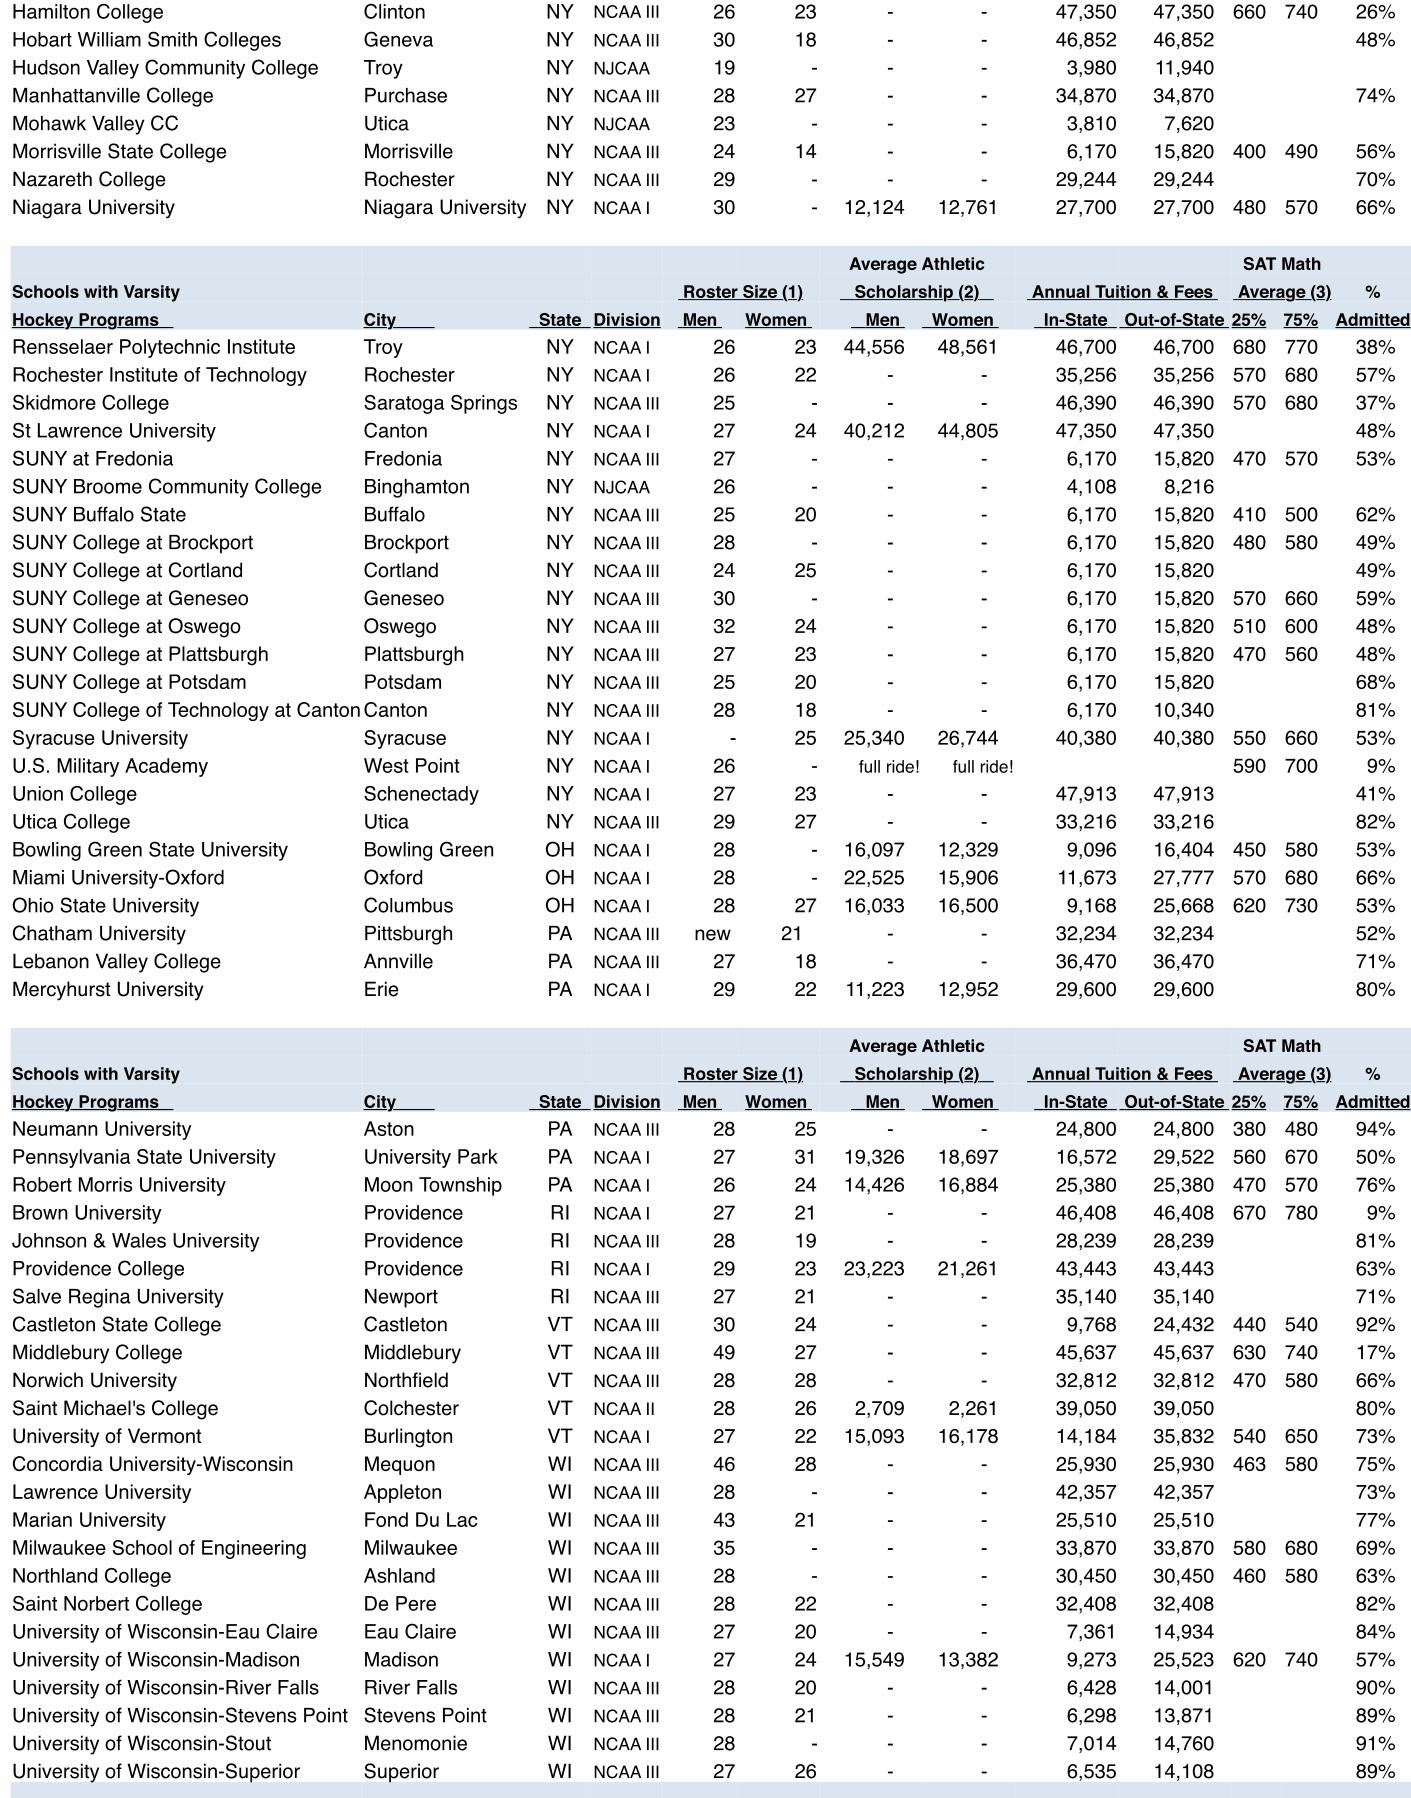
Hamilton College Clinton NY NCAA III 26 23 - - 47,350 47,350 660 740 26%Hobart William Smith Colleges Geneva NY NCAA III 30 18 - - 46,852 46,852 48%Hudson Valley Community College Troy NY NJCAA 19 - - - 3,980 11,940Manhattanville College Purchase NY NCAA III 28 27 - - 34,870 34,870 74%Mohawk Valley CC Utica NY NJCAA 23 - - - 3,810 7,620Morrisville State College Morrisville NY NCAA III 24 14 - - 6,170 15,820 400 490 56%Nazareth College Rochester NY NCAA III 29 - - - 29,244 29,244 70%Niagara University Niagara University NY NCAA I 30 - 12,124 12,761 27,700 27,700 480 570 66%
Average Athletic SAT Math Schools with Varsity Roster Size (1) Scholarship (2) Annual Tuition & Fees Average (3) %Hockey Programs City State Division Men Women Men Women In-State Out-of-State 25% 75% AdmittedRensselaer Polytechnic Institute Troy NY NCAA I 26 23 44,556 48,561 46,700 46,700 680 770 38%Rochester Institute of Technology Rochester NY NCAA I 26 22 - - 35,256 35,256 570 680 57%Skidmore College Saratoga Springs NY NCAA III 25 - - - 46,390 46,390 570 680 37%St Lawrence University Canton NY NCAA I 27 24 40,212 44,805 47,350 47,350 48%SUNY at Fredonia Fredonia NY NCAA III 27 - - - 6,170 15,820 470 570 53%SUNY Broome Community College Binghamton NY NJCAA 26 - - - 4,108 8,216SUNY Buffalo State Buffalo NY NCAA III 25 20 - - 6,170 15,820 410 500 62%SUNY College at Brockport Brockport NY NCAA III 28 - - - 6,170 15,820 480 580 49%SUNY College at Cortland Cortland NY NCAA III 24 25 - - 6,170 15,820 49%SUNY College at Geneseo Geneseo NY NCAA III 30 - - - 6,170 15,820 570 660 59%SUNY College at Oswego Oswego NY NCAA III 32 24 - - 6,170 15,820 510 600 48%SUNY College at Plattsburgh Plattsburgh NY NCAA III 27 23 - - 6,170 15,820 470 560 48%SUNY College at Potsdam Potsdam NY NCAA III 25 20 - - 6,170 15,820 68%SUNY College of Technology at CantonCanton NY NCAA III 28 18 - - 6,170 10,340 81%Syracuse University Syracuse NY NCAA I - 25 25,340 26,744 40,380 40,380 550 660 53%U.S. Military Academy West Point NY NCAA I 26 - full ride! full ride! 590 700 9%Union College Schenectady NY NCAA I 27 23 - - 47,913 47,913 41%Utica College Utica NY NCAA III 29 27 - - 33,216 33,216 82%Bowling Green State University Bowling Green OH NCAA I 28 - 16,097 12,329 9,096 16,404 450 580 53%Miami University-Oxford Oxford OH NCAA I 28 - 22,525 15,906 11,673 27,777 570 680 66%Ohio State University Columbus OH NCAA I 28 27 16,033 16,500 9,168 25,668 620 730 53%Chatham University Pittsburgh PA NCAA III new 21 - - 32,234 32,234 52%Lebanon Valley College Annville PA NCAA III 27 18 - - 36,470 36,470 71%Mercyhurst University Erie PA NCAA I 29 22 11,223 12,952 29,600 29,600 80%
Average Athletic SAT Math Schools with Varsity Roster Size (1) Scholarship (2) Annual Tuition & Fees Average (3) %Hockey Programs City State Division Men Women Men Women In-State Out-of-State 25% 75% AdmittedNeumann University Aston PA NCAA III 28 25 - - 24,800 24,800 380 480 94%Pennsylvania State University University Park PA NCAA I 27 31 19,326 18,697 16,572 29,522 560 670 50%Robert Morris University Moon Township PA NCAA I 26 24 14,426 16,884 25,380 25,380 470 570 76%Brown University Providence RI NCAA I 27 21 - - 46,408 46,408 670 780 9%Johnson & Wales University Providence RI NCAA III 28 19 - - 28,239 28,239 81%Providence College Providence RI NCAA I 29 23 23,223 21,261 43,443 43,443 63%Salve Regina University Newport RI NCAA III 27 21 - - 35,140 35,140 71%Castleton State College Castleton VT NCAA III 30 24 - - 9,768 24,432 440 540 92%Middlebury College Middlebury VT NCAA III 49 27 - - 45,637 45,637 630 740 17%Norwich University Northfield VT NCAA III 28 28 - - 32,812 32,812 470 580 66%Saint Michael's College Colchester VT NCAA II 28 26 2,709 2,261 39,050 39,050 80%University of Vermont Burlington VT NCAA I 27 22 15,093 16,178 14,184 35,832 540 650 73%Concordia University-Wisconsin Mequon WI NCAA III 46 28 - - 25,930 25,930 463 580 75%Lawrence University Appleton WI NCAA III 28 - - - 42,357 42,357 73%Marian University Fond Du Lac WI NCAA III 43 21 - - 25,510 25,510 77%Milwaukee School of Engineering Milwaukee WI NCAA III 35 - - - 33,870 33,870 580 680 69%Northland College Ashland WI NCAA III 28 - - - 30,450 30,450 460 580 63%Saint Norbert College De Pere WI NCAA III 28 22 - - 32,408 32,408 82%University of Wisconsin-Eau Claire Eau Claire WI NCAA III 27 20 - - 7,361 14,934 84%University of Wisconsin-Madison Madison WI NCAA I 27 24 15,549 13,382 9,273 25,523 620 740 57%University of Wisconsin-River Falls River Falls WI NCAA III 28 20 - - 6,428 14,001 90%University of Wisconsin-Stevens Point Stevens Point WI NCAA III 28 21 - - 6,298 13,871 89%University of Wisconsin-Stout Menomonie WI NCAA III 28 - - - 7,014 14,760 91%University of Wisconsin-Superior Superior WI NCAA III 27 26 - - 6,535 14,108 89%
(1) Varsity Rosters may include junior varsity, redshirt, reserve and/or practice squad players and do not reflect club or intramural team participants.
(2) Average Athletic Scholarship is the average award per athlete for ALL varsity sports sponsored by the specific school. Some athletes receive full awards, somereceive partial and many receive none. Additionally some sports within a school may be fully funded, some partially and some sports provide no athleticscholarships. Private schools generally have higher tuition than public schools and the average award will reflect this.
(3) SAT Math Average: For each school this represents the range where the middle half of the admitted students scored, so 1/4 scored below the lower end (25thpercentile) and 1/4 scored above the upper end (75th percentile).
© ScholarshipStats.com
Statistical information on college athletic scholarships and student athlete participation at the collegiate level.
Main Page 2016-17 About our Stats 2016-17 Contact Us
Statistics edited by Patrick O'Rourke, CPA Washington, DC