Embed Size (px)
Citation preview

College Enrollment in the Great Recession: The Role of
Supply Constraints
Soobin Kim∗
September 2014
Abstract
Most studies on cyclicality of higher education examine the relationship between cyclical
variationss in labor market conditions and changes in enrollment. Changes in enrollment are
cause by changes both on the demand side and the supply side. Most of the previous litera-
ture, however, implicitly assumed perfectly elastic supply of enrollment. This study identifies
institutions with supply constraints and investigates how the constraints affected institution’s
decision on enrollment, and how this varies across institutions by studying the case of the Great
Recession. I find that institutions have different capacity to adjust their resources in the short
run and it simultaneously affected enrollment size and the quality of freshmen. Some institu-
tions with limited capacity increased the enrollment not proportional with the increase in the
number of applications and, as a result, increased the selectivity of their admissions during the
Great Recession. Other institutions responded to the increase in demand for higher education
by accepting more students, however, it resulted in drop in new students’ quality.
1 Introduction
Most studies on effects of recession on higher education investigated relationship between college
enrollment and labor market conditions, mainly measured by unemployment rate, and found clear
countercyclicality; Betts and McFarland (1995) provided results that public community college en-
rollments rise and fall in phase with the ups and downs of unemployment1 and Barr and Turner
∗Department of Economics, Michigan State University, 486 W. Circle Drive, 110 Marshall-Adams Hall, EastLansing, MI 48824-1038 USA. Telephone: 517-355-7583; Fax: 517-432-1068. [email protected]
1Some notable research on the theory of cyclicality on higher education includes Dellas and Sakellaris (1996),Sakellaris and Spilimbergo (2000), and Dellas and Koubi (2003).
1

(2013) claimed that the Great recession has produced unambiguous increases in college enrollment.
Most of attention has been paid to changes in demand of enrollment when economy conditions
changes and these works usually analyzed the relationship with individual level. Some claimed that
opportunity cost of going to college decreases during the recession but the liquidity constraint also
becomes severe at the same time, which limits the increase in enrollment (Lovenheim, 2011). The
implicit assumption in this line of research is that institutions have quite flexible supply to adjust
to the changes in demand and that there were not much issues on supply-side (Bound and Turner,
2007; Barr and Turner, 2012).
Recently some studies acknowledged that the supply-side of the higher education markets is likely
to be affected by local economic condition and that the college enrollment can become inelastic if the
supply is inelastic even though there is a cyclicality in demand. If an institution faces a reduction
in non-tuition revenue including state/federal appropriations during economic recession, it has less
amount of resources to spend on instruction, which in turn decreases school quality. Furthermore
if an institution has a capacity limit in enrollment, it cannot accommodate all increase in demand
and has only a limited quantity response in the short-run. For instance, Lovenheim (2011) and Barr
and Turner (2013) claimed that supply elasticity might depend on residential program, subsidies per
student, and prestige of institution, however, none have tested the hypothesis.2 Motivated by their
conjectures, this study collected data to identify institutions with supply capacity constraints in
the short run and showed that these institutions behaved limited adjustment in quantity dimension
during the Great Recession; supply was inelastic.
Most of previous studies on cyclicality of higher education focused on the adjustment in quantity
dimension and analyzed how the enrollment size responded to economic fluctuations. At the same
time, those works almost neglected what happens in quality of new students and implicitly assumed
that the quality of incoming students or that of produced human capital is homogenous. Current
study, however, investigates who exerts more efforts on quality dimension and how those are related
to capacity constraints.
In this study, in order to present a more complete accounting of cyclical movement of college en-
rollment, I develop and estimate a model that can be applied to a wide range of institutions, including
public and private colleges, and 2-year and 4-year institutions. Previous documents on cyclicality in
2Lovenheim (2011) stated supply at top-ranked public and private schools is inelastic and Barr and Turner (2013)argued that research universities and liberal arts colleges are most likely to be supply inelastic and that supply iselastic for community colleges, open-access public four-year institutions, and for-profit institutions,
2

higher education might have misinterpreted the real world because they have not disaggregate the
system it should be. The policy to require the new freshmen to stay at on-campus housing captures
the capacity constraint on supply-side and it produces different predicted adjustments in enrollment
decisions during economic recession. The model implies that institutions that are required to provide
dorms could have quite elastic supply. During economic downturn, these institutions are becoming
more selective and cyclical variations in demand do not turn into full-realization. That is, where the
quantity expansion occurs would have to be other types of institutions; institutions without capacity
constraints in the short run that is not require to house students such as community colleges and
commuter universities.
I present compelling evidence that the capacity constraint on the supply-side is in fact binding
and that the increase in enrollment is disproportional across institution depending on the constraint.
Those institutions with limited quantity adjustment responded in Great recession by increasing
a smaller proportional level of enrollment and by increasing the admission standard, and accept
students with better quality whereas other institutions tended to increase the enrollment size, which
resulted in the decline in quality of new freshmen.
The analysis begins with an introduction of a simple model that illustrates institution’s maxi-
mization problem with different supply constraints and derives the implications of choices and results
during economic recession. Section 3 presents the data source, variables, and data selection process
to generate the final sample for analysis. Section 4 describes changes in revenue resources and the
estimation results on the relationship between enrollment as well as quality of new students and
variations in labor market, and the final section concludes.
2 Model
Consider a simple world with two types of institutions, where each institution acts as one utility
maximizing agent, that provide supply to the higher education market by making decisions on
enrollment subject to their own resources.3 Type A institutions have no constraint in supply in the
short run in the sense that they are flexible in accepting students if there is an increase in demand.
Thus supply of those institutions is quite elastic. Type A colleges include 4-year private commuting
colleges, local public colleges, and community colleges, where most students live nearby the campus
3I use the individual institution as the agent that sets enrollment, quality, and admission policy. Some previousstudies, especially for public institutions, modeled states as a unit of analysis.(Lowry, 2001; Bound and Turner, 2007)
3

and commute from home. On the other hand, Type B institutions face capacity constraints in the
short run and have limited adjustment in enrollment when there is a change in demand. These
colleges have relatively inelastic supply and are occupied with qualified students such as elite 4-year
private and public colleges. For example, these institutions require the new freshmen to stay at
on-campus housing such as dormitory or off-campus facilities that have contracts with institutions,
and have capacity constraints in the short run. These institutions have more weights on maintaining
the quality of enrolled students.
Both types of institutions make choices on enrollment that involves decision on how many to
accept and whom to accept. In other words, institutions choose the number of students to admit
and enroll, and the quality of incoming students. In fact institutions pick the number of admitted
students and employ all resources to predict the number of enrolled students. That is, enrollment
is a function of acceptance rate, which is the proportion of new applicant who are accepted, γ,
tuition, p, school quality, S, the outside wage that students can earn when they choose to work, w,
and yield rate, which is the proportion of admitted students who enroll, d. Thus, the number of
enrolled students, n, is n = N(p, S, w, γ, d), with n2(=∂N∂S
), n4, n5 all positive except for n1 and n3
negative. For simplicity, ignore the possibility of interdependence between tuition, school quality,
outside wage, acceptance rate, and yield rate.
The number of enrolled students serves as a source of revenue and cost to each institution at the
same time, and is closely related to profit, π. Profit is the defined as the difference between revenue
received and cost paid. Revenue, R, is the sum of tuition charged to enrolled students, p × n, and
non-tuition revenue including subsidy from governments, A. Then the revenue function is
R = n× p+A
A school’s cost depends on the number of students enrolled and the expenditure on educational
quality. Assume that all schools, private and public, have the simple cost function
C(n, I) = I × n+ c(n), c = c0 if n ≦ n̄
c = c1 if n > n̄
c1 > c0
4

where c(·) is custodial costs including salary to faculty and staff, and other costs associated with
providing the same physical space to enrolled students such as classroom building and dormitory,
and I is the educational expenditure per enrolled students. Type B institutions that have freshmen
on-campus residency policy have capacity constraint, n̄, in the short run and choose n smaller
than n̄. Thus they cannot have much quantity adjustment in the short run and are constrained
in enrollment capacity, n ∈ [0, n̄]. If there are more students enrolled than the capacity, n > n̄,
then these institutions need to consider building a new housing or have extra contracts with other
facilities that costs c1. Then the profit function can be written as
B = R− C = n× p+A− [I × n+ c(n)]
School quality, S = S(θ, I), is twice-differentiable, continuous, and increasing function of financial
input per students and the mean ability of the institution, θ. The school quality function captures
the peer-effect in the model. As in Epple and Romano (1998, 2008), to maintain the simplicity and
highlight the role of peer groups, a school’s quality is determined exclusively by the mean ability
of its peer group.4 The mean quality of students is related to the number of enrollment, n, such
that θ(n) = ln( n̄n̄−|n−a| + b) where a, b > 0 and a < n̄. It is assumed that Type A institutions that
don’t have capacity constraint act as n < a whereas Type B institutions with on-campus housing
requirement are operating around its capacity, n̄, such that a < n < n̄.
The institution i’s decision maker’s utility function, U(·), is increasing in profit and the quality of
the enrolled student, S, and it is continuous, nonnegative, and twice differentiable in both arguments.
Thus U = U(π, S(θ, I)), with U1, U2, S1 and S2 all positive.
A Cobb-Douglas specification of utility and school quality function that places weight 1− α on
school quality S is
U = παS(θ, I)1−α;S(θ, I) = φθ(n)βI1−β ;α, ρ > 0
where φ depends on whether a school is public or private. For instance, one simple approach in
the spirit of Epple and Romano (2008) treats φ as a parameter and sets φpub < φprv considering
some empirical evidence that public schools are to be more costly to operate and less effective in
4If the quality of enrolled students and that of new students are positively correlated via peer-effect, then choosingbetter freshmen would mean the increase in overall quality, θ. Hereafter θ represents the quality of new students.
5

delivering education than private schools. As α increases, an institution is placing more importance
on profit while that on school quality decreases. Both types of institutions have the same form of
utility function for simplicity, however, have different weights on arguments. Type A colleges put
more weights on profit dimension while Type B colleges have more values the quality of students;
αA > αB.
In response to changes in labor market and taking into account the resource constraints, schools
are choosing different acceptance rate and are forecasting yield rate. To determine optimal enroll-
ment size, consider a school that can predict the yield rate accurately enough so that schools can
use the expected enrolled students in maximization problem.5 Then a school’s utility maximization
would mean to choosing n so as to 6
maxU = πS(θ, I) (1)
The first order condition is then
πα−1θβ−1[απnθ + βπ∂θ
∂n]I1−β = 0 (2)
where πn = ∂π∂n
. This is the basic model and I can derive some interesting implications associated with
changes in labor market conditions. The implication of the model is clear: institutions, depending on
their resource capacity situations they are facing in the short run, such as required to provide dorms
to freshmen, respond differently in terms of quantity and quality of enrollment to Great Recession.
During economic downturn, Type B institutions with limited capacity are becoming more selective
and cyclical changes in demand does not turn into full-realization. In other words, where most of
quantity expansion occurs have to be Type A institutions that are not required to house students
and don’t have binding capacity constraint in the short run. Those institutions, however, had to
bear a decline in incoming students’ quality.
5Universities and colleges choose the number of admission and have a long enough experience of predicting theactual enrollment. If N(· ) is assumed to be a known function that behaved well for a long time, it is reasonable topick n with uncertainty but uncertainty is not a big issue.
6The main focus of this paper is on the choices of the number of undergraduate even though empirical results, forinstance by DeGroot el al (1991) and Koshal and Koshal (2000) showed synergies, or economies of scope, associatedwith the joint production of two or more products such as undergraduate and graduate education, and research.
6

2.1 Optimization during economic downturn
Institution i is maximizing the objective function relative to changes in labor market condition.
During economic downturn, as in Dellas and Koubi (2003), the opportunity cost of education is
procyclical and outside wage w decreases. Thus, in the absence of severe liquidity constraints,
educational pursuits ought to be countercyclical, which increases the total number of new applicants.
Using equation (2), a proposition, proved in the Appendix A, can be derived.
Proposition 1. During economic recession, the changes of optimal enrollment size depends on c(·).
Schools without capacity constraint increase the enrollment size whereas institutions with limited
capacity tend to have a smaller increment in enrollment.
The main goal of the model is to show that institutions, considering the quality of new appli-
cants and profit level, are choosing the enrollment size to optimize the utility and that there are
heterogeneous responses across institutions during economic recession.
During economic downturn, institutions receive less non-tuition revenue, which includes appro-
priation from federal/state governments. With substantial decrease in appropriation and funding,
institutions can increase the tuition revenue by increasing the enrollment size if prices are assumed
to be stable in the short run.
Type A colleges where on-campus housing is not necessary for freshmen such as commuter colleges
or community colleges, which choose n < a by assumption, show countercyclical responses; they
increases the enrollment size during recession by increasing the class size or by hiring temporary
faculties. They can expand the enrollment size, ∂n∂w
|A< 0, and offset the decrease in outside
funding by maintaining the similar acceptance rate, which in turn increases the tuition revenue
( ∂α∂w
≦ 0, ∂π∂w
≦ 0 at least with one equality).
On the other hand, Type B colleges, who have policies to require the freshmen to stay at on-
campus housing such as dormitory, needs to build additional dorms or make contracts with other
housing facilities if they decide to accommodate the increase in demand such that n > n̄. By
assumption that these institutions are already operating around the capacity limit, they cannot
have much responses in quantity dimension in the short run; they admit similar amount of students
or a little more and some may even accept less if they have cut in outside funding (| ∂n∂w
|A>| ∂n∂w
|B,
∂n∂w
|B< 0). The comparative statistics show that these colleges can increase the admission standard
and admit smaller size of students.
7

The different responses to the increase in demand result in different impact on school quality.
Proposition 2. During economic recession, the changes of school quality depends on c(·). Schools
without capacity constraint result in the fall in quality of new freshmen whereas institutions with
limited capacity tend to increase the quality of new freshmen. (Proved in Appendix)
The effect of the increase in enrollment size on school quality is clear. Type A colleges that
don’t have dorms or freshmen residence policy accepts more students and it decreases the overall
quality of new students. With the increase in demand measured by the increase in the number of
applicants, there are some better students but majority of marginal students are coming from the
lower tale of quality distribution. Once they accept more of lower quality students than the better
ones, the overall quality declines ( ∂θ∂w
|A> 0). Since there are other types of constraints such as the
quality of staffs and student services that colleges aim to maintain, and number of classroom, those
institutions may not indefinitely increase the enrollment size.
In response to worse labor market conditions, Type B colleges with on-campus residence requiring
policies choose to maintain or increase the enrollment size at a smaller increment than the coun-
terpart, and increase the admission standards and admit students with better quality( ∂θ∂w
|B< 0).
These institutions become more selective and choose more students with better quality among the
additional applicants, which improves the overall quality.7
3 Data
3.1 IPEDS
The study investigates how an institution is optimizing its resources in response to changes in
demand. Institutions are a natural unit of analysis and institutional enrollment, prices, faculty, stu-
dent quality, and financial data are drawn from Integrated Postsecondary Education Data System
(IPEDS) since 1986, which is an annually survey by the U.S. Department’s National Center for Ed-
7Another interesting approach would be by matching institutions with new students. Then the sign depends on theprestige of the school ( ∂θ
∂nS 0). For top-ranked schools, the quality of marginal students due to the recession tends
to be lower on average than that of their original students. Thus if they admit more students, then the quality woulddecrease( ∂θ
∂n< 0). If the school is less-selective and accepts only better-quality student, who would have enrolled in
better school but could not due to the increase in admission standards, then the student quality can increase( ∂θ
∂n> 0).
On the other hand, if they accept some marginal students who would have worked, who are generally less talented,and it might decrease the student quality( ∂θ
∂n< 0) and similar result is expected for least-competitive colleges. If
those two types of schools admit more of less-talented students than better-qualified students, then the overall qualityof new student would decrease when the enrollment size increases( ∂θ
∂n< 0).
8

ucation Statistics (NCES). IPEDS provides aggregate information by institutions that participate in
Title IV federal financial aid programs. This data set is used to explore the relationship between in-
stitution’s decision on enrollment and changes in labor market conditions during the Great recession,
and is suitable to observe the types of institutions’ responses in detail. Number of institutions varies
from 7,066 to 14,104 by year. The final dataset is smaller because I excluded closed institutions,
military institutions, tribal colleges, colleges in outlying areas,8 and extremely small institutions
that reported to have less than 200 undergraduate students.
3.2 Variables
Given the research interest is how supply constraints, namely the requirement to provide on-campus
housing to freshmen, affect the decision on enrollment, it is natural to use to enrollment data for
first-time first-year (FTFY) degree/certificate-seeking undergraduate students who applied, were
admitted, and enrolled (full time) for the most recent fall period available, and the fall enrollment
data is available from 1986. Other measures of enrollment such as FTFY enrollment among high
school graduates in past 12 months, and enrollment by age, residence state, or race, are also available.
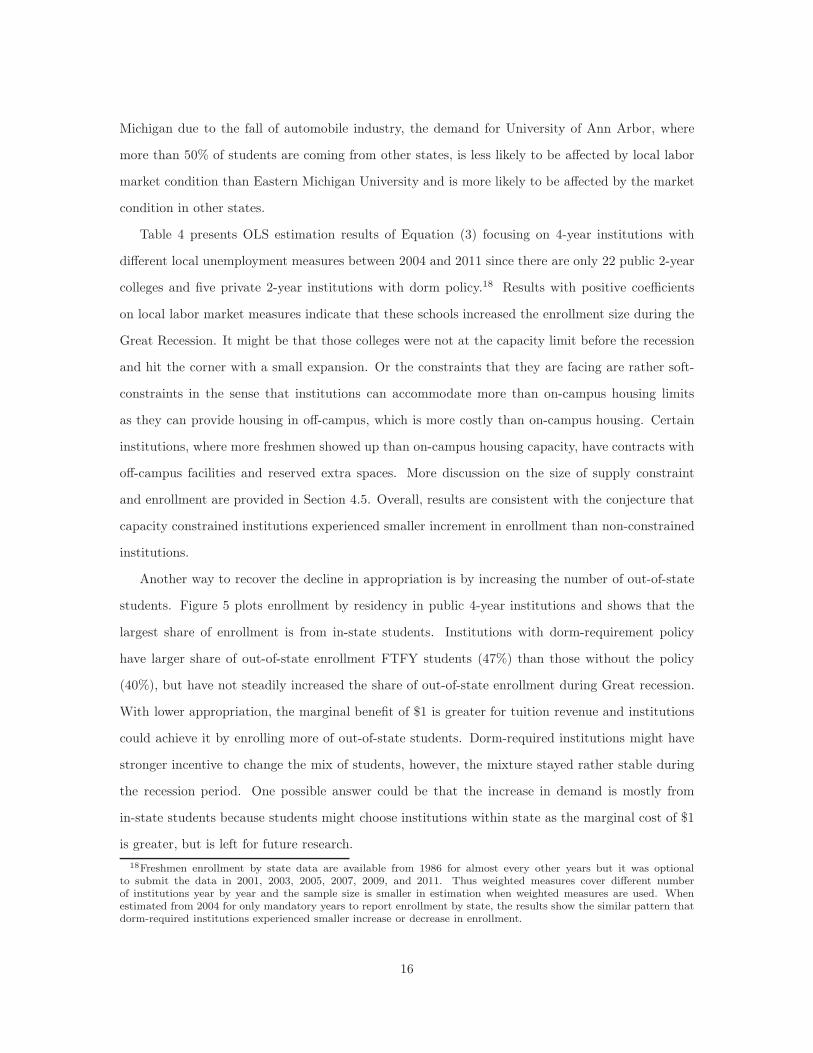
Figure 1 plots the relationship between total enrollment and labor market condition since 1970,
which previous studies on cyclicality of higher education focused on. Most studies on cyclicality
concluded that there is a little cyclicality with 2-year institutions and almost no or weak cyclicality
with 4-year institutions as in Figure 1(a). Some studies further investigated the relationship based
on the student’s attendance status and claimed that there is a procyclicality in 2-year full-time
enrollment and countercyclicality with 2-year part-time enrollment, which is shown in Figure 1(b).
The key variable to represent the capacity constraint on supply-side of higher education is on-
campus housing requirement such as dormitory, which is equal to one if all FTFY degree/certificate-
seeking students are required to live on campus or in institutionally-controlled housing, or zero
if not. Institutions have different exemption criteria on dorm policy such as number of credits,
proximity (commuting distance in mile or in minute), age, marital status, and custodial care of
children (dependent children), and the policy sometimes changes from year to year depending on
the available space, which could be changed if they offer married housing or purchase/build a new
dormitory.
8These areas include American Samoa, Guam, Federated States of Micronesia, Marshall Islands, Northern MarianaIslands, Palau, Puerto Rico, Virgin Islands, and Hawaii.
9

For institutions that are required to provide dormitory for FTFY students cannot make much
changes in enrollment when there is a increase in demand. For example, they cannot increase 20%
of building overnight and even if they do, recession may end earlier than expected. IPEDS provides
information whether freshmen are required to live on-campus housing and ALLONCAM variable is
recorded in Institutional Characteristics from 2004, which is long enough to cover Great recession
period. The variable in the government’s data system, however, contains serious errors. Among
1,059 institutions that marked to have dorm residency policy at least once since 2004, 856 changed
the answer from one to zero, vice versa, or mixed. For example, in IPEDS Michigan State University
answered one, which means that MSU requires freshmen to stay at dormitory, from 2004 to 2009,
and changed the answer to zero since 2010 even though MSU never changed the policy.
Since it was impossible to detect any clear pattern of error being recorded, those 856 institutions
were individually asked whether they had freshmen dorm requirement policy by phone and email.9
Table 1 compares the number of institutions under original variable from IPEDS with that of revised
one and the results are surprising. 242 institutions marked as to have dorm policy in IPEDS never
had the policy and the number of institutions that had dorm policy during 2004-2011 is changed
from 203 to 724 after data collection. For comparison, Carnegie Classification categorizes four-
year institutions into highly residential, primarily residential, and primarily nonresidential. 50% of
institutions that are classified as residential have dorm-required policy and around 70% of highly-
residential classified institutions are found to have dorm-required policy.
The edited dorm policy variable is still not properly reflecting the supply constraint. Not all
institutions that have large residence halls or have a high portion of out-of-state students are en-
forcing freshmen to stay at on-campus housing. University of Michigan, for example, does not have
a dorm requirement policy, however, provides dorms for over 10,000 students where around 70% of
freshmen are living at dorms. Other national schools such as Boston College, University of Wiscon-
sin, and Cornell University are marked as not having the dorm policy even though in general they
have large share of out-of-state students who mostly stay at dorms. Thus dorm variable is revised
considering dorm capacity, ratio of FTFY enrollment to dorm capacity, and share of out-of-state
freshmen. Moreover, if an institution is reported to have the policy for more than a half of observed
period, it is considered as dorm-required institution.
9As of September 18th 2014, among 856 institutions, I collected dorm policy information from 773 institutions.The revised list of colleges with the policy is available upon request from the author.
10

Next, additional dorm policy measure is generated to cover time back to 1986. There exists risk
of misclassifying dorm-required institutions, however, what data tells is that the risk is not high.
Between 2004 and 2011, only 46 out of 1,059 institutions adopted dorm policy, which implies that
institutions with dorm-policy are more likely to have maintained their policy. In fact, among 610
institutions that are reported to have the dorm policy, more than 510 colleges were turned out to
have the policy at least prior to 2004, and around 200 colleges answered to have the policy at least
for 20 years. If a college is reported to experience an unrealistic increase and decrease in enrollment,
it is dropped.10
Quality is important since colleges both want and need to enroll students to be able to take
advantage of the kinds of curricula, advising, and other programming which they offer, and the
quality of students affects future enrollment. The quality of students is measured by the SAT
scores, which is primarily considered to be predictors of students’ performance, in reading, math,
and writing because the scores can be compared both across colleges and over time. IPEDS also
provide ACT (Composition, Math, English, Writing) scores at the 25th and 75th percentile scores
from 2001. One drawback of quality measure is that SAT/ACT scores are available for 4-year public
and 4-year not-for-profit private colleges but mostly not available for 4-year for-profit and 2-year
institutions.
Finance variables, including average tuition and fees by student’s residence, and net price, which
is the posted “sticker price” and fees less average financial aid from federal, state, and institution,
is calculated by author. Appropriation variables are accessible by local, state, and federal and
other variable such as revenue, unrestricted revenue, and net tuition revenue, which is the difference
between tuition and institutional grant and aid, are calculated by Delta Cost Project.11 All price
variables are adjusted to 2010 price level by consumer price index.
Staff variables include information of the number of current full-time/part-time faculty and the
number of new hired faculty. For new faculty variables, detailed information is accessible whether
they are tenured or whether they are contracted with tenure track, and data are available from 2001.
Finally, variables to measure the labor market condition are unemployment rate, mass layoff
10Some schools were reported to have increase in freshmen enrollment for more than 100 times between 2004 and2011. Examples are South University-Savannah by 97 times, Ashford University by 362 times, and University ofPhoenix (online) for 100 times.
11Delta Cost Project provides longitudinal database derived from IPEDS finance, enrollment, staffing, completionsand student aid data for academic years 1986-87 through 2009-10, however, some variables in enrollment, institutionalcharacteristics, and staff are not the same as in raw data files from IPEDS Data Center. For those mis-matchedvariables, the raw data files are preferred.
11

statistics, and average weekly earnings from Bureau of Labor Statistics. There are many measures of
unemployment rate such as by national or state, and by age, but the year when the recession started
is quite same across measures. Thus the preferred measure is the overall national unemployment
level between 16-19. Most of previous studies analyzed the cyclicality with state unemployment rate
but it is well known that it is subject to sampling error. Thus state mass layoff data are also used
to measure the local labor market condition.12
Table 2 provides descriptive statistics by institutions types between 2004 and 2011 and is stratified
by whether an institution has a dorm-required policy for freshmen and by control. The statistics
indicate that institutions with dorm-required policy are mostly 4-year colleges and that enrollment
size is about 50% larger for dorm-required ones. Quality of students, which is measured by SAT
scores, for dorm-required institutions is higher by 6∼10% but the cost of attendance measured by
sticker price is more expensive for dorm-policy institutions; about 10% for public 4-year colleges
and 40% for private 4-year colleges. Another notable difference is the dependency on non-tuition
revenue including various appropriations for dorm-required public institutions. Last, dorm-required
institutions account for 60% of land grant institutions and 65% of flagship institutions.
4 Responses to labor market shock in the higher education
market
Given that the goal of the study is to explore how institutions optimized their resources in response
to the shock in labor market during Great recession and how the constraints in supply-side affected
enrollment decision, the analysis is focused on periods from years prior to the onset of recession
to years past the end of recession, from 2004 to 2011, and mainly highlights the circumstances of
4-year not-for-profit public and private institutions since the FTFY enrollment for 2-year public and
private institutions with dorm-required policy hardly exist, as described in Table 2.
A simple statistical model for describing the cyclicality in higher education is
lnnit = α1 + α2Ut + τt + ci + ǫit (3)
where nit is enrollment at institution i in year t, Ut is unemployment rate, τt is time fixed effect, ci is
12See Lindo et al. (2013) for more discussion on the validity of mass layoff data.
12

institution fixed effect, and ǫit is a random error term. If unemployment rate properly represents the
labor market condition or cyclical variation, then α2 R 0 as enrollment is countercyclical, noncyclical,
or procyclical.
This approach, however, has limitation in at least two aspects. First, the model is imprecisely
specified in the sense that it was implicitly assumed there is no constraint in the supply side. Second,
if a researcher uses national unemployment rate, which is same across all institutions, with time
fixed effect, then one of year dummy will be automatically removed due to perfect multicollinearity.
Individual institutions are sharing common time effects and it results in biases of standard error
estimators. The second issue can be resolved by following method suggested in Solon, Barsky,
and Parker (1994). Equation (3) is estimated in two steps. In the first step, OLS is applied to
institutional-level regression of log enrollment on eight year dummies with school fixed effects and
generate national level average year effect. In the second step, OLS is applied to regression of the
estimated coefficients of year dummy on linear time-trend t, Ut, and other variables that describes
the constraints in supply side.
Figure 2 shows that the demand for higher education, which is measured by the number of
application, was increased during the Great recession period across all types.13 It indicates that
there is cyclicality in demand,14 which implies that the effect of the decrease in the opportunity
costs of investment outweighs that of the increase in liquidity constraint. However, how it is served
to supply and the extent to which institutions are responding would vary across types of institutions.
Institutions without supply-side constraints that would not consider dorm requirement regulation
are more likely to be flexible in adjusting the enrollment size with respect to changes in demand and
thus are more driven by demand. On the other hand, other institutions with enrollment capacity
constraint in the short run might choose to maximize different dimensions, including competing in
school quality, hiring better faculty, and raising their endowment.
The empirical analysis begins with exploring the relationship labor market shock and institution
revenue.
13Two-step regression yields a statistically significant positive α2 implying that demand is countercyclical.14Yield rate in Figure 2(b) is moderately decreasing over years, which might be due to the increase in competition
with other institutions, and is consistent with the assumption in the model that an institution can accurately predictthe yield rate.
13

4.1 Budget
The most important sources of total revenue is from unrestricted revenues, which is the sum of
tuition from students and appropriation largely from state and federal governments. Table 2 indi-
cates that the share of non-tuition revenue including appropriations is different across institution
types. Lowry (2001) reported that the median share of all unrestricted revenues obtained from these
sources was 78 percent in 1994–95. Figure 3 displays similar FTE appropriation and nontuition
revenue patterns across all types of institutions and differences are only in terms of the level; public
institutions are more dependent on nontuition revenues. Figure 3(a) further indicates that the de-
cline in appropriation occurred to every institution during Great recession, which implies that those
institutions could try to increase the tuition to recover some of the lost revenues.
Figure 4(a) shows that all four-year institutions have the same increasing trend in tuition but the
rise in out-of-state tuition is relatively sharper for dorm-not-required institutions during 2004-2010;
17% in public colleges and 15% in private colleges. For dorm-required institutions, the increment
is smaller; 13% for public institutions and 10% for private institutions. While the “sticker price”
or posted tuition and fee has been increased, “net price”, which is the difference between sticker
price and financial aid from federal, state, and institution, has been stayed quite stable as in Figure
4(b). Thus some institutions, which face cut in state/federal appropriation and provide financial
aid to students at the same time, have another option to make up the fall in appropriation; enroll
additional students.
4.2 Enrollment
One of the natural responses for institutions to the Great recession is to increase the enrollment
size by either the need or the desire to increase tuition revenue as argued by Duffy and Goldberg
(1998).15 With larger enrollment, institutions can increase the revenue, however, not all institutions
are capable of serving more students; some schools with dorm-required policy for freshmen have to
deal with the capacity constraint in the short-run. As noted above, equation (3) cannot be estimated
with national unemployment rate when institution level data are used and is estimated by two-step
method.
15It is assumed that p, A, I were chosen by the board before selecting the number of students and institutionstake those values as given. Some may argue that given non-tuition revenue received, per student resource, I, woulddecrease when enrollment increases and thus decreases the quality of education. If I is changing as the number ofstudent changes, institutions need to make decisions on at least three dimensions (quantity, quality, and expenditure),which makes the analysis more complicated.
14

Table 3 summarizes the empirical analysis with the two-step estimation of the elasticity of FTFY
enrollment, defined as the natural log of FTFY enrollment, with respect to unemployment rate,
defined as the national unemployment rate among 16-19. Note that the number of observation is
equal to the number of years (1986-2011) as average year effect is generated in the first stage. Panel
A summarizes estimation results that was generally used in previous studies on cyclicality in higher
education. Previous results did not consider any constraints in the supply side and estimates in the
first row are consistent with previous studies; countercyclicality in 2-year institutions and almost
no or weak cyclicality with 4-year institutions. By comparing Panel B and Panel C, it is obvious
that supply constraint is playing a significant role in enrollment adjustment with respect to changes
in labor market; for dorm-required institutions, the increase in enrollment is smaller than that of
dorm-not-required institutions and on average decreased the enrollment size, which are consistent
with model’s prediction on supply-constrained institutions. 16
An alternative way to analyze the cyclicality while utilizing full benefits of rich micro data is to
use state variation. As briefly stated previous section, state-level unemployment rate, however, has
at least two issues being addressed for the analysis. The data are tend to be less accurate due to the
nature of CPS sampling design. Next concern is the extent of how the local labor market condition
of where the institution is located will be affecting the institution’s decision on enrollment. From
institution’s perspective, if outside funding such as state appropriation is fluctuating along with
labor market condition within state, it is appropriate to use state unemployment rate. On the other
hand, from college applicant’s stance, it is the local labor market condition of where they live that
has more impact on enrollment decision, which in turn changes the demand for higher education.
For instance, high school students in Michigan would consider more about the local economy in
California than that in Michigan if they are applying to colleges in California.
First concern can be alleviated by using mass layoff statistics from BLS, which reports the number
of mass layoff events.17 The second issue is dealt by constructing additional measure of unemploy-
ment rate that applicants are facing. It is average state unemployment rate among accepted students
weighted by their enrollment size. If a college is in national level, the weighted unemployment re-
flects various applicants’ local economy conditions. For examples, during the economy downturn in
16There are other national measures such as unemployment rate over 20 years old, by census region, and by censusdivision, and all of these measures have the same results with respect to supply constraints but with slightly differentmagnitude.
17Mass layoff numbers are from establishments which have at least 50 initial claims for unemployment insurance(UI) filed against them during a 5-week period. This measure also has measurement error if each state has differentpolicy for unemployment insurance but is presented to investigate the role of supply constraints.
15
Michigan due to the fall of automobile industry, the demand for University of Ann Arbor, where
more than 50% of students are coming from other states, is less likely to be affected by local labor
market condition than Eastern Michigan University and is more likely to be affected by the market
condition in other states.
Table 4 presents OLS estimation results of Equation (3) focusing on 4-year institutions with
different local unemployment measures between 2004 and 2011 since there are only 22 public 2-year
colleges and five private 2-year institutions with dorm policy.18 Results with positive coefficients
on local labor market measures indicate that these schools increased the enrollment size during the
Great Recession. It might be that those colleges were not at the capacity limit before the recession
and hit the corner with a small expansion. Or the constraints that they are facing are rather soft-
constraints in the sense that institutions can accommodate more than on-campus housing limits
as they can provide housing in off-campus, which is more costly than on-campus housing. Certain
institutions, where more freshmen showed up than on-campus housing capacity, have contracts with
off-campus facilities and reserved extra spaces. More discussion on the size of supply constraint
and enrollment are provided in Section 4.5. Overall, results are consistent with the conjecture that
capacity constrained institutions experienced smaller increment in enrollment than non-constrained
institutions.
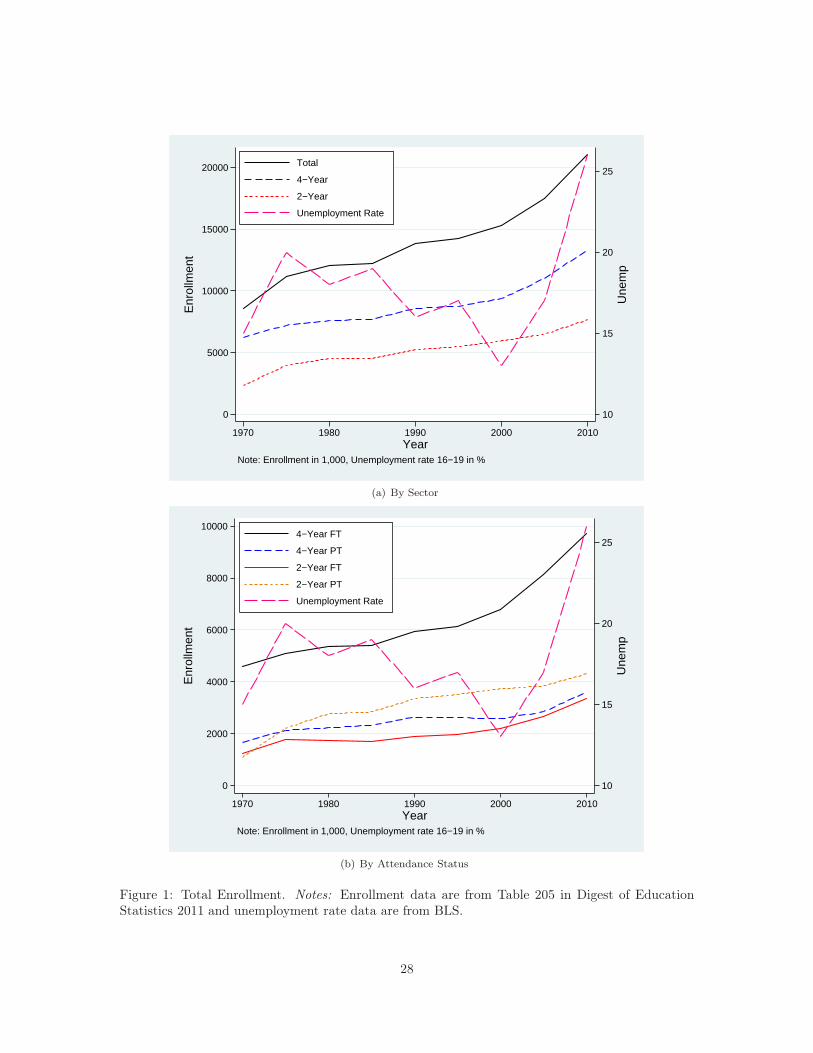
Another way to recover the decline in appropriation is by increasing the number of out-of-state
students. Figure 5 plots enrollment by residency in public 4-year institutions and shows that the
largest share of enrollment is from in-state students. Institutions with dorm-requirement policy
have larger share of out-of-state enrollment FTFY students (47%) than those without the policy
(40%), but have not steadily increased the share of out-of-state enrollment during Great recession.
With lower appropriation, the marginal benefit of $1 is greater for tuition revenue and institutions
could achieve it by enrolling more of out-of-state students. Dorm-required institutions might have
stronger incentive to change the mix of students, however, the mixture stayed rather stable during
the recession period. One possible answer could be that the increase in demand is mostly from
in-state students because students might choose institutions within state as the marginal cost of $1
is greater, but is left for future research.
18Freshmen enrollment by state data are available from 1986 for almost every other years but it was optionalto submit the data in 2001, 2003, 2005, 2007, 2009, and 2011. Thus weighted measures cover different numberof institutions year by year and the sample size is smaller in estimation when weighted measures are used. Whenestimated from 2004 for only mandatory years to report enrollment by state, the results show the similar pattern thatdorm-required institutions experienced smaller increase or decrease in enrollment.
16

4.3 Quality
With the countercyclicality in higher education, there is an increasing number of application during
the recession, however, given capacity fixed in short-run, institutions can choose an alternative
dimension in enrollment; raise standards for acceptance, which increases quality of new students. If
we believe that the proportional increase in demand is lower for more talented students and that
they are more prone to have higher education and are less affected by local labor market conditions,
then most of increase in demand might come from students with average or low quality.
Figure 6 represents different changes in quality pattern across institution types, where quality is
measured by average SAT scores of freshmen. For dorm-not-required institutions, the quality level of
high ability students (SAT 75th percentile) or that of low quality students (SAT 25th percentile) is
quite similar. The changes in quality for those institution is as expected in the model and the overall
quality of new students has been decreased during the recession period. The pattern is most explicit
for high quality students (SAT 75th) in private 4-year institutions. For dorm-required institutions,
private institutions have higher SAT score on average, which supports the claim that they are more
selective, and exhibits the opposite pattern for changes in quality; there is an increasing trend in
quality of students during the economic downturn.
Test score data are available from 2001 and two-step method gives rather inaccurate estimates
because the method generates eight observations between 2004 and 2011, or 12 observations for
2001-2011. Thus it is more reasonable to estimate the effect of changes in labor market condition
on quality of new students with local measures used in previous analysis with enrollment. Among
various test score measures, SAT Math 75th percentile score is analyzed since the score was reported
by most number of institutions. Table 5 summarizes the results of the effect of local labor market
measures on quality of new students measured by SAT Math 75th percentile focusing on 4-year
institutions between 2001 and 2011. The results with weighted state unemployment rate indicate
that public 4-year institutions with dorm policy experienced an increase in student quality. With
weighted mass layoff measure, results show that for dorm-required institutions, both in 4-year public
and private, the quality of incoming students increased when unemployment rate increased.
Changes in quality during the Recession are not only determined by the supply constraints but
also by institution’s prestige. Michigan State University (MSU), for example, would not accept
low-quality students who are at the margin affected by cyclical variation in the labor market. There
17

are some students at the margin, who would have been accepted to MSU but received rejection in
recession due to stricter admission standards, and now they need to choose less-talented school. In
lower-quality institutions, the effect on quality is ambiguous as selections are not unit dimensional.
There are some students who were rejected from could-have-been accepted colleges with higher rank,
some good students who would have not gone to colleges if market opportunity would have been
better, and others who are at the margin with relatively lower quality. Since public universities are
mostly less selective than private counterparts. heterogeneous quality of freshmen applies neither
to selective colleges nor to private colleges, but mostly to public colleges. More discussion on the
relationship between prestige of institution and changes in enrollment size and quality is offered in
section 4.6.
4.4 Faculty Staffs
In response to the transitory increase in demand, once institutions decided to expand the enrollment
size, they need to hire extra faculty to provide similar quality of education to new students. Since
hiring new tenured full-time faculty can be considered as long-term investment, institutions might
adjust by hiring faculty with lower cost such as non-tenured or part-time faculty,19 implying that
those faculties are at the margin of employment.
Figure 7(a) shows that institutions hired different types of faculty and how they responded to
cyclical shocks. During the recession, 4-year institutions without dorm regulation, which experienced
an increase in their enrollments, increased faculty size mostly in part-time positions. Moreover, in
Figure 7(b), these institutions hired more of new non-tenured faculties and less of new tenured
faculties to meet the transitory shock in demand implying that those institutions in short-term
adjusted by hiring faculty with lower or zero fixed cost.20
4.5 Size of Supply Constraints
One might be concerned that the enrollment adjustment in dorm-required institutions with larger
dorm capacity would be different from those with smaller dorm capacity. Institutions with smaller
19For long-run growth, quality/cost is higher with this tenured faculty and institutions will be able spread theinvestment cost over longer period. Then it would be reasonable to hire them.
20In comparison with 2-year institutions, 4-year institutions hire more full-time than part-time faculties whereaspublic 2-year institutions hire more part-time faculties. Public 2-year institutions especially hired more of non-tenurefaculty not on tenure track, and not much of full time, who can be relatively readily employed temporarily with lowerwages.
18

capacity can more easily increase the enrollment size as the cost is relatively lower. On the other
hand, institutions with larger capacity can increase the enrollment size if on-campus housing is
under-utilized or have to make additional contracts with off-campus housing that is more costly.
Dorm-required institutions are grouped by the dorm capacity size. Dorm capacity of 700, 1400,
2600, and 6500 represents 25%, 50%, 75%, and 99% of observation respectively. Figure 8 displays the
enrollment and quality trends across different capacity and the responses in FTE FTFY enrollment
are different across dorm capacity sizes. Most of institutions increased the enrollment size and
experienced drop in quality whereas middle dorm-size (2600∼6500) institutions relatively decreased
the enrollment size and increased the admission standards by accepting students with better quality.
Table 6 summarizes OLS estimation results of weighted state unemployment rate on enrollment
size and quality of FTFY enrollment between 2001 and 2011 among 4-year institutions, and indicates
that the enrollment adjustment occurred in different rate. On average, institutions with dorm size
less than 2600 expanded the class size during economic downturn and experienced a drop in student
quality. On the other hand, colleges with dorm size greater between 2600 and 6500 had decreased
enrollment size and have relatively increased the quality of freshmen measured by SAT Math 75th
percentile. Results imply that colleges with small size of dorm have relatively lower cost of accepting
additional students and capacity constraint is rather soft. On the other hand, for institutions with
large size of dorms, the constraint is relatively binding harder as they increased smaller size of
enrollment.
4.6 Prestige
Some schools are at national level and local condition would affect their decision on enrollment less
than lower quality schools because many high quality students are coming from other states, who are
less influenced by labor market conditions. Table 7 presents different quantity and quality adjustment
by prestige status between 2001 and 2011 with weighted state unemployment rate. Prestige status
is assembled from US and World Report in 2005 and in 2013. Institutions were grouped into Top
120 Public, Top 50 Public, Top 65 Private, Top 180 Liberal and Arts, and Top 50 Liberal and Arts
institutions.
By comparing the coefficients on unemployment between Panel A and Panel B, it turns out that
prestigious schools reacted to the Recession by decreasing or increasing small size of enrollment
while less prestigious schools increased the enrollment size. The changes in quality by prestige type
19

is described in Panel C and Panel D. Coefficients on unemployment is positive for national and top
private schools indicating that the quality of incoming students were increased during the Great
Recession. On the other hand, for less prestigious colleges coefficients are negative, which implies
that the quality of new students has declined for those schools.
5 Conclusion
With worsening economic conditions, institutions experienced a slide in outside financial resources
and an increase in demand at the same time. Institutions, who are maximizing the combination of
school quality and profits, came up with other means to compensate the lost in revenue; accepting
more students. By far most studies implicitly assumed that institutions are capable of enrolling more
students, especially during recession, but only acknowledged possible constraints on supply-side, and
not much attention was paid to changes in quality of students.
This study presents how an institution chooses quantity and quality simultaneously and modeled
utility maximization problem for institution, from which implications were derived on enrollment and
quality of students when there are changes in labor market conditions. Those implication were tested
by using dorm-requirement policy variable from IPEDS, which was collected and further modified
to represent the supply capacity constraint. Results show that there are considerable heterogeneous
responses by type of institution in enrollment, changes in school quality as well as adjustment in
resources when the constraint is taken into account.
Institutions with dorm-requirement policy tend to have a smaller increase in enrollment or a
decrease in enrollment compared to those without the policy. As a result, institutions with dorm
policy experienced an increase in quality of new freshmen whereas institutions without the policy
faced decrease in the quality and adjusted by hiring new faculty with lower cost such as non-tenured
not on tenure-track. Among dorm-required colleges, the responses to Great Recession is quite
different based on dorm capacity and prestige.
An inference from the model is that if prestigious institutions face a cut in outside funding,
institutions with supply capacity constraint might be much choosier and increase the quality of new
students. If it is the case, then the quality gap between prestigious and middle ranked institutions
will expand. Another interesting topic would be to explore how the matching between prestige of
college and applicants were altered when the supply constraint is taking into account.
20

Some recent studies pointed out the expansion of non-residential programs and an increase in
entry of for-profit institutions, however, most of for-profit institutions are not required to provide
on-campus housing to freshmen and they are almost not receiving any appropriations.21 Thus those
for-profit institutions are not much constrained in the supply-side and can expand the enrollment
more promptly when there is a temporary increase in demand.
References
[1] K. J. Arrow and M. D. Intriligator. Handbook of the Economics of Education Vol II, volume 2
of Handbook of the Economics of Education15740692. Elsevier, 2006.
[2] A. Barr and S. E. Turner. Down and Enrolled: The Impact of the Great Recession on Invest-
ments in Post-Secondary Education. Working Paper, pages 1–50, Aug. 2012.
[3] A. Barr and S. E. Turner. Down and Enrolled: An Examination of the Enrollment Response
to Cyclical Trends and Job Loss. Working Paper, pages 1–47, Jan. 2013.
[4] A. Barr and S. E. Turner. Expanding Enrollments and Contracting State Budgets: The Effect
of the Great Recession on Higher Education. ANNALS of the American Academy of Political
and Social Science, 650(1):168–193, Sept. 2013.
[5] J. Betts and L. McFarland. Safe Port in a Storm: The Impact of Labor Market Conditions on
Community College Enrollments. Journal of Human Resources, pages 741–765, 1995.
[6] J. Bound and S. E. Turner. Cohort crowding: How resources affect collegiate attainment.
Journal of Public Economics, 91(5-6):877–899, June 2007.
[7] S. V. Cameron and J. J. Heckman. The Dynamics of Educational Attainment for Black, His-
panic, and White Males. Journal of Political Economy, 109(3):455–499, June 2001.
[8] M. S. Christian. The Response of State Universities to Changes in the Demand for Public
Higher Education, 1980-95. pages 1–61, 2004.
[9] M. S. Christian. Liquidity Constraints and the Cyclicality of College Enrollment in the United
States. Oxford Economic Papers, 59(1):141–169, June 2006.
21Less than 0.01% of all for-profit institutions have dorm-requirement policy and they received on average $285 ofappropriation during 2004-2011.
21

[10] H. De Groot, W. W. McMahon, and J. F. Volkwein. The cost structure of American research
universities. Review of Economics and Statistics, pages 424–431, 1991.
[11] H. Dellas and V. Koubi. Business cycles and schooling. European Journal of Political Economy,
19(4):843–859, Nov. 2003.
[12] H. Dellas and P. Sakellaris. On the cyclicality of schooling: Theory and evidence. 1996.
[13] H. Dellas and P. Sakellaris. On the Cyclicality of Schooling: Theory and Evidence. Oxford
Economic Papers, 55(1):148–172, 2003.
[14] E. A. Duffy. Crafting a Class, 1998.
[15] D. Epple and R. Romano. Educational Vouchers and Cream Skimming. International Economic
Review, 49(4):1395–1435, 2008.
[16] D. Epple and R. E. Romano. Competition between Private and Public Schools, Vouchers, and
Peer-group Effects. American Economic Review, pages 33–62, 1998.
[17] R. K. Koshal and M. Koshal. Do liberal arts colleges exhibit economies of scale and scope?
Education Economics, 8(3):209–220, 2000.
[18] E. P. Lazear. Educational Production. Quarterly Journal of Economics, 116(3):777–803, 2001.
[19] J. M. Lindo, J. Schaller, and B. Hansen. Economic Conditions and Child Abuse. NBER Working
Paper, 2013.
[20] M. F. Lovenheim. The Effect of Liquid Housing Wealth on College Enrollment. Journal of
Labor Economics, 29(4):741–771, Oct. 2011.
[21] R. C. Lowry. The Effects of State Political Interests and Campus Outputs on Public University
Revenues. Economics of Education Review, 20(2):105–119, 2001.
[22] T. J. Nechyba. Centralization, Fiscal Federalism, and Private School Attendance. International
Economic Review, 44(1):179–204, Jan. 2008.
[23] C. A. Pissarides. Regular Education as a Tool of Counter-cyclical Employment Policy, May
2010.
22

[24] G. Solon, R. Barsky, and J. A. Parker. Measuring the cyclicality of real wages: how important
is composition bias? Quarterly Journal of Economics, 109(1):1–25, 1994.
Appendix A.
A.1. Proof of Proposition 1
Using the implicit function theorem on (2), let
G = απnθ + βπ∂θ
∂n= 0
then for non-zero or positive profit institutions, assume ∂A∂w
> 0 and p > I
∂n
∂w=∂n
∂A
∂A
∂w
=−∂G/∂A
∂G/∂n
∂A
∂w
=−β ∂θ
∂n
α(p− I) ∂θ∂n
+ βπn∂θ∂n
+ βπ ∂2θ∂n2
∂A
∂w
Then the sign of ∂n∂w
depends on signs of ∂θ∂n
and ∂2θ∂n2 .
Case 1. a < n < n̄ (Type A Institutions)
θ(n) = ln(n̄+ b
n̄− n+ a)
= ln(n̄+ b)− ln(n̄− n+ a)
Then
∂θ
∂n= −
−1
n̄− n+ a> 0
23

∂2θ
∂n2= −
1
(̄n− n+ a)2< 0.
So
∂n
∂w=−
β ∂θ∂n
α(p− I) ∂θ∂n
+ βπn∂θ∂n
+ βπ ∂2θ∂n2
∂A
∂w
=−β 1
n̄−n+a
α(p− I) 1n̄−n+a
+ βπn1
n̄−n+a+ βπ 1
(̄n−n+a)2
∂A
∂w
=−β(n̄− n+ a)
(α+ β)(p− I)(n̄− n+ a)− β(pn+A− In− c0)
∂A
∂w
Note that if budget binds, pn+A− In− c0 = 0, then ∂n∂w
> 0. In general if c0 > (pn+A− In)−
α+β
β(p− I)(n̄− n+ a) ≡ V or if α > βM where M = (p−I)(2n−n̄−a)+c0−A
(p−I)(n̄−n+a) ,
∂n
∂w< 0
Case 2. n < a < n̄ (Type B Institutions)
θ(n) = ln(n̄+ b
n̄+ n− a)
= ln(n̄+ b)− ln(n̄+ n− a)
Then
∂θ
∂n= −
1
n̄+ n− a< 0
∂2θ
∂n2=
1
(n̄+ n− a)2> 0.
Similarly
24

∂n
∂w=−
β ∂θ∂n
α(p− I) ∂θ∂n
+ βπn∂θ∂n
+ βπ ∂2θ∂n2
∂A
∂w
=β(n̄+ n− a)
β(pn+A− In− c0)− (α+ β)(p− I)(n̄+ n− a)
∂A
∂w
, which is the same result as in Case 1. Thus
∂n
∂w< 0
Case 3. n > n̄
Now πn = (p− I − c1−c0n
). Then the analysis is similar to Case 1,
θ(n) = ln(n̄+ b
n̄− n+ a)
= ln(n̄+ b)− ln(n̄− n+ a)
Then
∂θ
∂n= −
−1
n̄− n+ a> 0
∂2θ
∂n2= −
1
(̄n− n+ a)2< 0.
Similarly
∂n
∂w=−
β ∂θ∂n
α c1−c0n2 θ + (α+ β)(p− I − c1−c0
n) ∂θ∂n
+ βπ ∂2θ∂n2
∂A
∂w
which is similar to previous one in Case 1. If c1− c0 is not big and α > βM , then ∂n∂w
< 0. However,
for those institutions where c1 − c0 is not negligible, | ∂n∂w
| gets smaller, which implies that the
25

increment in enrollment is much smaller than other types. If c1 − c0 is large enough then ∂n∂w
could
be positive.
∂n
∂wS 0. |||
A.2. Proof of Proposition 2
Using the implicit function theorem on (2), let
G = απnθ + βπ∂θ
∂n= 0
then for non-zero or positive profit institutions, assume ∂A∂w
> 0 and p > I
∂θ
∂w=∂θ
∂n
∂n
∂w
Then the sign of ∂θ∂w
depends on signs of ∂θ∂n
and ∂n∂w
, which are already shown in A.1. Note that ∂n∂w
is generally positive for c1 > L and α > βM , which implies that the sign of ∂θ∂w
is determined by the
sign of ∂θ∂n
.
Case 1. a < n < n̄ (Type A Institutions)
Since ∂θ∂n
> 0 and ∂n∂w
< 0 for c1 > L and α > βM ,
∂θ
∂w<0
Case 2. n < a < n̄ (Type B Institutions)
Similarly, with ∂θ∂n
< 0 and ∂n∂w
< 0 for c1 > L and α > βM ,
26

∂θ
∂w>0
Case 3. n > n̄
Unlike previous cases, the sing of ∂n∂w
is ambiguous. With ∂θ∂n
> 0, institutions with small c1 − c0,
∂n∂w
is negative. Thus,
∂θ
∂w<0
However, if c1 − c0 is large enough so that ∂n∂w
becomes positive, then
∂θ
∂w>0. |||
27
10
15
20
25
Une
mp
0
5000
10000
15000
20000
Enr
ollm
ent
1970 1980 1990 2000 2010Year
Total
4−Year
2−Year
Unemployment Rate
Note: Enrollment in 1,000, Unemployment rate 16−19 in %
(a) By Sector
10
15
20
25
Une
mp
0
2000
4000
6000
8000
10000
Enr
ollm
ent
1970 1980 1990 2000 2010Year
4−Year FT
4−Year PT
2−Year FT
2−Year PT
Unemployment Rate
Note: Enrollment in 1,000, Unemployment rate 16−19 in %
(b) By Attendance Status
Figure 1: Total Enrollment. Notes: Enrollment data are from Table 205 in Digest of EducationStatistics 2011 and unemployment rate data are from BLS.
28

16
18
20
22
24
26
16
18
20
22
24
26
16
18
20
22
24
26
16
18
20
22
24
26
1000
2000
3000
4000
5000
2000
4000
6000
8000
10000
500
1000
1500
2000
0
5000
10000
2004 2006 2008 2010 2012 2004 2006 2008 2010 2012
2004 2006 2008 2010 2012 2004 2006 2008 2010 2012
Pub 4yr, Dorm Not Required Pub 4yr, Dorm Required
Prv 4yr, Dorm Not Required Prv 4yr, Dorm Required
Application Admission
FTE FTFY Enrollment Unemployment 16−19
(a) Application, Admission, and Enrollment
.4
.5
.6
.7
.4
.5
.6
.7
.3
.4
.5
.6
.7
.3
.4
.5
.6
2004 2006 2008 2010 2012 2004 2006 2008 2010 2012
2004 2006 2008 2010 2012 2004 2006 2008 2010 2012
Pub 4yr, Dorm Not Required Pub 4yr, Dorm Required
Prv 4yr, Dorm Not Required Prv 4yr, Dorm Required
Acceptace Yield
(b) Acceptance and Yield Rate
Figure 2: Application, Admission, Enrollment, and Acceptance Rate by Institution Types. Notes:Data are from author’s calculation using IPEDS weighted by FTFY enrollment size.
29

16
18
20
22
24
26
16
18
20
22
24
26
16
18
20
22
24
26
16
18
20
22
24
26
60000
65000
70000
45000
50000
55000
800
900
1000
1100
1200
1500
2000
2500
3000
2004 2006 2008 2010 2004 2006 2008 2010
2004 2006 2008 2010 2004 2006 2008 2010
Pub 4yr, Dorm Not Required Pub 4yr, Dorm Required
Prv 4yr, Dorm Not Required Prv 4yr, Dorm Required
FTE Appropriation Unemployment 16−19
FT
E A
ppro
pria
tion
(a) FTE Appropriation
16
18
20
22
24
26
16
18
20
22
24
26
16
18
20
22
24
26
16
18
20
22
24
26
.6
.62
.64
.66
.62
.64
.66
.68
.1
.15
.2
.25
.3
.2
.3
.4
.5
2004 2006 2008 2010 2004 2006 2008 2010
2004 2006 2008 2010 2004 2006 2008 2010
Pub 4yr, Dorm Not Required Pub 4yr, Dorm Required
Prv 4yr, Dorm Not Required Prv 4yr, Dorm Required
Non−tuition Share Unemployment 16−19
Non
tuiti
on S
hare
(b) Non-Tuition Share to Revenue
Figure 3: FTE Appropriation and Non-Tuition Share by Institution Types. Notes: Data are fromauthor’s calculation using IPEDS weighted by FTFY enrollment size.
30

16
18
20
22
24
26
16
18
20
22
24
26
16
18
20
22
24
26
16
18
20
22
24
26
5000
10000
15000
5000
10000
15000
20000
18000
18500
19000
19500
20000
25000
30000
2004 2006 2008 2010 2004 2006 2008 2010
2004 2006 2008 2010 2004 2006 2008 2010
Pub 4yr, Dorm Not Required Pub 4yr, Dorm Required
Prv 4yr, Dorm Not Required Prv 4yr, Dorm Required
In District In State
Out of State Unemployment 16−19
Tuition and Fees
(a) Tuition by Residence
16
18
20
22
24
26
16
18
20
22
24
26
16
18
20
22
24
26
16
18
20
22
24
26
5000
10000
15000
5000
10000
15000
20000
5000
10000
15000
20000
0
10000
20000
30000
2004 2006 2008 2010 2004 2006 2008 2010
2004 2006 2008 2010 2004 2006 2008 2010
Pub 4yr, Dorm Not Required Pub 4yr, Dorm Required
Prv 4yr, Dorm Not Required Prv 4yr, Dorm Required
Out−of−State Tuition and Fees Out−of−State Net Price
Unemployment 16−19
Net Price: Tuition and Fees − Avg. Grant from Federal, State, Institution
(b) Tuition and Net Price
Figure 4: Tuition and Net Price by Institution Types. Notes: Data are from author’s calculationusing IPEDS weighted by FTFY enrollment size.
31
16
18
20
22
24
26
16
18
20
22
24
26
1500
2000
2500
2200
2400
2600
2004 2006 2008 2010 2004 2006 2008 2010
Pub 4yr, Dorm Not Required Pub 4yr, Dorm Required
In State Out of State
Unemployment 16−19
(a) Enrollment by Residence
16
18
20
22
24
26
16
18
20
22
24
26
.4
.45
.5
.55
.6
.46
.48
.5
.52
.54
2004 2006 2008 2010 2004 2006 2008 2010
Pub 4yr, Dorm Not Required Pub 4yr, Dorm Required
Share of In State Share of Out of State
Unemployment 16−19
(b) Enrollment Share of Residence
Figure 5: Enrollment in Public 4-year. Notes: FTFY enrollment data are from author’s calculationusing IPEDS weighted by FTFY enrollment size.
32

16
18
20
22
24
26
16
18
20
22
24
26
16
18
20
22
24
26
16
18
20
22
24
26
460
465
470
475
490
500
510
520
465
470
475
480
530
535
540
2004 2006 2008 2010 2012 2004 2006 2008 2010 2012
2004 2006 2008 2010 2012 2004 2006 2008 2010 2012
Pub 4yr, Dorm Not Required Pub 4yr, Dorm Required
Prv 4yr, Dorm Not Required Prv 4yr, Dorm Required
SAT Reading 25th SAT Math 25th
Unemployment 16−19
(a) SAT 25th
16
18
20
22
24
26
16
18
20
22
24
26
16
18
20
22
24
26
16
18
20
22
24
26
570
580
590
600
610
620
630
570
575
580
585
590
635
640
645
650
2004 2006 2008 2010 2012 2004 2006 2008 2010 2012
2004 2006 2008 2010 2012 2004 2006 2008 2010 2012
Pub 4yr, Dorm Not Required Pub 4yr, Dorm Required
Prv 4yr, Dorm Not Required Prv 4yr, Dorm Required
SAT Reading 75th SAT Math 75th
Unemployment 16−19
(b) SAT 75th
Figure 6: Quality of FTFY by Institution Types. Notes: SAT data are from author’s calculationusing IPEDS weighted by FTFY enrollment size.
33

16
18
20
22
24
26
16
18
20
22
24
26
16
18
20
22
24
26
16
18
20
22
24
26
400
600
800
1000
0
500
1000
1500
150
200
250
300
350
200
400
600
800
2004 2006 2008 2010 2012 2004 2006 2008 2010 2012
2004 2006 2008 2010 2012 2004 2006 2008 2010 2012
Pub 4yr, Dorm Not Required Pub 4yr, Dorm Required
Prv 4yr, Dorm Not Required Prv 4yr, Dorm Required
Faculty Full−Time Faculty Part−Time
Unemployment 16−19
(a) Total Faculty
16
18
20
22
24
26
16
18
20
22
24
26
16
18
20
22
24
26
16
18
20
22
24
26
0
10
20
30
0
20
40
60
2
4
6
8
10
0
10
20
30
40
2004 2006 2008 2010 2012 2004 2006 2008 2010 2012
2004 2006 2008 2010 2012 2004 2006 2008 2010 2012
Pub 4yr, Dorm Not Required Pub 4yr, Dorm Required
Prv 4yr, Dorm Not Required Prv 4yr, Dorm Required
New Faculty With Tenure Faculty Non−tenured on Tenure Track
Unemployment 16−19 Faculty Non−tenured Not on Tenure Track
(b) New Faculty by Position
Figure 7: Faculty Employment by Institution Types. Notes: Faculty enrollment data are fromauthor’s calculation using IPEDS weighted by FTFY enrollment size.
34

16
18
20
22
24
26
16
18
20
22
24
26
16
18
20
22
24
26
16
18
20
22
24
26
16
18
20
22
24
26
16
18
20
22
24
26
16
18
20
22
24
26
16
18
20
22
24
26
16
18
20
22
24
26
16
18
20
22
24
26
400
500
600
700
600
800
1000
1200
1400
1600
1800
2000
2200
2500
3000
3500
4000
4500
5000
5500
6000
6500
200
250
300
350
400
400
450
500
550
600
700
750
800
850
1600
1800
2000
2200
3000
3500
4000
4500
2004 2006 2008 2010 2012 2004 2006 2008 2010 2012 2004 2006 2008 2010 2012 2004 2006 2008 2010 2012
2004 2006 2008 2010 2012 2004 2006 2008 2010 2012 2004 2006 2008 2010 2012 2004 2006 2008 2010 2012
2004 2006 2008 2010 2012 2004 2006 2008 2010 2012
Pub 4yr, Room Capacity<700 Pub 4yr, Room Capacity<1400 Pub 4yr, Room Capacity<2600 Pub 4yr, Room Capacity<6500
Pub 4yr, Room Capacity>6500 Prv 4yr, Room Capacity<700 Prv 4yr, Room Capacity<1400 Prv 4yr, Room Capacity<2600
Prv 4yr, Room Capacity<6500 Prv 4yr, Room Capacity>6500
FTFY Enrollment Unemployment 16−19
FT
E F
TF
Y E
nrol
lmen
t
(a) Enrollment by Dorm Capacity
16
18
20
22
24
26
16
18
20
22
24
26
16
18
20
22
24
26
16
18
20
22
24
26
16
18
20
22
24
26
16
18
20
22
24
26
16
18
20
22
24
26
16
18
20
22
24
26
16
18
20
22
24
26
16
18
20
22
24
26
420
440
460
480
420
430
440
450
440
445
450
455
460
480
490
500
510
520
530
540
550
560
435
440
445
450
470
480
490
500
510
520
530
540
570
575
580
585
590
590
600
610
620
630
2004 2006 2008 2010 2012 2004 2006 2008 2010 2012 2004 2006 2008 2010 2012 2004 2006 2008 2010 2012
2004 2006 2008 2010 2012 2004 2006 2008 2010 2012 2004 2006 2008 2010 2012 2004 2006 2008 2010 2012
2004 2006 2008 2010 2012 2004 2006 2008 2010 2012
Pub 4yr, Room Capacity<700 Pub 4yr, Room Capacity<1400 Pub 4yr, Room Capacity<2600 Pub 4yr, Room Capacity<6500
Pub 4yr, Room Capacity>6500 Prv 4yr, Room Capacity<700 Prv 4yr, Room Capacity<1400 Prv 4yr, Room Capacity<2600
Prv 4yr, Room Capacity<6500 Prv 4yr, Room Capacity>6500
SAT Reading 25th SAT Math 25th
Unemployment 16−19
(b) Quality by Dorm Capacity
Figure 8: Enrollment and Quality by Dorm Capacity. Notes: FTE FTFY enrollment and SAT dataare from author’s calculation using IPEDS weighted by FTFY enrollment size.
35

Revised Dorm Variable
0 1 2 3 4 5 6 7 8 Total
Original
0 7,761 0 0 0 0 0 0 0 0 7,761
1 107 2 5 4 1 0 1 1 52 173
2 38 0 2 3 2 2 1 1 55 104
3 21 1 2 1 4 3 5 0 68 105
4 18 2 0 0 0 2 2 3 60 87
5 21 1 2 0 1 5 3 2 80 115
6 16 1 2 0 3 3 5 3 88 121
7 21 0 1 4 1 1 2 3 118 151
8 0 0 0 0 0 0 0 0 203 203
Total 8,003 7 14 12 12 16 19 13 724 8,820
Notes: Each number indicates the number of institution. Original refers to ALLOCAMvariable in IPEDS and Revised refers to new dorm policy variable after collecting informationfrom each individual institution.
Table 1: Number of Observations with Dorm Policy
36

Dorm Required Dorm Not Required
Public Private Public Private
4-year 2-year 4-year 2-year 4-year 2-year 4-year 2-year
Enrollment
FTFY Enrollment 2,023 364 534 230 1,247 756 290 221FTFY FTE 2,006 333 531 227 1,195 625 273 213
Undergrad FTE 9,980 1,145 2,323 471 6,829 3,528 1,471 559In-State 53% 53% 35% 37% 59% 63% 51% 61%
Out-of-State 47% 47% 65% 63% 41% 37% 49% 39%Application 5,160 82 3,157 624 2,010 46 794 60Admission 3,270 45 1,530 395 1,276 35 497 44
Dorm Capacity 3,740 456 1,487 465 1,677 313 720 210
Quality
SAT Verbal 25% 480 437 501 389 446 406 460 413SAT Verbal 75% 588 563 615 499 554 515 571 529SAT Math 25% 493 449 504 393 455 401 459 412SAT Math 75% 601 591 615 506 566 510 571 522
TuitionIn-District 6,415 3,222 24,735 20,175 5,814 2,458 17,193 13,016In-State 6,416 3,377 24,735 20,175 5,822 2,925 17,193 13,022
Out-of-State 15,403 7,330 24,735 20,210 13,770 6,288 17,197 13,045
RevenueTotal 316 17 140 11 227 42 37 8
Unrestricted 244 15 139 13 176 36 41 8Net Tuition 95 4 55 7 66 11 29 7
AppropriationLocal 6 8 0 - 38 15 3 0State 108 7 8 0 88 16 1 0
Federal 68 4 17 - 5 3 4 1
Faculty
Total 846 106 312 35 598 270 153 22New Tenured 6 2 5 1 4 4 4 7
New Not Tenured 27 4 13 2 16 6 5 4New Non on Track 21 3 9 3 14 6 7 3
Part-time / RA 878 1 338 . 432 16 46 5
Obs. 261 22 556 5 390 1,175 1,031 1,154
Notes: Revenue and appropriation variables are measured in Million USD.
Table 2: Descriptive Statistics
37

All Institutions
4-year Institutions 2-year Institutions
All Public PrivatePrivate Not
All Public Privatefor Profit
Panel A: All Institutions
Unemp 0.008* -0.001 0.002 -0.001 0.001 0.014** 0.023*** 0.001(0.004) (0.003) (0.002) (0.004) (0.002) (0.005) (0.003) (0.009)
Obs 26 26 26 26 26 26 26 26
Panel B: Dorm Not Required Institutions
Unemp 0.009 0.001 0.004 -0.001 0.003 0.014** 0.023*** 0.001(0.004) (0.005) (0.003) (0.006) (0.003) (0.005) (0.003) (0.009)
Obs 26 26 26 26 26 26 26 26
Panel C: Dorm Required Institutions
Unemp -0.002 -0.002 -0.001 -0.003** -0.003* 0.012*** 0.006 0.030***(0.001) (0.001) (0.002) (0.001) (0.001) (0.003) (0.003) (0.006)
Obs 26 26 26 26 26 26 26 26
Panel D: Coefficient Difference
Difference 0.011* 0.003 0.004 0.003 0.006* 0.002 0.018** -0.029(0.004) (0.003) (0.002) (0.004) (0.003) (0.005) (0.006) (0.015)
Notes: Each specification includes a full set of fixed effects for individual institutions and years in the first stage,and linear time trend in the second stage. Robust standard errors clustered at the year level are in parentheses.***Significant at the 1 percent level. **Significant at the 5 percent level. *Significant at the 10 percent level.
Table 3: Regression of Log Enrollment on National Unemployment Rate
38

Dorm Not Required Dorm Required
All Public PrivatePrivate Not
All Public PrivatePrivate Not
for Profit for Profit
Panel A: State Unemployment
Unemp 0.017 0.015* 0.019 0.020 0.006 0.006 0.007 0.006(0.009) (0.007) (0.013) (0.014) (0.005) (0.007) (0.006) (0.006)
Obs 9,783 2,953 6,830 4,147 5,941 1,848 4,093 4,077
Panel B: Weighted State Unemployment
Unemp 0.019 0.017* 0.020 0.027 0.010 0.009 0.013 0.012(0.011) (0.008) (0.017) (0.02) (0.006) (0.008) (0.009) (0.009)
Obs 8,016 2,600 5,416 3,273 5,120 1,749 3,371 3,360
Panel C: State Mass Layoff
Unemp 0.038 -0.022 0.072* 0.064* 0.009 0.016 0.007 0.009(0.023) (0.026) (0.032) (0.03) (0.012) (0.014) (0.017) (0.017)
Obs 9,783 2,953 6,830 4,147 5,940 1,847 4,093 4,077
Panel D: Weighted State Mass Layoff
Unemp 0.032 -0.023 0.061 0.002 0.032 0.037 0.027 0.027(0.03) (0.033) (0.042) (0.044) (0.016) (0.02) (0.025) (0.025)
Obs 8,016 2,600 5,416 3,273 5,120 1,749 3,371 3,360
Notes: Each specification includes a full set of fixed effects for individual institutions and years, between2004 and 2011. Robust standard errors clustered at the institution level are in parentheses.***Significant at the 1 percent level. **Significant at the 5 percent level.*Significant at the 10 percent level.
Table 4: Regression of Log Enrollment on Local Unemployment Measures (4-year Institutions)
39

Dorm Not Required Dorm Required
All Public PrivatePrivate Not
All Public PrivatePrivate Not
for Profit for Profit
Panel A: State Unemployment
Unemp -0.396 -1.324 0.297 0.457 -0.320 0.788 -0.553 -0.628(0.629) (0.688) (1.070) (1.073) (0.619) (1.21) (0.736) (0.739)
Obs 6,487 2,751 3,736 3,667 6,258 1,727 4,531 4,523
Panel B: Weighted State Unemployment
Unemp -0.726 -1.968* 1.004 1.076 -0.388 0.419 -0.610 -0.659(0.777) (0.781) (1.690) (1.691) (0.975) (1.629) (1.299) (1.304)
Obs 5,357 2,370 2,987 2,946 5,355 1,624 3,731 3,727
Panel C: State Mass Layoff
Unemp -1.101 -0.034 -1.902 -1.711 -1.347 -1.094 -1.833 -1.628(1.680) (2.156) (2.508) (2.533) (1.218) (1.620) (1.577) (1.575)
Obs 6,487 2,751 3,736 3,667 6,257 1,726 4,531 4,523
Panel D: Weighted State Mass Layoff
Unemp -0.384 0.334 -0.888 -0.836 2.364 0.479 3.418 3.654(2.229) (2.413) (3.818) (3.901) (2.026) (2.268) (3.125) (3.134)
Obs 5,357 2,370 2,987 2,946 5,355 1,624 3,731 3,727
Notes: Each specification includes a full set of fixed effects for individual institutions and years between2001 and 2011. Robust standard errors clustered at the institution level are in parentheses.***Significant at the 1 percent level. **Significant at the 5 percent level.*Significant at the 10 percent level.
Table 5: Regression of Quality on Local Unemployment Measures (4-year Institutions)
40

Enrollment Quality
DormAll Public Private
Private NotAll Public Private
Private NotSize for Profit for Profit
Size 1 0.037** 0.050** 0.039* 0.013 -0.770 -1.127 -0.555 -0.529(0.013) (0.018) (0.018) (0.017) (1.548) (1.995) (1.971) (1.981)
Size 2 0.009 0.023 0.003 0.003 -1.084 -3.309 0.023 0.027(0.009) (0.014) (0.012) (0.012) (1.068) (1.773) (1.356) (1.356)
Size 3 0.018* 0.021 0.016 0.016 -0.283 -1.007 0.843 0.843(0.008) (0.010) (0.013) (0.013) (0.940) (1.219) (1.414) (1.414)
Size 4 -0.005 -0.005 -0.006 -0.004 0.277 -0.028 2.589 2.589(0.008) (0.009) (0.016) (0.015) (0.962) (1.034) (2.082) (2.082)
Size 5 0.015 0.016 0.016 0.075 0.617 0.608 1.394 2.290(0.019) (0.016) (0.024) (0.061) (1.123) (1.136) (7.164) (6.944)
Notes: Dorm sizes are 1 (<700), 2 (<1400), 3(<2600), 4(<6500), and 5(>=6500). Each specification includesa full set of fixed effects for individual institutions and years between 2001 and 2011. FTFY enrollment and SATMath 75th percentile score are used for enrollment and quality measure. Robust standard errors are clustered atthe institution level. ***Significant at the 1 percent level. **Significant at the 5 percent level.*Significant at the 10 percent level.
Table 6: Regression of Enrollment on Local Unemployment Rate with Dorm Size (4-year Institution)
41

National
Public Private Liberal Arts
Top120 Top50 Top65 Top180 Top50
Panel A: Changes in Enrollment for Prestigious Institutions
Unemp -0.004 -0.008 0.007 -0.006 -0.001 -0.005
(0.007) (0.008) (0.010) (0.015) (0.078) (0.011)
Panel B: Changes in Enrollment for Less Prestigious Institutions
Unemp 0.033*** 0.034*** 0.028*** 0.021 0.010 0.055(0.006) (0.007) (0.006) (0.011) (0.016) (0.034)
Panel C: Changes in Quality for Prestigious Institutions
Unemp 0.029 -0.129 -0.989 1.202 -1.329 0.007(0.726) (0.814) (1.125) (1.418) (2.985) (1.428)
Panel D: Changes in Quality for Less Prestigious Institutions
Unemp -0.599 -1.794* -1.548* -0.131 -1.704 -4.963(0.738) (0.859) (0.760) (1.042) (2.101) (5.159)
Notes: Each specification includes a full set of fixed effects for individual institutionsand years between 2001 and 2011. FTFY enrollment and SAT Math 75th percentile scoreare used for enrollment and quality measure. Robust standard errors clustered at the institutionlevel are in parentheses. Prestige variable is assembled by US News and World Report in 2005and in 2013. ***Significant at the 1 percent level. **Significant at the 5 percent level.*Significant at the 10 percent level.
Table 7: Changes in Enrollment and Prestige
42