Embed Size (px)
Citation preview

College and University Endowments:
Overview and Tax Policy Options
Molly F. Sherlock
Specialist in Public Finance
Jane G. Gravelle
Senior Specialist in Economic Policy
Margot L. Crandall-Hollick
Specialist in Public Finance
Joseph S. Hughes
Research Assistant
May 4, 2018
Congressional Research Service
7-5700
www.crs.gov
R44293

College and University Endowments: Overview and Tax Policy Options
Congressional Research Service
Summary Colleges and universities maintain endowments to directly support their activities as institutions
of higher education. Endowments are typically investment funds, but may also consist of cash or
property. Current tax law benefits endowments and the accumulation of endowment assets.
Generally, endowment fund earnings are exempt from federal income tax. The 2017 tax revision
(P.L. 115-97), however, imposes a new 1.4% excise tax on the net investment earnings of certain
college and university endowments. Taxpayers making contributions to college and university
endowment funds may be able to deduct the value of their contribution from income subject to
tax. The purpose of this report is to provide background information on college and university
endowments, and discuss various options for changing their tax treatment.
This report uses data from the U.S. Department of Education, the National Association of College
and University Business Officers (NACUBO) and Commonfund Institute, and the Internal
Revenue Service to provide background information on college and university endowments. Key
statistics, as discussed further within, include the following:
In 2017, college and university endowment assets were $566.8 billion.
Endowment assets have been growing, in real terms, since 2009. Endowment
asset values fell during the 2007-2008 financial crisis, and took several years to
fully recover.
Endowment assets are concentrated, with 12% of institutions holding 75%
of all endowment assets in 2017. Institutions with the largest endowments (Yale,
Princeton, Harvard, and Stanford) each hold more than 4% of total endowment
assets.
The average spending (payout) rate from endowments in 2017 was 4.4%.
Between 1998 and 2017, average payout rates have fluctuated between 4.2% and
5.1%. In recent years, institutions with larger endowments have tended to have
higher payout rates.
In 2017, endowment assets earned a rate of return of 12.2%, on average.
Larger institutions tended to earn higher returns. Larger institutions also tended
to have a larger share of assets invested in alternative strategies, including hedge
funds and private equity.
Changing the tax treatment of college and university endowments could be used to further various
policy objectives. Current-law tax treatment could be modified to increase federal revenues. The
tax treatment of college and university endowments could also be changed to encourage
additional spending from endowments on specific purposes (tuition assistance, for example).
Policy options discussed in this report include (1) a payout requirement, possibly similar to that
imposed on private foundations, requiring a certain percentage of funds be paid out annually in
support of charitable activities; (2) modifying the excise tax on endowment investment earnings;
(3) a limitation on the charitable deduction for certain gifts to endowments; and (4) a change to
the tax treatment of certain debt-financed investments in strategies often employed by
endowments.

College and University Endowments: Overview and Tax Policy Options
Congressional Research Service
Contents
What Is an Endowment? .................................................................................................................. 2
Tax Treatment of College and University Endowments .................................................................. 2
Excise Tax on Net Investment Income of Certain Institutions .................................................. 4 Comparing the Tax Treatment of Endowments and Private Foundations ................................. 5
College and University Endowments: Data Overview .................................................................... 5
Endowment Balances ................................................................................................................ 5 College and University Endowments: FY2017 .................................................................. 7 Largest Private College and University Endowments ........................................................ 8
Payouts from College and University Endowments................................................................ 10 Endowment Fund Investments ................................................................................................ 14
Returns on Endowment Fund Investments ....................................................................... 14 Where Are Endowment Funds Invested? .......................................................................... 16
Policy Considerations and Options ............................................................................................... 18
Modify Tax on Endowment Net Investment Income .............................................................. 19 Impose a Payout Requirement ................................................................................................ 20 Tax Endowments or Impose Additional Taxes on Endowment Earnings ............................... 21 Limit or Enhance Charitable Deductions for Gifts to Endowments........................................ 22 Change Policies for Certain Offshore Investments ................................................................. 22 Increase Data Reporting .......................................................................................................... 23
Figures
Figure 1. Endowment Balances, 1993- 2017 ................................................................................... 7
Figure 2. Average Annual Effective Spending (Payout) Rate, 1998-2017 ..................................... 11
Figure 3. Average Annual Effective Spending (Payout) Rate by Endowment Size,
FY1998 - FY2017 ...................................................................................................................... 13
Figure 4. Average Net Returns, FY2001 - FY2017 ....................................................................... 14
Figure 5. Asset Allocations for U.S. College and University Endowments, FY2002 –
FY2017 ....................................................................................................................................... 17
Tables
Table 1. Endowments and Institutions by Endowment Size, FY2017 ............................................ 7
Table 2. Private Institutions with Endowments of at Least $500,000 per Student and 500
Students ........................................................................................................................................ 8
Table 3. Endowment Value Per Full-Time Equivalent Student, FY2017 ........................................ 9
Table 4. Endowment Characteristics by Size of Endowment, FY2017 .......................................... 11
Table 5. Rate of Return by Endowment Size and Time Period ..................................................... 15
Table A-1. Endowments of 501(c)(3) Higher Education Institutions, 2011-2014 ......................... 26
Table A-2. Endowment Payouts of 501(c)(3) Higher Education Institutions, 2014 ...................... 27
Table B-1. Top 100 College and University Endowments, FY2017 ............................................. 28

Congressional Research Service
Table C-1. Top 25 Private Institutions by Endowment Assets per Student ................................... 32
Appendixes
Appendix A. Endowment Data Reported to the IRS by 501(c)(3) Institutions ............................. 25
Appendix B. Top 100 College and University Endowments ......................................................... 28
Appendix C. Top 25 Private Institutions Ranked by Endowment Assets per Student .................. 32
Contacts
Acknowledgments ......................................................................................................................... 33
Author Contact Information .......................................................................................................... 33

Congressional Research Service 1
ver the past decade, the size and growth of college and university endowments has
attracted the attention of academicians and policymakers.1 In 2008, Senator Chuck
Grassley and Representative Peter Welch convened a roundtable discussion entitled
“Maximizing the Use of Endowment Funds and Making Higher Education More Affordable.”2
More recently, discussion of endowments featured heavily in a House Ways and Means
Committee hearing on “The Rising Costs of Higher Education and Tax Policy.”3 In 2016, the
House Committee on Ways and Means held a hearing focusing exclusively on tax-exempt college
and university endowments.4 The 2017 tax revision (P.L. 115-97) included a new excise tax on
the net investment income of certain college and university endowments.5
At the end of FY2017, endowment balances for the 809 institutions included in the National
Association of College and University Business Officers (NACUBO)-Commonfund Study of
Endowments totaled $566.8 billion.6 In inflation-adjusted terms, endowment balances trended
upwards through most of the 1990s and 2000s. Endowment balances declined sharply during the
financial crisis that began in 2008, but subsequently recovered. Strong investment returns have
contributed to this growth in endowment balances. For 2017, endowments earned an average
return of 12.2%. Over time, an increasing proportion of endowment funds have been invested in
“alternative strategies,” including private equity and hedge funds. Large endowments are more
likely than smaller endowments to have their funds invested in alternative strategies.
Spending, or payouts, from endowments supports various higher education activities. The
spending rate, or payout rate, has fluctuated over time. For 2017, the payout rate for NACUBO
institutions was 4.4%. On average, in recent years, institutions with the largest endowments have
tended to have payout rates that exceeded average payout rates for institutions with smaller
endowments.
This report begins by providing background information on college and university endowments,
and discussing their current-law tax treatment. The report then reviews available data and trends
related to endowment balances, payout rates, and investment returns. The report concludes with a
discussion of several policy options to change the current tax treatment of college and university
endowments.
1 See, for example, Josh Lerner, Antoinette Schoar, and Jialan Wang, “Secrets of the Academy: The Drivers of
University Endowment Success,” Journal of Economic Perspectives, vol. 22, no. 3 (Summer 2008), pp. 207-222; and
Jeffrey R. Brown, Stephen G. Dimmock, Jin-Koo Kang, et al., “How University Endowments Respond to Financial
Market Shocks: Evidence and Implications,” American Economic Review, vol. 104, no. 3 (2014), pp. 931-962. The
Higher Education Opportunity Act (P.L. 110-315) required the Comptroller General to conduct a study on college and
university endowments. This study was published as U.S. Government Accountability Office, Postsecondary
Education: College and University Endowments Have Shown Long-Term Growth, While Size, Restrictions, and
Distributions Vary, GAO-10-393, February 2010, available at: http://www.gao.gov/products/GAO-10-393. 2 Senator Grassley’s opening statement and a video of the roundtable are available at http://www.finance.senate.gov/
newsroom/ranking/release/?id=38a762b5-0fc7-4a9c-a130-3ddf23812279. 3 More information on the hearing and links to hearing testimony can be found at http://waysandmeans.house.gov/
event/39840295/. 4 More information on the hearing and links to hearing testimony can be found at https://waysandmeans.house.gov/
event/hearing-tax-exempt-college-university-endowments/. 5 CRS Report R45092, The 2017 Tax Revision (P.L. 115-97): Comparison to 2017 Tax Law, coordinated by Molly F.
Sherlock and Donald J. Marples. 6 National Association of College and University Business Officers and Commonfund Institute, NACUBO-
Commonfund Study of Endowments, 2017, 2018. Selected content available at https://www.nacubo.org/Research/2009/
Public-NCSE-Tables. Cited hereafter as “NACUBO-Commonfund Study of Endowments, 2017.”
O

Congressional Research Service 2
What Is an Endowment? A college or university’s endowment fund—often referred to simply as an endowment—is an
investment fund maintained for the benefit of the educational institution. Endowments may also
hold cash or property. Income from the endowment is used to cover the cost of the college or
university’s operations and capital expenditures, to fund special projects, or for reinvestment.
Typically, a college or university endowment includes hundreds, if not thousands, of individual
funds that are the result of various agreements between donors and the recipient institution.
There are several types of endowment funds. Donors may give funds to a true endowment, or
permanent endowment. Oftentimes, donors impose restrictions on the institutions spending the
principal balance of true endowments. Donors may also impose restrictions on the use of income
earned on true endowments. True endowments may contain funds that the donors have dedicated
to scholarships or faculty support, for example.
A term endowment is an endowment where funds may be restricted by the donor for some period
of time. After the set period of time has passed, unused funds or principal may become
unrestricted.
Institutions may also put other unrestricted funds, such as those from general gifts or bequests, in
the institution’s endowment. These funds are typically referred to as a quasi-endowment.
Typically, when looking at the total value of an institution’s endowments, true endowments, term
endowments, and quasi-endowments are included.
Of the $566.8 billion in endowment assets reported to NACUBO in 2017, $255.3 billion (45%)
was in a true endowment, while $135.4 billion (24%) was in a quasi-endowment.7 Of the true
endowment balance, $233.3 billion was donor restricted (41% of total endowment market value).
The reported term endowment balance was $12.3 billion (2%).8
Tax Treatment of College and University
Endowments Endowments are tax-exempt for one of two reasons. Either they are part of a university which is
tax-exempt as a 501(c)(3) organization or a government entity (public universities), or the
endowment itself has 501(c)(3) tax-exempt status.9 Contributions to 501(c)(3)s and government
entities are generally tax deductible to the contributor under Internal Revenue Code (IRC) Section
170. Another benefit of an endowment’s tax-exempt status is that, except for the recent excise tax
on the net investment income of endowments at certain institutions, the investment earnings are
tax free.10
7 NACUBO-Commonfund Study of Endowments, 2017, p. 100. 8 There are two other categories for components of endowments in the NACUBO survey: (1) funds held in trust by
others, at $23.4 billion in 2017; and (2) an unspecified other category for endowment funds, at $140.5 billion. 9 Bruce R. Hopkins, “Chapter 11: Other Charitable Organizations,” in The Law of Tax Exempt Organizations, 10th ed.
(John Wiley & Sons, Inc., 2011). 10 As the Joint Committee on Taxation has explained, “In general, an exempt organization may have revenue from four
sources: (1) contributions, gifts, and grants; (2) trade or business income that is related to exempt activities (e.g.,
program service revenue); (3) investment income; (4) and trade or business income that is not related to exempt
activities. In general, the Federal income tax exemption extends to the first three categories, and does not extend to an
organization’s unrelated trade or business income.” Unrelated business income is “income derived from a trade or
(continued...)

Congressional Research Service 3
The 501(c)(3) status of colleges and universities—and by extension their endowments—is a result
of them being organized and operated exclusively for purposes listed in Section 501(c)(3),
specifically charitable and educational purposes.
If the return from endowments of colleges and universities were taxed currently at 35%, the
revenue gain is estimated at $15.3 billion; taxed at the new corporate rate of 21%, the amount
would be $9.9 billion.11 If only private universities and colleges were subject to a tax, the gain
would be estimated at $10.4 billion at a 35% rate and $6.4 billion at a 21% rate, since public
institutions are responsible for 32% of assets.12 This figure can be compared with the estimated
value of other tax provisions that directly benefit educational institutions. These include the
deduction for charitable contributions to educational institutions, estimated to reduce revenues by
$10.5 billion in FY2017 (while the deduction is claimed by individuals and corporations, the
benefit also accrues to institutions of higher education); private activity tax-exempt bonds for
nonprofit educational institutions, estimated at $3.8 billion; and the share of general obligation
tax exempt bonds benefits that accrue to public institutions of higher education, which are
estimated at around $1.4 billion.13 These benefits total approximately $15.7 billion.14 Beginning
in 2018, the value of these provisions would be expected to be somewhat smaller under the new
tax rules.15
(...continued)
business regularly carried on by the organization that is not substantially related to the performance of the
organization’s tax-exempt functions.” Hence, in so far as the income—including investment income—of an
endowment is related to the college or university’s tax-exempt functions, that income would not be subject to tax.
However, passive income from items such as rents from real property, interest and dividends are subject to the tax if
they are debt financed or received from a controlled organization. Income under the unrelated business income tax
(UBIT) is taxed at the corporate rate (top rate of 35% in 2017, but reduced to 21% in taxable years beginning after
2017). See Joint Committee on Taxation, Historical Development and Present Law of the Federal Tax Exemption for
Charities and Other Tax-Exempt Organizations, April 20, 2005, JCX-29-05, p. 5 and Table 4 on p. 31. 11 This estimate was made by CRS using the following information, assuming end of FY2017 endowment values and
FY2017 endowment returns. Total endowments at NACUBO institutions at the end of the fiscal year were $566 billion,
after having earned an average of 12.2% weighted by the share of assets in each side class and their respective returns,
according to 2017 NACUBO-Commonfund Study of Endowments, National Association of College and University
Business Officers and Commonfund Institute, 2018. (The aggregate return reported is 12.2%, but that return is
measured given an equal weight for each institution. The 12.8% return has an equal weight for each institution within a
size category but weights by asset size for the composite of size categories). If all of this income were taxed currently at
35% the collections would be at $25.4 billion. Some portion of these earnings would be unrealized capital gains. The
share of unrealized capital gains was estimated at 35% calculated by assuming current taxation of income of fixed
income assets and cash assets (which accounted 8% and 4% of assets, earning a return of 2.4% and 1.4%), accounting
for 2% of total earnings, assuming a 4% dividend on other assets (88% of assets at a 4% return account for 29% of the
total 12.2% return), and assuming half of the remainder of 69% of the return (capital gains) is realized. There is little
evidence on the ratio of realizations to accruals for nonprofits and the assumption of one half is based on historical data
indicating that individual realizations are half of accruals. See CRS Report 91-250, Limits to Capital Gains Feedback
Effects, by Jane G. Gravelle. This estimate is revenue that would be collected if endowment returns were taxed
currently at 35% or 21%, and does not consider potential behavioral responses. 12 NACUBO-Commonfund Study of Endowments, 2017. 13 Based on 2016 data indicating 3.7% of bonds were issued for public colleges. See The Bond Buyer, 2017 Yearbook,
Thomas Reuters, Sourcemedia, New York, NY, pp. 7 and 134. 14 See Joint Committee on Taxation, Estimates Of Federal Tax Expenditures For Fiscal Years 2016-2020, JCX-3-17,
January 30, 2017, https://www.jct.gov/publications.html?func=startdown&id=4971. 15 Based on the corporate share of about 15% of the combined individual tax expenditures the decrease in rate should
reduce the value by about 9%. Most contributors to college endowment funds are likely to be higher income
individuals: the top rates (temporary) for individuals fell from 39.6% to 37% and 35%, a 7% to 12% reduction in value,
and a 6% to 10% overall reduction when applied to the 85% share attributable to individuals. These amounts added to
the 9% reduction for corporations results in a 15% to 19% total reduction. Some of the individuals who contributed
(continued...)

Congressional Research Service 4
Excise Tax on Net Investment Income of Certain Institutions
A 1.4% tax on net investment income is imposed annually on certain private colleges and
universities beginning in tax years after December 31, 2017.16 For the purposes of the tax, net
investment income is gross investment income and net capital gain, less expenses associated with
earning that income. Gross investment income includes income from interest, dividends, rents,
and royalties.
To be subject to the tax, private colleges and universities must meet the following criteria:
1. have at least 500 tuition-paying full-time equivalent (FTE) students in the
previous tax year (with more than 50% of these students located in the United
States);17 and
2. have assets of at least $500,000 per student (excluding assets that are used
directly in carrying out the institution’s exempt educational purpose).18
Institutions that are subject to the tax and meet the above criteria are referred to as “applicable
educational institution[s].”
IRC Section 4968 is a new provision. Per the Conference Report accompanying P.L. 115-97, it is
intended that the Secretary promulgate regulations to carry out the intent of the provision,
including regulations that describe: (1) assets that are used directly in carrying out the
educational institution’s exempt purpose; (2) the computation of net investment income;
and (3) assets that are intended or available for the use or benefit of the educational
institution.19
The IRS has not yet released any guidance or regulations related to the new excise tax under IRC
Section 4968.
The Joint Committee on Taxation (JCT) estimated that the excise tax on net investment income of
private colleges and universities with endowments of at least $500,000 per student would raise
$1.8 billion in revenue over the 2018 through 2027 budget window.20 Annually, the tax is
estimated to raise about $0.2 billion.21
(...continued)
may not be in the top income levels, and some might no longer itemize, so that a reduction in excess of 20% is likely.
The individual changes are temporary. 16 IRC Section 4968. 17 As enacted in P.L. 115-97, IRC Section 4968 applied to applicable educational institutions with at least 500 students
during the preceding tax year. The Bipartisan Budget Act of 2018 (BBA18; P.L. 115-123) specified that applicable
educational institutions were those with 500 tuition-paying students during the previous tax year. 18 Assets and net investment income include amounts with respect to related organizations, or organizations that are
controlled by an institution, or are supported or supporting organizations of the institution, for the purposes of
determining the assets per student threshold and net investment income. Assets used directly in carrying out an exempt
educational purpose might include, for example, classroom buildings or physical facilities and offices. 19 U.S. Congress, House of Representatives, Tax Cuts and Jobs Act, Conference Report to Accompany H.R. 1, 115th
Cong., 1st sess., December 15, 2017, Report 115-446, p. 420. 20 Joint Committee on Taxation, Estimated Budget Effects of the Conference Agreement for H.R. 1, the “Tax Cuts and
Jobs Act,” JCX-67-17, December 18, 2017, available at https://www.jct.gov/publications.html?func=startdown&id=
5053. 21 Ten year estimates may not be the sum of annual estimates, due to rounding.
Congressional Research Service 5
Comparing the Tax Treatment of Endowments and Private
Foundations
Comparisons are often drawn between private foundations and college endowments, particularly
when considering certain policy options (payout requirements, for example). Unlike private
foundations, college endowments are not subject to a payout requirement. Private foundations are
differentiated from tax-exempt public charities by their narrow bases of control and financial
support.22 In order to limit accumulation of tax-exempt funds by foundations, Congress chose to
require private foundations (and only private foundations) to pay out at least 5% of their fund
every year under Internal Revenue Code (IRC) Section 4942.23
Private foundations are also subject to an excise tax on net investment income.24 The tax rate is
2%, but is reduced to 1% if the foundation’s qualifying distributions exceed a historical average.
When the tax on investment income of private foundations was enacted, Congress stated that the
purpose of the tax was to have private foundations share in the cost of government oversight of
the sector.25 Revenues from the tax, however, go to the general fund and are not earmarked for
any specific purpose.
College and University Endowments: Data
Overview
Endowment Balances
There are several sources of data on endowment balances. Specifically, data on endowments can
be obtained from the following sources:
U.S. Department of Education: The U.S. Department of Education publishes
data on endowment funds. Generally, information is provided on total
endowment funds for all public and private colleges and universities and
separately for the top 120 institutions. At the end of FY2015 (June 30, 2015), all
institutions reported endowment funds of $547.2 billion.26 The 120 institutions
with the largest endowments held $406.4 billion, or 74.3% of the total.
National Association of College and University Business Officers (NACUBO):
NACUBO regularly gathers endowment data from a large number of public and
22 Private foundations may either be categorized as operating or non-operating. Operating private foundations generally
conduct their own charitable activities (e.g., operate a museum), while non-operating private foundations generally
provide charitable support through grants or other forms of financial assistance. The majority of private foundations are
non-operating. 23 Section 4942 does not apply to private operating foundations. 24 IRC Section 4940(a). This tax does not apply to certain qualifying operating foundations. IRC section 4940(d)(2). 25 Joint Committee on Internal Revenue Taxation, General Explanation of the Tax Reform Act of 1969: H.R. 13270,
91st Congress, Public Law 91-172, December 3, 1970, p. 29, https://www.jct.gov/publications.html?func=startdown&
id=2406. 26 Data on FY2015 endowments can be found in the U.S. Department of Education, National Center for Education
Statistics, Digest of Education Statistics 2016, February 2018, at https://nces.ed.gov/programs/digest/d16/index.asp.
Institutions included are those that grant associate’s or higher degrees and participate in Title IV federal financial aid
programs.
Congressional Research Service 6
private colleges and universities and affiliated foundations.27 At the end of
FY2017 (June 30, 2017), 809 institutions reported $566.8 billion in endowment
assets.28 The NACUBO survey provides the most up-to-date information on
endowments, although it may not include the same institutions included in the
U.S. Department of Education data.
Internal Revenue Service: Data on endowments of 501(c)(3) (private)
universities and colleges are reported on Schedule D of IRS Form 990
informational returns. IRS data representing 1,782 501(c)(3) higher education
institutions reported $390.2 billion in endowment assets for 2014.29
Historically, the aggregate endowment values reported in the NACUBO survey have closely
tracked the endowments data published by the Department of Education. While the Department
of Education data includes all Title IV institutions, the NACUBO survey gathers information on
endowments from some affiliated foundations in their survey.30
There have been fluctuations in endowment balances over time. Overall, endowment balances
have increased substantially since the early 1990s, both in nominal and real (inflation-adjusted)
terms (Figure 1 shows trends in endowment balances since 1993, in inflation-adjusted terms). In
1993, endowment balances were $150.8 billion (inflation-adjusted to 2017 dollars). By 2015,
endowment balances were $565.9 billion (inflation-adjusted). While the Department of Education
has not yet released data for 2017, data from the NACUBO survey, which closely tracks
Department of Education statistics on endowments, reported endowment assets of $566.8 billion
for 2017. The share of endowments held by the top 120 institutions (the Department of Education
regularly reports data on endowments held by the top 120 institutions) has remained roughly the
same over time, at around 75%.
Endowment values decreased substantially during the 2007-2008 financial crisis, and took several
years to recover to pre-crisis levels. In 2007, endowments were valued at $484.4 billion (in
inflation-adjusted 2017 dollars). Balances had declined to $372.0 billion (inflation-adjusted) by
2009. By 2013, inflation-adjusted endowment balances had reached $491.1 billion, before
increasing further to $565.9 billion in 2015.
27 Some institutions manage their endowments through institutionally related foundations. These related foundations
are generally treated as 501(c)(3) public charities, and not subject to tax rules that apply to other types of private
foundations. 28 For FY2015, 812 institutions reported $529.0 billion in endowment assets for the NACUBO survey. 29 The 2014 Form 990s are filed for the 2014 calendar year or for fiscal years that began in 2014 and ended in 2015.
Some organizations use calendar year accounting periods, while others use fiscal year accounting periods. Additional
information on endowment data from the IRS is provided in Appendix A. 30 A Title IV institution is one that has an agreement with the Secretary of Education allowing the institution to
participate in Title IV federal student financial assistance programs, including the Federal Pell Grant program. For
more information, see CRS Report R43351, The Higher Education Act (HEA): A Primer, by Alexandra Hegji.

Congressional Research Service 7
Figure 1. Endowment Balances, 1993- 2017
Source: CRS analysis of Department of Education and NACUBO data.
Notes: Data are inflation adjusted using the Consumer Price Index (CPI-U). Data from 1993 through 2015 are
from the National Center for Education Statistics, Digest of Education Statistics, various years. Endowment data
for all institutions are not available for 1997 through 2005. From 1993 through 1996 and again from 1999
through 2015, the National Center for Education Statistics reported endowment values for the top 120
institutions. Between 1999 and 2005, the Digest of Education Statistics reported data on the endowments of the
top 120 institutions, with their source for the data being NACUBO. The data points for 2016 and 2017 are
endowment values from the NACUBO survey.
College and University Endowments: FY2017
For the fiscal year ending June 30, 2017, data gathered by NACUBO from 809 universities and
colleges reported total endowment assets of $566.8 billion. As illustrated in Table 1, endowment
balances are heavily concentrated in a small share of institutions, with 12% of institutions holding
75% of endowments. Private nonprofit universities (classified as “independent” in Table 1) have
a slightly higher share of endowments (68%) relative to their share of institutions (63%).
Table 1. Endowments and Institutions by Endowment Size, FY2017
Endowment Size in 2017 Share of Institutions (%) Share of Endowments (%)
Over $1 billion 12.0 75.4
$0.5 billion - $1.0 billion 10.1 10.6
$0.1 billion - $0.5 billion 34.0 10.9
$0.05 billion - $0.1 billion 19.4 2.1
$0.025 billion - $0.05 billion 14.0 0.8
Under $0.025 billion 10.5 0.2
Public 37.3 32.2

Congressional Research Service 8
Endowment Size in 2017 Share of Institutions (%) Share of Endowments (%)
Independent 62.7 67.8
Full Sample (Equal Weighted) 100.0 100.0
Source: NACUBO-Commonfund Study of Endowment, 2017, publicly available data at https://www.nacubo.org/
Research/2009/Public-NCSE-Tables
Notes: Data collected from 809 institutions holding $566.8 billion of endowment assets. Canadian institutions
were not included.
Largest Private College and University Endowments
In FY2017, according to NACUBO data, there were 31 private colleges and universities with
endowments of at least $500,000 per student and 500 students (see Table 2).31 A list of the 100
largest college and university endowments, including public institutions can be found in
Appendix B. A list of the 25 private institutions with the largest endowment per student,
including institutions with less than 500 students, can be found in Appendix C.
Harvard University had the largest endowment in FY2017, totaling more than $36.0 billion. On a
per-student basis, Harvard’s endowment was $1.5 million in FY2017. A total of five institutions
had total endowment assets of $15.0 million or more, and a per-student endowment of at least
$1.3 million (Harvard, Yale, Stanford, Princeton, and MIT). Endowment wealth is highly
concentrated in these top institutions, with Harvard holding 6.4% of all endowment assets
reported to NACUBO in FY2017. Yale held 4.8% of endowment assets in that same year, with
Princeton holding 4.2% of endowment assets.
Table 2. Private Institutions with Endowments of at Least $500,000
per Student and 500 Students
End of FY2017 Endowment Assets and Fall 2016 Full-Time Equivalent (FTE) Students
Institution
FY2017
Endowment Assets
($ billions)
Share of Total
Endowment Assets
Endowment Value
per Student
Princeton University $23.8 4.2% $2,951,077
Yale University $27.2 4.8% $2,191,268
Princeton Theological Seminary $1.1 0.2% $1,996,913
Stanford University $24.8 4.4% $1,541,160
Harvard University $36.0 6.4% $1,522,104
Pomona College $2.2 0.4% $1,321,353
Massachusetts Institute of Technology $15.0 2.6% $1,315,751
Amherst College $2.2 0.4% $1,255,243
Swarthmore College $2.0 0.3% $1,207,864
Williams College $2.5 0.4% $1,188,429
31 Appendix B contains a list of the top 100 college and university endowments as reported to NACUBO for FY2017.
Endowment data reported to NACUBO may not necessarily be the same as any information reported to the IRS for the
purposes of the Section 4968 tax on net investment income from endowments.

Congressional Research Service 9
Institution
FY2017
Endowment Assets
($ billions)
Share of Total
Endowment Assets
Endowment Value
per Student
California Institute of Technology $2.6 0.5% $1,163,618
Grinnell College $1.9 0.3% $1,119,716
Rice University $5.8 1.0% $872,778
The Cooper Union for the Advancement
of Science and Art
$0.8 0.1% $851,726
Wellesley College $1.9 0.3% $807,322
Bowdoin College $1.5 0.3% $806,151
Dartmouth College $5.0 0.9% $782,398
University of Notre Dame $9.4 1.6% $762,463
Baylor College of Medicine $1.2 0.2% $746,361
The Medical College of Wisconsin Inc. $0.9 0.2% $717,883
Washington and Lee University $1.5 0.3% $717,595
Berea Collegea $1.2 0.2% $702,296
University of Richmond $2.4 0.4% $633,780
Smith College $1.8 0.3% $616,056
Claremont McKenna College $0.8 0.1% $584,038
Northwestern University $10.4 1.8% $568,540
Washington University in St. Louis $7.9 1.4% $562,770
University of Pennsylvania $12.2 2.2% $541,389
Bryn Mawr College $0.8 0.1% $510,171
Duke University $7.9 1.4% $509,248
Trinity University $1.2 0.2% $504,329
Source: NACUBO-Commonfund Study of Endowment, 2017, publicly available data at https://www.nacubo.org/
Research/2009/Public-NCSE-Tables.
Notes: This table is not intended to represent a list of institutions subject to the net investment income tax.
The NACUBO-Commonfund Study of Endowments includes data as voluntarily reported by participating
institutions, which may not reflect endowment values as reported to the IRS. Additionally, under the Bipartisan
Budget Act of 2018, the net investment income tax is not applicable to institutions with fewer than 500 tuition-
paying students.
a. Berea College does not have 500 tuition-paying students.
Endowment assets are concentrated in private doctoral-granting universities. In FY2017, the
average endowment per student at private doctoral-granting universities was $360,787 (the
median was $74,767) (see Table 3). The average endowment per student at public doctoral-
granting universities was $27,092 (with a median of $23,012).
Table 3. Endowment Value Per Full-Time Equivalent Student, FY2017
Doctoral Master’s Bachelor's
Private, Nonprofit, 4-Year Institutions n=92 n=161 n=189
Mean $360,787 $39,024 $190,314

Congressional Research Service 10
Doctoral Master’s Bachelor's
Median $74,767 $24,833 $98,067
Public, 4-Year Institutions n=132 n=85 n=14
Mean $27,092 $7,720 $30,678
Median $23,012 $5,480 $13,468
Source: CRS calculations using NACUBO-Commonfund Study of Endowments 2017, publicly available data at
https://www.nacubo.org/Research/2009/Endowment-Market-Values-and-Investment-Rates-of-Return.
Notes: Values reflect endowment assets as of June 30, 2017. Enrollment data reflect Fall 2016 FTE enrollment.
Full-time equivalent (FTE) enrollment is self-reported by the institutions.
Payouts from College and University Endowments
Spending from the endowment includes expenditures on student financial aid, faculty research,
maintenance of facilities, and other campus operations. The spending rate, or payout rate, is this
spending divided by the market value of the endowment at the beginning of the year (net of
administrative expenses). Most institutions have a spending policy, where the payout rate is tied
to a moving average of endowment value.32 Colleges and universities may deviate from pre-
determined spending policies, particularly in the face of negative financial shocks like the 2008-
2009 financial crisis.33
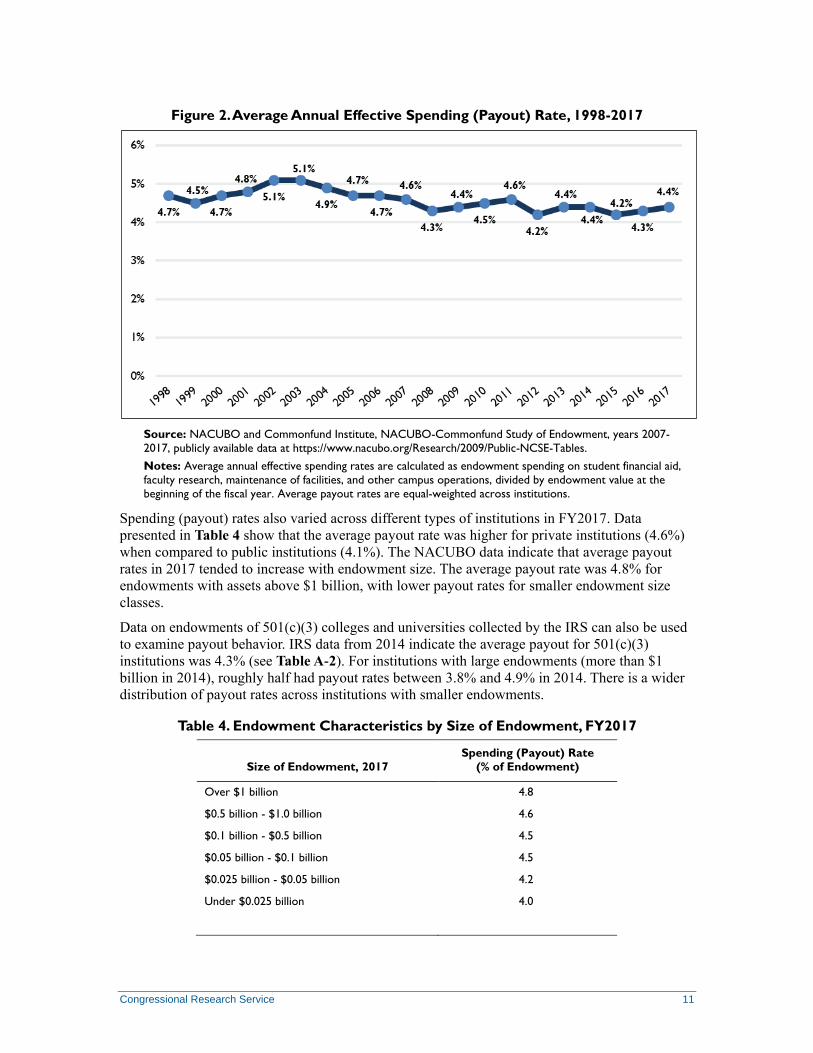
NACUBO publishes data on average annual effective spending rates from endowment funds, or
payouts. Since 1998, the average annual effective spending rate, or average payout rate, has
fluctuated within a one-percentage-point band, hitting a period high of 5.1% in 2003 and period
low of 4.2% in 2012 (see Figure 2). In 2017, the average payout rate was 4.4%.
32 NACUBO-Commonfund Study of Endowments, 2014, p. 45. In FY2014, the average pre-specified spending rate for
institutions participating in the NACUBO survey was 4.5%, and 92% of institutions followed their spending policy. 33 Jeffrey R. Brown, Stephen G. Dimmock, Jin-Koo Kang, et al., “How University Endowments Respond to Financial
Market Shocks: Evidence and Implications,” American Economic Review, vol. 104, no. 3 (2014), pp. 931-962.
Specifically, Brown et al. (2014) find that universities tend to reduce payouts relative to stated payout policies
following negative shocks. However, following positive shocks, there is no evidence of changes to payouts. The
authors suggest this as evidence of “endowment hoarding.”
Congressional Research Service 11
Figure 2. Average Annual Effective Spending (Payout) Rate, 1998-2017
Source: NACUBO and Commonfund Institute, NACUBO-Commonfund Study of Endowment, years 2007-
2017, publicly available data at https://www.nacubo.org/Research/2009/Public-NCSE-Tables.
Notes: Average annual effective spending rates are calculated as endowment spending on student financial aid,
faculty research, maintenance of facilities, and other campus operations, divided by endowment value at the
beginning of the fiscal year. Average payout rates are equal-weighted across institutions.
Spending (payout) rates also varied across different types of institutions in FY2017. Data
presented in Table 4 show that the average payout rate was higher for private institutions (4.6%)
when compared to public institutions (4.1%). The NACUBO data indicate that average payout
rates in 2017 tended to increase with endowment size. The average payout rate was 4.8% for
endowments with assets above $1 billion, with lower payout rates for smaller endowment size
classes.
Data on endowments of 501(c)(3) colleges and universities collected by the IRS can also be used
to examine payout behavior. IRS data from 2014 indicate the average payout for 501(c)(3)
institutions was 4.3% (see Table A-2). For institutions with large endowments (more than $1
billion in 2014), roughly half had payout rates between 3.8% and 4.9% in 2014. There is a wider
distribution of payout rates across institutions with smaller endowments.
Table 4. Endowment Characteristics by Size of Endowment, FY2017
Size of Endowment, 2017
Spending (Payout) Rate
(% of Endowment)
Over $1 billion 4.8
$0.5 billion - $1.0 billion 4.6
$0.1 billion - $0.5 billion 4.5
$0.05 billion - $0.1 billion 4.5
$0.025 billion - $0.05 billion 4.2
Under $0.025 billion 4.0

Congressional Research Service 12
Size of Endowment, 2017
Spending (Payout) Rate
(% of Endowment)
Type of Institution
All Public Institutions 4.1
All Private Colleges and Universities 4.6
Average (All Institutions) 4.4
Source: NACUBO and Commonfund Institute, NACUBO-Commonfund Study of Endowment, years 2007-
2017, publicly available data at https://www.nacubo.org/Research/2009/Public-NCSE-Tables.
Notes: Average annual effective spending rates calculated as endowment spending on student financial aid,
faculty research, maintenance of facilities, and other campus operations, divided by endowment value at the
beginning of the fiscal year. Average payout rates are equal-weighted across institutions.
Trends in payout rates over time have differed for institutions with large endowments as opposed
to smaller endowments (see Figure 3). Payout rates generally trended downward between 2003
and 2008 (the average payout rate was 5.1% in 2003, as opposed to 4.3% in 2008). While average
payouts trended upwards from 2008 through 2011, during that time, a gap developed between the
average payout rate of institutions with endowments of $0.5 billion or more, and those with
smaller endowments of less than $0.05 billion. In 2010, the average payout rate for institutions
with endowments between $0.5 billion and $1 billion, and those with average endowments above
$1 billion, was 5.7% and 5.6%, respectively. The average payout rate for institutions with an
endowment between $0.025 billion and $0.05 billion was 4.1% in 2010, while the average payout
rate for institutions with endowments of less than $0.025 billion was 3.5%.
These trends suggest that during and in the period immediately following the Great Recession,
institutions with larger endowments tended to increase payout rates. Institutions with large
endowments, where spending from endowments funds a significant portion of operating
expenses, tend to base payouts on average endowment values in recent years (often over a three-
year period).34 Thus, payout rates tend to increase when endowments decline. Where payout rates
tended to decline during and immediately following the Great Recession was among institutions
with smaller endowments. As the economy has recovered, payout rates for institutions with large
and smaller endowments have again converged and are close to the average across all institutions
(4.4%).
34 Institutions with larger endowments use endowment funds in their annual operating budget, on average. In FY2017,
for institutions with endowments of $1 billion or more, 12.1% of operating budgets were funded by endowments (the
median value was 4.4%). For institutions with endowments of $51 million - $100 million, 6.2% of operating budgets
were funded by endowments, on average (the median value was 1.8%). See NACUBO-Commonfund Study of
Endowments, 2017, p. 53.

CRS-13
Figure 3. Average Annual Effective Spending (Payout) Rate by Endowment Size, FY1998 - FY2017
Source: NACUBO and Commonfund Institute, NACUBO-Commonfund Study of Endowment, years 2007-2017, publicly available data at https://www.nacubo.org/
Research/2009/Public-NCSE-Tables.
Notes: Average annual effective spending rates are calculated as endowment spending on student financial aid, faculty research, maintenance of facilities, and other
campus operations, divided by endowment value at the beginning of the fiscal year. Average payout rates are equal-weighted across institutions within endowment size
category.

College and University Endowments: Overview and Tax Policy Options
Congressional Research Service 14
Endowment Fund Investments
In recent years, on the whole, invested endowment assets have yielded strong returns. In FY2017,
endowment assets included in the NACUBO survey earned a return of 12.2% on average,
resulting in income of $64 billion.35
Returns have fluctuated over time (see Figure 4). In some years, FY2016 being the most recent
example, average net returns have been negative.
Figure 4. Average Net Returns, FY2001 - FY2017
Source: NACUBO-Commonfund Study of Endowments, Public NCSE Tables, Average and Median Annual Net
Investment Returns, 2017 and 2010 tables, publicly accessible at https://www.nacubo.org/Research/2009/Public-
NCSE-Tables.
Returns on Endowment Fund Investments
Endowment returns vary across different types of institutions and over time. In FY2017,
institutions with larger endowments tended to earn higher returns.36 This pattern tends to hold
when looking at returns over longer periods of time (3-, 5-, or 10-year average rates of return).
Returns of public and private nonprofit (independent) institutions are similar (when looking at
equal-weighted figures).
35 The 12.2% figure is an equal-weighted rate of return. Since institutions with larger endowments tend to earn higher
returns and have a proportionally larger share of assets than their share of institutions, weighting the return in each size
category by the share of assets in that category yields a higher estimated rate of return, 12.8%. This measure is closer to
a dollar-weighted return. 36 Other research has shown that in the 1990s and early 2000s, Ivy League schools tended to have endowment returns
that outperformed other universities. Institutions with large endowments and high student SAT scores were also found
to have endowments with above-average returns in that time period. See Josh Lerner, Antoinette Schoar, and Jialan
Wang, “Secrets of the Academy: The Drivers of University Endowment Success,” Journal of Economic Perspectives,
vol. 22, no. 3 (Summer 2008), pp. 207-222.

College and University Endowments: Overview and Tax Policy Options
Congressional Research Service 15
Table 5 also provides information on the share of assets invested in alternative strategies (which
includes hedge funds and private equity).37 Institutions with larger endowments tend to have a
higher share of their endowment assets invested in alternative strategies. Institutions with smaller
endowments tend to have most of their endowment assets invested in domestic equities, fixed
income, or international equities. Trends in where endowment funds are invested over time are
examined further below.
Table 5. Rate of Return by Endowment Size and Time Period
Endowment Size in 2017 1-Year 3-Year 5-Year 10-Year
Assets in
Alternative
Strategies (%)a
Over $1 billion 12.9 5.0 8.6 5.0 57
$0.5 billion - $1.0 billion 12.7 4.2 8.1 4.6 42
$0.1 billion - $0.5 billion 12.5 4.1 7.8 4.4 32
$0.05 billion - $0.1 billion 11.9 3.9 7.7 4.4 22
$0.025 billion - $0.05 billion 11.7 4.0 7.7 4.5 17
Under $0.025 billion 11.6 4.7 8.1 5.0 11
Public 12.2 4.3 8.0 4.5 46
Independent 12.3 4.2 7.9 4.6 54
Full Sample (Equal Weighted) 12.2 4.2 7.9 4.6 29.7b
Source: NACUBO-Commonfund Study of Endowments, 2017.
Notes: Averages are equal-weighted, unless otherwise specified.
a. NACUBO does not report decimal places in their asset allocation tables. Data on asset allocations, or the
percentage of assets invested in alternative strategies, are dollar-weighted.
b. The 29.7% full-sample estimate of assets invested in alternative strategies is the equal-weighted estimate.
This increases to 52% when a dollar-weighted average is used.
37 Of the 51% of dollar-weighted assets invested in alternative strategies, 11% are invested in private equity, 19% in
“marketable alternative strategies,” which includes hedge funds and derivatives, 6% in private equity real estate, 6% in
venture capital, and 6% in energy and natural resources. The remainder is in other commodities or managed funds,
distressed debt, or alternatives that are not broken out.

College and University Endowments: Overview and Tax Policy Options
Congressional Research Service 16
Where Are Endowment Funds Invested?
There has been a shift in
where endowment assets are
invested in recent years.
Between 2002 and 2010, the
share of endowment assets
invested in equities declined
from 50% to 31%. Since
2010, the share of
endowment assets invested in
equities increased to 36%
(see Figure 5). The
percentage of assets invested
in fixed income declined
from 23% to 8% over the
2002 to 2017 period. While
the proportion of assets being
invested in equity and fixed
income declined, the share of assets invested in alternative strategies increased. The share of
assets invested in alternative strategies, which includes hedge funds and private equity, increased
from 20% in 2002 to 51% 2009. In 2017, the share of endowment assets invested in alternative
strategies was 52%.
Empirical research has explored why the asset allocation of university endowments has shifted
towards alternative investments. Competition is one possible reason. There is evidence that
institutions tend to increase the share of endowment holdings invested in hedge funds to “catch
up” with schools that are competitors.38 Other research has observed that endowment managers
are more likely to invest in alternative assets when institutions have higher and less variable
background income.39 These institutions may be willing to take on the greater risk associated with
alternative strategies investments.
38 See William N. Goetzmann and Sharon Oster, “Competition among University Endowments,” in How the Financial
Crisis and Great Recession Affected Higher Education, ed. Jeffrey R. Brown and Caroline M. Hoxby (Chicago, IL: The
University of Chicago Press, 2015), pp. 99-126. 39 See Harvey S. Rosen and Alexander J.W. Sappington, What Do University Endowment Managers Worry About? An
Analysis of Alternative Asset Investments and Background Income, National Bureau of Economic Research, Working
Paper 21271, June 2015.
Investment Strategy Definitions
Equity Investments: The investor has an ownership interest in a company,
often through the purchase of stock in the company, which can be traded on
a public market. Income is generally derived from dividends (payments to
shareholders out of the company’s profits), or the realization of capital gains
upon the sale of the stock.
Fixed Income Investments: The investor lends money to a corporation
(or government) borrower who pays a fixed amount of interest on a regular
basis until a predetermined date. At that date the borrower also pays back
the principal to the investor. Fixed income investments include U.S
Treasuries, money market instruments, mortgage and asset backed securities,
and bonds.
Alternative Investment Strategies: These investment strategies include
any investment not considered traditional. Often traditional investments
include stocks (i.e., equities) and bonds (i.e., fixed income). Alternative
strategies include private equity, venture capital, hedge funds, distressed (or
private) debt, and “real assets” (like real estate, or oil and natural gas).

College and University Endowments: Overview and Tax Policy Options
Congressional Research Service 17
Figure 5. Asset Allocations for U.S. College and University Endowments,
FY2002 – FY2017
Source: CRS analysis of NACUBO data.
Notes: Asset allocations are dollar-weighted.
The shaded text box below provides additional background and information on UBIT and the use
of blocker corporations to avoid UBIT. The increasing share of endowment assets invested or
held in alternative strategies has raised concerns among some policymakers regarding the use of
offshore “blocker” corporations to avoid the unrelated business income tax (UBIT) on hedge fund
investments.40
This issue was the topic of a 2007 Senate Committee on Finance hearing41
and has
continued to receive media attention.42
Investing Endowments in Hedge Funds: The Unrelated Business Income Tax (UBIT)
and “Blocker” Corporations
The Unrelated Business Income Tax (UBIT)
The unrelated business income tax (UBIT) is effectively the corporate income tax applied to a tax-exempt
organization’s unrelated business income. Unrelated business income is any income from a trade or business that is
regularly conducted by the organization and is not substantially related to the organization’s exempt purpose.43 For
40 For further explanation of this technique, see Summer A. LePree, “Taxation of United States Tax-Exempt Entities’
Offshore Hedge Fund Investments: Application of the Section 514 Debt-Financed Rules to Leveraged Hedge Funds
and Derivatives and the Case for Equalization,” The Tax Lawyer, Vol. 61 (Spring 2008): 807-853; and Norman Silber
and John Wei, The Use of Foreign Blocker Corporations by U.S. Nonprofits: Should Blockers be Blocked?, Hofstra
Law, Legal Studies Research Paper No. 2016-04, October 28, 2016, available at https://ssrn.com/abstract=2860107. 41 See Senate Finance Committee Hearings Offshore Tax Issues: Reinsurance and Hedge Funds, United States Senate
Committee on Finance, September 26, 2007, http://www.finance.senate.gov/hearings/hearing/?id=ddb36aa0-beb0-e2f8-
275e-13625c509939. 42 See, for example, Stephanie Saul, “Endowments Boom as Colleges Bury Earnings Overseas,” New York Times,
November 8, 2017, available at https://www.nytimes.com/2017/11/08/world/universities-offshore-investments.html. 43 See IRC Section 513.
College and University Endowments: Overview and Tax Policy Options
Congressional Research Service 18
example, if a university operates a gym facility that is used by students for physical education classes and is also open
to members of the public who pay a fee, the fees collected from the public may be subject to UBIT.44
While investment income (e.g., dividends and interest) is generally exempt from UBIT, such income is subject to UBIT
if it is derived from debt-financed property.45 Furthermore, if a tax-exempt organization invests in a pass-through
entity, such as a partnership, that invests using borrowed funds, then income from that debt-financed investment will
flow through to the exempt organization and be subject to UBIT.46 A different result occurs if the tax-exempt
organization invests in a corporation, rather than a pass-through entity. When a corporation pays out a dividend to
tax-exempt shareholders, the dividend is not subject to UBIT even if the corporation had debt-financed investments.47
Hedge Funds and UBIT
Hedge funds are typically structured as partnerships and use borrowed funds for investing. Therefore, investments by
tax-exempt organizations in hedge funds often give rise to UBIT as income derived from debt-financed property.
Blocker Corporations to Avoid UBIT
A method by which tax-exempt organizations can legally avoid paying UBIT on hedge fund investments is through the
use of a blocker corporation. While there are various ways in which the blocker corporation can be set up, the basic
structure is that the blocker corporation is established between the hedge fund and the tax-exempt organization so
that any investment income the tax-exempt organization receives is in the form of a dividend from the blocker
corporation, rather than income flowing directly from the hedge fund. Since it is a corporate dividend, there are no
UBIT consequences—in other words, the use of the corporation essentially “blocks” any income subject to UBIT
from flowing through the hedge fund to the tax-exempt investor.
In order to avoid tax consequences for the blocker corporation, these entities are generally established in low or
zero tax countries, like the Cayman Islands. The blocker corporation will then owe little or no tax to its home
country, and it will typically have minimal or no U.S. tax liability since it is a foreign corporation operating outside the
United States.48
Policy Considerations and Options There are a number of policy options related to the tax treatment of endowments, should there be
a desire to change the status quo. Policy options considered may depend on the overarching
policy objective. For example, is the goal of the policy to encourage colleges and universities to
use endowment funds for a specific purpose? Or is the objective of the policy to carve back or
restrict the tax exemption currently provided to endowments? Or is the objective to look at
endowments as a source of federal revenue? Identifying the goals of endowment-related tax
policies may help inform the analysis of specific policy options. Leaving current-law tax
treatment of endowments unchanged is also an option.
44 See, e.g., IRS Rev. Rul. 78-98; 1978-1 C.B. 167. 45 See IRC Section 514. 46 See IRC Section 512(c). 47 Unlike pass-through entities, which are not subject to tax and whose income flows through to their investors,
corporations are subject to tax on their income. See IRC Section 11. 48 See IRC Section 881.

College and University Endowments: Overview and Tax Policy Options
Congressional Research Service 19
Modify Tax on Endowment Net Investment Income
Soon after the 1.4% excise tax on private college and university endowment’s net investment
income was enacted, legislation was introduced that would repeal the tax.49 Repeal of the tax is
one option.
Other policy options include those that would reduce or eliminate the tax in certain situations. For
example, the tax could be reduced or eliminated for institutions that devote a certain portion of
endowment returns to financial aid for low- and middle-income students.50 Alternatively, the tax
could be waived for institutions that meet a fixed payout objective (discussed further below) or as
part of a policy requiring increased reporting related to endowments and uses of endowment
funds (discussed further below). Another option would be to repeal the tax, but require that some
portion of endowment assets be managed by minority- and women-owned asset management
firms.51
Options to modify or redesign the tax could also be considered. For example, the tax could be
expanded to apply to more institutions, or the cut-off points (either the per-student or assets per
FTE thresholds) changed. The tax could also be modified to be more punitive in nature. For
example, Representative Reed has suggested an approach that would require institutions with
endowment assets in excess of $1 billion to use at least 25% of investment gains to reduce the
cost of attendance for lower- and middle-income students.52 Institutions not meeting this target
would face a tax of 30% of net investment income, with the tax increasing for institutions that do
not use endowments to reduce cost of attendance as stipulated over time.
Taxing the net investment income of private college and university endowments had been
proposed as part of an earlier tax reform effort. The Tax Reform Act of 2014 (H.R. 1), a tax
reform proposal introduced in the 113th Congress by then Ways and Means Committee Chairman
Dave Camp, proposed a flat excise tax for foundations and extended it to net investment earnings
of private universities and colleges. Under this proposal, private colleges and universities with
endowments in excess of $100,000 per student would be subject to a 1% excise tax.53 The tax on
net investment returns of private college and university endowments enacted in the 2017 tax
revision (P.L. 115-97) applies to institutions with endowments in excess of $500,000 per student,
at a rate of 1.4%. Additionally, the tax only applies to institutions with at least 500 students.
49 See the Don’t Tax Higher Education Act (H.R. 5220). 50 This idea was discussed in Testimony of Mark Schneider, Vice President of the American Institutes for Research, in
U.S. House of Representatives, House Committee on Ways and Means Subcommittee on Oversight, Hearing on Tax-
Exempt College and University Endowments, 114th Cong., 2nd sess., September 13, 2016. Testimony available at
https://waysandmeans.house.gov/event/hearing-tax-exempt-college-university-endowments/. 51 Representatives Gregory W. Meeks and Maxine Waters suggested this in a March 20, 2018, letter to House and
Senate leadership. The letter is available at https://meeks.house.gov/media/press-releases/reps-meeks-and-waters-urge-
greater-use-diverse-asset-managers-education. 52 This idea is discussed in Representative Reed’s “Our Vision for Students” whitepaper, available at
https://reed.house.gov/uploadedfiles/our_vision_for_students._final.12.2.16.pdf. 53 For a description of the proposal, see Joint Committee on Taxation, Technical Explanation of the Tax Reform Act of
2014, A Discussion Draft of the Chairman of the House Committee on Ways and Means to Reform the Internal Revenue
Code: Title V – Tax Exempt Entities, JCX-16-14, February 26, 2014, pp. 34-37, available at https://www.jct.gov/
publications.html?func=startdown&id=4558. In this proposal, the number of students is the daily average number of
full-time students, with part-time students accounted for on a full-time student equivalent basis.

College and University Endowments: Overview and Tax Policy Options
Congressional Research Service 20
Impose a Payout Requirement
Some policymakers have proposed requiring endowments to pay out a minimum amount every
year to prevent “an unreasonable accumulation of taxpayer-subsidized funds.”54 One option
would be to require that endowments have a minimum 5% payout rate, similar to that required of
private foundations. In the face of rising tuition, it has been suggested that to achieve their
charitable and educational objectives, colleges and universities should use a greater portion of
their endowments to reduce college prices and make a college education more accessible and
affordable for students.55
There are a number of policy design choices that could be considered when imposing a payout
requirement. While a payout requirement of 5%—the payout requirement for private non-
operating foundations—is one option, some other level (higher or lower) could be chosen. The
payout requirement could be restricted to certain endowments, such as those that exceed a certain
threshold, either in absolute terms ($500 million, for example) or on a per-student basis. Payout
requirements could be tied to investment earnings, or capped to not exceed investment earnings in
down years. Payout requirements could also be determined on a rolling basis (5% over a 3-year
period, for example). Payouts requirements could also be tied to tuition levels, metrics on student
need (Pell grant recipients, for example), or students’ receipt of federal student aid.56
Additional nuances could complicate various policy design choices. For example, if payout
requirements were to be imposed in institutions with endowments per student above some
predetermined level, what measure of students would be used (e.g., would the measure of
students include graduate students; would the measure of students be fall enrollment, the 12-
month unduplicated headcount, full-time equivalents, or some other measure?).
Opponents of a payout requirement for endowments say the approach is misguided, and have
been critical of various aspects of different payout policy options. When considering payout
policies that target institutions with large endowments, some have suggested that these
institutions may be more likely to offer robust financial aid and perhaps more likely to have
modest tuition increases over time.57 In recent years, institutions with larger endowments have
tended to have higher average payouts than institutions with smaller endowments. Thus, a payout
requirement applied to all institutions regardless of endowment size could impose a greater
burden on institutions with smaller endowments. Some have also questioned whether the 5%
payout rate that currently applies to non-operating foundations would be appropriate for
endowments, noting that operating foundations often have lower effective payout rates.58 Finally,
there are concerns that imposing a payout requirement might serve as a ceiling rather than a floor,
54 Senator Charles Grassley, “Grassley Urges Continued Look at College Endowment Growth, Student Affordability,”
press release, September 8, 2008, http://www.grassley.senate.gov/news/news-releases/grassley-urges-continued-look-
college-endowment-growth-student-affordability. 55 For example, see Karen W. Arenson, “Senate Looking at Endowments as Tuition Rises,” New York Times, January
25, 2008. 56 A payout requirement based on receipt of federal student aid could be designed to identify institutions with limited
payouts from endowments where students are relying on federal student aid to pay market-rate tuition. 57 This point is made in Alexander M. Wolf, “The Problems with Payouts: Assessing the Proposal for a Mandatory
Distribution Requirement for University Endowments,” Harvard Journal on Legislation, vol. 48 (2011), pp. 591-622.
The Wolf article critiques various aspects of mandatory payout proposals. 58 Ibid.
College and University Endowments: Overview and Tax Policy Options
Congressional Research Service 21
leading institutions that would have paid out more than 5% (or whatever rate is required) to make
payouts that meet the requirement but no more.59
One issue raised by university representatives is restrictions on endowments imposed by donors
(i.e., donor-restricted funds, discussed earlier).60 Donor restrictions come in two forms (which
often appear simultaneously): a requirement that the principal not be spent (so as to preserve the
fund permanently) and a requirement that funds be spent for specified purposes. Mary Frances
McCourt, representing NACUBO at a recent hearing, indicated that, in FY2014, colleges received
$7.7 billion in new financial contributions to their endowments. Of those new gifts, 90% were
restricted for a specific purpose by the donors.61 Since most endowments have grown over time,
and proposed payout rates tend to be below earnings over time, restrictions on not spending
principal could likely be designed to be manageable for most institutions.
If a payout were to be required, payouts might come from quasi-endowments, as opposed to
donor-restricted funds. As noted earlier in this report (see the “What Is an Endowment?” section),
in 2017, 24% of all endowment funds were reportedly held in quasi-endowments, and 25% of
endowment funds in a non-defined “other” category. Thus, across endowments as a whole, it
could be possible to meet a payout requirement even if a sizable portion of endowment funds is
restricted. What is not clear is how a payout requirement might affect specific institutions, where
the proportion of restricted endowment funds may be higher.
Restrictions on purposes are unlikely to impose a constraint to increased payouts, either for
increasing spending generally or for the purpose of slowing tuition increases, because of the
fungibility of money. That is, if some endowment funds are limited to specific purposes and
increased spending for those purposes is not feasible (e.g., supporting an endowed chair),
increased payouts from other endowments without restrictions or endowments that are devoted to
student aid can be used to meet a payout requirement. Providing aid to students is one of the most
common restrictions.
Nevertheless, any legislation requiring a payout or a payout tied to a particular purpose might
need a “safe harbor” so that colleges and universities would not be caught between legal
restrictions on donations and payout requirements. Protections from fluctuations in asset values
might also be addressed by requiring minimum payout averaged over several years.
Tax Endowments or Impose Additional Taxes on Endowment
Earnings
Another option would be to impose a tax on the value of endowments or impose additional taxes
on endowment earnings. As is the case with the payout option, there are a number of different
ways such a policy could be designed. For example, the tax could only be applied to endowments
59 This concern has been expressed with respect to the current policy of imposing a 5% payout requirement on private
non-operating foundations. 60 Testimony of Mary Frances McCourt, Senior Vice President and Chief Financial Officer, Indiana University on
behalf of the National Association of College and University Business Officers, in U.S. House of Representatives,
House Committee on Ways and Means Subcommittee on Oversight, Examining the Rising Costs of Higher Education,
hearings, 114th Cong., 1st sess., October 7, 2015. Testimony available at http://waysandmeans.house.gov/event/
39840295/. 61 Ibid.

College and University Endowments: Overview and Tax Policy Options
Congressional Research Service 22
of a certain size, or to institutions with “large” endowments that have increased tuition at a certain
rate (more than the rate of inflation, for example).62
Endowment earnings could also be subject to tax. One option would be to impose a tax similar to
the current maximum rate of 21% already imposed on tax-exempt entities for earnings from
activities not related to their exempt purpose (the unrelated business income tax, UBIT).
A tax on endowments or an additional tax on endowment earnings would generate additional
federal revenues. These revenues could be earmarked to provide student aid across all colleges
and universities, or could be treated as general fund revenues or used for other purposes. Whether
a tax on endowments encourages universities to spend more is unclear: saving via the endowment
becomes more expensive (as the after-tax return is lower) which would encourage payouts
relative to endowment savings and accumulation. However, with lower after-tax returns, more
saving may be needed to meet future endowment accumulation goals.
Limit or Enhance Charitable Deductions for Gifts to Endowments
Donors making contributions to endowments can claim the charitable deduction at the time the
gift is made, even if the gift is not immediately used for charitable purposes. Gifts to endowments
are often spent out over long periods of time. Reducing the value of the charitable deduction for
gifts that are spent out over time, or are not immediately used for charitable purposes, could
change incentives for giving donations that are related to endowments.
Limiting the charitable deduction for restricted gifts to endowments or term endowments would
reduce the tax incentive for making this kind of contribution. Taxpayers might choose instead to
make non-restricted contributions, substituting one form of giving for another. Since limiting the
deduction would reduce the tax incentive for giving to endowments, overall contributions
may fall.
One option for implementing this approach could be to limit the deduction based on when the
contribution is expected to be spent.63 For example, if the contribution is expected to support
educational activities for 10 years, some adjustment could be made to reflect the fact that a dollar
spent in the future is worth less than a dollar spent today, as a result of inflation. Since this type of
adjustment could become complex, it could be limited to gifts of a certain size.
Another option would be to provide an enhanced charitable deduction for certain types of gifts.
For example, taxpayers making charitable donations of funds that would be used to offset tuition
for lower- and middle-income students could receive an enhanced charitable deduction for such
contributions.
Change Policies for Certain Offshore Investments
As discussed above, some have noted that the increased share of endowment assets being
invested in alternative strategies, particularly hedge funds, raises concerns about the use of
62 The option of linking taxation of endowments to tuition increases in excess of inflation is discussed in detail in Matt
Willie, ”Taxing and Tuition: A Legislative Solution to Growing Endowments and the Rising Costs of a College
Degree,” Brigham Young University Law Review, December 1, 2012, pp. 1664-1702. 63 This option, and others, are discussed in Testimony of Brian Galle, Professor of Law, Georgetown University Law
Center, in U.S. House of Representatives, House Committee on Ways and Means Subcommittee on Oversight,
Examining the Rising Costs of Higher Education, hearings, 114th Cong., 1st sess., October 7, 2015. Testimony available
at http://waysandmeans.house.gov/event/39840295/.

College and University Endowments: Overview and Tax Policy Options
Congressional Research Service 23
offshore blocker corporations to avoid UBIT. The ability to use offshore blocker corporations to
avoid UBIT creates disparate tax treatment between debt-financed investments made
domestically and those made offshore.64 Some have also expressed concern that current law
creates an incentive to borrow to increase the level of the endowment, which could force
spending cutbacks in a downturn.65
In 2007, then Chairman of the Ways and Means Committee Charles Rangel introduced a bill,
H.R. 3970, which addressed the disparate tax treatment of domestic and offshore investments by
exempting partnership income from the UBIT.66 Following hearings by the Senate Finance
Committee in 2007,67 a draft proposal by Senators Grassley and Wyden circulated in August 2008
proposed instead to disallow the use of offshore blocker corporations by providing look-through
rules to determine the source of earnings.68 Others have suggested that Congress could disallow
the use of blocker corporations and expand the scope of UBIT rules covering debt-financed
investment to apply to all forms of leveraged investment.69 Another option would be to repeal
debt-financed UBIT rules, eliminating the incentive created under current law to use offshore
blocker corporations.70
Increase Data Reporting
In 2016, the Chairmen of the Senate Committee on Finance and the House Committee on Ways
and Means, along with the Ways and Means Oversight Subcommittee Chairman, sent a letter to
56 colleges and universities requesting information regarding the operations and status of the
institution’s endowments.71 Others have suggested that the IRS Form 990 be modified to collect
additional information on endowment funds.72
If endowment spending on financial aid and low- and moderate-income students is an issue of
interest, it might be useful to collect additional information on spending on grants and
scholarships. Another area of potential concern is administrative expenses associated with
managing the endowment, including fees paid to third parties. It might also be helpful to
policymakers to have additional information on the types of endowments held. For example, are
64 Summer A. LePree, “Taxation of United States Tax-Exempt Entities’ Offshore Hedge Fund Investments: Application
of the Section 514 Debt-Financed Rules to Leveraged Hedge Funds and Derivatives and the Case for Equalization,”
The Tax Lawyer, Vol. 61 (Spring 2008): 807-853. 65 Daniel Halperin, “Tax Policy and Endowments—Is Excessive Accumulation Subsidized (Part II),” Tax Notes, Vol.
67, No. 2 2011, pp. 125-133. 66 See CRS Report RL34249, The Tax Reduction and Reform Act of 2007: An Overview, by Jane G. Gravelle for an
overview of the tax reform bill. 67 Offshore Tax Issues: Reinsurance and Hedge Funds, September 26, 2007, at http://www.finance.senate.gov/hearings/
hearing/?id=ddb36aa0-beb0-e2f8-275e-13625c509939. 68 This proposal is discussed by Travis Patton and Jocelyn Bishop, Reporting Unrelated Business Income, Journal of
Accountancy, February 1, 2009, at http://journalofaccountancy.com/Issues/2009/Feb/ReportingUBI.htm. 69 This option is discussed in Norman Silber and John Wei, The Use of Foreign Blocker Corporations by U.S.
Nonprofits: Should Blockers be Blocked?, Hofstra Law, Legal Studies Research Paper No. 2016-04, October 28, 2016,
available at https://ssrn.com/abstract=2860107. 70 Ibid. 71 A list of the institutions that received the letter, as well as a copy of the letter, can be found at
https://waysandmeans.house.gov/endowment-letters/. 72 Testimony of Mark Schneider, Vice President of the American Institutes for Research, in U.S. House of
Representatives, House Committee on Ways and Means Subcommittee on Oversight, Hearing on Tax-Exempt College
and University Endowments, 114th Cong., 2nd sess., September 13, 2016. Testimony available at
https://waysandmeans.house.gov/event/hearing-tax-exempt-college-university-endowments/.

College and University Endowments: Overview and Tax Policy Options
Congressional Research Service 24
endowments composed of quasi-endowments? Or is the use of assets otherwise restricted?
Policymakers might also seek information on endowment holdings of real property.
Collecting additional information on college and university endowments could increase
transparency, while also being useful for policymakers in both policy and oversight capacities. A
potential trade-off associated with collecting additional information is increased administrative
burden.

College and University Endowments: Overview and Tax Policy Options
Congressional Research Service 25
Appendix A. Endowment Data Reported to the IRS
by 501(c)(3) Institutions Data on endowments of 501(c)(3) universities and colleges are reported on Schedule D of IRS
Form 990 informational returns.73 The IRS makes available data files that contain a sample of
information reported on the Form 990s.74 The most recent year for which IRS microdata files are
available is 2014. Public universities and colleges are not required to file 990s and thus
information on non-filing institutions’ endowments is not included in the IRS data.
The IRS SOI 990 sample contains 1,048 observations of higher education entities, including
colleges, universities, two-year colleges, and graduate and professional schools.75 Since the IRS
SOI file is a sample, and not all smaller institutions are included, the sample weights can be used
to estimate the population. Overall, this sample represents an estimated 1,782 institutions. For
2014, these institutions reported total endowments of $390.2 billion.76
In addition to collecting data on endowment balances, the IRS collects data on endowment
contributions; net investment earnings, gains, and losses; grants and scholarships; other
expenditures for facilities and programs; and administrative expenses. Contributions and positive
net investment earnings increase endowment balances. Grants and scholarships, expenditures for
facilities and programs, and administrative expenses reduce endowment balances.
In 2014, $11.3 billion was reported in contributions to 501(c)(3) higher education endowments
(see Table A-1). This amount is equal to 3.0% of the endowment balances reported at the
beginning of 2014. Net investment earnings on endowment funds were reported to be $20.3
billion in 2012, or 5.4% of total endowment funds.
The largest category of endowment spending in 2014 was for facilities and programs, $12.0
billion, or 3.2% of total endowment funds. Grants and scholarships were $4.2 billion in 2014, or
1.1% of endowment funds. Administrative costs were $1.0 billion, or 0.3% of endowment funds.
73 The IRS microdata files are available online at https://www.irs.gov/statistics/soi-tax-stats-2014-charities-and-other-
tax-exempt-organizations-microdata-files. 74 All 501(c)(3) organizations with total assets of $50 million or more are included in the sample. Smaller organizations
are randomly selected for inclusion in the sample, and sampling weights assigned. 75 NTEE classifications of B40, B41, B42, B43, and B50 are included in the analysis. Background on NTEE categories
is available at http://nccs.urban.org/classification/NTEE.cfm. 76 The 2014 Form 990s are filed for 2014 calendar year or fiscal years that began in 2014 and ended in 2015. Some
organizations use calendar year accounting periods, while others use fiscal year accounting periods.

College and University Endowments: Overview and Tax Policy Options
Congressional Research Service 26
Table A-1. Endowments of 501(c)(3) Higher Education Institutions, 2011-2014
Billions of Dollars
2011 2012 2013 2014
Beginning of Year
Balance
$304.90 $302.00 $316.74 $375.77
End of Year Balance $302.60 $330.90 $360.93 $390.17
Total
As a % of
Beginning
of Year
Balance Total
As a % of
Beginning
of Year
Balance Total
As a % of
Beginning
of Year
Balance Total
As a % of
Beginning
of Year
Balance
Contributions $6.88 2.26% $9.48 3.14% $9.62 3.04% $11.28 3.00%
Net Investment
Earnings, Gains, and
Losses
$5.11 1.68% $34.82 11.53% $49.97 15.78% $20.35 5.41%
Grants or
Scholarshipsa
$3.42 1.12% $3.55 1.18% $3.73 1.18% $4.16 1.11%
Other Expenditures
for Facilities and
Programsa
$10.57 3.47% $11.09 3.67% $10.86 3.43% $12.04 3.20%
Administrative
Expensesa
$0.84 0.28% $0.92 0.30% $0.97 0.31% $1.04 0.28%
Source: CRS analysis of the IRS SOI public use file for tax-exempt organizations.
a. Some institutions report certain expenditures as positive, while others report these expenditures as
negative. Since the three expenditure categories would reasonably be expected to be expenditures from
endowments, the analysis here looks at them in absolute value terms.
Data reported by 501(c)(3) universities and colleges on their IRS Form 990 can be used to
calculate payout rates. Following NACUBO, effective spending rates, or payout rates, are
calculated as distribution for spending (spending on grants or scholarships and other expenditures
for facilities and programs) divided by the beginning of year endowment value, net of
administrative expenses. Payout rates for different endowment size classes are reported in Table
A-2, in both dollar-weighted and equal-weighted terms.
Analysis of the distribution of payout rate for 501(c)(3) higher education institutions reveals a
couple of trends. First, median payouts tend to be higher for institutions with larger
endowments.77 Second, payout rates for larger institutions are more concentrated. The difference
between the payout rate for institutions at the 25th percentile and those at the 50th percentile is
greater for institutions with smaller endowments.
77 The average payout in the smallest endowment size class, less than $0.025 billion, is skewed by a few small
institutions reporting very large payouts (close to 100%). The median payout is below the average payout for the
smallest endowment class.

College and University Endowments: Overview and Tax Policy Options
Congressional Research Service 27
Table A-2. Endowment Payouts of 501(c)(3) Higher Education Institutions, 2014
Dollar
Weighted Equal Weighted
Endowment Size
Number of
Institutions
Average
Payout
Average
Payout
Payout at
25th
Percentile
Median
Payout
(50th
Percentile)
Payout at
75th
Percentile
Over $1 billion 56 4.40% 4.44% 3.81% 4.37% 4.86%
$0.5 billion - $1.0 billion 47 3.94% 3.87% 3.52% 4.25% 4.56%
$0.1 billion - $0.5 billion 235 4.04% 4.12% 3.22% 4.12% 4.79%
$0.05 billion - $0.1 billion 166 4.53% 4.59% 3.05% 3.84% 4.79%
$0.025 billion - $0.05 billion 185 4.37% 4.38% 2.81% 3.80% 4.73%
Under $0.025 billion 1,093 4.94% 4.35% 1.40% 3.33% 4.80%
Total 1,782 4.32% 4.32% 2.75% 3.89% 4.77%
Source: CRS analysis of the IRS SOI public use file for tax-exempt organizations.
Notes: The 25th percentile corresponds to the point in the distribution of payouts where 25% of institutions in
the endowment size class have payouts below the payout rate at the 25th percentile, and 75% of institutions have
payouts above that rate. Institutions with zero endowment net of administrative costs were excluded when
calculating equal weighted payouts rates.

College and University Endowments: Overview and Tax Policy Options
Congressional Research Service 28
Appendix B. Top 100 College and University
Endowments Table B-1 lists the top 100 U.S. college and university endowments reported to NACUBO as of
FY2017, including both public and private institutions. Harvard University has the largest
endowment, at $36.0 billion. Harvard held 6.4% of all endowment assets reported to NACUBO
as of FY2017. The second-largest endowment was held by the Yale University system, at $27.2
billion, or 4.8% of all endowment assets. Taken together, the top 100 institutions listed in Table
B-1 held 76.2% of endowment assets as of FY2017.
Table B-1. Top 100 College and University Endowments, FY2017
Institution
Endowment ($
billions)
Share of
Endowment
Assets Cumulative Share
Harvard University $36.0 6.4% 6.4%
Yale University $27.2 4.8% 11.1%
The University of Texas System $26.5 4.7% 15.8%
Stanford University $24.8 4.4% 20.2%
Princeton University $23.8 4.2% 24.4%
Massachusetts Institute of Technology $15.0 2.6% 27.0%
University of Pennsylvania $12.2 2.2% 29.2%
The Texas A&M University System $11.6 2.0% 31.2%
University of Michigan $10.9 1.9% 33.1%
Northwestern University $10.4 1.8% 35.0%
Columbia University $10.0 1.8% 36.7%
The University of California $9.8 1.7% 38.5%
University of Notre Dame $9.4 1.6% 40.1%
Duke University $7.9 1.4% 41.5%
Washington University in St. Louis $7.9 1.4% 42.9%
The University of Chicago $7.5 1.3% 44.2%
Emory University $6.9 1.2% 45.4%
Cornell University $6.8 1.2% 46.6%
University of Virginia $6.4 1.1% 47.8%
Rice University $5.8 1.0% 48.8%
University of Southern California $5.1 0.9% 49.7%
Dartmouth College $5.0 0.9% 50.6%
The Ohio State University $4.3 0.7% 51.3%
Vanderbilt University $4.1 0.7% 52.0%
New York University $4.0 0.7% 52.8%
The Pennsylvania State University $4.0 0.7% 53.5%

College and University Endowments: Overview and Tax Policy Options
Congressional Research Service 29
Institution
Endowment ($
billions)
Share of
Endowment
Assets Cumulative Share
University of Pittsburgh $3.9 0.7% 54.1%
Johns Hopkins University $3.8 0.7% 54.8%
University of Minnesota & Foundation $3.5 0.6% 55.4%
Brown University $3.2 0.6% 56.0%
University of North Carolina at Chapel Hill
and Foundations
$3.0 0.5% 56.5%
University of Wisconsin Foundation $2.7 0.5% 57.0%
Michigan State University $2.7 0.5% 57.5%
California Institute of Technology $2.6 0.5% 58.0%
University of Illinois & Foundation $2.6 0.5% 58.4%
University of Washington $2.5 0.4% 58.9%
The President and Trustees of Williams
College
$2.5 0.4% 59.3%
Purdue University $2.4 0.4% 59.7%
University of Richmond $2.4 0.4% 60.2%
Trustees of Boston College $2.3 0.4% 60.6%
Amherst College $2.2 0.4% 61.0%
Indiana University and Foundation $2.2 0.4% 61.3%
Pomona College $2.2 0.4% 61.7%
Carnegie Mellon University $2.2 0.4% 62.1%
University of Rochester $2.1 0.4% 62.5%
The UCLA Foundation $2.1 0.4% 62.8%
The Rockefeller University $2.0 0.4% 63.2%
Georgia Institute of Technology and related
Foundations
$2.0 0.4% 63.6%
Trustees of Boston University $2.0 0.3% 63.9%
Swarthmore College $2.0 0.3% 64.2%
Wellesley College $1.9 0.3% 64.6%
Trustees of Grinnell College $1.9 0.3% 64.9%
Virginia Commonwealth University $1.8 0.3% 65.2%
Case Western Reserve University $1.8 0.3% 65.6%
University of California Berkeley Foundation $1.8 0.3% 65.9%
Smith College $1.8 0.3% 66.2%
Tufts University $1.7 0.3% 66.5%
The George Washington University $1.7 0.3% 66.8%
Georgetown University $1.7 0.3% 67.1%
University of Oklahoma $1.6 0.3% 67.4%
College and University Endowments: Overview and Tax Policy Options
Congressional Research Service 30
Institution
Endowment ($
billions)
Share of
Endowment
Assets Cumulative Share
University of Nebraska Board of Regents $1.6 0.3% 67.7%
The Kansas University Endowment
Association
$1.6 0.3% 68.0%
University of Florida Foundation Inc. $1.6 0.3% 68.2%
University of Missouri System $1.6 0.3% 68.5%
Washington and Lee University $1.5 0.3% 68.8%
Texas Christian University $1.5 0.3% 69.1%
Southern Methodist University $1.5 0.3% 69.3%
Bowdoin College $1.5 0.3% 69.6%
University of Iowa & Foundation $1.4 0.2% 69.8%
University of Delaware $1.4 0.2% 70.1%
The University of Alabama System $1.4 0.2% 70.3%
University of California San Francisco
Foundation
$1.3 0.2% 70.5%
Liberty University Inc. $1.3 0.2% 70.8%
Tulane University $1.3 0.2% 71.0%
University of Kentucky $1.3 0.2% 71.2%
University of Cincinnati $1.3 0.2% 71.4%
Lehigh University $1.3 0.2% 71.7%
Texas Tech University System $1.3 0.2% 71.9%
Syracuse University $1.3 0.2% 72.1%
Baylor University $1.2 0.2% 72.3%
Rutgers the State University of New Jersey $1.2 0.2% 72.5%
University of Colorado Foundation $1.2 0.2% 72.8%
The University of Tennessee $1.2 0.2% 73.0%
Wake Forest University $1.2 0.2% 73.2%
Trinity University $1.2 0.2% 73.4%
Baylor College of Medicine $1.2 0.2% 73.6%
The University of Georgia and Related
Foundations
$1.2 0.2% 73.8%
Berea College $1.2 0.2% 74.0%
Saint Louis University $1.1 0.2% 74.2%
The University of Utah $1.1 0.2% 74.4%
NC State University and Related Foundations $1.1 0.2% 74.6%
The University System of Maryland
Foundation, Inc.
$1.1 0.2% 74.8%
Middlebury College $1.1 0.2% 75.0%

College and University Endowments: Overview and Tax Policy Options
Congressional Research Service 31
Institution
Endowment ($
billions)
Share of
Endowment
Assets Cumulative Share
Princeton Theological Seminary $1.1 0.2% 75.2%
The University of Tulsa $1.0 0.2% 75.4%
Vassar College $1.0 0.2% 75.5%
University of Arkansas - Fayetteville $1.0 0.2% 75.7%
Virginia Tech Foundation $1.0 0.2% 75.9%
Brandeis University $1.0 0.2% 76.1%
Washington State University $1.0 0.2% 76.2%
Source: NACUBO-Commonfund Study of Endowment, 2017, publicly available data at https://www.nacubo.org/
Research/2009/Public-NCSE-Tables.

College and University Endowments: Overview and Tax Policy Options
Congressional Research Service 32
Appendix C. Top 25 Private Institutions Ranked by
Endowment Assets per Student Table C-1 includes the top 25 private institutions, ranked according to endowment assets per
student.
Table C-1. Top 25 Private Institutions by Endowment Assets per Student
End of FY2017 Endowment assets and Fall 2016 Full-Time Equivalent Students
Institution
FY2017
Endowment
Assets
($ billions)
Share of total
Endowment
Assets
Endowment
Value per
Student
Fall 2016 Full-
Time
Equivalent
Students
The Rockefeller University $2.05 0.4% $10,246,719 200
Princeton University $23.81 4.2% $2,951,077 8,069
Yale University $27.18 4.8% $2,191,268 12,402
Princeton Theological Seminary $1.07 0.2% $1,996,913 534
Stanford University $24.78 4.4% $1,541,160 16,082
Harvard University $36.02 6.4% $1,522,104 23,666
The Principia Corporation $0.68 0.1% $1,430,552 477
Pomona College $2.17 0.4% $1,321,353 1,640
Massachusetts Institute of Technology $14.97 2.6% $1,315,751 11,376
Amherst College $2.25 0.4% $1,255,243 1,791
Swarthmore College $1.96 0.3% $1,207,864 1,619
The President and Trustees of Williams
College
$2.51 0.4% $1,188,429 2,111
California Institute of Technology $2.61 0.5% $1,163,618 2,240
Austin Presbyterian Theological Seminary $0.12 0.0% $1,162,173 106
Trustees of Grinnell College $1.87 0.3% $1,119,716 1,671
Franklin W. Olin College of Engineering $0.38 0.1% $1,072,020 351
Christian Theological Seminary $0.10 0.0% $940,154 106
Columbia Theological Seminary $0.21 0.0% $892,210 234
Rice University $5.81 1.0% $872,778 6,662
The Cooper Union for the Advancement of
Science and Art
$0.80 0.1% $851,726 938
McCormick Theological Seminary $0.08 0.0% $811,681 104
Wellesley College $1.93 0.3% $807,322 2,392
Bowdoin College $1.46 0.3% $806,151 1,806
Dartmouth College $4.96 0.9% $782,398 6,335
University of Notre Dame $9.35 1.6% $762,463 12,266
Source: NACUBO-Commonfund Study of Endowment, 2017, publicly available data at https://www.nacubo.org/
Research/2009/Public-NCSE-Tables.

College and University Endowments: Overview and Tax Policy Options
Congressional Research Service 33
Acknowledgments
Adam Stoll, Section Research Manager of the Education and Labor Section; David H. Bradley, Specialist
in Labor Economics; and Erika K. Lunder, Legislative Attorney, provided helpful comments on an earlier
version of this report. Jamie L. Hutchinson, Visual Information Specialist, provided graphics support on an
earlier version of this report. Jeff Stupak was a co-author on an earlier version of this report.
Author Contact Information
Molly F. Sherlock
Specialist in Public Finance
[email protected], 7-7797
Margot L. Crandall-Hollick
Specialist in Public Finance
[email protected], 7-7582
Jane G. Gravelle
Senior Specialist in Economic Policy
[email protected], 7-7829
Joseph S. Hughes
Research Assistant
[email protected], 7-0952