Embed Size (px)
Citation preview

www.ExcelinEd.org
COLLEGE AND CAREER PATHWAYS: EQUITY AND ACCESS
ExcelinEd Civil Rights Data Collection Analysis- 2018
By 2020, 65 percent of jobs will require a postsecondary credential, meaning anything from a bachelor’s degree to industry-recognized credentials. Without access to essential math and science classes in high school, many students will graduate from high school unprepared for postsecondary learning and the opportunities it offers. To ensure students have opportunities to acquire a postsecondary credential, we need to know what courses are available to them during high school.
EXECUTIVE SUMMARY Analysis Findings ExcelinEd’s new analysis of data from the U.S. Department of Education reveals that too many students in every state do not have the chance to take fundamental courses needed to prepare them for college and career.
• Nationally, millions of students lack access to key courses that would prepare them for college and career.
• Access is inequitable: it is worse for schools with high populations of minority students and schools with high populations of low-income students.
Solutions for States If states know which math, science and advanced learning opportunities students have access to, they can better understand how that access (or lack thereof) may impact students’ futures as well as the future of local, state and national workforces and economies. ExcelinEd has identified a three-step process states can consider using to overcome gaps in access to core courses.
1. Evaluate: Conduct a statewide audit of course offerings and access.
2. Communicate: Inform families of courses necessary for college and career readiness and options to access those courses.
3. Improve: Identify policy solutions to improve access for students.
CONTENTS Part 1: The Analysis – 2
Part 2: Our Findings - 3
• Students Lack Access to College and Career Preparation Courses
• Lack of Access Reveals Equity Issues for Certain School Types
Part 3: Solutions for States - 6
• Evaluate • Communicate • Improve
Part 4: Additional Findings and Access Comparison - 9
Appendices A-D - 14
About the Data Source
Since 1968, the U.S. Department of Education’s Civil Rights Data Collection (CRDC) has collected data on key education and civil rights issues in our nation's public schools. CRDC offers a variety of information including student enrollment and educational programs and services, which the Department of Education’s Office for Civil Rights (OCR) collects and publishes the biennial data collection.
In April 2018, OCR released the 2015-16 CRDC. The information in this data collection is self-reported by 17,300 public school districts and 96,400 public schools and educational programs (a 99.8 percent response rate). The data include access to math (Algebra I, Geometry, Algebra II, Advanced Math and Calculus), science (Biology, Chemistry and Physics) and college-credit bearing courses (Advanced Placement and dual enrollment).

Page 2 of 21
ExcelinEd Civil Rights Data Collection Analysis - 2018
PART 1: THE ANALYSIS CRDC1 is the most comprehensive 50-state data source on access to college and career preparation courses currently available. ExcelinEd analyzed the 2015-16 CRDC to identify gaps in students’ access to college and career preparation courses. Through this analysis, we strove to answer the following questions:
• How many students do not have access to college and career preparation courses2 in their schools? • What types of schools are more or less likely to offer those courses? • Do schools with higher populations of minority and low-income students offer students equal access to college
and career preparation courses?
Our Approach Our approach to the data analysis includes:
• Linking CRDC with the Common Core of Data (CCD)3 to provide additional and more accurate information about school characteristics, particularly school enrollments.4
• Using a broad definition of “high school” (schools offering grades 9, 10, 11 or 12) that gives better insight into schools that should be offering these courses.
• Choosing to use course “or higher” in analysis. Only identifying how many schools do not offer a specific course could be misleading, especially in math and science where there is typically a traditional course progression.
Visit ExcelinEd.org/CRDC-Analysis to access our dataset and additional resources.
Data Limitations While CRDC is the most comprehensive dataset on access to college and career preparation courses, it has some limitations. CRDC and our analysis does not: include if students are accessing courses online, include non-core courses, reflect the current school year (2017-18) or reflect the quality of the course. Additionally, we did not independently verify the information from the 29,716 public schools reflected in this analysis. For more information, see Appendix A on page 14.
Analysis Definitions All Schools — CRDC collects data from K-12 public local education agencies (LEA) and schools, including juvenile justice facilities, charter schools, alternative schools and schools serving only students with disabilities. We have limited that population to all public schools offering grades 9, 10, 11 or 12.
Locale — The National Center for Education Statistics (NCES) designed a locale framework to provide a general indicator of the type of geographic area where a school is located. We used NCES’s four basic types of locale (city, suburban, town and rural) and did not include subtypes. Additional details can be found at the NCES website.
Poverty — We identified low-income students as those eligible for free or reduced-price lunch (FRPL) under the National School Lunch program. We sorted K-12 schools from smallest to greatest percentage of FRPL students, separated out high schools and divided the high schools into quintiles which we reference throughout the report.
Minority — We identified Black, Hispanic, American Indian and Pacific Islander students as minority students. We sorted K-12 schools from smallest to greatest percentage of minority students, separated out high schools and divided high schools into quintiles which we reference throughout the report. 1 U.S. Department of Education, Office for Civil Rights, 2015-16 Civil Rights Data Collection. Available at www2.ed.gov/about/offices/list/ocr/docs/crdc-2015-16.html. 2 Core courses collected by the CRDC are: Algebra I, Geometry, Algebra II, Advanced Math and Calculus; Biology, Chemistry and Physics; Advanced Placement and dual enrollment. 3 U.S. Department of Education, National Center for Education Statistics, Common Core of Data. Available at https://nces.ed.gov/ccd/. 4 CRDC allows users to look at the data in two ways: by number of schools and percent of schools. ExcelinEd used the Common Core of Data (CCD) to match NCES ID numbers, allowing us to also analyze the number of students affected by the lack of access in those schools. This is important to get a better indication of how many students are affected, as school sizes vary widely across the US.

Page 3 of 21
ExcelinEd Civil Rights Data Collection Analysis - 2018
PART 2: OUR FINDINGS ExcelinEd’s analysis identifies a national issue for high school-aged students: lack of access to critical courses necessary to prepare for college and career. We found the following:
• Nationally, millions of students lack access to key courses that would prepare them for college and career. • Access is inequitable: it is worse for schools with high populations of minority students5 and schools with
high populations of low-income students.6
Students Lack Access to College and Career Preparation Courses The data show that across the country, nearly 1.4 million students attend public high schools that do not offer Algebra I or the subsequent progression of math courses expected by many colleges and universities for enrollment.
An even greater number—1.5 million students—attend public high schools that do not offer Biology or higher. And those are just the first core courses in the math and science progressions.
More than half of our nation’s high schools don’t offer Calculus, meaning 4.3 million students can’t pursue this course. Nearly half (47 percent) of high schools don’t offer Physics, leaving 3.4 million students without access.
The problem is not isolated to just a few states. According to the self-reported data in the CRDC, not a single state offers Algebra I or Biology in all high schools. For additional information about the limitations of this data set, see the data limitations on p. 2.
These courses open the door for students to pursue a range of challenging and vital careers. Research shows that students who take high-quality math in high school are more likely to declare STEM majors in college. And students
5 ExcelinEd defines high minority schools as schools in the 80th percentile or higher of minority students enrolled in those schools and low minority schools as those schools in the 20th percentile or lower.
6 ExcelinEd defines high poverty schools as schools in the 80th percentile or higher of FRPL students enrolled in those schools and low poverty schools as those schools in the 20th percentile or lower.
Page 4 of 21
ExcelinEd Civil Rights Data Collection Analysis - 2018
who take Algebra II in high school are also more likely to enroll in college or community college. Many colleges expect students to have mastered these topics before they are accepted. Yet millions of students have no access.
Lack of Access Reveals Equity Issues Even considering the limitations of the data, ExcelinEd’s analysis revealed an alarming and consistent pattern of inequity. As noted, students attending two specific types of schools are significantly less likely to have access to college and career preparatory courses: high minority schools and high poverty schools.
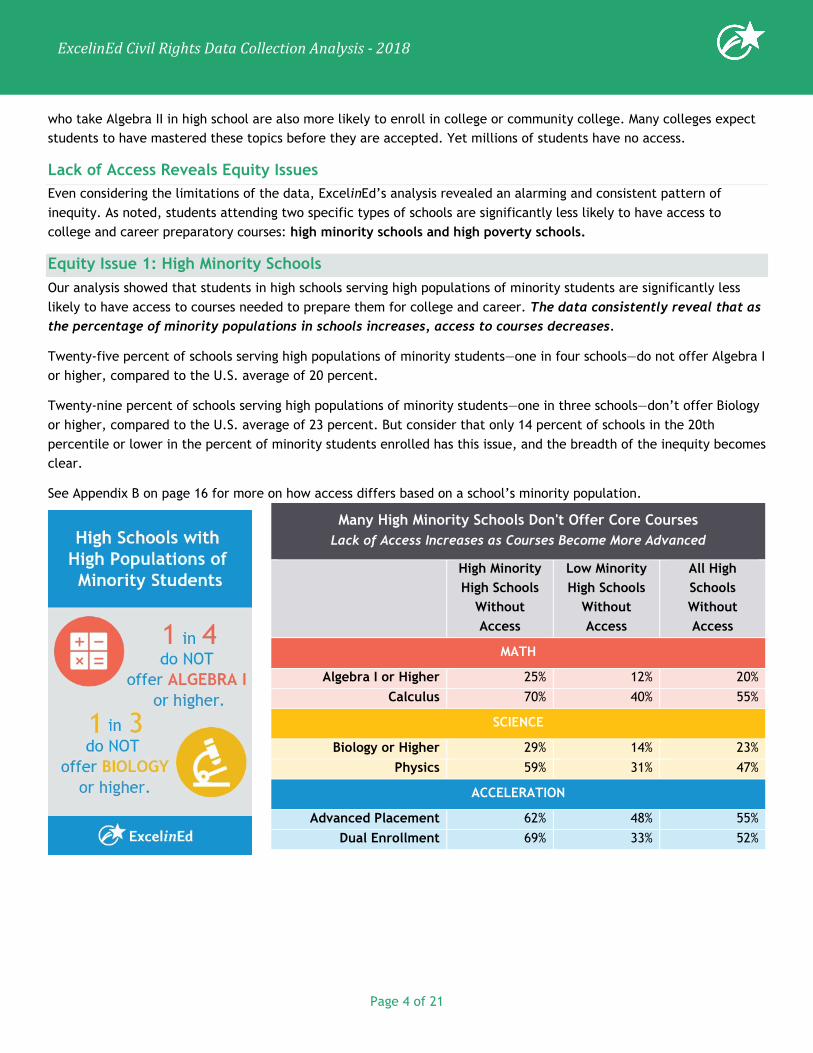
Equity Issue 1: High Minority Schools Our analysis showed that students in high schools serving high populations of minority students are significantly less likely to have access to courses needed to prepare them for college and career. The data consistently reveal that as the percentage of minority populations in schools increases, access to courses decreases.
Twenty-five percent of schools serving high populations of minority students—one in four schools—do not offer Algebra I or higher, compared to the U.S. average of 20 percent.
Twenty-nine percent of schools serving high populations of minority students—one in three schools—don’t offer Biology or higher, compared to the U.S. average of 23 percent. But consider that only 14 percent of schools in the 20th percentile or lower in the percent of minority students enrolled has this issue, and the breadth of the inequity becomes clear.
See Appendix B on page 16 for more on how access differs based on a school’s minority population.
Many High Minority Schools Don't Offer Core Courses Lack of Access Increases as Courses Become More Advanced
High Minority High Schools
Without Access
Low Minority High Schools
Without Access
All High Schools Without Access
MATH
Algebra I or Higher 25% 12% 20% Calculus 70% 40% 55%
SCIENCE
Biology or Higher 29% 14% 23% Physics 59% 31% 47%
ACCELERATION
Advanced Placement 62% 48% 55% Dual Enrollment 69% 33% 52%

Page 5 of 21
ExcelinEd Civil Rights Data Collection Analysis - 2018
Equity Issue 2: High Poverty Schools Students in high poverty high schools—schools serving high populations of low-income students—are also significantly less likely to have access to courses needed to prepare students for college and career. The data consistently reveal that as the percentage of low-income populations in schools increases, access to courses decreases.
Twenty-one percent of high poverty schools, or one in five, do not offer Algebra I or higher.
Sixty percent of high poverty schools, or three in five, don’t offer Physics or higher, compared to the U.S. average of 47 percent. In contrast, only 33 percent of low-poverty schools fail to offer Physics.
See Appendix C on page 18 for more on how access differs based on income.
Many High Poverty Schools Don't Offer Core Courses Lack of Access Increases as Courses Become More Advanced
High Poverty High Schools
Without Access
Low Poverty High Schools
Without Access
All High Schools Without Access
MATH
Algebra I or Higher 21% 16% 20% Calculus 72% 39% 55%
SCIENCE
Biology or Higher 25% 18% 23% Physics 60% 33% 47%
ACCELERATION
Advanced Placement 65% 41% 55% Dual Enrollment 65% 44% 52%
Locale & School Size
Lack of access isn’t just a rural problem. We had assumed lack of access nationally would be much higher in rural schools compared to city, suburb or town schools. However, the data showed that city schools are more likely not to offer math courses within their schools compared to rural schools.
School size matters. Small are less likely to offer the full progression of math and science courses. Very small schools—those with fewer than 93 students—are significantly less likely to offer college and career preparatory courses than larger schools, regardless of location. According to the CCD, 18 percent of K-12 students attend schools serving 100 or fewer students.
See page 9 for more on rural and small school findings.
Page 6 of 21
ExcelinEd Civil Rights Data Collection Analysis - 2018
PART 3: SOLUTIONS FOR STATES At ExcelinEd, we promote student-centered policy solutions that increase student learning, advance equity and prepare graduates for college and career. These solutions can help all students access the courses necessary to reach their greatest potential. And we see a path forward for states seeking to address this crisis in access and equity.
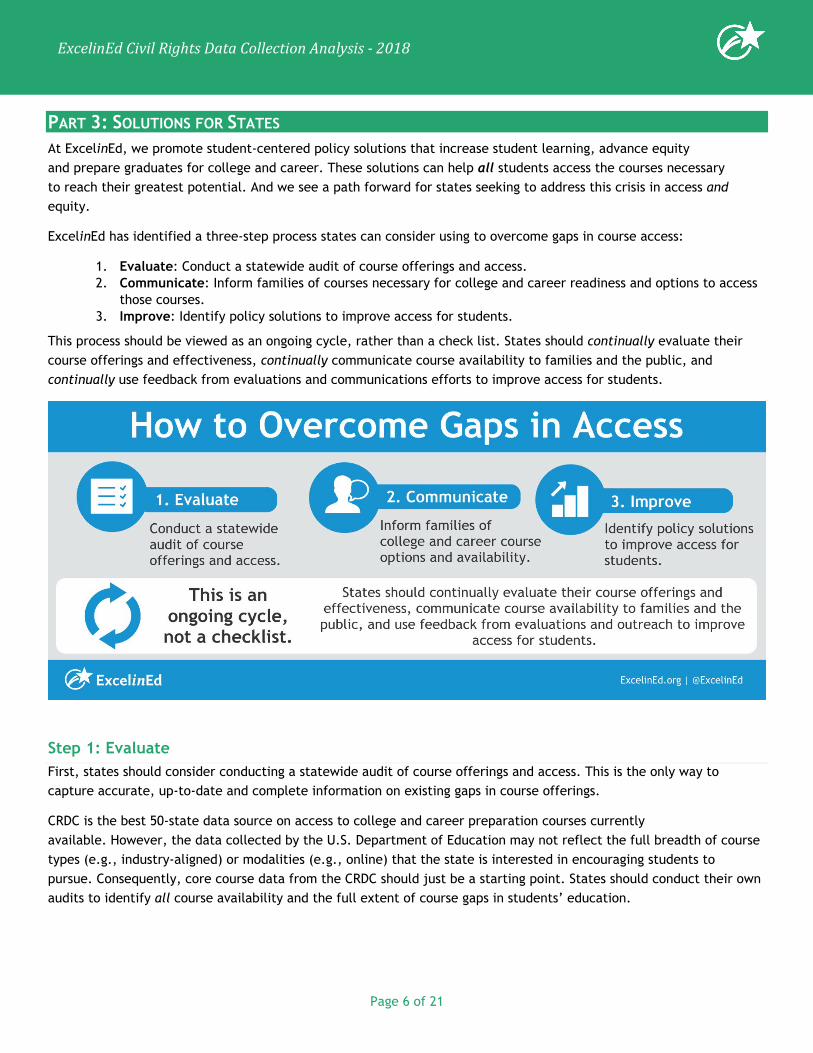
ExcelinEd has identified a three-step process states can consider using to overcome gaps in course access:
1. Evaluate: Conduct a statewide audit of course offerings and access. 2. Communicate: Inform families of courses necessary for college and career readiness and options to access
those courses. 3. Improve: Identify policy solutions to improve access for students.
This process should be viewed as an ongoing cycle, rather than a check list. States should continually evaluate their course offerings and effectiveness, continually communicate course availability to families and the public, and continually use feedback from evaluations and communications efforts to improve access for students.
Step 1: Evaluate First, states should consider conducting a statewide audit of course offerings and access. This is the only way to capture accurate, up-to-date and complete information on existing gaps in course offerings.
CRDC is the best 50-state data source on access to college and career preparation courses currently available. However, the data collected by the U.S. Department of Education may not reflect the full breadth of course types (e.g., industry-aligned) or modalities (e.g., online) that the state is interested in encouraging students to pursue. Consequently, core course data from the CRDC should just be a starting point. States should conduct their own audits to identify all course availability and the full extent of course gaps in students’ education.
Page 7 of 21
ExcelinEd Civil Rights Data Collection Analysis - 2018
Step 2: Communicate One outcome of a state’s audit and the subsequent analysis should be a clear understanding of which types of courses are critical for postsecondary success and career readiness and where gaps in access to those courses exist. Even as states work to correct inequity and gaps in access within the state, they must communicate the results of the analysis to parents and students.
Parents and students should be informed of and able to easily find the following:
1. Range of college and career readiness courses students should consider and take. 2. Options to access those courses.
Step 3: Improve Finally, states can identify policy solutions to improve access for students. There isn’t one solution to address access gaps nationwide. States need to customize their plans for addressing state access gaps based on their own analysis and unique state circumstances. However, we have compiled the following potential options for consideration.
Expand Course Offerings Statewide Through Course Access State leaders can look to states employing course access policies like Louisiana, Indiana and Rhode Island. Course access is a state-level program that provides students with expanded course offerings from diverse, accountable providers across the country. Students then can receive credit in their home school for these courses. Strong data
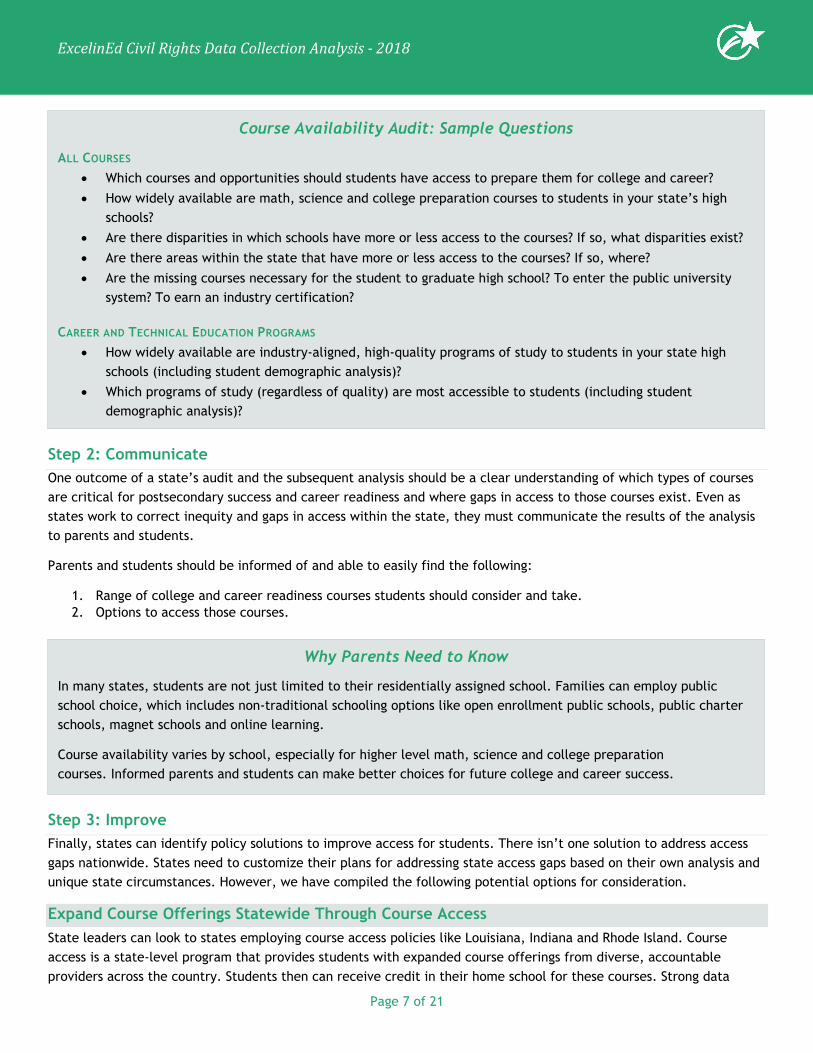
Course Availability Audit: Sample Questions
ALL COURSES • Which courses and opportunities should students have access to prepare them for college and career? • How widely available are math, science and college preparation courses to students in your state’s high
schools? • Are there disparities in which schools have more or less access to the courses? If so, what disparities exist? • Are there areas within the state that have more or less access to the courses? If so, where? • Are the missing courses necessary for the student to graduate high school? To enter the public university
system? To earn an industry certification? CAREER AND TECHNICAL EDUCATION PROGRAMS
• How widely available are industry-aligned, high-quality programs of study to students in your state high schools (including student demographic analysis)?
• Which programs of study (regardless of quality) are most accessible to students (including student demographic analysis)?
Why Parents Need to Know
In many states, students are not just limited to their residentially assigned school. Families can employ public school choice, which includes non-traditional schooling options like open enrollment public schools, public charter schools, magnet schools and online learning.
Course availability varies by school, especially for higher level math, science and college preparation courses. Informed parents and students can make better choices for future college and career success.
Page 8 of 21
ExcelinEd Civil Rights Data Collection Analysis - 2018
collection and reporting from the analysis can help states make informed decisions on what types of courses to include in their program and where those courses would have the greatest impact. States can also consider providing a course access opportunity incentive to encourage district utilization of courses not available through the student’s home school. Learn more about course access.
Expand Options Offered by Existing Course Providers
States can allow their districts and schools to utilize other online resources and courses as they address access gaps. High-quality online learning is an effective way to offer courses to students across state and district lines. Organizations such as Modern States Education Alliance partners with edX to “let students earn up to one year of college credit without tuition or textbook expense.” Khan Academy is widely used by schools across the U.S. and “offers practice exercises, instructional videos and a personalized learning dashboard that empower[s] learners to study at their own pace in and outside of the classroom.”
Expand Access to High-Quality Career and Technical Education (CTE) Pathways After a state analysis of core and non-core courses, states should be able to report on what CTE opportunities are available to which students. However, this is the first step. States can also analyze regional labor market data to determine whether offerings available to students are closely aligned both to industry standards and demand. High-quality pathways have the following features: include the progressive set of coursework, experiences and credentials that span both secondary and postsecondary education as well as work-based contexts; are closely aligned with industry standards and demand; and prepare learners not only for entry to a middle- or higher-wage job, but also for continued career advancement over time. CTE programs are the primary means by which high school and early postsecondary students can access and pursue these pathways at scale. Learn more about CTE.
Make It Easier for Schools and Districts to Attract Talent A school’s ability to recruit and retain effective teachers has a significant impact on the courses the school can offer. Math and science are consistently listed as teacher shortage areas by the Department of Education.7 As demand for STEM jobs grows, spotlighting and expanding efforts to address teacher shortages through new pipelines, training, adjunct and alternative certifications will need to become more of a state priority. 8
However, it’s not just STEM. High-quality CTE programs also are challenged by a lack of qualified subject area instructors. Recruiting and retaining high-quality instructors requires more flexibility for certification and ongoing, progressive training and professional development that is reflective of current industry work environments. For example, a growing number of states are providing school districts the ability to certify staff locally or provisionally to address CTE instructor shortages.
Address Key Infrastructure Needs Digital learning and access to online resources are key components to ensuring students have the tools necessary to succeed after high school. School districts’ access to high-quality broadband has increased dramatically over the last five years. According to Education Superhighway, in 2013, 40 million students were not meeting the 100 kbps per student minimum connectivity goal for digital learning. The connectivity gap has narrowed by 84 percent. However, 6.5 million students remain unconnected to high speed broadband. State leadership can prioritize connectivity for the remaining students and schools. For more information, visit Education Superhighway.
7 U.S. Department of Education, “Teacher Shortage Areas.” Available at https://tsa.ed.gov/#/home/. 8 For example, in 2017, Arizona passed legislation (SB1042) that would allow highly-qualified professionals to be certified to teach. The professional would have significant experience in a subject matter, possess a higher education, and have passed a background check in order to be certified.
Page 9 of 21
ExcelinEd Civil Rights Data Collection Analysis - 2018
PART 4: ADDITIONAL FINDINGS AND ACCESS COMPARISON In addition to the access issues outlined above, this analysis has also uncovered significant access issues impacting students in small schools across the country.
Access by Locale & Size
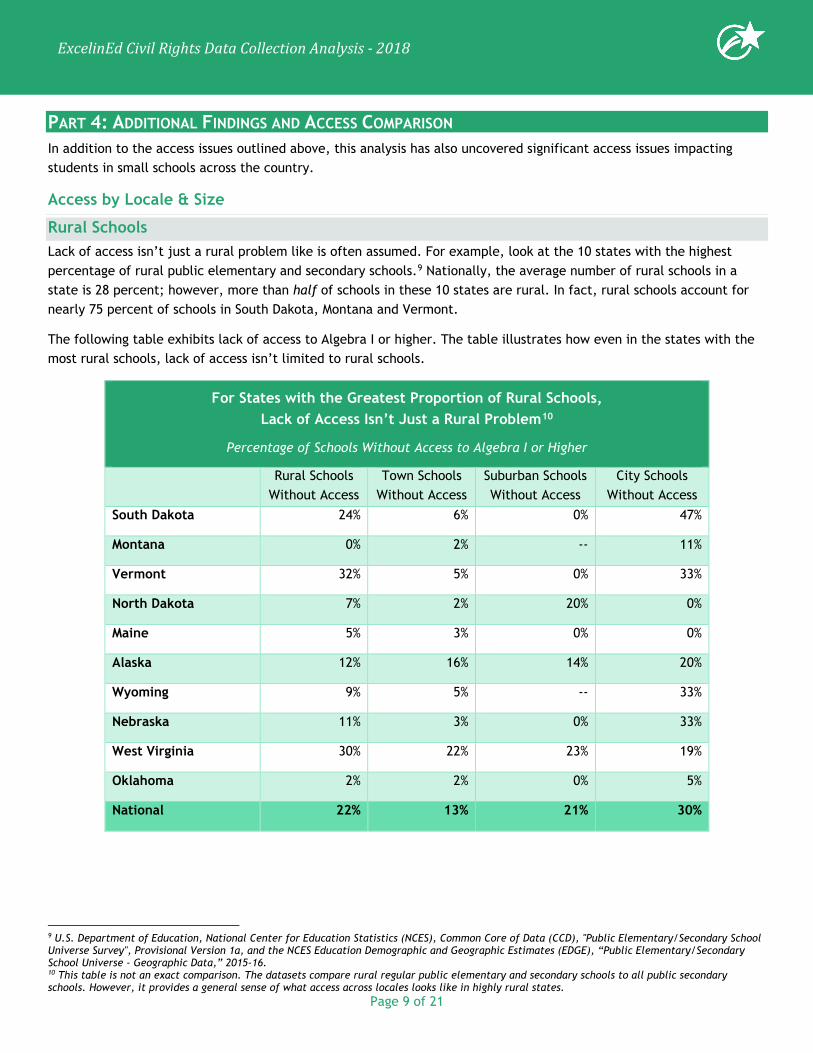
Rural Schools Lack of access isn’t just a rural problem like is often assumed. For example, look at the 10 states with the highest percentage of rural public elementary and secondary schools.9 Nationally, the average number of rural schools in a state is 28 percent; however, more than half of schools in these 10 states are rural. In fact, rural schools account for nearly 75 percent of schools in South Dakota, Montana and Vermont.
The following table exhibits lack of access to Algebra I or higher. The table illustrates how even in the states with the most rural schools, lack of access isn’t limited to rural schools.
For States with the Greatest Proportion of Rural Schools, Lack of Access Isn’t Just a Rural Problem10
Percentage of Schools Without Access to Algebra I or Higher
Rural Schools Without Access
Town Schools Without Access
Suburban Schools Without Access
City Schools Without Access
South Dakota 24% 6% 0% 47%
Montana 0% 2% -- 11%
Vermont 32% 5% 0% 33%
North Dakota 7% 2% 20% 0%
Maine 5% 3% 0% 0%
Alaska 12% 16% 14% 20%
Wyoming 9% 5% -- 33%
Nebraska 11% 3% 0% 33%
West Virginia 30% 22% 23% 19%
Oklahoma 2% 2% 0% 5%
National 22% 13% 21% 30%
9 U.S. Department of Education, National Center for Education Statistics (NCES), Common Core of Data (CCD), "Public Elementary/Secondary School Universe Survey", Provisional Version 1a, and the NCES Education Demographic and Geographic Estimates (EDGE), “Public Elementary/Secondary School Universe - Geographic Data,” 2015-16. 10 This table is not an exact comparison. The datasets compare rural regular public elementary and secondary schools to all public secondary schools. However, it provides a general sense of what access across locales looks like in highly rural states.

Page 10 of 21
ExcelinEd Civil Rights Data Collection Analysis - 2018
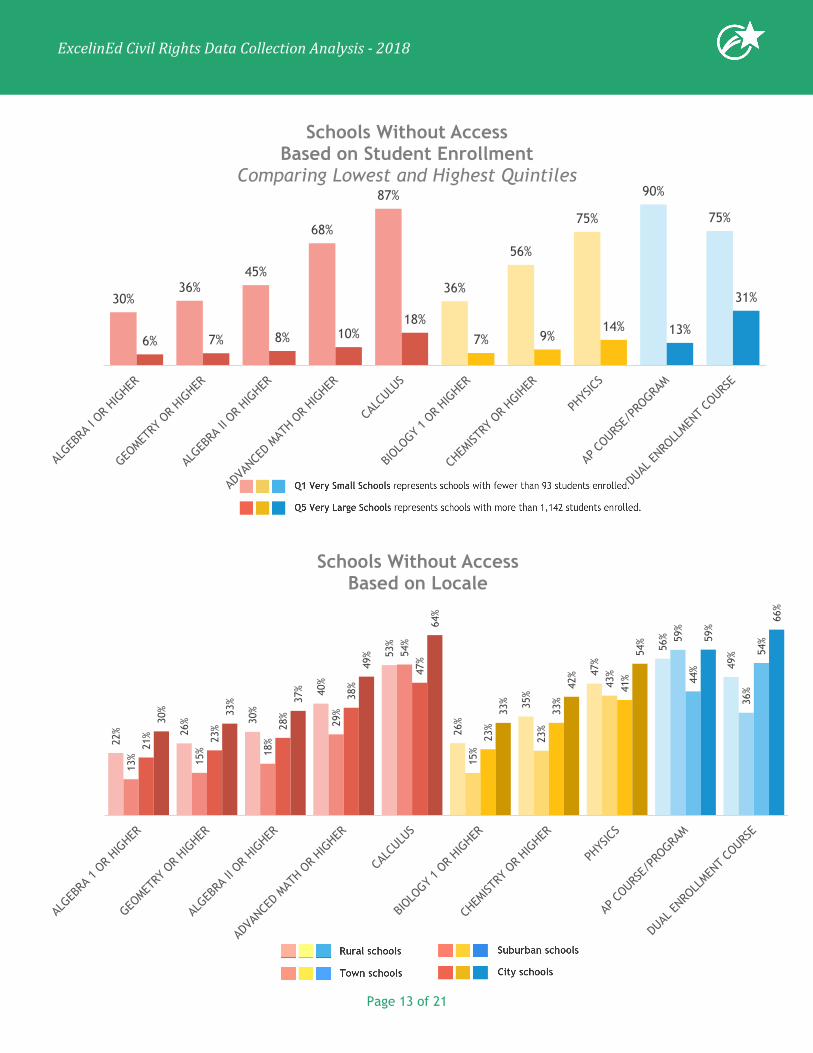
School Size One interesting finding our analysis uncovered concerns school sizes. We had assumed that rural schools’ access gaps would be considerably higher than city, suburb or town schools. However, that was not the case. What seemed to matter most is school size.
Nationally, when comparing the very small high schools in the lowest quintile (schools with fewer than 93 students) with small high schools in the second quintile (schools with 93 to 263 students), we found a dramatic difference in access for schools with more than 93 students. For all math courses except Calculus, the gap in access between small schools and very small schools doubles. This is important because according to CCD11, 18 percent of K-12 students attend schools serving 100 or fewer students.
Very Small Schools Lack of Access Increases as Courses Become More Advanced
Very Small High Schools
Without Access
Small High Schools
Without Access
All High Schools Without Access
MATH
Algebra I or Higher 30% 13% 20% Calculus 87% 57% 55%
SCIENCE
Biology or Higher 36% 16% 23% Physics 75% 45% 47%
ACCELERATION
Advanced Placement 90% 62% 55% Dual Enrollment 75% 43% 52%
11 U.S. Department of Education, National Center for Education Statistics, Common Core of Data (CCD), “Public Elementary/Secondary School Universe Survey,” 2013-14, 2014-15, and 2015-16.

Page 11 of 21
ExcelinEd Civil Rights Data Collection Analysis - 2018
Access Comparison The following tables and charts provide a more direct comparison of access across a single subject for all populations or a direct comparison across a single population for all subjects.
Access to Math Courses: Side-by-Side Comparison % of Schools Without Access
LOCALE POVERTY MINORITY SCHOOL SIZE ALL SCHOOLS
Rural Town Suburb City Low (Q1)
High (Q5)
Low (Q1)
High (Q5)
Very Small (Q1)
Very Large (Q5)
Algebra I or higher
22% 13% 21% 30% 16% 21% 12% 25% 30% 6% 20%
Geometry or higher
26% 15% 23% 33% 18% 26% 13% 29% 36% 7% 23%
Algebra II or higher
30% 18% 28% 37% 21% 32% 15% 35% 45% 8% 28%
Advanced Math or higher
40% 29% 38% 49% 29% 50% 22% 51% 68% 10% 39%
Calculus 53% 54% 47% 64% 39% 72% 40% 70% 87% 18% 55% Access to Science Courses: Side-by-Side Comparison
% of Schools Without Access
LOCALE POVERTY MINORITY SCHOOL SIZE ALL SCHOOLS
Rural Town Suburb City Low (Q1)
High (Q5)
Low (Q1)
High (Q5)
Very Small (Q1)
Very Large (Q5)
Biology or higher
26% 15% 23% 33% 18% 25% 14% 29% 36% 7% 23%
Chemistry or higher
35% 23% 33% 42% 25% 41% 18% 42% 56% 9% 33%
Physics 47% 43% 41% 54% 33% 60% 31% 59% 75% 14% 47% Access to Accelerated Courses: Side-by-Side Comparison
% of Schools Without Access
LOCALE POVERTY MINORITY SCHOOL SIZE ALL SCHOOLS
Rural Town Suburb City Low (Q1)
High (Q5)
Low (Q1)
High (Q5)
Very Small (Q1)
Very Large (Q5)
Advanced Placement
56% 59% 44% 59% 41% 65% 48% 62% 90% 13% 55%
International Baccalaureate
99% 99% 95% 95% 96% 97% 99% 97% 100% 91% 97%
Dual Enrollment
49% 36% 54% 66% 44% 65% 33% 69% 75% 31% 52%

Page 12 of 21
ExcelinEd Civil Rights Data Collection Analysis - 2018
16% 18% 21%29%
39%
18%25%
33%41% 44%
21%26%
32%
50%
72%
25%
41%
60%65% 65%
Schools Without Access Based on Student Poverty
Comparing Lowest and Highest Quintiles
12% 13% 15%22%
40%
14%18%
31%
48%
33%
25%29%
35%
51%
70%
29%
42%
59% 62%69%
Schools Without Access Based on Student Minority
Comparing Lowest and Highest Quintiles
Page 13 of 21
ExcelinEd Civil Rights Data Collection Analysis - 2018
30%36%
45%
68%
87%
36%
56%
75%
90%
75%
6% 7% 8% 10%18%
7% 9%14% 13%
31%
Schools Without Access Based on Student Enrollment
Comparing Lowest and Highest Quintiles
22% 26
% 30%
40%
53%
26%
35%
47%
56%
49%
13% 15% 18
%
29%
54%
15%
23%
43%
59%
36%
21% 23
% 28%
38%
47%
23%
33%
41% 44
%
54%
30% 33
% 37%
49%
64%
33%
42%
54% 59
%
66%
Schools Without Access Based on Locale

Page 14 of 21
ExcelinEd Civil Rights Data Collection Analysis - 2018
APPENDIX A: ADDITIONAL INFORMATION ABOUT THE DATA Data Sources
Civil Rights Data Collection The Civil Rights Data Collection (CRDC) is a biennial (i.e., every other school year) survey of public schools required by the U.S. Department of Education’s Office of Civil Rights since 1968. CRDC collects data on leading civil rights indicators related to access and barriers to educational opportunity at the early childhood through grade 12 levels from public local educational agencies (LEA) and schools, including juvenile justice facilities, charter schools, alternative schools and schools serving only students with disabilities. Data collected includes enrollment demographics, math and science courses, Advanced Placement, discipline, teacher experience and much more. For more information, visit www.Ed.Gov/OCR/Data.
National Center for Education Statistics Common Core of Data The Common Core of Data (CCD) is the Department of Education's primary database on public elementary and secondary education in the United States. CCD is a comprehensive, annual, national database of all public elementary and secondary schools and school districts. CCD data provide more accurate enrollment and grade-levels-offered data than CRDC alone. For more information, visit www.NCES.ED.Gov/CCD.
ExcelinEd’s Dataset ExcelinEd analyzed a subset of the 2015-16 CRDC data related to high school math, science, Advanced Placement, International Baccalaureate, dual enrollment and credit recovery course offerings and CCD data on locale, school type and enrollment. The NCES School IDs in both datasets enabled us to link the two datasets to provide the most accurate analysis. Multiple years of CCD were used to update and identify accurate enrollment, school types and grade level data.
Incorporating CCD data provides the ability to not only identify how many schools do not offer a specific course but what type of schools are more likely to do so. For example, simply using CRDC data we can find out how many schools do not offer Algebra II. However, by incorporating CCD data we can also find out whether these schools are more likely to be located in rural areas or if such schools typically enroll larger proportions of low-income and minority students.
Additionally, the CCD was used to provide accurate information about school characteristics, particularly school enrollments. While both the CRDC and CCD datasets included school enrollments for both overall and subgroups, these enrollments numbers were not in agreement for a number of schools. Previous CRDC and CCD datasets were used to determine what the most likely enrollments were; these likely enrollments were used in our analysis. Furthermore, previous datasets were also used to replace any missing or incorrect data on school characteristics such as identifying which schools were charter schools and which grade levels each school served.
View our dataset and a slide deck of our analysis.
Population ExcelinEd’s dataset analyzes 29,716 public schools offering grades 9, 10, 11 or 12. This is a broad definition of high school that gives better insight into schools that should be offering these courses.

Page 15 of 21
ExcelinEd Civil Rights Data Collection Analysis - 2018
Courses and Analysis The analysis focuses on the course progression toward college and career readiness, including college or career preparatory courses.
• Course Path for Math: Algebra I or higher, Geometry or higher, Algebra II or higher, Advanced Math or higher and Calculus.
• Course Path for Science: Biology or higher, Chemistry or higher and Physics. • Accelerated Courses: Advance Placement, International Baccalaureate, Dual Enrollment and Credit Recovery
courses.
ExcelinEd chose to use course “or higher” in its analysis. The CRDC by itself does not identify schools that do not offer a specific course or higher. Simply identifying how many schools don’t offer a specific course could be misleading especially in math and science where there is typically a traditional course progression. For example, CRDC data may identify a high school for not offering Algebra I. However, that school may still offer Geometry, Algebra II, Advanced Math and Calculus but not Algebra I because all their students completed Algebra I in middle school. As such, this high school would be wrongly identified as not providing access to such a foundational math course if using the CRDC data alone.
However, ExcelinEd chose to recognize that the high school offered courses “higher” than Algebra I would prevent such misidentification. This more accurately identifies schools that are not providing access to the courses their students need to graduate college and career ready.
Characteristics and Data Subsets Most of the data are available by school level access, broken down school type, school-wide Title I, charters, magnets, locale, enrollment groups, minority enrollment groups, free- and reduced-price lunch enrollment groups, minority quintiles and free-and reduced-price lunch (FRPL) quintiles. State-level student data is available for course level access and by enrollment quintiles.
Dataset Limitations While the CRDC is the most comprehensive dataset on access to college and career preparation courses, it has some limitations. The CRDC and ExcelinEd’s analysis does not:
• Include if students are accessing courses online. While CRDC collects information on district online enrollment, it does not include course specifics.
• Include non-core courses. Data from 2015-16 are only collected for core courses—math, science, Advanced Placement, International Baccalaureate, dual enrollment and credit recovery. It does not include access to non-core courses, such as computer science or courses that would lead to an industry certification.
• Reflect the current school year (2017-18). The data are only collected every two years and released 1-2 years after collection, meaning that our most up-to-date information is at least one school year old.
• Reflect the quality of the course.
Finally, the data are self-reported by schools and LEAs, and these reporting agencies have the opportunity to correct and recertify data identified by OCR as anomalies. This is the third year that all schools and LEAs were required to answer questions on college and career readiness (since 2011-12 when CRDC began asking all schools rather than a sample of schools). However, ExcelinEd did not independently verify the information from the 29,716 public schools reflected in ExcelinEd’s analysis.
Page 16 of 21
ExcelinEd Civil Rights Data Collection Analysis - 2018
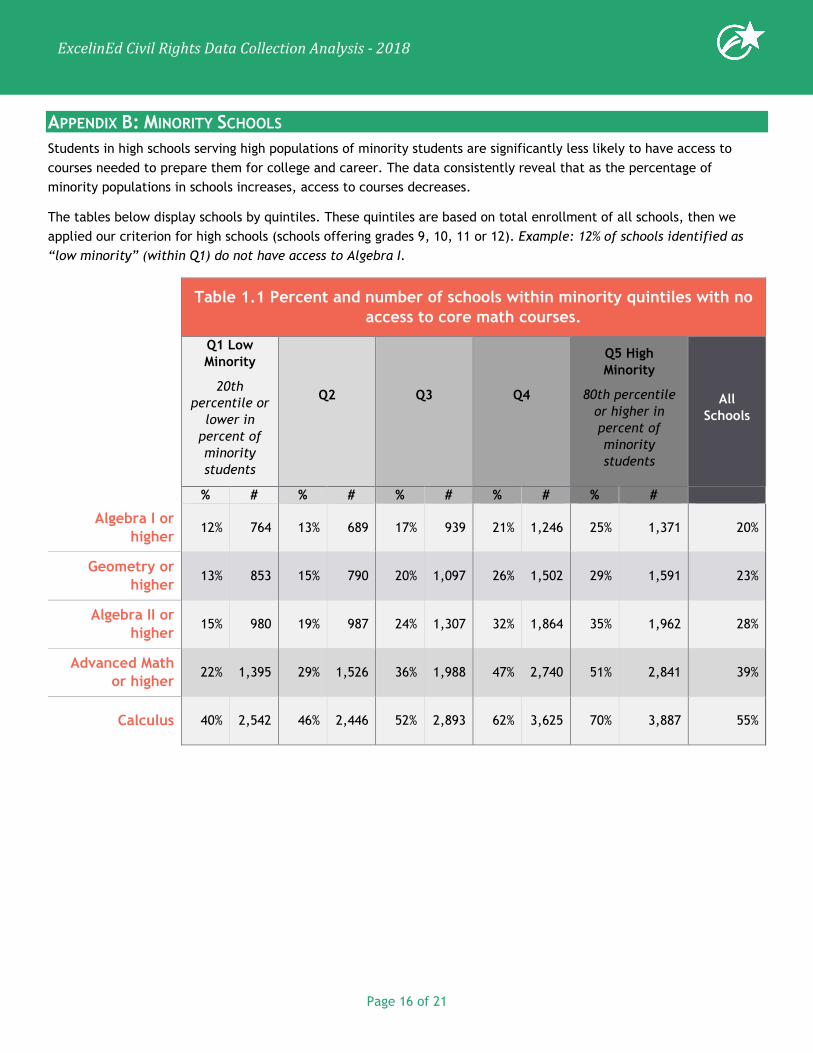
APPENDIX B: MINORITY SCHOOLS Students in high schools serving high populations of minority students are significantly less likely to have access to courses needed to prepare them for college and career. The data consistently reveal that as the percentage of minority populations in schools increases, access to courses decreases.
The tables below display schools by quintiles. These quintiles are based on total enrollment of all schools, then we applied our criterion for high schools (schools offering grades 9, 10, 11 or 12). Example: 12% of schools identified as “low minority” (within Q1) do not have access to Algebra I.
Table 1.1 Percent and number of schools within minority quintiles with no
access to core math courses.
Q1 Low Minority
20th percentile or
lower in percent of minority students
Q2
Q3
Q4
Q5 High Minority
80th percentile or higher in percent of minority students
All Schools
% # % # % # % # % #
Algebra I or higher
12% 764 13% 689 17% 939 21% 1,246 25% 1,371 20%
Geometry or higher
13% 853 15% 790 20% 1,097 26% 1,502 29% 1,591 23%
Algebra II or higher
15% 980 19% 987 24% 1,307 32% 1,864 35% 1,962 28%
Advanced Math or higher
22% 1,395 29% 1,526 36% 1,988 47% 2,740 51% 2,841 39%
Calculus 40% 2,542 46% 2,446 52% 2,893 62% 3,625 70% 3,887 55%

Page 17 of 21
ExcelinEd Civil Rights Data Collection Analysis - 2018
Table 1.2 Percent and number of schools within minority quintiles with no
access to core science courses.
Q1 Low Minority
20th percentile or lower in percent of minority students
Q2
Q3
Q4
Q5 High Minority
80th percentile or higher in percent of minority students
All Schools
% # % # % # % # % #
Biology or higher 14% 877 15% 798 20% 1,122 26% 1,513 29% 1,592 23%
Chemistry or higher
18% 1,163 23% 1,233 30% 1,662 39% 2,310 42% 2,312 33%
Physics 31% 1,990 37% 1,977 44% 2,443 53% 3,111 59% 3,265 47%
Table 1.3 Percent and number of schools within minority quintiles with no
access to acceleration courses.
Q1 Low Minority
20th percentile or lower in percent of minority students
Q2
Q3
Q4
Q5 High Minority
80th percentile or higher in percent of minority students
All Schools
% # % # % # % # % #
Advanced Placement
48% 3,098 48% 2,541 50% 2,769 58% 3,427 62% 3,411 55%
International Baccalaureate
99% 6,313 97% 5,154 96% 5,303 95% 5,594 97% 5,380 97%
Dual Enrollment 33% 2,088 41% 2,160 49% 2,693 61% 3,579 69% 3,820 52%

Page 18 of 21
ExcelinEd Civil Rights Data Collection Analysis - 2018
APPENDIX C: POVERTY SCHOOLS Students in high poverty high schools—those serving high populations of low-income students—are also significantly less likely to have access to courses needed to prepare students for college and career. The data consistently reveal that as the percentage of low-income populations in schools increases, access to courses decreases.
The tables below display schools by quintiles. These quintiles are based on total enrollment of all schools, then we applied our criterion for high schools (schools offering grades 9, 10, 11 or 12). Example: 16% of schools identified as “low poverty” (within Q1) do not have access to Algebra I.
Table 2.1 Percent and number of schools within poverty quintiles with no
access to core math courses.
Q1 Low Poverty
20th percentile or lower in percent of
low-income students
Q2
Q3
Q4
Q5 High Poverty
80th percentile or higher in
percent of low-income students
All Schools
% # % # % # % # % #
Algebra I or higher
16% 838 10% 651 12% 699 21% 1,025 21% 835 20%
Geometry or higher
18% 940 12% 737 14% 811 25% 1,214 26% 1,031 23%
Algebra II or higher
21% 1,105 14% 897 18% 1,006 31% 1,523 32% 1,281 28%
Advanced Math or higher
29% 1,528 21% 1,348 29% 1,631 46% 2,274 50% 1,975 39%
Calculus 39% 2,105 38% 2,373 49% 2,750 66% 3,253 72% 2,829 55%

Page 19 of 21
ExcelinEd Civil Rights Data Collection Analysis - 2018
Table 2.2 Percent and number of schools within poverty quintiles with no
access to core science courses.
Q1 Low Poverty
20th percentile or lower in
percent of low-income students
Q2
Q3
Q4
Q5 High Poverty
80th percentile or higher in
percent of low-income students
All Schools
% # % # % # % # % #
Biology or higher 18% 978 12% 776 15% 835 25% 1,216 25% 991 23%
Chemistry or higher
25% 1,345 18% 1,103 22% 1,261 37% 1,843 41% 1,629 33%
Physics 33% 1,787 30% 1,885 38% 2,157 54% 2,670 60% 2,366 47%
Table 2.3 Percent and number of schools within poverty quintiles with no
access to acceleration courses.
Q1 Low Poverty
20th percentile or lower in
percent of low-income students
Q2
Q3
Q4
Q5 High Poverty
80th percentile or higher in
percent of low-income students
All Schools
% # % # % # % # % #
Advanced Placement
41% 2,172 42% 2,667 50% 2,822 62% 3,042 65% 2,574 55%
International Baccalaureate
96% 5,137 97% 6,070 96% 5,400 97% 4,784 97% 3,847 97%
Dual Enrollment 44% 2,335 34% 2,160 40% 2,266 58% 2,858 65% 2,562 52%
Page 20 of 21
ExcelinEd Civil Rights Data Collection Analysis - 2018
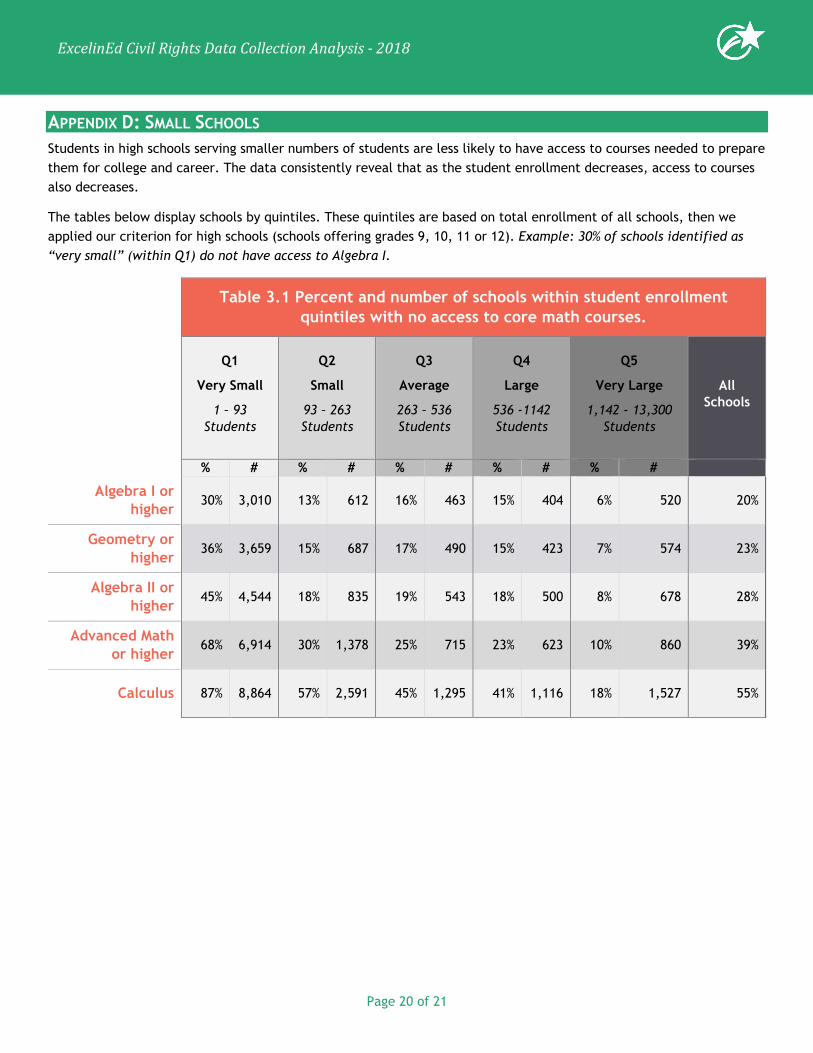
APPENDIX D: SMALL SCHOOLS Students in high schools serving smaller numbers of students are less likely to have access to courses needed to prepare them for college and career. The data consistently reveal that as the student enrollment decreases, access to courses also decreases.
The tables below display schools by quintiles. These quintiles are based on total enrollment of all schools, then we applied our criterion for high schools (schools offering grades 9, 10, 11 or 12). Example: 30% of schools identified as “very small” (within Q1) do not have access to Algebra I.
Table 3.1 Percent and number of schools within student enrollment
quintiles with no access to core math courses.
Q1
Very Small
1 – 93 Students
Q2
Small
93 – 263 Students
Q3
Average
263 – 536 Students
Q4
Large
536 -1142 Students
Q5
Very Large
1,142 - 13,300 Students
All Schools
% # % # % # % # % #
Algebra I or higher
30% 3,010 13% 612 16% 463 15% 404 6% 520 20%
Geometry or higher
36% 3,659 15% 687 17% 490 15% 423 7% 574 23%
Algebra II or higher
45% 4,544 18% 835 19% 543 18% 500 8% 678 28%
Advanced Math or higher
68% 6,914 30% 1,378 25% 715 23% 623 10% 860 39%
Calculus 87% 8,864 57% 2,591 45% 1,295 41% 1,116 18% 1,527 55%

Page 21 of 21
ExcelinEd Civil Rights Data Collection Analysis - 2018
Table 3.2 Percent and number of schools within student enrollment
quintiles with no access to core science courses.
Q1
Very Small
1 – 93 Students
Q2
Small
93 – 263 Students
Q3
Average
263 – 536 Students
Q4
Large
536 -1142 Students
Q5
Very Large
1,142 - 13,300 Students
All Schools
% # % # % # % # % #
Biology or higher 36% 3,629 16% 727 18% 503 17% 457 7% 586 23%
Chemistry or higher
56% 5,691 24% 1,079 22% 617 20% 546 9% 747 33%
Physics 75% 7,553 45% 2,020 38% 1,087 34% 930 14% 1,196 47%
Table 3.3 Percent and number of schools within student enrollment
quintiles with no access to acceleration courses.
Q1
Very Small
1 – 93 Students
Q2
Small
93 – 263 Students
Q3
Average
263 – 536 Students
Q4
Large
536 -1142 Students
Q5
Very Large
1,142 - 13,300 Students
All Schools
% # % # % # % # % #
Advanced Placement
90% 9,101 62% 2,791 45% 1,284 37% 1,012 13% 1,058 55%
International Baccalaureate
100% 10,109 99% 4,495 99% 2,817 99% 2,706 91% 7,617 97%
Dual Enrollment 75% 7,602 43% 1,946 40% 1,132 40% 1,106 31% 2,554 52%