Embed Size (px)
Citation preview
Collective Short Wavelength Dynamics inComposite Phospholipid Model
Membranes
withInelastic Neutron Scattering
Dissertation
zur Erlangung des Doktorgrades
der Mathematisch-Naturwissenschaftlichen Fakultaten
der Georg-August-Universitat zu Gottingen
vorgelegt von
Beate-Annette Bruning
aus Bielefeld
Gottingen 2009

D7
Referent: Prof. Dr. Tim Salditt
Korreferent(in): Prof. Dr. Helmut Schober
Tag der mundlichen Prufung: 02.12.2008
Contents
1 Introduction 5
2 Membranes and Membrane Dynamics 8
2.1 Biological Membranes . . . . . . . . . . . . . . . . . . . . . . . . . . . . . . 8
2.2 Model Membranes . . . . . . . . . . . . . . . . . . . . . . . . . . . . . . . . 9
2.2.1 Membrane Structure and Lamellar Phases . . . . . . . . . . . . . . . 10
2.2.2 Phase Transitions . . . . . . . . . . . . . . . . . . . . . . . . . . . . 11
2.2.3 Lipid Melting: Cooperativity and In-plane Correlation . . . . . . . . 13
2.2.4 Membrane Interaction Potentials . . . . . . . . . . . . . . . . . . . . 16
2.3 Single Lipid and Composite Model Membranes Studied . . . . . . . . . . . 18
2.3.1 DSPC: Chain-length and Main Phase Transition . . . . . . . . . . . 18
2.3.2 Phospholipid/Cholesterol: . . . . . . . . . . . . . . . . . . . . . . . . 20
2.3.3 Phospholipid/Ethanol: . . . . . . . . . . . . . . . . . . . . . . . . . . 23
2.4 Collective In-plane Dynamics: Biological Membranes . . . . . . . . . . . . . 27
2.4.1 Transmembrane Transport of Molecules . . . . . . . . . . . . . . . . 27
2.4.2 Nerve Pulse Propagation . . . . . . . . . . . . . . . . . . . . . . . . 27
3 Collective Dynamics in Model Membranes 28
3.1 Inelastic Neutron Scattering . . . . . . . . . . . . . . . . . . . . . . . . . . . 28
3.1.1 The Scattering Cross Section . . . . . . . . . . . . . . . . . . . . . . 28
3.1.2 Coherent vs. Incoherent Scattering . . . . . . . . . . . . . . . . . . . 30
3.2 Dynamical Processes: the Neutron Window . . . . . . . . . . . . . . . . . . 31
3.2.1 Local Modes . . . . . . . . . . . . . . . . . . . . . . . . . . . . . . . 32
3.2.2 Collective Excitations . . . . . . . . . . . . . . . . . . . . . . . . . . 33
3.2.3 Collective Dynamics in Liquids: Effective Eigenmode Model . . . . . 36
3.3 Neutron Spectroscopy . . . . . . . . . . . . . . . . . . . . . . . . . . . . . . 38
3.3.1 Three-axis Spectrometry . . . . . . . . . . . . . . . . . . . . . . . . . 38
3.3.2 Instrumental Setup . . . . . . . . . . . . . . . . . . . . . . . . . . . . 41
3.3.3 Influence of Instrumental Resolution . . . . . . . . . . . . . . . . . . 41
3.3.4 Data Treatment of Inelastic Energy-Scans . . . . . . . . . . . . . . . 46
iii
CONTENTS iv
4 Single Component Model Membrane: DSPC-d70 49
4.1 X-ray Diffraction: Structural Phase Characterization . . . . . . . . . . . . . 49
4.1.1 Experimental . . . . . . . . . . . . . . . . . . . . . . . . . . . . . . . 50
4.1.2 Effect of Lipid Chain Length: Bilayer and In-plane Ordering . . . . 51
4.2 Neutron Scattering: Structure and Collective Dynamics . . . . . . . . . . . 57
4.2.1 Sample Preparation and Experiment . . . . . . . . . . . . . . . . . . 57
4.2.2 Diffraction: Bilayer Repeat Spacing and Chain Correlation . . . . . 58
4.2.3 Extracting Points of a Liquid Dispersion Curve . . . . . . . . . . . . 62
4.2.4 Summary and Conclusion . . . . . . . . . . . . . . . . . . . . . . . . 66
5 Cholesterol in Model Membranes 69
5.1 X-ray Diffraction: DMPC/Cholesterol Phase Diagram . . . . . . . . . . . . 69
5.1.1 Experimental . . . . . . . . . . . . . . . . . . . . . . . . . . . . . . . 70
5.1.2 Temperature Dependence . . . . . . . . . . . . . . . . . . . . . . . . 71
5.1.3 Concentration Dependence . . . . . . . . . . . . . . . . . . . . . . . 84
5.1.4 Summary and Conclusion . . . . . . . . . . . . . . . . . . . . . . . . 88
5.2 Neutron Scattering . . . . . . . . . . . . . . . . . . . . . . . . . . . . . . . . 91
5.2.1 Sample Preparation and Experiment . . . . . . . . . . . . . . . . . . 91
5.2.2 Neutron Diffraction: Specific Points in Phase Diagram . . . . . . . . 91
Reflectivity: Bilayer Repeat Spacing . . . . . . . . . . . . . . . . . . 92
Acyl Chain Correlation: In-plane Ordering . . . . . . . . . . . . . . 93
5.2.3 Collective In-plane Dynamics in a Composite Membrane . . . . . . . 96
5.2.4 Discussion . . . . . . . . . . . . . . . . . . . . . . . . . . . . . . . . . 104
5.3 Summary and Conclusion . . . . . . . . . . . . . . . . . . . . . . . . . . . . 106
6 Ethanol in Model Membranes 108
6.1 X-ray Reflectivity on Model Membranes . . . . . . . . . . . . . . . . . . . . 108
6.1.1 Sample Preparation and Environment . . . . . . . . . . . . . . . . . 110
6.1.2 Effect of Ethanol concentration . . . . . . . . . . . . . . . . . . . . . 111
6.1.3 Unbinding of DMPC-bilayers . . . . . . . . . . . . . . . . . . . . . . 113
6.1.4 Influence of Osmotic Pressure . . . . . . . . . . . . . . . . . . . . . . 115
6.2 Neutron Scattering . . . . . . . . . . . . . . . . . . . . . . . . . . . . . . . . 117
6.2.1 Sample Preparation and Experiment . . . . . . . . . . . . . . . . . . 117
6.2.2 Neutron Diffraction: In-plane and Bilayer Ordering . . . . . . . . . . 118
6.2.3 Influence of Ethanol on Collective In-plane Chain Dynamics . . . . . 121
6.3 Summary and Outlook . . . . . . . . . . . . . . . . . . . . . . . . . . . . . . 122
7 Summary 123
CONTENTS 1
A X-ray Experiments 127
A.1 WENDI-macros (SPEC) . . . . . . . . . . . . . . . . . . . . . . . . . . . . . 127
A.1.1 SAXS- and WAXS-scans combined . . . . . . . . . . . . . . . . . . . 127
A.1.2 temperature ramp . . . . . . . . . . . . . . . . . . . . . . . . . . . . 128
A.2 Data Treatment: Matlab . . . . . . . . . . . . . . . . . . . . . . . . . . . . . 130
A.2.1 3d-plots . . . . . . . . . . . . . . . . . . . . . . . . . . . . . . . . . . 130
A.2.2 Evaluation of Temperature Ramps . . . . . . . . . . . . . . . . . . . 131
A.2.3 Cuts through 3d-plots Shown . . . . . . . . . . . . . . . . . . . . . . 132
A.2.4 DMPC/Cholesterol Phase diagram . . . . . . . . . . . . . . . . . . . 134
A.3 Osmotic Pressures induced by PEG 20000 . . . . . . . . . . . . . . . . . . . 138
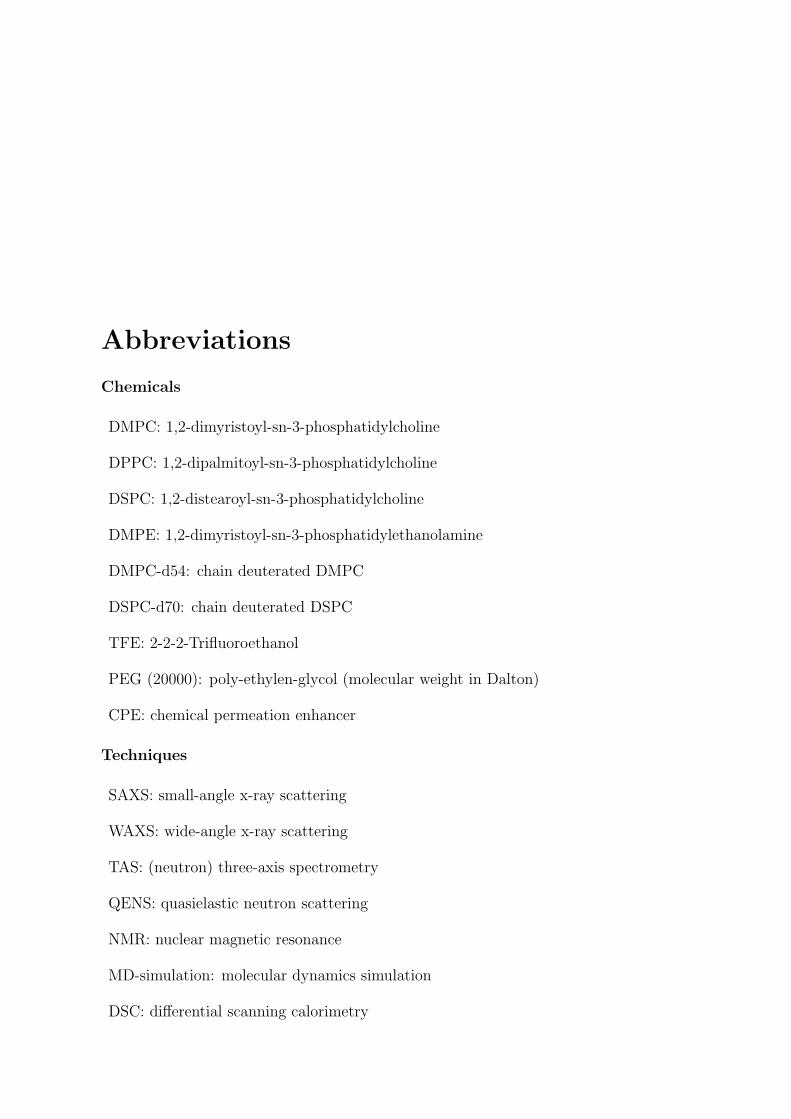
B Neutron Experiments 140
B.1 Instrument Parameters (V2-Flex) . . . . . . . . . . . . . . . . . . . . . . . . 140
B.2 Macro Example (MAD) . . . . . . . . . . . . . . . . . . . . . . . . . . . . . 142
B.3 Data Treatment: Matlab . . . . . . . . . . . . . . . . . . . . . . . . . . . . . 143
B.3.1 Fit of Neutron Reflectivities . . . . . . . . . . . . . . . . . . . . . . . 143
B.3.2 DMPC/Ethanol Bilayer Decay . . . . . . . . . . . . . . . . . . . . . 144
B.4 Treatment of Inelastic Data . . . . . . . . . . . . . . . . . . . . . . . . . . . 149
B.4.1 Energy-Scans: Detailed Balance Correction . . . . . . . . . . . . . . 149
B.4.2 Energy-Scans: Absorption Correction . . . . . . . . . . . . . . . . . 149
B.5 Resolution Calculation with ’Rescal’ . . . . . . . . . . . . . . . . . . . . . . 150
Bibliography 161

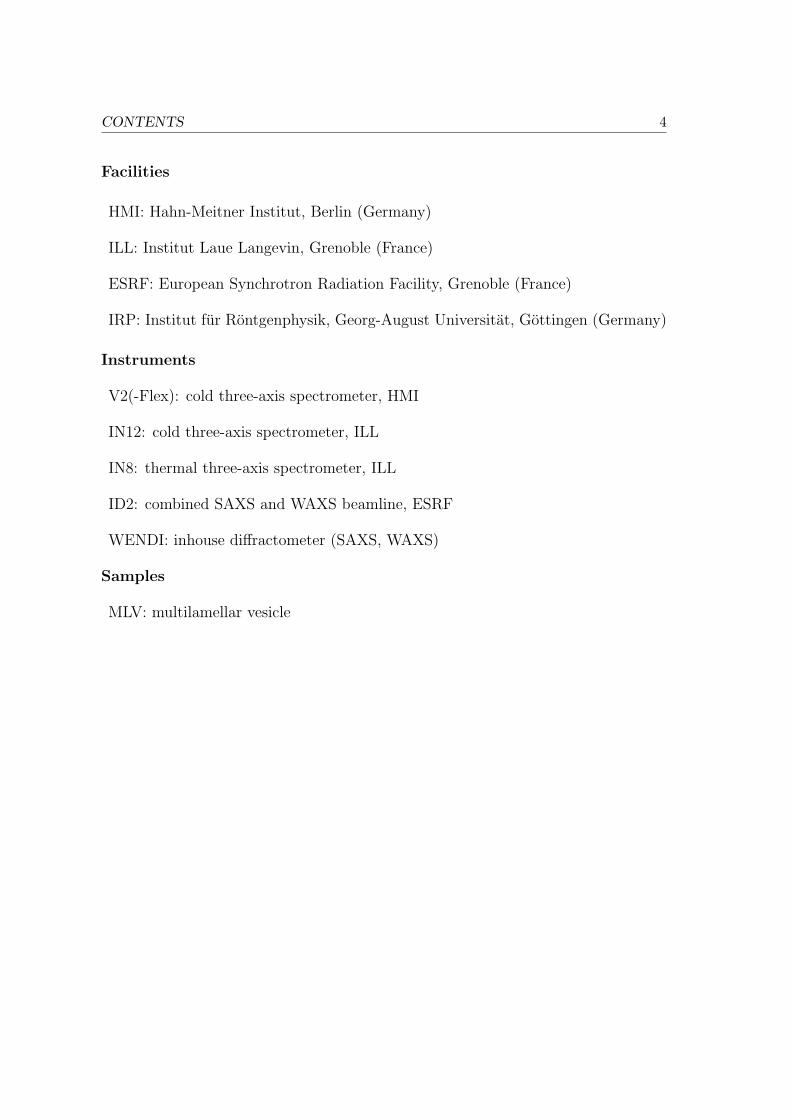
Abbreviations
Chemicals
DMPC: 1,2-dimyristoyl-sn-3-phosphatidylcholine
DPPC: 1,2-dipalmitoyl-sn-3-phosphatidylcholine
DSPC: 1,2-distearoyl-sn-3-phosphatidylcholine
DMPE: 1,2-dimyristoyl-sn-3-phosphatidylethanolamine
DMPC-d54: chain deuterated DMPC
DSPC-d70: chain deuterated DSPC
TFE: 2-2-2-Trifluoroethanol
PEG (20000): poly-ethylen-glycol (molecular weight in Dalton)
CPE: chemical permeation enhancer
Techniques
SAXS: small-angle x-ray scattering
WAXS: wide-angle x-ray scattering
TAS: (neutron) three-axis spectrometry
QENS: quasielastic neutron scattering
NMR: nuclear magnetic resonance
MD-simulation: molecular dynamics simulation
DSC: differential scanning calorimetry
CONTENTS 4
Facilities
HMI: Hahn-Meitner Institut, Berlin (Germany)
ILL: Institut Laue Langevin, Grenoble (France)
ESRF: European Synchrotron Radiation Facility, Grenoble (France)
IRP: Institut fur Rontgenphysik, Georg-August Universitat, Gottingen (Germany)
Instruments
V2(-Flex): cold three-axis spectrometer, HMI
IN12: cold three-axis spectrometer, ILL
IN8: thermal three-axis spectrometer, ILL
ID2: combined SAXS and WAXS beamline, ESRF
WENDI: inhouse diffractometer (SAXS, WAXS)
Samples
MLV: multilamellar vesicle
Chapter 1
Introduction
Phospholipid membranes often serve as simple model systems to understand basic
properties of their far more complex biological counterparts.
One of the most significant aims in membrane biophysics is to relate changes in
composition of a model system as well as of the external parameters, to the specific
functionality of the membrane. The most relevant external parameters are tempera-
ture, humidity, pressure or ph. Functional properties of a membrane depend equally
on structural and dynamical properties. For example, the collective in-plane density
fluctuations of the phospholipid chains, which are in the focus of the present work,
have been shown to influence membrane permeability [1, 2]. Knowledge about the
relationships between collective dynamics on one hand, and the resulting transport
properties on the other hand, can then be useful for biomedical applications, such
as drug delivery.
While molecular vibrations, conformational dynamics and diffusional processes
are studied by a number of spectroscopic techniques over a broad range of time scales,
such as e. g. nuclear magnetic resonance (NMR) [3, 4], incoherent inelastic neutron
scattering (QENS) [5, 6] or dielectric spectroscopy, only very few experimental tech-
niques can access the short range collective motions mentioned above. Chen et al.
were the first to present an inelastic x-ray scattering study with a dispersion relation
~ω(Qr) which quantifies the collective motion of the lipid acyl chains as a function
of the lateral momentum transfer Qr [7]. In the following years, Rheinstadter et
al. have used inelastic neutron scattering for similar investigations of the collective
in-plane chain dynamics [8], and pointed out several distinct differences between the
two probes. These are related to the energy-momentum relations of neutrons and
photons, which affect the respective energy-resolution, the accessible (Q,ω)-range,
and the signal-to-noise ratio. Most importantly, the fact that the energy of the in-
cident neutron beam with several meV lies in the range of the excitations, results
5
6
in an energy-resolution of up to ≈300 µeV, compared to 1.5 meV for an inelastic
x-ray experiment. The latter is a decisive advantage for a quantitative comparison
of dispersion curves for lipid membranes, where high resolution is needed. On the
other hand, the range at low Q and high ω, is not accessible by inelastic neutron
scattering due to the dispersion of the neutron itself (∼ Q2).
A detailed comparison between points of the dispersion relations of two single
component lipid membanes is the starting point of this thesis: Chapter 4 presents
the collective short wavelength dynamics in two single lipid model membranes, which
exhibit distinctly different phase behavior. These differences become apparent in the
temperature-dependence in the bilayer repeat spacing, as well the packing of lipid
molecules in the plane of the membrane. So far, the different phase behavior has
not been linked to the corresponding dynamical properties.
The insertion of the membrane-active molecule Cholesterol, which is known to
regulate membrane fluidity, membrane permeability and the lateral mobility of pro-
teins, is then a next step towards the understanding of collective dynamics in phys-
iologically more relevant membrane systems (chapter 5). In order to first achieve a
more complete description of the membrane on a molecular level, the temperature-
and concentration-dependent structural changes in the phospholipid/Cholesterol-
system have been studied by small- and wide-angle x-ray scattering. Secondly, the
influence of Cholesterol on the collective short wavelength fluctuations of the phos-
pholipid acyl chains was studied by inelastic neutron scattering. Sharp inelastic
excitations have been observed in the composite membrane, which exhibit a surpris-
ingly long life-time.
Next, composite model membranes containing Ethanol have been studied, in
order to gain insight in the molecular mechanism underlying its function as a drug
enhancer and anesthetic. Note, that the alcohol has a somewhat reverse effect on the
in-plane ordering of lipid molecules than Cholesterol, due to its tendency to maximize
the interfacial area between the bilayer and water. A structural characterization was
performed by x-ray reflectivity measurements on highly oriented membrane samples
in a liquid environment. An approach for a technically challenging inelastic neutron
scattering experiment is introduced and first results are discussed.
The thesis is organized as follows: In the next chapter a general introduction into
basic membrane properties and membrane dynamics is given, the specific model sys-
tems that were investigated, are introduced. In chapter 3 an overview over the neu-
tron window for the observation of various dynamical processes in model membranes
is given, before focussing on the picosecond time scale, and length scales of near-
est neighbor distances. Technical aspects of the neutron three-axis technique and
7
its application to lipid membranes are presented. Chapters 4-6 are each dedicated
to a specific model system and are subdivided into a structural characterization
performed with x-rays and the simultaneous characterization of structure and dy-
namics by inelastic neutron scattering. Finally, chapter 7 presents a brief summary
and conclusions of this work.
Chapter 2
Membranes and Membrane
Dynamics
2.1 Biological Membranes
Various models of biological membranes have been introduced in the past. In 1877
Pfeffer was the first to propose the existence of a plasma membrane which covers
the outer surface of cells, but also separates all aqueous environments of different
composition from each other [9]. The well-known lipid bilayer structure as a model
for a cell membrane was first introduced by Gorter and Grendel in 1925 [10].
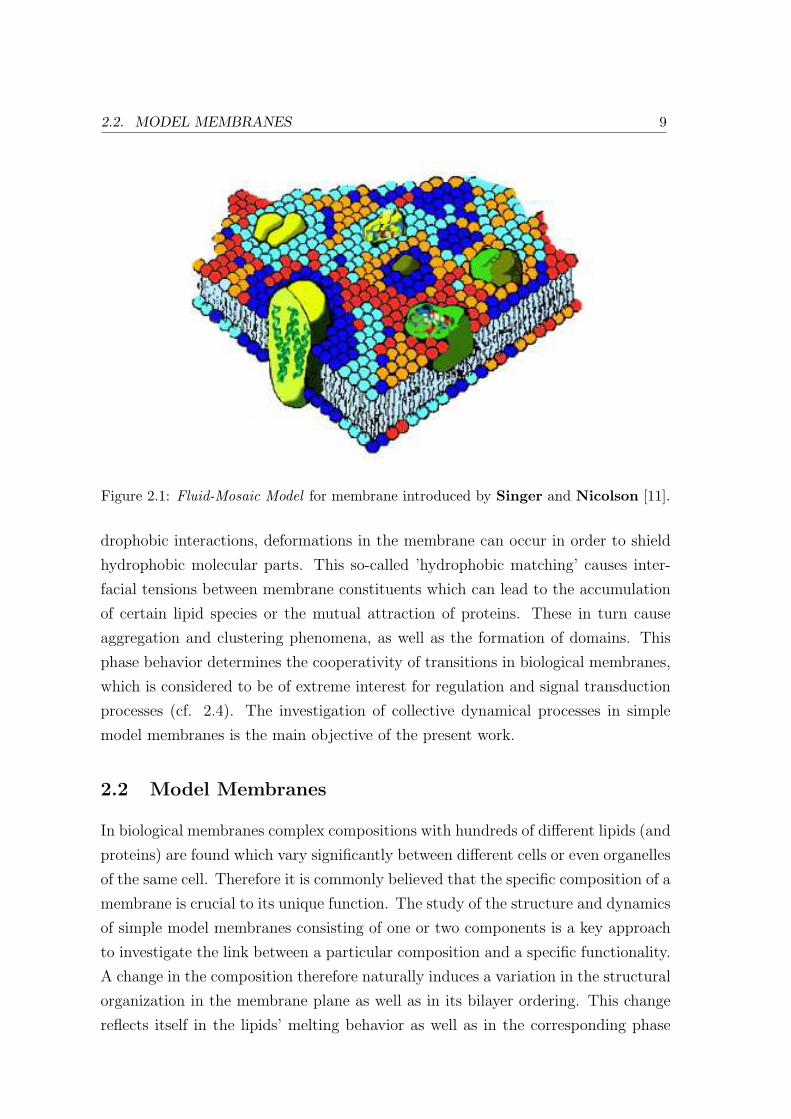
A very successful model was introduced in 1972 by Singer and Nicolson who
suggested that proteins are not only bound to the membrane surface, but can also
span through it (Fig. 2.1). Since it was known from x-ray crystallography in the
1960’s that many proteins exhibit an α-helical structure, they hypothized that the
hydrophobic amino acids in the helices might play a special role. In their famous
Fluid-Mosaic Model they underline that some proteins could interact with the sur-
rounding lipids and that, in turn, protein function could depend on the presence of
specific lipids [11]. However, they proposed that lipids in the physiologically rele-
vant fluid state form a matrix through which proteins can freely diffuse, including
the formation of domains, but excluding long-range order or interactions of proteins.
As this picture does not fully match experimental observations, Mouritsen and
Bloom suggested a slightly refined version of the model taking into consideration
that lipids and proteins may distribute inhomogenously and that not only domains,
but also clusters form within the plane of the membrane. In their mattress model
they take into account the influence of a mismatch in the hydrophobic length of
different membrane constituents, for example for lipids and proteins or lipids of
varying length in lipid mixtures [12]. In order to avoid energetically unfavorable hy-
2.2. MODEL MEMBRANES 9
Figure 2.1: Fluid-Mosaic Model for membrane introduced by Singer and Nicolson [11].
drophobic interactions, deformations in the membrane can occur in order to shield
hydrophobic molecular parts. This so-called ’hydrophobic matching’ causes inter-
facial tensions between membrane constituents which can lead to the accumulation
of certain lipid species or the mutual attraction of proteins. These in turn cause
aggregation and clustering phenomena, as well as the formation of domains. This
phase behavior determines the cooperativity of transitions in biological membranes,
which is considered to be of extreme interest for regulation and signal transduction
processes (cf. 2.4). The investigation of collective dynamical processes in simple
model membranes is the main objective of the present work.
2.2 Model Membranes
In biological membranes complex compositions with hundreds of different lipids (and
proteins) are found which vary significantly between different cells or even organelles
of the same cell. Therefore it is commonly believed that the specific composition of a
membrane is crucial to its unique function. The study of the structure and dynamics
of simple model membranes consisting of one or two components is a key approach
to investigate the link between a particular composition and a specific functionality.
A change in the composition therefore naturally induces a variation in the structural
organization in the membrane plane as well as in its bilayer ordering. This change
reflects itself in the lipids’ melting behavior as well as in the corresponding phase
2.2. MODEL MEMBRANES 10
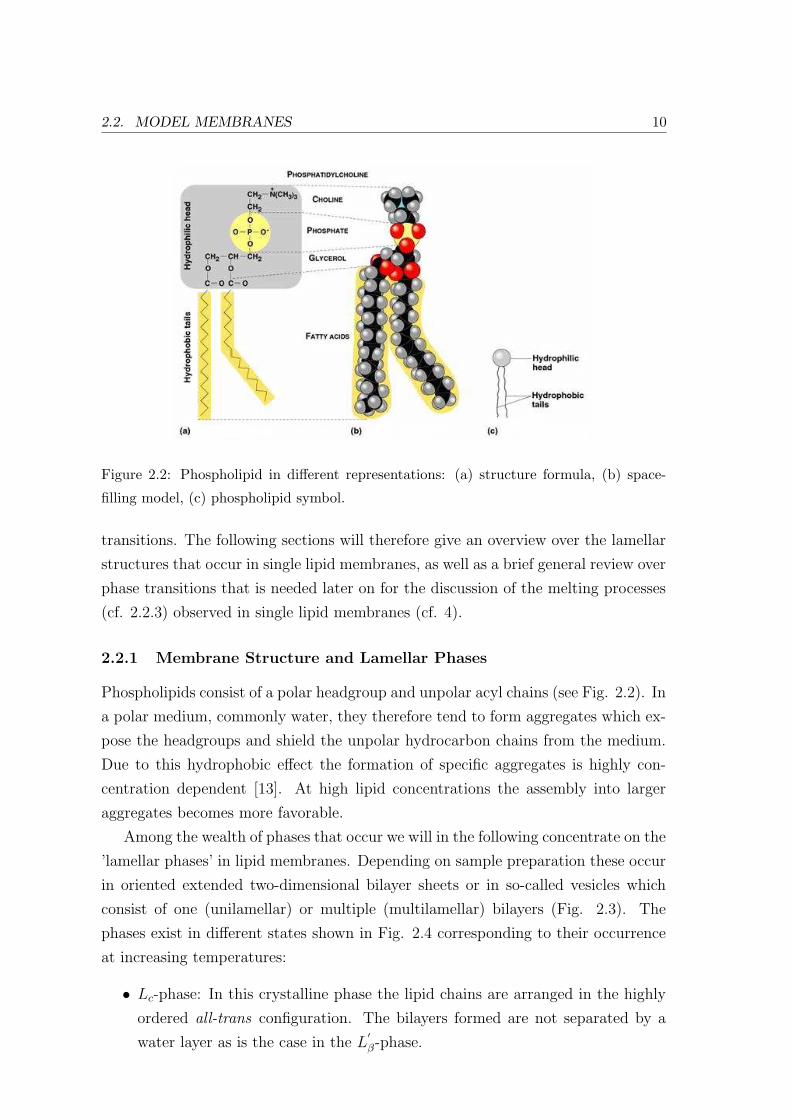
Figure 2.2: Phospholipid in different representations: (a) structure formula, (b) space-
filling model, (c) phospholipid symbol.
transitions. The following sections will therefore give an overview over the lamellar
structures that occur in single lipid membranes, as well as a brief general review over
phase transitions that is needed later on for the discussion of the melting processes
(cf. 2.2.3) observed in single lipid membranes (cf. 4).
2.2.1 Membrane Structure and Lamellar Phases
Phospholipids consist of a polar headgroup and unpolar acyl chains (see Fig. 2.2). In
a polar medium, commonly water, they therefore tend to form aggregates which ex-
pose the headgroups and shield the unpolar hydrocarbon chains from the medium.
Due to this hydrophobic effect the formation of specific aggregates is highly con-
centration dependent [13]. At high lipid concentrations the assembly into larger
aggregates becomes more favorable.
Among the wealth of phases that occur we will in the following concentrate on the
’lamellar phases’ in lipid membranes. Depending on sample preparation these occur
in oriented extended two-dimensional bilayer sheets or in so-called vesicles which
consist of one (unilamellar) or multiple (multilamellar) bilayers (Fig. 2.3). The
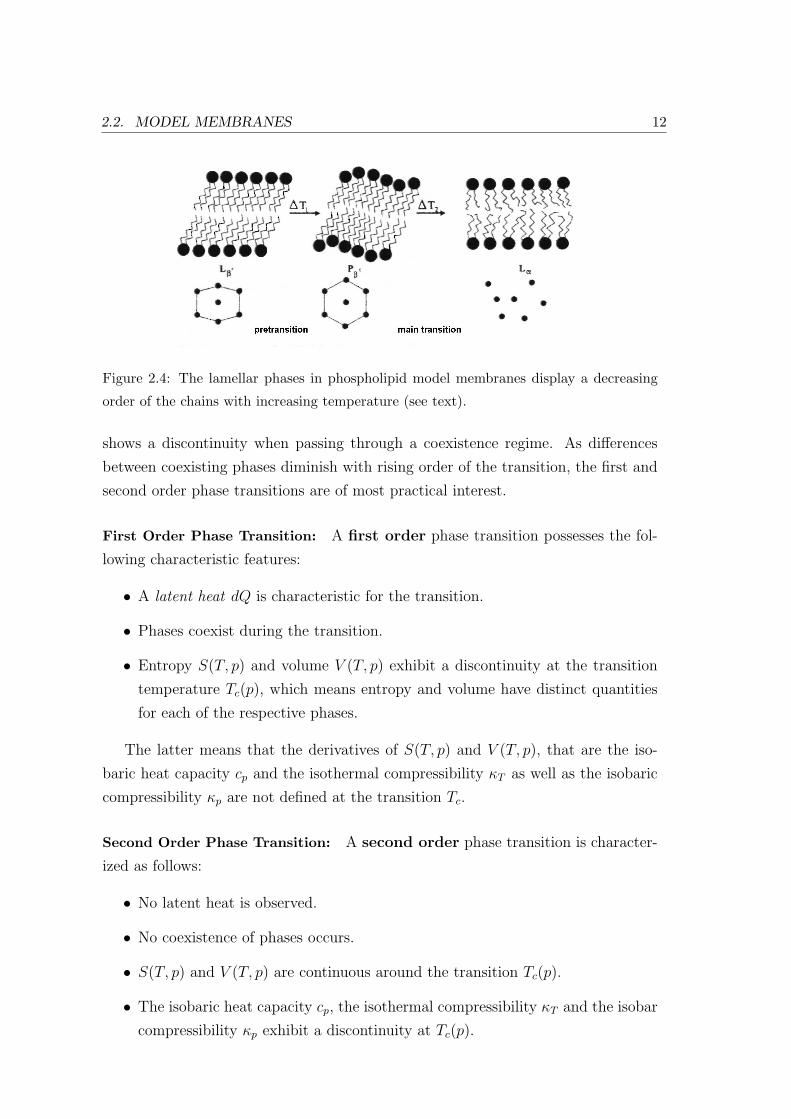
phases exist in different states shown in Fig. 2.4 corresponding to their occurrence
at increasing temperatures:
• Lc-phase: In this crystalline phase the lipid chains are arranged in the highly
ordered all-trans configuration. The bilayers formed are not separated by a
water layer as is the case in the L′β-phase.

2.2. MODEL MEMBRANES 11
Figure 2.3: (top) cut through unilamellar vesicle (liposome); (bottom) oriented bilayer
sheet.
• L′β-phase: In the ’gel’ phase the lipid chains are also arranged in the all-trans
configuration (see 2.2.2). The prime index indicates a tilt of the headgroups
with respect to the bilayer normal (Fig. 2.4, 2.12). This tilt is commonly
found in phospholipids that have large headgroups with respect to their chain
lengths, such as DMPC and DSPC. The high degree of chain order evokes a
quasi crystalline hexagonal in-plane order of the lipid molecules. Therefore this
phase is also referred to as the ’solid (ordered)’ phase.
• P′β-phase: The ’ripple’ phase is an intermediate phase that occurs with in-
creased temperature for some phospholipids. It shows characteristic one-dimen-
sional ripples on the membrane surface (Fig. 2.4). These ripples are probably
evoked by a partially molten lipid Lα-phase (see below) with a lower average
degree of chain ordering than in the L′β-phase. The crystalline in-plane order
of the lipid molecules is therefore partially lost. The ripples are likely to be
formed of periodic assemblies of linear gel (L′β) and fluid (Lα) lipid domains
[14, 15].
• Lα-phase: in the ’fluid’ phase the lipid acyl chains are mostly disordered and
all in-plane lattice order is of short range order (fluid like). Therefore this
phase is sometimes also referred to as liquid-disordered Ld-phase.
2.2.2 Phase Transitions
In order to describe phase transitions theoretically, an order parameter φ represent-
ing a suitable thermodynamic macroscopic quantity is introduced [16]. The order of
a phase transition is generally defined as the order of the lowest derivative of φ that
2.2. MODEL MEMBRANES 12
Figure 2.4: The lamellar phases in phospholipid model membranes display a decreasing
order of the chains with increasing temperature (see text).
shows a discontinuity when passing through a coexistence regime. As differences
between coexisting phases diminish with rising order of the transition, the first and
second order phase transitions are of most practical interest.
First Order Phase Transition: A first order phase transition possesses the fol-
lowing characteristic features:
• A latent heat dQ is characteristic for the transition.
• Phases coexist during the transition.
• Entropy S(T, p) and volume V (T, p) exhibit a discontinuity at the transition
temperature Tc(p), which means entropy and volume have distinct quantities
for each of the respective phases.
The latter means that the derivatives of S(T, p) and V (T, p), that are the iso-
baric heat capacity cp and the isothermal compressibility κT as well as the isobaric
compressibility κp are not defined at the transition Tc.
Second Order Phase Transition: A second order phase transition is character-
ized as follows:
• No latent heat is observed.
• No coexistence of phases occurs.
• S(T, p) and V (T, p) are continuous around the transition Tc(p).
• The isobaric heat capacity cp, the isothermal compressibility κT and the isobar
compressibility κp exhibit a discontinuity at Tc(p).
2.2. MODEL MEMBRANES 13
A second order phase transition is typically accompanied by diverging fluctua-
tions in the form of deviations around a mean value which occur during the tran-
sition. The isobaric heat capacity and the isothermal compressibility are linked to
the occurring fluctuations according to the Fluctuation-Dissipation Theorem:
cp =
(dH
dT
)
p
=H2 −H
2
RT 2
κT = − 1
V
(dV
dp
)
T
=V 2 − V
2
V ·RT(2.1)
This means, the isobaric heat capacity and the isothermal compressibility change
according to the fluctuations in enthalpy H and volume V , respectively. Note, that
in the case of membranes instead of volume fluctuations often lateral in-plane area
fluctuations are regarded.
A system which undergoes a second order transition obeys the following laws:
• Near the transition temperature Tc the so-called correlation length ξ(T ), which
is a measure for the length scale of specific interactions, diverges. For a number
of systems the corresponding correlation function can then be described as:
g(r, r′) = c0
exp(− |r−r′ |
ξ(T ))
|r − r′| (2.2)
This is called Ornstein-Zernike behavior [16]. The absence of a defined length
scale when ξ diverges near the transition temperature Tc is referred to as scale
invariance.
• As a consequence of the scaling invariance all thermodynamic quantities follow
power laws near the critical temperature Tc according to:
f ∼∣∣∣∣T − Tc
Tc
∣∣∣∣γ
(2.3)
Here, γ denotes a socalled critical exponent.
• The divergence of the correlation length is accompanied by a socalled criti-
cal slowing down. This means characteristic time scales of dynamic processes
increase near the phase transition.
2.2.3 Lipid Melting: Cooperativity and In-plane Correlation
For a specific single component phospholipid model membrane, the ’main phase
transition’ is induced at a defined temperature Tm at which equal amounts of lipids
2.2. MODEL MEMBRANES 14
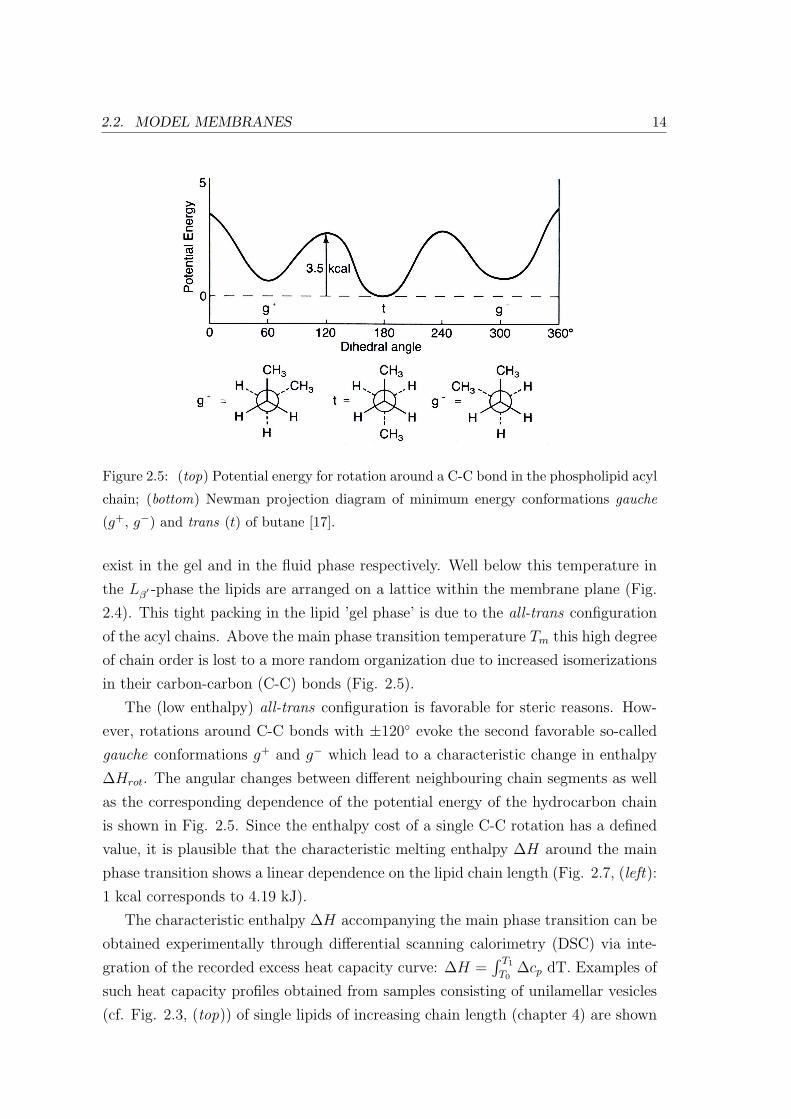
Figure 2.5: (top) Potential energy for rotation around a C-C bond in the phospholipid acyl
chain; (bottom) Newman projection diagram of minimum energy conformations gauche
(g+, g−) and trans (t) of butane [17].
exist in the gel and in the fluid phase respectively. Well below this temperature in
the Lβ′ -phase the lipids are arranged on a lattice within the membrane plane (Fig.
2.4). This tight packing in the lipid ’gel phase’ is due to the all-trans configuration
of the acyl chains. Above the main phase transition temperature Tm this high degree
of chain order is lost to a more random organization due to increased isomerizations
in their carbon-carbon (C-C) bonds (Fig. 2.5).
The (low enthalpy) all-trans configuration is favorable for steric reasons. How-
ever, rotations around C-C bonds with ±120 evoke the second favorable so-called
gauche conformations g+ and g− which lead to a characteristic change in enthalpy
∆Hrot. The angular changes between different neighbouring chain segments as well
as the corresponding dependence of the potential energy of the hydrocarbon chain
is shown in Fig. 2.5. Since the enthalpy cost of a single C-C rotation has a defined
value, it is plausible that the characteristic melting enthalpy ∆H around the main
phase transition shows a linear dependence on the lipid chain length (Fig. 2.7, (left):
1 kcal corresponds to 4.19 kJ).
The characteristic enthalpy ∆H accompanying the main phase transition can be
obtained experimentally through differential scanning calorimetry (DSC) via inte-
gration of the recorded excess heat capacity curve: ∆H =∫ T1
T0∆cp dT. Examples of
such heat capacity profiles obtained from samples consisting of unilamellar vesicles
(cf. Fig. 2.3, (top)) of single lipids of increasing chain length (chapter 4) are shown
2.2. MODEL MEMBRANES 15
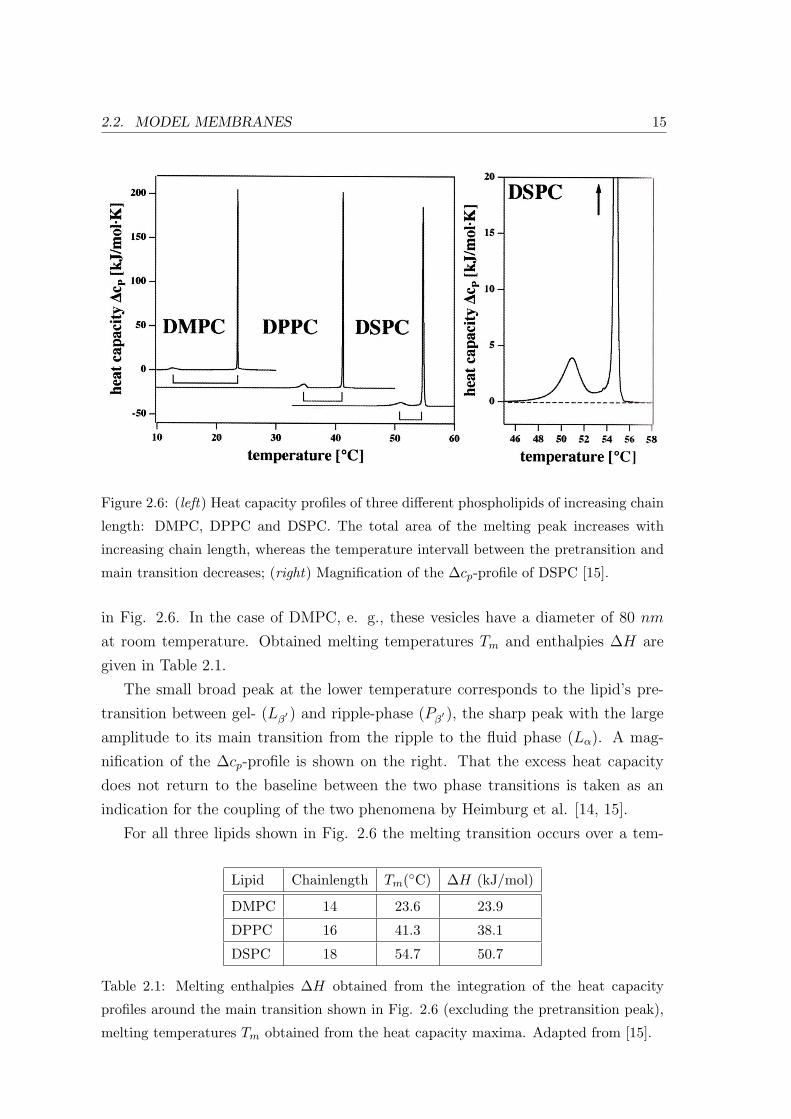
Figure 2.6: (left) Heat capacity profiles of three different phospholipids of increasing chain
length: DMPC, DPPC and DSPC. The total area of the melting peak increases with
increasing chain length, whereas the temperature intervall between the pretransition and
main transition decreases; (right) Magnification of the ∆cp-profile of DSPC [15].
in Fig. 2.6. In the case of DMPC, e. g., these vesicles have a diameter of 80 nm
at room temperature. Obtained melting temperatures Tm and enthalpies ∆H are
given in Table 2.1.
The small broad peak at the lower temperature corresponds to the lipid’s pre-
transition between gel- (Lβ′ ) and ripple-phase (Pβ
′ ), the sharp peak with the large
amplitude to its main transition from the ripple to the fluid phase (Lα). A mag-
nification of the ∆cp-profile is shown on the right. That the excess heat capacity
does not return to the baseline between the two phase transitions is taken as an
indication for the coupling of the two phenomena by Heimburg et al. [14, 15].
For all three lipids shown in Fig. 2.6 the melting transition occurs over a tem-
Lipid Chainlength Tm(C) ∆H (kJ/mol)
DMPC 14 23.6 23.9
DPPC 16 41.3 38.1
DSPC 18 54.7 50.7
Table 2.1: Melting enthalpies ∆H obtained from the integration of the heat capacity
profiles around the main transition shown in Fig. 2.6 (excluding the pretransition peak),
melting temperatures Tm obtained from the heat capacity maxima. Adapted from [15].
2.2. MODEL MEMBRANES 16
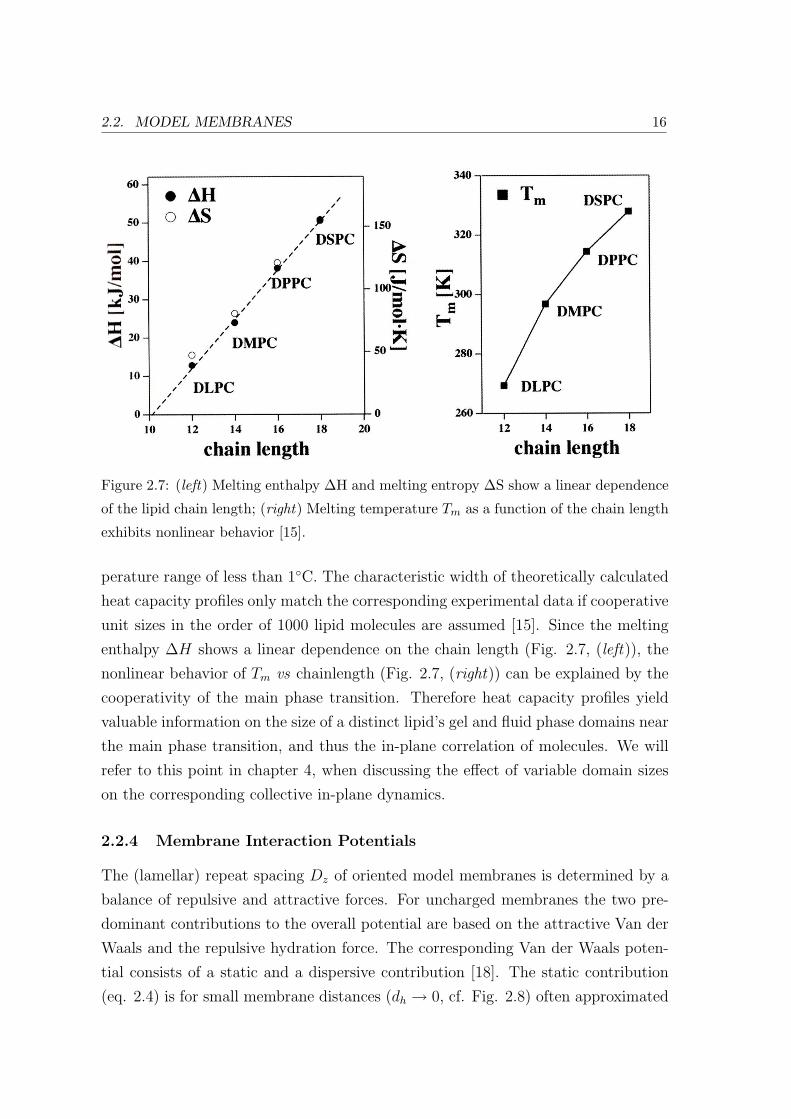
Figure 2.7: (left) Melting enthalpy ∆H and melting entropy ∆S show a linear dependence
of the lipid chain length; (right) Melting temperature Tm as a function of the chain length
exhibits nonlinear behavior [15].
perature range of less than 1C. The characteristic width of theoretically calculated
heat capacity profiles only match the corresponding experimental data if cooperative
unit sizes in the order of 1000 lipid molecules are assumed [15]. Since the melting
enthalpy ∆H shows a linear dependence on the chain length (Fig. 2.7, (left)), the
nonlinear behavior of Tm vs chainlength (Fig. 2.7, (right)) can be explained by the
cooperativity of the main phase transition. Therefore heat capacity profiles yield
valuable information on the size of a distinct lipid’s gel and fluid phase domains near
the main phase transition, and thus the in-plane correlation of molecules. We will
refer to this point in chapter 4, when discussing the effect of variable domain sizes
on the corresponding collective in-plane dynamics.
2.2.4 Membrane Interaction Potentials
The (lamellar) repeat spacing Dz of oriented model membranes is determined by a
balance of repulsive and attractive forces. For uncharged membranes the two pre-
dominant contributions to the overall potential are based on the attractive Van der
Waals and the repulsive hydration force. The corresponding Van der Waals poten-
tial consists of a static and a dispersive contribution [18]. The static contribution
(eq. 2.4) is for small membrane distances (dh → 0, cf. Fig. 2.8) often approximated
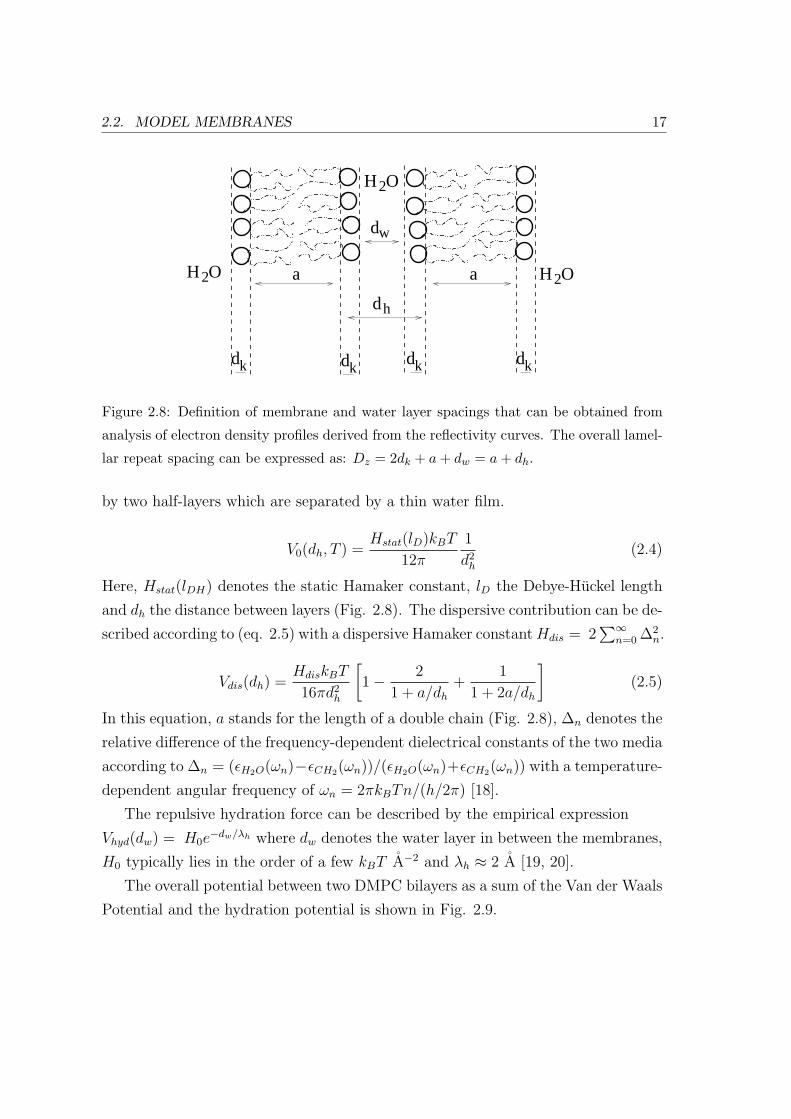
2.2. MODEL MEMBRANES 17
dk dkdk dk
dh
H O2
dw
H O2
H O2a a
Figure 2.8: Definition of membrane and water layer spacings that can be obtained from
analysis of electron density profiles derived from the reflectivity curves. The overall lamel-
lar repeat spacing can be expressed as: Dz = 2dk + a + dw = a + dh.
by two half-layers which are separated by a thin water film.
V0(dh, T ) =Hstat(lD)kBT
12π
1
d2h
(2.4)
Here, Hstat(lDH) denotes the static Hamaker constant, lD the Debye-Huckel length
and dh the distance between layers (Fig. 2.8). The dispersive contribution can be de-
scribed according to (eq. 2.5) with a dispersive Hamaker constant Hdis = 2∑∞
n=0 ∆2n.
Vdis(dh) =HdiskBT
16πd2h
[1− 2
1 + a/dh
+1
1 + 2a/dh
](2.5)
In this equation, a stands for the length of a double chain (Fig. 2.8), ∆n denotes the
relative difference of the frequency-dependent dielectrical constants of the two media
according to ∆n = (εH2O(ωn)−εCH2(ωn))/(εH2O(ωn)+εCH2(ωn)) with a temperature-
dependent angular frequency of ωn = 2πkBTn/(h/2π) [18].
The repulsive hydration force can be described by the empirical expression
Vhyd(dw) = H0e−dw/λh where dw denotes the water layer in between the membranes,
H0 typically lies in the order of a few kBT A−2 and λh ≈ 2 A [19, 20].
The overall potential between two DMPC bilayers as a sum of the Van der Waals
Potential and the hydration potential is shown in Fig. 2.9.
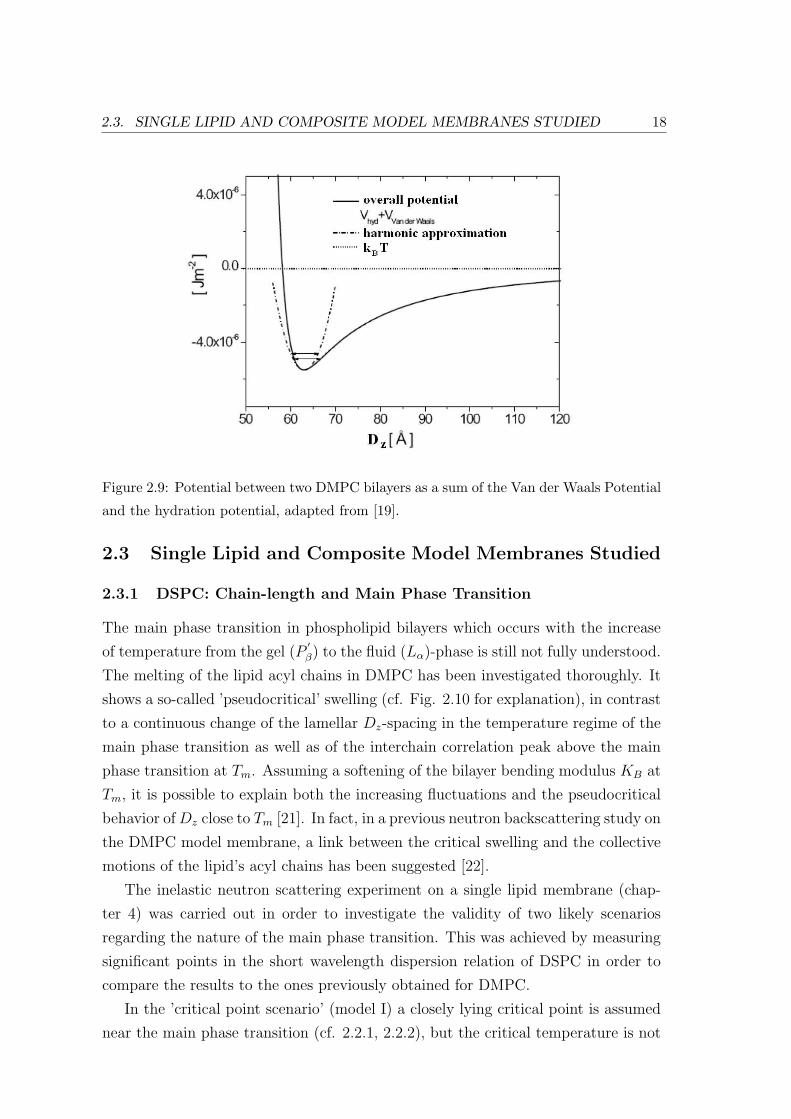
2.3. SINGLE LIPID AND COMPOSITE MODEL MEMBRANES STUDIED 18
Figure 2.9: Potential between two DMPC bilayers as a sum of the Van der Waals Potential
and the hydration potential, adapted from [19].
2.3 Single Lipid and Composite Model Membranes Studied
2.3.1 DSPC: Chain-length and Main Phase Transition
The main phase transition in phospholipid bilayers which occurs with the increase
of temperature from the gel (P′β) to the fluid (Lα)-phase is still not fully understood.
The melting of the lipid acyl chains in DMPC has been investigated thoroughly. It
shows a so-called ’pseudocritical’ swelling (cf. Fig. 2.10 for explanation), in contrast
to a continuous change of the lamellar Dz-spacing in the temperature regime of the
main phase transition as well as of the interchain correlation peak above the main
phase transition at Tm. Assuming a softening of the bilayer bending modulus KB at
Tm, it is possible to explain both the increasing fluctuations and the pseudocritical
behavior of Dz close to Tm [21]. In fact, in a previous neutron backscattering study on
the DMPC model membrane, a link between the critical swelling and the collective
motions of the lipid’s acyl chains has been suggested [22].
The inelastic neutron scattering experiment on a single lipid membrane (chap-
ter 4) was carried out in order to investigate the validity of two likely scenarios
regarding the nature of the main phase transition. This was achieved by measuring
significant points in the short wavelength dispersion relation of DSPC in order to
compare the results to the ones previously obtained for DMPC.
In the ’critical point scenario’ (model I) a closely lying critical point is assumed
near the main phase transition (cf. 2.2.1, 2.2.2), but the critical temperature is not
2.3. SINGLE LIPID AND COMPOSITE MODEL MEMBRANES STUDIED 19
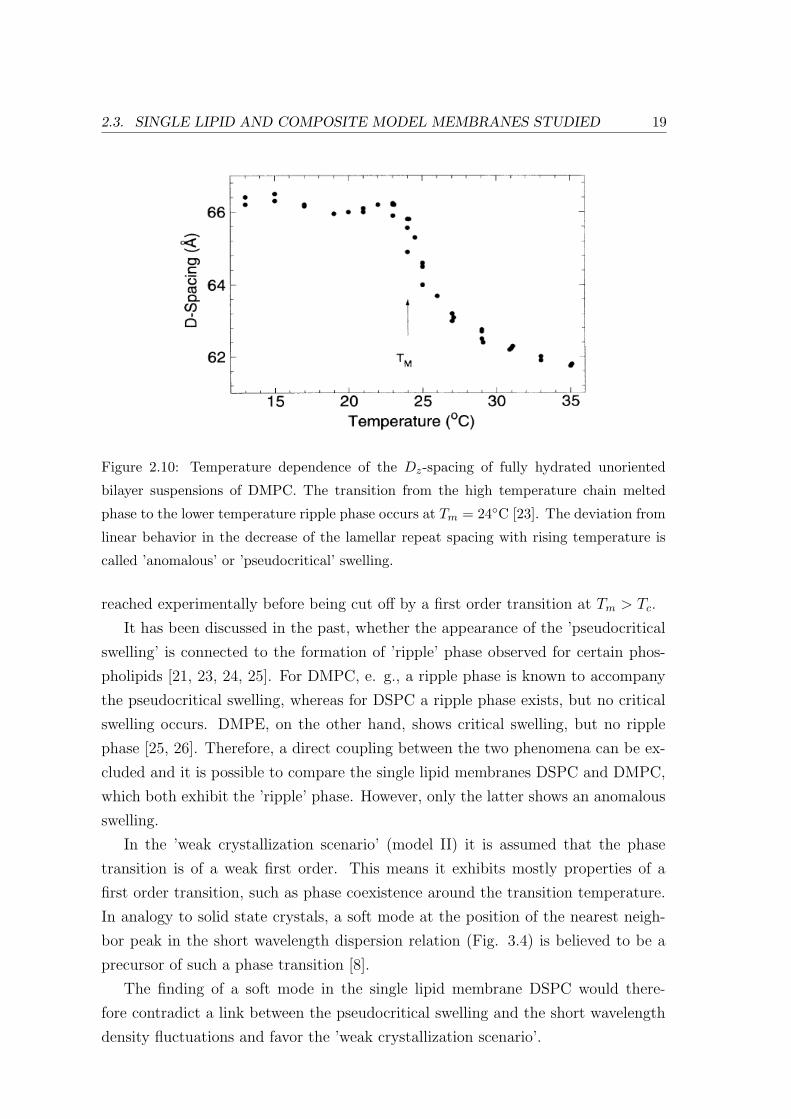
Figure 2.10: Temperature dependence of the Dz-spacing of fully hydrated unoriented
bilayer suspensions of DMPC. The transition from the high temperature chain melted
phase to the lower temperature ripple phase occurs at Tm = 24C [23]. The deviation from
linear behavior in the decrease of the lamellar repeat spacing with rising temperature is
called ’anomalous’ or ’pseudocritical’ swelling.
reached experimentally before being cut off by a first order transition at Tm > Tc.
It has been discussed in the past, whether the appearance of the ’pseudocritical
swelling’ is connected to the formation of ’ripple’ phase observed for certain phos-
pholipids [21, 23, 24, 25]. For DMPC, e. g., a ripple phase is known to accompany
the pseudocritical swelling, whereas for DSPC a ripple phase exists, but no critical
swelling occurs. DMPE, on the other hand, shows critical swelling, but no ripple
phase [25, 26]. Therefore, a direct coupling between the two phenomena can be ex-
cluded and it is possible to compare the single lipid membranes DSPC and DMPC,
which both exhibit the ’ripple’ phase. However, only the latter shows an anomalous
swelling.
In the ’weak crystallization scenario’ (model II) it is assumed that the phase
transition is of a weak first order. This means it exhibits mostly properties of a
first order transition, such as phase coexistence around the transition temperature.
In analogy to solid state crystals, a soft mode at the position of the nearest neigh-
bor peak in the short wavelength dispersion relation (Fig. 3.4) is believed to be a
precursor of such a phase transition [8].
The finding of a soft mode in the single lipid membrane DSPC would there-
fore contradict a link between the pseudocritical swelling and the short wavelength
density fluctuations and favor the ’weak crystallization scenario’.
2.3. SINGLE LIPID AND COMPOSITE MODEL MEMBRANES STUDIED 20
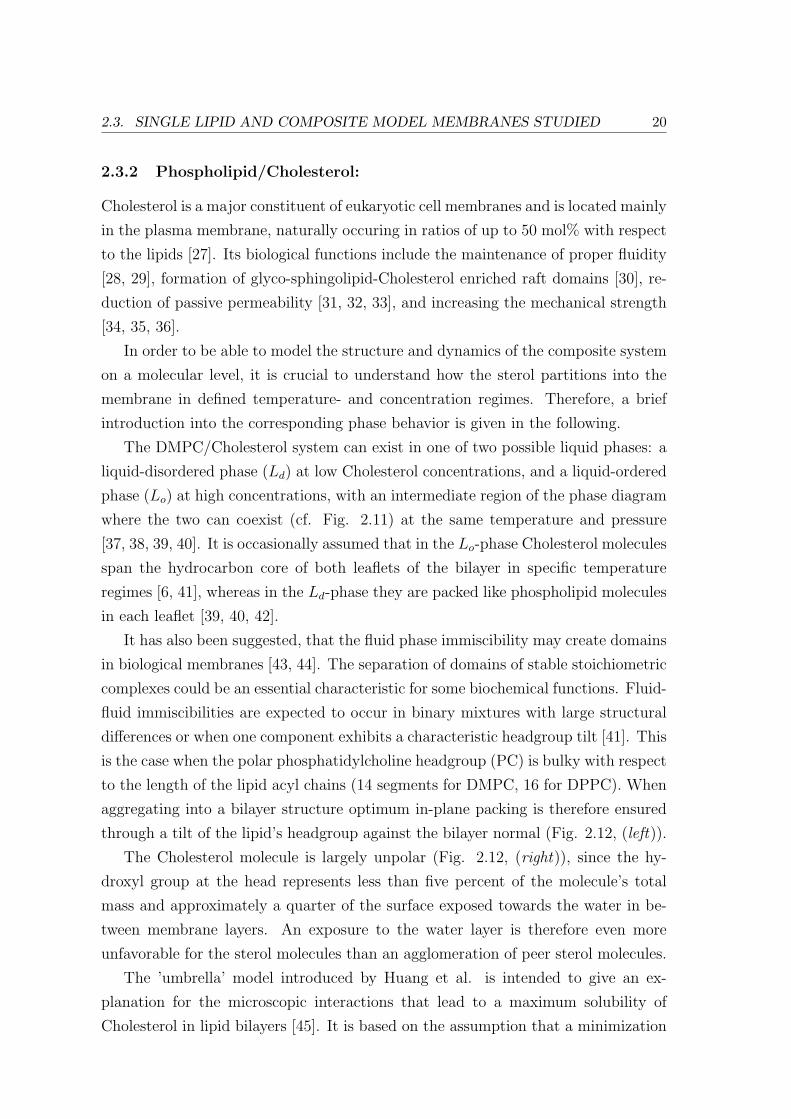
2.3.2 Phospholipid/Cholesterol:
Cholesterol is a major constituent of eukaryotic cell membranes and is located mainly
in the plasma membrane, naturally occuring in ratios of up to 50 mol% with respect
to the lipids [27]. Its biological functions include the maintenance of proper fluidity
[28, 29], formation of glyco-sphingolipid-Cholesterol enriched raft domains [30], re-
duction of passive permeability [31, 32, 33], and increasing the mechanical strength
[34, 35, 36].
In order to be able to model the structure and dynamics of the composite system
on a molecular level, it is crucial to understand how the sterol partitions into the
membrane in defined temperature- and concentration regimes. Therefore, a brief
introduction into the corresponding phase behavior is given in the following.
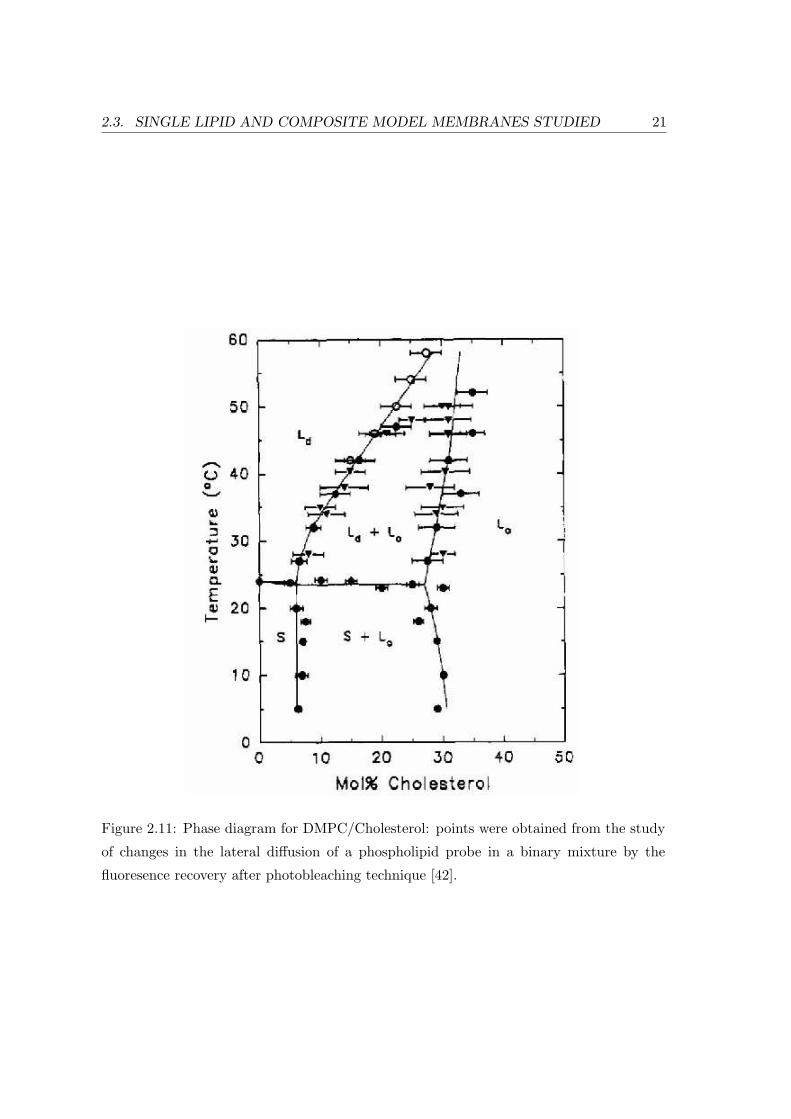
The DMPC/Cholesterol system can exist in one of two possible liquid phases: a
liquid-disordered phase (Ld) at low Cholesterol concentrations, and a liquid-ordered
phase (Lo) at high concentrations, with an intermediate region of the phase diagram
where the two can coexist (cf. Fig. 2.11) at the same temperature and pressure
[37, 38, 39, 40]. It is occasionally assumed that in the Lo-phase Cholesterol molecules
span the hydrocarbon core of both leaflets of the bilayer in specific temperature
regimes [6, 41], whereas in the Ld-phase they are packed like phospholipid molecules
in each leaflet [39, 40, 42].
It has also been suggested, that the fluid phase immiscibility may create domains
in biological membranes [43, 44]. The separation of domains of stable stoichiometric
complexes could be an essential characteristic for some biochemical functions. Fluid-
fluid immiscibilities are expected to occur in binary mixtures with large structural
differences or when one component exhibits a characteristic headgroup tilt [41]. This
is the case when the polar phosphatidylcholine headgroup (PC) is bulky with respect
to the length of the lipid acyl chains (14 segments for DMPC, 16 for DPPC). When
aggregating into a bilayer structure optimum in-plane packing is therefore ensured
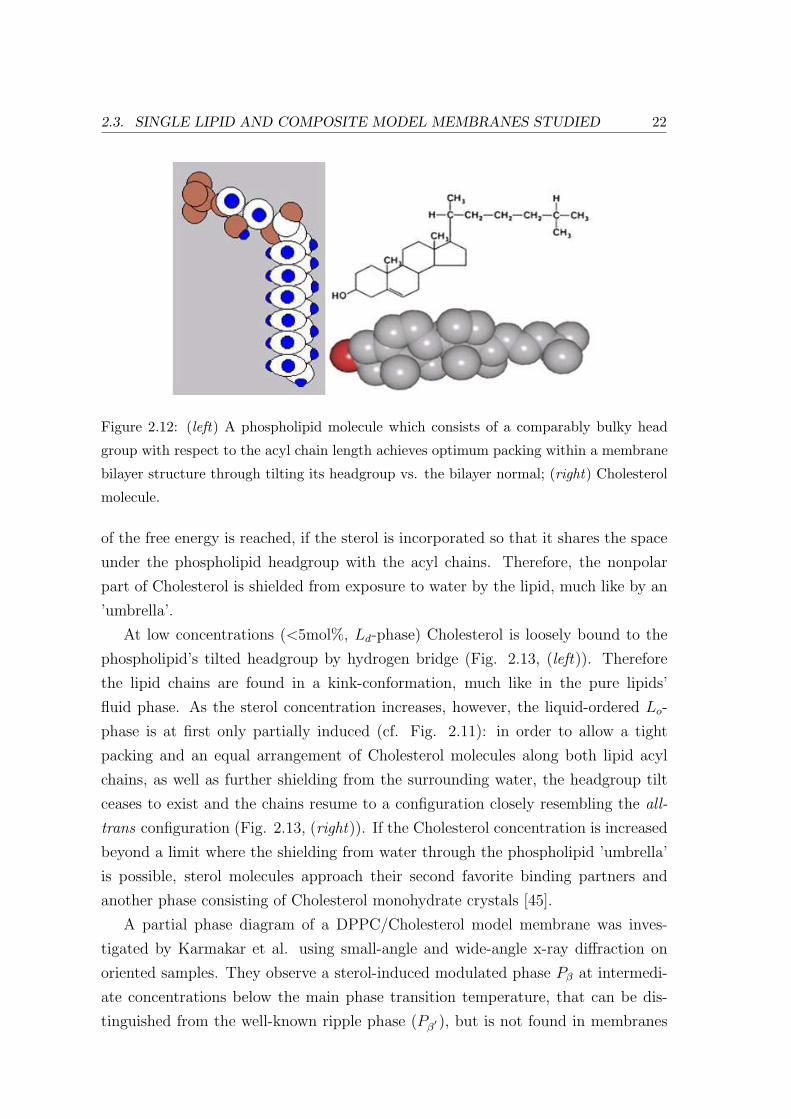
through a tilt of the lipid’s headgroup against the bilayer normal (Fig. 2.12, (left)).
The Cholesterol molecule is largely unpolar (Fig. 2.12, (right)), since the hy-
droxyl group at the head represents less than five percent of the molecule’s total
mass and approximately a quarter of the surface exposed towards the water in be-
tween membrane layers. An exposure to the water layer is therefore even more
unfavorable for the sterol molecules than an agglomeration of peer sterol molecules.
The ’umbrella’ model introduced by Huang et al. is intended to give an ex-
planation for the microscopic interactions that lead to a maximum solubility of
Cholesterol in lipid bilayers [45]. It is based on the assumption that a minimization
2.3. SINGLE LIPID AND COMPOSITE MODEL MEMBRANES STUDIED 21
Figure 2.11: Phase diagram for DMPC/Cholesterol: points were obtained from the study
of changes in the lateral diffusion of a phospholipid probe in a binary mixture by the
fluoresence recovery after photobleaching technique [42].
2.3. SINGLE LIPID AND COMPOSITE MODEL MEMBRANES STUDIED 22
Figure 2.12: (left) A phospholipid molecule which consists of a comparably bulky head
group with respect to the acyl chain length achieves optimum packing within a membrane
bilayer structure through tilting its headgroup vs. the bilayer normal; (right) Cholesterol
molecule.
of the free energy is reached, if the sterol is incorporated so that it shares the space
under the phospholipid headgroup with the acyl chains. Therefore, the nonpolar
part of Cholesterol is shielded from exposure to water by the lipid, much like by an
’umbrella’.
At low concentrations (<5mol%, Ld-phase) Cholesterol is loosely bound to the
phospholipid’s tilted headgroup by hydrogen bridge (Fig. 2.13, (left)). Therefore
the lipid chains are found in a kink-conformation, much like in the pure lipids’
fluid phase. As the sterol concentration increases, however, the liquid-ordered Lo-
phase is at first only partially induced (cf. Fig. 2.11): in order to allow a tight
packing and an equal arrangement of Cholesterol molecules along both lipid acyl
chains, as well as further shielding from the surrounding water, the headgroup tilt
ceases to exist and the chains resume to a configuration closely resembling the all-
trans configuration (Fig. 2.13, (right)). If the Cholesterol concentration is increased
beyond a limit where the shielding from water through the phospholipid ’umbrella’
is possible, sterol molecules approach their second favorite binding partners and
another phase consisting of Cholesterol monohydrate crystals [45].
A partial phase diagram of a DPPC/Cholesterol model membrane was inves-
tigated by Karmakar et al. using small-angle and wide-angle x-ray diffraction on
oriented samples. They observe a sterol-induced modulated phase Pβ at intermedi-
ate concentrations below the main phase transition temperature, that can be dis-
tinguished from the well-known ripple phase (Pβ′ ), but is not found in membranes
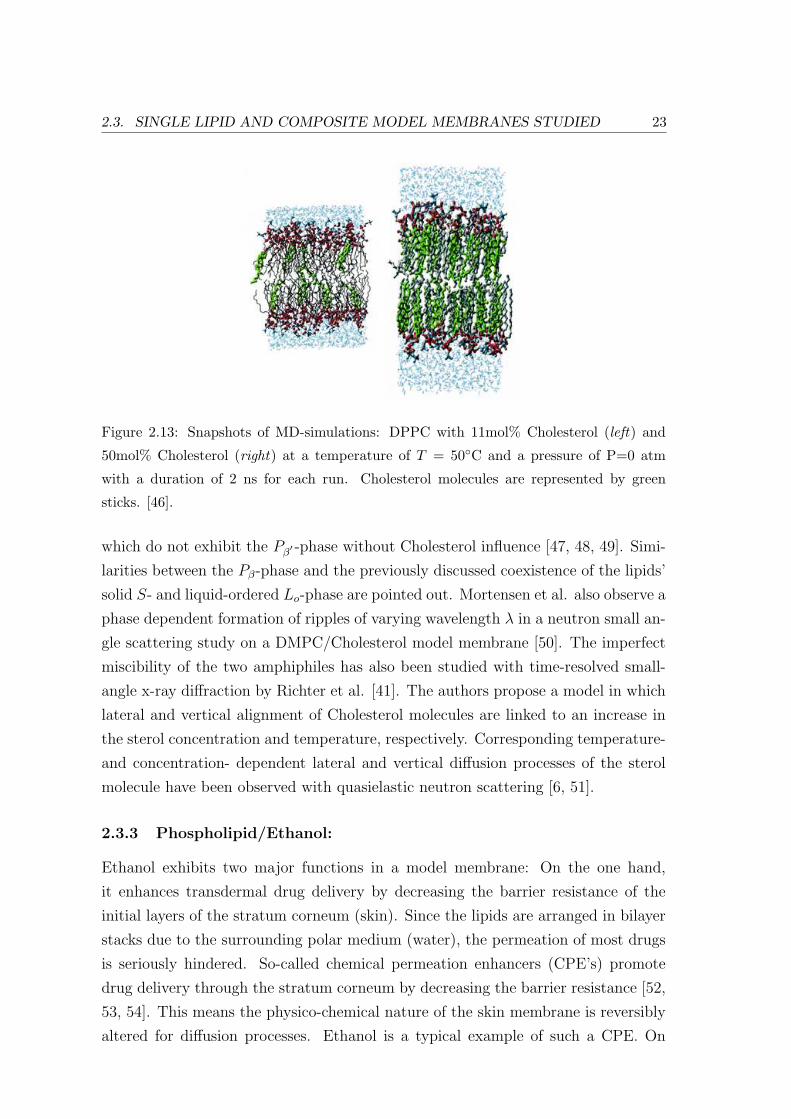
2.3. SINGLE LIPID AND COMPOSITE MODEL MEMBRANES STUDIED 23
Figure 2.13: Snapshots of MD-simulations: DPPC with 11mol% Cholesterol (left) and
50mol% Cholesterol (right) at a temperature of T = 50C and a pressure of P=0 atm
with a duration of 2 ns for each run. Cholesterol molecules are represented by green
sticks. [46].
which do not exhibit the Pβ′ -phase without Cholesterol influence [47, 48, 49]. Simi-
larities between the Pβ-phase and the previously discussed coexistence of the lipids’
solid S- and liquid-ordered Lo-phase are pointed out. Mortensen et al. also observe a
phase dependent formation of ripples of varying wavelength λ in a neutron small an-
gle scattering study on a DMPC/Cholesterol model membrane [50]. The imperfect
miscibility of the two amphiphiles has also been studied with time-resolved small-
angle x-ray diffraction by Richter et al. [41]. The authors propose a model in which
lateral and vertical alignment of Cholesterol molecules are linked to an increase in
the sterol concentration and temperature, respectively. Corresponding temperature-
and concentration- dependent lateral and vertical diffusion processes of the sterol
molecule have been observed with quasielastic neutron scattering [6, 51].
2.3.3 Phospholipid/Ethanol:
Ethanol exhibits two major functions in a model membrane: On the one hand,
it enhances transdermal drug delivery by decreasing the barrier resistance of the
initial layers of the stratum corneum (skin). Since the lipids are arranged in bilayer
stacks due to the surrounding polar medium (water), the permeation of most drugs
is seriously hindered. So-called chemical permeation enhancers (CPE’s) promote
drug delivery through the stratum corneum by decreasing the barrier resistance [52,
53, 54]. This means the physico-chemical nature of the skin membrane is reversibly
altered for diffusion processes. Ethanol is a typical example of such a CPE. On
2.3. SINGLE LIPID AND COMPOSITE MODEL MEMBRANES STUDIED 24
the other hand, Ethanol is also known to show properties similar to an anesthetic.
The effect of an anesthetic is to induce a lateral pressure within the fluid membrane
which can cause changes in the conformation of inserted membrane proteins and
therefore alter their function [15, 55, 56]. Therefore the effect of osmotic pressure
on the layer repeat spacing of membranes containing Ethanol is studied in section
6.1 prior to the corresponding collective in-plane dynamics in section 6.2.
As for the previously introduced composite system, the following overview over
the occurring phases will be referred to in the discussion of a molecular model for
the observed structure and dynamics when Ethanol is inserted into the membrane.
The influence of Ethanol on properties of different phospholipid model mem-
branes has been investigated in several studies. For saturated phosphatidylcholines,
Ethanol induces interdigitation of the lamellar gel phase at threshold concentrations
that decrease with the lipid chain length [57]. A biphasic effect on the gel-liquid
crystalline phase transition of the lipid multilayers is associated to this interdigi-
tation. The temperature of this transition first decreases slightly, then increases
when the Ethanol concentration exceeds the threshold concentration. For DMPC
and DPPC the interdigitation threshold concentrations for vesicle solutions are 10.7
and 6.3vol% respectively. The results presented in this work were taken on DMPC
with Ethanol.
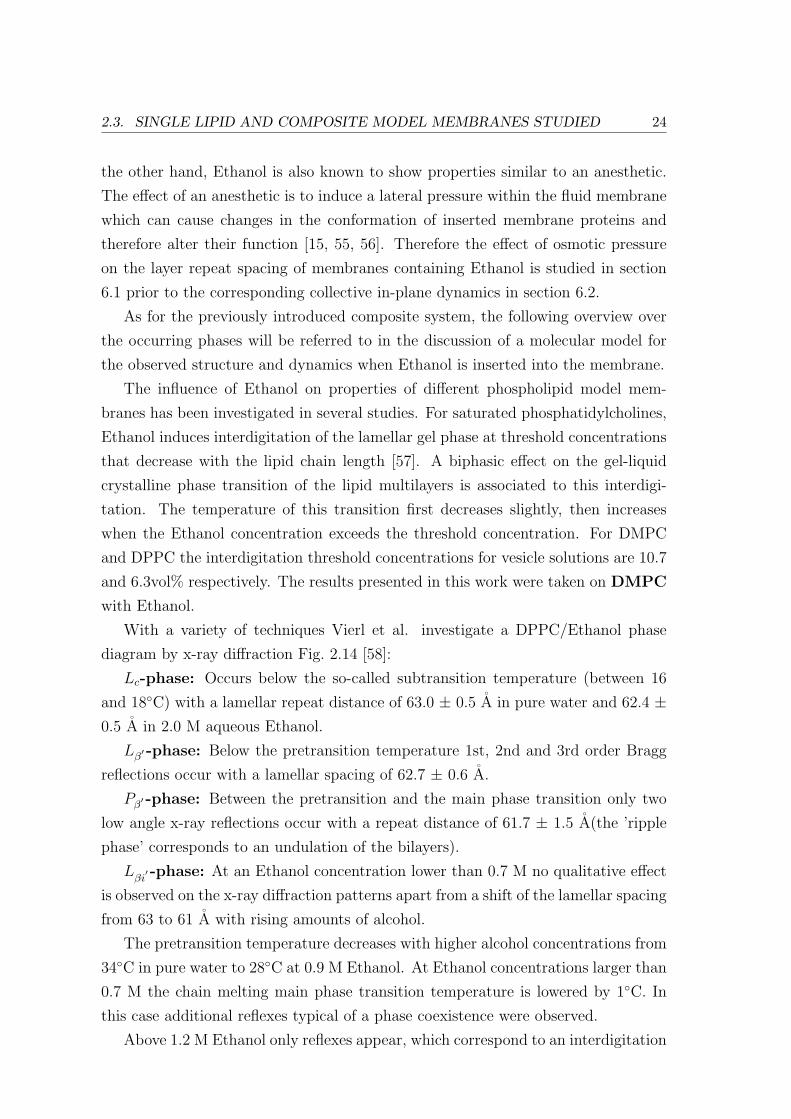
With a variety of techniques Vierl et al. investigate a DPPC/Ethanol phase
diagram by x-ray diffraction Fig. 2.14 [58]:
Lc-phase: Occurs below the so-called subtransition temperature (between 16
and 18C) with a lamellar repeat distance of 63.0 ± 0.5 A in pure water and 62.4 ±0.5 A in 2.0 M aqueous Ethanol.
Lβ′ -phase: Below the pretransition temperature 1st, 2nd and 3rd order Bragg
reflections occur with a lamellar spacing of 62.7 ± 0.6 A.
Pβ′ -phase: Between the pretransition and the main phase transition only two
low angle x-ray reflections occur with a repeat distance of 61.7 ± 1.5 A(the ’ripple
phase’ corresponds to an undulation of the bilayers).
Lβi′ -phase: At an Ethanol concentration lower than 0.7 M no qualitative effect
is observed on the x-ray diffraction patterns apart from a shift of the lamellar spacing
from 63 to 61 A with rising amounts of alcohol.
The pretransition temperature decreases with higher alcohol concentrations from
34C in pure water to 28C at 0.9 M Ethanol. At Ethanol concentrations larger than
0.7 M the chain melting main phase transition temperature is lowered by 1C. In
this case additional reflexes typical of a phase coexistence were observed.
Above 1.2 M Ethanol only reflexes appear, which correspond to an interdigitation
2.3. SINGLE LIPID AND COMPOSITE MODEL MEMBRANES STUDIED 25
Figure 2.14: Phase diagram of DPPC in water/Ethanol-mixtures of varying concentrations
as obtained from a combination of calorimetric, fluorescence, dynamic light scattering and
x-ray diffraction measurements on vesicle solutions, adapted from [58].
of the lipid lamellae (Fig. 2.14). The Dz-spacing characteristic for this particular
phase is 48.8± 0.5 A.
Lα-phase: For temperatures above the main phase transition temperature two
very sharp and intense reflections occur with a repeat distance of 67.5± 1.1 A.
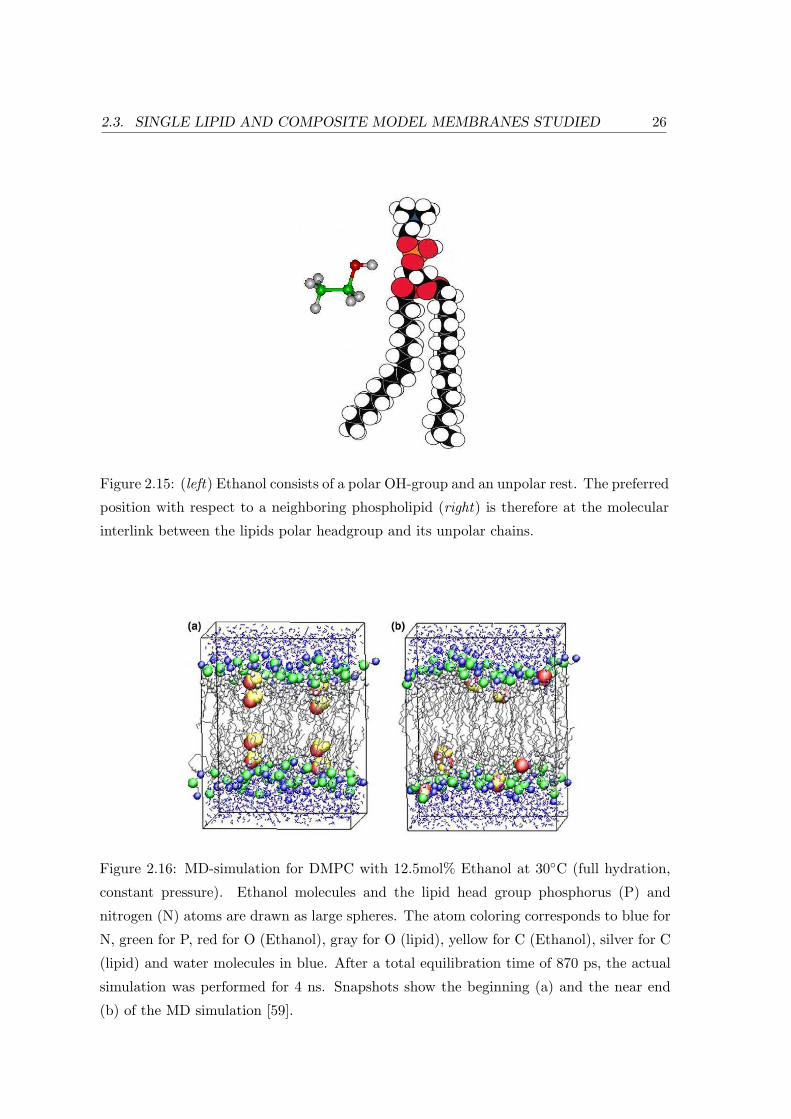
For the position of the Ethanol molecules at 12.5mol% and 30C, Chanda et
al. find a preferred location at the bilayer interface (cf. Fig. 2.15) [59]. Fig. 2.16
shows snapshots at the beginning and at the end of the simulation. Even Ethanol
molecules originally placed within the layer’s interior at the C6 atoms of the lipid
chains migrate towards the glycerol backbone, the carbonyl groups and the first
Methylene group (C2) of the lipid acyl chains.
Ethanol generally exhibits a strong affinity for the layer interface [60, 61, 62, 63].
This affinity can be related to the small difference between the molecule’s hydropho-
bic and hydrophillic lengths in the membrane, which can be related to a distinct
solubility towards hydrophobic (phospholipid chains) and hydrophillic (phospho-
lipid heads, water) components (Meyer-Overton rule). In this respect, Ethanol and
Cholesterol in a membrane have reverse influence on the molecular ordering of lipids
with rising concentrations: while Cholesterol moves inside the bilayer leaflets to
avoid contact with membrane water and therefore minimizes the layer interface (Lo-
2.3. SINGLE LIPID AND COMPOSITE MODEL MEMBRANES STUDIED 26
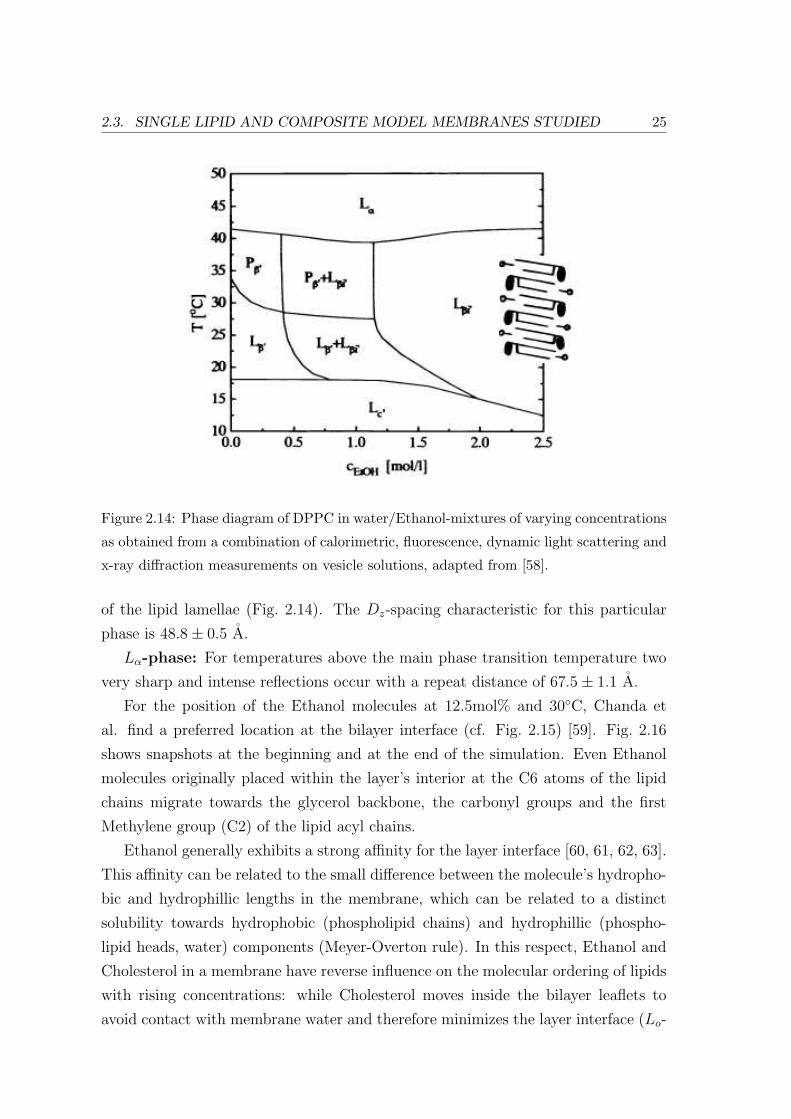
Figure 2.15: (left) Ethanol consists of a polar OH-group and an unpolar rest. The preferred
position with respect to a neighboring phospholipid (right) is therefore at the molecular
interlink between the lipids polar headgroup and its unpolar chains.
Figure 2.16: MD-simulation for DMPC with 12.5mol% Ethanol at 30C (full hydration,
constant pressure). Ethanol molecules and the lipid head group phosphorus (P) and
nitrogen (N) atoms are drawn as large spheres. The atom coloring corresponds to blue for
N, green for P, red for O (Ethanol), gray for O (lipid), yellow for C (Ethanol), silver for C
(lipid) and water molecules in blue. After a total equilibration time of 870 ps, the actual
simulation was performed for 4 ns. Snapshots show the beginning (a) and the near end
(b) of the MD simulation [59].
2.4. COLLECTIVE IN-PLANE DYNAMICS: BIOLOGICAL MEMBRANES 27
phase), Ethanol seeks both, hydrophillic and hydrophobic, contact and therefore
maximizes the layer interface (Lβi′ -phase).
2.4 Collective In-plane Dynamics: Biological Membranes
2.4.1 Transmembrane Transport of Molecules
Correlated molecular motions play an important role for different biological func-
tions of a membrane. Specifically the collective movement of the lipid acyl chains due
to thermal fluctuations has been linked to the transport of small molecules through
the bilayer [1, 64]. Nagle et al. investigate the passive sodium permeability of pure
lipid vesicles, which has a large peak at the bilayer phase transition temperature [2].
They link the phenomenon to density fluctuations in the plane of the membrane,
that open cavities in the headgroup region through which small ions can enter. In a
thermodynamic approach, the Fluctuation-Dissipation Theorem is used to express
the lateral area compressibilty κT as a function of the in-plane pair correlation func-
tion g(r) ∝ erξr and thereby link it to specific area fluctuations. These fluctuations,
far from the main transition, determine the membrane’s passive permeability to
small molecules, such as sodium.
2.4.2 Nerve Pulse Propagation
In an electrochemical approach the well-known Hodgkin-Huxley model relates nerve
pulse propagation to ion currents through specific resistors, so-called ion channels
[65]. Heimburg et al., on the other hand, explain mechanical forces and disloca-
tions as well as temperature responses of nerve membranes in-phase with the action
potential on the basis of an adiabatically propagating reversible density wave trig-
gered by a ’piezoelectric’ impulse [15, 66]. They have previously shown that heat
capacity changes in simple phospholipid model systems can be related to changes
in the lateral compressibility of the membranes. This is the case not only for model
systems, but also for biological membranes, such as for example escheria coli or lung
surfactant [67, 68, 69].
Neural tissue membranes are known to contain large quantities of Cholesterol and
saturated phospholipids such as DMPC, as well as a significantly smaller number
of (poly-) unsaturated phospholipids [70]. Studying the collective in-plane density
fluctuations of the most simple composite membrane resembling such tissue mem-
branes, can therefore directly yield distinct information on the functionality of a
model system that could also apply to a significant number of natural membranes.
Chapter 3
Collective Dynamics in Model
Membranes
The neutron is an ideal probe to study soft condensed matter due to its deep pene-
tration of a sample without causing radiation damage upon the long counting times
necessary for inelastic measurements. The neutron was first discovered by Chadwick
in 1932 and exploited for Bragg diffraction on solids by using low-flux Ra-Be sources
[71]. The latest generation of high-flux reactors such as the one at the
Institut Laue-Langevin (ILL in Grenoble, France) came into existence in the early
1970’s and made inelastic neutron scattering studies more practical.
In the present chapter various aspects of applying inelastic neutron scattering to
investigate (collective) membrane dynamics are introduced. After a short general
review of the corresponding scattering theory, an overview over collective and local
modes accessible with neutron spectroscopy is given. The focus is then shifted to the
modeling of the collective short wavelength dynamics within hydrodynamic theory,
as well as to the neutron three-axis spectrometry as an experimental technique used.
3.1 Inelastic Neutron Scattering
3.1.1 The Scattering Cross Section
When neutrons are scattered by matter, the process is generally characterized by a
momentum Q and energy ~ω transfer between sample and probe. The corresponding
conservation laws can be expressed as a function of the wave vectors of the incoming
and scattered neutrons ki and kf :
3.1. INELASTIC NEUTRON SCATTERING 29
Q = ki − kf momentum
~ω = Ei − Ef =~2
2m(k2
i − k2f ) energy (3.1)
If the energy transfer Ei − Ef is zero, elastic scattering occurs, otherwise the
process is inelastic.
In an (inelastic) neutron scattering experiment at a known incident Energy Ei
and wave vector ki the quantity of interest is the rate of neutrons scattered into
a given solid angle dΩf in the direction of the wave vector kf with a final energy
between Ef and Ef + dEf . This rate is typically expressed by the product of the
flux incident on a sample φ(ki) and the double differential cross section. If V is
the interaction operator for the neutron with the sample and the initial and final
states of the sample are labeled by quantum numbers λi and λf , the differential
cross section can be expressed as [72]:
d2σ
dΩfdEf
=kf
ki
( mn
2π~2
)2
|〈kfλf |V |kiλi〉|2 δ(~ω + Ei − Ef ) (3.2)
Since on a length scale of neutron wavelengths, typically A, the effective interac-
tion is weak due to the short range of the nuclear potential, typically in fm, scattering
is isotropical and can be described by a scalar, the nuclear scattering length b. It is
related to the total scattering cross section according to σ = 4πb2.
The Fermi-Pseudopotential V (r) describes isotropical scattering in the Born ap-
proximation (eq. 3.3):
V (r) =2π~2
mn
∑
l
blδ(r− rl) (3.3)
In this equation rl is the position of the l-th nucleus for which the short range
interaction potential is approximated by a delta function.
In a scattering experiment one generally averages over initial states and sums
over final states. If P (λi) is the statistical weight factor for the initial state, the
differential cross section becomes:
d2σ
dΩfdEf
=kf
ki
∑
λi,λf
P (λi)
∣∣∣∣∣
⟨λf
∣∣∣∣∣b∑
l
eiQrl
∣∣∣∣∣ λi
⟩∣∣∣∣∣
2
δ(~ω + Ei − Ef ) (3.4)
With the neutron scattering function S(Q, ω) (eq. 3.5), the double differential cross
3.1. INELASTIC NEUTRON SCATTERING 30
section in the Van Hove formalism can be expressed as (eq. 3.6) [73]:
S(Q, ω) =1
2π~N∑
ll′
∫ ∞
−∞dt〈e−iQr
l′ (0)eiQrl(t)〉e−iωt (3.5)
d2σ
dΩfdEf
= Nkfkib2S(Q, ω) (3.6)
In (eq. 3.5), N is the number of nuclei, t is the time and the brackets denote the
average over the initial states. The scattering function depends only on momentum
and energy transferred from a neutron to the sample, not on absolute values of ki
and kf itself. The aim of an inelastic neutron scattering experiment is to measure
S(Q, ω) which contains both information on the positions as well as the motions of
atoms comprising the sample in order to determine the microscopic properties of the
system under investigation.
3.1.2 Coherent vs. Incoherent Scattering
In general one always obtains an incoherent and a coherent scattering contribution
in any neutron experiment. Therefore one usually measures two different scattering
cross sections. The difference can be understood looking at a monoatomic sample
consisting of different isotopes, which each have distinct scattering lengths. For
isotopes with a nuclear spin the scattering length depends on whether it is parallel
or antiparallel to the neutron spin. Let us assume, for instance, the rth distinct
isotope or nuclear spin state has the scattering length br, occurs with frequency
cr and correlations between nuclear position and scattering length can be omitted.
Then scattering, which depends on the relative positions of the atoms, is described
solely by the average (or coherent) scattering length b =∑
r crbr and therefore the
average coherent cross section per atom σcoh = 4π(b)2.
Random deviations from a scattering average, on the other hand, will not give
a contribution to collective scattering, only to the incoherent scattering. In this
case the total cross section is given by σscat = 4π∑
i crb2r = 4πb2. Therefore, with
σinc = σscat−σcoh the incoherent scattering cross section and the effective incoherent
scattering length can be obtained as:
σinc = 4π(b2 − b2
)= 4π(b− b)2 (3.7)
⇒ binc =√
b2 − b2
Table 3.1 shows examples of the coherent and incoherent scattering lengths and
cross sections for the elements most common in phospholipid model membranes.
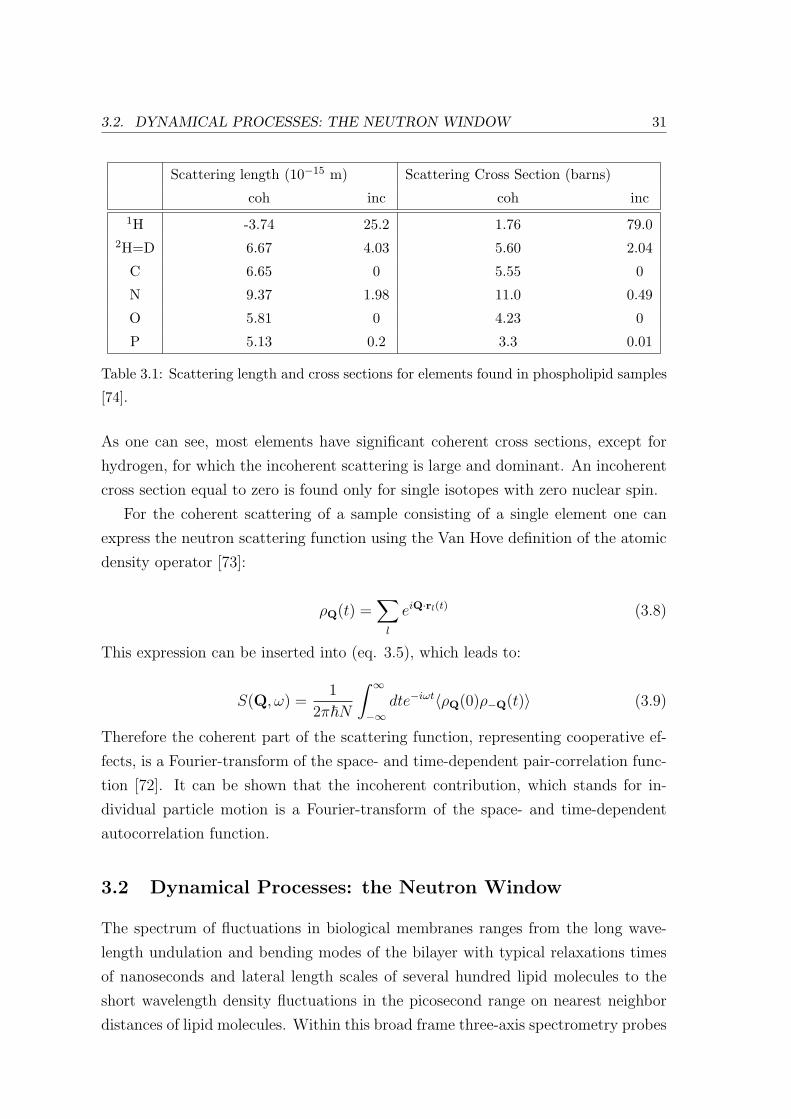
3.2. DYNAMICAL PROCESSES: THE NEUTRON WINDOW 31
Scattering length (10−15 m) Scattering Cross Section (barns)
coh inc coh inc1H -3.74 25.2 1.76 79.0
2H=D 6.67 4.03 5.60 2.04
C 6.65 0 5.55 0
N 9.37 1.98 11.0 0.49
O 5.81 0 4.23 0
P 5.13 0.2 3.3 0.01
Table 3.1: Scattering length and cross sections for elements found in phospholipid samples
[74].
As one can see, most elements have significant coherent cross sections, except for
hydrogen, for which the incoherent scattering is large and dominant. An incoherent
cross section equal to zero is found only for single isotopes with zero nuclear spin.
For the coherent scattering of a sample consisting of a single element one can
express the neutron scattering function using the Van Hove definition of the atomic
density operator [73]:
ρQ(t) =∑
l
eiQ·rl(t) (3.8)
This expression can be inserted into (eq. 3.5), which leads to:
S(Q, ω) =1
2π~N
∫ ∞
−∞dte−iωt〈ρQ(0)ρ−Q(t)〉 (3.9)
Therefore the coherent part of the scattering function, representing cooperative ef-
fects, is a Fourier-transform of the space- and time-dependent pair-correlation func-
tion [72]. It can be shown that the incoherent contribution, which stands for in-
dividual particle motion is a Fourier-transform of the space- and time-dependent
autocorrelation function.
3.2 Dynamical Processes: the Neutron Window
The spectrum of fluctuations in biological membranes ranges from the long wave-
length undulation and bending modes of the bilayer with typical relaxations times
of nanoseconds and lateral length scales of several hundred lipid molecules to the
short wavelength density fluctuations in the picosecond range on nearest neighbor
distances of lipid molecules. Within this broad frame three-axis spectrometry probes
3.2. DYNAMICAL PROCESSES: THE NEUTRON WINDOW 32
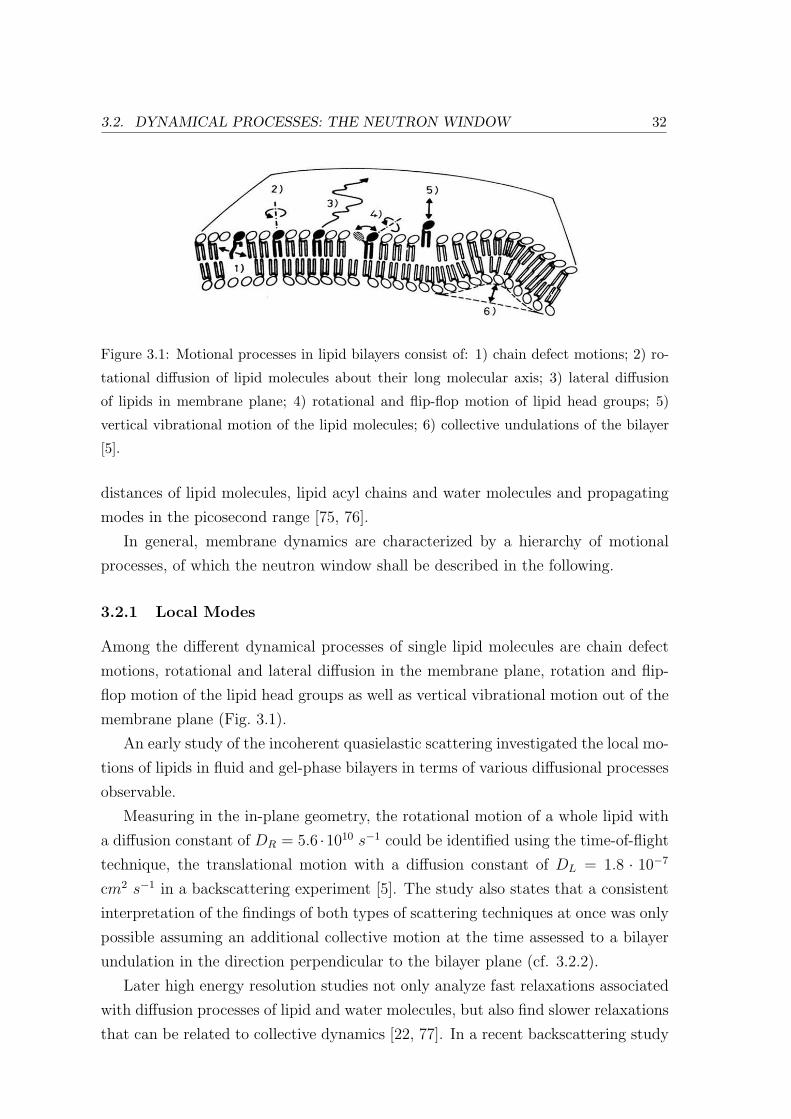
Figure 3.1: Motional processes in lipid bilayers consist of: 1) chain defect motions; 2) ro-
tational diffusion of lipid molecules about their long molecular axis; 3) lateral diffusion
of lipids in membrane plane; 4) rotational and flip-flop motion of lipid head groups; 5)
vertical vibrational motion of the lipid molecules; 6) collective undulations of the bilayer
[5].
distances of lipid molecules, lipid acyl chains and water molecules and propagating
modes in the picosecond range [75, 76].
In general, membrane dynamics are characterized by a hierarchy of motional
processes, of which the neutron window shall be described in the following.
3.2.1 Local Modes
Among the different dynamical processes of single lipid molecules are chain defect
motions, rotational and lateral diffusion in the membrane plane, rotation and flip-
flop motion of the lipid head groups as well as vertical vibrational motion out of the
membrane plane (Fig. 3.1).
An early study of the incoherent quasielastic scattering investigated the local mo-
tions of lipids in fluid and gel-phase bilayers in terms of various diffusional processes
observable.
Measuring in the in-plane geometry, the rotational motion of a whole lipid with
a diffusion constant of DR = 5.6 ·1010 s−1 could be identified using the time-of-flight
technique, the translational motion with a diffusion constant of DL = 1.8 · 10−7
cm2 s−1 in a backscattering experiment [5]. The study also states that a consistent
interpretation of the findings of both types of scattering techniques at once was only
possible assuming an additional collective motion at the time assessed to a bilayer
undulation in the direction perpendicular to the bilayer plane (cf. 3.2.2).
Later high energy resolution studies not only analyze fast relaxations associated
with diffusion processes of lipid and water molecules, but also find slower relaxations
that can be related to collective dynamics [22, 77]. In a recent backscattering study
3.2. DYNAMICAL PROCESSES: THE NEUTRON WINDOW 33
performed within the work of this thesis, selective contrast matching by alternating
partial deuteration of lipid chains and intermembrane water, was used to distinguish
between coherent and incoherent scattering contributions of both components. Here,
on length scales of ns, slow collective motions of the lipid acyl chains were identified
[78].
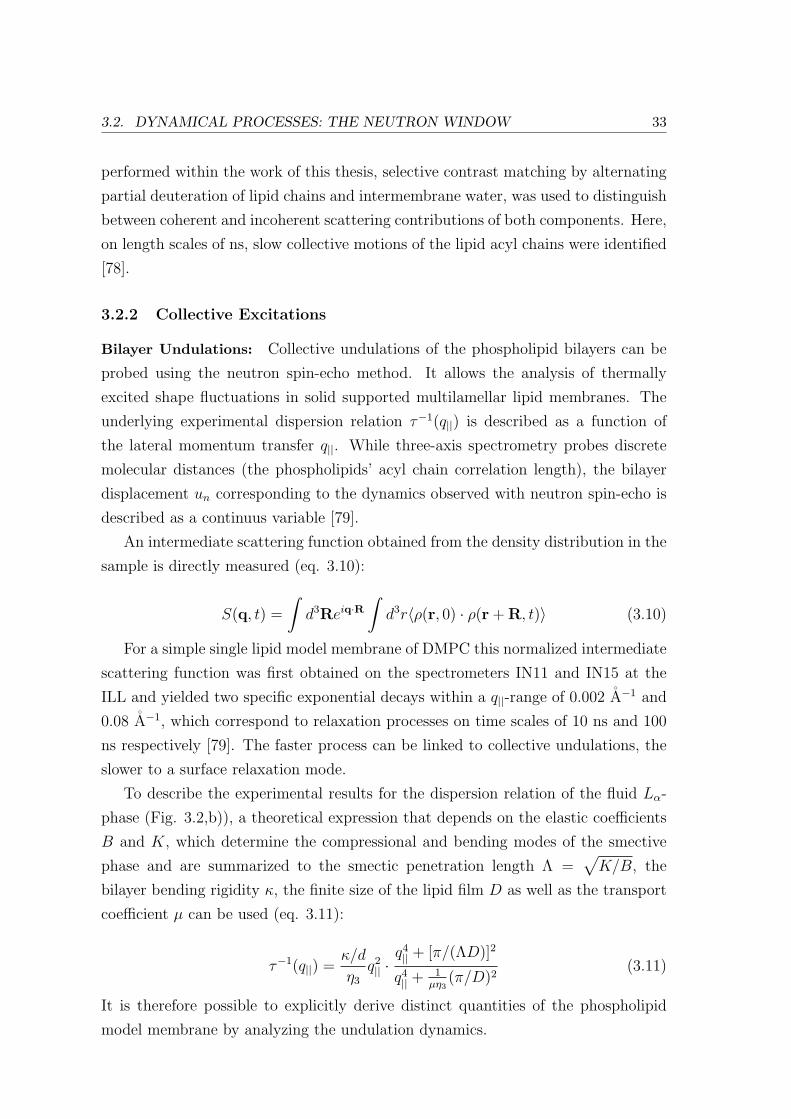
3.2.2 Collective Excitations
Bilayer Undulations: Collective undulations of the phospholipid bilayers can be
probed using the neutron spin-echo method. It allows the analysis of thermally
excited shape fluctuations in solid supported multilamellar lipid membranes. The
underlying experimental dispersion relation τ−1(q||) is described as a function of
the lateral momentum transfer q||. While three-axis spectrometry probes discrete
molecular distances (the phospholipids’ acyl chain correlation length), the bilayer
displacement un corresponding to the dynamics observed with neutron spin-echo is
described as a continuus variable [79].
An intermediate scattering function obtained from the density distribution in the
sample is directly measured (eq. 3.10):
S(q, t) =
∫d3Reiq·R
∫d3r〈ρ(r, 0) · ρ(r + R, t)〉 (3.10)
For a simple single lipid model membrane of DMPC this normalized intermediate
scattering function was first obtained on the spectrometers IN11 and IN15 at the
ILL and yielded two specific exponential decays within a q||-range of 0.002 A−1 and
0.08 A−1, which correspond to relaxation processes on time scales of 10 ns and 100
ns respectively [79]. The faster process can be linked to collective undulations, the
slower to a surface relaxation mode.
To describe the experimental results for the dispersion relation of the fluid Lα-
phase (Fig. 3.2,b)), a theoretical expression that depends on the elastic coefficients
B and K, which determine the compressional and bending modes of the smective
phase and are summarized to the smectic penetration length Λ =√
K/B, the
bilayer bending rigidity κ, the finite size of the lipid film D as well as the transport
coefficient µ can be used (eq. 3.11):
τ−1(q||) =κ/d
η3
q2|| ·
q4|| + [π/(ΛD)]2
q4|| +
1µη3
(π/D)2(3.11)
It is therefore possible to explicitly derive distinct quantities of the phospholipid
model membrane by analyzing the undulation dynamics.
3.2. DYNAMICAL PROCESSES: THE NEUTRON WINDOW 34
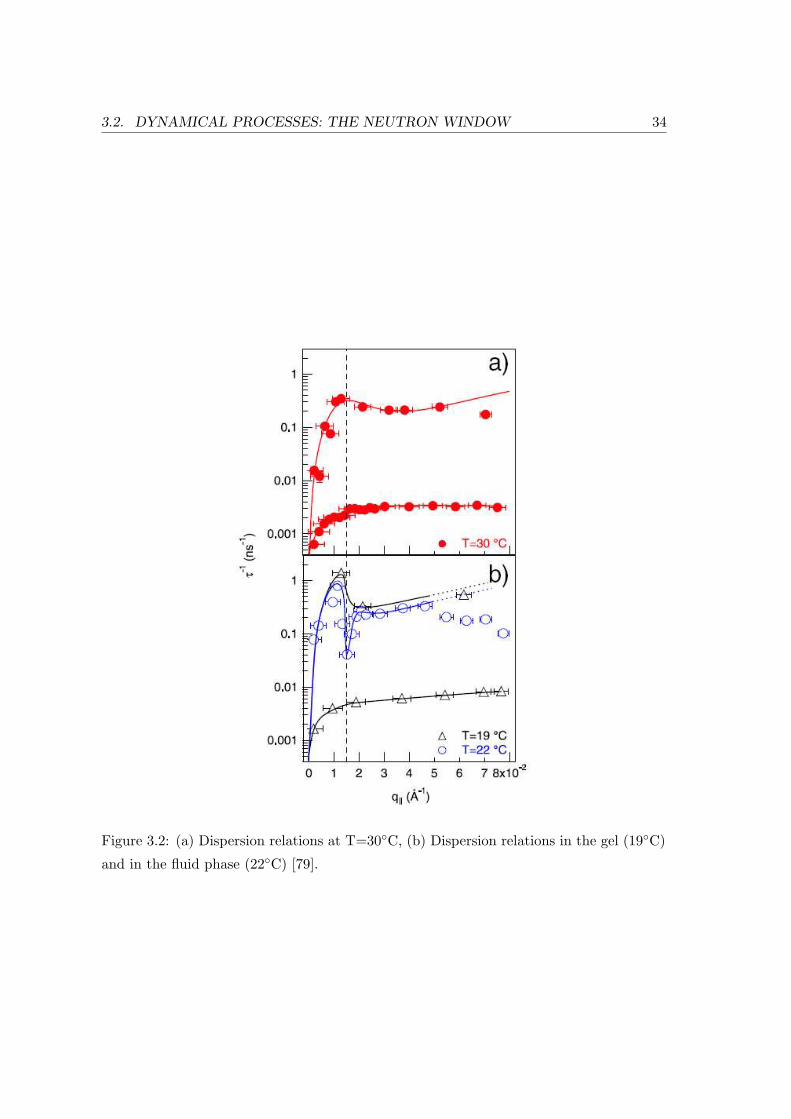
Figure 3.2: (a) Dispersion relations at T=30C, (b) Dispersion relations in the gel (19C)
and in the fluid phase (22C) [79].
3.2. DYNAMICAL PROCESSES: THE NEUTRON WINDOW 35
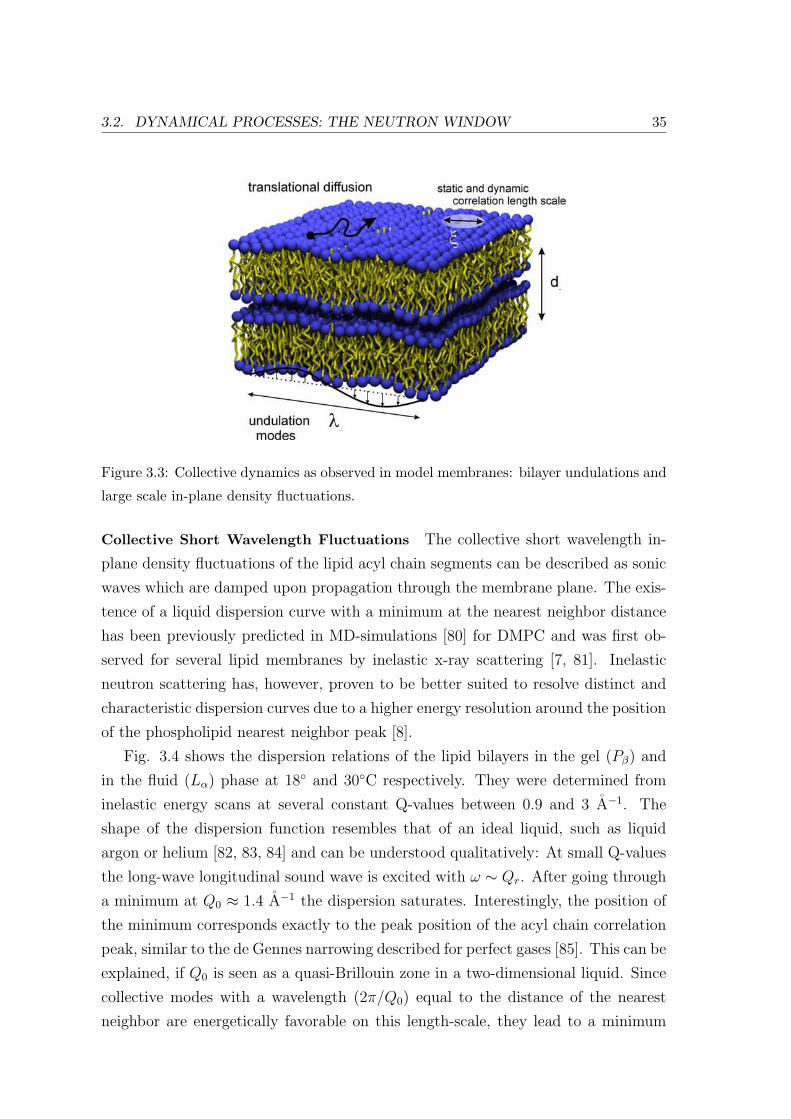
Figure 3.3: Collective dynamics as observed in model membranes: bilayer undulations and
large scale in-plane density fluctuations.
Collective Short Wavelength Fluctuations The collective short wavelength in-
plane density fluctuations of the lipid acyl chain segments can be described as sonic
waves which are damped upon propagation through the membrane plane. The exis-
tence of a liquid dispersion curve with a minimum at the nearest neighbor distance
has been previously predicted in MD-simulations [80] for DMPC and was first ob-
served for several lipid membranes by inelastic x-ray scattering [7, 81]. Inelastic
neutron scattering has, however, proven to be better suited to resolve distinct and
characteristic dispersion curves due to a higher energy resolution around the position
of the phospholipid nearest neighbor peak [8].
Fig. 3.4 shows the dispersion relations of the lipid bilayers in the gel (Pβ) and
in the fluid (Lα) phase at 18 and 30C respectively. They were determined from
inelastic energy scans at several constant Q-values between 0.9 and 3 A−1. The
shape of the dispersion function resembles that of an ideal liquid, such as liquid
argon or helium [82, 83, 84] and can be understood qualitatively: At small Q-values
the long-wave longitudinal sound wave is excited with ω ∼ Qr. After going through
a minimum at Q0 ≈ 1.4 A−1 the dispersion saturates. Interestingly, the position of
the minimum corresponds exactly to the peak position of the acyl chain correlation
peak, similar to the de Gennes narrowing described for perfect gases [85]. This can be
explained, if Q0 is seen as a quasi-Brillouin zone in a two-dimensional liquid. Since
collective modes with a wavelength (2π/Q0) equal to the distance of the nearest
neighbor are energetically favorable on this length-scale, they lead to a minimum
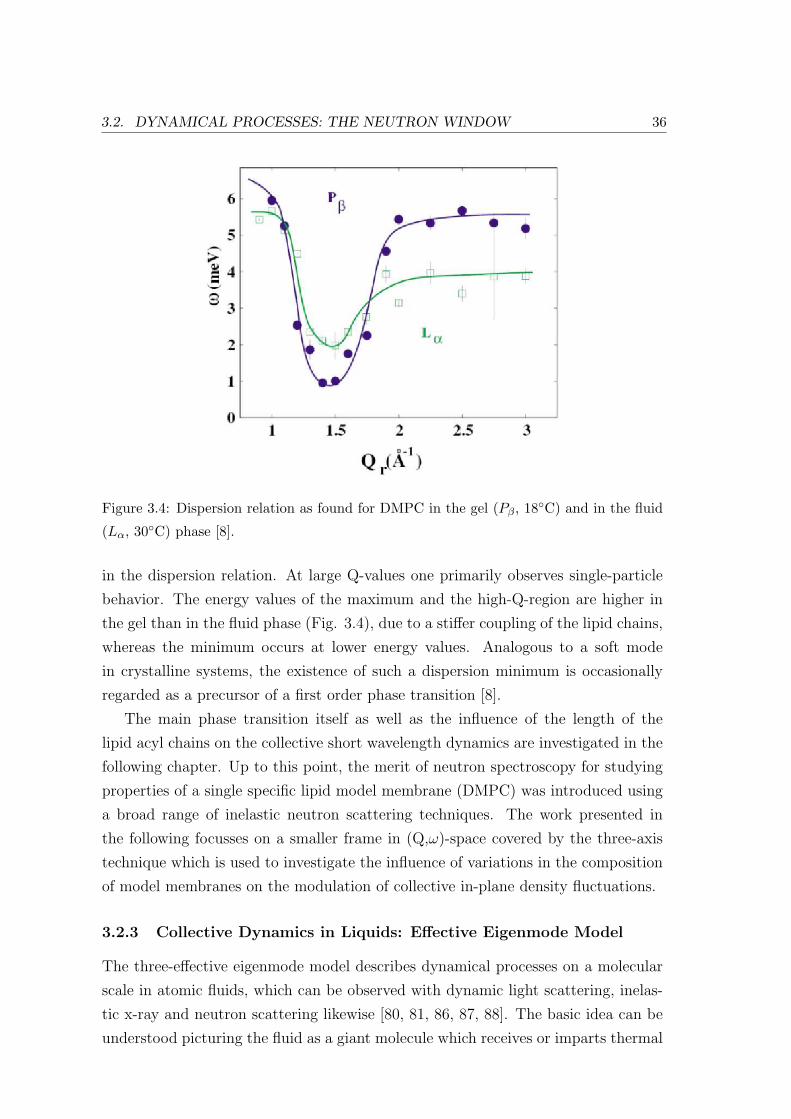
3.2. DYNAMICAL PROCESSES: THE NEUTRON WINDOW 36
Figure 3.4: Dispersion relation as found for DMPC in the gel (Pβ, 18C) and in the fluid
(Lα, 30C) phase [8].
in the dispersion relation. At large Q-values one primarily observes single-particle
behavior. The energy values of the maximum and the high-Q-region are higher in
the gel than in the fluid phase (Fig. 3.4), due to a stiffer coupling of the lipid chains,
whereas the minimum occurs at lower energy values. Analogous to a soft mode
in crystalline systems, the existence of such a dispersion minimum is occasionally
regarded as a precursor of a first order phase transition [8].
The main phase transition itself as well as the influence of the length of the
lipid acyl chains on the collective short wavelength dynamics are investigated in the
following chapter. Up to this point, the merit of neutron spectroscopy for studying
properties of a single specific lipid model membrane (DMPC) was introduced using
a broad range of inelastic neutron scattering techniques. The work presented in
the following focusses on a smaller frame in (Q,ω)-space covered by the three-axis
technique which is used to investigate the influence of variations in the composition
of model membranes on the modulation of collective in-plane density fluctuations.
3.2.3 Collective Dynamics in Liquids: Effective Eigenmode Model
The three-effective eigenmode model describes dynamical processes on a molecular
scale in atomic fluids, which can be observed with dynamic light scattering, inelas-
tic x-ray and neutron scattering likewise [80, 81, 86, 87, 88]. The basic idea can be
understood picturing the fluid as a giant molecule which receives or imparts thermal
3.2. DYNAMICAL PROCESSES: THE NEUTRON WINDOW 37
excitations from the incident radiation. These excitations are visible in the scattered
radiation and can be interpreted assuming the fluid exhibits the dynamic behavior
that matches the existence of a few effective eigenmodes. The corresponding eigen-
values determine the decay of excitations when they are real, and their propagation
when they are complex.
The experimentally obtained dynamic structure factor S(Qr, ω) can be equiva-
lently represented by its time Fourier transform, the intermediate scattering function
G(Qr, t), which can be represented as a sum of three exponentials. The respective
exponents are the eigenvalues, their respective intensities are determined by the
eigenfunctions of the three effective eigenmodes of the fluid.
The model originates in the theory of Landau and Placzek for the light scat-
tering of fluids, which explains the Rayleigh-Brillouin triplett lines observed in the
spectrum of light. Here, it is assumed that the wavelength of the incident light is
much larger than the size of the atoms, so that many atoms would be comprised in a
wavelength. This assumption in general does not hold for whole lipids with sizes in
the range of several A’s and neutron wavelengths in the order of A’s. The membrane
plane can, however, be sliced into layers, which can be described as 2-dimensional
liquid crystals. This way, single acyl chain segments can be considered similar to
independent particles of a liquid described by de Gennes [89, 90]. This means, the
time evolution of these chain segments can in good approximation be described by
the equations of hydrodynamics, that is as if they move like particles in macroscopic
flow, according to:
∂
∂tG(Q, t) = −H(Q)G(Q, t) (3.12)
which implies (eq. 3.13)
G(Q, t) = exp −tH(Q) (3.13)
With Gjl(Q, 0) = δjl for (j, l = 1, 2, 3) and the hydrodynamic matrix for small
Q, H(Q):
H(Q) =
0 ifun(Q) 0
ifun(Q) zu(Q) ifuT (Q)
0 ifuT (Q) zT (Q)
(3.14)
3.3. NEUTRON SPECTROSCOPY 38
The matrix elements are the following:
fun(Q) = Qcs · √γ
zu(Q) = φ ·Q2
zT (Q) = γ ·DT Q2
fuT (Q) = Qcs ·√
(γ − 1)/γ (3.15)
Where: cs = v0[γ/S(0)]1/2: adiabatic speed of sound; γ = cp/cv: ratio of specific
heat per unit mass at constant pressure and volume; φ = [(4/3)η+ζ]/nm: kinematic
longitudinal viscosity, η: shear viscosity, ρ = nm: mass density of the fluid with n:
number density, ζ: bulk viscosity; DT = λ/nmcp: thermal diffusivity, λ: thermal
conductivity.
The three hydrodynamic modes are now given as the three eigenvalues (O(Q2))
of the hydrodynamic matrix:
zu(Q) = DT Q2 heat mode
z+(Q) = ±icsQ + ΓsQ2 sound mode (3.16)
If the obtained correlation function G(Q,t) is now inversely Fourier-transformed,
the solution of (eq. 3.12) in the hydrodynamic form can be written as (eq. 3.17):
S(Q,ω)/S(Q) = 1/π ·
A0zh
ω2 + z2h
+ AsΓs + b(ω + ωs)
(ω + ωs)2 + Γ2s
+ AsΓs − b(ω − ωs)
(ω − ωs)2 + Γ2s
(3.17)
Looking at (eq. 3.17) two cases are of special interest: When fuT = 0, the
amplitude of the central peak S(Q, ω) diminishes. Therefore the last two terms rep-
resenting the side peaks stay and the model remains a damped harmonic oscillation
model (DHO). When zu(Q) = 0, one obtains only a Lorentzian with the decay time
zT (Q), the so-called ’viscoelastic model’.
3.3 Neutron Spectroscopy
3.3.1 Three-axis Spectrometry
Among the instrumental methods used for neutron spectroscopy the three-axis tech-
nique (developed in 1961 by Brockhouse) plays a significant role, since it allows
controlled measurement of the scattering function S(Q,ω) at essentially any point
3.3. NEUTRON SPECTROSCOPY 39
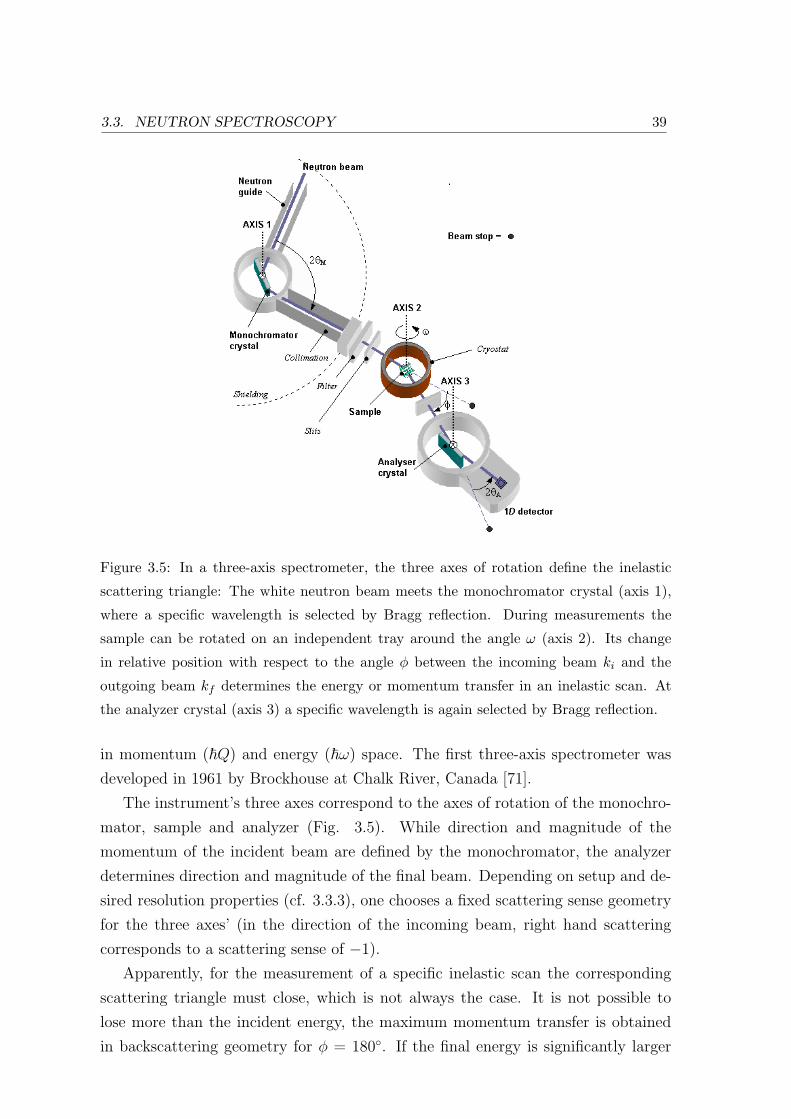
Figure 3.5: In a three-axis spectrometer, the three axes of rotation define the inelastic
scattering triangle: The white neutron beam meets the monochromator crystal (axis 1),
where a specific wavelength is selected by Bragg reflection. During measurements the
sample can be rotated on an independent tray around the angle ω (axis 2). Its change
in relative position with respect to the angle φ between the incoming beam ki and the
outgoing beam kf determines the energy or momentum transfer in an inelastic scan. At
the analyzer crystal (axis 3) a specific wavelength is again selected by Bragg reflection.
in momentum (~Q) and energy (~ω) space. The first three-axis spectrometer was
developed in 1961 by Brockhouse at Chalk River, Canada [71].
The instrument’s three axes correspond to the axes of rotation of the monochro-
mator, sample and analyzer (Fig. 3.5). While direction and magnitude of the
momentum of the incident beam are defined by the monochromator, the analyzer
determines direction and magnitude of the final beam. Depending on setup and de-
sired resolution properties (cf. 3.3.3), one chooses a fixed scattering sense geometry
for the three axes’ (in the direction of the incoming beam, right hand scattering
corresponds to a scattering sense of −1).
Apparently, for the measurement of a specific inelastic scan the corresponding
scattering triangle must close, which is not always the case. It is not possible to
lose more than the incident energy, the maximum momentum transfer is obtained
in backscattering geometry for φ = 180. If the final energy is significantly larger
3.3. NEUTRON SPECTROSCOPY 40
k i kf
k i kf
kfk i
kfk i
a)b)
c) d)
Q Q
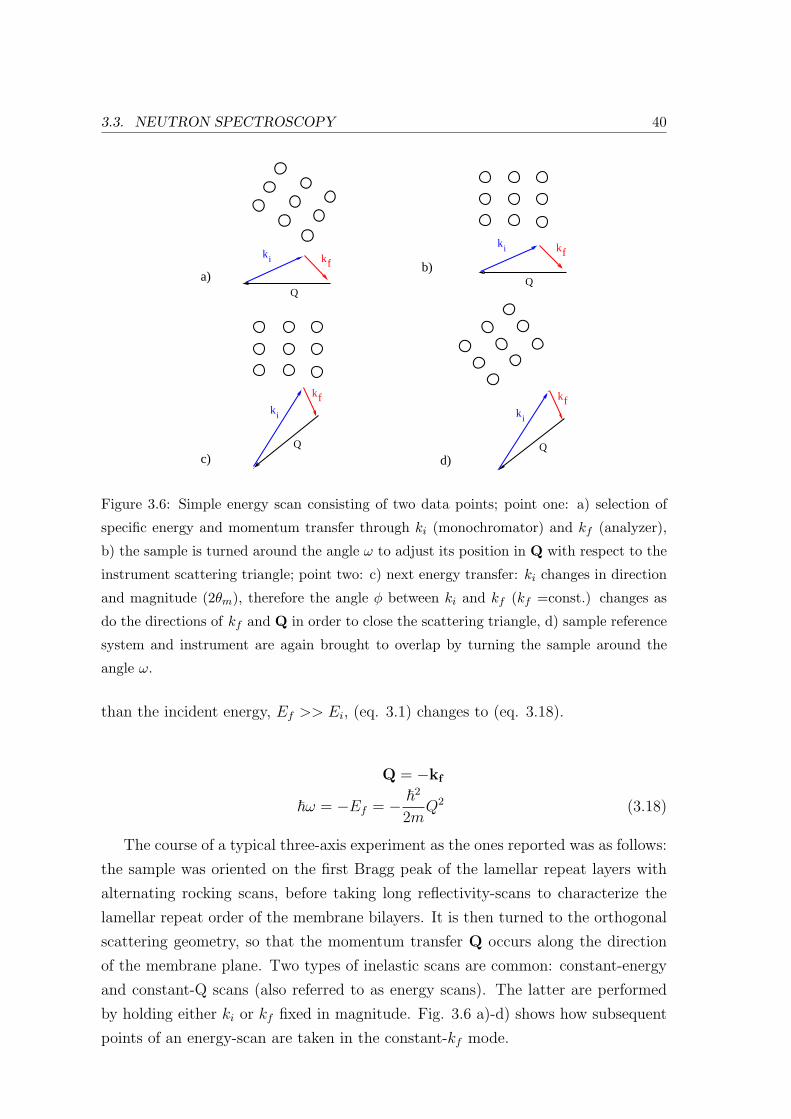
Figure 3.6: Simple energy scan consisting of two data points; point one: a) selection of
specific energy and momentum transfer through ki (monochromator) and kf (analyzer),
b) the sample is turned around the angle ω to adjust its position in Q with respect to the
instrument scattering triangle; point two: c) next energy transfer: ki changes in direction
and magnitude (2θm), therefore the angle φ between ki and kf (kf =const.) changes as
do the directions of kf and Q in order to close the scattering triangle, d) sample reference
system and instrument are again brought to overlap by turning the sample around the
angle ω.
than the incident energy, Ef >> Ei, (eq. 3.1) changes to (eq. 3.18).
Q = −kf
~ω = −Ef = − ~2
2mQ2 (3.18)
The course of a typical three-axis experiment as the ones reported was as follows:
the sample was oriented on the first Bragg peak of the lamellar repeat layers with
alternating rocking scans, before taking long reflectivity-scans to characterize the
lamellar repeat order of the membrane bilayers. It is then turned to the orthogonal
scattering geometry, so that the momentum transfer Q occurs along the direction
of the membrane plane. Two types of inelastic scans are common: constant-energy
and constant-Q scans (also referred to as energy scans). The latter are performed
by holding either ki or kf fixed in magnitude. Fig. 3.6 a)-d) shows how subsequent
points of an energy-scan are taken in the constant-kf mode.
3.3. NEUTRON SPECTROSCOPY 41
3.3.2 Instrumental Setup
Commonly used monochromators and analyzers consist of pyrolitic graphite (002)
crystals, the IN12 monochromator offers a variable vertical curvature for optimum
focussing. In the experiments described in this work slits were placed before and
after the sample, additional collimation of 30′was added before and after the slits,
respectively, and 60′
before the detector. No filter was used, the occurrence of
unwanted harmonic wavelengths in ki and kf was avoided by limiting the magnitude
of the energy transfer with respect to the incident neutron energy to ki/kf < 3/2.
The standard sample environment consisted of an aluminium chamber, in which
the temperature was controlled through a water bath and humidity was held constant
using saturated salt solutions. The flux on IN12 usually lies in the order of 107 n/cm2
s, on IN8 it is a tenfold larger. On IN12, the angular range of 2θm lies between
15 and 90, the angular range of 2θs lies between −120 and 120. On IN8, the
corresponding angular range of 2θm lies between 10 and 90, and for 2θs between 0
and 130. Although several multiplex detection systems (e.g. Flatcone, IMPS) were
in the construction and testing stages at the ILL at the time of writing, conventional3He line detectors recorded the scattered signal.
3.3.3 Influence of Instrumental Resolution
The intensity I(Qr,ω) measured on a three-axis spectrometer consists of a convolu-
tion of the inelastic structure factor S(Qr,ω), which characterizes the properties of
the sample, with the instrumental resolution function R(Qr,ω). We will see in the
following, that R(Qr,ω) shows significant changes throughout the four-dimensional
(Q,ω)-space probed by the instrument.
As explained in section 3.3.1, two types of inelastic scans are common: constant-
energy scans S(Qr,ω=const.), and constant-Q scans S(Qr=const.,ω), also referred
to as energy-scans. For liquids the peaks corresponding to inelastic excitations are
naturally broad and have small amplitudes compared to other contributions to the
inelastic signal due to damping (cf. 3.2.3). The choice of the scan-type taken in a
specific (Qr,ω)-regime is one of the features that contribute to a resolution optimized
measurement of an excitation. Another is placing the longest axis of the so-called
resolution ellipsoid R(ω0+∆ω,Q0+∆Q) along the gradient of the dispersion surface
in the direction of the scan as is shown in Fig. 3.7.
Since the early development of instrumental neutron scattering techniques in
the late 1940’s, continuous effort has been made to describe the corresponding res-
olution properties theoretically. For three-circle single-crystal as well as powder
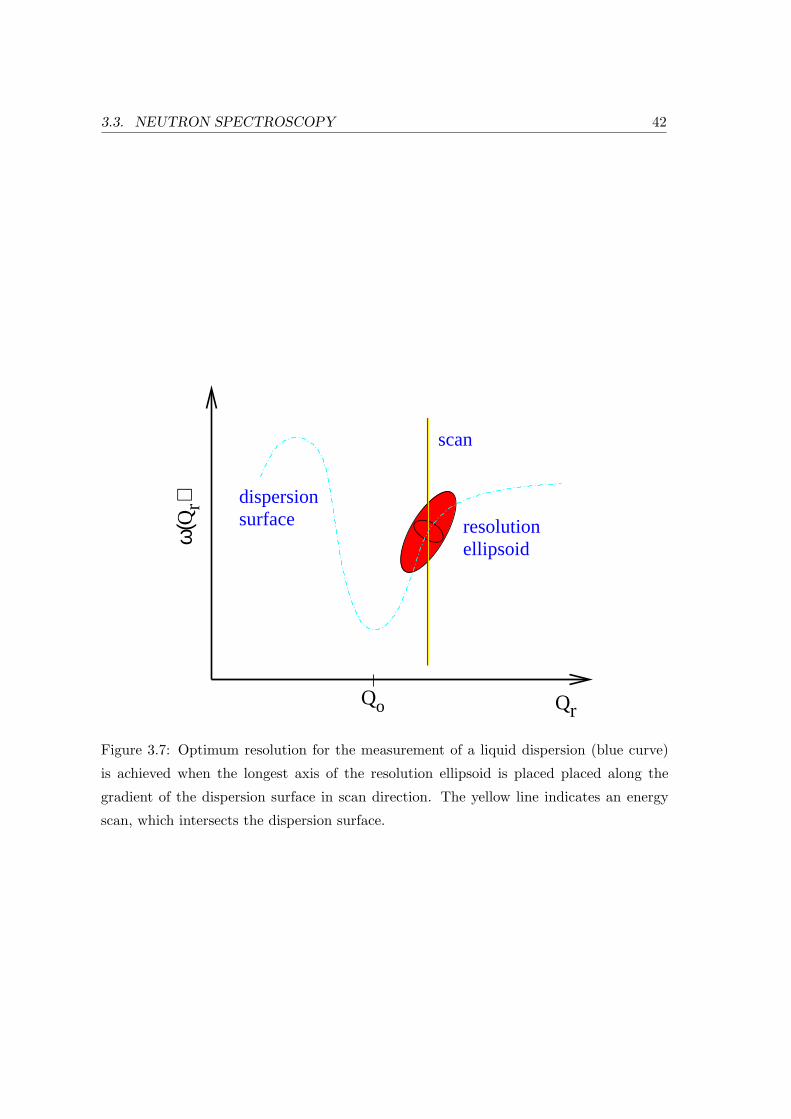
3.3. NEUTRON SPECTROSCOPY 42
QrQo
Qr
ω(
) dispersionsurface
scan
resolution ellipsoid
Figure 3.7: Optimum resolution for the measurement of a liquid dispersion (blue curve)
is achieved when the longest axis of the resolution ellipsoid is placed placed along the
gradient of the dispersion surface in scan direction. The yellow line indicates an energy
scan, which intersects the dispersion surface.
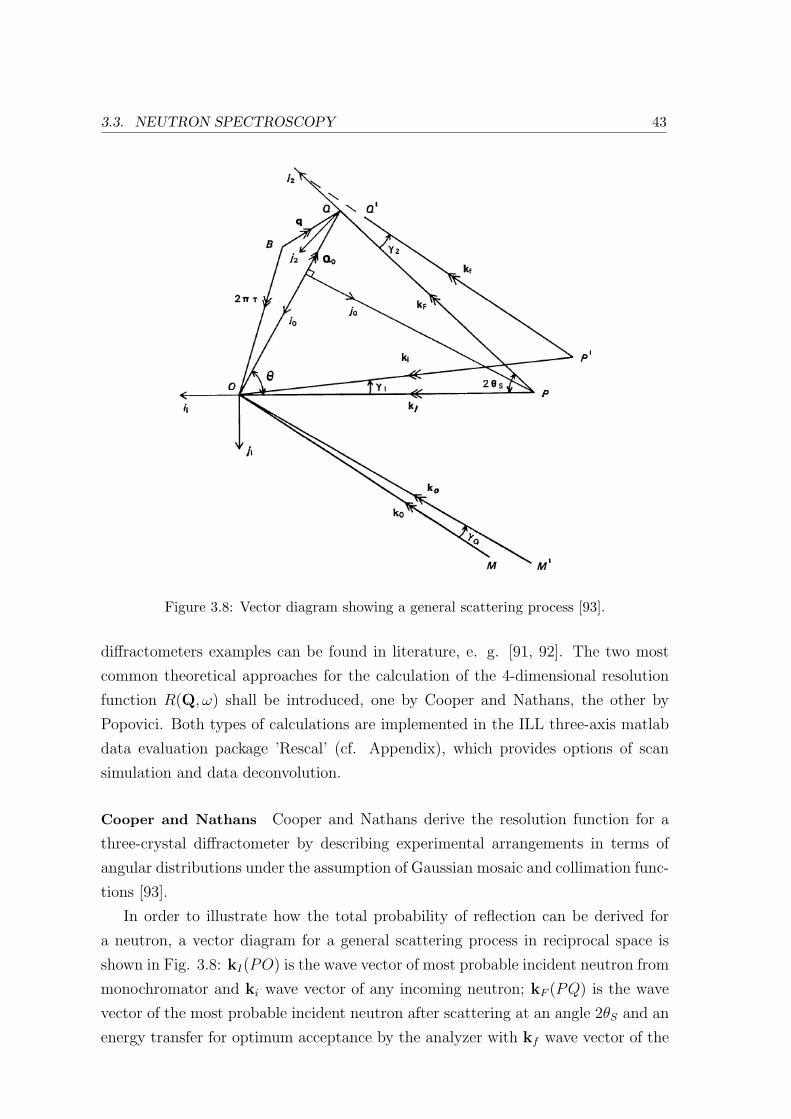
3.3. NEUTRON SPECTROSCOPY 43
Figure 3.8: Vector diagram showing a general scattering process [93].
diffractometers examples can be found in literature, e. g. [91, 92]. The two most
common theoretical approaches for the calculation of the 4-dimensional resolution
function R(Q, ω) shall be introduced, one by Cooper and Nathans, the other by
Popovici. Both types of calculations are implemented in the ILL three-axis matlab
data evaluation package ’Rescal’ (cf. Appendix), which provides options of scan
simulation and data deconvolution.
Cooper and Nathans Cooper and Nathans derive the resolution function for a
three-crystal diffractometer by describing experimental arrangements in terms of
angular distributions under the assumption of Gaussian mosaic and collimation func-
tions [93].
In order to illustrate how the total probability of reflection can be derived for
a neutron, a vector diagram for a general scattering process in reciprocal space is
shown in Fig. 3.8: kI(PO) is the wave vector of most probable incident neutron from
monochromator and ki wave vector of any incoming neutron; kF (PQ) is the wave
vector of the most probable incident neutron after scattering at an angle 2θS and an
energy transfer for optimum acceptance by the analyzer with kf wave vector of the
3.3. NEUTRON SPECTROSCOPY 44
corresponding neutron. Therefore one can define ∆ki = ki−kI and ∆kf = kf −kF ,
as well as the horizontal and vertical divergence angles γi and δi (for i = 0, 1, 2, 3).
The authors express the total probability of reflection of the neutron under the
assumption of optimum crystal reflectivities at the monochromator (PM) and ana-
lyzer (PA), respectively, as well as the corresponding Gaussian mosaic spreads ηM
and ηA [93].
In reciprocal space (ω,Q), an inelastic scattering process is associated with a neu-
tron’s loss/gain of energy for a specific momentum transfer, ~Q, thereby defining a
specific point(ω0,Q0). The resolution function of the instrument is then the proba-
bility of detection of the neutron as a function of ∆ω and ∆Q, when the instrument
has been set to measure a scattering process corresponding to the point (ω0,Q0).
The value of the resolution function at a given point in (ω,Q)-space is obtained by
integrating the probability over all possible paths (ki,kf ) to that point:
R(ω,Q) =
∫P (ω,Q)dkidkf (3.19)
After transforming the integration variables into (ω,Q)-space the resolution function
can be expressed in the form of a 4-dimensional ellipsoidal [93]:
R(ω0 + ∆ω,Q0 + ∆Q) = R0 · exp−1
2
4∑
k=1
4∑
l=1
MklXkXl︸ ︷︷ ︸
:=p
(3.20)
In this equation (eq. 3.20) the variables are denoted as follows: X1 = ∆Qx, X2 =
∆Qy, X3 = ∆Qz, X4 = ∆ω and R0 = R(ω0, Q0) is the optimum value of the
resolution function. R0 and Mkl are involved functions of kI , ω0 and Q0, as well
as the intrinsic properties of the collimators, the monochromator and analyzer. A
convenient visualization of the resolution function is an ellipsoid with a specifically
defined constant probability p, for which the resolution equals exactly 50% of R0.
The intensity observed in an experiment can now be expressed for a given scat-
tering cross section σ:
I(ω0,Q0) =
∫R(ω0 + ∆ω,Q0 + ∆Q) · σ(ω0 + ∆ω,Q0 + ∆Q)∆Q∆ω (3.21)
Up to this point, we have focussed on the resolution function in relation to
the energy lost by the neutron as a function of momentum transfer Q, namely
the scattering cross section as the dispersion surface ω(q) and the momentum of
the created phonon −~q (q denotes a vector in Q-space from the Bragg point of
3.3. NEUTRON SPECTROSCOPY 45
interest). It is convention to plot ω(q) positive for phonon creation (energy loss)
and negative for phonon annihilation (energy gain).
Germanium crystals are commonly used as a reference system to compare with
instrumental resolution, since its dispersive behavior has been well established in the
past 50 years, e. g. [94, 95]. This is the case for two reasons: On the one hand the
crystal has a simple well-known lattice structure. On the other hand it consists of
two atoms per unit cell and therefore exhibits optical as well as acoustic vibrations.
It can be shown that the experimental resolution function obtained from mea-
surements with a perfect single-crystal of germanium has the form predicted by the
analytic expression [93]. Therefore a direct comparison with the instrumental pa-
rameters is possible as well as a theoretical derivation of the resolution function at
any point in (ω,Q)-space.
The most common type of focussing is the so-called ’gradient focussing’ which is
applied when the orientation of the ellipsoid is given in a manner that the longest
principal axis is aligned in the dispersion surface. The asymmmetry of the cuts
through the ellipsoid evokes pronounced focussing or defocussing effects. A focussing
position for energy loss corresponds to a defocussing position for energy gain and
vice versa.
Optimum resolved scans are therefore obtained on the one hand through selec-
tion of defined points in reciprocal space where a specific phonon can be measured,
on the other hand through the choice of the instrumental parameters, such as for
example the material of monochromator (dM) and analyzer (dA) or the scattering
sense configuration.
Popovici Popovici formulates the resolution function for a three-axis spectrometer,
not only taking into account the angular transmission function described above,
but also the spatial configuration of the experimental set-up and the curvature of
the monochromator and analyzer crystals [96]. Instead of the angular variables
used before, now the initial variables are the coordinates ri of the points where the
neutrons are emitted from the source (r0), reflected in the monochromator (r1),
scattered in the sample (r2), reflected again in the analyzer (r3) and finally detected
(r4) (see Fig. 3.9). The axes y1, x2 and y3 are directed along the bisectors of
the corresponding scattering angles 2θi, the distances between the origins of the
corresponding reference systems are denoted by Li (i = 0, 1, 2, 3).
The shape of the crystals and the sample is described by probability distributions
pi(ri) in the normal approximation. Popovici shows that, when spatial effects are
included, the covariance matrix of the probability distribution changes significantly

3.3. NEUTRON SPECTROSCOPY 46
Figure 3.9: Geometry of a neutron scattering experiment with the coordinate systems used
in computations indicated. All scattering angles are shown in the positive sense [96].
in comparison to the previously introduced formalism by Cooper and Nathans: the
finite sample dimensions introduce a coupling between the monochromator and the
analyzer units which is stronger the smaller their mosaic spread [96]. Except for
very small samples it is no longer possible to express P (ki,kf ) as a product of two
independent transmission functions. The new expression derived for the resolution
matrix takes into account the absolute intensity dependence on the distances Li, the
dimensions and shape of the crystals and sample as well as the exposed areas of the
neutron source and detector and the divergence of the Soller collimators if included.
3.3.4 Data Treatment of Inelastic Energy-Scans
Absorption Correction: In all of the presented experiments inelastic energy scans
were performed in constant kf mode. The non-cylindrical geometry of the sample
used causes absorption that needs to be corrected for scans with ∆ω 6= 0. Only for
elastic scans with ∆ω = 0 it is positioned in the geometrical middle of the angle
between ki and kf (Fig. 3.10, a)). For inelastic scans, however, it continuously
changes position with respect to ki and kf (Fig. 3.10, b) and c)), which has to be
taken into account in order to obtain intensity balanced of data.
The absorption α can be described through an analytic expression as a superpo-
sition of the absorption occurring with respect to ki (dominant for ∆ω < 0) and the
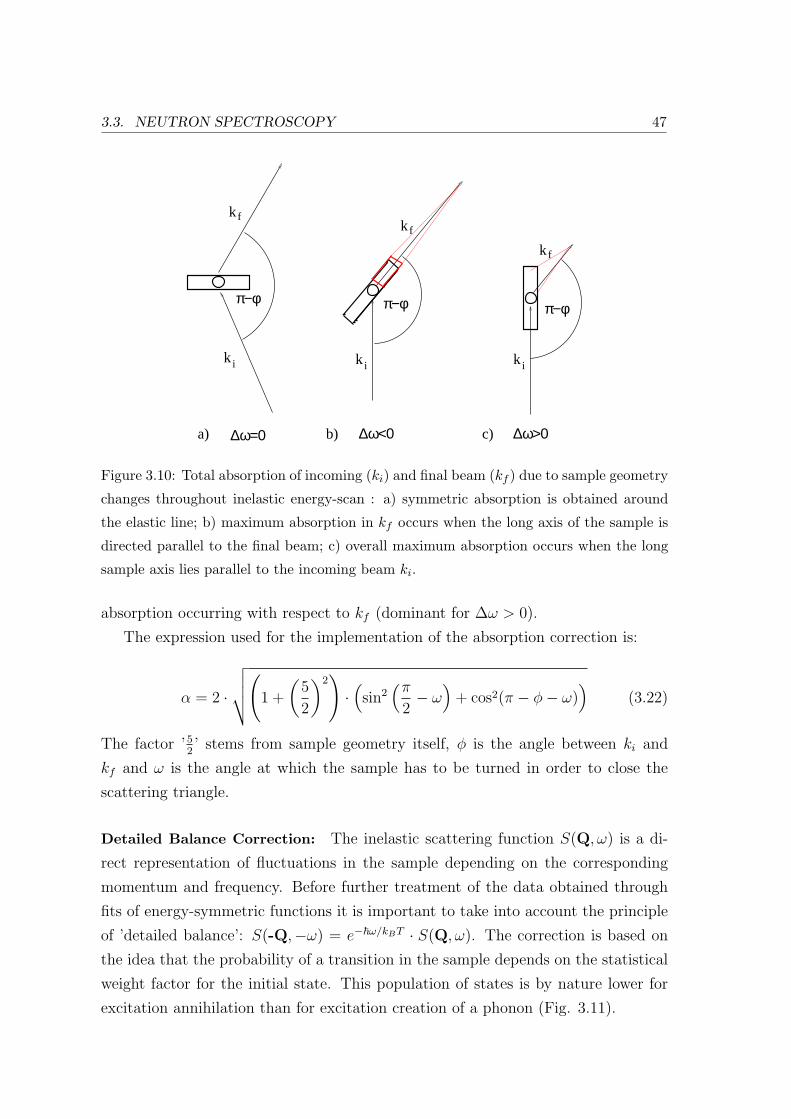
3.3. NEUTRON SPECTROSCOPY 47
k i
k f
k f
k ik i
k f
π−φ
∆ω=0
π−φπ−φ
∆ω<0 ∆ω>0c)b)a)
Figure 3.10: Total absorption of incoming (ki) and final beam (kf ) due to sample geometry
changes throughout inelastic energy-scan : a) symmetric absorption is obtained around
the elastic line; b) maximum absorption in kf occurs when the long axis of the sample is
directed parallel to the final beam; c) overall maximum absorption occurs when the long
sample axis lies parallel to the incoming beam ki.
absorption occurring with respect to kf (dominant for ∆ω > 0).
The expression used for the implementation of the absorption correction is:
α = 2 ·√√√√
(1 +
(5
2
)2)·(sin2
(π
2− ω
)+ cos2(π − φ− ω)
)(3.22)
The factor ’52’ stems from sample geometry itself, φ is the angle between ki and
kf and ω is the angle at which the sample has to be turned in order to close the
scattering triangle.
Detailed Balance Correction: The inelastic scattering function S(Q, ω) is a di-
rect representation of fluctuations in the sample depending on the corresponding
momentum and frequency. Before further treatment of the data obtained through
fits of energy-symmetric functions it is important to take into account the principle
of ’detailed balance’: S(-Q,−ω) = e−~ω/kBT · S(Q, ω). The correction is based on
the idea that the probability of a transition in the sample depends on the statistical
weight factor for the initial state. This population of states is by nature lower for
excitation annihilation than for excitation creation of a phonon (Fig. 3.11).
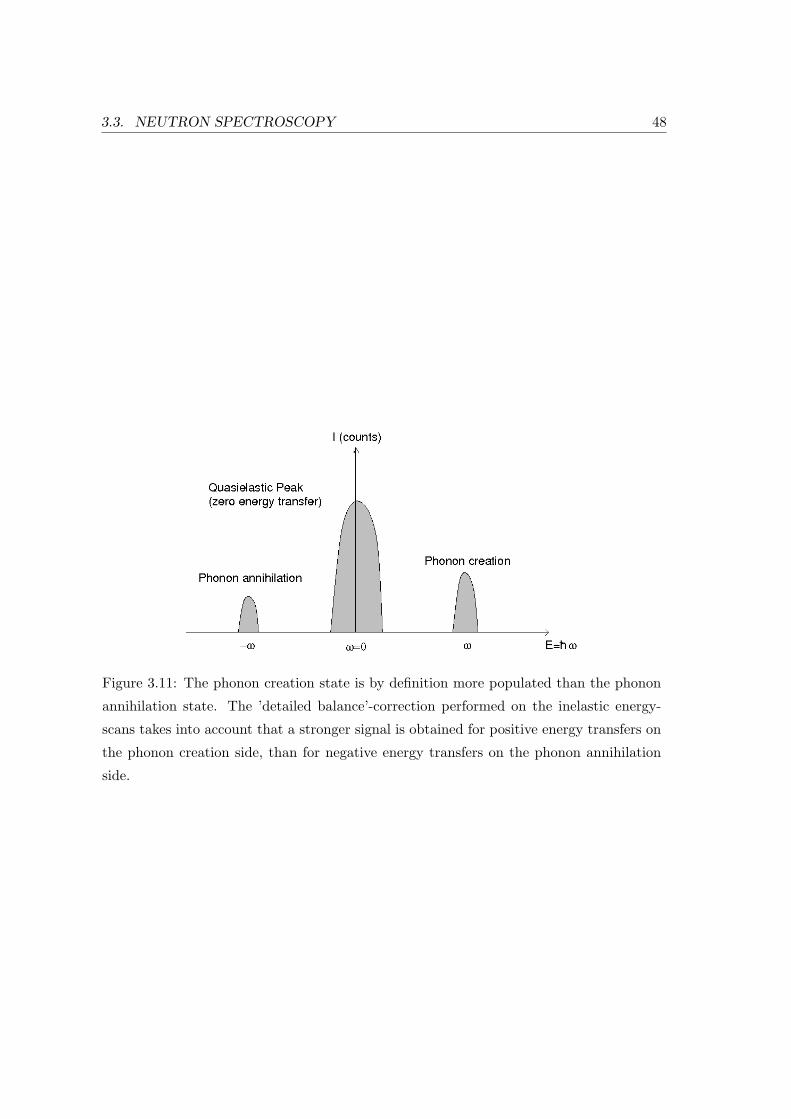
3.3. NEUTRON SPECTROSCOPY 48
Figure 3.11: The phonon creation state is by definition more populated than the phonon
annihilation state. The ’detailed balance’-correction performed on the inelastic energy-
scans takes into account that a stronger signal is obtained for positive energy transfers on
the phonon creation side, than for negative energy transfers on the phonon annihilation
side.
Chapter 4
Single Component Model
Membrane: DSPC-d70
The collective in-plane density fluctuations of a model membrane such as DSPC-
d70 in comparison with the previously studied DMPC-d54 [8, 97] are interesting for
different reasons: A possible connection between the ’critical swelling’ that accom-
panies the main phase transition in several phospholipids such as DMPC, but not
DSPC, [25, 26], and the observation of a typical liquid dispersion curve is investi-
gated. Differences in the bilayer ordering and corresponding in-plane packing of the
lipid molecules are observed by x-ray and complementary neutron diffraction and
give an indication for the changes in the in-plane density distribution of the lipid acyl
chains. These can be linked to possible variations in the modulation of propagating
sonic waves, which are the origin of the collective in-plane density fluctuations.
4.1 X-ray Diffraction: Structural Phase Characterization
For extensive structural characterization of model membrane systems prior to an
inelastic neutron scattering experiment the IRP inhouse diffractometers are well
suited, complementing the diffraction results obtained from a neutron three-axis
spectrometer. For the x-ray experiments solutions of multilamellar vesicles (MLV’s)
were chosen as samples. Since the oriented multilayer samples used in the neutron
experiments are immersed in heavy water vapor and their lamellar repeat spacing Dz
depends on humidity [98], reference values for full hydration of the derived structural
quantities were obtained from x-ray diffraction.
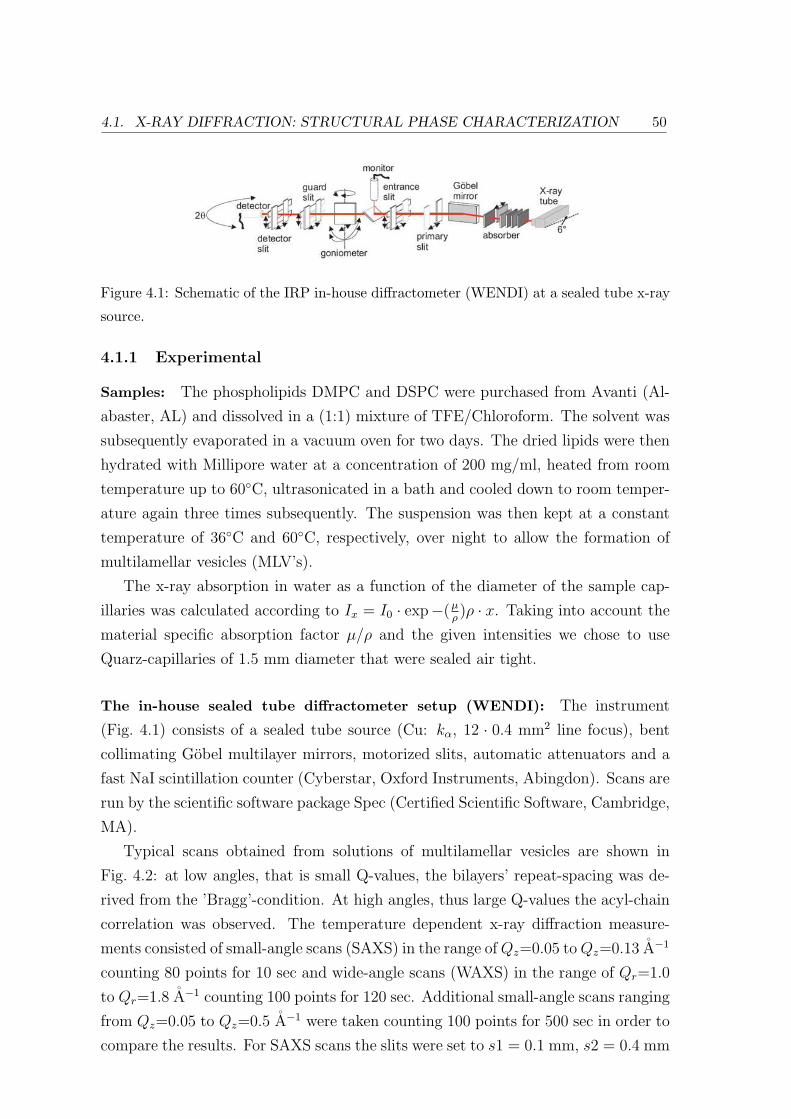
4.1. X-RAY DIFFRACTION: STRUCTURAL PHASE CHARACTERIZATION 50
Figure 4.1: Schematic of the IRP in-house diffractometer (WENDI) at a sealed tube x-ray
source.
4.1.1 Experimental
Samples: The phospholipids DMPC and DSPC were purchased from Avanti (Al-
abaster, AL) and dissolved in a (1:1) mixture of TFE/Chloroform. The solvent was
subsequently evaporated in a vacuum oven for two days. The dried lipids were then
hydrated with Millipore water at a concentration of 200 mg/ml, heated from room
temperature up to 60C, ultrasonicated in a bath and cooled down to room temper-
ature again three times subsequently. The suspension was then kept at a constant
temperature of 36C and 60C, respectively, over night to allow the formation of
multilamellar vesicles (MLV’s).
The x-ray absorption in water as a function of the diameter of the sample cap-
illaries was calculated according to Ix = I0 · exp−(µρ)ρ · x. Taking into account the
material specific absorption factor µ/ρ and the given intensities we chose to use
Quarz-capillaries of 1.5 mm diameter that were sealed air tight.
The in-house sealed tube diffractometer setup (WENDI): The instrument
(Fig. 4.1) consists of a sealed tube source (Cu: kα, 12 · 0.4 mm2 line focus), bent
collimating Gobel multilayer mirrors, motorized slits, automatic attenuators and a
fast NaI scintillation counter (Cyberstar, Oxford Instruments, Abingdon). Scans are
run by the scientific software package Spec (Certified Scientific Software, Cambridge,
MA).
Typical scans obtained from solutions of multilamellar vesicles are shown in
Fig. 4.2: at low angles, that is small Q-values, the bilayers’ repeat-spacing was de-
rived from the ’Bragg’-condition. At high angles, thus large Q-values the acyl-chain
correlation was observed. The temperature dependent x-ray diffraction measure-
ments consisted of small-angle scans (SAXS) in the range of Qz=0.05 to Qz=0.13 A−1
counting 80 points for 10 sec and wide-angle scans (WAXS) in the range of Qr=1.0
to Qr=1.8 A−1 counting 100 points for 120 sec. Additional small-angle scans ranging
from Qz=0.05 to Qz=0.5 A−1 were taken counting 100 points for 500 sec in order to
compare the results. For SAXS scans the slits were set to s1 = 0.1 mm, s2 = 0.4 mm
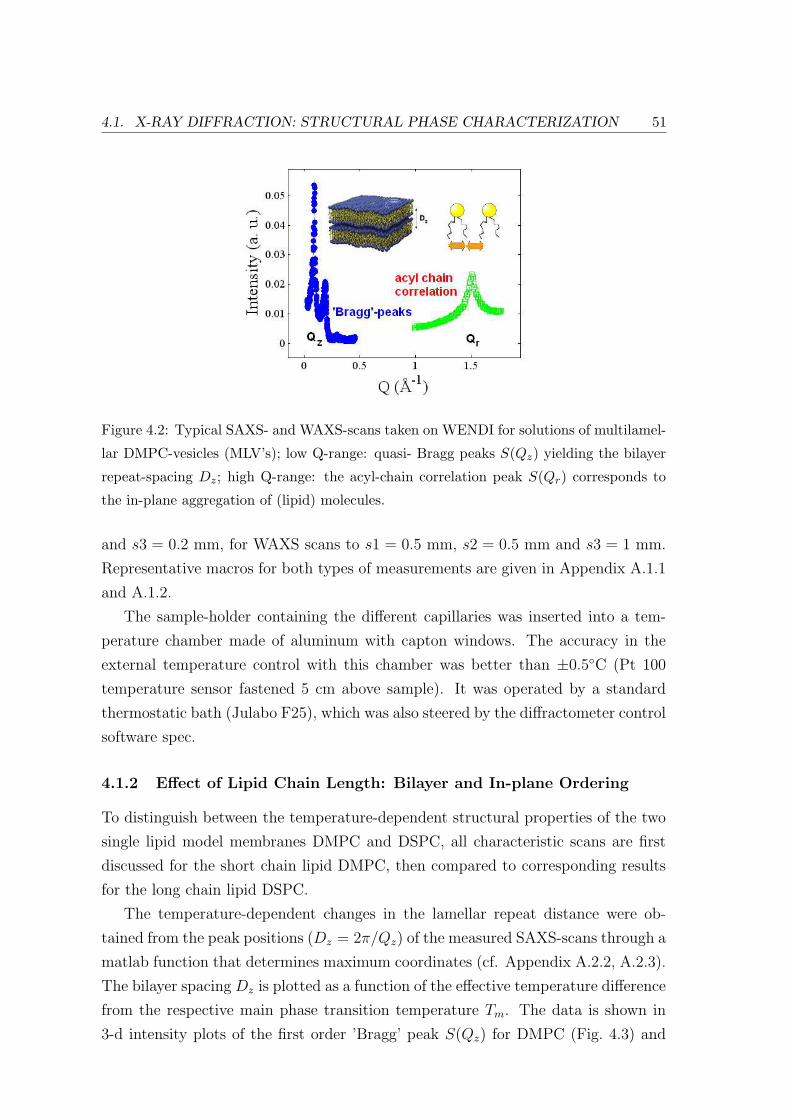
4.1. X-RAY DIFFRACTION: STRUCTURAL PHASE CHARACTERIZATION 51
Figure 4.2: Typical SAXS- and WAXS-scans taken on WENDI for solutions of multilamel-
lar DMPC-vesicles (MLV’s); low Q-range: quasi- Bragg peaks S(Qz) yielding the bilayer
repeat-spacing Dz; high Q-range: the acyl-chain correlation peak S(Qr) corresponds to
the in-plane aggregation of (lipid) molecules.
and s3 = 0.2 mm, for WAXS scans to s1 = 0.5 mm, s2 = 0.5 mm and s3 = 1 mm.
Representative macros for both types of measurements are given in Appendix A.1.1
and A.1.2.
The sample-holder containing the different capillaries was inserted into a tem-
perature chamber made of aluminum with capton windows. The accuracy in the
external temperature control with this chamber was better than ±0.5C (Pt 100
temperature sensor fastened 5 cm above sample). It was operated by a standard
thermostatic bath (Julabo F25), which was also steered by the diffractometer control
software spec.
4.1.2 Effect of Lipid Chain Length: Bilayer and In-plane Ordering
To distinguish between the temperature-dependent structural properties of the two
single lipid model membranes DMPC and DSPC, all characteristic scans are first
discussed for the short chain lipid DMPC, then compared to corresponding results
for the long chain lipid DSPC.
The temperature-dependent changes in the lamellar repeat distance were ob-
tained from the peak positions (Dz = 2π/Qz) of the measured SAXS-scans through a
matlab function that determines maximum coordinates (cf. Appendix A.2.2, A.2.3).
The bilayer spacing Dz is plotted as a function of the effective temperature difference
from the respective main phase transition temperature Tm. The data is shown in
3-d intensity plots of the first order ’Bragg’ peak S(Qz) for DMPC (Fig. 4.3) and
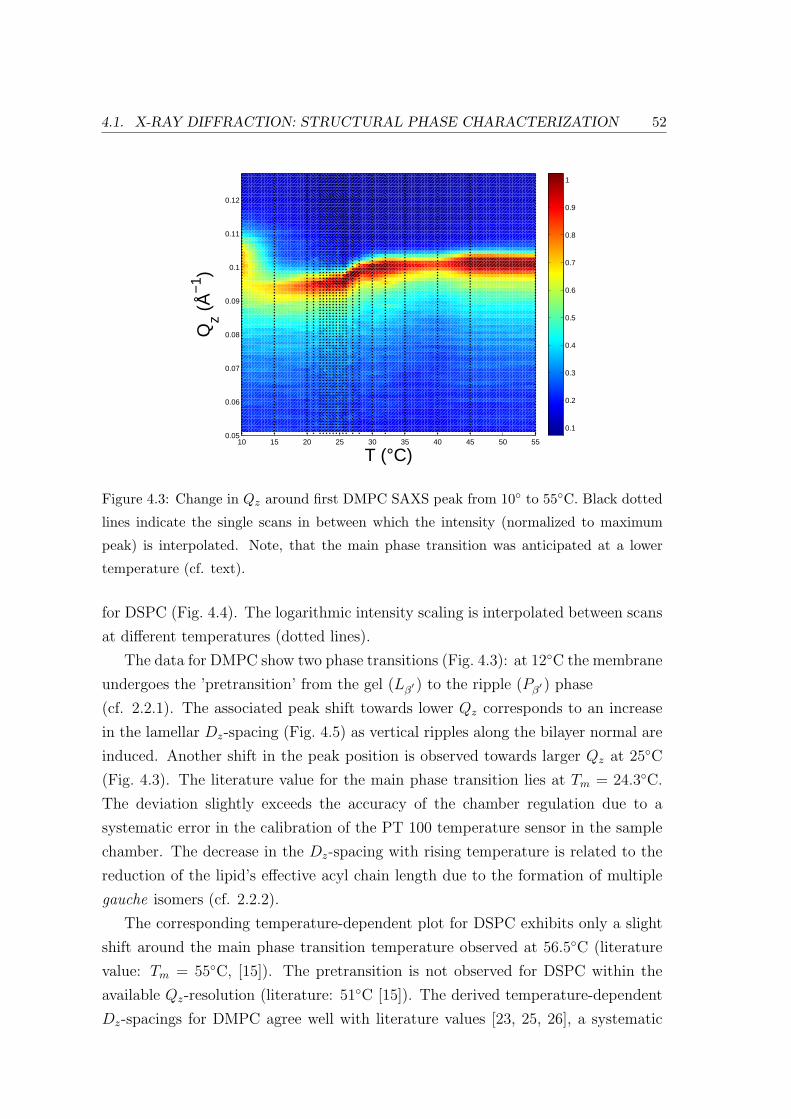
4.1. X-RAY DIFFRACTION: STRUCTURAL PHASE CHARACTERIZATION 52
10 15 20 25 30 35 40 45 50 550.05
0.06
0.07
0.08
0.09
0.1
0.11
0.12
T (°C)
Qz (
Å−
1 )
0.1
0.2
0.3
0.4
0.5
0.6
0.7
0.8
0.9
1
Figure 4.3: Change in Qz around first DMPC SAXS peak from 10 to 55C. Black dotted
lines indicate the single scans in between which the intensity (normalized to maximum
peak) is interpolated. Note, that the main phase transition was anticipated at a lower
temperature (cf. text).
for DSPC (Fig. 4.4). The logarithmic intensity scaling is interpolated between scans
at different temperatures (dotted lines).
The data for DMPC show two phase transitions (Fig. 4.3): at 12C the membrane
undergoes the ’pretransition’ from the gel (Lβ′ ) to the ripple (Pβ
′ ) phase
(cf. 2.2.1). The associated peak shift towards lower Qz corresponds to an increase
in the lamellar Dz-spacing (Fig. 4.5) as vertical ripples along the bilayer normal are
induced. Another shift in the peak position is observed towards larger Qz at 25C
(Fig. 4.3). The literature value for the main phase transition lies at Tm = 24.3C.
The deviation slightly exceeds the accuracy of the chamber regulation due to a
systematic error in the calibration of the PT 100 temperature sensor in the sample
chamber. The decrease in the Dz-spacing with rising temperature is related to the
reduction of the lipid’s effective acyl chain length due to the formation of multiple
gauche isomers (cf. 2.2.2).
The corresponding temperature-dependent plot for DSPC exhibits only a slight
shift around the main phase transition temperature observed at 56.5C (literature
value: Tm = 55C, [15]). The pretransition is not observed for DSPC within the
available Qz-resolution (literature: 51C [15]). The derived temperature-dependent
Dz-spacings for DMPC agree well with literature values [23, 25, 26], a systematic
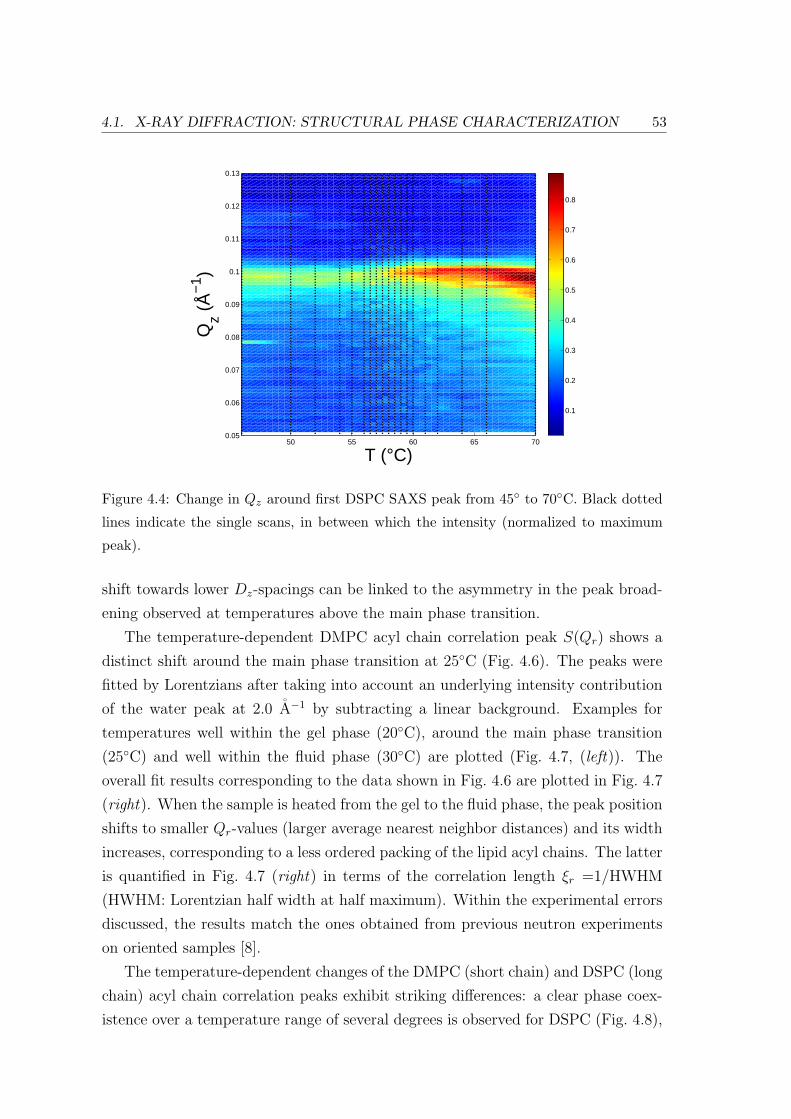
4.1. X-RAY DIFFRACTION: STRUCTURAL PHASE CHARACTERIZATION 53
50 55 60 65 700.05
0.06
0.07
0.08
0.09
0.1
0.11
0.12
0.13
T (°C)
Qz (
Å−
1 )
0.1
0.2
0.3
0.4
0.5
0.6
0.7
0.8
Figure 4.4: Change in Qz around first DSPC SAXS peak from 45 to 70C. Black dotted
lines indicate the single scans, in between which the intensity (normalized to maximum
peak).
shift towards lower Dz-spacings can be linked to the asymmetry in the peak broad-
ening observed at temperatures above the main phase transition.
The temperature-dependent DMPC acyl chain correlation peak S(Qr) shows a
distinct shift around the main phase transition at 25C (Fig. 4.6). The peaks were
fitted by Lorentzians after taking into account an underlying intensity contribution
of the water peak at 2.0 A−1 by subtracting a linear background. Examples for
temperatures well within the gel phase (20C), around the main phase transition
(25C) and well within the fluid phase (30C) are plotted (Fig. 4.7, (left)). The
overall fit results corresponding to the data shown in Fig. 4.6 are plotted in Fig. 4.7
(right). When the sample is heated from the gel to the fluid phase, the peak position
shifts to smaller Qr-values (larger average nearest neighbor distances) and its width
increases, corresponding to a less ordered packing of the lipid acyl chains. The latter
is quantified in Fig. 4.7 (right) in terms of the correlation length ξr =1/HWHM
(HWHM: Lorentzian half width at half maximum). Within the experimental errors
discussed, the results match the ones obtained from previous neutron experiments
on oriented samples [8].
The temperature-dependent changes of the DMPC (short chain) and DSPC (long
chain) acyl chain correlation peaks exhibit striking differences: a clear phase coex-
istence over a temperature range of several degrees is observed for DSPC (Fig. 4.8),
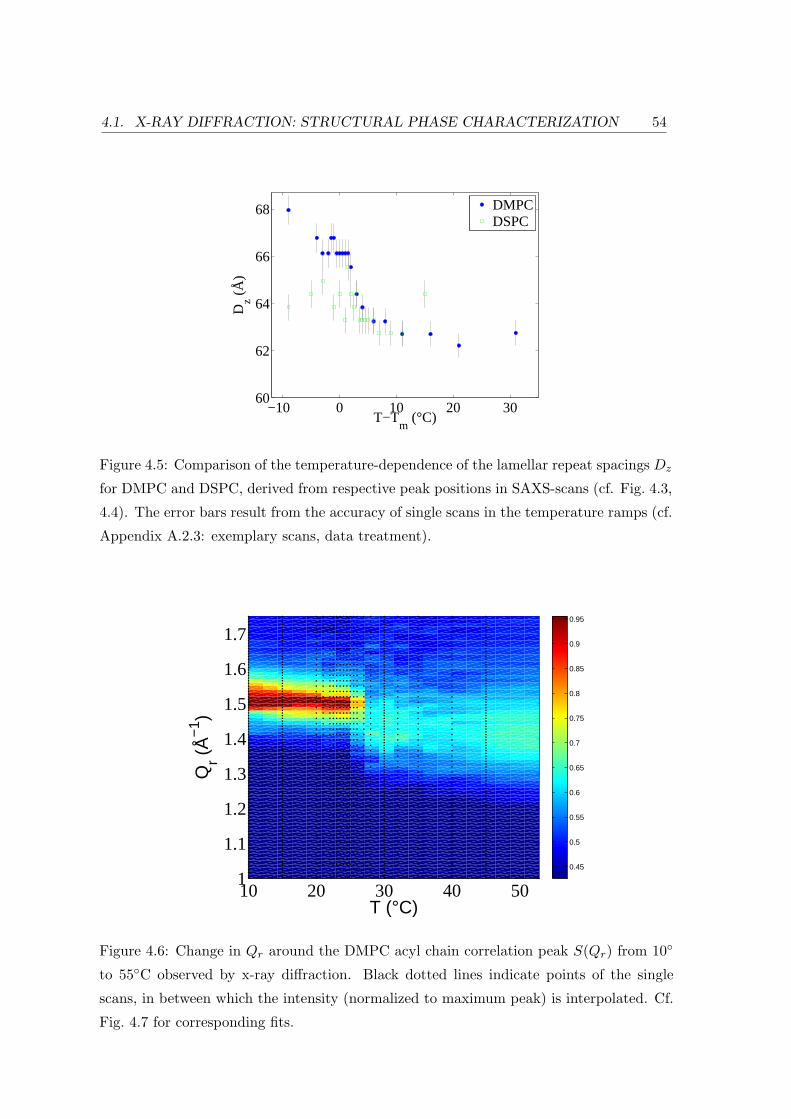
4.1. X-RAY DIFFRACTION: STRUCTURAL PHASE CHARACTERIZATION 54
−10 0 10 20 3060
62
64
66
68
T−Tm
(°C)
Dz (
Å)
DMPCDSPC
Figure 4.5: Comparison of the temperature-dependence of the lamellar repeat spacings Dz
for DMPC and DSPC, derived from respective peak positions in SAXS-scans (cf. Fig. 4.3,
4.4). The error bars result from the accuracy of single scans in the temperature ramps (cf.
Appendix A.2.3: exemplary scans, data treatment).
10 20 30 40 501
1.1
1.2
1.3
1.4
1.5
1.6
1.7
T (°C)
Qr (
Å−
1 )
0.45
0.5
0.55
0.6
0.65
0.7
0.75
0.8
0.85
0.9
0.95
Figure 4.6: Change in Qr around the DMPC acyl chain correlation peak S(Qr) from 10
to 55C observed by x-ray diffraction. Black dotted lines indicate points of the single
scans, in between which the intensity (normalized to maximum peak) is interpolated. Cf.
Fig. 4.7 for corresponding fits.
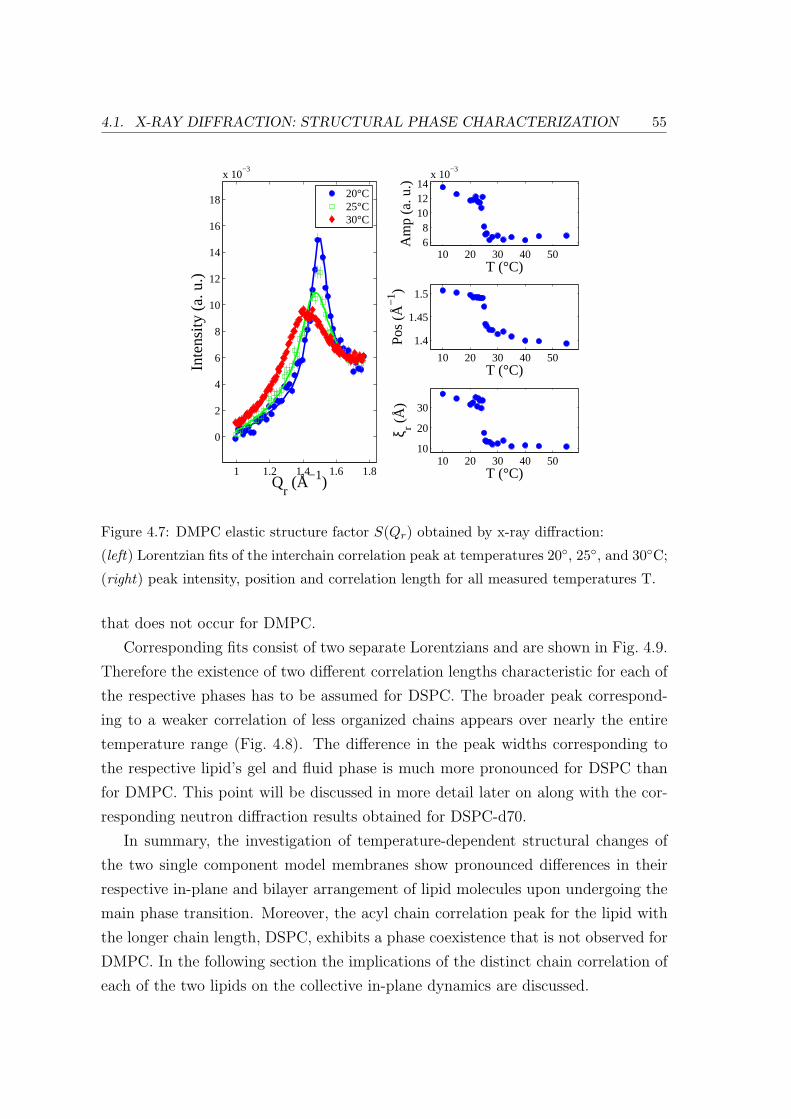
4.1. X-RAY DIFFRACTION: STRUCTURAL PHASE CHARACTERIZATION 55
1 1.2 1.4 1.6 1.8
0
2
4
6
8
10
12
14
16
18
x 10−3
Qr (Å−1)
Inte
nsity
(a.
u.)
20°C25°C30°C
10 20 30 40 5068
101214
x 10−3
T (°C)
Am
p (a
. u.)
10 20 30 40 50
1.4
1.45
1.5
T (°C)
Pos
(Å−
1 )
10 20 30 40 5010
20
30
T (°C)
ξ r (Å
)
Figure 4.7: DMPC elastic structure factor S(Qr) obtained by x-ray diffraction:
(left) Lorentzian fits of the interchain correlation peak at temperatures 20, 25, and 30C;
(right) peak intensity, position and correlation length for all measured temperatures T.
that does not occur for DMPC.
Corresponding fits consist of two separate Lorentzians and are shown in Fig. 4.9.
Therefore the existence of two different correlation lengths characteristic for each of
the respective phases has to be assumed for DSPC. The broader peak correspond-
ing to a weaker correlation of less organized chains appears over nearly the entire
temperature range (Fig. 4.8). The difference in the peak widths corresponding to
the respective lipid’s gel and fluid phase is much more pronounced for DSPC than
for DMPC. This point will be discussed in more detail later on along with the cor-
responding neutron diffraction results obtained for DSPC-d70.
In summary, the investigation of temperature-dependent structural changes of
the two single component model membranes show pronounced differences in their
respective in-plane and bilayer arrangement of lipid molecules upon undergoing the
main phase transition. Moreover, the acyl chain correlation peak for the lipid with
the longer chain length, DSPC, exhibits a phase coexistence that is not observed for
DMPC. In the following section the implications of the distinct chain correlation of
each of the two lipids on the collective in-plane dynamics are discussed.
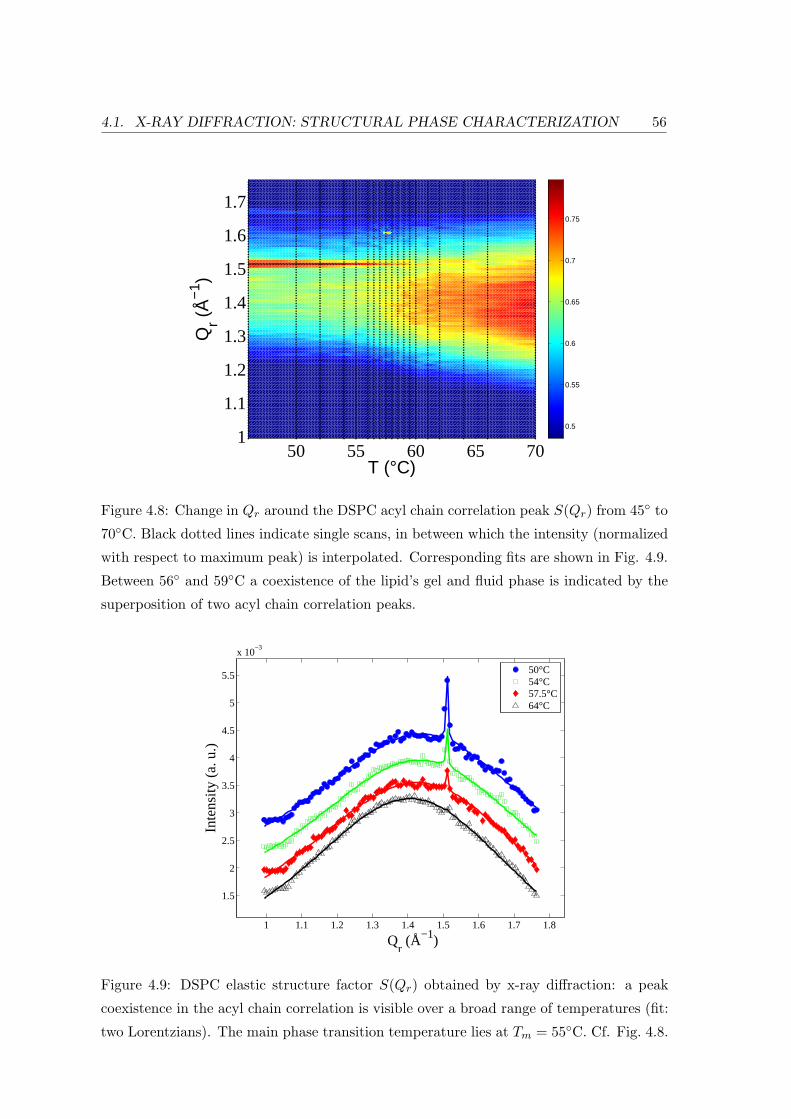
4.1. X-RAY DIFFRACTION: STRUCTURAL PHASE CHARACTERIZATION 56
50 55 60 65 701
1.1
1.2
1.3
1.4
1.5
1.6
1.7
T (°C)
Qr (
Å−
1 )
0.5
0.55
0.6
0.65
0.7
0.75
Figure 4.8: Change in Qr around the DSPC acyl chain correlation peak S(Qr) from 45 to
70C. Black dotted lines indicate single scans, in between which the intensity (normalized
with respect to maximum peak) is interpolated. Corresponding fits are shown in Fig. 4.9.
Between 56 and 59C a coexistence of the lipid’s gel and fluid phase is indicated by the
superposition of two acyl chain correlation peaks.
1 1.1 1.2 1.3 1.4 1.5 1.6 1.7 1.8
1.5
2
2.5
3
3.5
4
4.5
5
5.5
x 10−3
Qr (Å−1)
Inte
nsity
(a.
u.)
50°C54°C57.5°C64°C
Figure 4.9: DSPC elastic structure factor S(Qr) obtained by x-ray diffraction: a peak
coexistence in the acyl chain correlation is visible over a broad range of temperatures (fit:
two Lorentzians). The main phase transition temperature lies at Tm = 55C. Cf. Fig. 4.8.
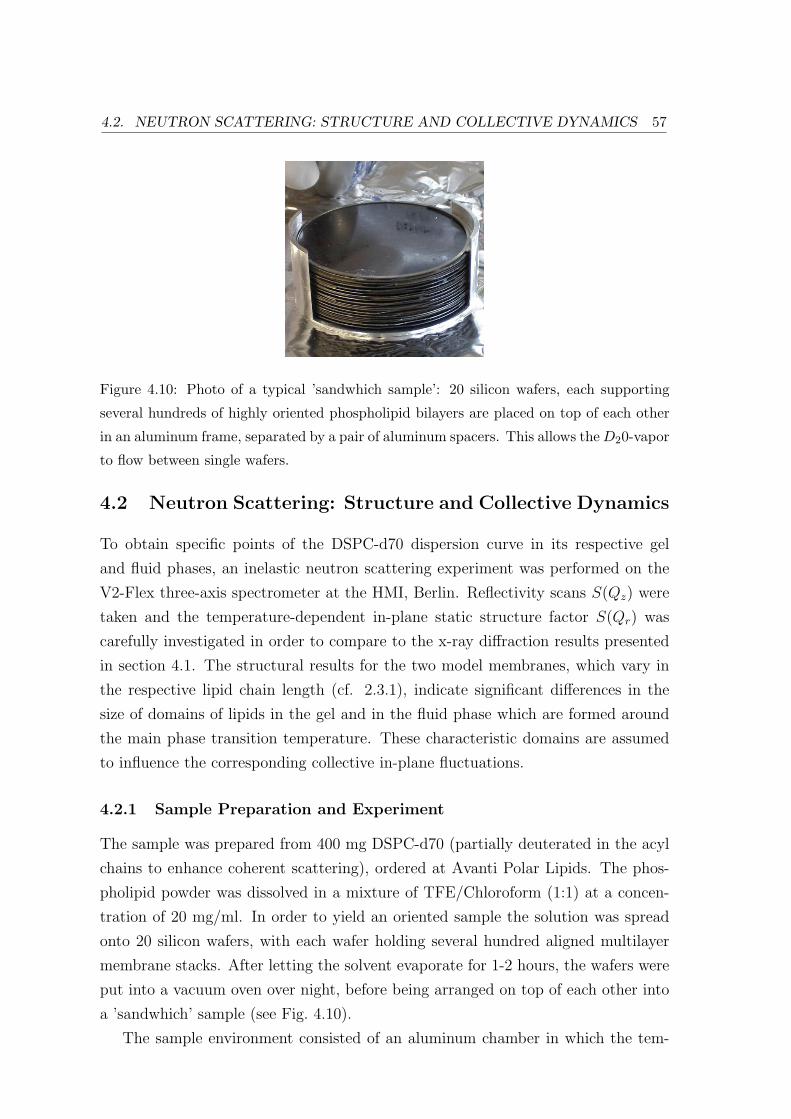
4.2. NEUTRON SCATTERING: STRUCTURE AND COLLECTIVE DYNAMICS 57
Figure 4.10: Photo of a typical ’sandwhich sample’: 20 silicon wafers, each supporting
several hundreds of highly oriented phospholipid bilayers are placed on top of each other
in an aluminum frame, separated by a pair of aluminum spacers. This allows the D20-vapor
to flow between single wafers.
4.2 Neutron Scattering: Structure and Collective Dynamics
To obtain specific points of the DSPC-d70 dispersion curve in its respective gel
and fluid phases, an inelastic neutron scattering experiment was performed on the
V2-Flex three-axis spectrometer at the HMI, Berlin. Reflectivity scans S(Qz) were
taken and the temperature-dependent in-plane static structure factor S(Qr) was
carefully investigated in order to compare to the x-ray diffraction results presented
in section 4.1. The structural results for the two model membranes, which vary in
the respective lipid chain length (cf. 2.3.1), indicate significant differences in the
size of domains of lipids in the gel and in the fluid phase which are formed around
the main phase transition temperature. These characteristic domains are assumed
to influence the corresponding collective in-plane fluctuations.
4.2.1 Sample Preparation and Experiment
The sample was prepared from 400 mg DSPC-d70 (partially deuterated in the acyl
chains to enhance coherent scattering), ordered at Avanti Polar Lipids. The phos-
pholipid powder was dissolved in a mixture of TFE/Chloroform (1:1) at a concen-
tration of 20 mg/ml. In order to yield an oriented sample the solution was spread
onto 20 silicon wafers, with each wafer holding several hundred aligned multilayer
membrane stacks. After letting the solvent evaporate for 1-2 hours, the wafers were
put into a vacuum oven over night, before being arranged on top of each other into
a ’sandwhich’ sample (see Fig. 4.10).
The sample environment consisted of an aluminum chamber in which the tem-
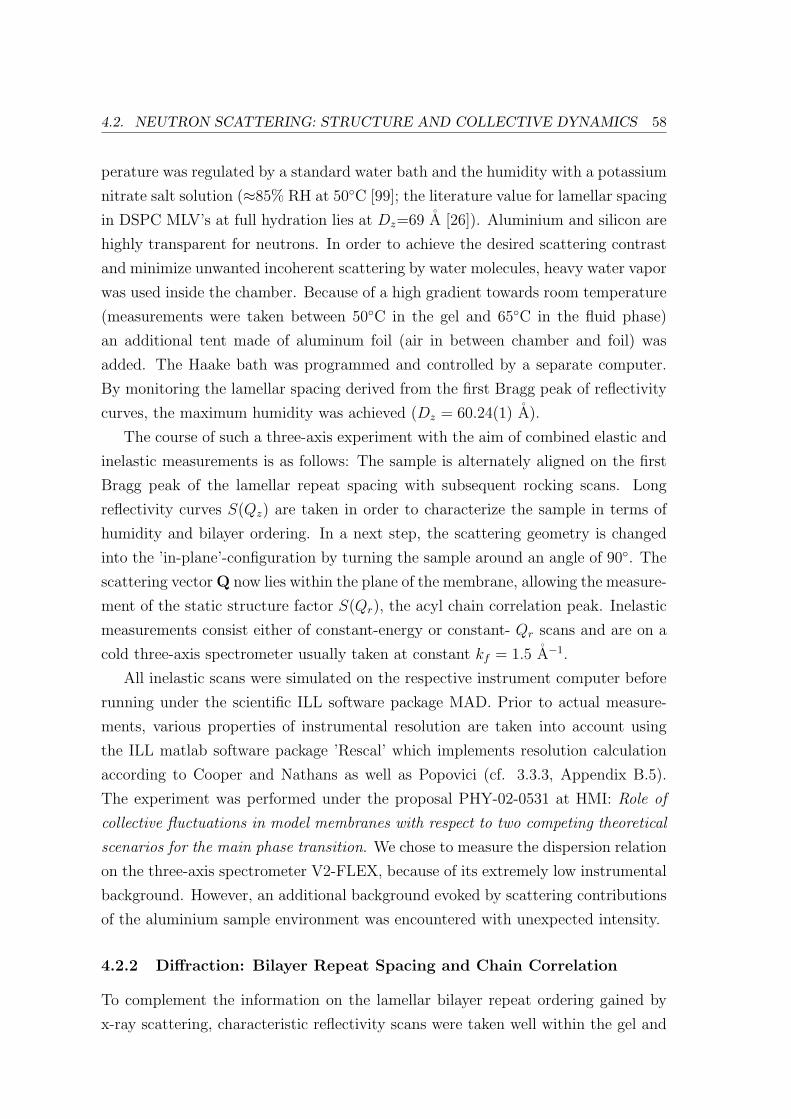
4.2. NEUTRON SCATTERING: STRUCTURE AND COLLECTIVE DYNAMICS 58
perature was regulated by a standard water bath and the humidity with a potassium
nitrate salt solution (≈85% RH at 50C [99]; the literature value for lamellar spacing
in DSPC MLV’s at full hydration lies at Dz=69 A [26]). Aluminium and silicon are
highly transparent for neutrons. In order to achieve the desired scattering contrast
and minimize unwanted incoherent scattering by water molecules, heavy water vapor
was used inside the chamber. Because of a high gradient towards room temperature
(measurements were taken between 50C in the gel and 65C in the fluid phase)
an additional tent made of aluminum foil (air in between chamber and foil) was
added. The Haake bath was programmed and controlled by a separate computer.
By monitoring the lamellar spacing derived from the first Bragg peak of reflectivity
curves, the maximum humidity was achieved (Dz = 60.24(1) A).
The course of such a three-axis experiment with the aim of combined elastic and
inelastic measurements is as follows: The sample is alternately aligned on the first
Bragg peak of the lamellar repeat spacing with subsequent rocking scans. Long
reflectivity curves S(Qz) are taken in order to characterize the sample in terms of
humidity and bilayer ordering. In a next step, the scattering geometry is changed
into the ’in-plane’-configuration by turning the sample around an angle of 90. The
scattering vector Q now lies within the plane of the membrane, allowing the measure-
ment of the static structure factor S(Qr), the acyl chain correlation peak. Inelastic
measurements consist either of constant-energy or constant- Qr scans and are on a
cold three-axis spectrometer usually taken at constant kf = 1.5 A−1.
All inelastic scans were simulated on the respective instrument computer before
running under the scientific ILL software package MAD. Prior to actual measure-
ments, various properties of instrumental resolution are taken into account using
the ILL matlab software package ’Rescal’ which implements resolution calculation
according to Cooper and Nathans as well as Popovici (cf. 3.3.3, Appendix B.5).
The experiment was performed under the proposal PHY-02-0531 at HMI: Role of
collective fluctuations in model membranes with respect to two competing theoretical
scenarios for the main phase transition. We chose to measure the dispersion relation
on the three-axis spectrometer V2-FLEX, because of its extremely low instrumental
background. However, an additional background evoked by scattering contributions
of the aluminium sample environment was encountered with unexpected intensity.
4.2.2 Diffraction: Bilayer Repeat Spacing and Chain Correlation
To complement the information on the lamellar bilayer repeat ordering gained by
x-ray scattering, characteristic reflectivity scans were taken well within the gel and
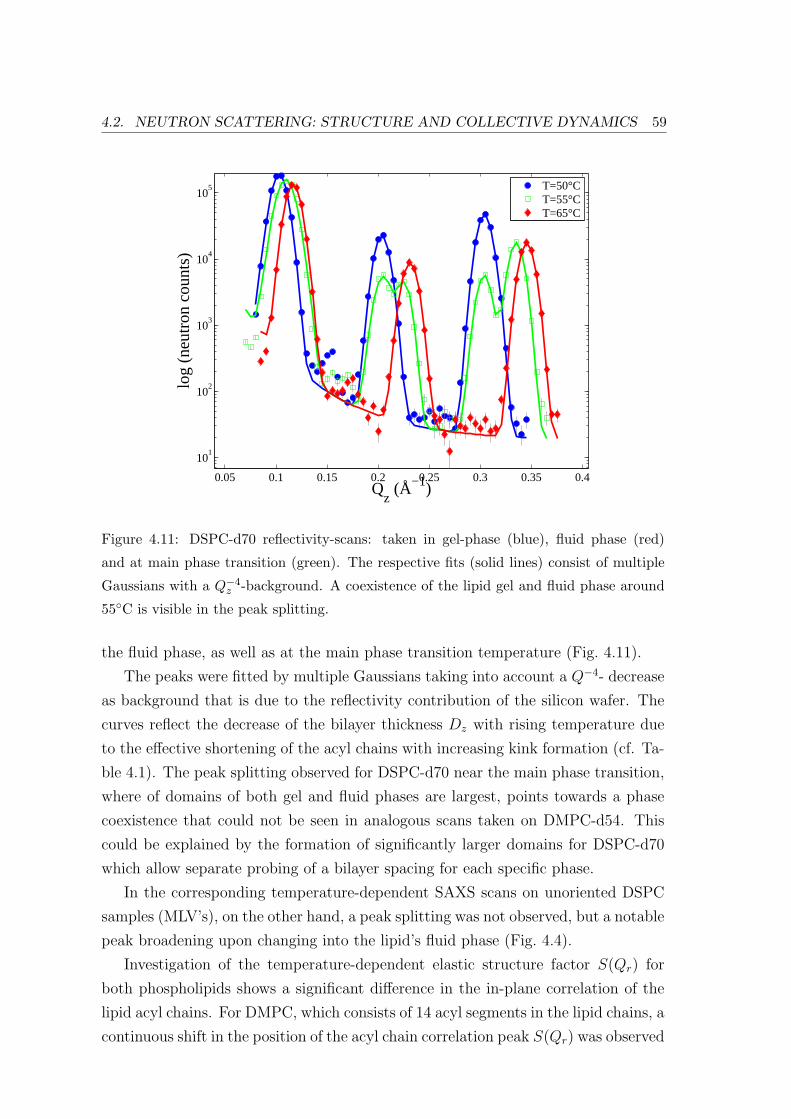
4.2. NEUTRON SCATTERING: STRUCTURE AND COLLECTIVE DYNAMICS 59
0.05 0.1 0.15 0.2 0.25 0.3 0.35 0.4
101
102
103
104
105
Qz (Å−1)
log
(neu
tron
cou
nts)
T=50°CT=55°CT=65°C
Figure 4.11: DSPC-d70 reflectivity-scans: taken in gel-phase (blue), fluid phase (red)
and at main phase transition (green). The respective fits (solid lines) consist of multiple
Gaussians with a Q−4z -background. A coexistence of the lipid gel and fluid phase around
55C is visible in the peak splitting.
the fluid phase, as well as at the main phase transition temperature (Fig. 4.11).
The peaks were fitted by multiple Gaussians taking into account a Q−4- decrease
as background that is due to the reflectivity contribution of the silicon wafer. The
curves reflect the decrease of the bilayer thickness Dz with rising temperature due
to the effective shortening of the acyl chains with increasing kink formation (cf. Ta-
ble 4.1). The peak splitting observed for DSPC-d70 near the main phase transition,
where of domains of both gel and fluid phases are largest, points towards a phase
coexistence that could not be seen in analogous scans taken on DMPC-d54. This
could be explained by the formation of significantly larger domains for DSPC-d70
which allow separate probing of a bilayer spacing for each specific phase.
In the corresponding temperature-dependent SAXS scans on unoriented DSPC
samples (MLV’s), on the other hand, a peak splitting was not observed, but a notable
peak broadening upon changing into the lipid’s fluid phase (Fig. 4.4).
Investigation of the temperature-dependent elastic structure factor S(Qr) for
both phospholipids shows a significant difference in the in-plane correlation of the
lipid acyl chains. For DMPC, which consists of 14 acyl segments in the lipid chains, a
continuous shift in the position of the acyl chain correlation peak S(Qr) was observed
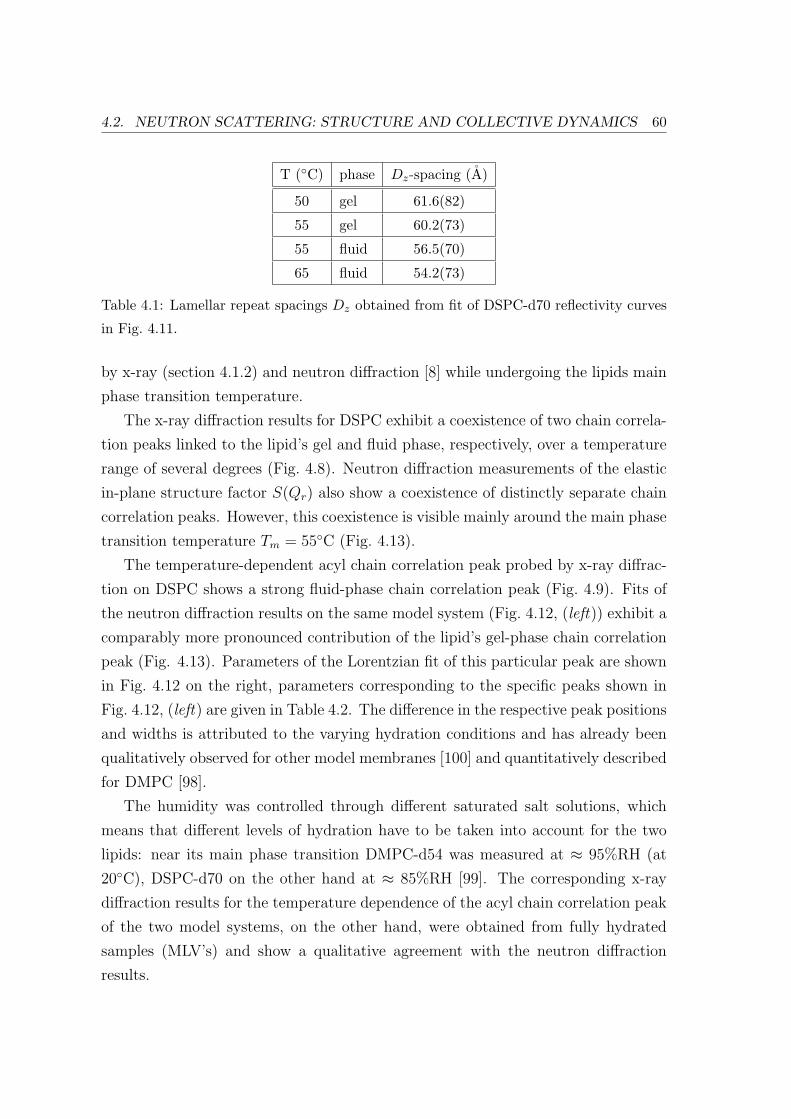
4.2. NEUTRON SCATTERING: STRUCTURE AND COLLECTIVE DYNAMICS 60
T (C) phase Dz-spacing (A)
50 gel 61.6(82)
55 gel 60.2(73)
55 fluid 56.5(70)
65 fluid 54.2(73)
Table 4.1: Lamellar repeat spacings Dz obtained from fit of DSPC-d70 reflectivity curves
in Fig. 4.11.
by x-ray (section 4.1.2) and neutron diffraction [8] while undergoing the lipids main
phase transition temperature.
The x-ray diffraction results for DSPC exhibit a coexistence of two chain correla-
tion peaks linked to the lipid’s gel and fluid phase, respectively, over a temperature
range of several degrees (Fig. 4.8). Neutron diffraction measurements of the elastic
in-plane structure factor S(Qr) also show a coexistence of distinctly separate chain
correlation peaks. However, this coexistence is visible mainly around the main phase
transition temperature Tm = 55C (Fig. 4.13).
The temperature-dependent acyl chain correlation peak probed by x-ray diffrac-
tion on DSPC shows a strong fluid-phase chain correlation peak (Fig. 4.9). Fits of
the neutron diffraction results on the same model system (Fig. 4.12, (left)) exhibit a
comparably more pronounced contribution of the lipid’s gel-phase chain correlation
peak (Fig. 4.13). Parameters of the Lorentzian fit of this particular peak are shown
in Fig. 4.12 on the right, parameters corresponding to the specific peaks shown in
Fig. 4.12, (left) are given in Table 4.2. The difference in the respective peak positions
and widths is attributed to the varying hydration conditions and has already been
qualitatively observed for other model membranes [100] and quantitatively described
for DMPC [98].
The humidity was controlled through different saturated salt solutions, which
means that different levels of hydration have to be taken into account for the two
lipids: near its main phase transition DMPC-d54 was measured at ≈ 95%RH (at
20C), DSPC-d70 on the other hand at ≈ 85%RH [99]. The corresponding x-ray
diffraction results for the temperature dependence of the acyl chain correlation peak
of the two model systems, on the other hand, were obtained from fully hydrated
samples (MLV’s) and show a qualitative agreement with the neutron diffraction
results.
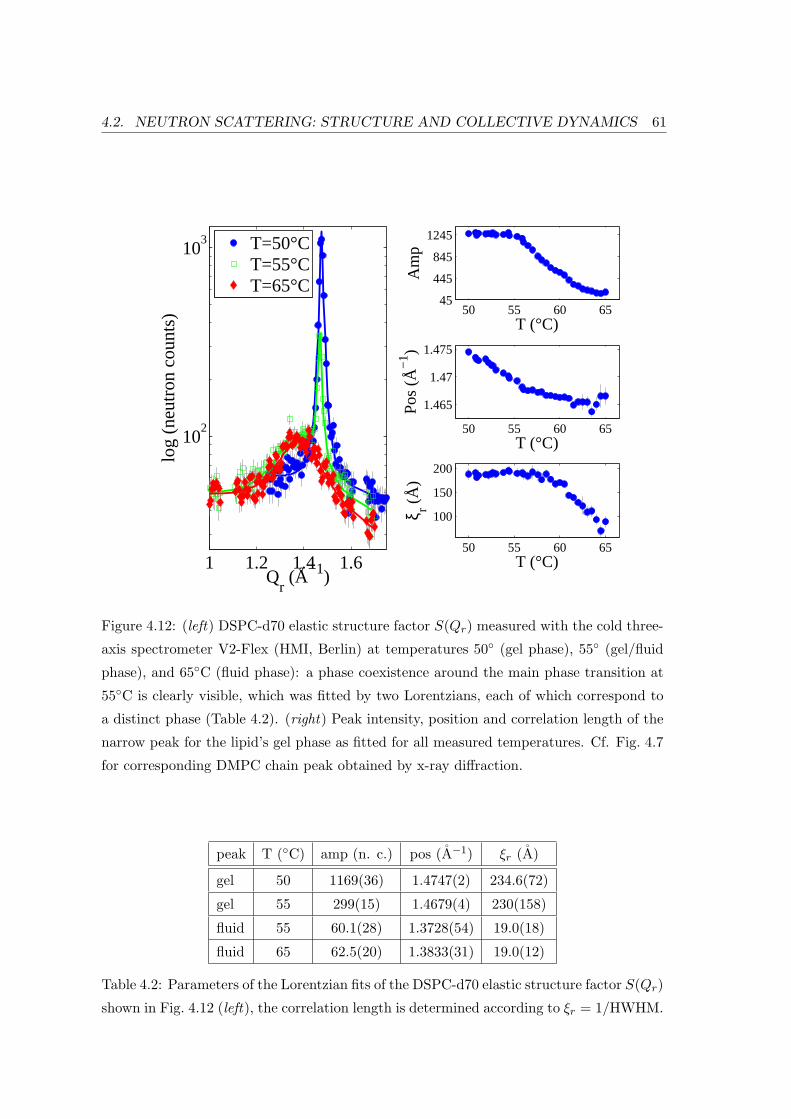
4.2. NEUTRON SCATTERING: STRUCTURE AND COLLECTIVE DYNAMICS 61
1 1.2 1.4 1.6
102
103
Qr (Å−1)
log
(neu
tron
cou
nts)
T=50°CT=55°CT=65°C
50 55 60 65
1.465
1.47
1.475
T (°C)
Pos
(Å−
1 )
50 55 60 6545
445
845
1245
T (°C)
Am
p
50 55 60 65
100
150
200
T (°C)
ξ r (Å
)
Figure 4.12: (left) DSPC-d70 elastic structure factor S(Qr) measured with the cold three-
axis spectrometer V2-Flex (HMI, Berlin) at temperatures 50 (gel phase), 55 (gel/fluid
phase), and 65C (fluid phase): a phase coexistence around the main phase transition at
55C is clearly visible, which was fitted by two Lorentzians, each of which correspond to
a distinct phase (Table 4.2). (right) Peak intensity, position and correlation length of the
narrow peak for the lipid’s gel phase as fitted for all measured temperatures. Cf. Fig. 4.7
for corresponding DMPC chain peak obtained by x-ray diffraction.
peak T (C) amp (n. c.) pos (A−1) ξr (A)
gel 50 1169(36) 1.4747(2) 234.6(72)
gel 55 299(15) 1.4679(4) 230(158)
fluid 55 60.1(28) 1.3728(54) 19.0(18)
fluid 65 62.5(20) 1.3833(31) 19.0(12)
Table 4.2: Parameters of the Lorentzian fits of the DSPC-d70 elastic structure factor S(Qr)
shown in Fig. 4.12 (left), the correlation length is determined according to ξr = 1/HWHM.
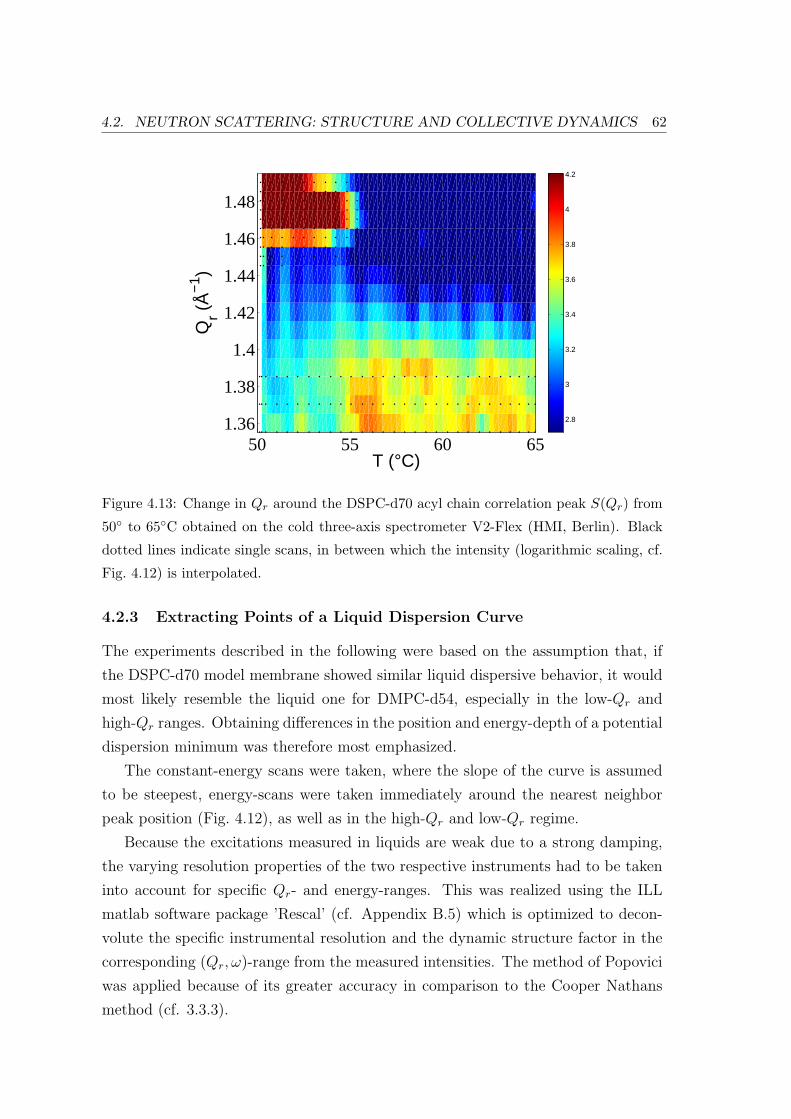
4.2. NEUTRON SCATTERING: STRUCTURE AND COLLECTIVE DYNAMICS 62
50 55 60 651.36
1.38
1.4
1.42
1.44
1.46
1.48
T (°C)
Qr (
Å−
1 )
2.8
3
3.2
3.4
3.6
3.8
4
4.2
Figure 4.13: Change in Qr around the DSPC-d70 acyl chain correlation peak S(Qr) from
50 to 65C obtained on the cold three-axis spectrometer V2-Flex (HMI, Berlin). Black
dotted lines indicate single scans, in between which the intensity (logarithmic scaling, cf.
Fig. 4.12) is interpolated.
4.2.3 Extracting Points of a Liquid Dispersion Curve
The experiments described in the following were based on the assumption that, if
the DSPC-d70 model membrane showed similar liquid dispersive behavior, it would
most likely resemble the liquid one for DMPC-d54, especially in the low-Qr and
high-Qr ranges. Obtaining differences in the position and energy-depth of a potential
dispersion minimum was therefore most emphasized.
The constant-energy scans were taken, where the slope of the curve is assumed
to be steepest, energy-scans were taken immediately around the nearest neighbor
peak position (Fig. 4.12), as well as in the high-Qr and low-Qr regime.
Because the excitations measured in liquids are weak due to a strong damping,
the varying resolution properties of the two respective instruments had to be taken
into account for specific Qr- and energy-ranges. This was realized using the ILL
matlab software package ’Rescal’ (cf. Appendix B.5) which is optimized to decon-
volute the specific instrumental resolution and the dynamic structure factor in the
corresponding (Qr, ω)-range from the measured intensities. The method of Popovici
was applied because of its greater accuracy in comparison to the Cooper Nathans
method (cf. 3.3.3).
4.2. NEUTRON SCATTERING: STRUCTURE AND COLLECTIVE DYNAMICS 63
Constant-energy Scans: Constant-energy scans obtained for DSPC-d70 at vary-
ing constant energies taken in the lipid’s fluid phase are shown in Fig. 4.14. The
data was fitted with a constant background and multiple Gaussians with the re-
spective peak width fixed to the corresponding instrumental resolution at a specific
point in reciprocal space (cf. Appendix B.5). This was necessary due to the weak
Q-resolution of the cold three-axis instrument V2, as well as the in comparison large
background. All scans shown in the following were smoothed with a Gaussian con-
volution of data points with the width 0.01 A−1 prior to fitting. The orientation
of the instrument resolution ellipsoid calculated for specific points in (Q,ω)-space
corresponds to the respective resolution focus visible in the data (cf. 3.3.3, Fig. 3.7):
the excitations are broader at smaller Qr and less intense than the more narrow
ones at larger Qr. Moreover, the excitations move apart in Qr the higher the energy.
An additional intensity contribution from the elastic chain peak at 1.47 A−1 can be
distinguished at 3.0 meV (not fitted). However, even taking resolution effects into
account, the results obtained from constant-energy scans are in this case no unam-
biguous evidence for the presence of excitations. Therefore we shall in the following
mainly consider the energy scans that were taken.
Energy Scans: Energy scans obtained well within the respective gel and fluid
phases for three distinct Qr-values (1.0 A−1, 1.47 A−1 and 2.3 A−1) and, in the
case of a potential minimum, also around the main phase transition at 55C were
evaluated based on the effective eigenmode model introduced in 3.2.3. The fits were
performed after ’detailed balance’ and absorption correction on the raw data (cf.
3.3.4, Appendix B.4.1, B.4.2).
Since the damped harmonic oscillator function converges towards a Lorentzian
[101, 102], the latter was fitted to the data obtained for Qr = 1.0 A−1 (Fig. 4.15)
together with a constant background. A signal increase at low energies due to a
quasielastic contribution, as well as a signal increase at high energies due to a con-
tribution of the primary beam are observed in the raw data and have been subtracted
as separate quadratic backgrounds prior to further evaluation.
The scans taken at Qr = 2.3 A−1 (Fig. 4.17) did not cover the elastic line. A
constant background was derived from the intensity contribution at high energies
and fixed, the Gaussian width was held according to the instrumental resolution
around the elastic line. The Lorentzian amplitude was approximated to the known
contribution obtained for the elastic structure factor S(Qr). The excess intensity
was then fitted by a damped harmonic oscillator.
For Qr = 1.47 A−1 the scans were fitted simultanuously for three temperatures
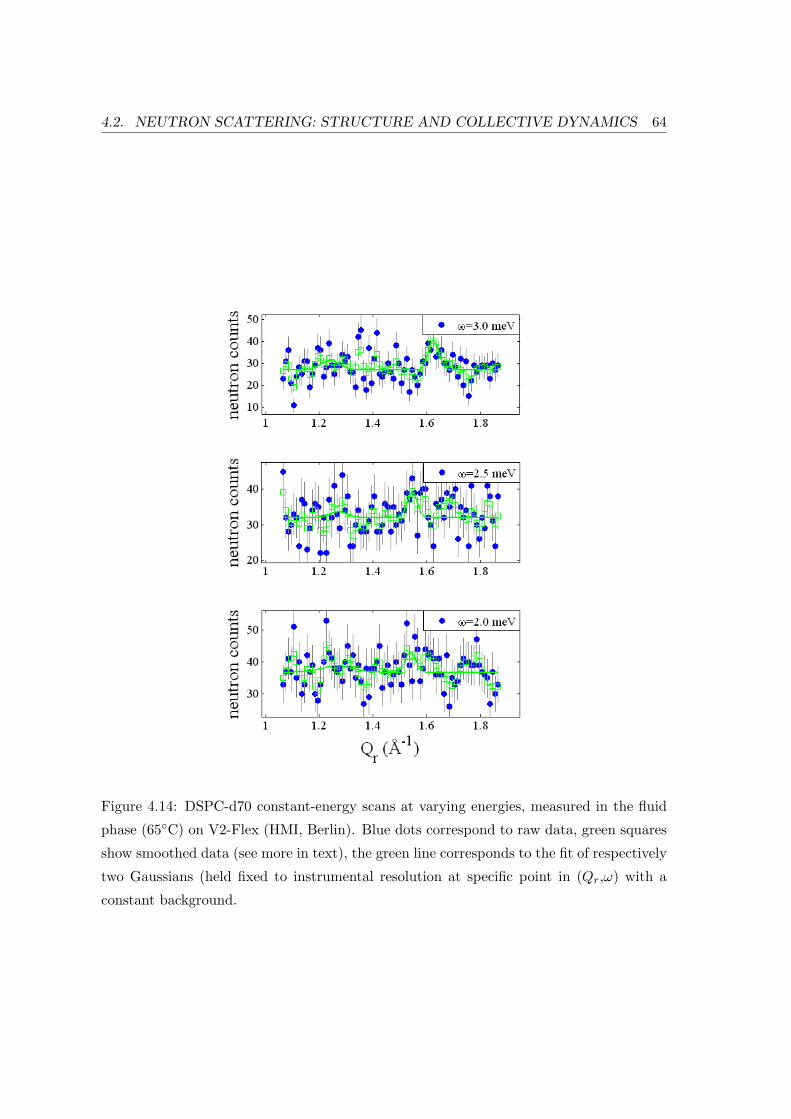
4.2. NEUTRON SCATTERING: STRUCTURE AND COLLECTIVE DYNAMICS 64
Figure 4.14: DSPC-d70 constant-energy scans at varying energies, measured in the fluid
phase (65C) on V2-Flex (HMI, Berlin). Blue dots correspond to raw data, green squares
show smoothed data (see more in text), the green line corresponds to the fit of respectively
two Gaussians (held fixed to instrumental resolution at specific point in (Qr,ω) with a
constant background.
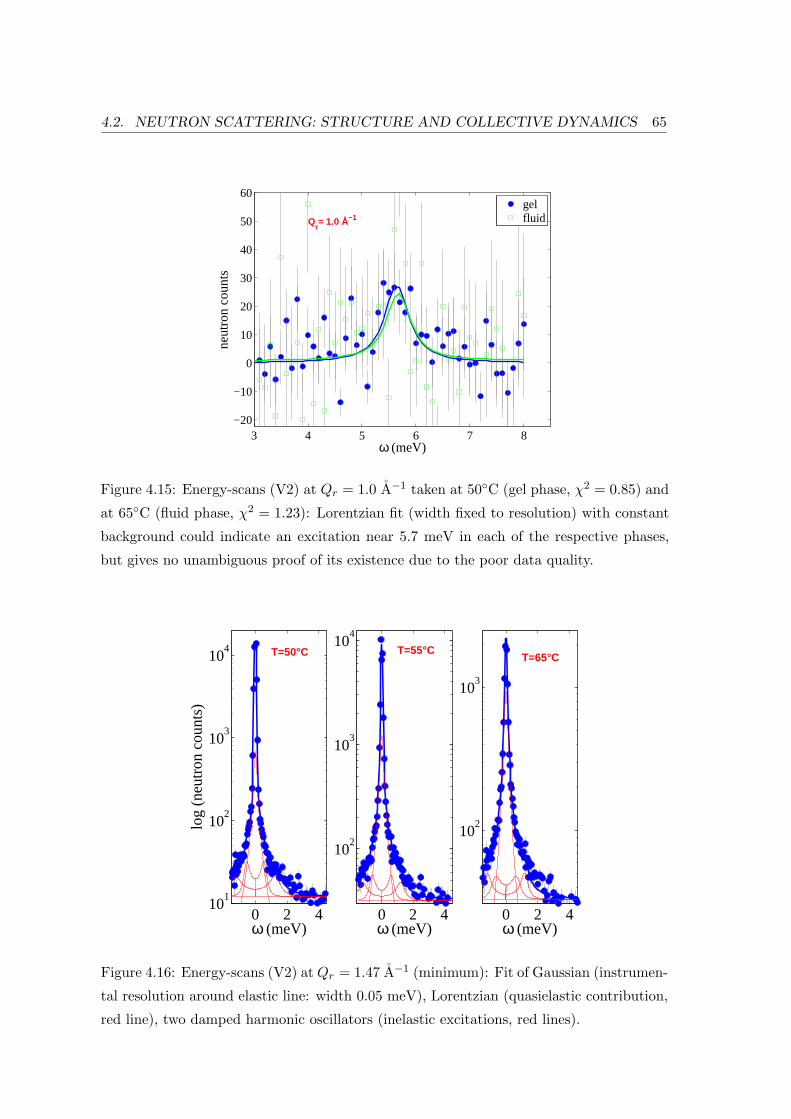
4.2. NEUTRON SCATTERING: STRUCTURE AND COLLECTIVE DYNAMICS 65
3 4 5 6 7 8−20
−10
0
10
20
30
40
50
60
ω (meV)
neut
ron
coun
ts
Qr= 1.0 Å−1
gelfluid
Figure 4.15: Energy-scans (V2) at Qr = 1.0 A−1 taken at 50C (gel phase, χ2 = 0.85) and
at 65C (fluid phase, χ2 = 1.23): Lorentzian fit (width fixed to resolution) with constant
background could indicate an excitation near 5.7 meV in each of the respective phases,
but gives no unambiguous proof of its existence due to the poor data quality.
0 2 410
1
102
103
104
ω (meV)
log
(neu
tron
cou
nts)
T=50°C
0 2 4
102
103
104
ω (meV)
T=55°C
0 2 4
102
103
ω (meV)
T=65°C
Figure 4.16: Energy-scans (V2) at Qr = 1.47 A−1 (minimum): Fit of Gaussian (instrumen-
tal resolution around elastic line: width 0.05 meV), Lorentzian (quasielastic contribution,
red line), two damped harmonic oscillators (inelastic excitations, red lines).
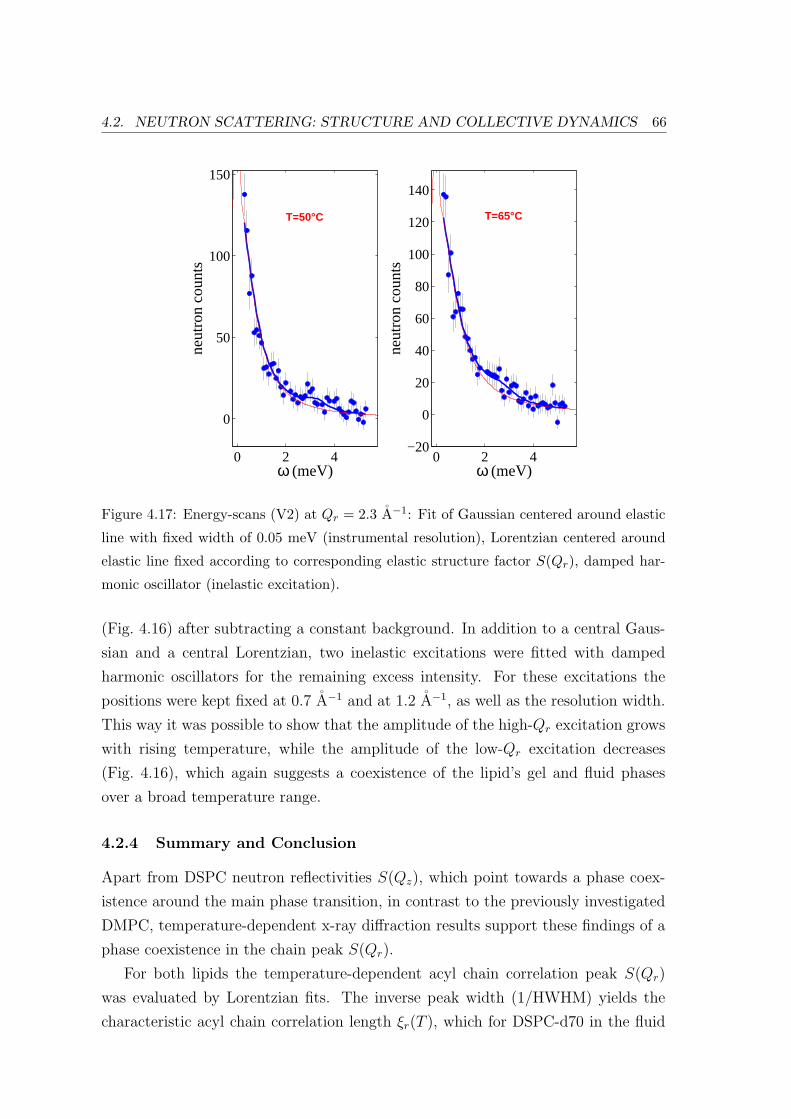
4.2. NEUTRON SCATTERING: STRUCTURE AND COLLECTIVE DYNAMICS 66
0 2 4
0
50
100
150
ω (meV)
neut
ron
coun
tsT=50°C
0 2 4−20
0
20
40
60
80
100
120
140
ω (meV)
neut
ron
coun
ts
T=65°C
Figure 4.17: Energy-scans (V2) at Qr = 2.3 A−1: Fit of Gaussian centered around elastic
line with fixed width of 0.05 meV (instrumental resolution), Lorentzian centered around
elastic line fixed according to corresponding elastic structure factor S(Qr), damped har-
monic oscillator (inelastic excitation).
(Fig. 4.16) after subtracting a constant background. In addition to a central Gaus-
sian and a central Lorentzian, two inelastic excitations were fitted with damped
harmonic oscillators for the remaining excess intensity. For these excitations the
positions were kept fixed at 0.7 A−1 and at 1.2 A−1, as well as the resolution width.
This way it was possible to show that the amplitude of the high-Qr excitation grows
with rising temperature, while the amplitude of the low-Qr excitation decreases
(Fig. 4.16), which again suggests a coexistence of the lipid’s gel and fluid phases
over a broad temperature range.
4.2.4 Summary and Conclusion
Apart from DSPC neutron reflectivities S(Qz), which point towards a phase coex-
istence around the main phase transition, in contrast to the previously investigated
DMPC, temperature-dependent x-ray diffraction results support these findings of a
phase coexistence in the chain peak S(Qr).
For both lipids the temperature-dependent acyl chain correlation peak S(Qr)
was evaluated by Lorentzian fits. The inverse peak width (1/HWHM) yields the
characteristic acyl chain correlation length ξr(T ), which for DSPC-d70 in the fluid
4.2. NEUTRON SCATTERING: STRUCTURE AND COLLECTIVE DYNAMICS 67
phase is by a factor of two larger than for DMPC-d54 [8]. The assumption of
significantly larger in-plane domains around the main phase transition for DSPC-
d70 (longer chains) is supported by the combined results for the in-plane and bilayer
ordering obtained both by x-ray and neutron diffraction. Taking into account a
neutron coherence length which lies in the order of 100 A, one might obtain an
average over domains of lipids in the gel and in the fluid phase for DMPC, while
single domains of either phase could actually be probed for DSPC.
Analysis of the fluid chain peak (cf. Table 4.2) yields a larger in-plane correlation
length ξr(T ) for DSPC than for DMPC in similar temperature ranges around the
respective main phase transitions [8]. The correlation length ξr(T ) is related to
decaying positional correlations which are considered to be a decisive criterium for
the cooperativity of the phase transition. A quantification of the cooperativity of
the main phase transition in phospholipid model membranes can be obtained from
calorimetric scans (cf. 2.2.2) through the width of a ∆cp(T )- peak. The cooperative
units are domains of phospholipid molecules in either the lipid’s gel or fluid phase.
The melting enthalpy obtained from an excess heat capacity profile can therefore
linked to the size of domains around the transition temperature for each lipid (cf.
2.2.2). This unit size is significantly larger for DSPC than for DMPC.
The in-plane correlation length ξr(T ), in general, describes the positional cor-
relations within each phase specifically. Analysis of the respective temperature de-
pendent chain peaks with neutron diffraction shows that the in-plane correlations
are for DSPC-d70 in every phase significantly larger than for DMPC-d54. The
DSPC-d70 acyl chains seem to be able to collectively interact at the same energy
exchange on a larger length scale than the DMPC-d54 chains, thereby evoking a
distinct modulation of the propagating sound wave.
The collective in-plane density fluctuations can be related to changes in the
properties of the bilayer bending modulus KB. According to Heimburg et al. [67,
103] the bending modulus as well as the in-plane area compressibility κT (T ) depend
on lateral area fluctuations, which are related to a distinct domain size through
the characteristic melting enthalpy ∆H (Fig. 2.1, 2.7). A decrease in the bending
modulus KB and an increase in the area compressibility κT with increasing chain
length match the observed energy minima obtained for respective points of the two
dispersion relations.
Previous studies have investigated the influence of fluctuations in the membrane
plane on its passive permeability (cf. 2.4.1). Nagle et al. link the in-plane correlation
length ξr of the membrane to its lateral compressibility, which shows a proportion-
ality to the permeability. In a series of experiments Paula et al. systematically vary

4.2. NEUTRON SCATTERING: STRUCTURE AND COLLECTIVE DYNAMICS 68
the bilayer thickness as well as the permeating molecules. The presented data show
a distinct relationship between acyl chain length and collective in-plane dynamics,
which is likely to influence membrane permeation.
Altogether, it seems that the ’anomalous swelling’ which occurs in the lamellar
Dz-spacing of several phospholipids is not coupled to the collective in-plane fluctu-
ations. The observation of a phase coexistence in the inelastic data and the elastic
data, as well as the indications found for the existence of a dispersion minimum in
the inelastic data strongly suggests that the ’weak crystallization’ theory is indeed
the favorable one.

Chapter 5
Cholesterol in Model Membranes
In this chapter the structure and collective dynamics of a DMPC/Cholesterol model
membrane are studied. Cholesterol is known to regulate membrane fluidity, per-
meability and the lateral mobility of proteins. The physical properties and the
corresponding biological functionality induced by Cholesterol strongly depend on
the way it partitions in the membrane (cf. 2.3.2). In the first section of this chapter
the DMPC/Cholesterol system is characterized by concentration- and temperature-
dependent small-angle and wide-angle x-ray diffraction on solutions of multilamellar
vesicles (MLV).
Within distinct phases identified in the x-ray experiments, complementary neu-
tron diffraction measurements were performed on oriented samples. The results are
shown and discussed the corresponding collective in-plane dynamics. The observa-
tions are compared to experimental findings for single lipid membranes as described
in the previous chapter as well as molecular dynamics simulations of simple model
membranes consisting of pure DMPC [8, 80]. For single lipid membranes the results
yield a typical liquid dispersion relation, which shows a ’de Gennes’-type behavior:
A minimum in the dispersion curve is located at the position of the nearest neighbor
peak. In the second section of this chapter it is investigated, how the insertion of
Cholesterol changes the structure and the collective density fluctuations of the lipid
acyl chains, and more specifically the liquid type of behavior observed in single lipid
membranes.
5.1 X-ray Diffraction: DMPC/Cholesterol Phase Diagram
The structural characterization of the DMPC/Cholesterol phase diagram was per-
formed on two different setups: The in-house diffractometer WENDI (cf. 4.1.1),
provides information on the temperature-dependent structural changes at small an-
5.1. X-RAY DIFFRACTION: DMPC/CHOLESTEROL PHASE DIAGRAM 70
gles at varied concentration. In addition, detailed information on the temperature
and concentration dependent wide-angle structure factor was obtained. Additional
concentration dependent small-angle x-ray scattering scans taken at the ID02 beam-
line (ESRF in Grenoble, France) complement the in-house results and provide higher
resolution.
5.1.1 Experimental
Samples The composite membrane samples for both x-ray diffraction experiments
consisted of multilamellar vesicles (MLV’s) like for the previously discussed single
component model membranes DMPC and DSPC. The lipids (DMPC, Cholesterol)
were purchased from Avanti (Alabaster, AL) and dissolved in Chloroform/TFE (1:1)
in the desired molar proportions to achieve a homogenous mixture of the compo-
nents. The solvent was subsequently evaporated over the course of two days at room
temperature in a vacuum oven and the dry lipids were hydrated with Millipore wa-
ter at a concentration of 200 mg/ml, heated from room temperature up to 60C,
ultrasonicated in a bath and cooled down to room temperature again several times
subsequently. The suspension was then kept at a constant temperature of 36C over
night to ensure the formation of MLV’s (multilamellar vesicles).
WENDI-Experiment: A description of the instrumental setup of the in-house
diffractometer is given in the previous chapter. Temperature dependent x-ray diffrac-
tion measurements consisted of small-angle scans in the range from Qz=0.05 to
Qz=0.5 A−1 taken with 500 points counting for 30 sec and wide-angle scans in the
range from Qr=1.0 to Qr=1.8 A−1 counting 100 points for 120 sec.
In addition to single SAXS measurements, continuous temperature ramps on the
first ’Bragg’ peak were taken running from 60C down to 10C for several Cholesterol
ratios counting 80 points for 10 sec. The sample-holder for the different capillaries
was inserted into a temperature chamber already used in the previous experiment on
this instrument (cf. 4.1). This chamber is made of aluminum with capton windows
and was operated by a standard thermostatic bath steered by the diffractometer
control software ’spec’.
ID02-Experiment: Due to the high brilliance of an undulator source this instru-
ment is well suited to study the microstructure and non-equilibrium dynamics of soft
matter systems, allowing combined small-angle and wide-angle scattering within a
Q-range of 0.01 nm−1 and 40 nm−1 at a wavelength of 0.1 nm. The distance of the
SAXS area detectors can be varied between 1 m and 10 m with a Q-resolution of
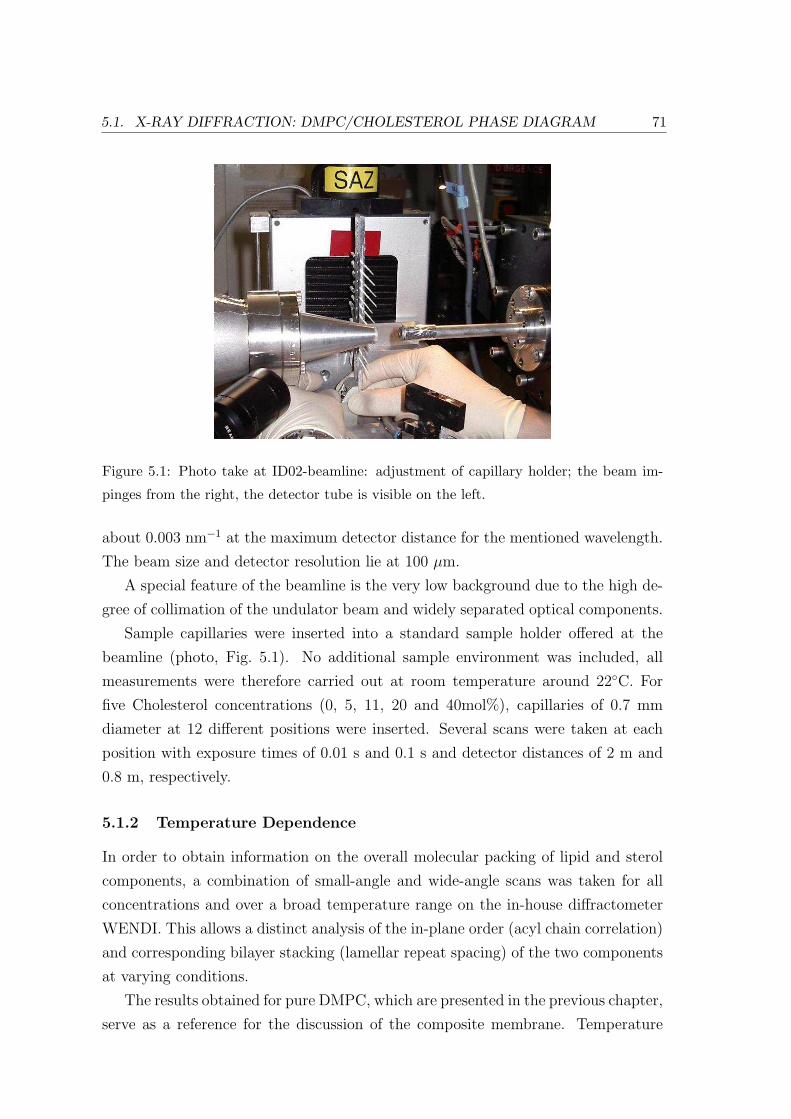
5.1. X-RAY DIFFRACTION: DMPC/CHOLESTEROL PHASE DIAGRAM 71
Figure 5.1: Photo take at ID02-beamline: adjustment of capillary holder; the beam im-
pinges from the right, the detector tube is visible on the left.
about 0.003 nm−1 at the maximum detector distance for the mentioned wavelength.
The beam size and detector resolution lie at 100 µm.
A special feature of the beamline is the very low background due to the high de-
gree of collimation of the undulator beam and widely separated optical components.
Sample capillaries were inserted into a standard sample holder offered at the
beamline (photo, Fig. 5.1). No additional sample environment was included, all
measurements were therefore carried out at room temperature around 22C. For
five Cholesterol concentrations (0, 5, 11, 20 and 40mol%), capillaries of 0.7 mm
diameter at 12 different positions were inserted. Several scans were taken at each
position with exposure times of 0.01 s and 0.1 s and detector distances of 2 m and
0.8 m, respectively.
5.1.2 Temperature Dependence
In order to obtain information on the overall molecular packing of lipid and sterol
components, a combination of small-angle and wide-angle scans was taken for all
concentrations and over a broad temperature range on the in-house diffractometer
WENDI. This allows a distinct analysis of the in-plane order (acyl chain correlation)
and corresponding bilayer stacking (lamellar repeat spacing) of the two components
at varying conditions.
The results obtained for pure DMPC, which are presented in the previous chapter,
serve as a reference for the discussion of the composite membrane. Temperature
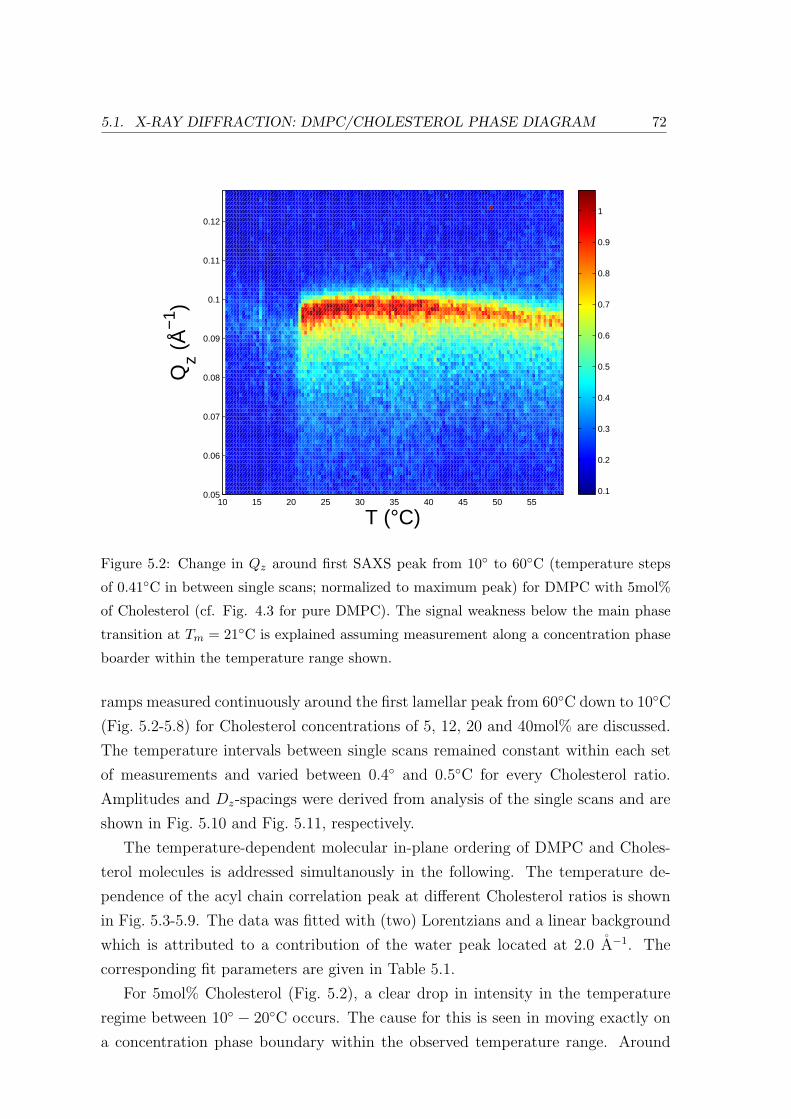
5.1. X-RAY DIFFRACTION: DMPC/CHOLESTEROL PHASE DIAGRAM 72
10 15 20 25 30 35 40 45 50 550.05
0.06
0.07
0.08
0.09
0.1
0.11
0.12
T (°C)
Qz (
Å−
1 )
0.1
0.2
0.3
0.4
0.5
0.6
0.7
0.8
0.9
1
Figure 5.2: Change in Qz around first SAXS peak from 10 to 60C (temperature steps
of 0.41C in between single scans; normalized to maximum peak) for DMPC with 5mol%
of Cholesterol (cf. Fig. 4.3 for pure DMPC). The signal weakness below the main phase
transition at Tm = 21C is explained assuming measurement along a concentration phase
boarder within the temperature range shown.
ramps measured continuously around the first lamellar peak from 60C down to 10C
(Fig. 5.2-5.8) for Cholesterol concentrations of 5, 12, 20 and 40mol% are discussed.
The temperature intervals between single scans remained constant within each set
of measurements and varied between 0.4 and 0.5C for every Cholesterol ratio.
Amplitudes and Dz-spacings were derived from analysis of the single scans and are
shown in Fig. 5.10 and Fig. 5.11, respectively.
The temperature-dependent molecular in-plane ordering of DMPC and Choles-
terol molecules is addressed simultanously in the following. The temperature de-
pendence of the acyl chain correlation peak at different Cholesterol ratios is shown
in Fig. 5.3-5.9. The data was fitted with (two) Lorentzians and a linear background
which is attributed to a contribution of the water peak located at 2.0 A−1. The
corresponding fit parameters are given in Table 5.1.
For 5mol% Cholesterol (Fig. 5.2), a clear drop in intensity in the temperature
regime between 10 − 20C occurs. The cause for this is seen in moving exactly on
a concentration phase boundary within the observed temperature range. Around
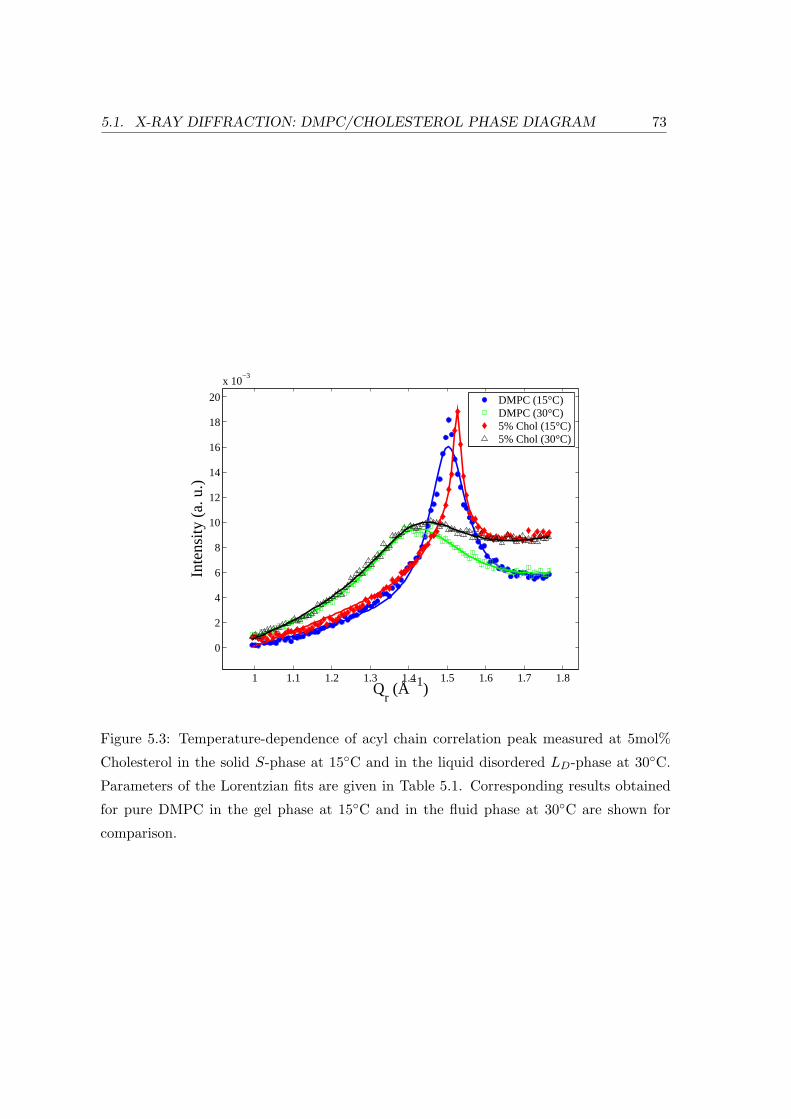
5.1. X-RAY DIFFRACTION: DMPC/CHOLESTEROL PHASE DIAGRAM 73
1 1.1 1.2 1.3 1.4 1.5 1.6 1.7 1.8
0
2
4
6
8
10
12
14
16
18
20
x 10−3
Qr (Å−1)
Inte
nsity
(a.
u.)
DMPC (15°C)DMPC (30°C)5% Chol (15°C)5% Chol (30°C)
Figure 5.3: Temperature-dependence of acyl chain correlation peak measured at 5mol%
Cholesterol in the solid S-phase at 15C and in the liquid disordered LD-phase at 30C.
Parameters of the Lorentzian fits are given in Table 5.1. Corresponding results obtained
for pure DMPC in the gel phase at 15C and in the fluid phase at 30C are shown for
comparison.
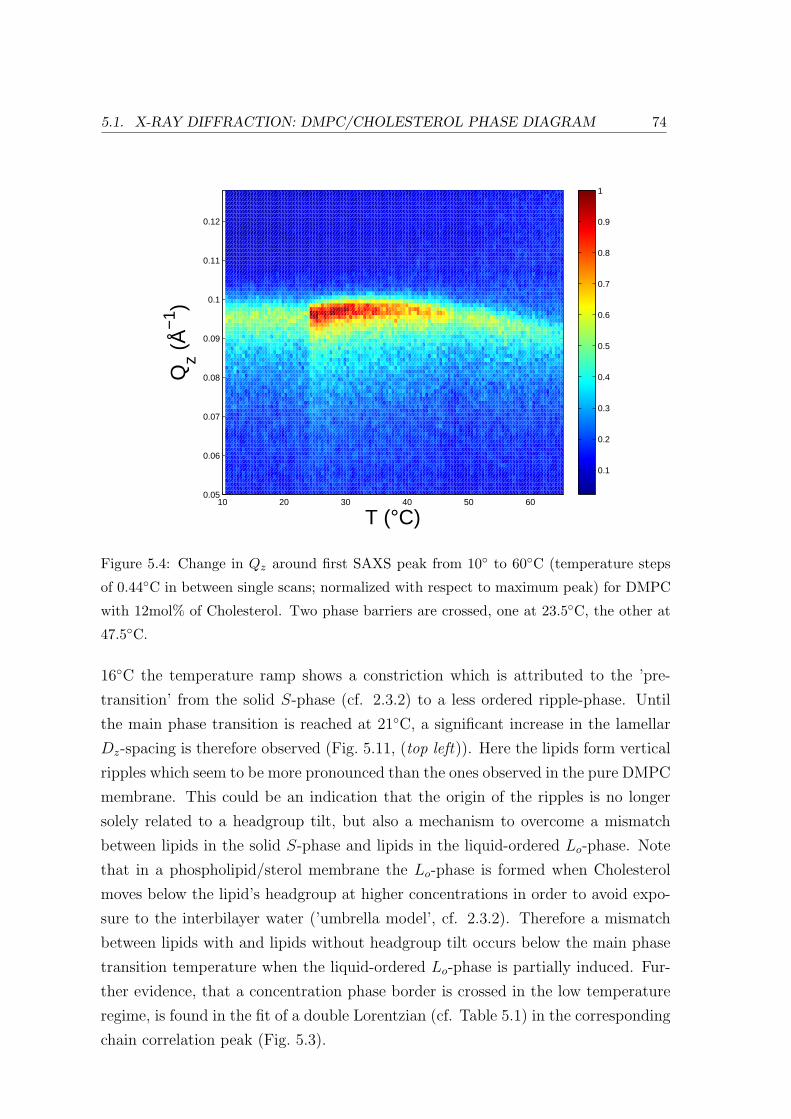
5.1. X-RAY DIFFRACTION: DMPC/CHOLESTEROL PHASE DIAGRAM 74
10 20 30 40 50 600.05
0.06
0.07
0.08
0.09
0.1
0.11
0.12
T (°C)
Qz (
Å−
1 )
0.1
0.2
0.3
0.4
0.5
0.6
0.7
0.8
0.9
1
Figure 5.4: Change in Qz around first SAXS peak from 10 to 60C (temperature steps
of 0.44C in between single scans; normalized with respect to maximum peak) for DMPC
with 12mol% of Cholesterol. Two phase barriers are crossed, one at 23.5C, the other at
47.5C.
16C the temperature ramp shows a constriction which is attributed to the ’pre-
transition’ from the solid S-phase (cf. 2.3.2) to a less ordered ripple-phase. Until
the main phase transition is reached at 21C, a significant increase in the lamellar
Dz-spacing is therefore observed (Fig. 5.11, (top left)). Here the lipids form vertical
ripples which seem to be more pronounced than the ones observed in the pure DMPC
membrane. This could be an indication that the origin of the ripples is no longer
solely related to a headgroup tilt, but also a mechanism to overcome a mismatch
between lipids in the solid S-phase and lipids in the liquid-ordered Lo-phase. Note
that in a phospholipid/sterol membrane the Lo-phase is formed when Cholesterol
moves below the lipid’s headgroup at higher concentrations in order to avoid expo-
sure to the interbilayer water (’umbrella model’, cf. 2.3.2). Therefore a mismatch
between lipids with and lipids without headgroup tilt occurs below the main phase
transition temperature when the liquid-ordered Lo-phase is partially induced. Fur-
ther evidence, that a concentration phase border is crossed in the low temperature
regime, is found in the fit of a double Lorentzian (cf. Table 5.1) in the corresponding
chain correlation peak (Fig. 5.3).
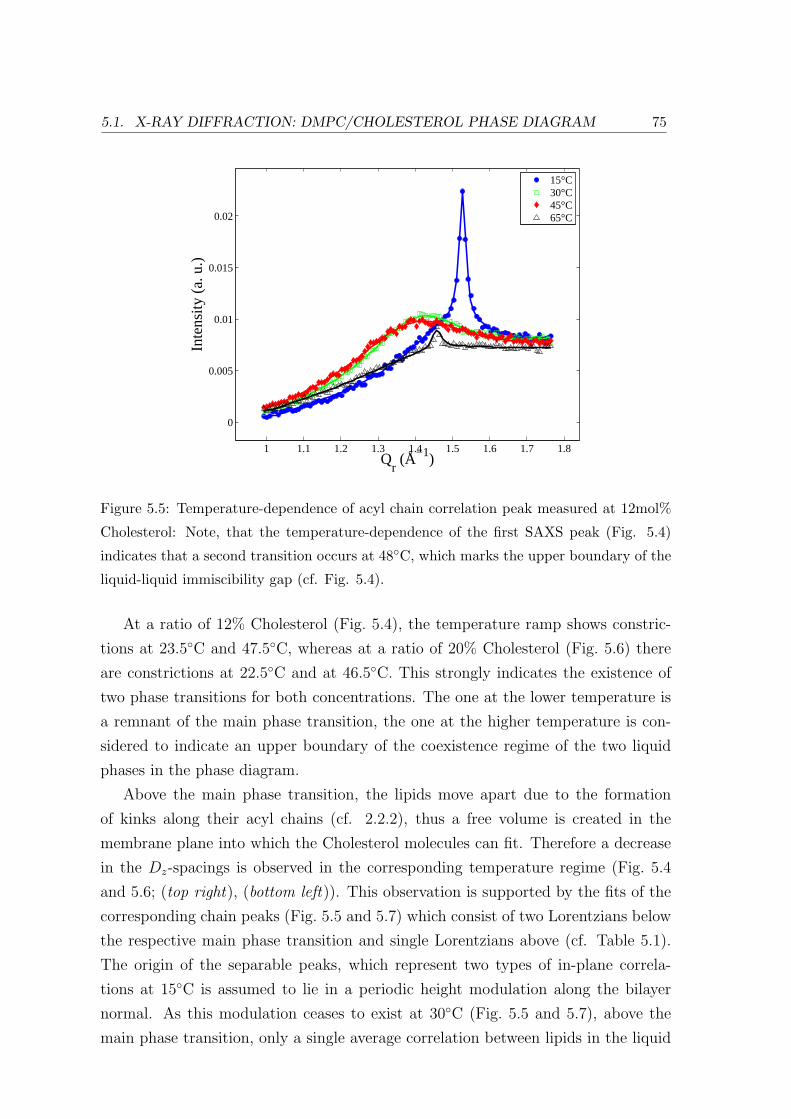
5.1. X-RAY DIFFRACTION: DMPC/CHOLESTEROL PHASE DIAGRAM 75
1 1.1 1.2 1.3 1.4 1.5 1.6 1.7 1.8
0
0.005
0.01
0.015
0.02
Qr (Å−1)
Inte
nsity
(a.
u.)
15°C30°C45°C65°C
Figure 5.5: Temperature-dependence of acyl chain correlation peak measured at 12mol%
Cholesterol: Note, that the temperature-dependence of the first SAXS peak (Fig. 5.4)
indicates that a second transition occurs at 48C, which marks the upper boundary of the
liquid-liquid immiscibility gap (cf. Fig. 5.4).
At a ratio of 12% Cholesterol (Fig. 5.4), the temperature ramp shows constric-
tions at 23.5C and 47.5C, whereas at a ratio of 20% Cholesterol (Fig. 5.6) there
are constrictions at 22.5C and at 46.5C. This strongly indicates the existence of
two phase transitions for both concentrations. The one at the lower temperature is
a remnant of the main phase transition, the one at the higher temperature is con-
sidered to indicate an upper boundary of the coexistence regime of the two liquid
phases in the phase diagram.
Above the main phase transition, the lipids move apart due to the formation
of kinks along their acyl chains (cf. 2.2.2), thus a free volume is created in the
membrane plane into which the Cholesterol molecules can fit. Therefore a decrease
in the Dz-spacings is observed in the corresponding temperature regime (Fig. 5.4
and 5.6; (top right), (bottom left)). This observation is supported by the fits of the
corresponding chain peaks (Fig. 5.5 and 5.7) which consist of two Lorentzians below
the respective main phase transition and single Lorentzians above (cf. Table 5.1).
The origin of the separable peaks, which represent two types of in-plane correla-
tions at 15C is assumed to lie in a periodic height modulation along the bilayer
normal. As this modulation ceases to exist at 30C (Fig. 5.5 and 5.7), above the
main phase transition, only a single average correlation between lipids in the liquid
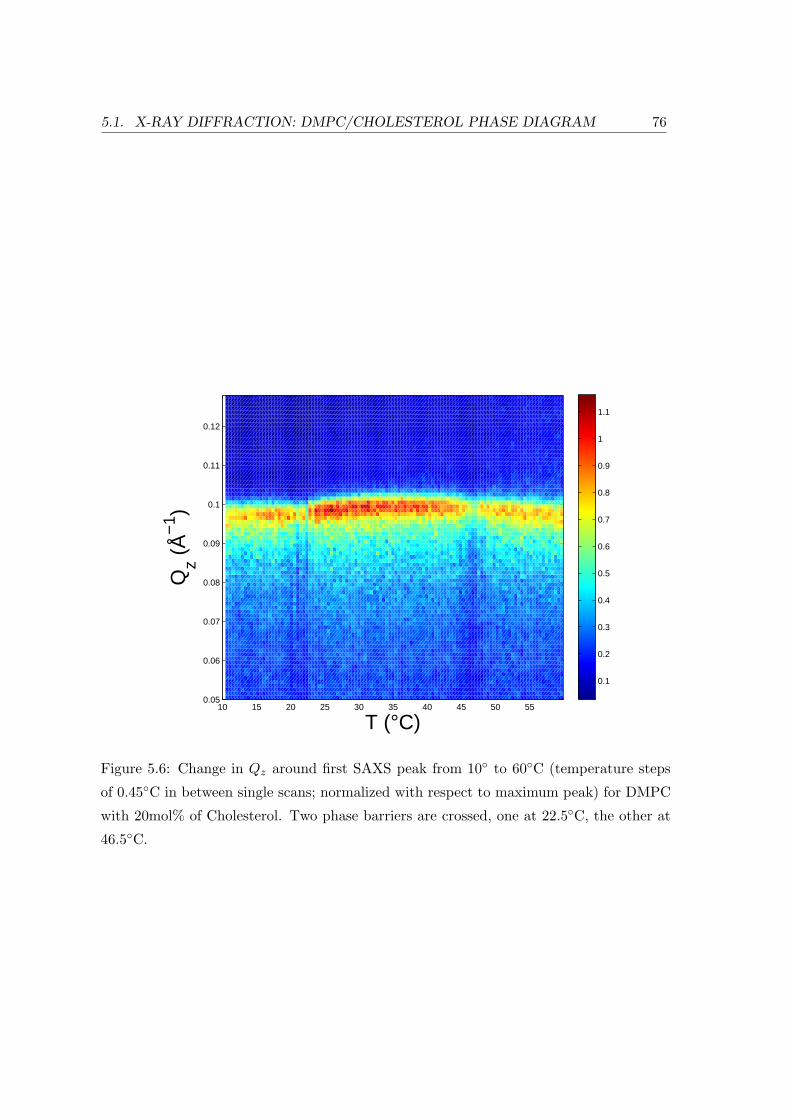
5.1. X-RAY DIFFRACTION: DMPC/CHOLESTEROL PHASE DIAGRAM 76
10 15 20 25 30 35 40 45 50 550.05
0.06
0.07
0.08
0.09
0.1
0.11
0.12
T (°C)
Qz (
Å−
1 )
0.1
0.2
0.3
0.4
0.5
0.6
0.7
0.8
0.9
1
1.1
Figure 5.6: Change in Qz around first SAXS peak from 10 to 60C (temperature steps
of 0.45C in between single scans; normalized with respect to maximum peak) for DMPC
with 20mol% of Cholesterol. Two phase barriers are crossed, one at 22.5C, the other at
46.5C.
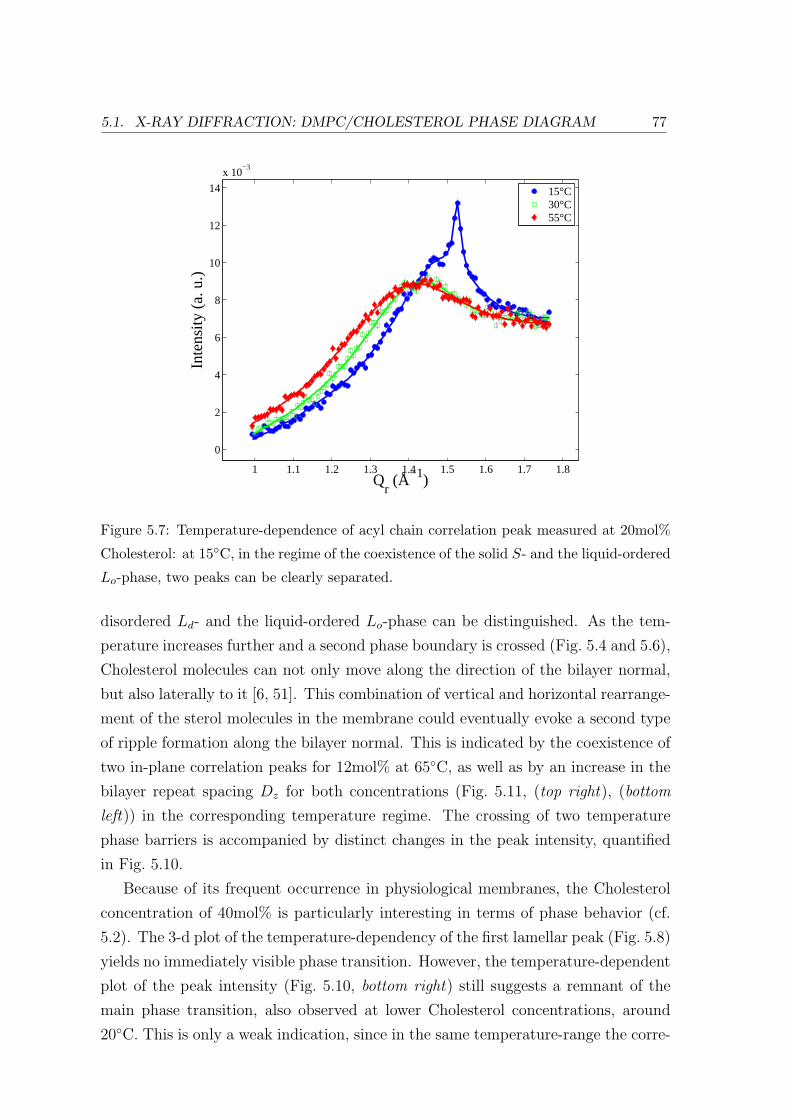
5.1. X-RAY DIFFRACTION: DMPC/CHOLESTEROL PHASE DIAGRAM 77
1 1.1 1.2 1.3 1.4 1.5 1.6 1.7 1.8
0
2
4
6
8
10
12
14
x 10−3
Qr (Å−1)
Inte
nsity
(a.
u.)
15°C30°C55°C
Figure 5.7: Temperature-dependence of acyl chain correlation peak measured at 20mol%
Cholesterol: at 15C, in the regime of the coexistence of the solid S- and the liquid-ordered
Lo-phase, two peaks can be clearly separated.
disordered Ld- and the liquid-ordered Lo-phase can be distinguished. As the tem-
perature increases further and a second phase boundary is crossed (Fig. 5.4 and 5.6),
Cholesterol molecules can not only move along the direction of the bilayer normal,
but also laterally to it [6, 51]. This combination of vertical and horizontal rearrange-
ment of the sterol molecules in the membrane could eventually evoke a second type
of ripple formation along the bilayer normal. This is indicated by the coexistence of
two in-plane correlation peaks for 12mol% at 65C, as well as by an increase in the
bilayer repeat spacing Dz for both concentrations (Fig. 5.11, (top right), (bottom
left)) in the corresponding temperature regime. The crossing of two temperature
phase barriers is accompanied by distinct changes in the peak intensity, quantified
in Fig. 5.10.
Because of its frequent occurrence in physiological membranes, the Cholesterol
concentration of 40mol% is particularly interesting in terms of phase behavior (cf.
5.2). The 3-d plot of the temperature-dependency of the first lamellar peak (Fig. 5.8)
yields no immediately visible phase transition. However, the temperature-dependent
plot of the peak intensity (Fig. 5.10, bottom right) still suggests a remnant of the
main phase transition, also observed at lower Cholesterol concentrations, around
20C. This is only a weak indication, since in the same temperature-range the corre-
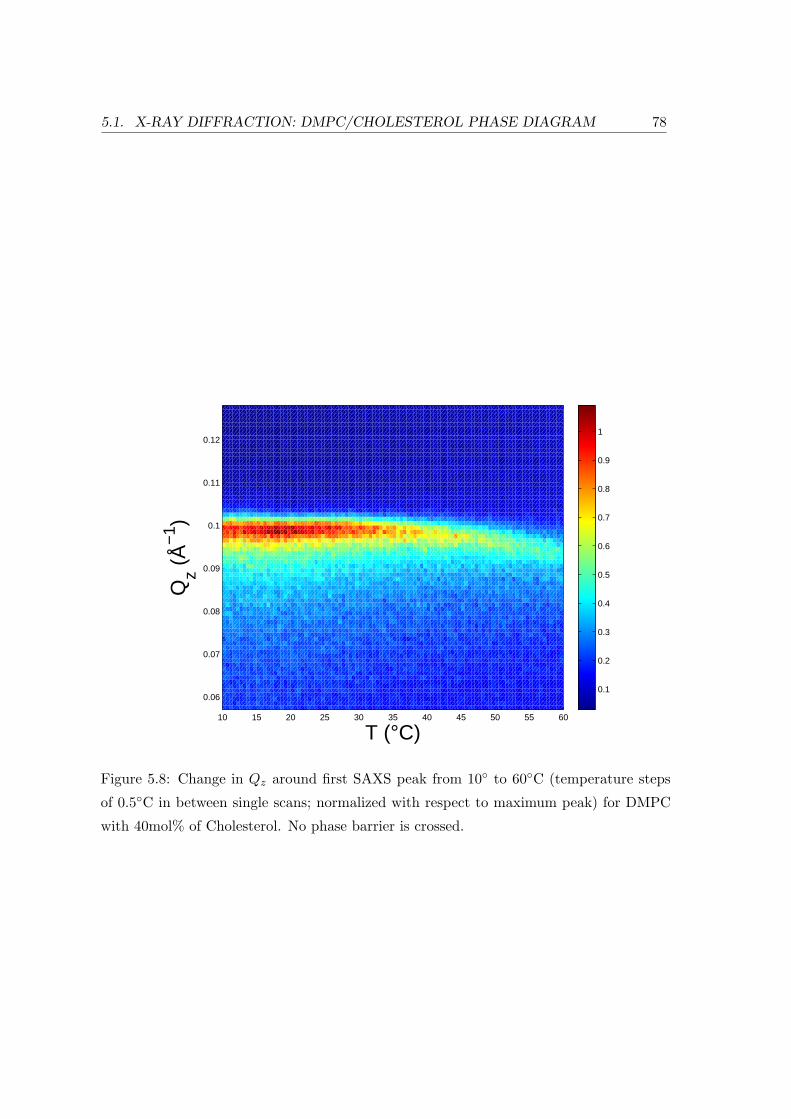
5.1. X-RAY DIFFRACTION: DMPC/CHOLESTEROL PHASE DIAGRAM 78
10 15 20 25 30 35 40 45 50 55 60
0.06
0.07
0.08
0.09
0.1
0.11
0.12
T (°C)
Qz (
Å−
1 )
0.1
0.2
0.3
0.4
0.5
0.6
0.7
0.8
0.9
1
Figure 5.8: Change in Qz around first SAXS peak from 10 to 60C (temperature steps
of 0.5C in between single scans; normalized with respect to maximum peak) for DMPC
with 40mol% of Cholesterol. No phase barrier is crossed.
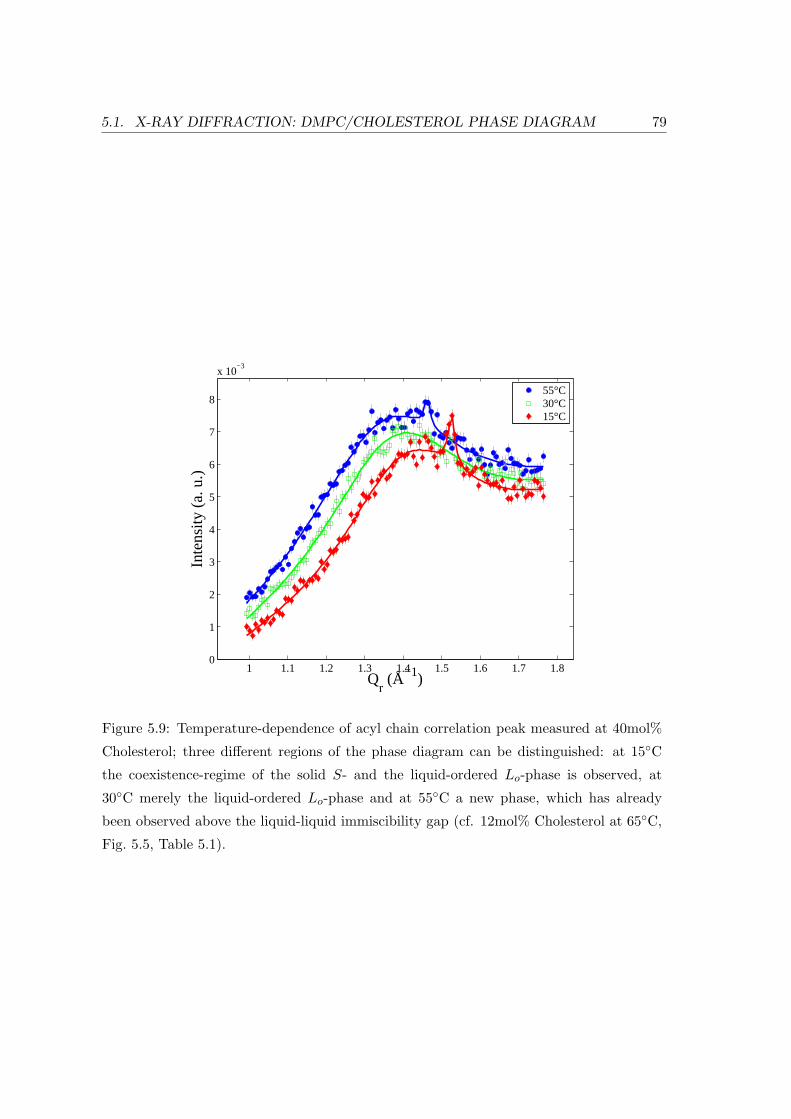
5.1. X-RAY DIFFRACTION: DMPC/CHOLESTEROL PHASE DIAGRAM 79
1 1.1 1.2 1.3 1.4 1.5 1.6 1.7 1.80
1
2
3
4
5
6
7
8
x 10−3
Qr (Å−1)
Inte
nsity
(a.
u.)
55°C30°C15°C
Figure 5.9: Temperature-dependence of acyl chain correlation peak measured at 40mol%
Cholesterol; three different regions of the phase diagram can be distinguished: at 15C
the coexistence-regime of the solid S- and the liquid-ordered Lo-phase is observed, at
30C merely the liquid-ordered Lo-phase and at 55C a new phase, which has already
been observed above the liquid-liquid immiscibility gap (cf. 12mol% Cholesterol at 65C,
Fig. 5.5, Table 5.1).
5.1. X-RAY DIFFRACTION: DMPC/CHOLESTEROL PHASE DIAGRAM 80
sponding Dz-spacing remains nearly constant at 64 A−1, well below the correspond-
ing values at lower concentrations (Fig. 5.11). At temperatures above 40C, an
increase in the lamellar repeat spacing is observed which exceeds the ones at lower
Cholesterol ratios in the corresponding regime by several A’s. This could indicate
that at least a fraction of the sterol molecules moves between the bilayer leaflets
in order to obtain hydrophobic shielding, thereby reducing the effective in-plane
Cholesterol concentration. Fits of the acyl chain peak at 40mol% Cholesterol at
varying temperatures also suggest a weak presence of three distinguishable phases
(Fig. 5.9): the double peak observed at 15C is attributed to the previously discussed
coexistence of the solid S- and the liquid-ordered Lo-phase. At a temperature of
30C only a single peak is visible which differs from all other peaks in position and
width (Table 5.1). It is therefore attributed to the purely liquid-ordered Lo-phase.
At 55C again a peak coexistence is found which, together with the previously men-
tioned strong increase in the lamellar repeat spacing Dz in this temperature regime,
indicates the crossing of the second weak phase barrier. The position of the fitted
satellite peak corresponds to the one found for 12mol% Cholesterol at 65C (cf.
Table 5.1).
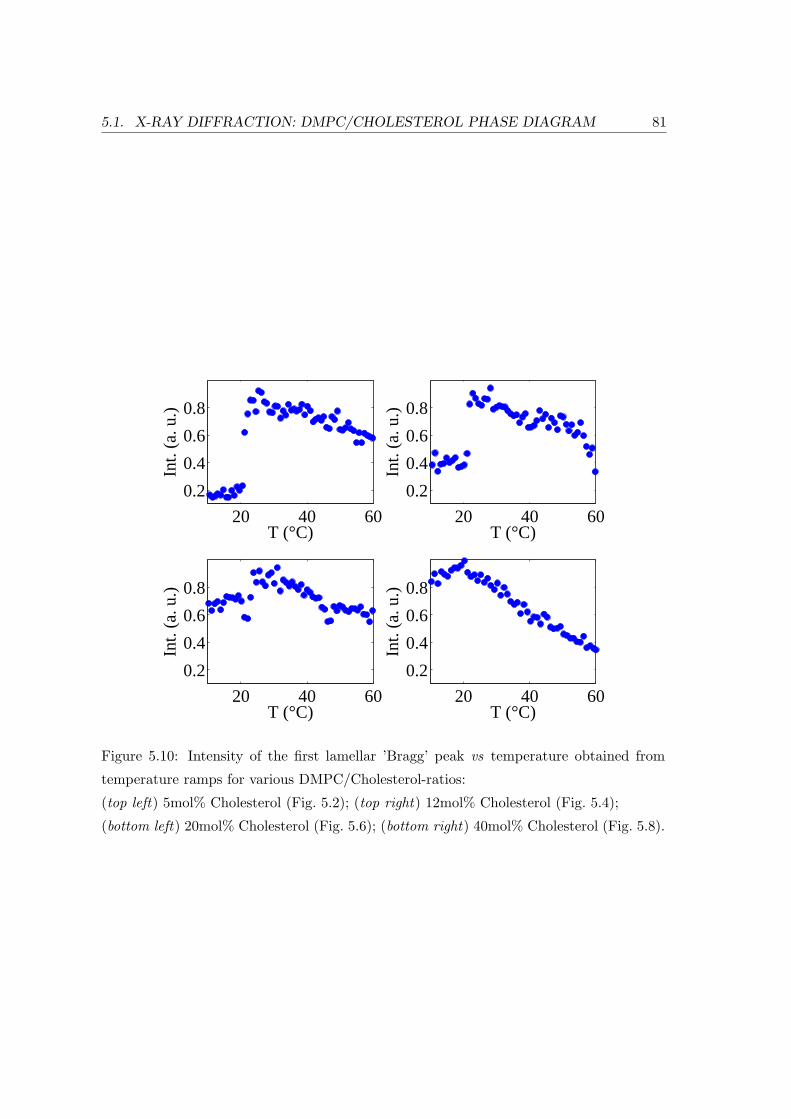
5.1. X-RAY DIFFRACTION: DMPC/CHOLESTEROL PHASE DIAGRAM 81
20 40 60
0.2
0.4
0.6
0.8
T (°C)
Int.
(a. u
.)
20 40 60
0.2
0.4
0.6
0.8
T (°C)
Int.
(a. u
.)
20 40 60
0.2
0.4
0.6
0.8
T (°C)
Int.
(a. u
.)
20 40 60
0.2
0.4
0.6
0.8
T (°C)
Int.
(a. u
.)
Figure 5.10: Intensity of the first lamellar ’Bragg’ peak vs temperature obtained from
temperature ramps for various DMPC/Cholesterol-ratios:
(top left) 5mol% Cholesterol (Fig. 5.2); (top right) 12mol% Cholesterol (Fig. 5.4);
(bottom left) 20mol% Cholesterol (Fig. 5.6); (bottom right) 40mol% Cholesterol (Fig. 5.8).
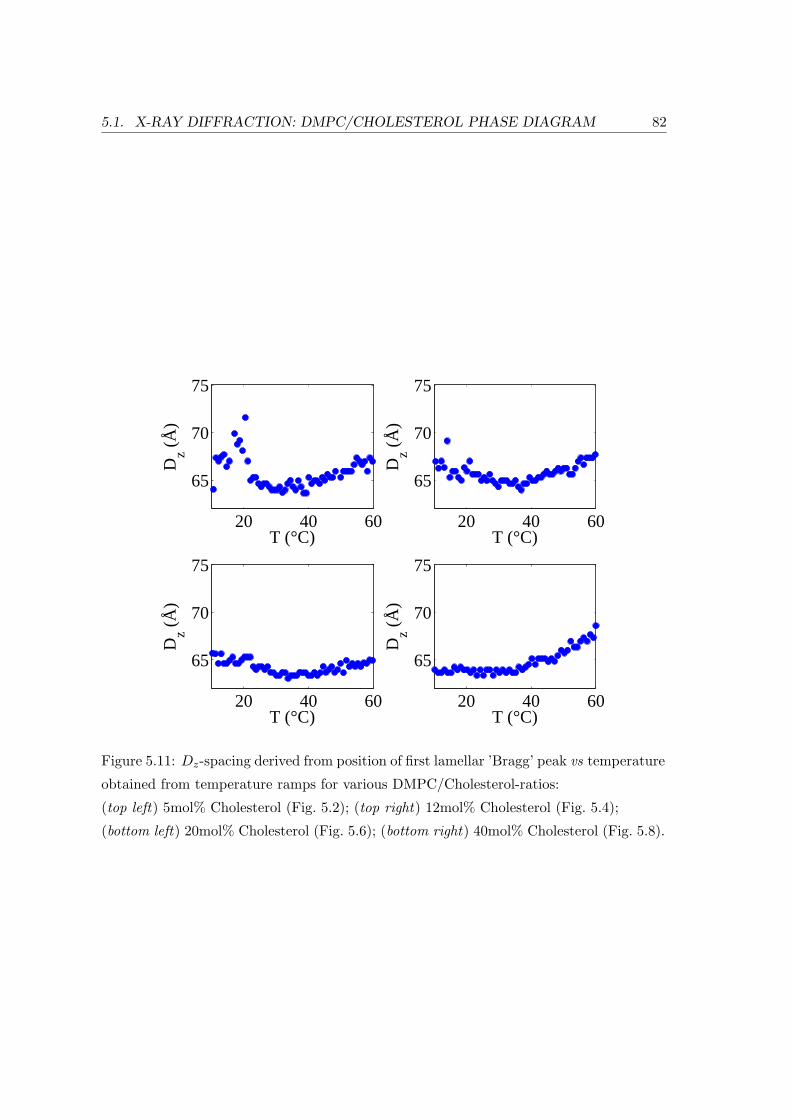
5.1. X-RAY DIFFRACTION: DMPC/CHOLESTEROL PHASE DIAGRAM 82
20 40 60
65
70
75
T (°C)
Dz (
Å)
20 40 60
65
70
75
T (°C)
Dz (
Å)
20 40 60
65
70
75
T (°C)
Dz (
Å)
20 40 60
65
70
75
T (°C)
Dz (
Å)
Figure 5.11: Dz-spacing derived from position of first lamellar ’Bragg’ peak vs temperature
obtained from temperature ramps for various DMPC/Cholesterol-ratios:
(top left) 5mol% Cholesterol (Fig. 5.2); (top right) 12mol% Cholesterol (Fig. 5.4);
(bottom left) 20mol% Cholesterol (Fig. 5.6); (bottom right) 40mol% Cholesterol (Fig. 5.8).
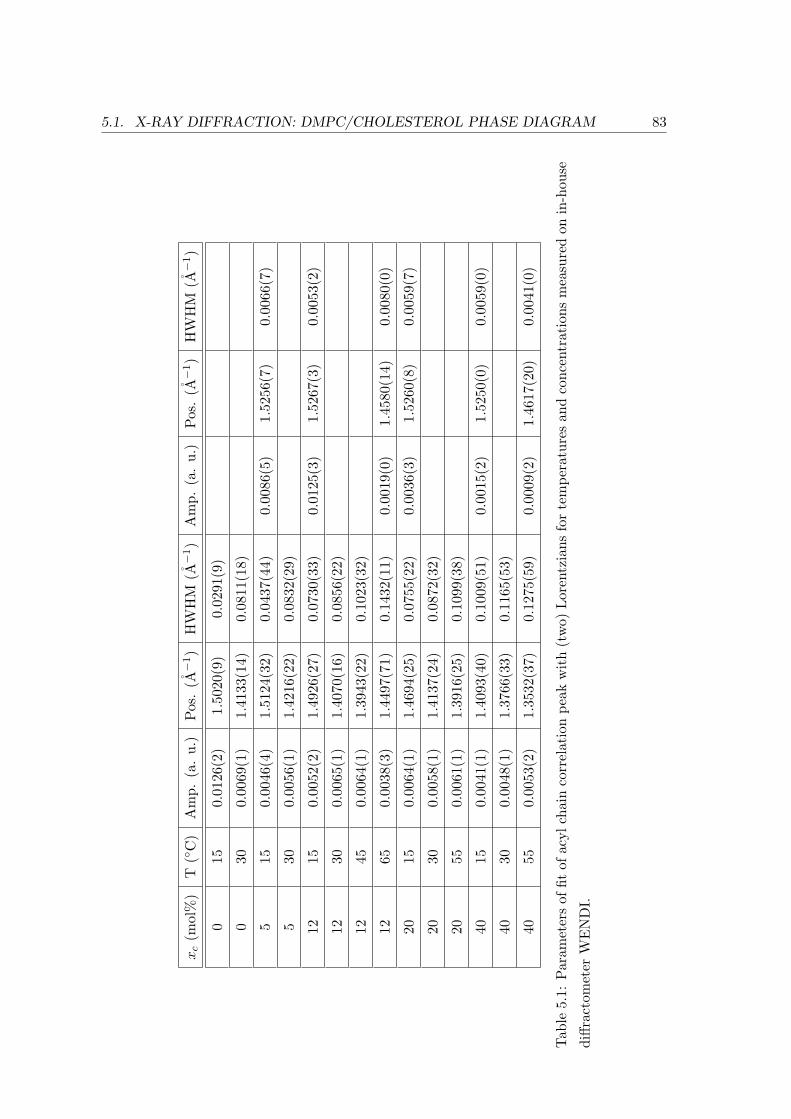
5.1. X-RAY DIFFRACTION: DMPC/CHOLESTEROL PHASE DIAGRAM 83
xc
(mol
%)
T(
C)
Am
p.(a
.u.
)Pos
.(A
−1)
HW
HM
(A−1
)A
mp.
(a.
u.)
Pos
.(A
−1)
HW
HM
(A−1
)
015
0.01
26(2
)1.
5020
(9)
0.02
91(9
)
030
0.00
69(1
)1.
4133
(14)
0.08
11(1
8)
515
0.00
46(4
)1.
5124
(32)
0.04
37(4
4)0.
0086
(5)
1.52
56(7
)0.
0066
(7)
530
0.00
56(1
)1.
4216
(22)
0.08
32(2
9)
1215
0.00
52(2
)1.
4926
(27)
0.07
30(3
3)0.
0125
(3)
1.52
67(3
)0.
0053
(2)
1230
0.00
65(1
)1.
4070
(16)
0.08
56(2
2)
1245
0.00
64(1
)1.
3943
(22)
0.10
23(3
2)
1265
0.00
38(3
)1.
4497
(71)
0.14
32(1
1)0.
0019
(0)
1.45
80(1
4)0.
0080
(0)
2015
0.00
64(1
)1.
4694
(25)
0.07
55(2
2)0.
0036
(3)
1.52
60(8
)0.
0059
(7)
2030
0.00
58(1
)1.
4137
(24)
0.08
72(3
2)
2055
0.00
61(1
)1.
3916
(25)
0.10
99(3
8)
4015
0.00
41(1
)1.
4093
(40)
0.10
09(5
1)0.
0015
(2)
1.52
50(0
)0.
0059
(0)
4030
0.00
48(1
)1.
3766
(33)
0.11
65(5
3)
4055
0.00
53(2
)1.
3532
(37)
0.12
75(5
9)0.
0009
(2)
1.46
17(2
0)0.
0041
(0)
Tab
le5.
1:Par
amet
ers
offit
ofac
ylch
ain
corr
elat
ion
peak
with
(tw
o)Lor
entz
ians
for
tem
pera
ture
san
dco
ncen
trat
ions
mea
sure
don
in-h
ouse
diffr
acto
met
erW
EN
DI.
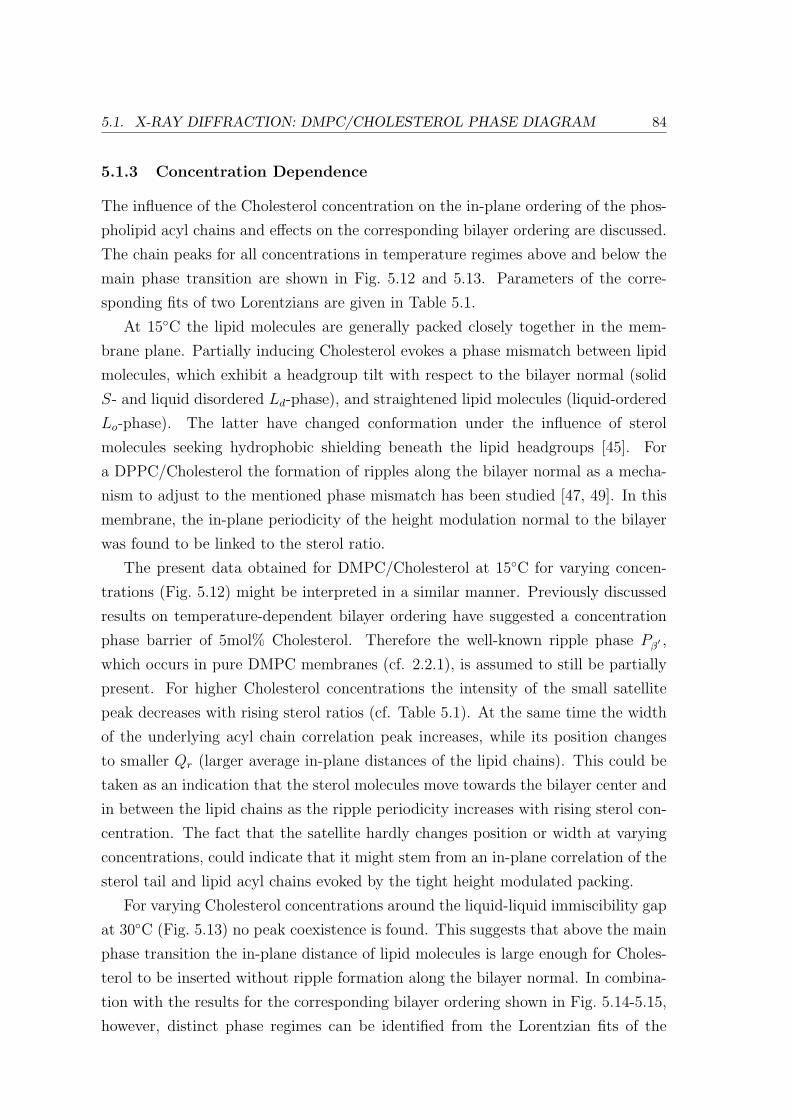
5.1. X-RAY DIFFRACTION: DMPC/CHOLESTEROL PHASE DIAGRAM 84
5.1.3 Concentration Dependence
The influence of the Cholesterol concentration on the in-plane ordering of the phos-
pholipid acyl chains and effects on the corresponding bilayer ordering are discussed.
The chain peaks for all concentrations in temperature regimes above and below the
main phase transition are shown in Fig. 5.12 and 5.13. Parameters of the corre-
sponding fits of two Lorentzians are given in Table 5.1.
At 15C the lipid molecules are generally packed closely together in the mem-
brane plane. Partially inducing Cholesterol evokes a phase mismatch between lipid
molecules, which exhibit a headgroup tilt with respect to the bilayer normal (solid
S- and liquid disordered Ld-phase), and straightened lipid molecules (liquid-ordered
Lo-phase). The latter have changed conformation under the influence of sterol
molecules seeking hydrophobic shielding beneath the lipid headgroups [45]. For
a DPPC/Cholesterol the formation of ripples along the bilayer normal as a mecha-
nism to adjust to the mentioned phase mismatch has been studied [47, 49]. In this
membrane, the in-plane periodicity of the height modulation normal to the bilayer
was found to be linked to the sterol ratio.
The present data obtained for DMPC/Cholesterol at 15C for varying concen-
trations (Fig. 5.12) might be interpreted in a similar manner. Previously discussed
results on temperature-dependent bilayer ordering have suggested a concentration
phase barrier of 5mol% Cholesterol. Therefore the well-known ripple phase Pβ′ ,
which occurs in pure DMPC membranes (cf. 2.2.1), is assumed to still be partially
present. For higher Cholesterol concentrations the intensity of the small satellite
peak decreases with rising sterol ratios (cf. Table 5.1). At the same time the width
of the underlying acyl chain correlation peak increases, while its position changes
to smaller Qr (larger average in-plane distances of the lipid chains). This could be
taken as an indication that the sterol molecules move towards the bilayer center and
in between the lipid chains as the ripple periodicity increases with rising sterol con-
centration. The fact that the satellite hardly changes position or width at varying
concentrations, could indicate that it might stem from an in-plane correlation of the
sterol tail and lipid acyl chains evoked by the tight height modulated packing.
For varying Cholesterol concentrations around the liquid-liquid immiscibility gap
at 30C (Fig. 5.13) no peak coexistence is found. This suggests that above the main
phase transition the in-plane distance of lipid molecules is large enough for Choles-
terol to be inserted without ripple formation along the bilayer normal. In combina-
tion with the results for the corresponding bilayer ordering shown in Fig. 5.14-5.15,
however, distinct phase regimes can be identified from the Lorentzian fits of the
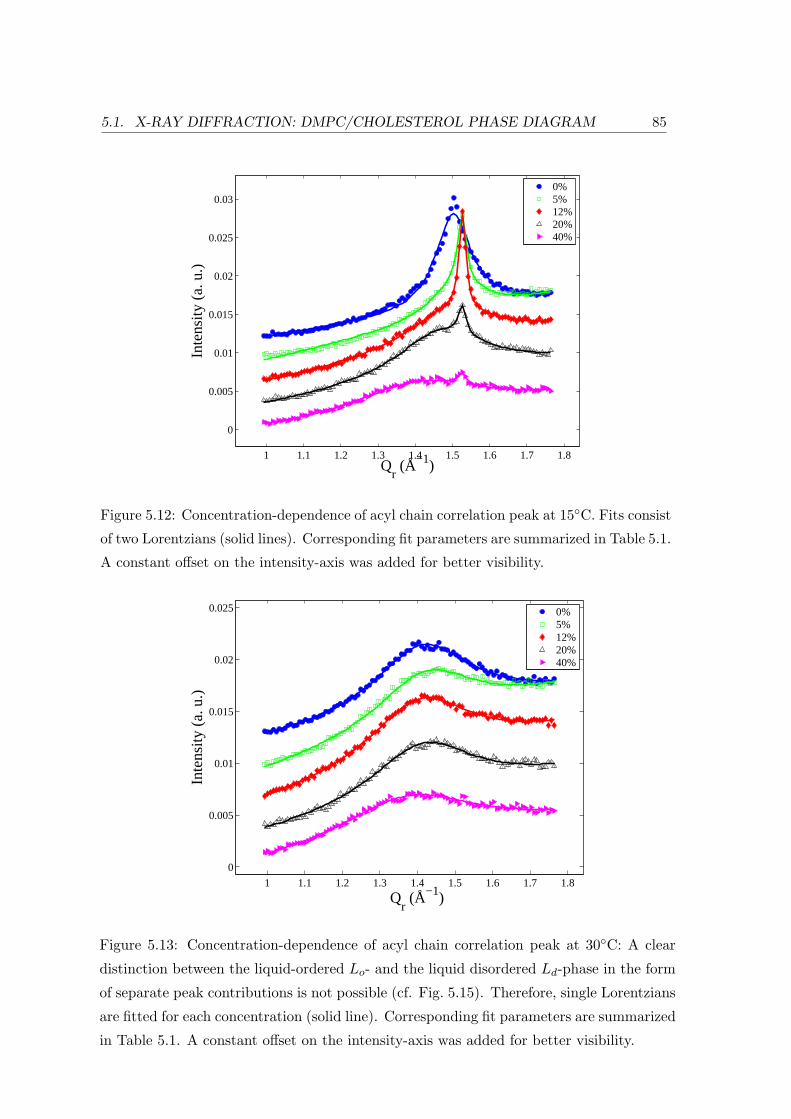
5.1. X-RAY DIFFRACTION: DMPC/CHOLESTEROL PHASE DIAGRAM 85
1 1.1 1.2 1.3 1.4 1.5 1.6 1.7 1.8
0
0.005
0.01
0.015
0.02
0.025
0.03
Qr (Å−1)
Inte
nsity
(a.
u.)
0%5%12%20%40%
Figure 5.12: Concentration-dependence of acyl chain correlation peak at 15C. Fits consist
of two Lorentzians (solid lines). Corresponding fit parameters are summarized in Table 5.1.
A constant offset on the intensity-axis was added for better visibility.
1 1.1 1.2 1.3 1.4 1.5 1.6 1.7 1.8
0
0.005
0.01
0.015
0.02
0.025
Qr (Å−1)
Inte
nsity
(a.
u.)
0%5%12%20%40%
Figure 5.13: Concentration-dependence of acyl chain correlation peak at 30C: A clear
distinction between the liquid-ordered Lo- and the liquid disordered Ld-phase in the form
of separate peak contributions is not possible (cf. Fig. 5.15). Therefore, single Lorentzians
are fitted for each concentration (solid line). Corresponding fit parameters are summarized
in Table 5.1. A constant offset on the intensity-axis was added for better visibility.
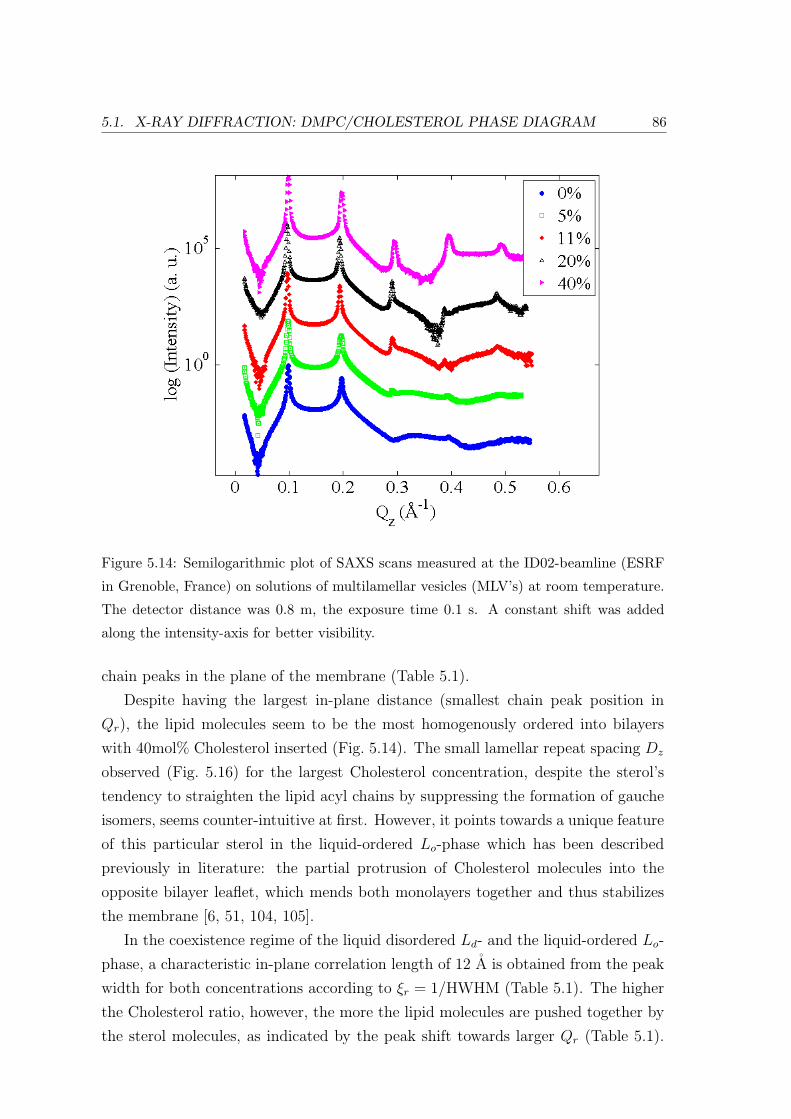
5.1. X-RAY DIFFRACTION: DMPC/CHOLESTEROL PHASE DIAGRAM 86
Figure 5.14: Semilogarithmic plot of SAXS scans measured at the ID02-beamline (ESRF
in Grenoble, France) on solutions of multilamellar vesicles (MLV’s) at room temperature.
The detector distance was 0.8 m, the exposure time 0.1 s. A constant shift was added
along the intensity-axis for better visibility.
chain peaks in the plane of the membrane (Table 5.1).
Despite having the largest in-plane distance (smallest chain peak position in
Qr), the lipid molecules seem to be the most homogenously ordered into bilayers
with 40mol% Cholesterol inserted (Fig. 5.14). The small lamellar repeat spacing Dz
observed (Fig. 5.16) for the largest Cholesterol concentration, despite the sterol’s
tendency to straighten the lipid acyl chains by suppressing the formation of gauche
isomers, seems counter-intuitive at first. However, it points towards a unique feature
of this particular sterol in the liquid-ordered Lo-phase which has been described
previously in literature: the partial protrusion of Cholesterol molecules into the
opposite bilayer leaflet, which mends both monolayers together and thus stabilizes
the membrane [6, 51, 104, 105].
In the coexistence regime of the liquid disordered Ld- and the liquid-ordered Lo-
phase, a characteristic in-plane correlation length of 12 A is obtained from the peak
width for both concentrations according to ξr = 1/HWHM (Table 5.1). The higher
the Cholesterol ratio, however, the more the lipid molecules are pushed together by
the sterol molecules, as indicated by the peak shift towards larger Qr (Table 5.1).
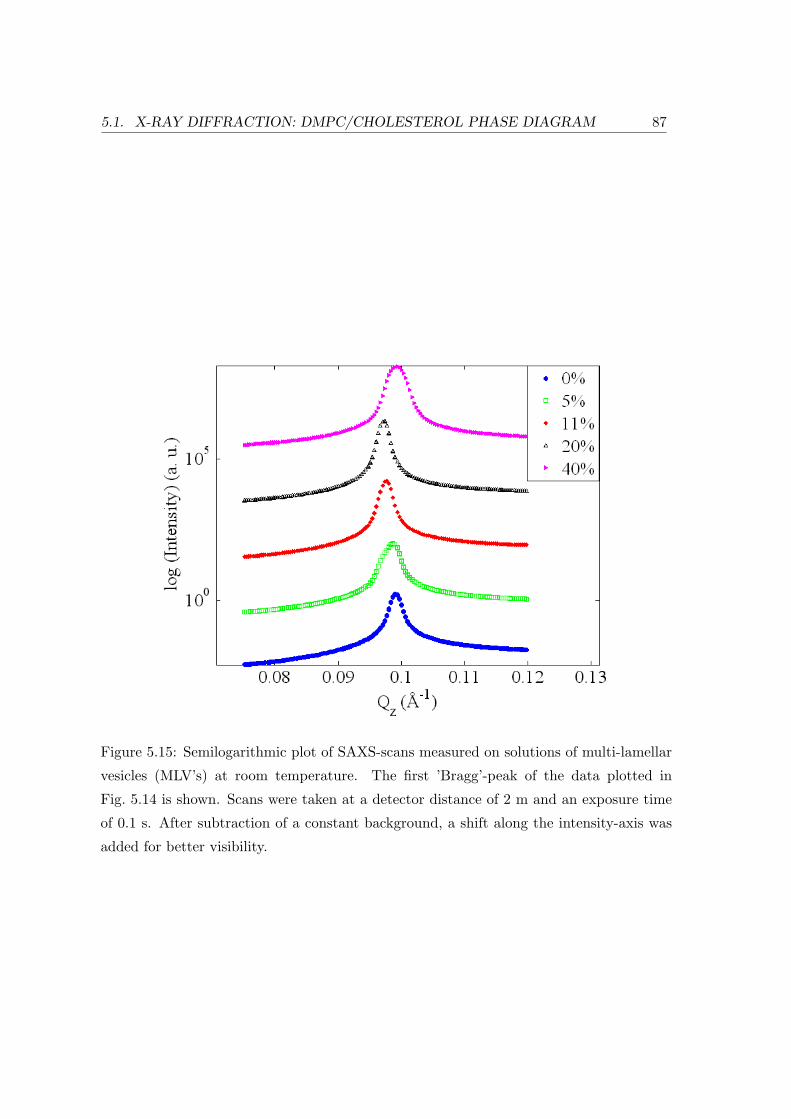
5.1. X-RAY DIFFRACTION: DMPC/CHOLESTEROL PHASE DIAGRAM 87
Figure 5.15: Semilogarithmic plot of SAXS-scans measured on solutions of multi-lamellar
vesicles (MLV’s) at room temperature. The first ’Bragg’-peak of the data plotted in
Fig. 5.14 is shown. Scans were taken at a detector distance of 2 m and an exposure time
of 0.1 s. After subtraction of a constant background, a shift along the intensity-axis was
added for better visibility.
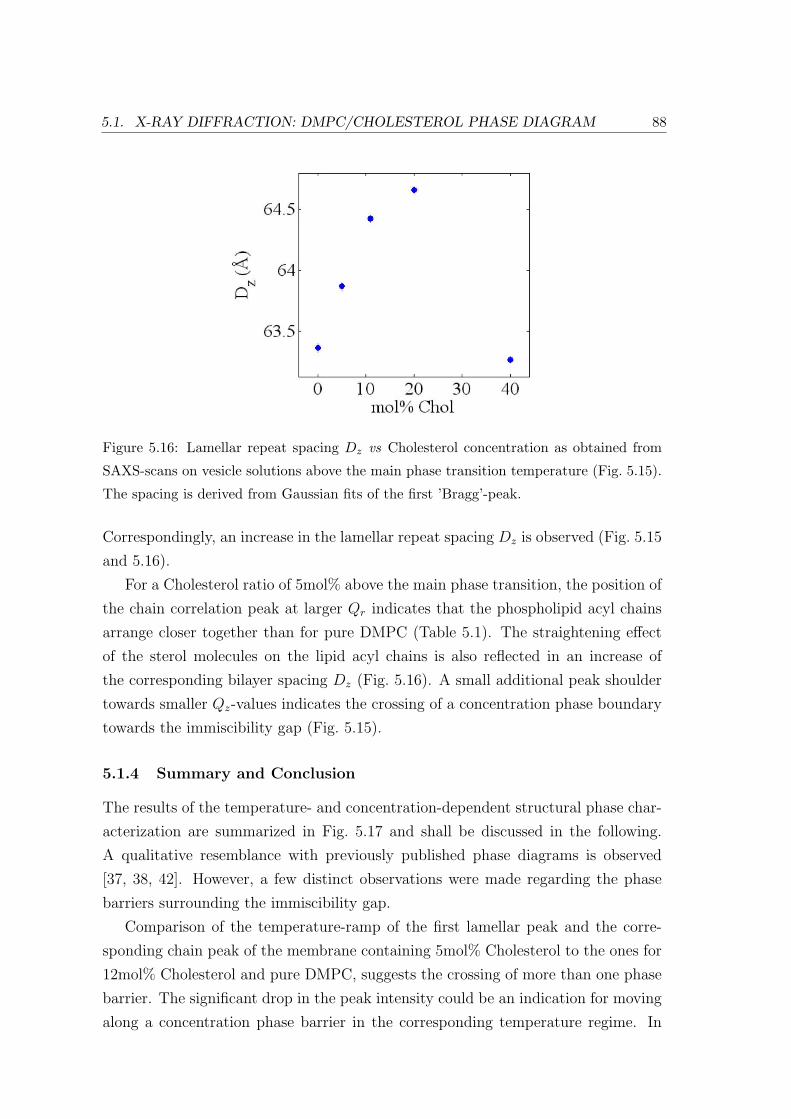
5.1. X-RAY DIFFRACTION: DMPC/CHOLESTEROL PHASE DIAGRAM 88
Figure 5.16: Lamellar repeat spacing Dz vs Cholesterol concentration as obtained from
SAXS-scans on vesicle solutions above the main phase transition temperature (Fig. 5.15).
The spacing is derived from Gaussian fits of the first ’Bragg’-peak.
Correspondingly, an increase in the lamellar repeat spacing Dz is observed (Fig. 5.15
and 5.16).
For a Cholesterol ratio of 5mol% above the main phase transition, the position of
the chain correlation peak at larger Qr indicates that the phospholipid acyl chains
arrange closer together than for pure DMPC (Table 5.1). The straightening effect
of the sterol molecules on the lipid acyl chains is also reflected in an increase of
the corresponding bilayer spacing Dz (Fig. 5.16). A small additional peak shoulder
towards smaller Qz-values indicates the crossing of a concentration phase boundary
towards the immiscibility gap (Fig. 5.15).
5.1.4 Summary and Conclusion
The results of the temperature- and concentration-dependent structural phase char-
acterization are summarized in Fig. 5.17 and shall be discussed in the following.
A qualitative resemblance with previously published phase diagrams is observed
[37, 38, 42]. However, a few distinct observations were made regarding the phase
barriers surrounding the immiscibility gap.
Comparison of the temperature-ramp of the first lamellar peak and the corre-
sponding chain peak of the membrane containing 5mol% Cholesterol to the ones for
12mol% Cholesterol and pure DMPC, suggests the crossing of more than one phase
barrier. The significant drop in the peak intensity could be an indication for moving
along a concentration phase barrier in the corresponding temperature regime. In
5.1. X-RAY DIFFRACTION: DMPC/CHOLESTEROL PHASE DIAGRAM 89
addition to this, a ’pretransition’ can be clearly distinguished at 16C, as well as
the main phase transition at 21C. Whether or not the intermediate phase consists
of lipids in the Pβ′ -phase known to occur for pure DMPC, or a ripple phase Pβ
that is unique to phospholipid/Cholesterol membranes and was first introduced for
DPPC/Cholesterol membranes, [47, 49] remains to be investigated.
For the higher concentrations the formation of Pβ-ripples, which exhibit larger in-
plane periodicities with increasing sterol ratio, as a mechanism to overcome a phase
mismatch, could explain the data for the coexistence regime of the solid S and the
liquid-ordered Lo-phase in a DMPC/Cholesterol membrane as well. Above the main
phase transition no height modulation due to the lateral arrangement of coexisting
phases can be distinguished, but three separate phase regimes are obtained from the
analysis of the respective acyl chain correlation peaks in terms of the average distance
of lipid chains as well the corresponding in-plane correlation length ξr = 1/HWHM.
The exact nature of the phase at high temperatures above the fluid-fluid immis-
cibility gap is still a matter of debate. On the basis of a time-resolved small-angle
x-ray diffraction study, Richter et al. [41] suggest that in the liquid-ordered Lo-
phase sterol molecules move towards the interior of the bilayer. This matches the
observation of an increase in the lamellar Dz-spacing (Fig. 5.11). Corresponding
diffusion processes of Cholesterol molecules have been observed with quasielastic
neutron scattering (QENS) [6, 51].
The present study indicates that boundaries in the DMPC/Cholesterol phase
diagram towards higher sterol concentrations are reached gradually as the product
of a stepwise structural rearrangement of both molecules with respect to each other,
laterally and along the bilayer normal. Unlike for single lipid membranes like DMPC
or DSPC, where increased domain fluctuations occur around one prominent main
phase transition, in a phospholipid/Cholesterol membrane controlled adjustment of
phases over a broad range of temperatures and sterol concentrations is possible.
Due to its largely hydrophobic nature, the Cholesterol molecule exhibits a general
tendency to seek shelter from the inter-bilayer water below the headgroups of sur-
rounding phospholipids (’umbrella model’, cf. 2.3.2). Phase coexistences seem not
to be accompanied by the formation of domains as it is observed, e.g. in single
lipid model membranes around the main phase transition or membranes consisting
of varying mixtures of phospholipids. Therefore phospholipid/Cholesterol systems
in the purely liquid-ordered Lo-phase serve as stable barriers against transmembrane
diffusion, whereas domain fluctuations [106] as well as the collective short wavelength
in-plane chain dynamics have occasionally been linked to such transport phenomena
[1, 2, 8].
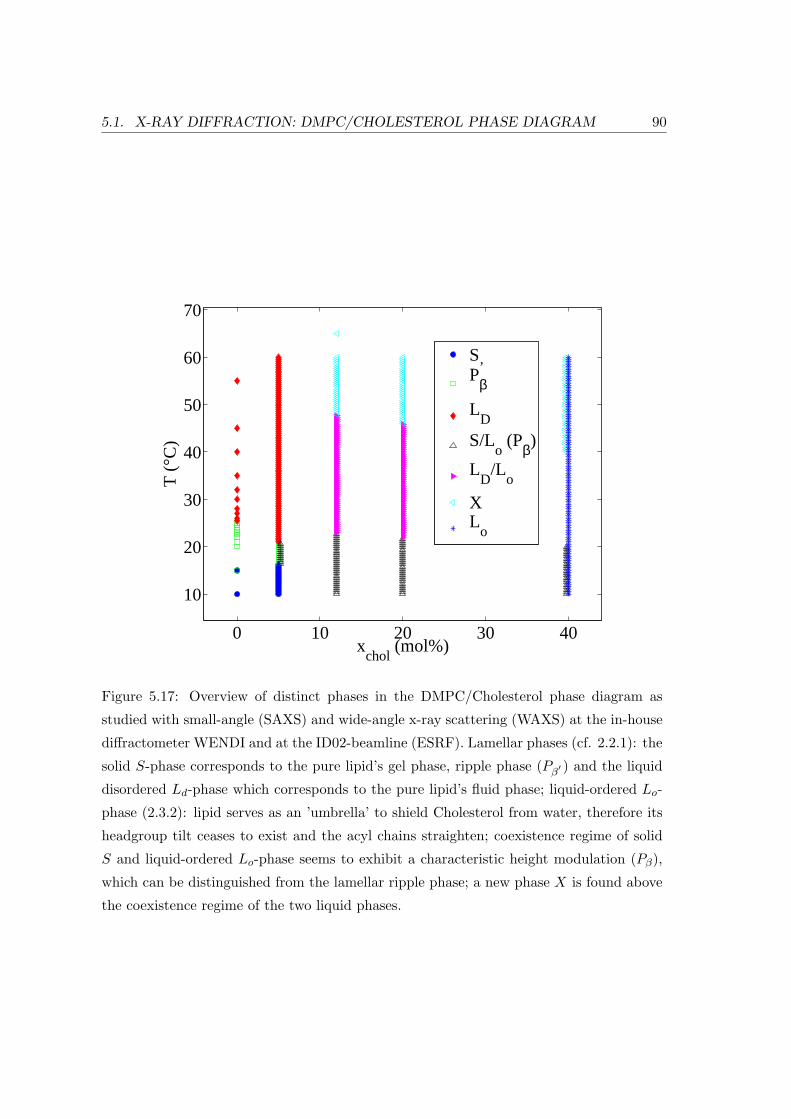
5.1. X-RAY DIFFRACTION: DMPC/CHOLESTEROL PHASE DIAGRAM 90
0 10 20 30 40
10
20
30
40
50
60
70
xchol
(mol%)
T (
°C)
SPβ
’
LD
S/Lo (Pβ)
LD
/Lo
XL
o
Figure 5.17: Overview of distinct phases in the DMPC/Cholesterol phase diagram as
studied with small-angle (SAXS) and wide-angle x-ray scattering (WAXS) at the in-house
diffractometer WENDI and at the ID02-beamline (ESRF). Lamellar phases (cf. 2.2.1): the
solid S-phase corresponds to the pure lipid’s gel phase, ripple phase (Pβ′ ) and the liquid
disordered Ld-phase which corresponds to the pure lipid’s fluid phase; liquid-ordered Lo-
phase (2.3.2): lipid serves as an ’umbrella’ to shield Cholesterol from water, therefore its
headgroup tilt ceases to exist and the acyl chains straighten; coexistence regime of solid
S and liquid-ordered Lo-phase seems to exhibit a characteristic height modulation (Pβ),
which can be distinguished from the lamellar ripple phase; a new phase X is found above
the coexistence regime of the two liquid phases.
5.2. NEUTRON SCATTERING 91
5.2 Neutron Scattering
DMPC-d54 bilayers with two different Cholesterol concentrations were investigated
in a combined study on the three-axis spectrometers IN8 and IN12 to study the
influence of the membrane-active molecule Cholesterol on the structure as well as the
collective in-plane dynamics. In the previous section we have discussed the structural
changes in significant regimes of the DMPC/Cholesterol concentration/temperature
phase diagram obtained by x-ray diffraction on fully hydrated samples. Now we
focus on the structure and corresponding short wavelength dynamics of a lipid bilayer
under the influence of Cholesterol as simultanously probed by the neutron three-axis
technique.
5.2.1 Sample Preparation and Experiment
Highly oriented membrane stacks on silicon wafers were used, as in previous three-
axis experiments (cf. 4.2.1), with a mosaicity better than 0.6 deg. The chain deuter-
ated phospholipid DMPC-d54 as well as Cholesterol, both ordered from Avanti Polar
Lipids with a total mass of about 400 mg, were dissolved in TFE/Chloroform (1:1)
in the desired molar ratios of 5mol% and 40mol%. For each sample the solution with
a concentration of 20 mg/ml was spread on 600 µm thick silicon wafers. The single
wafers were placed on top of each other separated by small air gaps (cf. Fig. 4.10).
The high degree of order allowed to align the sample with respect to the in-
coming beam and distinguish between Qz and Qr (the component perpendicular
and parallel to the membrane surface, respectively). The samples were kept in a
vertically mounted temperature- and humidity-controlled chamber. For each con-
centration and temperature reflectivities S(Qz) were taken before changing to the
in-plane scattering geometry to measure the corresponding elastic S(Qr) and inelas-
tic structure factors S(Qr, ω).
The experiments were performed at the ILL under the combined IN12 and IN8
Proposal CRG-958: Collective dynamics in phospholipid model membranes studied
by inelastic neutron scattering.
5.2.2 Neutron Diffraction: Specific Points in Phase Diagram
The neutron diffraction results presented complement the previously shown x-ray
diffraction results in two ways: On the one hand a contrast is obtained through
the fact that neutrons probe the sample nuclei instead of its electron hull. On
the other hand, an additional contrast was added by selective deuteration of the
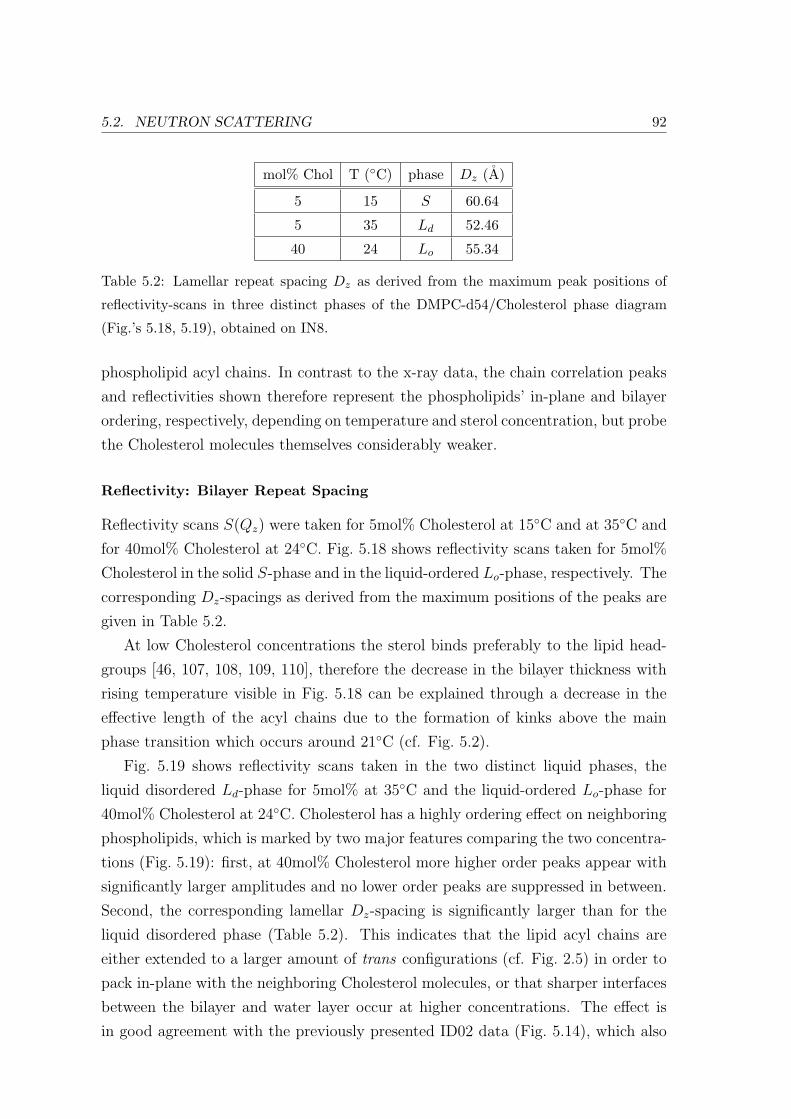
5.2. NEUTRON SCATTERING 92
mol% Chol T (C) phase Dz (A)
5 15 S 60.64
5 35 Ld 52.46
40 24 Lo 55.34
Table 5.2: Lamellar repeat spacing Dz as derived from the maximum peak positions of
reflectivity-scans in three distinct phases of the DMPC-d54/Cholesterol phase diagram
(Fig.’s 5.18, 5.19), obtained on IN8.
phospholipid acyl chains. In contrast to the x-ray data, the chain correlation peaks
and reflectivities shown therefore represent the phospholipids’ in-plane and bilayer
ordering, respectively, depending on temperature and sterol concentration, but probe
the Cholesterol molecules themselves considerably weaker.
Reflectivity: Bilayer Repeat Spacing
Reflectivity scans S(Qz) were taken for 5mol% Cholesterol at 15C and at 35C and
for 40mol% Cholesterol at 24C. Fig. 5.18 shows reflectivity scans taken for 5mol%
Cholesterol in the solid S-phase and in the liquid-ordered Lo-phase, respectively. The
corresponding Dz-spacings as derived from the maximum positions of the peaks are
given in Table 5.2.
At low Cholesterol concentrations the sterol binds preferably to the lipid head-
groups [46, 107, 108, 109, 110], therefore the decrease in the bilayer thickness with
rising temperature visible in Fig. 5.18 can be explained through a decrease in the
effective length of the acyl chains due to the formation of kinks above the main
phase transition which occurs around 21C (cf. Fig. 5.2).
Fig. 5.19 shows reflectivity scans taken in the two distinct liquid phases, the
liquid disordered Ld-phase for 5mol% at 35C and the liquid-ordered Lo-phase for
40mol% Cholesterol at 24C. Cholesterol has a highly ordering effect on neighboring
phospholipids, which is marked by two major features comparing the two concentra-
tions (Fig. 5.19): first, at 40mol% Cholesterol more higher order peaks appear with
significantly larger amplitudes and no lower order peaks are suppressed in between.
Second, the corresponding lamellar Dz-spacing is significantly larger than for the
liquid disordered phase (Table 5.2). This indicates that the lipid acyl chains are
either extended to a larger amount of trans configurations (cf. Fig. 2.5) in order to
pack in-plane with the neighboring Cholesterol molecules, or that sharper interfaces
between the bilayer and water layer occur at higher concentrations. The effect is
in good agreement with the previously presented ID02 data (Fig. 5.14), which also
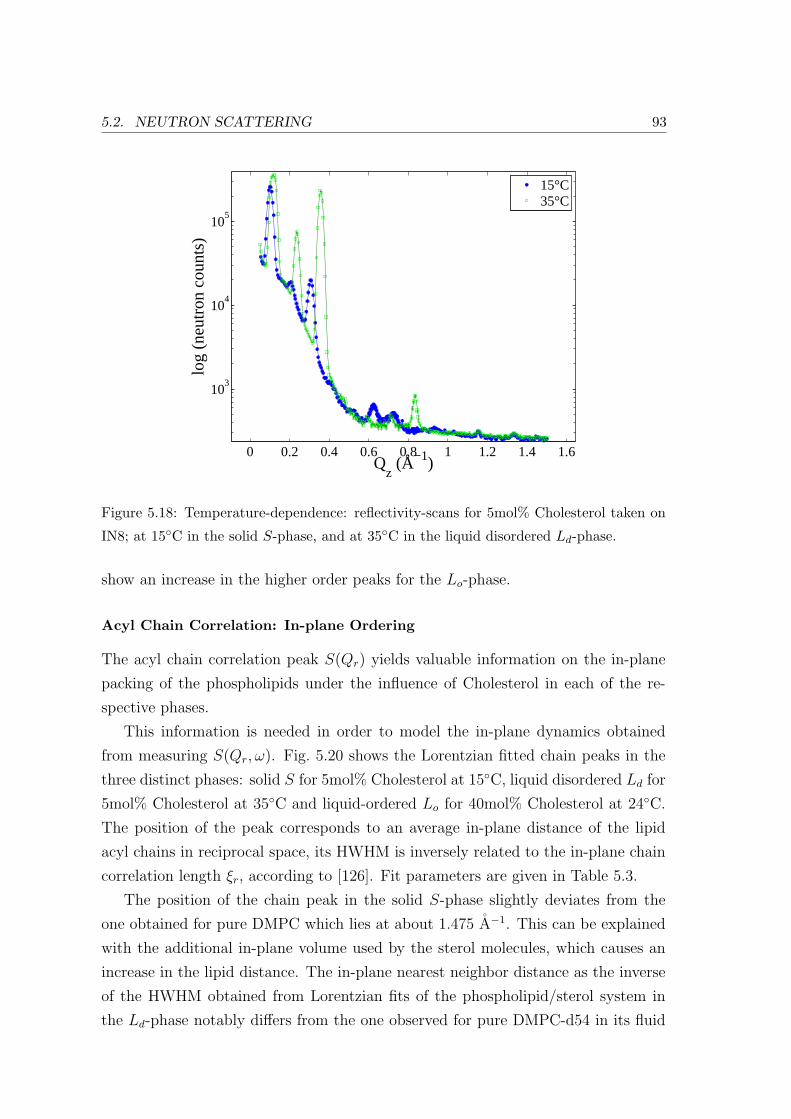
5.2. NEUTRON SCATTERING 93
0 0.2 0.4 0.6 0.8 1 1.2 1.4 1.6
103
104
105
Qz (Å−1)
log
(neu
tron
cou
nts)
15°C35°C
Figure 5.18: Temperature-dependence: reflectivity-scans for 5mol% Cholesterol taken on
IN8; at 15C in the solid S-phase, and at 35C in the liquid disordered Ld-phase.
show an increase in the higher order peaks for the Lo-phase.
Acyl Chain Correlation: In-plane Ordering
The acyl chain correlation peak S(Qr) yields valuable information on the in-plane
packing of the phospholipids under the influence of Cholesterol in each of the re-
spective phases.
This information is needed in order to model the in-plane dynamics obtained
from measuring S(Qr, ω). Fig. 5.20 shows the Lorentzian fitted chain peaks in the
three distinct phases: solid S for 5mol% Cholesterol at 15C, liquid disordered Ld for
5mol% Cholesterol at 35C and liquid-ordered Lo for 40mol% Cholesterol at 24C.
The position of the peak corresponds to an average in-plane distance of the lipid
acyl chains in reciprocal space, its HWHM is inversely related to the in-plane chain
correlation length ξr, according to [126]. Fit parameters are given in Table 5.3.
The position of the chain peak in the solid S-phase slightly deviates from the
one obtained for pure DMPC which lies at about 1.475 A−1. This can be explained
with the additional in-plane volume used by the sterol molecules, which causes an
increase in the lipid distance. The in-plane nearest neighbor distance as the inverse
of the HWHM obtained from Lorentzian fits of the phospholipid/sterol system in
the Ld-phase notably differs from the one observed for pure DMPC-d54 in its fluid
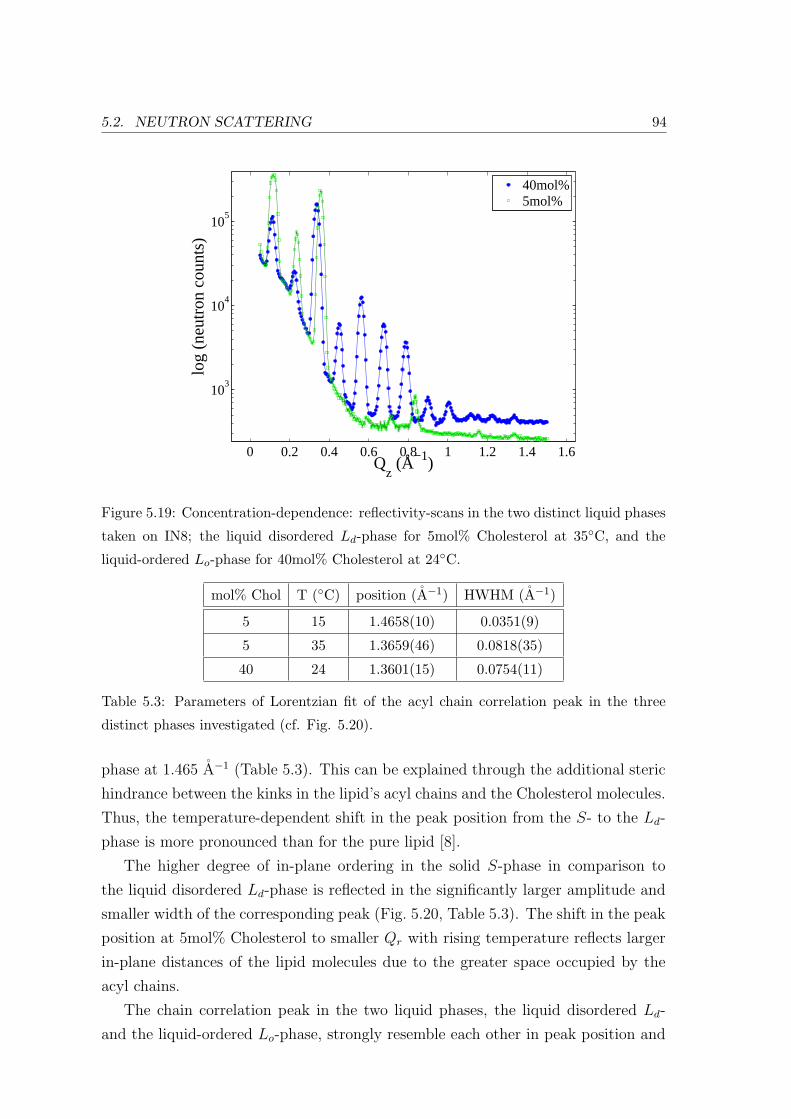
5.2. NEUTRON SCATTERING 94
0 0.2 0.4 0.6 0.8 1 1.2 1.4 1.6
103
104
105
Qz (Å−1)
log
(neu
tron
cou
nts)
40mol%5mol%
Figure 5.19: Concentration-dependence: reflectivity-scans in the two distinct liquid phases
taken on IN8; the liquid disordered Ld-phase for 5mol% Cholesterol at 35C, and the
liquid-ordered Lo-phase for 40mol% Cholesterol at 24C.
mol% Chol T (C) position (A−1) HWHM (A−1)
5 15 1.4658(10) 0.0351(9)
5 35 1.3659(46) 0.0818(35)
40 24 1.3601(15) 0.0754(11)
Table 5.3: Parameters of Lorentzian fit of the acyl chain correlation peak in the three
distinct phases investigated (cf. Fig. 5.20).
phase at 1.465 A−1 (Table 5.3). This can be explained through the additional steric
hindrance between the kinks in the lipid’s acyl chains and the Cholesterol molecules.
Thus, the temperature-dependent shift in the peak position from the S- to the Ld-
phase is more pronounced than for the pure lipid [8].
The higher degree of in-plane ordering in the solid S-phase in comparison to
the liquid disordered Ld-phase is reflected in the significantly larger amplitude and
smaller width of the corresponding peak (Fig. 5.20, Table 5.3). The shift in the peak
position at 5mol% Cholesterol to smaller Qr with rising temperature reflects larger
in-plane distances of the lipid molecules due to the greater space occupied by the
acyl chains.
The chain correlation peak in the two liquid phases, the liquid disordered Ld-
and the liquid-ordered Lo-phase, strongly resemble each other in peak position and
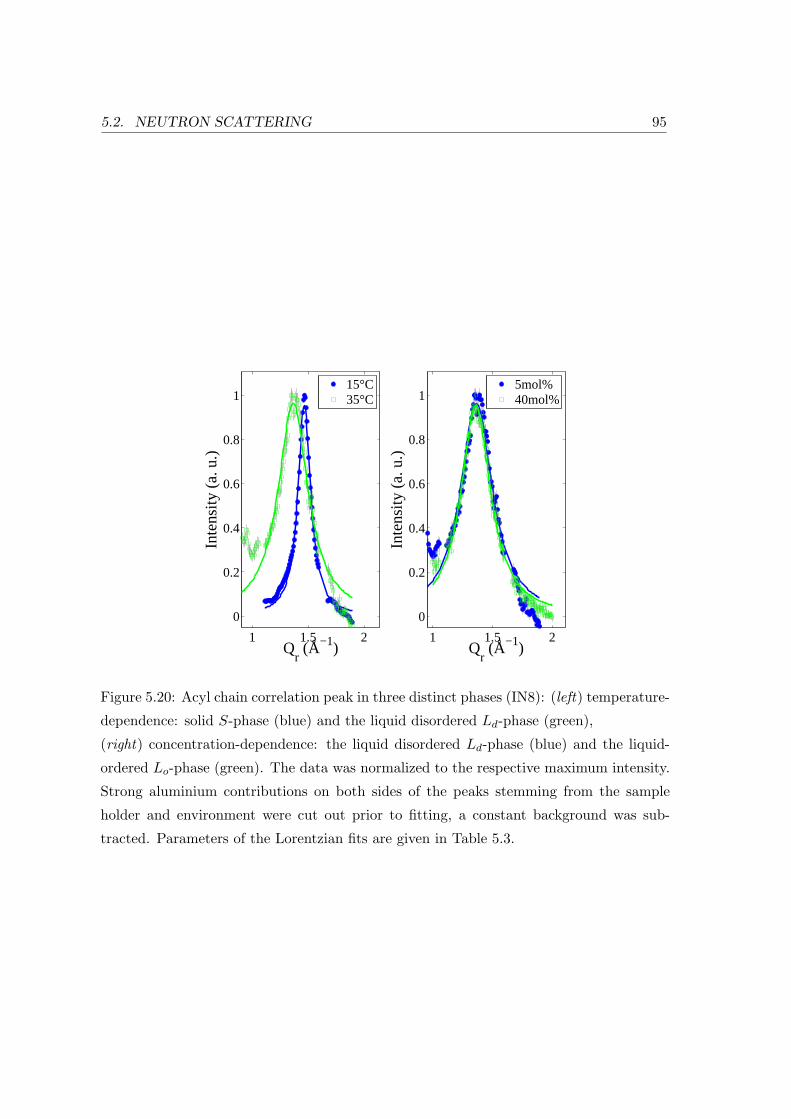
5.2. NEUTRON SCATTERING 95
1 1.5 2
0
0.2
0.4
0.6
0.8
1
Qr (Å−1)
Inte
nsity
(a.
u.)
15°C35°C
1 1.5 2
0
0.2
0.4
0.6
0.8
1
Qr (Å−1)
Inte
nsity
(a.
u.)
5mol%40mol%
Figure 5.20: Acyl chain correlation peak in three distinct phases (IN8): (left) temperature-
dependence: solid S-phase (blue) and the liquid disordered Ld-phase (green),
(right) concentration-dependence: the liquid disordered Ld-phase (blue) and the liquid-
ordered Lo-phase (green). The data was normalized to the respective maximum intensity.
Strong aluminium contributions on both sides of the peaks stemming from the sample
holder and environment were cut out prior to fitting, a constant background was sub-
tracted. Parameters of the Lorentzian fits are given in Table 5.3.
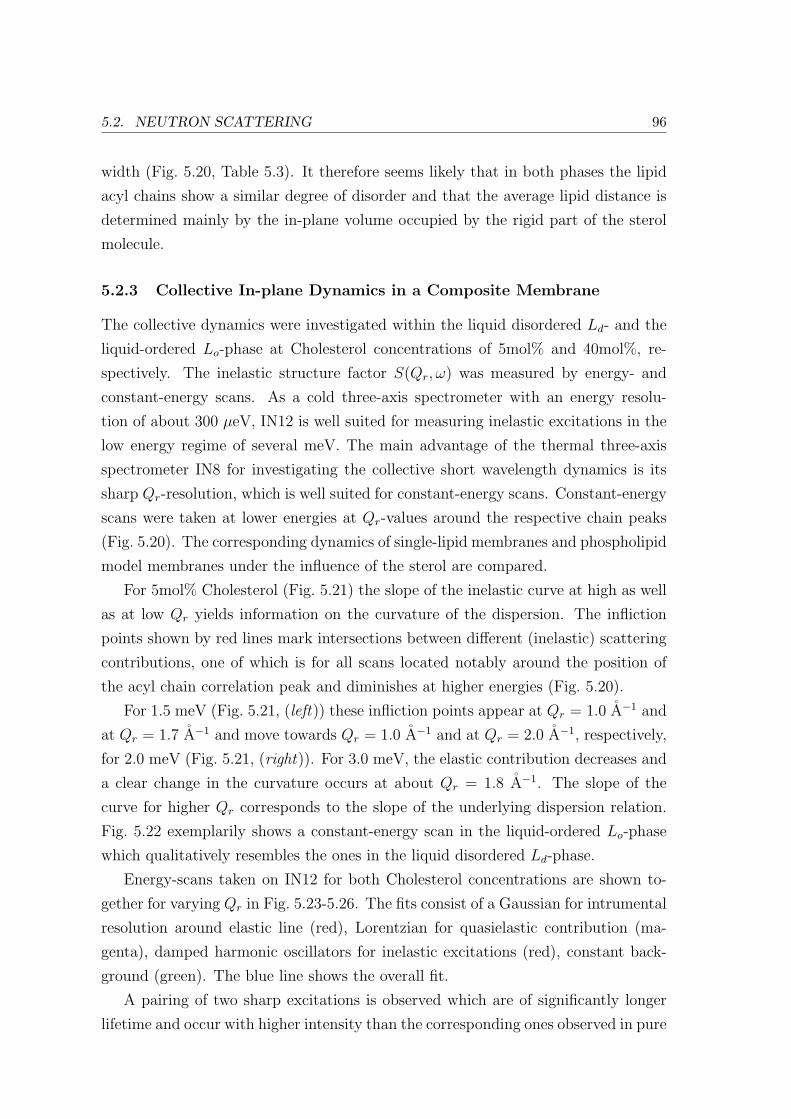
5.2. NEUTRON SCATTERING 96
width (Fig. 5.20, Table 5.3). It therefore seems likely that in both phases the lipid
acyl chains show a similar degree of disorder and that the average lipid distance is
determined mainly by the in-plane volume occupied by the rigid part of the sterol
molecule.
5.2.3 Collective In-plane Dynamics in a Composite Membrane
The collective dynamics were investigated within the liquid disordered Ld- and the
liquid-ordered Lo-phase at Cholesterol concentrations of 5mol% and 40mol%, re-
spectively. The inelastic structure factor S(Qr, ω) was measured by energy- and
constant-energy scans. As a cold three-axis spectrometer with an energy resolu-
tion of about 300 µeV, IN12 is well suited for measuring inelastic excitations in the
low energy regime of several meV. The main advantage of the thermal three-axis
spectrometer IN8 for investigating the collective short wavelength dynamics is its
sharp Qr-resolution, which is well suited for constant-energy scans. Constant-energy
scans were taken at lower energies at Qr-values around the respective chain peaks
(Fig. 5.20). The corresponding dynamics of single-lipid membranes and phospholipid
model membranes under the influence of the sterol are compared.
For 5mol% Cholesterol (Fig. 5.21) the slope of the inelastic curve at high as well
as at low Qr yields information on the curvature of the dispersion. The infliction
points shown by red lines mark intersections between different (inelastic) scattering
contributions, one of which is for all scans located notably around the position of
the acyl chain correlation peak and diminishes at higher energies (Fig. 5.20).
For 1.5 meV (Fig. 5.21, (left)) these infliction points appear at Qr = 1.0 A−1 and
at Qr = 1.7 A−1 and move towards Qr = 1.0 A−1 and at Qr = 2.0 A−1, respectively,
for 2.0 meV (Fig. 5.21, (right)). For 3.0 meV, the elastic contribution decreases and
a clear change in the curvature occurs at about Qr = 1.8 A−1. The slope of the
curve for higher Qr corresponds to the slope of the underlying dispersion relation.
Fig. 5.22 exemplarily shows a constant-energy scan in the liquid-ordered Lo-phase
which qualitatively resembles the ones in the liquid disordered Ld-phase.
Energy-scans taken on IN12 for both Cholesterol concentrations are shown to-
gether for varying Qr in Fig. 5.23-5.26. The fits consist of a Gaussian for intrumental
resolution around elastic line (red), Lorentzian for quasielastic contribution (ma-
genta), damped harmonic oscillators for inelastic excitations (red), constant back-
ground (green). The blue line shows the overall fit.
A pairing of two sharp excitations is observed which are of significantly longer
lifetime and occur with higher intensity than the corresponding ones observed in pure
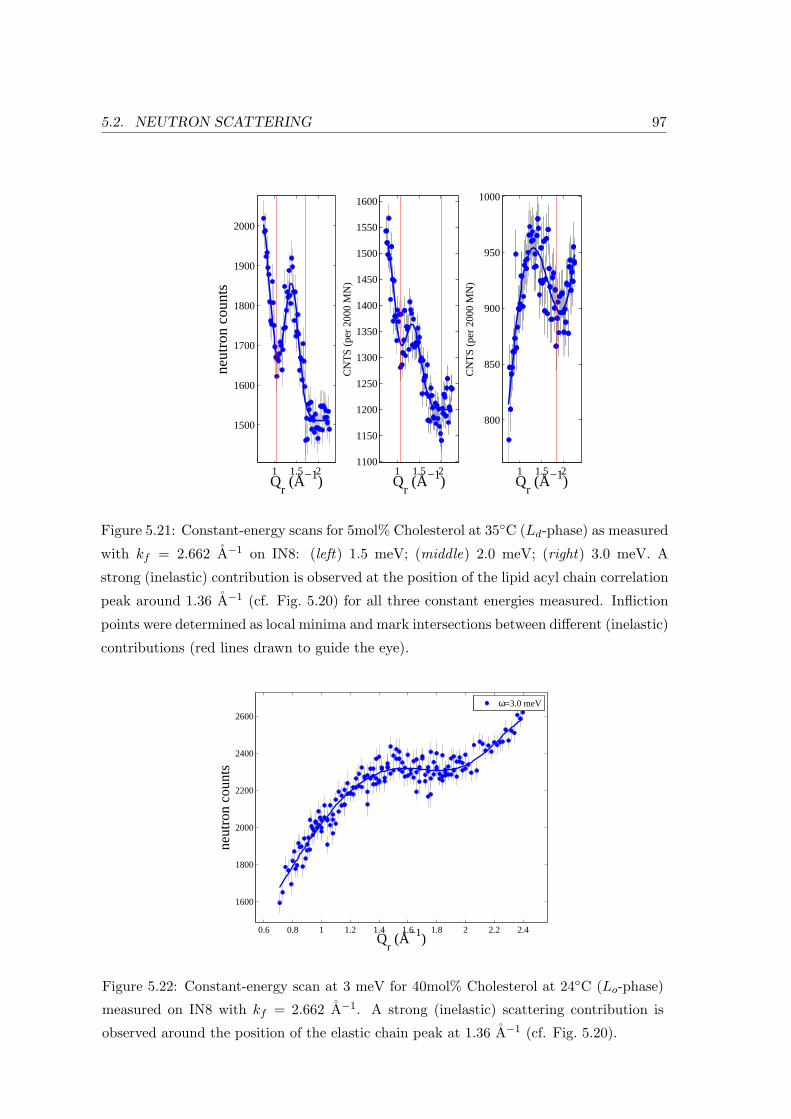
5.2. NEUTRON SCATTERING 97
1 1.5 2
1500
1600
1700
1800
1900
2000
Qr (Å−1)
neut
ron
coun
ts
1 1.5 21100
1150
1200
1250
1300
1350
1400
1450
1500
1550
1600
Qr (Å−1)
CN
TS
(pe
r 20
00 M
N)
1 1.5 2
800
850
900
950
1000
Qr (Å−1)
CN
TS
(pe
r 20
00 M
N)
Figure 5.21: Constant-energy scans for 5mol% Cholesterol at 35C (Ld-phase) as measured
with kf = 2.662 A−1 on IN8: (left) 1.5 meV; (middle) 2.0 meV; (right) 3.0 meV. A
strong (inelastic) contribution is observed at the position of the lipid acyl chain correlation
peak around 1.36 A−1 (cf. Fig. 5.20) for all three constant energies measured. Infliction
points were determined as local minima and mark intersections between different (inelastic)
contributions (red lines drawn to guide the eye).
0.6 0.8 1 1.2 1.4 1.6 1.8 2 2.2 2.4
1600
1800
2000
2200
2400
2600
Qr (Å−1)
neut
ron
coun
ts
ω=3.0 meV
Figure 5.22: Constant-energy scan at 3 meV for 40mol% Cholesterol at 24C (Lo-phase)
measured on IN8 with kf = 2.662 A−1. A strong (inelastic) scattering contribution is
observed around the position of the elastic chain peak at 1.36 A−1 (cf. Fig. 5.20).
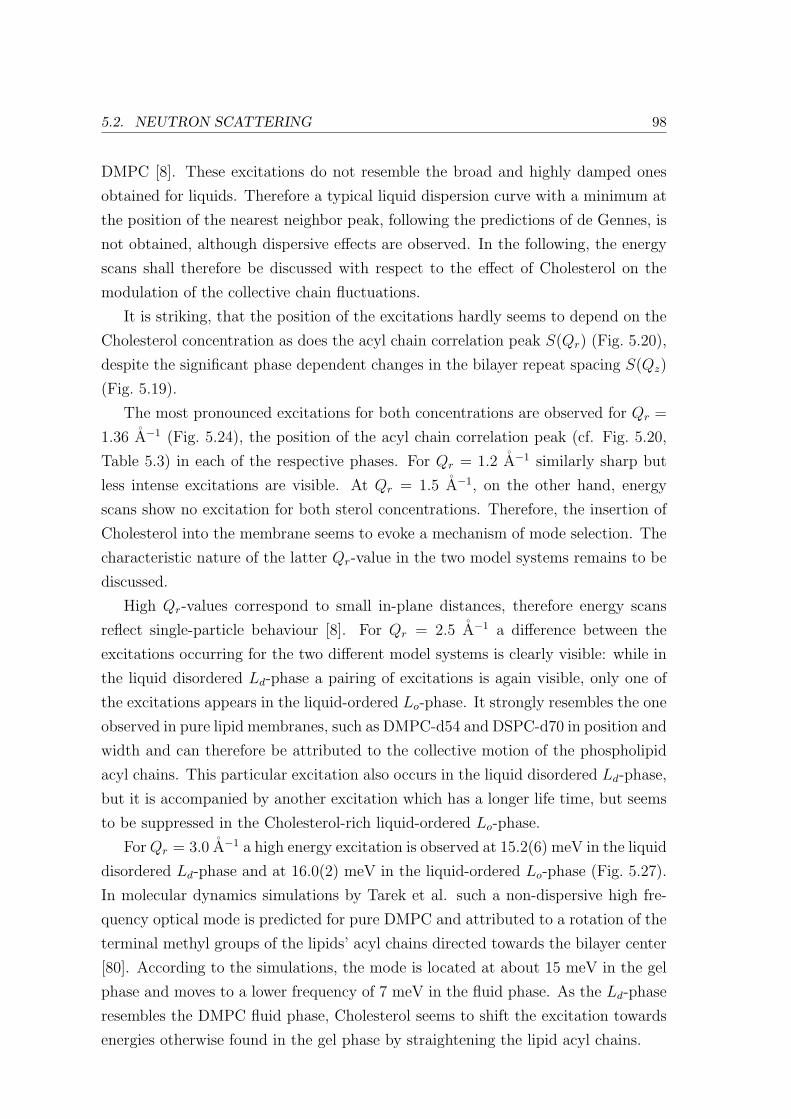
5.2. NEUTRON SCATTERING 98
DMPC [8]. These excitations do not resemble the broad and highly damped ones
obtained for liquids. Therefore a typical liquid dispersion curve with a minimum at
the position of the nearest neighbor peak, following the predictions of de Gennes, is
not obtained, although dispersive effects are observed. In the following, the energy
scans shall therefore be discussed with respect to the effect of Cholesterol on the
modulation of the collective chain fluctuations.
It is striking, that the position of the excitations hardly seems to depend on the
Cholesterol concentration as does the acyl chain correlation peak S(Qr) (Fig. 5.20),
despite the significant phase dependent changes in the bilayer repeat spacing S(Qz)
(Fig. 5.19).
The most pronounced excitations for both concentrations are observed for Qr =
1.36 A−1 (Fig. 5.24), the position of the acyl chain correlation peak (cf. Fig. 5.20,
Table 5.3) in each of the respective phases. For Qr = 1.2 A−1 similarly sharp but
less intense excitations are visible. At Qr = 1.5 A−1, on the other hand, energy
scans show no excitation for both sterol concentrations. Therefore, the insertion of
Cholesterol into the membrane seems to evoke a mechanism of mode selection. The
characteristic nature of the latter Qr-value in the two model systems remains to be
discussed.
High Qr-values correspond to small in-plane distances, therefore energy scans
reflect single-particle behaviour [8]. For Qr = 2.5 A−1 a difference between the
excitations occurring for the two different model systems is clearly visible: while in
the liquid disordered Ld-phase a pairing of excitations is again visible, only one of
the excitations appears in the liquid-ordered Lo-phase. It strongly resembles the one
observed in pure lipid membranes, such as DMPC-d54 and DSPC-d70 in position and
width and can therefore be attributed to the collective motion of the phospholipid
acyl chains. This particular excitation also occurs in the liquid disordered Ld-phase,
but it is accompanied by another excitation which has a longer life time, but seems
to be suppressed in the Cholesterol-rich liquid-ordered Lo-phase.
For Qr = 3.0 A−1 a high energy excitation is observed at 15.2(6) meV in the liquid
disordered Ld-phase and at 16.0(2) meV in the liquid-ordered Lo-phase (Fig. 5.27).
In molecular dynamics simulations by Tarek et al. such a non-dispersive high fre-
quency optical mode is predicted for pure DMPC and attributed to a rotation of the
terminal methyl groups of the lipids’ acyl chains directed towards the bilayer center
[80]. According to the simulations, the mode is located at about 15 meV in the gel
phase and moves to a lower frequency of 7 meV in the fluid phase. As the Ld-phase
resembles the DMPC fluid phase, Cholesterol seems to shift the excitation towards
energies otherwise found in the gel phase by straightening the lipid acyl chains.
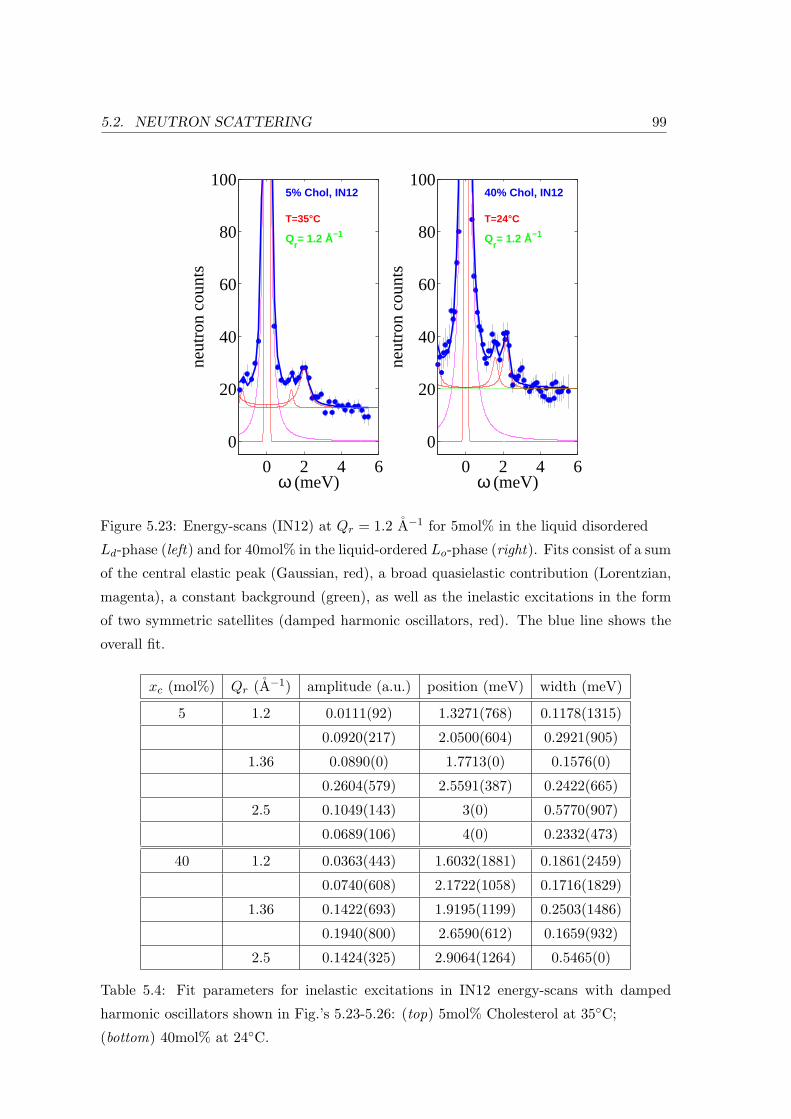
5.2. NEUTRON SCATTERING 99
0 2 4 6
0
20
40
60
80
100
ω (meV)
neut
ron
coun
ts5% Chol, IN12
T=35°C
Qr= 1.2 Å−1
0 2 4 6
0
20
40
60
80
100
ω (meV)
neut
ron
coun
ts
40% Chol, IN12
T=24°C
Qr= 1.2 Å−1
Figure 5.23: Energy-scans (IN12) at Qr = 1.2 A−1 for 5mol% in the liquid disordered
Ld-phase (left) and for 40mol% in the liquid-ordered Lo-phase (right). Fits consist of a sum
of the central elastic peak (Gaussian, red), a broad quasielastic contribution (Lorentzian,
magenta), a constant background (green), as well as the inelastic excitations in the form
of two symmetric satellites (damped harmonic oscillators, red). The blue line shows the
overall fit.
xc (mol%) Qr (A−1) amplitude (a.u.) position (meV) width (meV)
5 1.2 0.0111(92) 1.3271(768) 0.1178(1315)
0.0920(217) 2.0500(604) 0.2921(905)
1.36 0.0890(0) 1.7713(0) 0.1576(0)
0.2604(579) 2.5591(387) 0.2422(665)
2.5 0.1049(143) 3(0) 0.5770(907)
0.0689(106) 4(0) 0.2332(473)
40 1.2 0.0363(443) 1.6032(1881) 0.1861(2459)
0.0740(608) 2.1722(1058) 0.1716(1829)
1.36 0.1422(693) 1.9195(1199) 0.2503(1486)
0.1940(800) 2.6590(612) 0.1659(932)
2.5 0.1424(325) 2.9064(1264) 0.5465(0)
Table 5.4: Fit parameters for inelastic excitations in IN12 energy-scans with damped
harmonic oscillators shown in Fig.’s 5.23-5.26: (top) 5mol% Cholesterol at 35C;
(bottom) 40mol% at 24C.
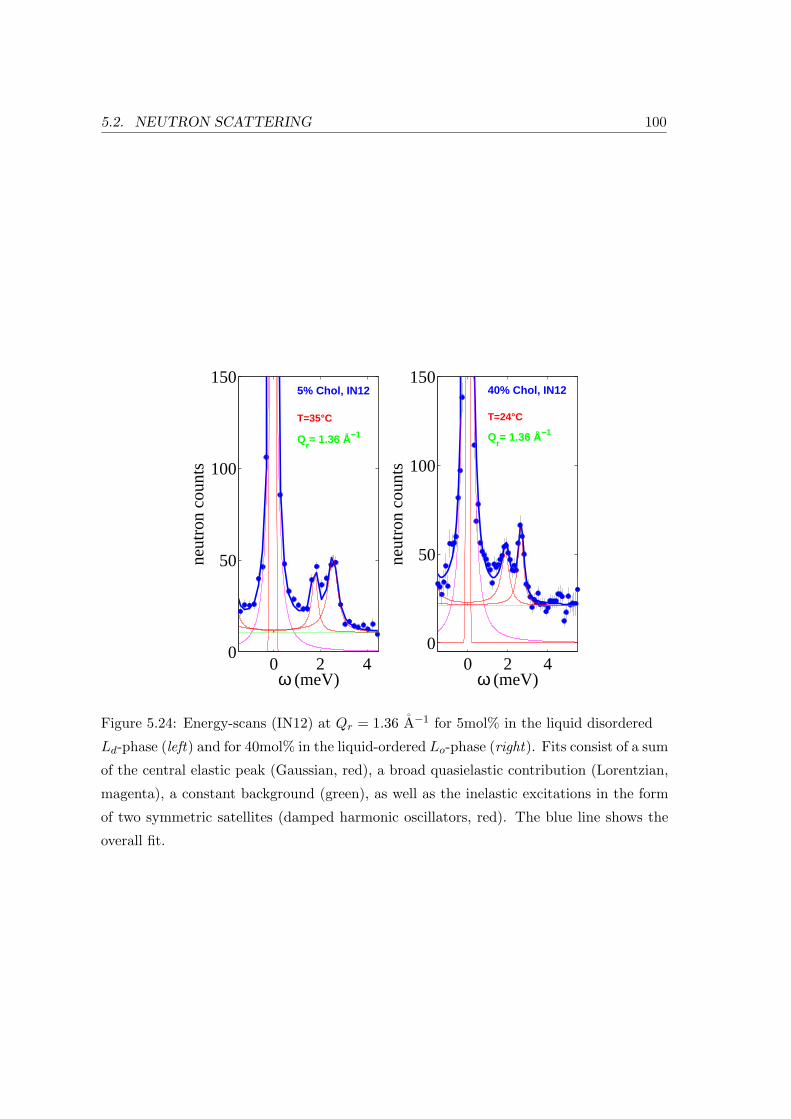
5.2. NEUTRON SCATTERING 100
0 2 40
50
100
150
ω (meV)
neut
ron
coun
ts
5% Chol, IN12
T=35°C
Qr= 1.36 Å−1
0 2 40
50
100
150
ω (meV)
neut
ron
coun
ts40% Chol, IN12
T=24°C
Qr= 1.36 Å−1
Figure 5.24: Energy-scans (IN12) at Qr = 1.36 A−1 for 5mol% in the liquid disordered
Ld-phase (left) and for 40mol% in the liquid-ordered Lo-phase (right). Fits consist of a sum
of the central elastic peak (Gaussian, red), a broad quasielastic contribution (Lorentzian,
magenta), a constant background (green), as well as the inelastic excitations in the form
of two symmetric satellites (damped harmonic oscillators, red). The blue line shows the
overall fit.
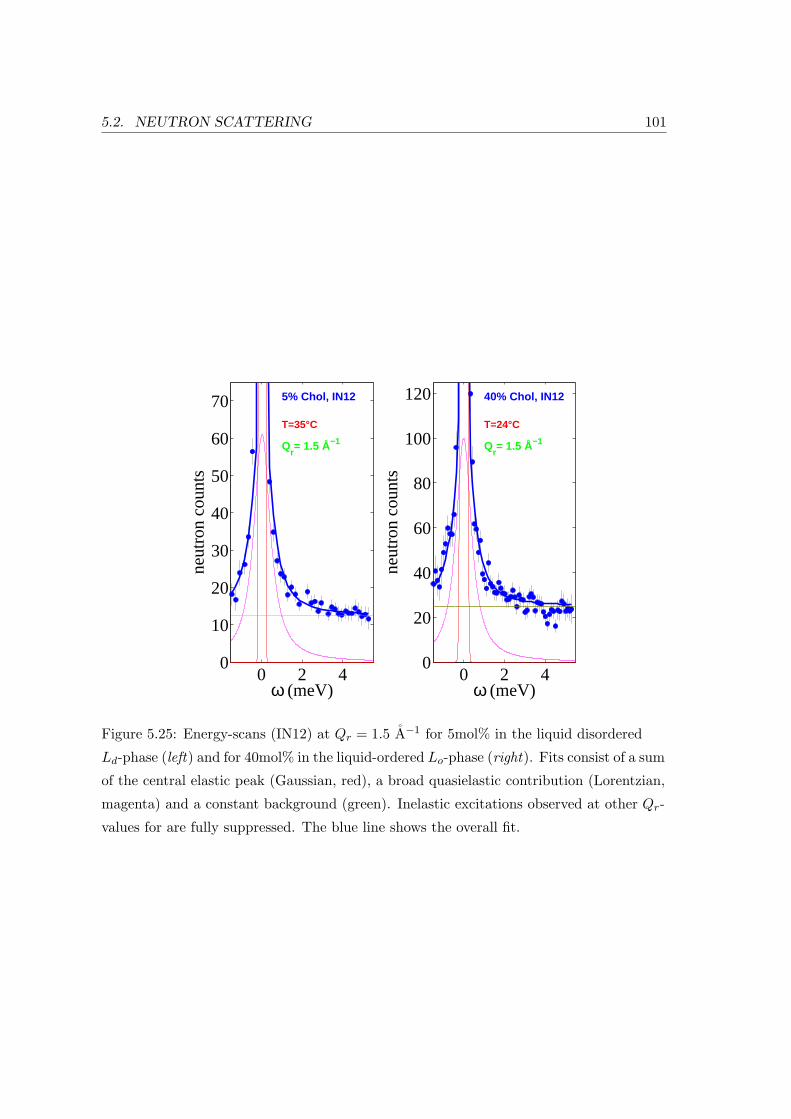
5.2. NEUTRON SCATTERING 101
0 2 40
10
20
30
40
50
60
70
ω (meV)
neut
ron
coun
ts
5% Chol, IN12
T=35°C
Qr= 1.5 Å−1
0 2 40
20
40
60
80
100
120
ω (meV)
neut
ron
coun
ts40% Chol, IN12
T=24°C
Qr= 1.5 Å−1
Figure 5.25: Energy-scans (IN12) at Qr = 1.5 A−1 for 5mol% in the liquid disordered
Ld-phase (left) and for 40mol% in the liquid-ordered Lo-phase (right). Fits consist of a sum
of the central elastic peak (Gaussian, red), a broad quasielastic contribution (Lorentzian,
magenta) and a constant background (green). Inelastic excitations observed at other Qr-
values for are fully suppressed. The blue line shows the overall fit.
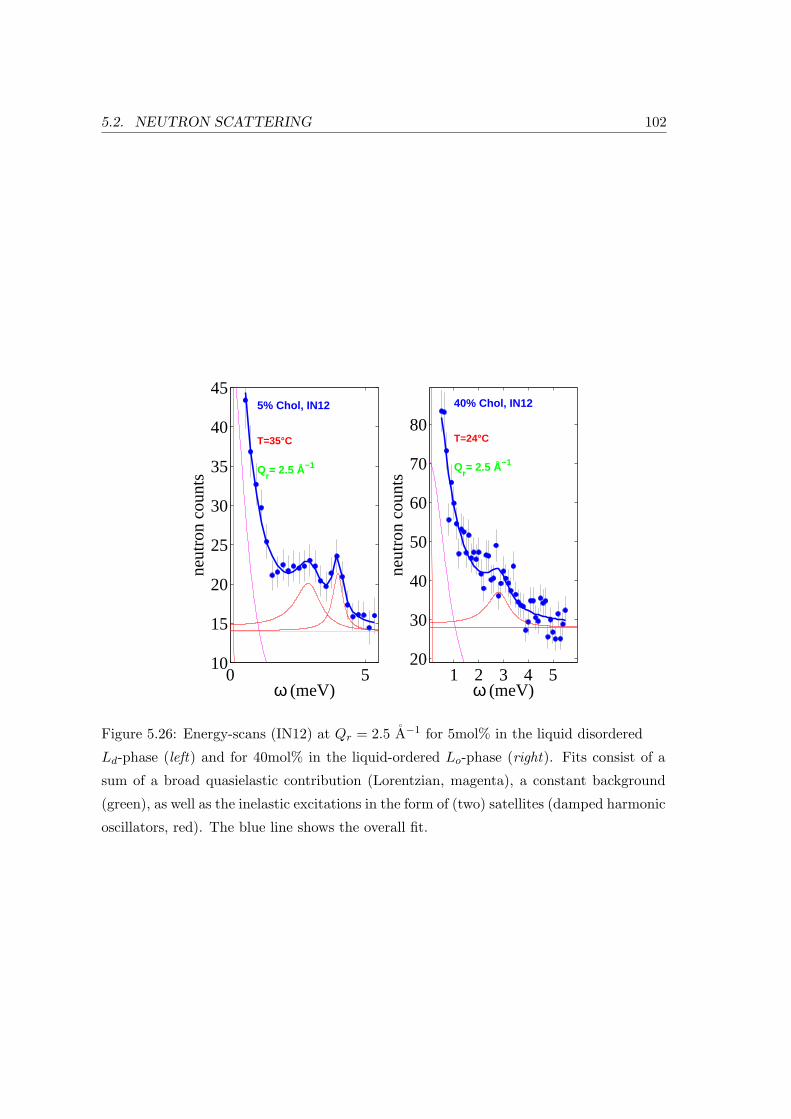
5.2. NEUTRON SCATTERING 102
0 510
15
20
25
30
35
40
45
ω (meV)
neut
ron
coun
ts
5% Chol, IN12
T=35°C
Qr= 2.5 Å−1
1 2 3 4 520
30
40
50
60
70
80
ω (meV)
neut
ron
coun
ts40% Chol, IN12
T=24°C
Qr= 2.5 Å−1
Figure 5.26: Energy-scans (IN12) at Qr = 2.5 A−1 for 5mol% in the liquid disordered
Ld-phase (left) and for 40mol% in the liquid-ordered Lo-phase (right). Fits consist of a
sum of a broad quasielastic contribution (Lorentzian, magenta), a constant background
(green), as well as the inelastic excitations in the form of (two) satellites (damped harmonic
oscillators, red). The blue line shows the overall fit.
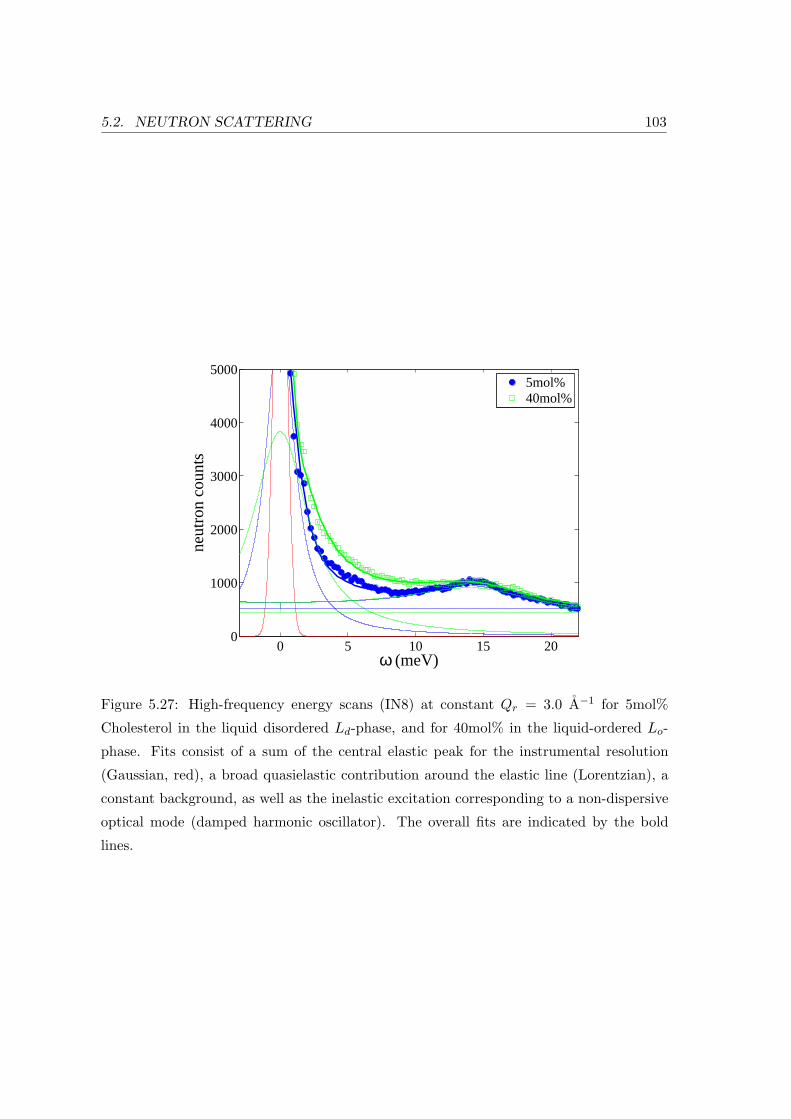
5.2. NEUTRON SCATTERING 103
0 5 10 15 200
1000
2000
3000
4000
5000
ω (meV)
neut
ron
coun
ts
5mol%40mol%
Figure 5.27: High-frequency energy scans (IN8) at constant Qr = 3.0 A−1 for 5mol%
Cholesterol in the liquid disordered Ld-phase, and for 40mol% in the liquid-ordered Lo-
phase. Fits consist of a sum of the central elastic peak for the instrumental resolution
(Gaussian, red), a broad quasielastic contribution around the elastic line (Lorentzian), a
constant background, as well as the inelastic excitation corresponding to a non-dispersive
optical mode (damped harmonic oscillator). The overall fits are indicated by the bold
lines.
5.2. NEUTRON SCATTERING 104
5.2.4 Discussion
Model membranes consisting of single lipids have often been described as liquid
crystalline phases in literature [111, 112, 113]. At the same time, the collective
in-plane dynamics of these systems has been shown to exhibit properties similar
to 3-d crystals investigated in solid state physics (such as the existence of optical
and acoustic phonons) on the one hand, on the other hand properties of classical
monoatomic liquids (de Gennes narrowing) [8, 80, 81]. In order to understand the
effect of Cholesterol on the dynamics of the phospholipid acyl chains in a composite
model membrane, both properties of a liquid and of a crystalline system have to be
taken into account.
The origin of the two coexisting excitations at the dispersion minimum for pure
lipid membranes (previous chapter) was explained by the coexistence of phases with
gel and fluid domains, which each evoke a distinct modulation of the propagating
sonic wave. Note that the in-plane sound velocity can be described as a function
of area compressibility and area density according to cs =√
1κsρ
(κs: in-plane area
density of lipid chain segments). The origin of the two sharp excitations in the
composite membrane, can also be related to two distinct modulations of the collective
in-plane density fluctuations of the lipid acyl chains. However, special care was taken
in the preparation of the inelastic experiments to remain in single defined phases at
all times (cf. section 5.1).
Despite the observation of distinct concentration-dependent superlattice struc-
tures of phospholipids and Cholesterol in literature [114, 115], the formation of
domains with diameters larger than a few molecule distances can be excluded in
all phases, which is explained by the ’umbrella model’ (cf. 2.3.2): Due to its hy-
drophobicity Cholesterol seeks shelter from inter-bilayer water in close proximity to
the surrounding phospholipids. Therefore it seems justified to assume that the two
different excitations are caused by varying modulations of the collective motions of
the lipid acyl chains themselves. The fact that the pairing of the two excitations
observed in both phases do not differ much in their energy-positions and lifetimes
suggests a rather robust and conformation and concentration independent mecha-
nism.
In MD-simulations a significant change in the influence of Cholesterol on the lipid
acyl chains for the two concentrations is observed only for the middle segments (6-10)
[107] with slight deviation in its position along the bilayer normal. In a mechanical
view the segments of the same chain can be regarded as linked to each other. One
can assume that in a pure DMPC-d54 model membrane several coexisting modes
5.2. NEUTRON SCATTERING 105
propagate as well as interfere. The sterol rings in the composite membrane can then
be regarded as obstacles which could act similar to hinges, thus limit the propagation
of certain modes and thereby evoke only specific interferences. In this picture one of
the excitations would be linked to the collective motion of whole lipid acyl chains,
the other to the collective motion of partial chains. In order to explain the similarity
in the energy-position of the two excitations in both model membranes, the position
of the sterol molecule along the bilayer normal would, however, have to remain
approximately constant.
A variety of views have been offered regarding the exact vertical position of
the sterol molecule in the lipid membrane throughout the phase diagram. Richter
et al. use time resolved small-angle x-ray diffraction to investigate the molecular
aggregation of DMPC and Cholesterol at varying temperatures and concentrations
[41]. They propose that at higher temperatures in the liquid-ordered Lo-phase the
sterol molecules diffuse towards the interior of the bilayer leaflet. Concluding from
their MD-simulations of a membrane with 12.5mol% sterol Tu et al. state that
Cholesterol has no preference to interact with a specific phospholipid molecule part
with its hydroxyl group [110]. In fact at this particular concentration the rigid part
of the sterol molecule can be distributed within a range of approximately 6 A along
the bilayer normal. Therefore the model system might also be considered as a 2-
dimensional liquid consisting of two types of thin (chain segment) layers: one where
a propagating sonic wave encounters the rigid body of a sterol molecule which has to
be circumsized and one which can be passed directly via collective chain movement.
The two approaches might indeed both be seen as valid if one takes into account
the motion of Cholesterol molecules along the bilayer normal in a phospholipid
membrane in the liquid-ordered Lo-phase as observed in quasielastic neutron scat-
tering studies [6, 51]. The authors study the motional degrees of freedom the sterol
molecule has within the lipid membrane at varying temperatures. Whether or not
a long range diffusion of Cholesterol into opposite bilayer leaflets can occur is de-
termined by the conformation of the phospholipid acyl chains. At low temperatures
the all-trans configuration is the predominant one, therefore the sterol molecules are
tightly packed in between the lipid chains. With rising temperatures the in-plane
distances of lipid molecules increase due to kink formation as do the motional de-
grees of freedom of Cholesterol molecules seeking hydrophobic shelter. This means
also the number of end-gauche isomers in the lipid chains increases, which enables
a protrusion of sterol molecules into the opposite monolayer. As a consequence,
the two monolayers are bound together, which not only stabilizes the whole bilayer
in comparison to other phases, but also forms distinctly sharper interfaces between
5.3. SUMMARY AND CONCLUSION 106
layers. The latter effect is observed in the SAXS-scans shown, as well as in neutron
reflectivities.
The intensity of the paired excitations with respect to each other, however, de-
pends on the Cholesterol concentration (cf. Table 5.4) and therefore suggests a
distinct population of states for each of the respective phases.
The energy position of the high-frequency mode does not change with the phase
of the DMPC-d54/Cholesterol system (Lo/Ld). For pure DMPC-d54 the excitation
is related to a rotation of the chain’s terminal methyl groups and its position depends
on the lipid phase [80]. The position of the excitations observed here lies close to
the one in the pure lipid’s gel phase [8]. This can be taken as an indication that
the rigid part of the sterol induces an alignment of the lipid’s acyl chains along the
bilayer normal closely resembling the all-trans configuration. Since the formation
of multiple gauche isomers (’kinks’) along the whole chains is at least partially
suppressed in the given temperature and concentration range due to steric reasons,
also the rotation of the terminal methyl groups is energetically less favorable.
5.3 Summary and Conclusion
In conclusion, what can be learned about the structure and collective in-plane dy-
namics from the presented study: The collective in-plane density fluctuations of the
lipids under the influence of Cholesterol show only weak dispersive effects compared
to pure DMPC. Excitations observed in the energy scans seem to be suppressed
selectively, but are at the same time stronger and less damped than in their pure
lipid counterpart. This is in particular the case at the nearest neighbor distance.
A pronounced (inelastic) scattering contribution is observed around the position of
the acyl chain correlation peak in the constant-energy scans. As in DMPC a high
frequency optical excitation is observed, however, in contrast to the pure lipid’s
energy-position remains independent of the actual phase of the membrane. This can
be understood on the basis of the ordering influence the hydrophobic rigid part of the
Cholesterol molecules has on the lipids’ acyl chains in either of the two phases. Since
modes can no longer propagate isotropically, the DMPC/Cholesterol membrane can
not be regarded similar to a simple liquid as modeled by de Gennes. Note, that
single excitations as described by an effective eigenmode model (cf. 3.2.3) cannot
be expected to describe a binary liquid [88].
Neither the position of the observed excitations nor their distinct life-time seems
to show a pronounced dependence on the position of the sterol molecule along the
bilayer normal. However, the relative intensity of the paired excitations changes
5.3. SUMMARY AND CONCLUSION 107
with respect to each other, depending on the phase. Apart from Cholesterol and
saturated phospholipids, such as DMPC, neural membranes are known to also con-
tain smaller amounts of unsaturated phospholipids which have a low affinity to bind
to sterol molecules [70, 116, 117]. Studies of the interaction of these lipids with
varying degrees of unsaturation with Cholesterol have revealed a tendency to regu-
late the effective in-plane sterol concentration [117, 118], which indicates a naturally
occurring mechanism.
Based on the observed excitations, a picture is proposed where the rigid part of
the Cholesterol molecule effectively shields parts of a fraction of the phospholipid
acyl chains from propagating, and leads to a selection of specific modes. Through
its position, as well as its effective in-plane concentration, a distinct modulation
of the sonic wave is achieved by the rigid sterol body. Whether this modulation
can be specifically influenced, would be interesting to study or by changing further
parameters that determine the state of the membrane, e. g. pressure or ph-value.
Chapter 6
Ethanol in Model Membranes
In this chapter a composite DMPC/Ethanol membrane is investigated. Due to its
small size and similar solubility with respect to unpolar and polar media, Ethanol
increases the interfacial area of lipid and water. Concentration dependent bilayer
unbinding gives valuable qualitative insight into membrane interaction potentials (cf.
2.2.4), as well as a possible structural reorganization, which accompanies the decay.
As is common also to anesthetics (cf. 2.3.3), Ethanol induces a lateral pressure into
the membrane. The effects of this lateral pressure are studied by adding varying
osmotic pressures through a polymer osmolyte. High Ethanol concentrations, like
high osmotic pressures, are found to induce a (partial) interdigitation (cf. 2.3.3).
A complementary structural characterization of the bilayer decay on a signifi-
cantly larger time scale is given as obtained by neutron scattering. The observed
lamellar repeat spacings Dz shows that the interdigitated phase was at least partially
induced, which suggests significant changes in the corresponding collective chain dy-
namics. Scattering contributions to the elastic in-plane structure factor S(Qr) are
introduced and possible implications for the observation of the coherent in-plane
density fluctuations of the lipid acyl chains are discussed.
6.1 X-ray Reflectivity on Model Membranes
When measuring a reflectivity curve, the x-ray beam is commonly collimated to the
order of hundreds of a degree and impinges on the sample at a glancing incidence
angle αi. The reflected intensity is recorded under specular conditions, therefore with
an exit angle of αf = αi. Typically, the data is corrected for partial illumination
of the sample on the one hand, as well as for a contribution of underlying diffuse
scattering, which is subtracted. The diffuse scattering contribution is accounted
for by an offset scan, which means by adding a slight offset ∆αi to the previous
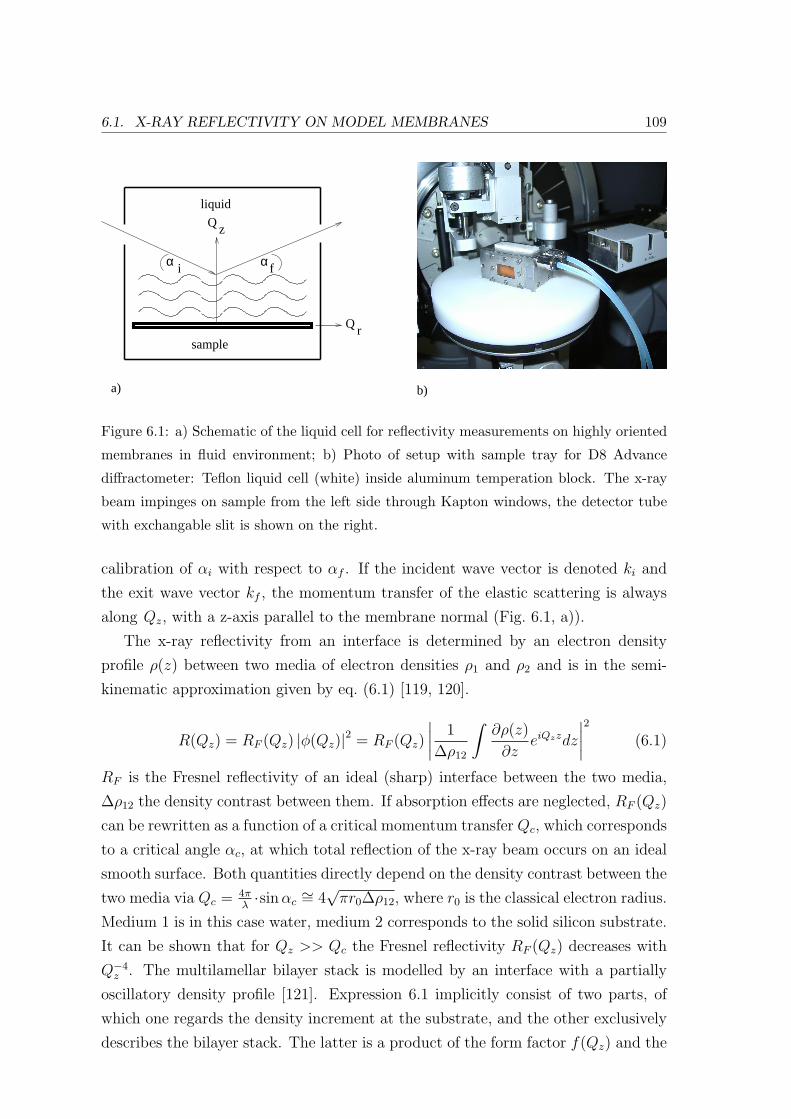
6.1. X-RAY REFLECTIVITY ON MODEL MEMBRANES 109
Q z
α i α f
Q rsample
liquid
b)a)
Figure 6.1: a) Schematic of the liquid cell for reflectivity measurements on highly oriented
membranes in fluid environment; b) Photo of setup with sample tray for D8 Advance
diffractometer: Teflon liquid cell (white) inside aluminum temperation block. The x-ray
beam impinges on sample from the left side through Kapton windows, the detector tube
with exchangable slit is shown on the right.
calibration of αi with respect to αf . If the incident wave vector is denoted ki and
the exit wave vector kf , the momentum transfer of the elastic scattering is always
along Qz, with a z-axis parallel to the membrane normal (Fig. 6.1, a)).
The x-ray reflectivity from an interface is determined by an electron density
profile ρ(z) between two media of electron densities ρ1 and ρ2 and is in the semi-
kinematic approximation given by eq. (6.1) [119, 120].
R(Qz) = RF (Qz) |φ(Qz)|2 = RF (Qz)
∣∣∣∣1
∆ρ12
∫∂ρ(z)
∂zeiQzzdz
∣∣∣∣2
(6.1)
RF is the Fresnel reflectivity of an ideal (sharp) interface between the two media,
∆ρ12 the density contrast between them. If absorption effects are neglected, RF (Qz)
can be rewritten as a function of a critical momentum transfer Qc, which corresponds
to a critical angle αc, at which total reflection of the x-ray beam occurs on an ideal
smooth surface. Both quantities directly depend on the density contrast between the
two media via Qc = 4πλ·sin αc
∼= 4√
πr0∆ρ12, where r0 is the classical electron radius.
Medium 1 is in this case water, medium 2 corresponds to the solid silicon substrate.
It can be shown that for Qz >> Qc the Fresnel reflectivity RF (Qz) decreases with
Q−4z . The multilamellar bilayer stack is modelled by an interface with a partially
oscillatory density profile [121]. Expression 6.1 implicitly consist of two parts, of
which one regards the density increment at the substrate, and the other exclusively
describes the bilayer stack. The latter is a product of the form factor f(Qz) and the
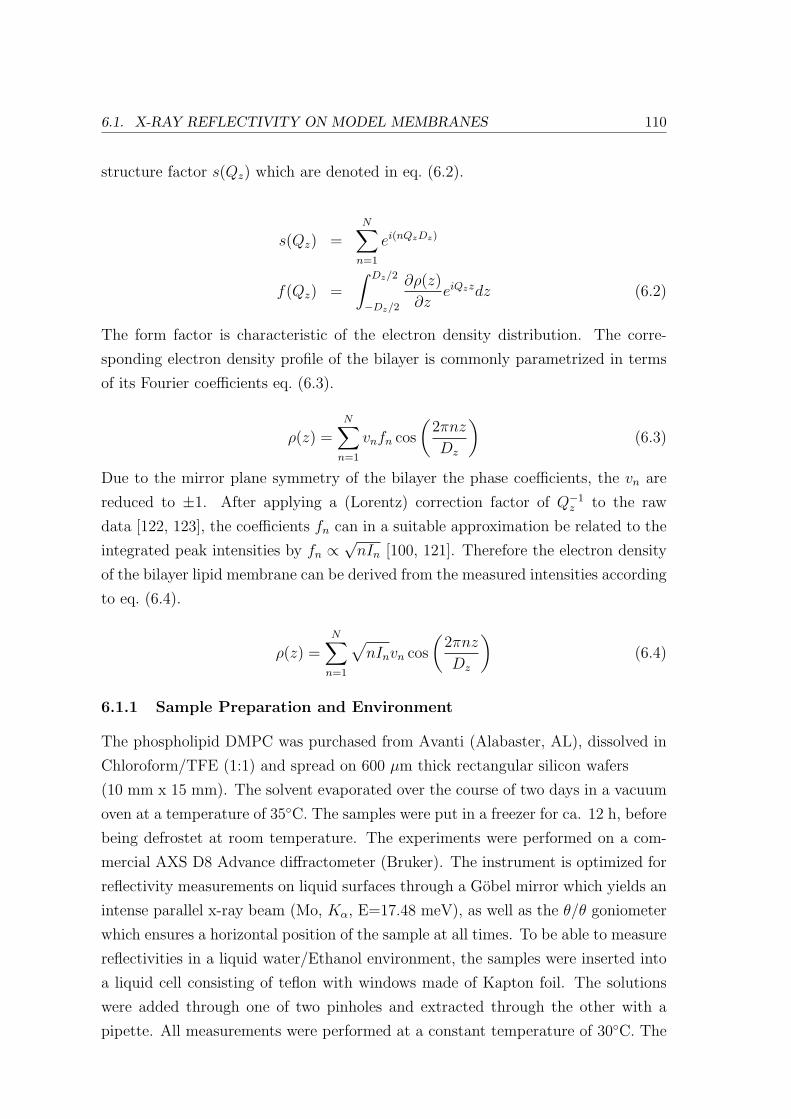
6.1. X-RAY REFLECTIVITY ON MODEL MEMBRANES 110
structure factor s(Qz) which are denoted in eq. (6.2).
s(Qz) =N∑
n=1
ei(nQzDz)
f(Qz) =
∫ Dz/2
−Dz/2
∂ρ(z)
∂zeiQzzdz (6.2)
The form factor is characteristic of the electron density distribution. The corre-
sponding electron density profile of the bilayer is commonly parametrized in terms
of its Fourier coefficients eq. (6.3).
ρ(z) =N∑
n=1
vnfn cos
(2πnz
Dz
)(6.3)
Due to the mirror plane symmetry of the bilayer the phase coefficients, the vn are
reduced to ±1. After applying a (Lorentz) correction factor of Q−1z to the raw
data [122, 123], the coefficients fn can in a suitable approximation be related to the
integrated peak intensities by fn ∝√
nIn [100, 121]. Therefore the electron density
of the bilayer lipid membrane can be derived from the measured intensities according
to eq. (6.4).
ρ(z) =N∑
n=1
√nInvn cos
(2πnz
Dz
)(6.4)
6.1.1 Sample Preparation and Environment
The phospholipid DMPC was purchased from Avanti (Alabaster, AL), dissolved in
Chloroform/TFE (1:1) and spread on 600 µm thick rectangular silicon wafers
(10 mm x 15 mm). The solvent evaporated over the course of two days in a vacuum
oven at a temperature of 35C. The samples were put in a freezer for ca. 12 h, before
being defrostet at room temperature. The experiments were performed on a com-
mercial AXS D8 Advance diffractometer (Bruker). The instrument is optimized for
reflectivity measurements on liquid surfaces through a Gobel mirror which yields an
intense parallel x-ray beam (Mo, Kα, E=17.48 meV), as well as the θ/θ goniometer
which ensures a horizontal position of the sample at all times. To be able to measure
reflectivities in a liquid water/Ethanol environment, the samples were inserted into
a liquid cell consisting of teflon with windows made of Kapton foil. The solutions
were added through one of two pinholes and extracted through the other with a
pipette. All measurements were performed at a constant temperature of 30C. The
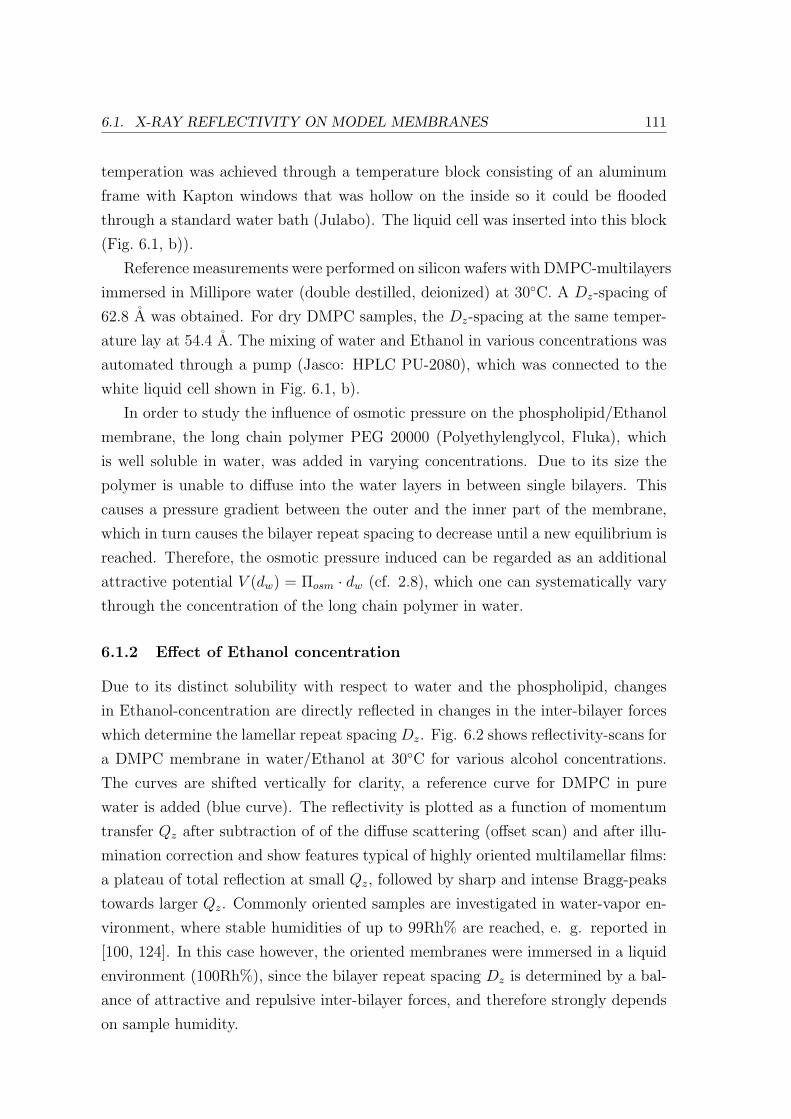
6.1. X-RAY REFLECTIVITY ON MODEL MEMBRANES 111
temperation was achieved through a temperature block consisting of an aluminum
frame with Kapton windows that was hollow on the inside so it could be flooded
through a standard water bath (Julabo). The liquid cell was inserted into this block
(Fig. 6.1, b)).
Reference measurements were performed on silicon wafers with DMPC-multilayers
immersed in Millipore water (double destilled, deionized) at 30C. A Dz-spacing of
62.8 A was obtained. For dry DMPC samples, the Dz-spacing at the same temper-
ature lay at 54.4 A. The mixing of water and Ethanol in various concentrations was
automated through a pump (Jasco: HPLC PU-2080), which was connected to the
white liquid cell shown in Fig. 6.1, b).
In order to study the influence of osmotic pressure on the phospholipid/Ethanol
membrane, the long chain polymer PEG 20000 (Polyethylenglycol, Fluka), which
is well soluble in water, was added in varying concentrations. Due to its size the
polymer is unable to diffuse into the water layers in between single bilayers. This
causes a pressure gradient between the outer and the inner part of the membrane,
which in turn causes the bilayer repeat spacing to decrease until a new equilibrium is
reached. Therefore, the osmotic pressure induced can be regarded as an additional
attractive potential V (dw) = Πosm · dw (cf. 2.8), which one can systematically vary
through the concentration of the long chain polymer in water.
6.1.2 Effect of Ethanol concentration
Due to its distinct solubility with respect to water and the phospholipid, changes
in Ethanol-concentration are directly reflected in changes in the inter-bilayer forces
which determine the lamellar repeat spacing Dz. Fig. 6.2 shows reflectivity-scans for
a DMPC membrane in water/Ethanol at 30C for various alcohol concentrations.
The curves are shifted vertically for clarity, a reference curve for DMPC in pure
water is added (blue curve). The reflectivity is plotted as a function of momentum
transfer Qz after subtraction of of the diffuse scattering (offset scan) and after illu-
mination correction and show features typical of highly oriented multilamellar films:
a plateau of total reflection at small Qz, followed by sharp and intense Bragg-peaks
towards larger Qz. Commonly oriented samples are investigated in water-vapor en-
vironment, where stable humidities of up to 99Rh% are reached, e. g. reported in
[100, 124]. In this case however, the oriented membranes were immersed in a liquid
environment (100Rh%), since the bilayer repeat spacing Dz is determined by a bal-
ance of attractive and repulsive inter-bilayer forces, and therefore strongly depends
on sample humidity.
6.1. X-RAY REFLECTIVITY ON MODEL MEMBRANES 112
0 0.1 0.2 0.3 0.4 0.5 0.610
0
105
1010
1015
Qz (Å−1)
log(
cps)
DMPC5.8vol%10vol%15vol%20vol%
Figure 6.2: Reflectivity-scans of DMPC in water/Ethanol with increasing alcohol amount,
at 30C.
xEth (vol%) 0 5.8 10 15 20
Dz (A) 62.84 65.18/64.5 61.24 62.4 48.93
Table 6.1: Bilayer repeat spacing Dz for DMPC membranes immersed in water/Ethanol
solutions at 30C for varying alcohol concentrations.
Two tendencies are observed, the more alcohol is added (Fig. 6.2): for low
concentrations up to 5.8vol%, the membrane swells in Dz compared to the pure
DMPC/water reference, for higher concentrations it exhibits a decrease in the lamel-
lar repeat spacing. For 10vol% and 15vol% this decrease in Dz can be attributed to
partial and for 20vol% to full interdigitation of the lipid acyl chains (cf. Table 6.1,
[58]).
To further evaluate the data, the Fourier synthesis method, where solely the inte-
grated peak intensities contribute to the electron density profile ρ(z) is occasionally
employed. The alternative to this method is a full Qz-range fit of the data curves
[121, 124], which yields density profiles in absolute units. The underlying model
function must take into account effects of absorption, thermal fluctuations, static
defects and instrumental resolution, not all of which are known here. The two meth-
ods are compared in Li et al. [125]. If the phase problem can be solved unambigously,
the simplified approach of Fourier synthesis can be used to extract the more crude
structural properties, such as changes in distance between the phospholipid head
6.1. X-RAY REFLECTIVITY ON MODEL MEMBRANES 113
groups (two maxima in the density profiles correspond to the phosphorus atoms).
It is then possible to determine the changes in the thickness of the water layer dw
in between the lipid layers, as well as of the hydrocarbon double layer according to:
a = Dz − dw − dk (Fig. 2.8).
However, since for most Ethanol concentrations only two Bragg peaks are visible,
the phase problem cannot be solved unambigously and therefore electron density
profiles ρ(z) cannot serve to identify distinct phases within or near the coexistence
regime of the phase diagram (cf. Fig. 2.14).
For 20vol% Ethanol comparison of the bilayer repeat spacing Dz with literature
values obtained for DPPC (cf. 2.3.3) suggests that the fully interdigitated phase,
where the membrane bilayer structure is replaced by one with alternately partially
overlapping lipid acyl chains separated by Ethanol molecules, is observed. For a
naturally occurring membrane this kind of structural arrangement could have two
interesting implications: On the one hand the membrane interface with the water
layer increases due to an in-plane increase in headgroup distance as well as a decrease
in the thickness of the hydrophobic carbon layer, which is bound to increase the
membrane’s permeability. On the other hand, collective fluctuations of the lipid
acyl chains could be more restricted compared to the bilayer arrangement.
6.1.3 Unbinding of DMPC-bilayers
The unbinding of oriented DMPC-bilayers from the substrate was studied by reflectivity-
scans for two distinct Ethanol concentrations. The small lamellar repeat spacing Dz
obtained from curves of DMPC with 5.8vol% Ethanol (cf. Fig. 6.2, Table 6.1) indi-
cates that the membrane was not fully immersed in liquid at the beginning of the
measurements.
For 20vol% Ethanol, the bilayer decay occurs on a much shorter time scale than
for 5.8vol% (Fig. 6.3). As for the lower concentration, the unbinding seems to
be coupled to the insertion of Ethanol into the membrane. Both effects could be
explained in a similar manner. In a state of full interdigitation, which only occurs at
larger alcohol concentrations, the two types of amphiphillic molecules are arranged
with respect to each other, so that both obtain a maximum exposure to the polar
water layer. The bilayer structure consisting of two leaflets ceases to exist. This
molecule arrangement is, however, extremely unstable for the lipids which are then
particularly exposed to unbound Ethanol molecules. As soon as lipid molecules
are dissolved from a single layer, the effect increases and an avalanche-effect which
triggers further layer-decay is therefore likely to begin.
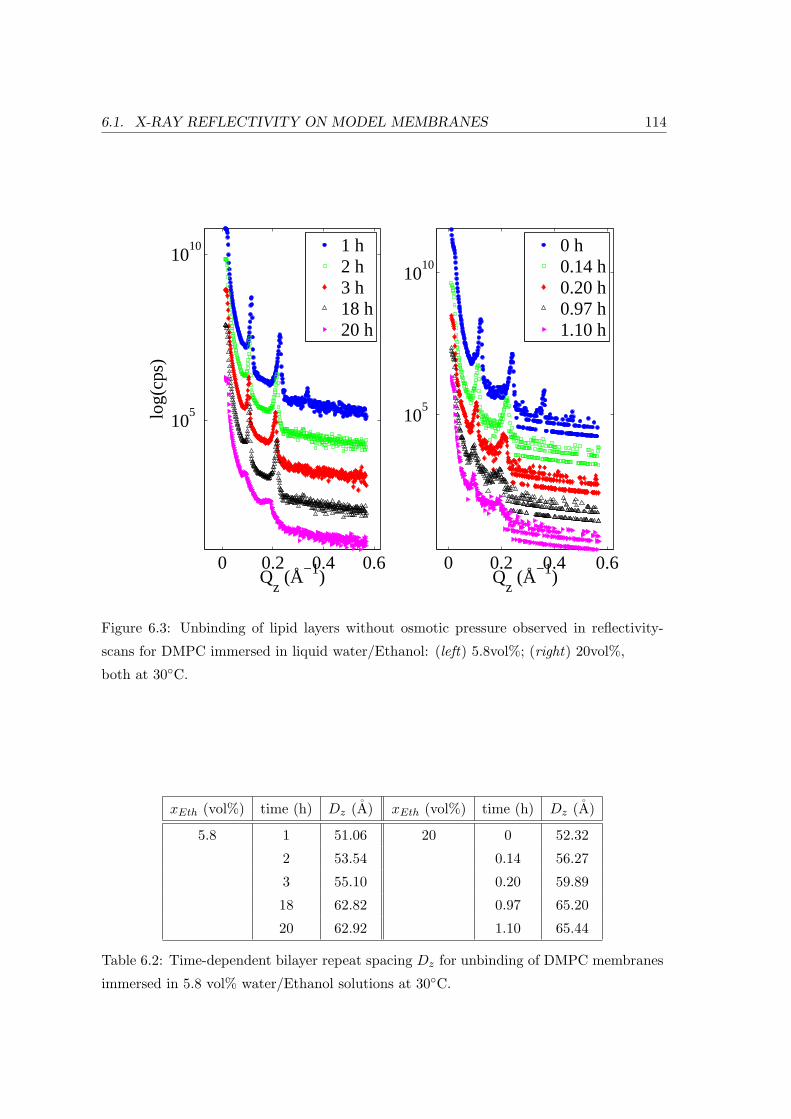
6.1. X-RAY REFLECTIVITY ON MODEL MEMBRANES 114
0 0.2 0.4 0.6
105
1010
Qz (Å−1)
log(
cps)
1 h2 h3 h18 h20 h
0 0.2 0.4 0.6
105
1010
Qz (Å−1)
0 h0.14 h0.20 h0.97 h1.10 h
Figure 6.3: Unbinding of lipid layers without osmotic pressure observed in reflectivity-
scans for DMPC immersed in liquid water/Ethanol: (left) 5.8vol%; (right) 20vol%,
both at 30C.
xEth (vol%) time (h) Dz (A) xEth (vol%) time (h) Dz (A)
5.8 1 51.06 20 0 52.32
2 53.54 0.14 56.27
3 55.10 0.20 59.89
18 62.82 0.97 65.20
20 62.92 1.10 65.44
Table 6.2: Time-dependent bilayer repeat spacing Dz for unbinding of DMPC membranes
immersed in 5.8 vol% water/Ethanol solutions at 30C.
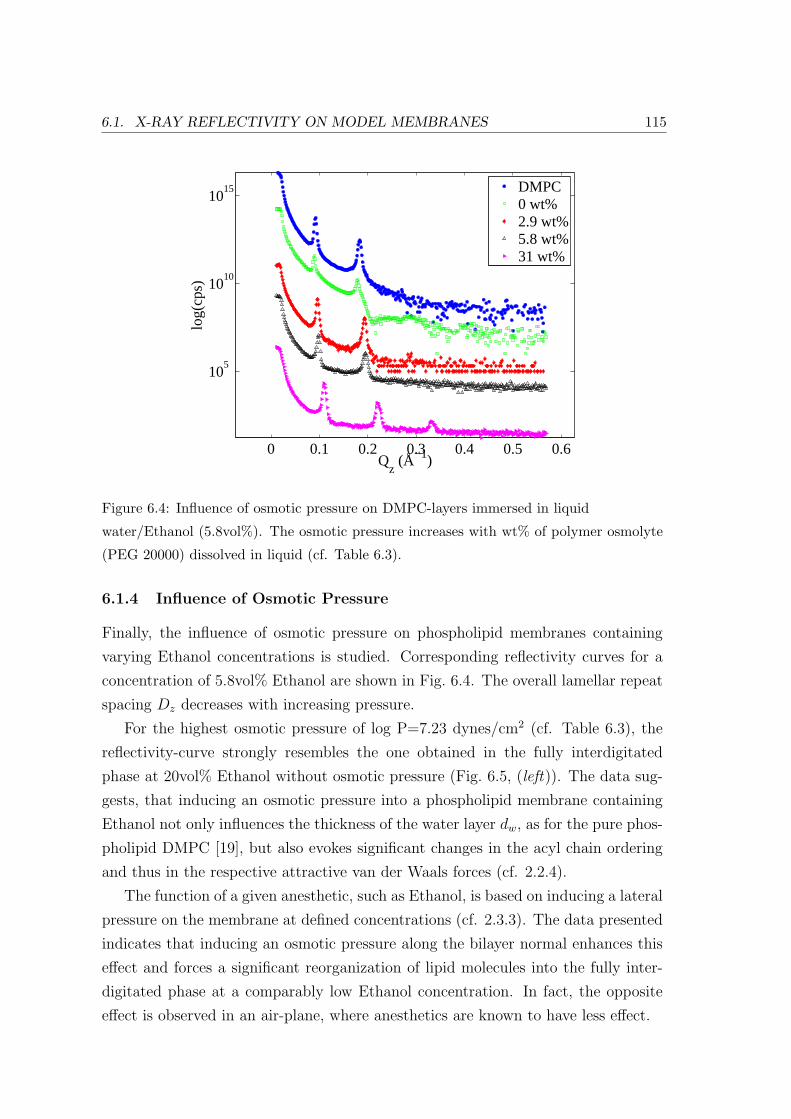
6.1. X-RAY REFLECTIVITY ON MODEL MEMBRANES 115
0 0.1 0.2 0.3 0.4 0.5 0.6
105
1010
1015
Qz (Å−1)
log(
cps)
DMPC0 wt%2.9 wt%5.8 wt%31 wt%
Figure 6.4: Influence of osmotic pressure on DMPC-layers immersed in liquid
water/Ethanol (5.8vol%). The osmotic pressure increases with wt% of polymer osmolyte
(PEG 20000) dissolved in liquid (cf. Table 6.3).
6.1.4 Influence of Osmotic Pressure
Finally, the influence of osmotic pressure on phospholipid membranes containing
varying Ethanol concentrations is studied. Corresponding reflectivity curves for a
concentration of 5.8vol% Ethanol are shown in Fig. 6.4. The overall lamellar repeat
spacing Dz decreases with increasing pressure.
For the highest osmotic pressure of log P=7.23 dynes/cm2 (cf. Table 6.3), the
reflectivity-curve strongly resembles the one obtained in the fully interdigitated
phase at 20vol% Ethanol without osmotic pressure (Fig. 6.5, (left)). The data sug-
gests, that inducing an osmotic pressure into a phospholipid membrane containing
Ethanol not only influences the thickness of the water layer dw, as for the pure phos-
pholipid DMPC [19], but also evokes significant changes in the acyl chain ordering
and thus in the respective attractive van der Waals forces (cf. 2.2.4).
The function of a given anesthetic, such as Ethanol, is based on inducing a lateral
pressure on the membrane at defined concentrations (cf. 2.3.3). The data presented
indicates that inducing an osmotic pressure along the bilayer normal enhances this
effect and forces a significant reorganization of lipid molecules into the fully inter-
digitated phase at a comparably low Ethanol concentration. In fact, the opposite
effect is observed in an air-plane, where anesthetics are known to have less effect.
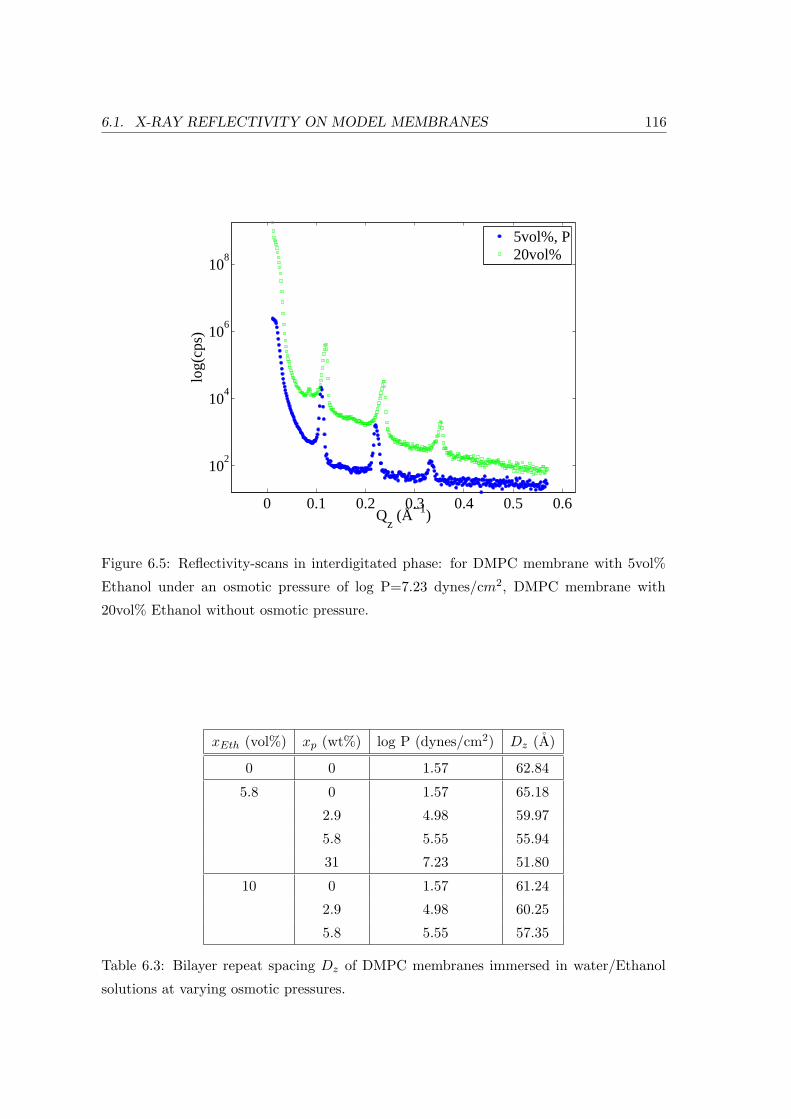
6.1. X-RAY REFLECTIVITY ON MODEL MEMBRANES 116
0 0.1 0.2 0.3 0.4 0.5 0.6
102
104
106
108
Qz (Å−1)
log(
cps)
5vol%, P20vol%
Figure 6.5: Reflectivity-scans in interdigitated phase: for DMPC membrane with 5vol%
Ethanol under an osmotic pressure of log P=7.23 dynes/cm2, DMPC membrane with
20vol% Ethanol without osmotic pressure.
xEth (vol%) xp (wt%) log P (dynes/cm2) Dz (A)
0 0 1.57 62.84
5.8 0 1.57 65.18
2.9 4.98 59.97
5.8 5.55 55.94
31 7.23 51.80
10 0 1.57 61.24
2.9 4.98 60.25
5.8 5.55 57.35
Table 6.3: Bilayer repeat spacing Dz of DMPC membranes immersed in water/Ethanol
solutions at varying osmotic pressures.
6.2. NEUTRON SCATTERING 117
6.2 Neutron Scattering
To study the effect of the short-chain alcohol Ethanol on the collective in-plane
density fluctuations observed for the phospholipid acyl chains of single lipid mem-
branes (cf. chapter 4), inelastic energy-scans were taken at distinct points around
the DMPC-d54 dispersion minimum on IN12 (ILL, Grenoble). Structural changes
within the semi-stable sample were monitored by measuring the in-plane static struc-
ture factor S(Qr) and taking repeated reflectivities S(Qz) between the inelastic scans
throughout the experiment.
Changes in the bilayer repeat spacing Dz are related to the previously presented
x-ray reflectivity study on the Ethanol-induced unbinding of phospholipid layers and
the influence of osmotic pressure on the composite model system.
6.2.1 Sample Preparation and Experiment
As for previously presented neutron experiments a DMPC-d54 ’sandwhich sample’
(cf. 4.2.1) was prepared and carefully inserted into a vacuum sealable aluminum
container specially built to fit into a standard orange cryostat. To reduce incoherent
inelastic scattering contributions, the sample was immersed into a mixture of 5vol%
deuterated Ethanol-d6 (Merck) in D2O. To prevent the phospholipid layers from
washing off the substrate under the influence of the added alcohol, an osmotic pres-
sure was added. This was achieved by giving the mixture into a solution of 2wt%
PEG 20000 (and D2O). The liquid containing water, Ethanol and the polymer os-
molyte was then carefully inserted into the aluminum container with a pipette (cf.
photo, Fig. 6.6). The temperation to a constant temperature of 30C was realized
by a standard orange cryostat.
Inelastic scans were taken at constant kf ’s of 1.25 A−1 and 1.75 A−1, respectively.
Two different scattering geometries were again employed: along the layer normal
Qz (neutron reflectivity scans) and in the plane of the membrane Qr (chain peak,
inelastic scans).
The neutron (diffraction) results shown in the following differ from the ones ob-
tained from a composite phospholipid/Cholesterol membrane (cf. 5.2), presented in
the previous chapter, in two ways: First, both major components of the membrane,
DMPC-d54 and D2O/Ethanol-d6 are deuterated (no selective highlighting). Second,
the incoherent scattering contribution is larger because the sample is immersed in
a liquid instead of in D2O-vapor. The majority of incoherent scatterers is located
in the polymer osmolyte used to stabilize the sample (cf. 6.1.4). Note that the
reduction of incoherent scattering is essential for the observation of the collective
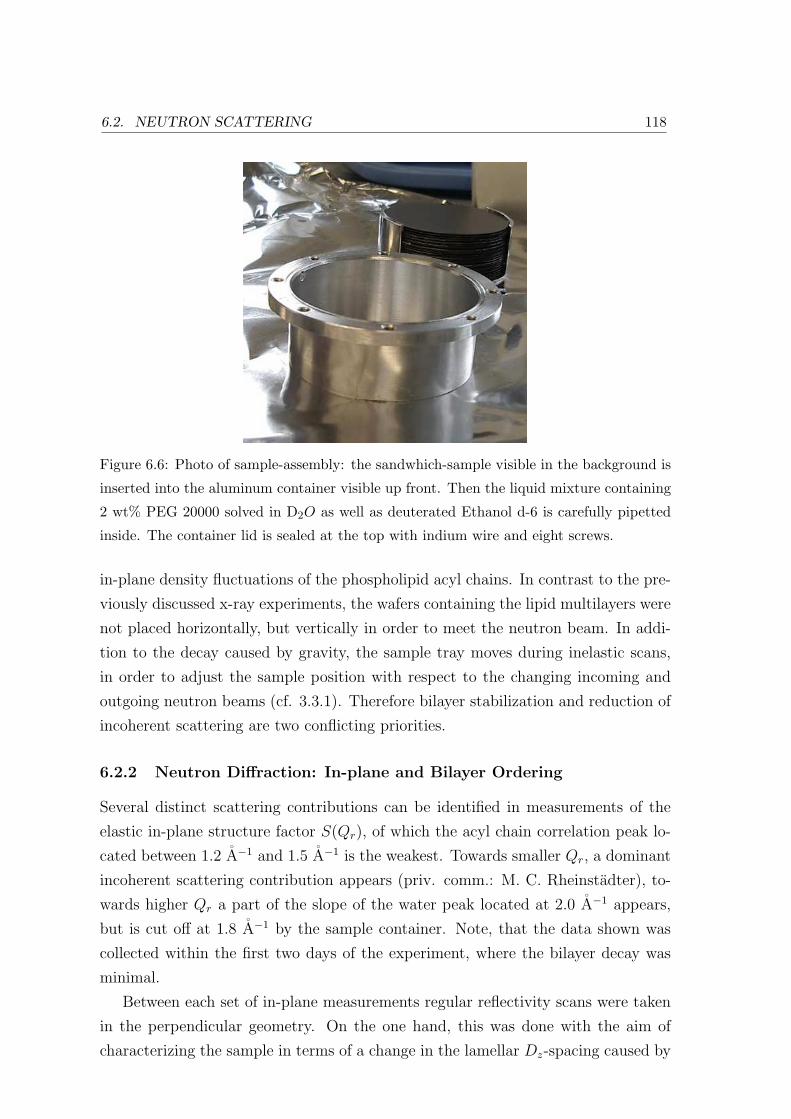
6.2. NEUTRON SCATTERING 118
Figure 6.6: Photo of sample-assembly: the sandwhich-sample visible in the background is
inserted into the aluminum container visible up front. Then the liquid mixture containing
2 wt% PEG 20000 solved in D2O as well as deuterated Ethanol d-6 is carefully pipetted
inside. The container lid is sealed at the top with indium wire and eight screws.
in-plane density fluctuations of the phospholipid acyl chains. In contrast to the pre-
viously discussed x-ray experiments, the wafers containing the lipid multilayers were
not placed horizontally, but vertically in order to meet the neutron beam. In addi-
tion to the decay caused by gravity, the sample tray moves during inelastic scans,
in order to adjust the sample position with respect to the changing incoming and
outgoing neutron beams (cf. 3.3.1). Therefore bilayer stabilization and reduction of
incoherent scattering are two conflicting priorities.
6.2.2 Neutron Diffraction: In-plane and Bilayer Ordering
Several distinct scattering contributions can be identified in measurements of the
elastic in-plane structure factor S(Qr), of which the acyl chain correlation peak lo-
cated between 1.2 A−1 and 1.5 A−1 is the weakest. Towards smaller Qr, a dominant
incoherent scattering contribution appears (priv. comm.: M. C. Rheinstadter), to-
wards higher Qr a part of the slope of the water peak located at 2.0 A−1 appears,
but is cut off at 1.8 A−1 by the sample container. Note, that the data shown was
collected within the first two days of the experiment, where the bilayer decay was
minimal.
Between each set of in-plane measurements regular reflectivity scans were taken
in the perpendicular geometry. On the one hand, this was done with the aim of
characterizing the sample in terms of a change in the lamellar Dz-spacing caused by
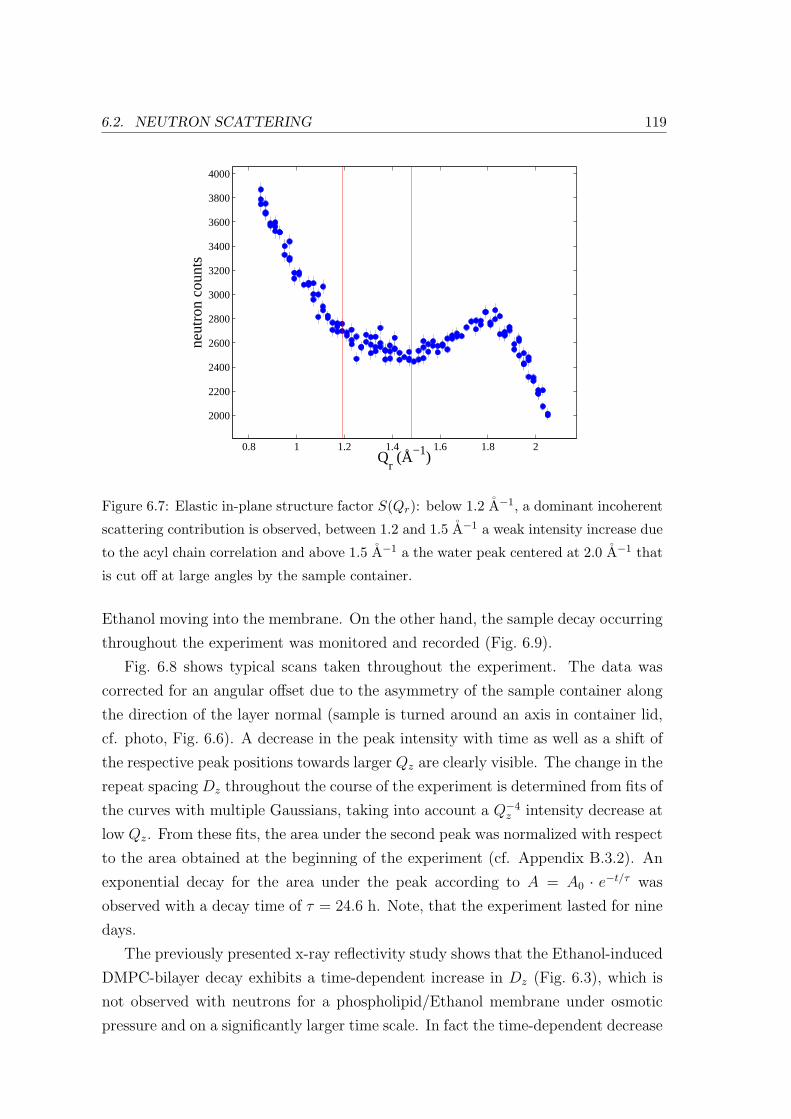
6.2. NEUTRON SCATTERING 119
0.8 1 1.2 1.4 1.6 1.8 2
2000
2200
2400
2600
2800
3000
3200
3400
3600
3800
4000
Qr (Å−1)
neut
ron
coun
ts
Figure 6.7: Elastic in-plane structure factor S(Qr): below 1.2 A−1, a dominant incoherent
scattering contribution is observed, between 1.2 and 1.5 A−1 a weak intensity increase due
to the acyl chain correlation and above 1.5 A−1 a the water peak centered at 2.0 A−1 that
is cut off at large angles by the sample container.
Ethanol moving into the membrane. On the other hand, the sample decay occurring
throughout the experiment was monitored and recorded (Fig. 6.9).
Fig. 6.8 shows typical scans taken throughout the experiment. The data was
corrected for an angular offset due to the asymmetry of the sample container along
the direction of the layer normal (sample is turned around an axis in container lid,
cf. photo, Fig. 6.6). A decrease in the peak intensity with time as well as a shift of
the respective peak positions towards larger Qz are clearly visible. The change in the
repeat spacing Dz throughout the course of the experiment is determined from fits of
the curves with multiple Gaussians, taking into account a Q−4z intensity decrease at
low Qz. From these fits, the area under the second peak was normalized with respect
to the area obtained at the beginning of the experiment (cf. Appendix B.3.2). An
exponential decay for the area under the peak according to A = A0 · e−t/τ was
observed with a decay time of τ = 24.6 h. Note, that the experiment lasted for nine
days.
The previously presented x-ray reflectivity study shows that the Ethanol-induced
DMPC-bilayer decay exhibits a time-dependent increase in Dz (Fig. 6.3), which is
not observed with neutrons for a phospholipid/Ethanol membrane under osmotic
pressure and on a significantly larger time scale. In fact the time-dependent decrease
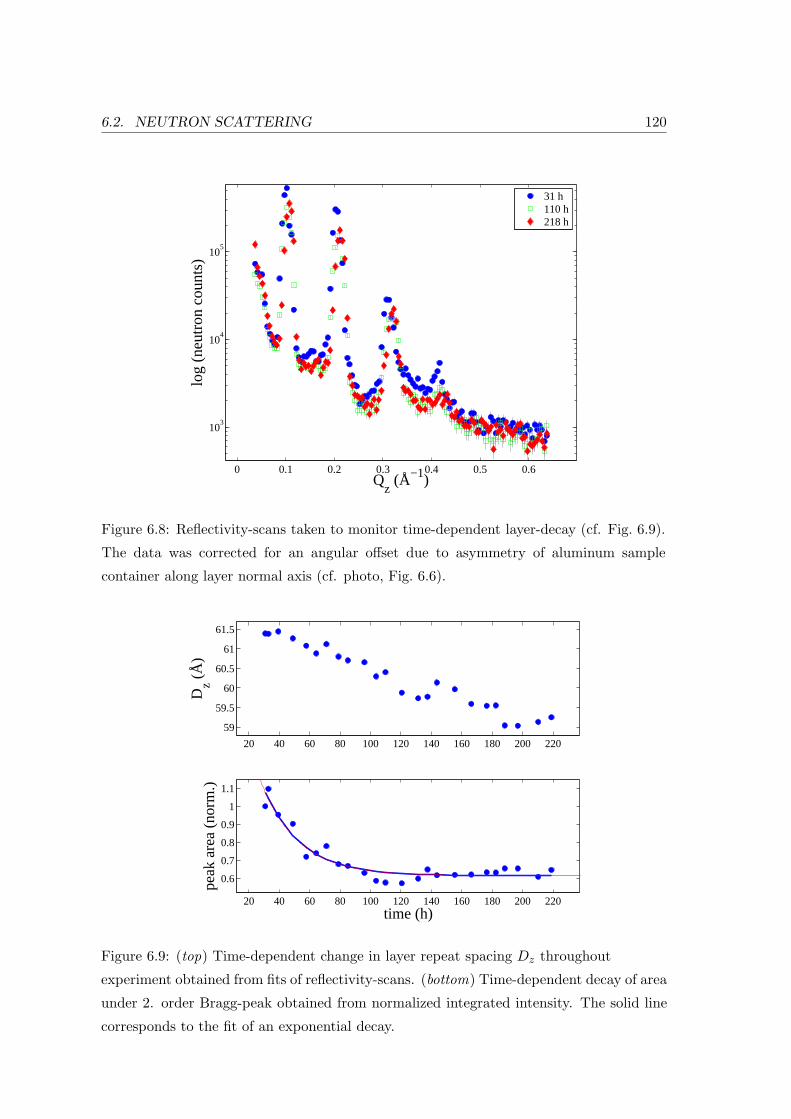
6.2. NEUTRON SCATTERING 120
0 0.1 0.2 0.3 0.4 0.5 0.6
103
104
105
Qz (Å−1)
log
(neu
tron
cou
nts)
31 h110 h218 h
Figure 6.8: Reflectivity-scans taken to monitor time-dependent layer-decay (cf. Fig. 6.9).
The data was corrected for an angular offset due to asymmetry of aluminum sample
container along layer normal axis (cf. photo, Fig. 6.6).
20 40 60 80 100 120 140 160 180 200 220
59
59.5
60
60.5
61
61.5
Dz (
Å)
20 40 60 80 100 120 140 160 180 200 220
0.6
0.7
0.8
0.9
1
1.1
time (h)
peak
are
a (n
orm
.)
Figure 6.9: (top) Time-dependent change in layer repeat spacing Dz throughout
experiment obtained from fits of reflectivity-scans. (bottom) Time-dependent decay of area
under 2. order Bragg-peak obtained from normalized integrated intensity. The solid line
corresponds to the fit of an exponential decay.
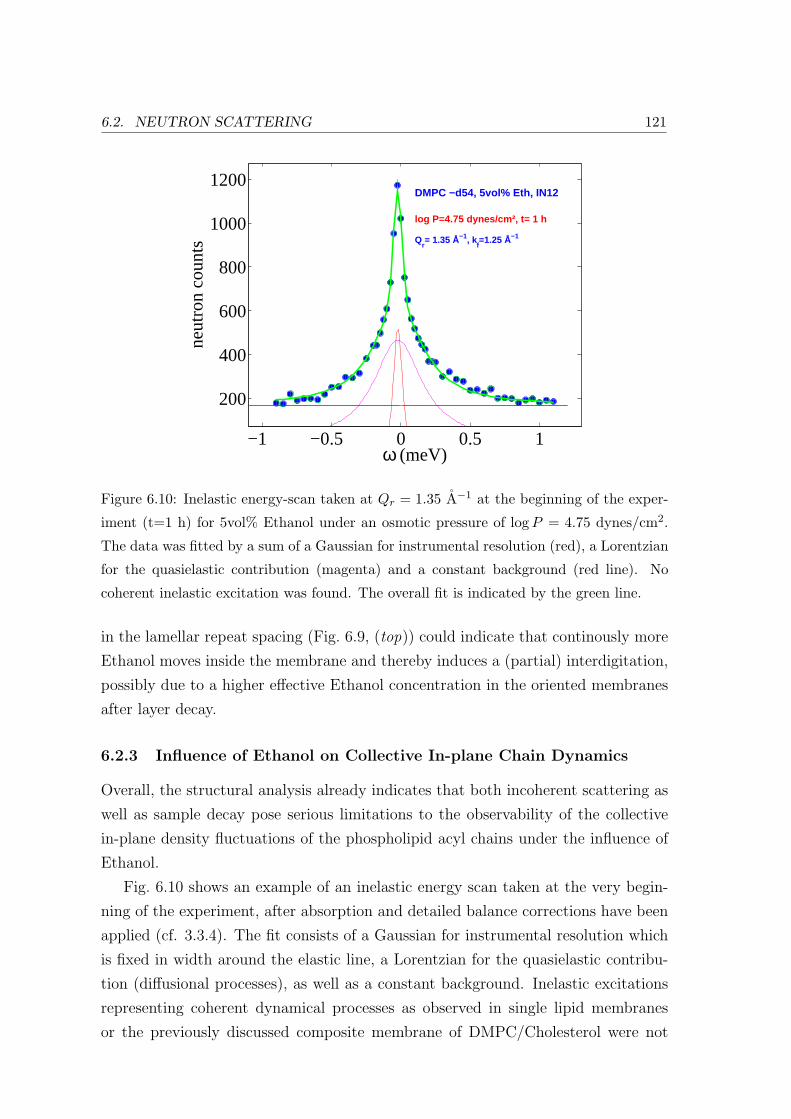
6.2. NEUTRON SCATTERING 121
−1 −0.5 0 0.5 1
200
400
600
800
1000
1200
ω (meV)
neut
ron
coun
tsDMPC −d54, 5vol% Eth, IN12
log P=4.75 dynes/cm², t= 1 h
Qr= 1.35 Å−1, k
f=1.25 Å−1
Figure 6.10: Inelastic energy-scan taken at Qr = 1.35 A−1 at the beginning of the exper-
iment (t=1 h) for 5vol% Ethanol under an osmotic pressure of log P = 4.75 dynes/cm2.
The data was fitted by a sum of a Gaussian for instrumental resolution (red), a Lorentzian
for the quasielastic contribution (magenta) and a constant background (red line). No
coherent inelastic excitation was found. The overall fit is indicated by the green line.
in the lamellar repeat spacing (Fig. 6.9, (top)) could indicate that continously more
Ethanol moves inside the membrane and thereby induces a (partial) interdigitation,
possibly due to a higher effective Ethanol concentration in the oriented membranes
after layer decay.
6.2.3 Influence of Ethanol on Collective In-plane Chain Dynamics
Overall, the structural analysis already indicates that both incoherent scattering as
well as sample decay pose serious limitations to the observability of the collective
in-plane density fluctuations of the phospholipid acyl chains under the influence of
Ethanol.
Fig. 6.10 shows an example of an inelastic energy scan taken at the very begin-
ning of the experiment, after absorption and detailed balance corrections have been
applied (cf. 3.3.4). The fit consists of a Gaussian for instrumental resolution which
is fixed in width around the elastic line, a Lorentzian for the quasielastic contribu-
tion (diffusional processes), as well as a constant background. Inelastic excitations
representing coherent dynamical processes as observed in single lipid membranes
or the previously discussed composite membrane of DMPC/Cholesterol were not
6.3. SUMMARY AND OUTLOOK 122
found. The reasons for this are mainly of a technical nature and related to the
diminishing effective coherent scattering volume due to the sample decay and to the
dominant overall incoherent scattering. However, the significant decrease observed
in the lamellar repeat spacing Dz indicates that the interdigitated Lβi′ -phase is at
least partially induced. Therefore it is not imminent that the collective chain mo-
tions themselves are not at least partially suppressed in this specific phase, due to
mutual steric hindrance of the lipid acyl chains. In fact, it could be a distinct mecha-
nism for the biochemical function of the anesthetic to block the in-plane propagation
of a signal in a membrane.
6.3 Summary and Outlook
At the investigated Ethanol concentrations DMPC samples of multiple bilayers ori-
ented on silicon wafers (≈1000 layers per wafer) exhibit a high degree of instability
with a certain statistical weight. For all measured Ethanol concentrations charac-
teristic Dz-spacings could be extracted, from which it was possible to deduce the
membrane state to either the lipid fluid phase or (partially) interdigitated phases.
In addition to its continuous decay, the neutron sample exhibited strong incoherent
scattering contributions. Therefore no coherent inelastic excitations could be ob-
served. In order stabilize the sample further and thus make the observation of these
excitations more likely, a larger concentration of the polymer osmolyte PEG 20000
would have to be used in a deuterated version. Possibly, a higher neutron flux than
presently available would be necessary to ensure successful measurement of excita-
tions in the liquid environment, so that they can be distinguished from background
and quasielastic scattering contributions.
Further x-ray reflectivity studies seem more practical, however: the liquid cham-
ber with the temperation unit, the water bath and the pump to mix water and
Ethanol in varying distinct ratios can easily be transferred to a synchrotron source,
where it should be possible to obtain Bragg peaks at least up to the fourth order.
Full Qz-range fits as described in [121, 124, 125] would yield electron density profiles
ρ(z) in absolute units and allow a precise analysis of the structural changes induced
by varying alcohol concentrations as well as osmotic pressures. Calculation of the
underlying contributions to the respective van der Waals and hydration potentials
seem possible and would most likely contribute to a unique quantitative understand-
ing of the function of Ethanol in a phospholipid membrane, both as an anesthetic
and as a drug enhancer.
Chapter 7
Summary
In the present study the structure and collective short wavelength dynamics of com-
posite phospholipid model membranes have been investigated.
Before an extension to multi-component membranes, the first part of this thesis
addressed the comparison of two lipid membranes, each containing a single com-
ponents, namely DMPC and DSPC. To this end, each system was characterized
by x-ray diffraction (4.1.2). The temperature-dependent structural changes in the
nearest neighbor distances of lipid molecules in the membrane plane were probed by
wide-angle scattering, while the temperature-dependent bilayer stacking was probed
by small-angle scattering. Significantly, differences in the temperature-dependent
in-plane chain correlation length have been observed. The chain correlation length
was obtained from Lorentzian fits of the acyl chain correlation peak, according to
ξr(T ) = 1/HWHM [126]. The results differed by an order of magnitude for the
two single lipid membranes in all phases (Fig. 4.7, 4.12). Both x-ray and neutron
diffraction showed a continuous shift of the peak for the short chain lipid DMPC
with temperature, while a coexistence of peaks around the main phase transition
was observed for the long chain lipid DSPC. Thus, the first system, DMPC, shows
the so-called anomalous effect, similar to a second order phase transition. The sec-
ond system, DSPC, shows phase coexistence typical for first order transitions and
no anomalous swelling effect. These differences can hypothetically be linked to the
formation of domains of lipids in each of the respective phases with considerably
different sizes in DMPC and DSPC. Such arguments must carefully weigh the effect
of three length scales on the observed lineshapes, namely: (i) the chain correlation
length, (ii) the domain size (in the case of phase coexistence), (iii) the coherence
length of the probe.
Here, we have extended both the elastic results, and for the first time present
a comparison including results from inelastic scattering. To this end, the coherent
123
124
scattering contribution had to be enhanced over the dominant incoherent scatter-
ing contribution. This was achieved using highly oriented multilamellar membrane
stacks with a total mass of 400 mg of chain-deuterated lipids. As the excitations
observed are broad and strongly damped, large counting times in the order of half
of a day for an energy-scan, which sufficiently covers the elastic line, were necessary
to distinguish the inelastic contribution from quasielastic and background contri-
butions. Instrumental resolution properties (3.3.3) had to be taken into account in
order to analyze the data. Finally, distinct points of a dispersion relation were ob-
tained for DSPC, which suggested a characteristic minimum (de-Gennes narrowing)
[85]. However, the uncertainty in the data is higher than in DMPC due to the higher
aluminium background scattering contribution. Also, the inelastic excitations occur
at much lower energy-values, closer to the quasi-elastic scattering contributions from
which they have to be distinguished. The significantly larger in-plane correlation
length obtained for DSPC, however, seems to correspond to a more pronounced
narrowing.
In the second part of the thesis, we have investigated a composite membrane
of DMPC/Cholesterol in terms of the characteristic nature of its inelastic excita-
tions. Again, detailed knowledge of the structure and the structural changes with
temperature and concentration is a prerequisite. The corresponding information ob-
tained from small- and wide-angle x-ray scattering (5.1) shed light on the in-plane
nearest chain packing and the corresponding bilayer stacking of phospholipid and
sterol molecules in different regions of the phase diagram (Fig. 5.17). A qualitative
agreement with previously published phase diagrams was observed [37, 42].
Do to the amphiphillic nature of the phospholipid and the pronounced hydropho-
bicity of Cholesterol, both types of molecules arrange in close proximity with respect
to each other throughout the phase diagram, in order to avoid the energetically unfa-
vorable exposure of the sterol to interbilayer water. According to [45], the hydropho-
bicity of the Cholesterol molecule determines the observed concentration-dependent
phase behavior, while motional degrees of freedom of the sterol molecule within the
membrane determine the temperature-dependent phase behavior [6]. This matches
our observations, where, apart from a dominant main phase transition, phase barri-
ers are crossed gradually, domains of lipids in one specific phase are not formed.
In the physiologically relevant liquid-ordered Lo-phase the lamellar ordering is
significantly higher than in the other phases with lower Cholesterol concentration,
reflecting an increase in the bending rigidity κB. On a molecular level, this can be
explained by a straightening effect, which the rigid part of the sterol molecule has
on the lipid acyl chains.
125
This phase was chosen for the study of the collective in-plane density fluctua-
tions. For comparison, we also measured in the so-called liquid disordered Ld-phase,
which occurs at significantly lower Cholesterol concentrations. The samples con-
sisted of partially deuterated phospholipids, but protonated sterol. Correspondingly,
the collective dynamics of the lipid acyl chains under the influence of Cholesterol
were observed. In other words, there was no coherent scattering contribution from
the sterol molecules themselves. Due to the selective highlighting of molecules,
the phase-dependent neutron diffraction measurements of the acyl chain correlation
peak on the same samples complemented the previously obtained x-ray diffraction
data. Surprisingly, the distance of lipid molecules in the membrane plane, as well as
the correlation length ξr are quite similar for the two liquid phases. Simultanously
measured neutron reflectivity-scans indicated significant changes in the bilayer or-
dering (Fig. 5.19), which qualitatively matched previously obtained concentration-
dependent SAXS-scans.
The appearance of two strong and sharp excitations of a well-defined long life-
time observed in the inelastic neutron energy-scans does not correspond to the typ-
ical liquid behavior observed in single lipid membranes. Within the fit error, posi-
tion and width of the excitations do not depend on the Cholesterol concentration
(Fig. 5.23-5.26). For certain specific Qr, excitations in the inelastic energy-scans are
equally suppressed in both phases (Fig. 5.25), which could suggest an underlying
mechanism of mode selection. The strongest (inelastic) scattering contribution in
constant-energy and energy scans, likewise, is observed for all energies around the
position of the acyl chain correlation peak (Fig. 5.20, 5.24, 5.21, 5.22).
The sharpness and intensity of energy excitations representing the collective den-
sity fluctuations is rather surprising for a liquid. A typical liquid dispersion relation
with a minimum at the nearest neighbor position as found for single lipid mem-
branes, was not obtained. Due to the complexity of the composite model system,
however, neither the theory of de Gennes, nor the effective eigenmode model, which
originate in the description of classical mono-atomic liquids, can be applied.
Structural results suggest that the bilayer stacking observed in the two liquid
phases is to a large degree decoupled from the in-plane nearest neighbor arrangement
of lipid molecules, as well as from the corresponding collective dynamics of lipid acyl
chains: Neutron reflectivity-scans on the one hand show significant differences in the
bilayer ordering in the two phases. The acyl chain correlation peaks, on the other
hand, resemble each other in terms of position and width. The two dispersive and
paired excitations also occur at the same energies in both phases, as does the high
frequency excitation (Fig. 5.27) that was linked to a non-dispersive optical mode

126
first predicted for the pure lipid membrane by Tarek et al [80].
The results seem to suggest, that the approach to model the lipid chains as (two-
dimensional) liquid crystals in single component membranes, can be extended to a
composite DMPC/Cholesterol membrane only with significant restrictions. Since no
domain formation was observed, the origin of the two paired excitations must be
found in a modulation of the propagating in-plane density fluctuations that origi-
nates on a molecular scale. Here, the rigid part of the sterol molecule is believed to
play a key role: If it adds a slight disturbance to the collective motion of a fraction
of the lipid chains, this could evoke a second distinct modulation of the propagating
sonic wave, visible in the pairing of excitations.
In the last part of this thesis, a composite model membrane containing the
short chain alcohol Ethanol has been studied to shed light on the molecule’s func-
tion as a drug enhancer and anesthetic. The structural characterization of the
DMPC/Ethanol system by x-ray reflectivity for the first time demonstrated the
possibility of investigating oriented phospholipid/alcohol-samples in a liquid envi-
ronment. Specifically, the so-called ’interdigitated’ Lβi′ -phase, which is unique to
this particular kind of membrane, was identified (Fig. 6.5).
In order to investigate the corresponding collective in-plane fluctuations of the
lipid chains, it turned out that two major technical challenges had to be met: i) the
instability of the oriented lipid layers under the alcohol influence, ii) compared to
previously employed samples immersed in vapor, an increased incoherent background
due to the liquid environment.
Over the course of the reported inelastic neutron scattering experiment, the
sample exhibited a continuous decay in the number of bound and aligned bilay-
ers (Fig. 6.9), similar to what was seen before by x-ray reflectivity experiment.
Along with the loss of sample volume, the lamellar repeat spacing Dz decreased
gradually over the course of 200 h measurement time. The decrease indicates a slow
transformation to the interdigitated Lβi′ -phase with time. Note, that interdigita-
tion of the lipid acyl chains is likely to hinder their collective motion. Therefore,
the observed absence of coherent inelastic excitations in the data, could not only be
related to the mentioned technical limitations, but also be an intrinsic feature of the
lipid/Ethanol/water system.
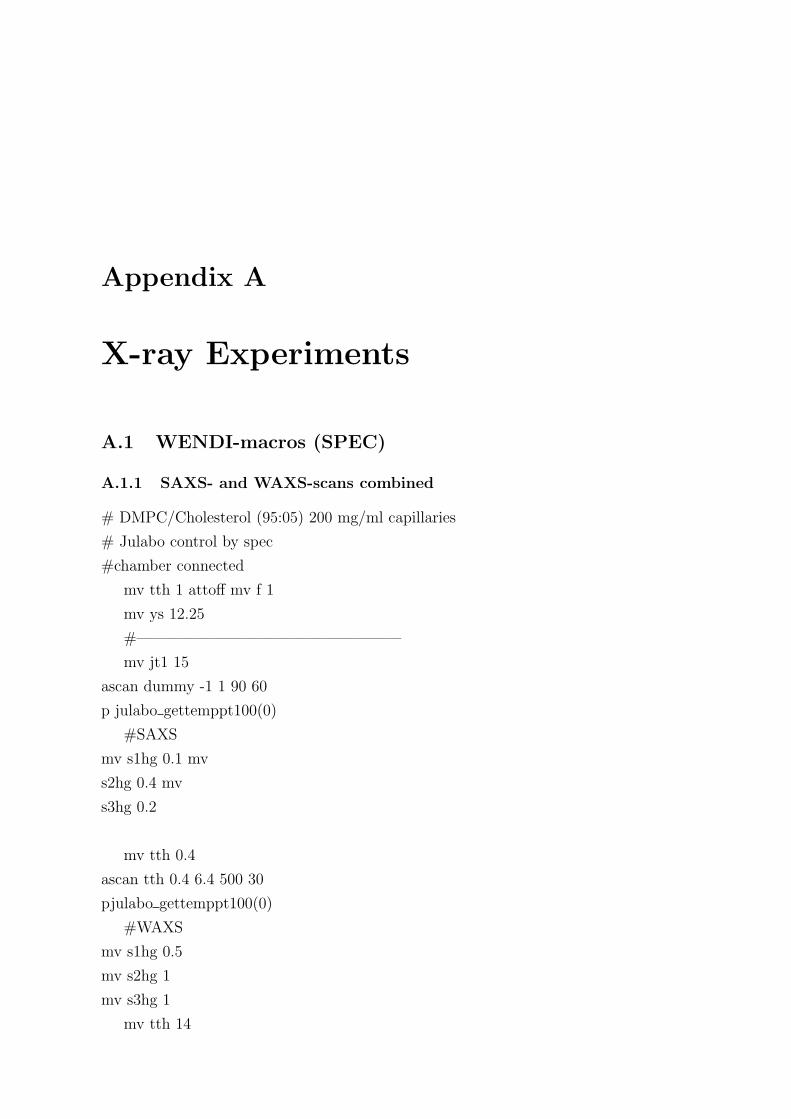
Appendix A
X-ray Experiments
A.1 WENDI-macros (SPEC)
A.1.1 SAXS- and WAXS-scans combined
# DMPC/Cholesterol (95:05) 200 mg/ml capillaries
# Julabo control by spec
#chamber connected
mv tth 1 attoff mv f 1
mv ys 12.25
#—————————————————
mv jt1 15
ascan dummy -1 1 90 60
p julabo gettemppt100(0)
#SAXS
mv s1hg 0.1 mv
s2hg 0.4 mv
s3hg 0.2
mv tth 0.4
ascan tth 0.4 6.4 500 30
pjulabo gettemppt100(0)
#WAXS
mv s1hg 0.5
mv s2hg 1
mv s3hg 1
mv tth 14
A.1. WENDI-MACROS (SPEC) 128
ascan tth 14 25 100 120
p julabo gettemppt100(0)
#——————————————————-
mv jt1 30
ascan dummy -1 1 90 60
p julabo gettemppt100(0)
#SAXS
mv s1hg 0.1
mv s2 hg 0.4
mv s3hg 0.2
mv tth 0.4
ascan tth 0.4 6.4 500 30
p julabo gettemppt100(0)
#WAXS
mv s1hg 0.5
mv s2hg 1
mv s3hg 1
mv tth 14
ascan tth 14 25 100 120
p julabo gettemppt100(0)
A.1.2 temperature ramp
# DMPC/Cholesterol (95:05) 200 mg/ml capillaries
# Julabo control by spec
#chamber connected
mv tth 1 attoff mv f 1
mv ys 12.25 mv th 0 #——————————————
# Start bei ca. 61
#mv jt1 60
p julabo gettemppt100(0)
#SAXS
mv s1hg 0.1
mv s2hg 0.4
mv s3hg 0.2 mv
tth 0.7
ascan tth 0.7 1.8 80 10
A.1. WENDI-MACROS (SPEC) 129
p julabo gettemppt100(0)
ascan tth 0.7 1.8 80 10
p julabo gettemppt100(0)
ascan tth 0.7 1.8 80 10
p julabo gettemppt100(0)
ascan tth 0.7 1.8 80 10
p julabo gettemppt100(0)
ascan tth 0.7 1.8 80 10
p julabo gettemppt100(0)
ascan tth 0.7 1.8 80 10
p julabo gettemppt100(0)
ascan tth 0.7 1.8 80 10
p julabo gettemppt100(0)
ascan tth 0.7 1.8 80 10
p julabo gettemppt100(0)
ascan tth 0.7 1.8 80 10
p julabo gettemppt100(0)
ascan tth 0.7 1.8 80 10
...
ascan tth 0.7 1.8 80 10
p julabo gettemppt100(0)
ascan tth 0.7 1.8 80 10
p julabo gettemppt100(0)
ascan tth 0.7 1.8 80 10
p julabo gettemppt100(0)
ascan tth 0.7 1.8 80 10
p julabo gettemppt100(0)
ascan tth 0.7 1.8 80 10
p julabo gettemppt100(0)
ascan tth 0.7 1.8 80 10
p julabo gettemppt100(0)
ascan tth 0.7 1.8 80 10
p julabo gettemppt100(0)
ascan tth 0.7 1.8 80 10
p julabo gettemppt100(0)
ascan tth 0.7 1.8 80 10
p julabo gettemppt100(0)
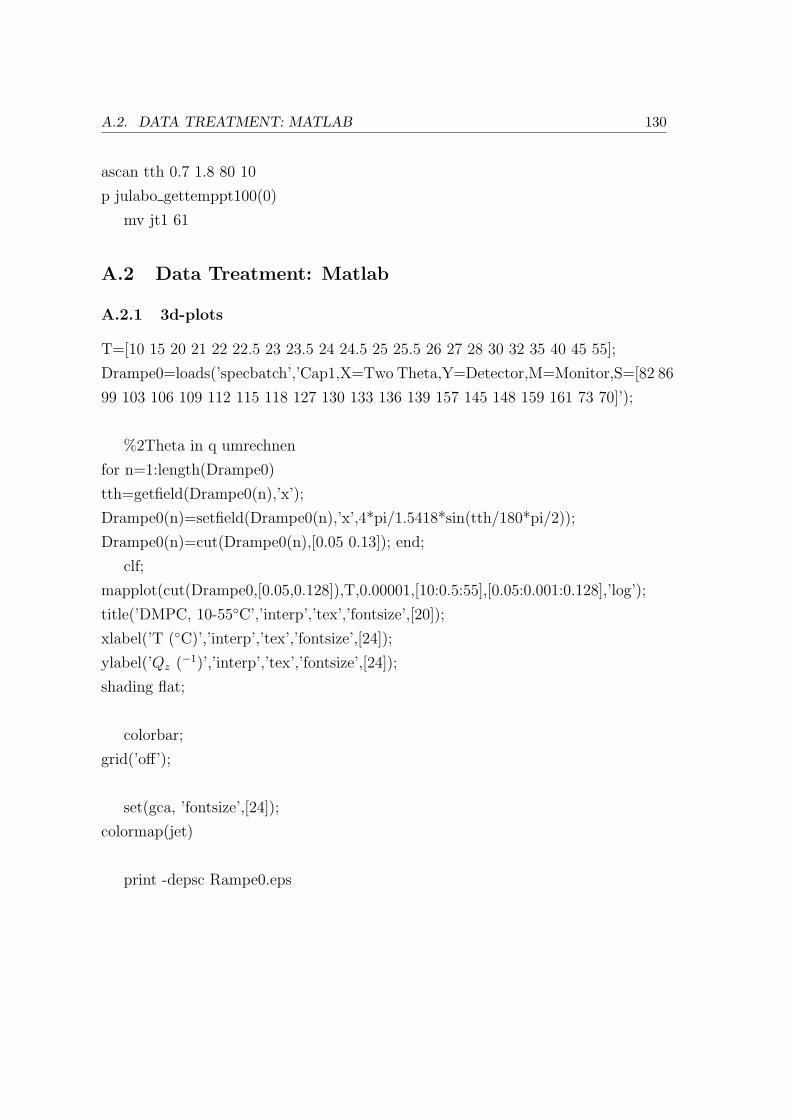
A.2. DATA TREATMENT: MATLAB 130
ascan tth 0.7 1.8 80 10
p julabo gettemppt100(0)
mv jt1 61
A.2 Data Treatment: Matlab
A.2.1 3d-plots
T=[10 15 20 21 22 22.5 23 23.5 24 24.5 25 25.5 26 27 28 30 32 35 40 45 55];
Drampe0=loads(’specbatch’,’Cap1,X=Two Theta,Y=Detector,M=Monitor,S=[82 86
99 103 106 109 112 115 118 127 130 133 136 139 157 145 148 159 161 73 70]’);
%2Theta in q umrechnen
for n=1:length(Drampe0)
tth=getfield(Drampe0(n),’x’);
Drampe0(n)=setfield(Drampe0(n),’x’,4*pi/1.5418*sin(tth/180*pi/2));
Drampe0(n)=cut(Drampe0(n),[0.05 0.13]); end;
clf;
mapplot(cut(Drampe0,[0.05,0.128]),T,0.00001,[10:0.5:55],[0.05:0.001:0.128],’log’);
title(’DMPC, 10-55C’,’interp’,’tex’,’fontsize’,[20]);
xlabel(’T (C)’,’interp’,’tex’,’fontsize’,[24]);
ylabel(’Qz (−1)’,’interp’,’tex’,’fontsize’,[24]);
shading flat;
colorbar;
grid(’off’);
set(gca, ’fontsize’,[24]);
colormap(jet)
print -depsc Rampe0.eps
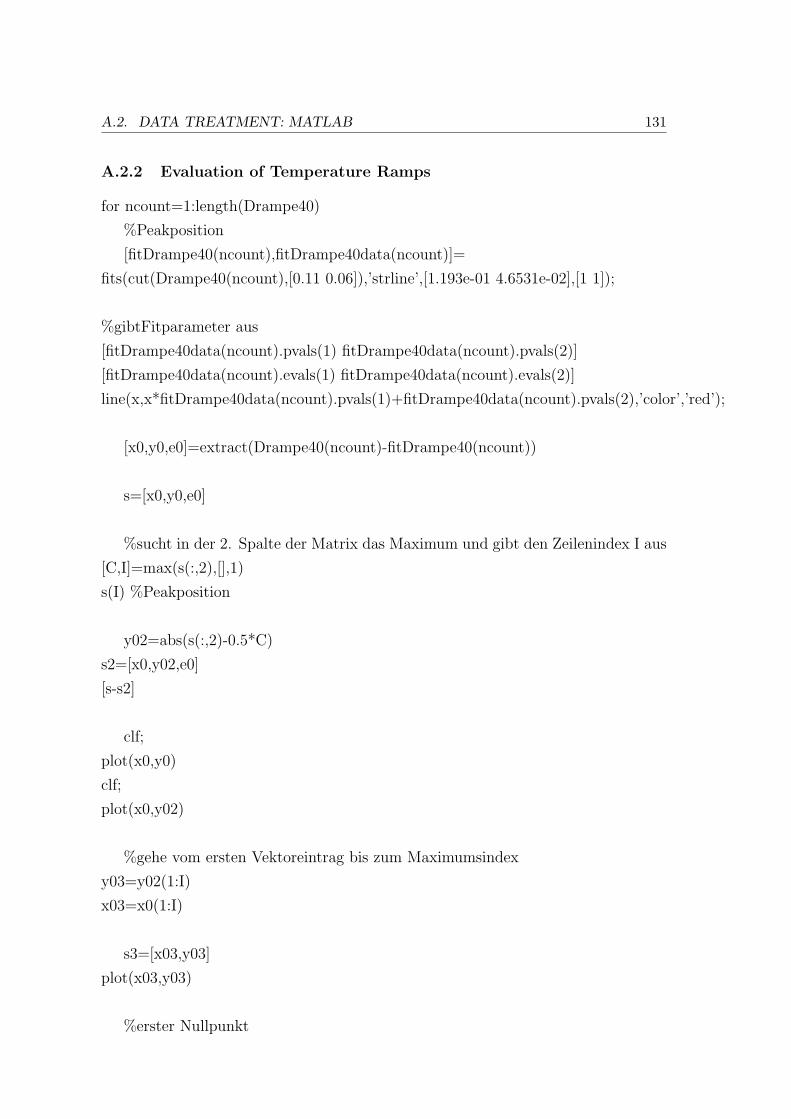
A.2. DATA TREATMENT: MATLAB 131
A.2.2 Evaluation of Temperature Ramps
for ncount=1:length(Drampe40)
%Peakposition
[fitDrampe40(ncount),fitDrampe40data(ncount)]=
fits(cut(Drampe40(ncount),[0.11 0.06]),’strline’,[1.193e-01 4.6531e-02],[1 1]);
%gibtFitparameter aus
[fitDrampe40data(ncount).pvals(1) fitDrampe40data(ncount).pvals(2)]
[fitDrampe40data(ncount).evals(1) fitDrampe40data(ncount).evals(2)]
line(x,x*fitDrampe40data(ncount).pvals(1)+fitDrampe40data(ncount).pvals(2),’color’,’red’);
[x0,y0,e0]=extract(Drampe40(ncount)-fitDrampe40(ncount))
s=[x0,y0,e0]
%sucht in der 2. Spalte der Matrix das Maximum und gibt den Zeilenindex I aus
[C,I]=max(s(:,2),[],1)
s(I) %Peakposition
y02=abs(s(:,2)-0.5*C)
s2=[x0,y02,e0]
[s-s2]
clf;
plot(x0,y0)
clf;
plot(x0,y02)
%gehe vom ersten Vektoreintrag bis zum Maximumsindex
y03=y02(1:I)
x03=x0(1:I)
s3=[x03,y03]
plot(x03,y03)
%erster Nullpunkt
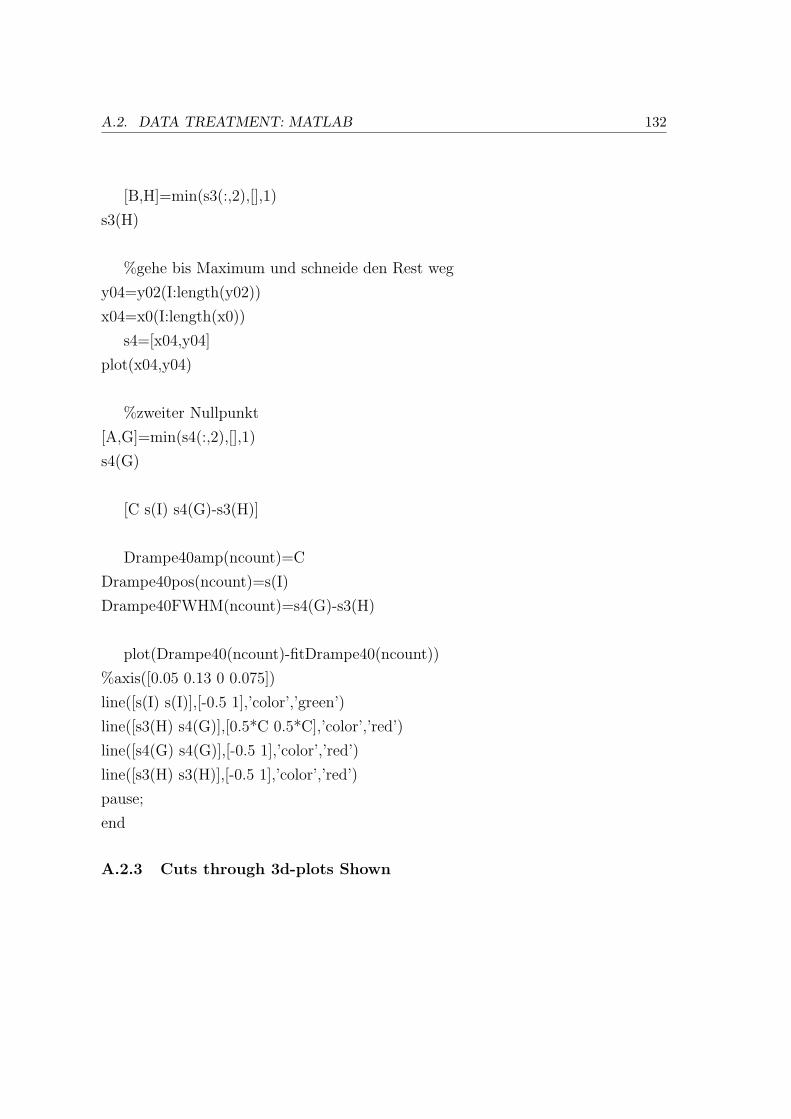
A.2. DATA TREATMENT: MATLAB 132
[B,H]=min(s3(:,2),[],1)
s3(H)
%gehe bis Maximum und schneide den Rest weg
y04=y02(I:length(y02))
x04=x0(I:length(x0))
s4=[x04,y04]
plot(x04,y04)
%zweiter Nullpunkt
[A,G]=min(s4(:,2),[],1)
s4(G)
[C s(I) s4(G)-s3(H)]
Drampe40amp(ncount)=C
Drampe40pos(ncount)=s(I)
Drampe40FWHM(ncount)=s4(G)-s3(H)
plot(Drampe40(ncount)-fitDrampe40(ncount))
%axis([0.05 0.13 0 0.075])
line([s(I) s(I)],[-0.5 1],’color’,’green’)
line([s3(H) s4(G)],[0.5*C 0.5*C],’color’,’red’)
line([s4(G) s4(G)],[-0.5 1],’color’,’red’)
line([s3(H) s3(H)],[-0.5 1],’color’,’red’)
pause;
end
A.2.3 Cuts through 3d-plots Shown
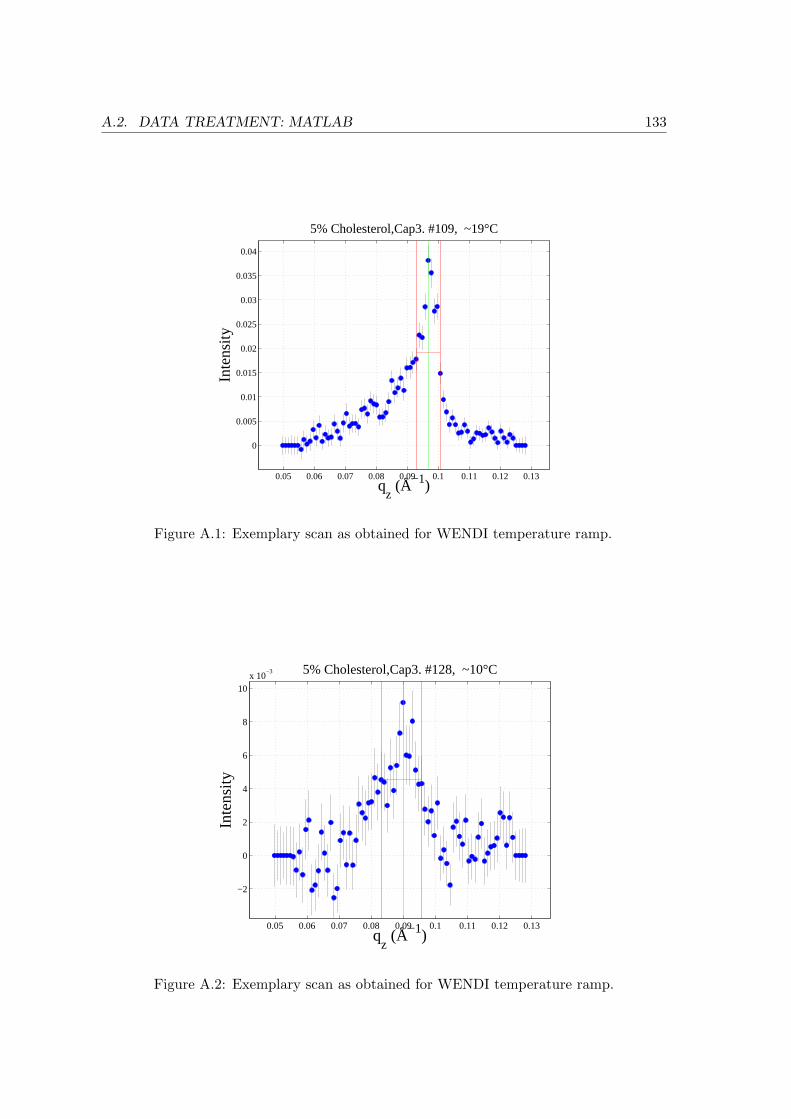
A.2. DATA TREATMENT: MATLAB 133
0.05 0.06 0.07 0.08 0.09 0.1 0.11 0.12 0.13
0
0.005
0.01
0.015
0.02
0.025
0.03
0.035
0.04
qz (Å−1)
Inte
nsity
5% Cholesterol,Cap3. #109, ~19°C
Figure A.1: Exemplary scan as obtained for WENDI temperature ramp.
0.05 0.06 0.07 0.08 0.09 0.1 0.11 0.12 0.13
−2
0
2
4
6
8
10x 10
−3
qz (Å−1)
Inte
nsity
5% Cholesterol,Cap3. #128, ~10°C
Figure A.2: Exemplary scan as obtained for WENDI temperature ramp.
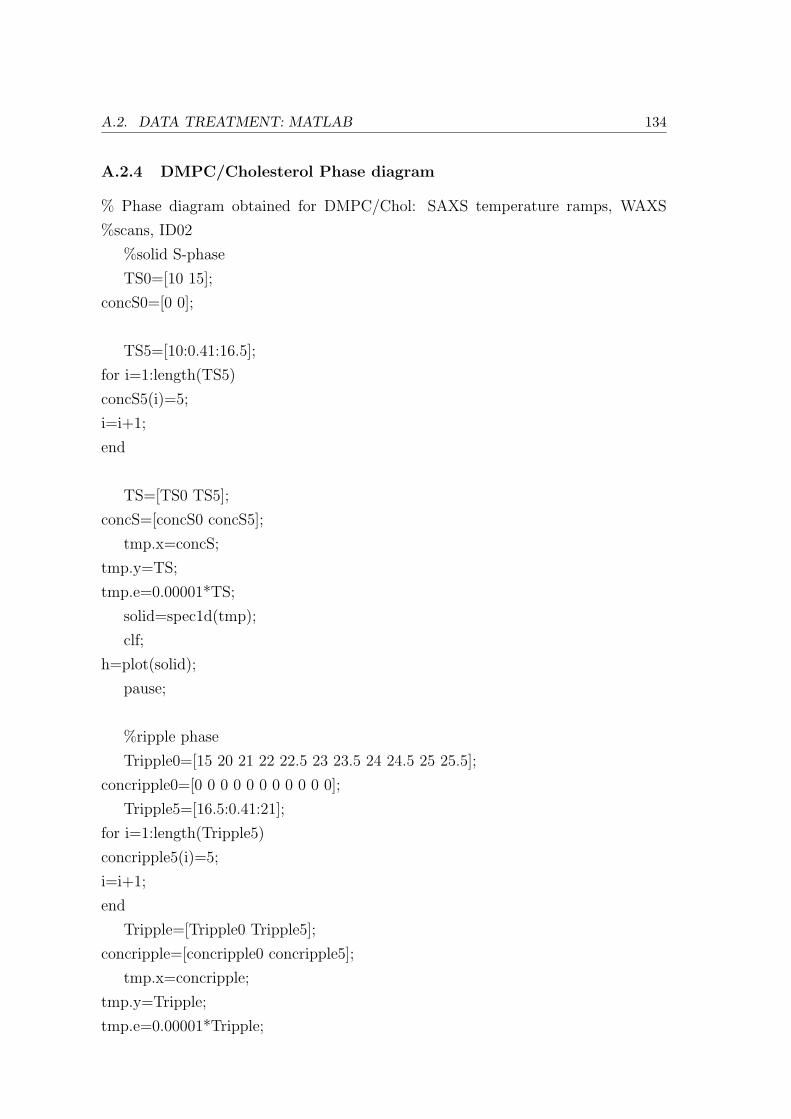
A.2. DATA TREATMENT: MATLAB 134
A.2.4 DMPC/Cholesterol Phase diagram
% Phase diagram obtained for DMPC/Chol: SAXS temperature ramps, WAXS
%scans, ID02
%solid S-phase
TS0=[10 15];
concS0=[0 0];
TS5=[10:0.41:16.5];
for i=1:length(TS5)
concS5(i)=5;
i=i+1;
end
TS=[TS0 TS5];
concS=[concS0 concS5];
tmp.x=concS;
tmp.y=TS;
tmp.e=0.00001*TS;
solid=spec1d(tmp);
clf;
h=plot(solid);
pause;
%ripple phase
Tripple0=[15 20 21 22 22.5 23 23.5 24 24.5 25 25.5];
concripple0=[0 0 0 0 0 0 0 0 0 0 0];
Tripple5=[16.5:0.41:21];
for i=1:length(Tripple5)
concripple5(i)=5;
i=i+1;
end
Tripple=[Tripple0 Tripple5];
concripple=[concripple0 concripple5];
tmp.x=concripple;
tmp.y=Tripple;
tmp.e=0.00001*Tripple;
A.2. DATA TREATMENT: MATLAB 135
ripple=spec1d(tmp);
clf;
h=plot(solid,ripple);
pause;
%liquid disordered LD-phase
Tld0=[25.5 26 27 28 30 32 35 40 45 55];
concld0=[0 0 0 0 0 0 0 0 0 0];
Tld5=[21:0.41:60];
for i=1:length(Tld5)
concld5(i)=5;
i=i+1;
end
Tld=[Tld0 Tld5];
concld=[concld0 concld5];
tmp.x=concld;
tmp.y=Tld;
tmp.e=0.00001*Tld;
ld=spec1d(tmp);
clf;
h=plot(solid,ripple,ld);
pause;
%coexistence solid, liquid-ordered phase
Tslo12=[10:0.44:23];
for i=1:length(Tslo12)
concslo12(i)=12;
i=i+1;
end
Tslo20=[10:0.45:22];
for i=1:length(Tslo20)
concslo20(i)=20;
i=i+1;
end
Tslo=[Tslo12 Tslo20 15 15 21 21];
concslo=[concslo12 concslo20 39.5 40.5 4.5 5.5];
tmp.x=concslo;
tmp.y=Tslo;
tmp.e=0.00001*Tslo;
A.2. DATA TREATMENT: MATLAB 136
slo=spec1d(tmp);
clf;
h=plot(solid,ripple,ld,slo);
pause;
%coexistence liquid disordered, liquid-ordered phase
Tldlo12=[23:0.44:48];
for i=1:length(Tldlo12)
concldlo12(i)=12;
i=i+1;
end
Tldlo20=[22:0.45:46];
for i=1:length(Tldlo20)
concldlo20(i)=20;
i=i+1;
end
Tldlo=[Tldlo12 Tldlo20 54.5 54.5];
concldlo=[concldlo12 concldlo20 39.5 40.5];
tmp.x=concldlo;
tmp.y=Tldlo;
tmp.e=0.00001*Tldlo;
ldlo=spec1d(tmp);
clf;
h=plot(solid,ripple,ld,slo,ldlo); pause;
%phase x
Tx12=[48:0.44:60];
for i=1:length(Tx12)
concx12(i)=12;
i=i+1;
end
Tx20=[46:0.45:60];
for i=1:length(Tx20)
concx20(i)=20;
i=i+1;
end
Tx=[Tx12 Tx20 55.5 55.5];
concx=[concx12 concx20 39.5 40.5];
tmp.x=concx;
A.2. DATA TREATMENT: MATLAB 137
tmp.y=Tx;
tmp.e=0.00001*Tx;
x=spec1d(tmp);
clf;
h=plot(solid,ripple,ld,slo,ldlo,x); pause;
%phase y
Ty=[65];
concy=[12];
tmp.x=concy;
tmp.y=Ty;
tmp.e=0.00001*Ty;
y=spec1d(tmp);
clf;
h=plot(solid,ripple,ld,slo,ldlo,x,y);
pause;
%liquid-ordered phase
Tlo40=[10:0.5:60];
for i=1:length(Tlo40)
conclo40(i)=40;
i=i+1;
end
tmp.x=conclo40;
tmp.y=Tlo40;
tmp.e=0.00001*Tlo40;
lo40=spec1d(tmp);
clf;
h=plot(solid,ripple,ld,slo,ldlo,x,lo40,y);
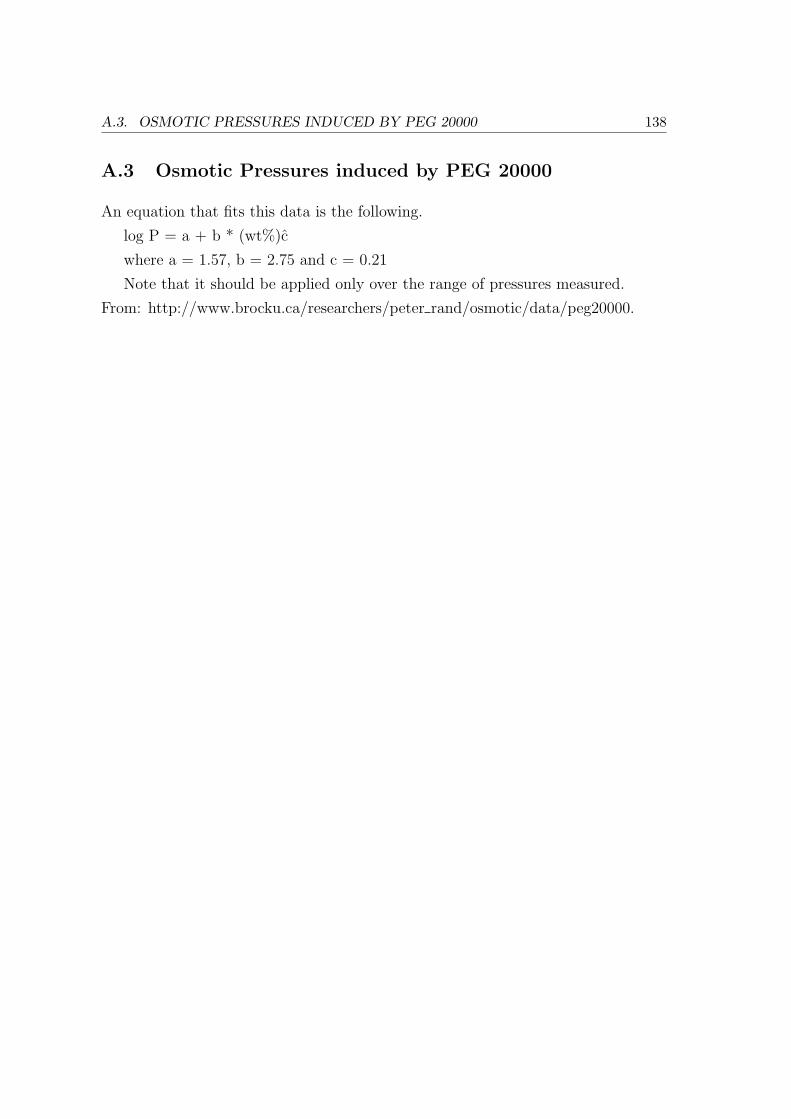
A.3. OSMOTIC PRESSURES INDUCED BY PEG 20000 138
A.3 Osmotic Pressures induced by PEG 20000
An equation that fits this data is the following.
log P = a + b * (wt%)c
where a = 1.57, b = 2.75 and c = 0.21
Note that it should be applied only over the range of pressures measured.
From: http://www.brocku.ca/researchers/peter rand/osmotic/data/peg20000.
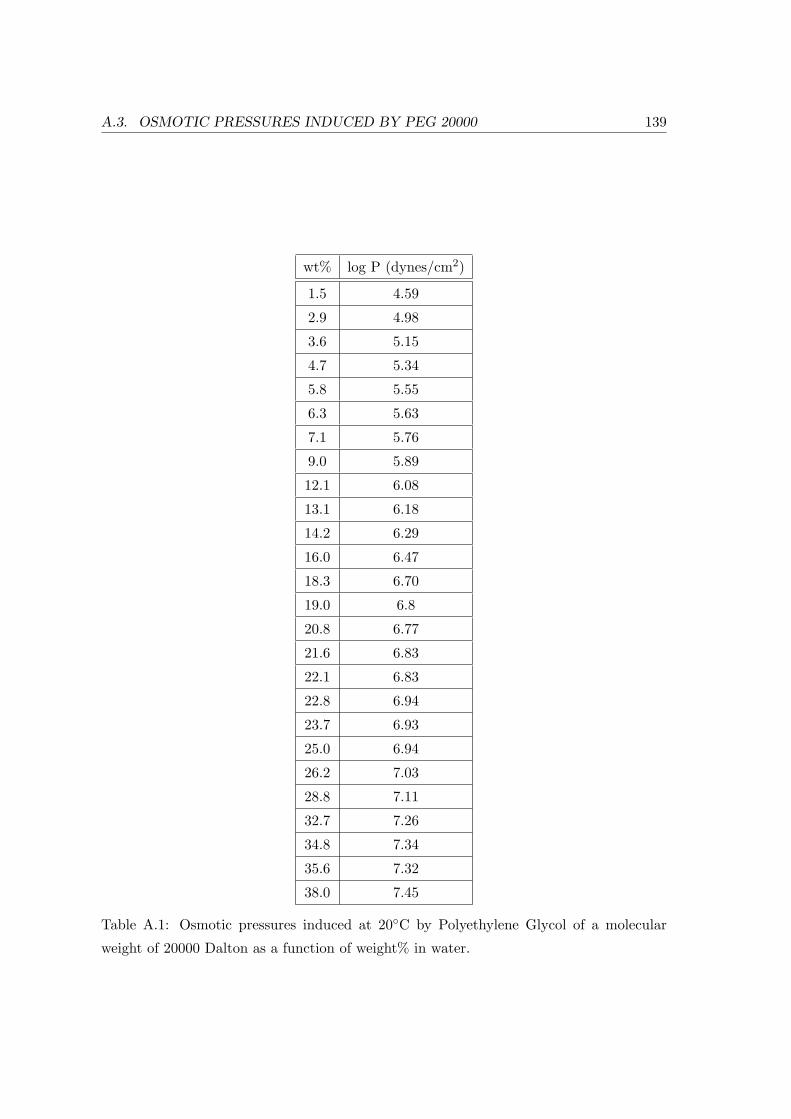
A.3. OSMOTIC PRESSURES INDUCED BY PEG 20000 139
wt% log P (dynes/cm2)
1.5 4.59
2.9 4.98
3.6 5.15
4.7 5.34
5.8 5.55
6.3 5.63
7.1 5.76
9.0 5.89
12.1 6.08
13.1 6.18
14.2 6.29
16.0 6.47
18.3 6.70
19.0 6.8
20.8 6.77
21.6 6.83
22.1 6.83
22.8 6.94
23.7 6.93
25.0 6.94
26.2 7.03
28.8 7.11
32.7 7.26
34.8 7.34
35.6 7.32
38.0 7.45
Table A.1: Osmotic pressures induced at 20C by Polyethylene Glycol of a molecular
weight of 20000 Dalton as a function of weight% in water.
Appendix B
Neutron Experiments
B.1 Instrument Parameters (V2-Flex)
Mosaic of analyzer (minutes) ... 30 arcmin
Mosaic of Monochromator (minutes) ... 30 arcmin
Vertical collimation of instrument between
guide to monochromator (minutes) ... open - distance between end of guide and
monochromator is 150 mm
monochromator to sample (minutes) ... given by monochromator height, vertical
diaphragm 1 setting, sample size and L MS
Sample to analyzer (minutes) ... given by analyzer height, vertical diaphragm 2
setting, sample size and L SA
Analyzer to detector (minutes) ... given by analyzer height, detector height and
L AD;
detector height depends on use of detector
diaphragm (Cd mask with 120 mm height)
Horizontal collimation of instrument WITHOUT any soller collimators in place
guide to monochromator (minutes) ... open - distance between end of guide and
monochromator is 150 mm
monochromator to sample (minutes) ... given by effective monochromator width,
horizontal diaphragm 1 setting, sample size and
L MS
Sample to analyzer (minutes) ... given by effective analyzer width, horizontal
diaphragm 2 setting, sample size and L SA
Analyzer to detector (minutes) ... given by effective analyzer width, detector
height and L AD;
detector width depends on use of detector
B.1. INSTRUMENT PARAMETERS (V2-FLEX) 141
diaphragm (Cd masks with 10, 20 or 30 mm width)
width of individual analyzer blades on the focusing analyzer ... 15 analyzer blades
each 13 mm
wide
Distances (cm)
guide to monochromator ... 0.15 m
monochromator to sample (cm) ... 1.75 m in standard setup
Sample to analyzer (cm) ... depends on setup, typically 1.10 m
Analyzer to detector (cm) ... ranging from 0.46 m to 1.0 m
most experiments with collimation use 0.62 m
Beam height of guide ... 125 mm
Beam width of guide ... 30 mm
detector width ... 49 mm, without detector diaphragm
detector height ... 150 mm, without detector diaphragm
Width of monochromator ... 125 mm
Height of monochromator ... 125 mm
Thickness of monochromator ... 2 mm
Width of analyzer ... 200 mm
Height of analyzer ... 125 mm
Thickness of analyzer ... 2 mm
Width of monitor ... 70 mm (standard setup: monitor in front of diaphr.)
Height of monitor ... 160 mm
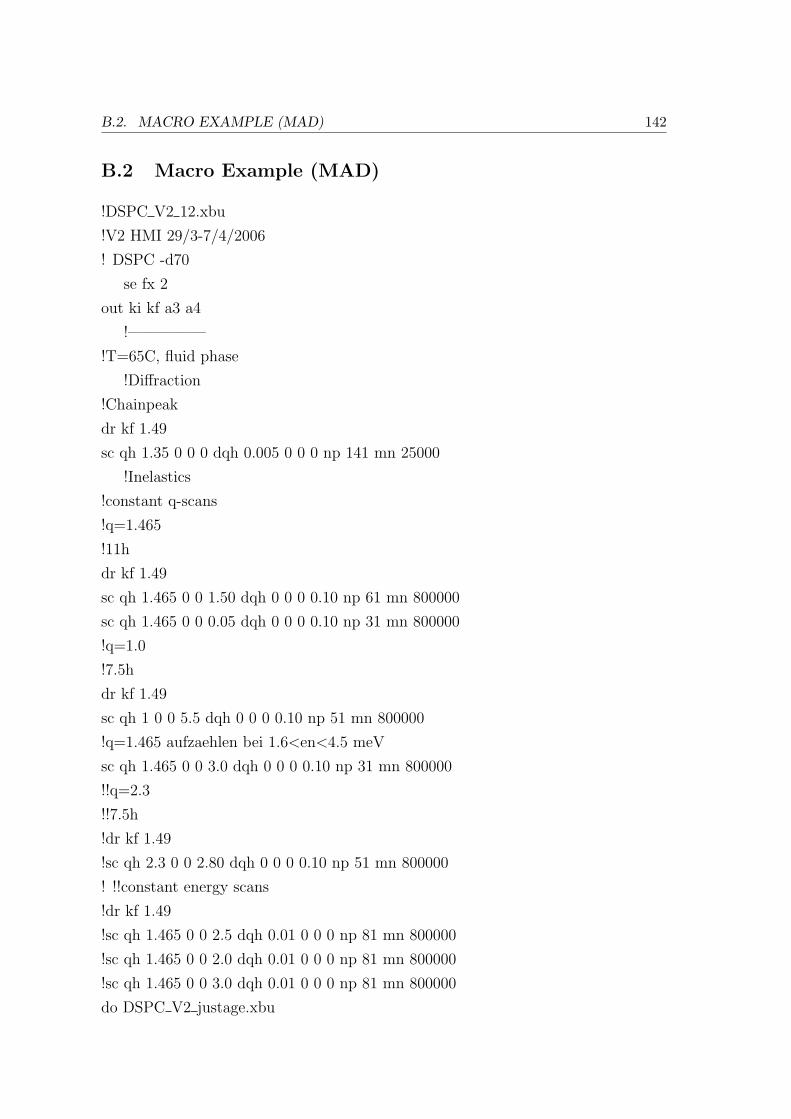
B.2. MACRO EXAMPLE (MAD) 142
B.2 Macro Example (MAD)
!DSPC V2 12.xbu
!V2 HMI 29/3-7/4/2006
! DSPC -d70
se fx 2
out ki kf a3 a4
!—————
!T=65C, fluid phase
!Diffraction
!Chainpeak
dr kf 1.49
sc qh 1.35 0 0 0 dqh 0.005 0 0 0 np 141 mn 25000
!Inelastics
!constant q-scans
!q=1.465
!11h
dr kf 1.49
sc qh 1.465 0 0 1.50 dqh 0 0 0 0.10 np 61 mn 800000
sc qh 1.465 0 0 0.05 dqh 0 0 0 0.10 np 31 mn 800000
!q=1.0
!7.5h
dr kf 1.49
sc qh 1 0 0 5.5 dqh 0 0 0 0.10 np 51 mn 800000
!q=1.465 aufzaehlen bei 1.6<en<4.5 meV
sc qh 1.465 0 0 3.0 dqh 0 0 0 0.10 np 31 mn 800000
!!q=2.3
!!7.5h
!dr kf 1.49
!sc qh 2.3 0 0 2.80 dqh 0 0 0 0.10 np 51 mn 800000
! !!constant energy scans
!dr kf 1.49
!sc qh 1.465 0 0 2.5 dqh 0.01 0 0 0 np 81 mn 800000
!sc qh 1.465 0 0 2.0 dqh 0.01 0 0 0 np 81 mn 800000
!sc qh 1.465 0 0 3.0 dqh 0.01 0 0 0 np 81 mn 800000
do DSPC V2 justage.xbu
B.3. DATA TREATMENT: MATLAB 143
B.3 Data Treatment: Matlab
B.3.1 Fit of Neutron Reflectivities
bg=17;
amp=0.042;
exponent=-4;
[fitDSPCrefl(1),fitDSPCrefldata(1)]=
fits(cut(DSPCrefl(1),[0.08 0.35]),’ngauss q4’,[20000 0.1 0.05 5000 0.2 0.05 5000 0.3
0.05 bg amp exponent],[1 1 1 1 1 1 1 1 1 0 0 0]);
[fitDSPCrefldata(1).pvals(1) fitDSPCrefldata(1).pvals(2) fitDSPCrefldata(1).pvals(3)
fitDSPCrefldata(1).pvals(4) fitDSPCrefldata(1).pvals(5) fitDSPCrefldata(1).pvals(6)
fitDSPCrefldata(1).pvals(7) fitDSPCrefldata(1).pvals(8) fitDSPCrefldata(1).pvals(9)
fitDSPCrefldata(1).pvals(10) fitDSPCrefldata(1).pvals(11) fitDSPCrefldata(1).pvals(12)]
[fitDSPCrefldata(1).evals(1) fitDSPCrefldata(1).evals(2) fitDSPCrefldata(1).evals(3)
fitDSPCrefldata(1).evals(4) fitDSPCrefldata(1).evals(5) fitDSPCrefldata(1).evals(6)
fitDSPCrefldata(1).evals(7) fitDSPCrefldata(1).evals(8) fitDSPCrefldata(1).evals(9)
fitDSPCrefldata(1).evals(10) fitDSPCrefldata(1).evals(11) fitDSPCrefldata(1).evals(12)]
[fitDSPCrefl(2),fitDSPCrefldata(2)]=
fits(cut(DSPCrefl(2),[0.07 0.37]),’ngauss q4’,[5000 0.11 0.05 5000 0.205 0.025 5000
0.225 0.025 5000 0.305 0.025 5000 0.33 0.025 bg amp exponent],[1 1 1 1 0 1 1 0 1 1
1 1 1 1 1 0 0 0]);
[fitDSPCrefldata(2).pvals(1) fitDSPCrefldata(2).pvals(2) fitDSPCrefldata(2).pvals(3)
fitDSPCrefldata(2).pvals(4) fitDSPCrefldata(2).pvals(5) fitDSPCrefldata(2).pvals(6)
fitDSPCrefldata(2).pvals(7) fitDSPCrefldata(2).pvals(8) fitDSPCrefldata(2).pvals(9)
fitDSPCrefldata(2).pvals(10) fitDSPCrefldata(2).pvals(11) fitDSPCrefldata(2).pvals(12)
fitDSPCrefldata(2).pvals(13) fitDSPCrefldata(2).pvals(14) fitDSPCrefldata(2).pvals(15)
fitDSPCrefldata(2).pvals(16) fitDSPCrefldata(2).pvals(17) fitDSPCrefldata(2).pvals(18)]
[fitDSPCrefldata(2).evals(1) fitDSPCrefldata(2).evals(2) fitDSPCrefldata(2).evals(3)
fitDSPCrefldata(2).evals(4) fitDSPCrefldata(2).evals(5) fitDSPCrefldata(2).evals(6)
fitDSPCrefldata(2).evals(7) fitDSPCrefldata(2).evals(8) fitDSPCrefldata(2).evals(9)
fitDSPCrefldata(2).evals(10) fitDSPCrefldata(2).evals(11) fitDSPCrefldata(2).evals(12)
fitDSPCrefldata(2).evals(13) fitDSPCrefldata(2).evals(14) fitDSPCrefldata(2).evals(15)
fitDSPCrefldata(2).evals(16) fitDSPCrefldata(2).evals(17) fitDSPCrefldata(2).evals(18)]
[fitDSPCrefl(3),fitDSPCrefldata(3)]=
fits(cut(DSPCrefl(3),[0.085 0.38]),’ngauss q4’,[5000 0.11 0.05 5000 0.22 0.05 5000
0.33 0.05 bg amp exponent],[1 1 1 1 1 1 1 1 1 0 0 0]);
B.3. DATA TREATMENT: MATLAB 144
[fitDSPCrefldata(3).pvals(1) fitDSPCrefldata(3).pvals(2) fitDSPCrefldata(3).pvals(3)
fitDSPCrefldata(3).pvals(4) fitDSPCrefldata(3).pvals(5) fitDSPCrefldata(3).pvals(6)
fitDSPCrefldata(3).pvals(7) fitDSPCrefldata(3).pvals(8) fitDSPCrefldata(3).pvals(9)
fitDSPCrefldata(3).pvals(10) fitDSPCrefldata(3).pvals(11) fitDSPCrefldata(3).pvals(12)]
[fitDSPCrefldata(3).evals(1) fitDSPCrefldata(3).evals(2) fitDSPCrefldata(3).evals(3)
fitDSPCrefldata(3).evals(4) fitDSPCrefldata(3).evals(5) fitDSPCrefldata(3).evals(6)
fitDSPCrefldata(3).evals(7) fitDSPCrefldata(3).evals(8) fitDSPCrefldata(3).evals(9)
fitDSPCrefldata(3).evals(10) fitDSPCrefldata(3).evals(11) fitDSPCrefldata(3).evals(12)]
clf;
h=plot(fitDSPCrefl(1),fitDSPCrefl(2),fitDSPCrefl(3),’semilogy’);
grid(’off’);
xlabel(’Qz (−1)’,’interp’,’tex’,’fontsize’,[20],’fontname’,’Times’);
ylabel(’log (neutron counts)’,’interp’,’tex’, ’fontsize’,[20],’fontname’,’Times’);
legend(h,’50C’,’55C’,’65C’);
B.3.2 DMPC/Ethanol Bilayer Decay
t = [(30+45/60+06/3600) (32+46/60+33/3600) (39+18/60+29/3600) (48+54/60+28/3600)
(57+41/60+10/3600) (64+15/60+08/3600) (70+56/60+25/3600) (78+55/60+14/3600)
(85+7/60+44/3600) (95+55/60+3/3600) (103+35/60+44/3600) (109+46/60+55/3600)
(120+32/60+10/3600) (131+17/60+54/3600) (137+29/60+50/3600) (143+40/60+58/3600)
(155+24/60+32/3600) (166+13/60+49/3600) (176+22/60+8/3600) (182+24/60+58/3600)
(188+15/60+16/3600) (196+51/60+44/3600) (210+11/60+2/3600) (218+52/60+22/3600)];
DMPCEthrefllang=loads(’illbatch’,’data/025[211 216 221 224 228 233 238 241 244
247 252 255 258 261 264 267 274 277 280 283 288 291 295 298],X=QH,Y=CNTS,M=M1’)*400000;
%Korrektur fur Offset vom Drehzentrum
kf=1.25;
j=1;
for j=1:length(DMPCEthrefllang)
[qh y ye]=extract(DMPCEthrefllang(j));
i=1;
for i=1:length(qh)
a40=acos(1-qh.2/(2*kf2))/pi*180;
a40corr=a40-0.6;
B.3. DATA TREATMENT: MATLAB 145
qhcorr=sqrt((1-cos(a40corr*pi/180))*2*kf2);
end
tmp.x=qhcorr;
tmp.y=y;
tmp.e=ye;
DMPCEthrefllangcorr(j)=spec1d(tmp);
clf;
h=plot(DMPCEthrefllang(j), DMPCEthrefllangcorr(j));
pause(1);
j=j+1;
end
clf;
h=plot(DMPCEthrefllangcorr(1),DMPCEthrefllangcorr(12),DMPCEthrefllangcorr(24),’semilogy’);
legend(h, ’31 h’,’110 h’,’218 h’);
pause;
%Fit als Gesamtes
bg=982;
amp=0.042;
exponent=-4;
[fitDMPCEthrefllangcorr(1),fitDMPCEthrefllangcorrdata(1)]
=fits(DMPCEthrefllangcorr(1),’ngauss q4’,[5.3349e+005 0.1153 0.006 3.1290e+005
0.2176 0.0064 2.5461e+004 0.3244 0.0099 2.2954e+003 0.4239 0.0114 bg amp expo-
nent],
[1 1 1 1 1 1 1 1 1 1 1 0 0 1 0]);
[fitDMPCEthrefllangcorrdata(1).pvals(1) fitDMPCEthrefllangcorrdata(1).pvals(2)
fitDMPCEthrefllangcorrdata(1).pvals(3) fitDMPCEthrefllangcorrdata(1).pvals(4) fit-
DMPCEthrefllangcorrdata(1).pvals(5) fitDMPCEthrefllangcorrdata(1).pvals(6) fit-
DMPCEthrefllangcorrdata(1).pvals(7) fitDMPCEthrefllangcorrdata(1).pvals(8) fit-
DMPCEthrefllangcorrdata(1).pvals(9) fitDMPCEthrefllangcorrdata(1).pvals(10) fit-
DMPCEthrefllangcorrdata(1).pvals(11)
fitDMPCEthrefllangcorrdata(1).pvals(12)]
[fitDMPCEthrefllangcorrdata(1).evals(1) fitDMPCEthrefllangcorrdata(1).evals(2) fit-
DMPCEthrefllangcorrdata(1).evals(3) fitDMPCEthrefllangcorrdata(1).evals(4) fitDM-
PCEthrefllangcorrdata(1).evals(5) fitDMPCEthrefllangcorrdata(1).evals(6) fitDMPCEthre-
fllangcorrdata(1).evals(7) fitDMPCEthrefllangcorrdata(1).evals(8) fitDMPCEthrefllang-
corrdata(1).evals(9) fitDMPCEthrefllangcorrdata(1).evals(10) fitDMPCEthrefllang-
corrdata(1).evals(11)
B.3. DATA TREATMENT: MATLAB 146
fitDMPCEthrefllangcorrdata(1).evals(12)]
clf;
h=plot(DMPCEthrefllangcorr(1),fitDMPCEthrefllangcorr(1),’semilogy’);
pause(1);
...
%zeitabhangige Veranderung der Flache unter jeweils dem 1. und 2. Bragg Peak
%Sichtung der gefitteten Peaks
[xfitDMPCEthrefllangcorr1 yfitDMPCEthrefllangcorr1 efitDMPCEthrefllangcorr1]
=extract(fitDMPCEthrefllangcorr(1));
i=1;
for i=1:length(xfitDMPCEthrefllangcorr1)
yfitDMPCEthrefllangcorr1ucorr(i)=yfitDMPCEthrefllangcorr1(i)
-(1./(xfitDMPCEthrefllangcorr1(i).4)*fitDMPCEthrefllangcorrdata(1).pvals(14)
+fitDMPCEthrefllangcorrdata(1).pvals(13)); i=i+1;
end
tmp.x=xfitDMPCEthrefllangcorr1;
tmp.y=yfitDMPCEthrefllangcorr1ucorr;
tmp.e=efitDMPCEthrefllangcorr1;
fitDMPCEthrefllangcorrucorr(1)=spec1d(tmp);
clf;
h=plot(DMPCEthrefllangcorr(1),fitDMPCEthrefllangcorr(1),
cut(fitDMPCEthrefllangcorrucorr(1),[0.295 0.38]),’semilogy’);
%h=plot(DMPCEthrefllangcorr(1),fitDMPCEthrefllangcorr(1),
cut(fitDMPCEthrefllangcorrucorr(1),[0.17 0.26]),’semilogy’);
%h=plot(DMPCEthrefllangcorr(1),fitDMPCEthrefllangcorr(1),
cut(fitDMPCEthrefllangcorrucorr(1),[0.08 0.15]),’semilogy’);
...
%Berechnung der Flache unter 1.,2. und 3. Peak
Apeak1 1=0.005*sum(yfitDMPCEthrefllangcorr1ucorr(8:21))
Apeak1 1e=0.005*sum(efitDMPCEthrefllangcorr1(8:21))
Apeak1 2=0.005*sum(yfitDMPCEthrefllangcorr1ucorr(25:43))
Apeak1 2e=0.005*sum(efitDMPCEthrefllangcorr1(25:43))
Apeak1 3=0.005*sum(yfitDMPCEthrefllangcorr1ucorr(50:67))
Apeak1 3e=0.005*sum(efitDMPCEthrefllangcorr1(50:67))
%Zeitabhangigkeit plotten Apeak1=[Apeak1 1 Apeak2 1 Apeak3 1 Apeak4 1
Apeak5 1 Apeak6 1 Apeak7 1 Apeak8 1 Apeak9 1 Apeak10 1 Apeak11 1 Apeak12 1
B.3. DATA TREATMENT: MATLAB 147
Apeak13 1 Apeak14 1 Apeak15 1 Apeak16 1 Apeak17 1 Apeak18 1 Apeak19 1 Apeak20 1
Apeak21 1 Apeak22 1 Apeak23 1 Apeak24 1]; Apeak1e=[Apeak1 1e Apeak2 1e Apeak3 1e
Apeak4 1e Apeak5 1e Apeak6 1e Apeak7 1e Apeak8 1e Apeak9 1e Apeak10 1e
Apeak11 1e Apeak12 1e Apeak13 1e Apeak14 1e Apeak15 1e Apeak16 1e Apeak17 1e
Apeak18 1e Apeak19 1e Apeak20 1e Apeak21 1e Apeak22 1e Apeak23 1e Apeak24 1e];
tmp.x=t(1:24);
tmp.y=Apeak1;
tmp.e=Apeak1e;
A1=spec1d(tmp);
...
clf;
h=plot(A1,A2);
legend(h, ’peak 1’, ’peak 2’);
...
pause(1);
%Fit: exponential decay (mit Normierung auf Peakflache zur Zeit null)
[fitDMPCEthdecay1,fitDMPCEthdecay1data]=fits(A1/Apeak1 1,’expon’,[1.2 7.5696
0.5],[1 1 1]);
[fitDMPCEthdecay1data.pvals(1) fitDMPCEthdecay1data.pvals(2) fitDMPCEthdecay1data.pvals(3)]
[fitDMPCEthdecay1data.evals(1) fitDMPCEthdecay1data.evals(2)fitDMPCEthdecay1data.evals(3)]
clf;
h=plot(A1/Apeak1 1,fitDMPCEthdecay1);
x=1:0.5:250;
line(x,fitDMPCEthdecay1data.pvals(1)*exp(-x/fitDMPCEthdecay1data.pvals(2))
+fitDMPCEthdecay1data.pvals(3),’color’,’red’);
pause(1);
...
%zeitabhangige Veranderung des Dz-spacings
i=1;
j=2;
for i=1:length(DMPCEthrefllang)
Dz(i)=2*pi/((fitDMPCEthrefllangcorrdata(i).pvals(j)+fitDMPCEthrefllangcorrdata(i).pvals(j+3)/2
+fitDMPCEthrefllangcorrdata(i).pvals(j+6)/3
+fitDMPCEthrefllangcorrdata(i).pvals(j+9)/4)/4);
eDz(i)=2*pi*(fitDMPCEthrefllangcorrdata(i).evals(j)+fitDMPCEthrefllangcorrdata(i).evals(j+3)/2
+fitDMPCEthrefllangcorrdata(i).evals(j+6)/3
+fitDMPCEthrefllangcorrdata(i).evals(j+9)/4)./(fitDMPCEthrefllangcorrdata(i).pvals(j)
B.3. DATA TREATMENT: MATLAB 148
+fitDMPCEthrefllangcorrdata(i).pvals(j+3)/2+fitDMPCEthrefllangcorrdata(i).pvals(j+6)/3
+fitDMPCEthrefllangcorrdata(i).pvals(j+9)/4).2;
i=i+1;
end
tmp.x=t;
tmp.y=Dz;
tmp.e=eDz; %aus Fehlerfortpflanzug ermittelt
Dzspac=spec1d(tmp);
clf;
h=plot(Dzspac);
B.4. TREATMENT OF INELASTIC DATA 149
B.4 Treatment of Inelastic Data
B.4.1 Energy-Scans: Detailed Balance Correction
enDSPC50(1)
=loads(’illbatch’,’01[1265;1267],X=EN,Y=CNTS,M=M1’)*400000;
%Temperaturkorrektur (Detailed Balance)
kB=1.38E-23;
el=1.6E-19;
T1=50;
for n=1:length(enDSPC50)
normalisierung=(1-exp(-1E-5/(kB*(T1+273)/el*1000)))/1E-5;
werten=getfield(enDSPC50(1),’x’);
%energie korrektur im vergleich zu den alten messungen
wertcnts=getfield(enDSPC50(1),’y’);
wertcntsalt=getfield(enDSPC50(1),’y’);
for m=1:length(werten)
fac(m)=werten(m)./(1-exp(-werten(m)./(kB*(T1+273)/el*1000)))*normalisierung;
wertcnts(m)=wertcnts(m)./fac(m);
end;
[werten wertcnts]
enDSPC50(1)=setfield(enDSPC50(1),’x’,werten);
enDSPC50(1)=setfield(enDSPC50(1),’y’,wertcnts);
end;
B.4.2 Energy-Scans: Absorption Correction
omega=getfield(enDSPC50(1),’x’);
kf=1.49;
Q=1.0;
ki=sqrt(omega/2.072+kfˆ2);
testa4 0=acos(1-Qˆ2/(2*kfˆ2))/180*pi;
testa4=acos((-Qˆ2+kfˆ2+ki.ˆ2)./(2*kf.*ki))/180*pi;
B.5. RESOLUTION CALCULATION WITH ’RESCAL’ 150
testa3 0=(180-testa4 0)/2; tmp=(-kfˆ2+Qˆ2+ki.ˆ2)./(2*Q.*ki);
testa3=acos(tmp)/180*pi; delta a3=testa3 0-testa3;
absorption=(cos(testa3-testa3 0)+cos(testa3-testa4/2));
energy50 10=getfield(enDSPC50(1),’x’);
counts50 10=getfield(enDSPC50(1),’y’);
fehlercounts50 10=getfield(enDSPC50(1),’e’);
corrtest50 10=(absorption).*counts50 10;
fehlercorrtest50 10=sqrt(corrtest50 10);
tmp50 10.x=energy50 10;
tmp50 10.y=corrtest50 10;
tmp50 10.e=fehlercorrtest50 10;
enDSPC50 10corrabsorb=spec1d(tmp50 10);
clf;
h=plot(enDSPC50(1),enDSPC50 10corrabsorb);
axis([2.5 8.5 0 17]);
B.5 Resolution Calculation with ’Rescal’
Spectrometer
DM: monochromator d-spacing in A; DA: analyzer d-spacing
ETAM: monochromator mosaic in min.;
ETAA: analyzer mosaic; ETAS: sample mosaic
SM: scattering sense from monochromator (+1: right, -1: left);
SS: scattering sense from sample;
SA: scattering sense from analyzer
KFIX: fixed neutron wave vector in A−1;
FX: index for fixed wave vector (1=incident, 2=final)
ALF1: horizontal source-mono. collimation in min.;
ALF2: horizontal mono.-sample collimation;
ALF3: horizontal sample-analyzer collimation;
ALF4: horizontal analyzer-detector collimation
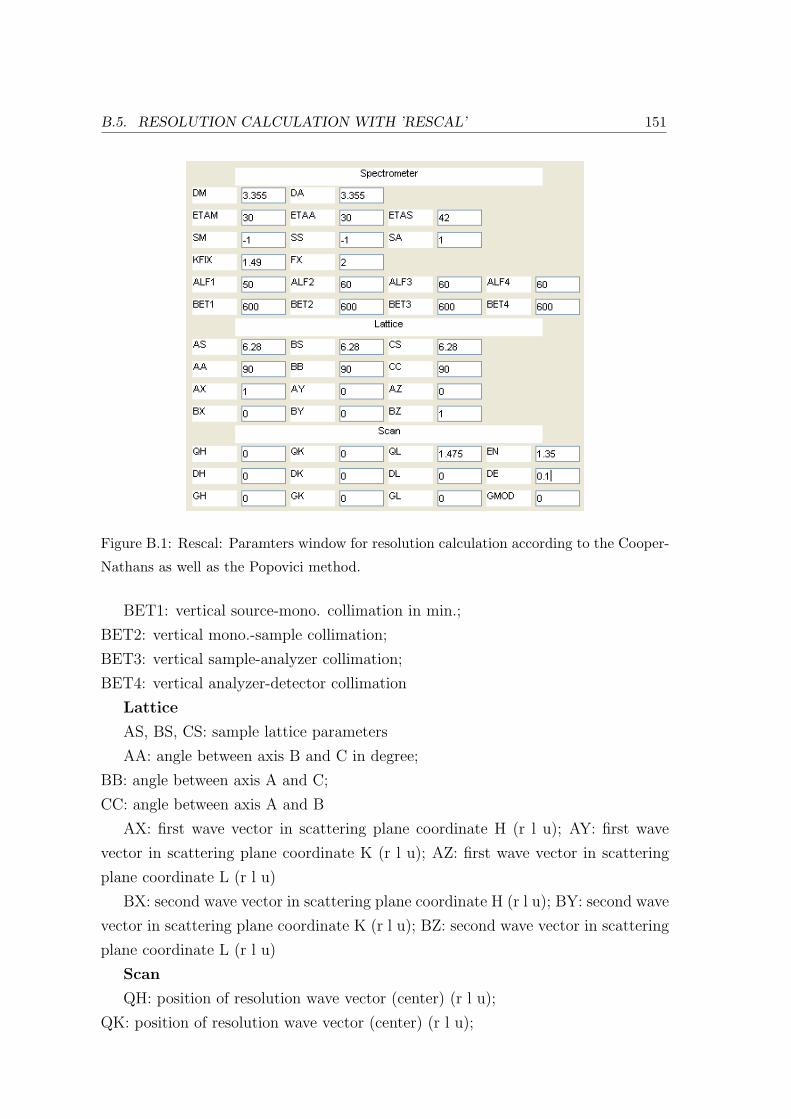
B.5. RESOLUTION CALCULATION WITH ’RESCAL’ 151
Figure B.1: Rescal: Paramters window for resolution calculation according to the Cooper-
Nathans as well as the Popovici method.
BET1: vertical source-mono. collimation in min.;
BET2: vertical mono.-sample collimation;
BET3: vertical sample-analyzer collimation;
BET4: vertical analyzer-detector collimation
Lattice
AS, BS, CS: sample lattice parameters
AA: angle between axis B and C in degree;
BB: angle between axis A and C;
CC: angle between axis A and B
AX: first wave vector in scattering plane coordinate H (r l u); AY: first wave
vector in scattering plane coordinate K (r l u); AZ: first wave vector in scattering
plane coordinate L (r l u)
BX: second wave vector in scattering plane coordinate H (r l u); BY: second wave
vector in scattering plane coordinate K (r l u); BZ: second wave vector in scattering
plane coordinate L (r l u)
Scan
QH: position of resolution wave vector (center) (r l u);
QK: position of resolution wave vector (center) (r l u);
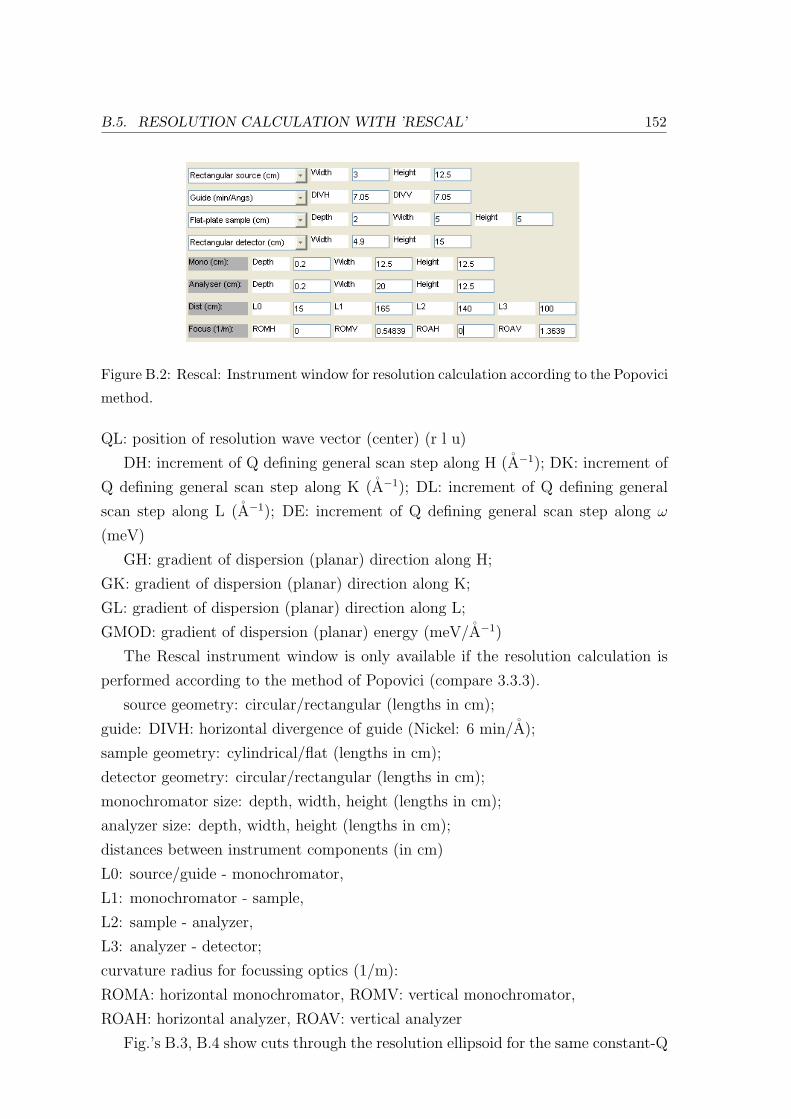
B.5. RESOLUTION CALCULATION WITH ’RESCAL’ 152
Figure B.2: Rescal: Instrument window for resolution calculation according to the Popovici
method.
QL: position of resolution wave vector (center) (r l u)
DH: increment of Q defining general scan step along H (A−1); DK: increment of
Q defining general scan step along K (A−1); DL: increment of Q defining general
scan step along L (A−1); DE: increment of Q defining general scan step along ω
(meV)
GH: gradient of dispersion (planar) direction along H;
GK: gradient of dispersion (planar) direction along K;
GL: gradient of dispersion (planar) direction along L;
GMOD: gradient of dispersion (planar) energy (meV/A−1)
The Rescal instrument window is only available if the resolution calculation is
performed according to the method of Popovici (compare 3.3.3).
source geometry: circular/rectangular (lengths in cm);
guide: DIVH: horizontal divergence of guide (Nickel: 6 min/A);
sample geometry: cylindrical/flat (lengths in cm);
detector geometry: circular/rectangular (lengths in cm);
monochromator size: depth, width, height (lengths in cm);
analyzer size: depth, width, height (lengths in cm);
distances between instrument components (in cm)
L0: source/guide - monochromator,
L1: monochromator - sample,
L2: sample - analyzer,
L3: analyzer - detector;
curvature radius for focussing optics (1/m):
ROMA: horizontal monochromator, ROMV: vertical monochromator,
ROAH: horizontal analyzer, ROAV: vertical analyzer
Fig.’s B.3, B.4 show cuts through the resolution ellipsoid for the same constant-Q
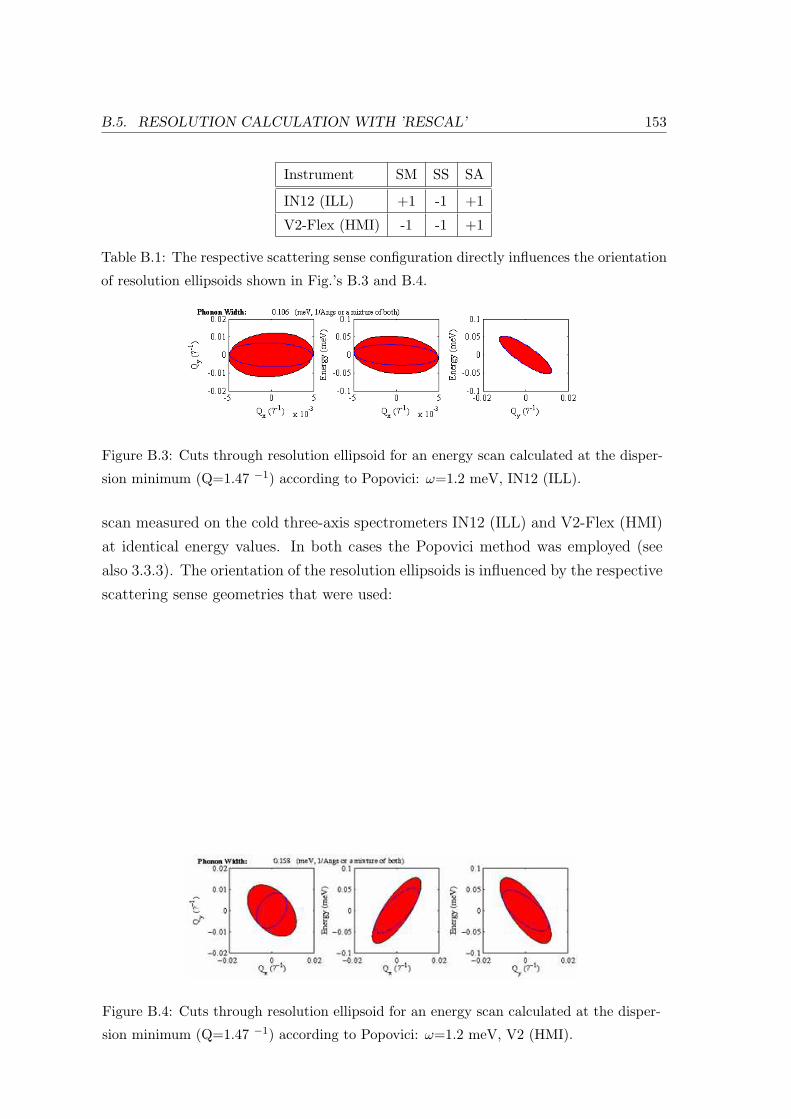
B.5. RESOLUTION CALCULATION WITH ’RESCAL’ 153
Instrument SM SS SA
IN12 (ILL) +1 -1 +1
V2-Flex (HMI) -1 -1 +1
Table B.1: The respective scattering sense configuration directly influences the orientation
of resolution ellipsoids shown in Fig.’s B.3 and B.4.
Figure B.3: Cuts through resolution ellipsoid for an energy scan calculated at the disper-
sion minimum (Q=1.47 −1) according to Popovici: ω=1.2 meV, IN12 (ILL).
scan measured on the cold three-axis spectrometers IN12 (ILL) and V2-Flex (HMI)
at identical energy values. In both cases the Popovici method was employed (see
also 3.3.3). The orientation of the resolution ellipsoids is influenced by the respective
scattering sense geometries that were used:
Figure B.4: Cuts through resolution ellipsoid for an energy scan calculated at the disper-
sion minimum (Q=1.47 −1) according to Popovici: ω=1.2 meV, V2 (HMI).

Bibliography
[1] S. Paula, A. G. Volkow, A. N. Van Hoek, T. H. Haines, and D. W. Deamer.
Biophys. J, 70:339–348, 1996.
[2] J. F. Nagle and H. L. jr Scott. Biochim. Biophys. Acta, 513:236, 1978.
[3] H. Reinl, T. Brumm, and T. M. Bayerl. Biophys. J., 61:1025, 1992.
[4] H.A. Scheidt, D. Huster, and K. Gawrisch. Biophys. J., 89:2504, 2005.
[5] W. Pfeiffer, Th. Henkel, E. Sackmann, W. Knoll, and D. Richter. Europhys.
Lett., 8:201–206, 1989.
[6] C. Gliss, O. Randel, H. Casalta, E. Sackmann, R. Zorn, and T. Bayerl. Bio-
phys. J., 77:331, 1999.
[7] S. H. Chen, C. Y. Liao, H. W. Huang, T. M. Weiss, M. C. Bellisent-Funel, and
F. Sette. Phys. Rev. Lett., 86:740, 2001.
[8] M. C. Rheinstadter, C. Ollinger, G. Fragneto, F. Demmel, and T. Salditt.
Phys. Rev. Lett., 93:108107, 2004.
[9] W. Pfeffer. Osmotische Untersuchungen. Studien zur Zellmechanik. W. En-
gelmann, Leipzig, 1877.
[10] E. Gorter and F. Grendel. J. Exp. Med, 41:439–443, 1925.
[11] S. J. Singer and G. L. Nicolson. Science, 173:720, 1972.
[12] O. G. Mouritsen and M. Bloom. Biophys. J, 46:141–153, 1984.
[13] J. Israelachvili. Intermolecular and Surface Forces. Academic Press, Amster-
dam, 2006.
[14] T. Heimburg. Biophys. J., 78:1154–1165, 2000.
[15] T. Heimburg. Thermal Biophysics of Membranes. Wiley, Weinheim, 2007.
154
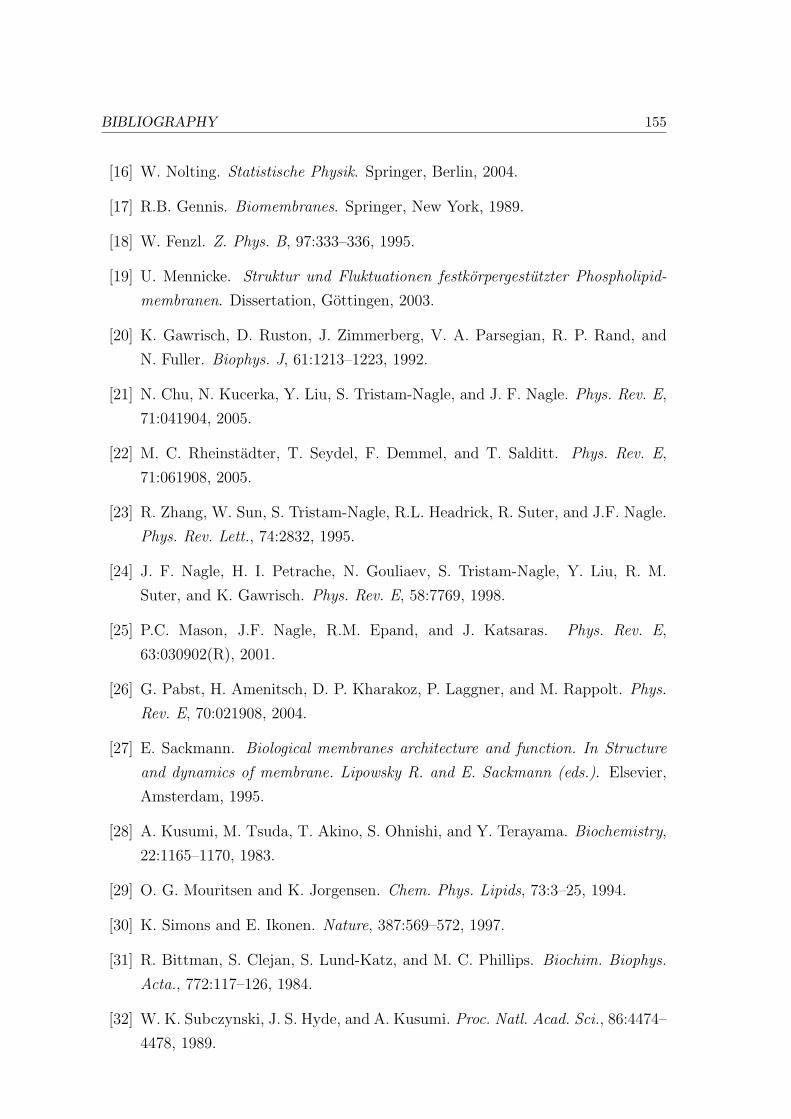
BIBLIOGRAPHY 155
[16] W. Nolting. Statistische Physik. Springer, Berlin, 2004.
[17] R.B. Gennis. Biomembranes. Springer, New York, 1989.
[18] W. Fenzl. Z. Phys. B, 97:333–336, 1995.
[19] U. Mennicke. Struktur und Fluktuationen festkorpergestutzter Phospholipid-
membranen. Dissertation, Gottingen, 2003.
[20] K. Gawrisch, D. Ruston, J. Zimmerberg, V. A. Parsegian, R. P. Rand, and
N. Fuller. Biophys. J, 61:1213–1223, 1992.
[21] N. Chu, N. Kucerka, Y. Liu, S. Tristam-Nagle, and J. F. Nagle. Phys. Rev. E,
71:041904, 2005.
[22] M. C. Rheinstadter, T. Seydel, F. Demmel, and T. Salditt. Phys. Rev. E,
71:061908, 2005.
[23] R. Zhang, W. Sun, S. Tristam-Nagle, R.L. Headrick, R. Suter, and J.F. Nagle.
Phys. Rev. Lett., 74:2832, 1995.
[24] J. F. Nagle, H. I. Petrache, N. Gouliaev, S. Tristam-Nagle, Y. Liu, R. M.
Suter, and K. Gawrisch. Phys. Rev. E, 58:7769, 1998.
[25] P.C. Mason, J.F. Nagle, R.M. Epand, and J. Katsaras. Phys. Rev. E,
63:030902(R), 2001.
[26] G. Pabst, H. Amenitsch, D. P. Kharakoz, P. Laggner, and M. Rappolt. Phys.
Rev. E, 70:021908, 2004.
[27] E. Sackmann. Biological membranes architecture and function. In Structure
and dynamics of membrane. Lipowsky R. and E. Sackmann (eds.). Elsevier,
Amsterdam, 1995.
[28] A. Kusumi, M. Tsuda, T. Akino, S. Ohnishi, and Y. Terayama. Biochemistry,
22:1165–1170, 1983.
[29] O. G. Mouritsen and K. Jorgensen. Chem. Phys. Lipids, 73:3–25, 1994.
[30] K. Simons and E. Ikonen. Nature, 387:569–572, 1997.
[31] R. Bittman, S. Clejan, S. Lund-Katz, and M. C. Phillips. Biochim. Biophys.
Acta., 772:117–126, 1984.
[32] W. K. Subczynski, J. S. Hyde, and A. Kusumi. Proc. Natl. Acad. Sci., 86:4474–
4478, 1989.
BIBLIOGRAPHY 156
[33] W. K. Subczynski, A. Wisuiewska, J.-J. Yin, J. S. Hyde, and A. Kusumi.
Biochemistry, 33:7670–7681, 1994.
[34] M. Y. El-Sayed, T. A. Guion, and M. D. Fayer. Biochemistry, 25:4825–4832,
1986.
[35] M. Bloom, E. Evans, and O. G. Mouritsen. Q. Rev. Biophys., 24:293–397,
1991.
[36] M. Bloom and O. G. Mouritsen. The evolution of membrane. In Structure
and dynamics of membrane. Lipowsky R. and E. Sackmann (eds.). Elsevier,
Amsterdam, 1995.
[37] M. R. Vist and J. H. Davis. Biochemistry, 29:451, 1990.
[38] I. Vattulainen. Diff. Fund., 2:113.1–113.15, 2005.
[39] M. B. Sankaram and T. E. Thompson. Biochemistry, 29:10670, 1990.
[40] M. B. Sankaram and T. E. Thompson. Proc. Natl. Acad. Sci., 88:8686, 1991.
[41] F. Richter, G. Rapp, and L. Finegold. Phys. Rev. E, 63:051914, 2001.
[42] P.F.F. Almeida, W.L.C. Vaz, and T.E. Thompson. Biochemistry, 31:6739,
1992.
[43] G. Ipsen, J. H.and Karlstrom, O. G. Mouritsen, H. Wennerstrom, and M. J.
Zuckermann. Biochim. Biophys. Acta, 905:162–172, 1987.
[44] D. J. Recktenwald and H. M. McConnell. Biochemistry, 20:4505, 1981.
[45] J. Huang and G. W. Feigenson. Biophys. J., 76:2142, 1999.
[46] A.M. Smondyrev and M.L. Berkowitz. Biophys. J., 77:2075, 1999.
[47] S. Karmakar and V. A. Raghunathan. Phys. Rev. Lett., 91:098102, 2003.
[48] S. Karmakar and V. A. Raghunathan. Phys. Rev. E, 71:061924, 2005.
[49] S. Karmakar, V. A. Raghunathan, and S. Mayor. J. Phys.: Cond. Matt.,
17:S1177–S1182, 2005.
[50] K. Mortensen, W. Pfeiffer, E. Sackmann, and W. Knoll. Biochim. Biophys.
Acta, 945:221–245, 1988.
[51] E. Endress, H. Heller, H. Casalta, M. F. Brown, and T. M. Bayerl. Biochem-
istry, 41:13078–13086, 2002.
BIBLIOGRAPHY 157
[52] B. W. Barry. Eur. J. Pharm. Sciences, 14:101, 2001.
[53] H. Benson. Curr. Drug Delivery, 2:23, 2005.
[54] K. Vavrova, J. Zbytovska, and A. Hrabalek. Curr. Med. Chem., 12:2273, 2005.
[55] T. Heimburg and A. D. Jackson. Biophys. Rev. Lett, 2:57–78, 2007.
[56] T. Heimburg and A. D. Jackson. Biophys. J, 92:3159–3165, 2007.
[57] P. Nambi, E. S. Rowe, and T. J. McIntosh. Biochem., 27:9175, 1988.
[58] U. Vierl, L. Lobbecke, N. Nagel, and G. Cevc. Biophys. J., 67:1067, 1994.
[59] J. Chanda and S. Bandyopadhyay. Chem. Phys. Lett., 392:249, 2004.
[60] J. A. Barry and K. Gawrisch. Biochemistry, 33:8082–8088, 1994.
[61] L. L. Holte and K. Gawrisch. Biochemistry, 36:4669–4674, 1997.
[62] S. E. Feller, C. A. Brown, D. T. Nizza, and K. Gawrisch. Biophys. J., 82:1396–
1404, 2002.
[63] B. W. Koenig and K. Gawrisch. J. Phys. Chem. B, 109:7540–7547, 2005.
[64] H. Trauble. J. Membr. Biol., 4:193–208, 1971.
[65] A. Hodgkin and A. Huxley. J. Physiol., 117:500–544, 1952.
[66] T. Heimburg and A. D. Jackson. Proc. Natl. Acad. Sci., 102:9790–9795, 2005.
[67] T. Heimburg. Biochim. Biophys. Acta, 1415:147–162, 1998.
[68] S. Halstenberg, T. Heimburg, T. Hianik, U. Kaatze, and R. Krivanek. Biophys.
J, 75:264–271, 1998.
[69] W. Schrader, H. Ebel, P. Grabitz, E. Hanke, T. Heimburg, M. Hoeckel,
M. Kahle, F. Wente, and U. Kaatze. J. Phys. Chem. B, 106:6581–6586, 2002.
[70] T. A. Harroun, J. Katsaras, and S. R. Wassall. Biochemistry, 45:1227–1233,
2006.
[71] G. Shirane, S. M. Shapiro, and J. M. Tranquada. Neutron scattering with a
triple-axis spectrometer: basic techniques. Cambridge Univ. Press, Cambridge,
2002.
[72] G. L. Squires. Introduction to the theory of thermal neutron scattering. Cam-
bridge Univ. Press, Cambridge, 1978.
BIBLIOGRAPHY 158
[73] L. Van Hove. Phys. Rev., 95:251, 1954.
[74] V. F. Sears. Thermal neutron scattering lengths and cross sections for con-
densed matter research. Atomic Energy Canada Ltd., Chalk River, Ontario,
Canada, 1984.
[75] M. C. Rheinstadter, T. Seydel, W. Haußler, and T. Salditt. Physica B, 385-
386:722, 2006.
[76] J. S. Hub, T. Salditt, M. C. Rheinstadter, and B. L. de Groot. Biophys. J.,
2007.
[77] M. C. Rheinstadter, T. Seydel, and T. Salditt. Phys. Rev. E, 75:011907, 2007.
[78] M. C. Rheinstadter, J. Das, E. J. Flenner, B. Bruning, T. Seydel, and
I. Kosztin. Phys. Rev. Lett., 101:248106, 2008.
[79] M. C. Rheinstadter, W. Haußler, and T. Salditt. Phys. Rev. Lett., 97:048103,
2006.
[80] M. Tarek, D. J. Tobias, S.-H. Chen, and M. L. Klein. Phys. Rev. Lett., 87:2381,
2001.
[81] T. M. Weiss, P.-J. Chen, H. Sinn, E. E. Alp, S.-H. Chen, and H. W. Huang.
Biophys. J., 84:3767, 2003.
[82] A. A. van Well, P. Verkerk, and L. A. de Graaf. Phys. Rev. A, 31:3391, 1985.
[83] A. A. van Well and L. A. de Graaf. Phys. Rev. A, 32:2396, 1985.
[84] I. M. de Schepper, P. Verkerk, A. A. van Well, and L. A. de Graaf. Phys. Rev.
Lett., 50:974, 1983.
[85] P. G. De Gennes. Physica, 25:825–839, 1959.
[86] C. Y. Liao, S. H. Chen, and F. Sette. Phys. Rev. E, 61:1518, 2000.
[87] J. Teixeira, M. C. Bellissent-Funel, S. H. Chen, and B. Dorner. Phys. Rev.
Lett., 54:2681, 1985.
[88] E. G. D. Cohen and I. M. de Schepper. Il Nuovo Cimento D, 12:521, 1990.
[89] P. G. de Gennes and J. Prost. The Physics of Liquid Crystals. Clarendon
Press, Oxford, 1993.
BIBLIOGRAPHY 159
[90] E. I. Kats and V. V. Lebedev. Fluctuational Effects in the Dynamics of Liquid
Crystals. Springer, New York, 1994.
[91] W. R. Busing and H. A. Levy. Acta Cryst., 22:457, 1967.
[92] L. D. Cussen. J. Appl. Cryst., 33:1399, 2000.
[93] M. J. Cooper and R. Nathans. Acta Cryst. A, 23:357, 1967.
[94] A. Ghose, H. Palevsky, D. J. Hughes, I. Pelah, and C. M. Eisenhauer. Phys.
Rev., 113:49, 1959.
[95] S. Klotz. Z. Kristallogr., 216:420–429, 2001.
[96] M. Popovici. Acta Cryst. A, 31:507, 1975.
[97] M. C. Rheinstadter, C. Ollinger, G. Fragneto, and T. Salditt. Physica B,
350:136–139, 2004.
[98] G. S. Smith, E. B. Sirota, C. R. Safinya, and N. A. Clark. Phys. Rev. Lett.,
60:813, 1988.
[99] L. Greenspan. J. of Research, National Bureau of Standards, 81A:89–96, 1977.
[100] Z. Khattari, G. Brotons, M. Akkawi, E. Arbely, and T. Salditt. Biophys. J,
90:2038–2050, 2006.
[101] E. G. D. Cohen, P. Westerhuijs, and I. M. de Schepper. Phys. Rev. Lett.,
59:2872, 1987.
[102] B. Fak and B. Dorner. Physica B, 234:1107, 1997.
[103] H. Ebel, P. Grabitz, and T. Heimburg. J. Phys. Chem. B, 105:7353–7360,
2001.
[104] M. Hildenbrand. Modulation kollektiver Membrandynamik im mesoskopis-
chen Bereich durch Einbau und Adsorption von Biomolekulen. Dissertation,
Wurzburg, 2004.
[105] M. F. Hildenbrand and T. M. Bayerl. Biophys. J., 88:3360, 2005.
[106] M. C. Giocondi and C. Le Grimellec. Biophys. J, 86:2218, 2004.
[107] E. Falck, M. Patra, M. Karttunen, M. T. Hyvonen, and I. Vattulainen. Bio-
phys. J., 87:1076, 2004.
BIBLIOGRAPHY 160
[108] M. Pasenkiewicz-Gierula, T. Rog, K. Kitamura, and A. Kusumi. Biophys. J.,
78:1376, 2000.
[109] S. W. Chiu, E. Jakobsson, and H. L. Scott. Biophys. J., 80:1104, 2001.
[110] K. Tu, M. L. Klein, and J. T. Douglas. Biophys. J., 75:2147, 1998.
[111] S. Marcelja. J. Chem Phys, 60:3599, 1974.
[112] S. Marcelja and J. Wolfe. Biochim. Biophys Acta, 557:24–31, 1979.
[113] P. V. Dolganov, V. M. Zhilin, and V. K. Dolganov. Phys. Rev. E, 67:041716,
2003.
[114] P. L. Chong. Proc. Natl. Acad. Sci., 91:10069–10073, 1994.
[115] J. A. Virtanen, M. Ruonala, M. Vauhkonen, and P. Somerharju. Biochemistry,
34:11568–11581, 1995.
[116] S. J. Marrink, A. H. de Vries, T. A. Harroun, J. Katsaras, and S. R. Wassall.
J. Am. Chem. Soc., 130:10–11, 2008.
[117] T. A. Harroun, J. Katsaras, and S. R. Wassall. Biochemistry, 47:7090–7096,
2008.
[118] M. Brzustowicz, V. Cherezov, M. Caffrey, W. Stillwell, and S. R. Wassall.
Biophys. J., 82:285–298, 2002.
[119] A. Braslau, P. S. Pershan, G. Swislow, B. M. Ocko, and J. Als-Nielsen. Phys.
Rev. A, 38:2457, 1988.
[120] J. Als-Nielsen and D. McMorrow. Elements of Modern X-ray Physics. Wiley,
New York, 2001.
[121] T. Salditt, C. Li, A. Spaar, and U. Mennicke. Europhys. J. E, 7:105–116, 2002.
[122] S. Tristam-Nagle, H. Petrache, and J. F. Nagle. Biophys. J, 75:917–925, 1998.
[123] M. Gandhavadi, D. Allende, A. Vidal, S. A. Simon, and T. J. McIntosh. Bio-
phys. J., 82:1469–1462, 2002.
[124] E. Novakova, K. Giewemeyer, and T. Salditt. Phys. Rev. E, 74:051911, 2006.
[125] Ch. Li, D. Constantin, and T. Salditt. J. Phys.: Cond. Matt., 16:S2439–S2453,
2004.
[126] A. Spaar and T. Salditt. Biophys. J, 85:1576–1584, 2003.

Acknowledgements
At this point, I would like to acknowledge Tim Salditt for proposing this challenging
topic and for the interest he has shown in my in-house work at the Institut fur
Rontgenphysik (IRP) in Gottingen over the past three years. Also, I wish to thank
him for the unique opportunity to spend the majority of my phd-time in a truely
inspiring working environment such as the Institut Laue-Langevin (ILL) in Grenoble,
France. Thank you for your vote of confidence.
A special thank you also goes to Helmut Schober, who has agreed to co-referee
this thesis, and whose office door at the ILL was always open to me, even during
my long stay in Germany in the past year. I also thank Maikel Rheinstadter for his
continuous efforts to help me get started at the ILL at the beginning of my thesis,
and for returning from the United States twice for mutual experiments.
At the IRP, I particurlarly enjoyed the times I spent preparing neutron exper-
iments and characterizing my samples. I am grateful to Christoph Ollinger and
Thorsten Gronemann for technical assistance during the sample preparation. I
thank my former office partners Anja Glisovic and Sven-Philip Kruger, who have
both read parts of this manuscript and given valuable comments, and my collegues,
Klaus Giewekemeyer and Sebastian Aeffner, who have done the same.
My heartfelt thanks also go to the members of the ILL Three-Axis (TAS) and
Time-of-Flight (TOF) groups who have always made me feel part of a unique team.
I am deeply indepted to Karin Schmalzl (TAS-group) and Tilo Seydel (TOF-group),
who ’adopted’ me in times when I seeked scientific and other guidance. Both of them
have also read parts of this manuscript. A special ’thank you’ also to the members
of the ’junior’ TAS-group: Lola Ruiz-Martin, Elisa Wheeler, Alexander Grunwald
and Paul Freeman. I enjoyed our discussions very much.
’Thank you’ also to other former and present members of the ILL student-body:
Martin Kempa, Liz, Katy, Clara, Mark, Johnny, Amy, Navid, Tinka, Jochen, Anton,
Martin Dawson, Andreas, Audrey and Estelle. Thank you for the ’coffee breaks’,
the skiing and hiking, going to ice hockey matches, telling me to turn off skype once
in while, restaurant visits and going out, ’international’ cooking lessons, long game
nights and generally for being there in trying and in fun times.
In Gottingen, I would like to thank my three ’oldest’ friends who have accom-
panied me (almost) since the beginning of my undergraduate studies: Alice von der
Heydt, Philip Zaulig and Mario Stanke. Countless offers of a couch to sleep on dur-
ing my shorter stays, as well as help with my frequent moves are deeply appreciated
at this point.

BIBLIOGRAPHY 162
Of course, I am grateful to my mother, who has continuosly supported me
throughout my studies emotionally and financially. My special gratitude also be-
longs to my brother, Bernhard, whose constant presence in Bielefeld has been a
great relief over the past two years.
Without all of you, this work could not have been possible. Thank you.

Lebenslauf
Name Beate-Annette Bruning
Geburtsdatum 23. Dezember 1978
Geburtsort Bielefeld
Staatsangehorigkeit deutsch
Schulbildung
1985 bis 1987 Bultmannshof-Grundschule in Bielefeld
1987 bis 1989 Riverside Elementary School in Princeton, NJ, USA
1989 Bultmannshof-Grundschule in Bielefeld
1989 bis 1995 Ratsgymnasium in Bielefeld
1995 bis 1996 Chetek High School in Chetek, WI, USA
1996 bis 1998 Ratsgymnasium in Bielefeld (Abitur)
Studium
Oktober 1998 bis Marz 2005 Studium der Physik im Diplomstudiengang an der
Georg-August-Universitat Gottingen (Diplom)
seit September 2005 Promotionsstudium im Fach Physik
an der Georg-August-Universitat Gottingen
Doktorandin am Institut Laue-Langevin
in Grenoble, Frankreich
Berufstatigkeit
August 2000 bis September 2002 studentische Hilfskraft in der Abteilung Molekulare Wechselwirkungen
am Max-Planck Institut fur Stromungsforschung, Gottingen
WS 02/03 studentische Hilfskraft in der mathematischen Fakultat
der Universitat Gottingen
SS 03 studentische Hilfskraft am Institut fur Mikrobiologie und Genetik
der Universitat Gottingen
September 2005 bis August 2007 wissenschaftliche Mitarbeiterin am Institut Laue-Langevin
in Grenoble, Frankreich
August 2005 bis September 2008 wissenschaftliche Mitarbeiterin am Institut fur Rontgenphysik
der Universitat Gottingen