Embed Size (px)
Citation preview
Collection and Treatment of Flowback and Produced Waters from Hydraulic Fracturing Edwin Pinero Veolia Water North America
The Issue Oil and gas production using enhanced techniques is NOT new Hydraulic fracturing is NOT new Oil and gas production using hydraulic fracturing IS NEW in some geographies Public interest, awareness, and concern is high Many myths and misconceptions The use of water and impact to water resources is a major concern
2
Industry Challenges – Flow Back and Produced Water
Increasing Transportation Cost Storage Cost – Frac Tanks, Impoundments, Tankage Flowback/Produced Water Processing Solid Waste Management Managing Total Cost Regulations Tightening Disposal Outlets are decreasing Best Available Technology
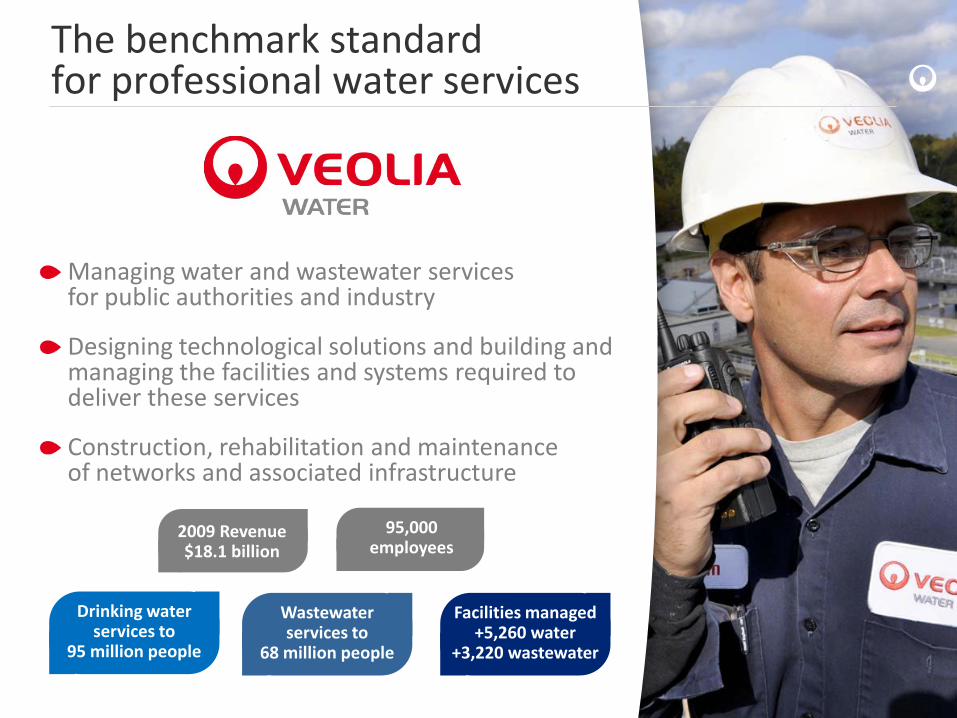
The benchmark standard for professional water services
Managing water and wastewater services for public authorities and industry
Designing technological solutions and building and managing the facilities and systems required to deliver these services
Construction, rehabilitation and maintenance of networks and associated infrastructure
95,000 employees
Drinking water services to
95 million people
Wastewater services to
68 million people
Facilities managed +5,260 water
+3,220 wastewater
2009 Revenue $18.1 billion
The View from the Water Company Quantity- Need to address the supply issue- where is it coming from and is there enough? Cross contamination- how secure are the aquifers?
• Well construction and expertise of drillers Quality- what is being put in the water, how well is it being treated, and what is it doing to the water resources?
5
Collection and treatment Issues Decentralized sources Rates variable, highest for short period during development No infrastructure in new areas transport and Discharge issues- footprint Challenging chemistry relative to effluent discharge options and disposal of solids
6
Fracking Fluid Over 90% water 9% sand Approximately 1% of “everything else”
• Everything else can be salts, ethylene glycol, sodium, potassium carbonate, and a suite of proprietary mixes Primary quality concern: salts and solids Primary quantity concern: it takes a LOT of water!...but does it really compared to other uses of water? The golf course example
7
Flowback Early on, mainly fracking fluid and formation water Over time, more formation water Quality issues, decreasing frack chemicals and increasing percentage of formation chemistry Formation chemistry- salts, metals, NORM, organic compounds, etc.
8
How Much are we talking about? An Example
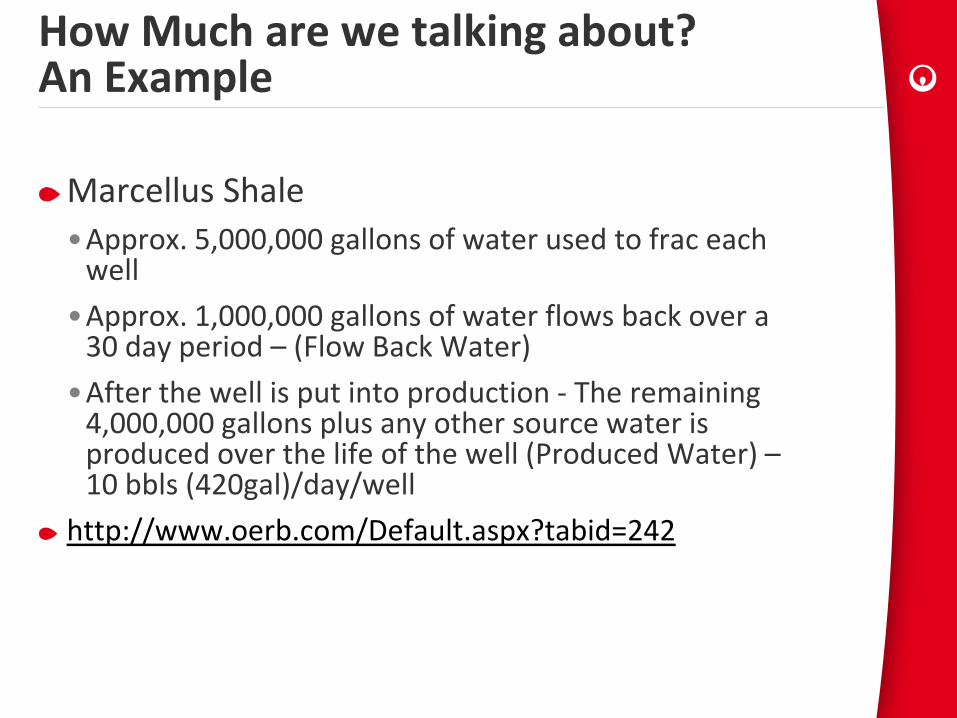
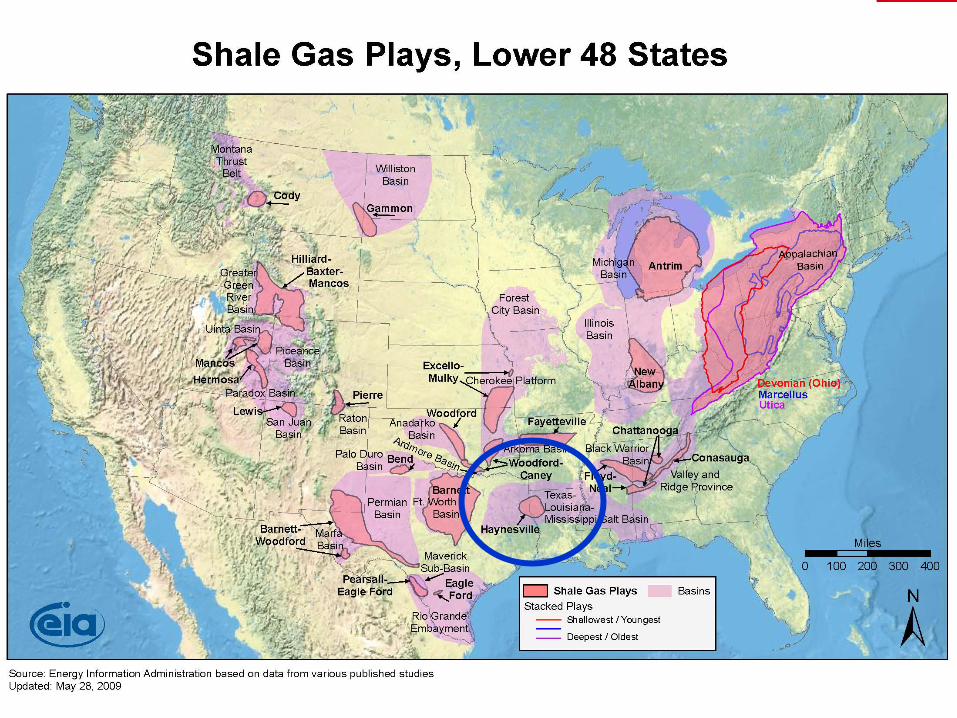
Marcellus Shale •Approx. 5,000,000 gallons of water used to frac each
well •Approx. 1,000,000 gallons of water flows back over a
30 day period – (Flow Back Water) •After the well is put into production - The remaining
4,000,000 gallons plus any other source water is produced over the life of the well (Produced Water) – 10 bbls (420gal)/day/well
http://www.oerb.com/Default.aspx?tabid=242
Solutions Modular approaches- package and mobile treatment plants Centralized treatment in local areas Reuse of treated water Highly efficient treatment (fast, cheap, low discharge, maximum water recovery)
10
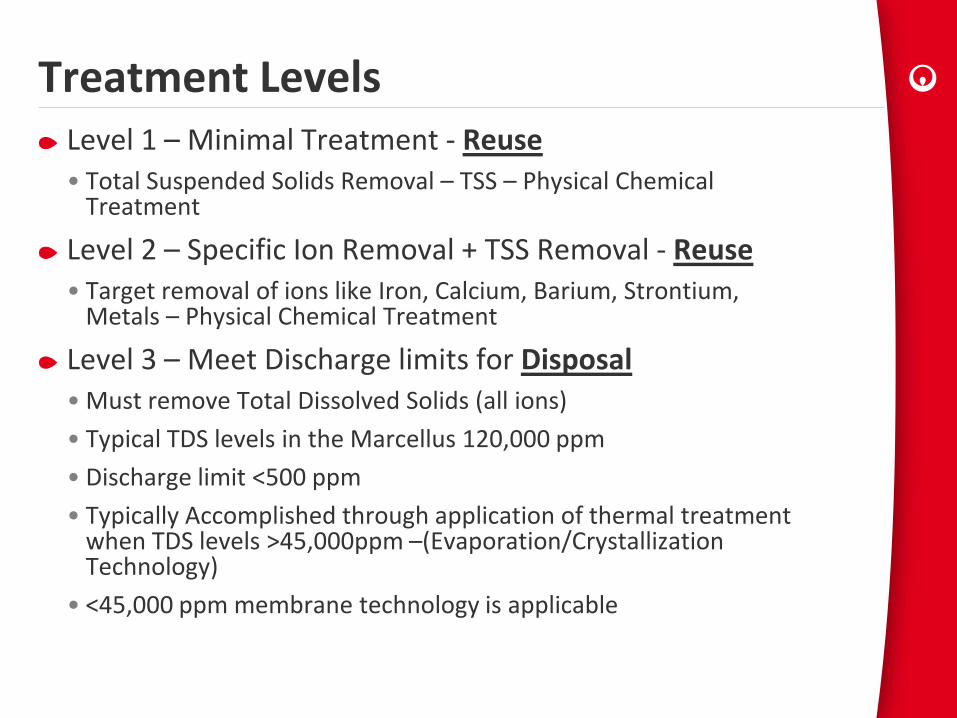
Treatment Levels Level 1 – Minimal Treatment - Reuse • Total Suspended Solids Removal – TSS – Physical Chemical
Treatment
Level 2 – Specific Ion Removal + TSS Removal - Reuse • Target removal of ions like Iron, Calcium, Barium, Strontium,
Metals – Physical Chemical Treatment
Level 3 – Meet Discharge limits for Disposal • Must remove Total Dissolved Solids (all ions) • Typical TDS levels in the Marcellus 120,000 ppm • Discharge limit <500 ppm • Typically Accomplished through application of thermal treatment
when TDS levels >45,000ppm –(Evaporation/Crystallization Technology)
• <45,000 ppm membrane technology is applicable
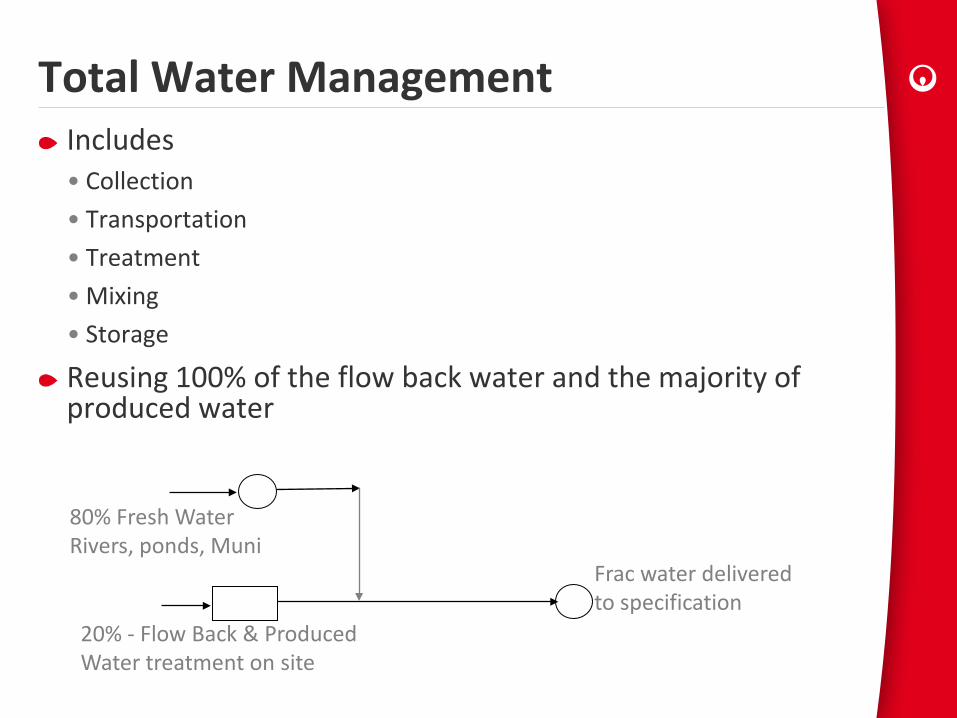
Total Water Management Includes • Collection • Transportation • Treatment • Mixing • Storage
Reusing 100% of the flow back water and the majority of produced water
Frac water delivered to specification
80% Fresh Water Rivers, ponds, Muni
20% - Flow Back & Produced Water treatment on site
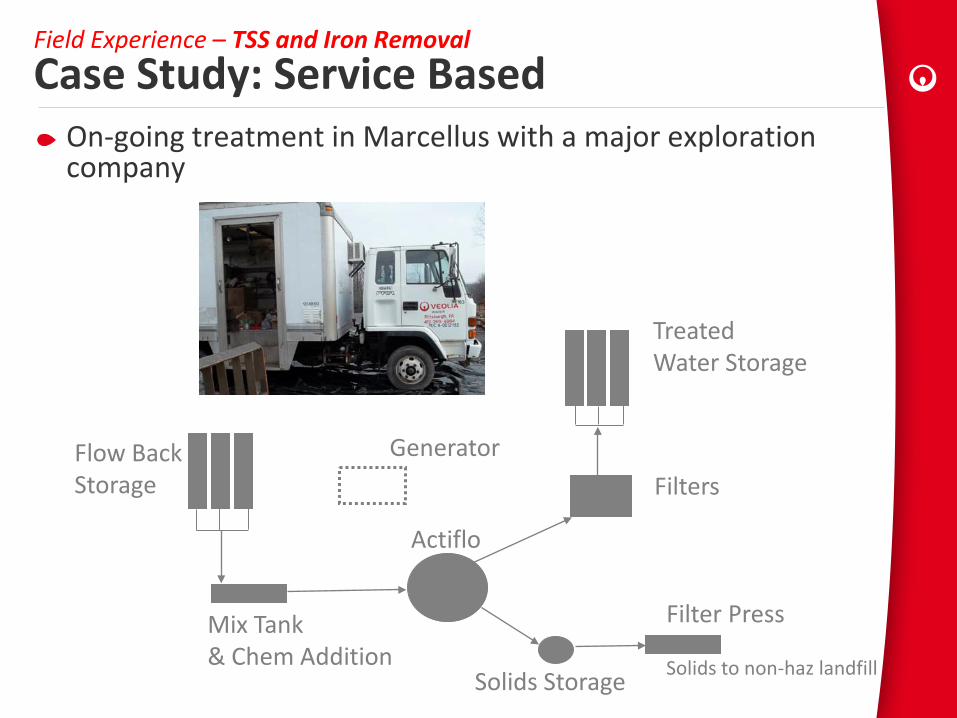
Field Experience – TSS and Iron Removal Case Study: Service Based
On-going treatment in Marcellus with a major exploration company
Flow Back Storage
Mix Tank & Chem Addition
Actiflo
Filters
Treated Water Storage
Solids Storage
Filter Press Solids to non-haz landfill
Generator
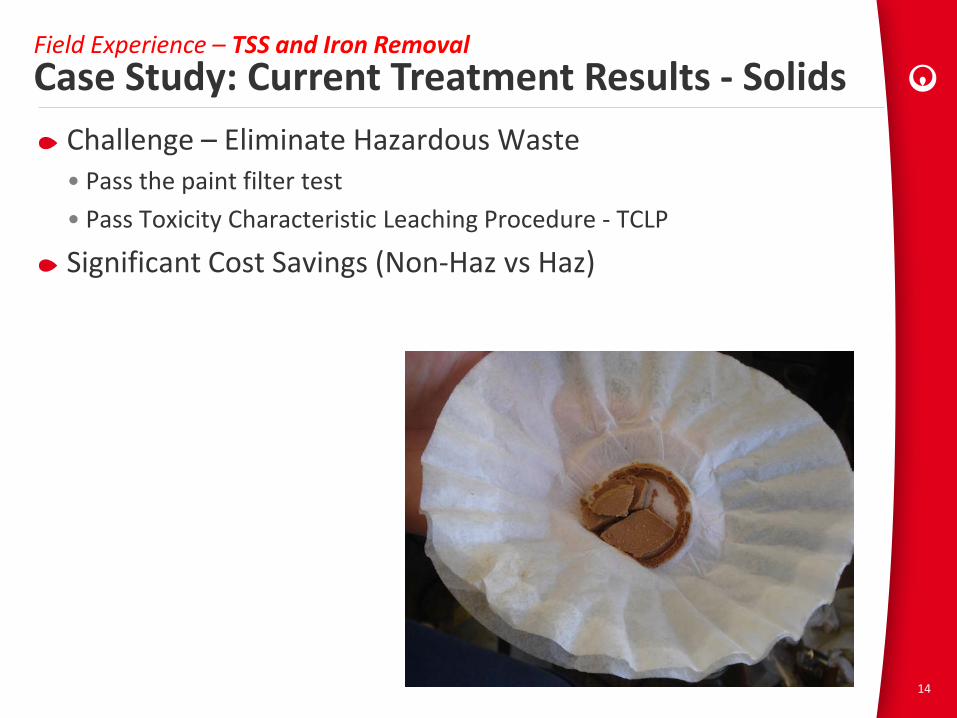
Challenge – Eliminate Hazardous Waste • Pass the paint filter test • Pass Toxicity Characteristic Leaching Procedure - TCLP
Significant Cost Savings (Non-Haz vs Haz)
14
Field Experience – TSS and Iron Removal Case Study: Current Treatment Results - Solids
Shale Map
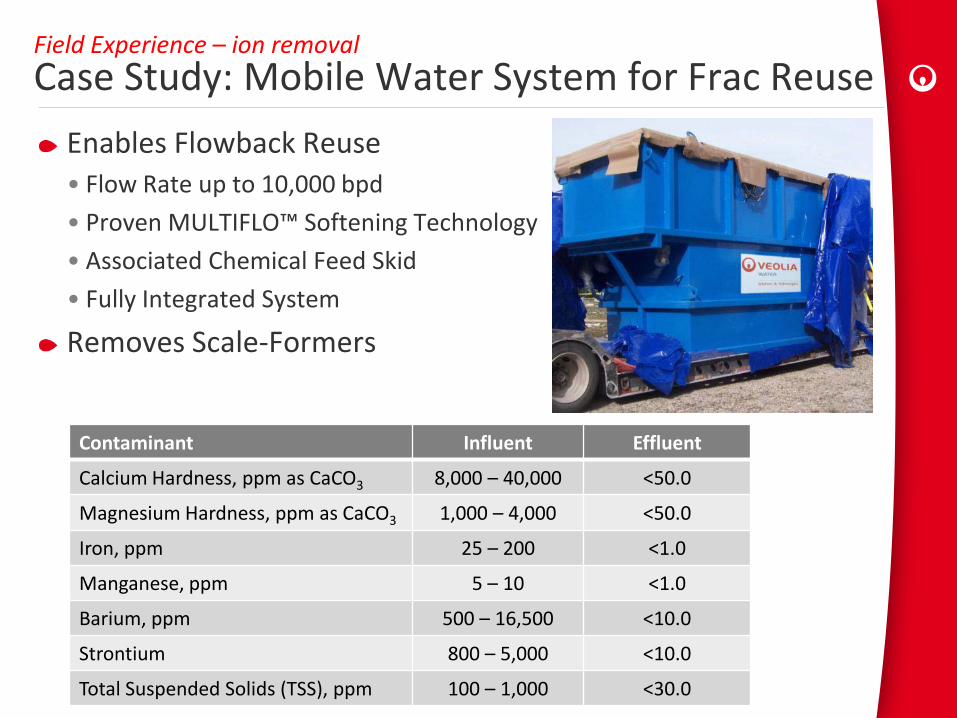
Field Experience – ion removal Case Study: Mobile Water System for Frac Reuse
Enables Flowback Reuse • Flow Rate up to 10,000 bpd • Proven MULTIFLO™ Softening Technology • Associated Chemical Feed Skid • Fully Integrated System
Removes Scale-Formers
Contaminant Influent Effluent
Calcium Hardness, ppm as CaCO3 8,000 – 40,000 <50.0
Magnesium Hardness, ppm as CaCO3 1,000 – 4,000 <50.0
Iron, ppm 25 – 200 <1.0
Manganese, ppm 5 – 10 <1.0
Barium, ppm 500 – 16,500 <10.0
Strontium 800 – 5,000 <10.0
Total Suspended Solids (TSS), ppm 100 – 1,000 <30.0
Shale Map
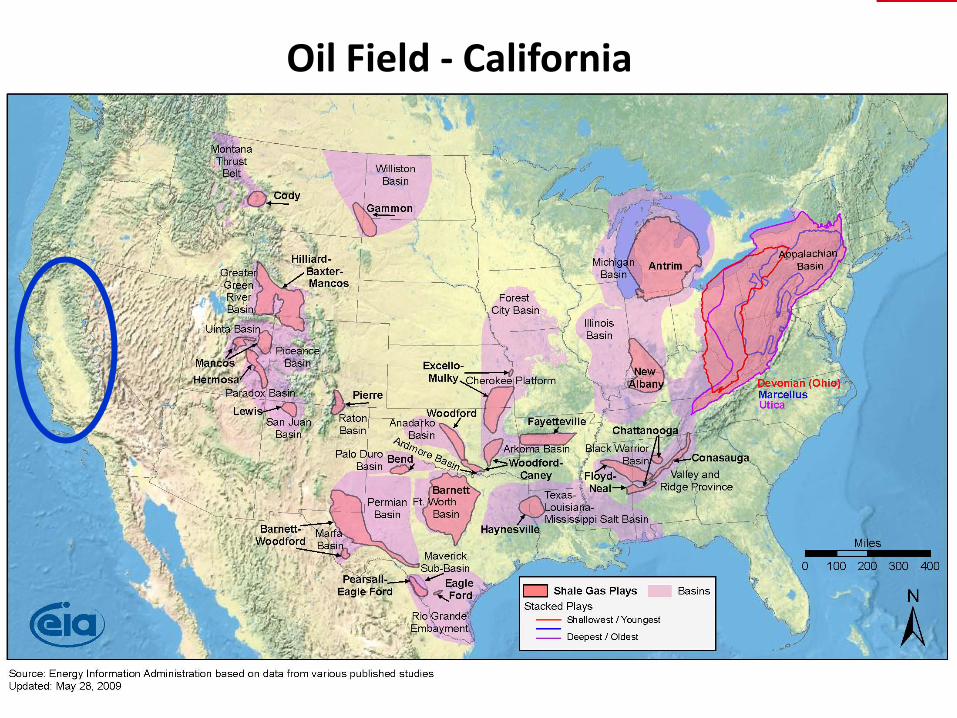
Oil Field - California
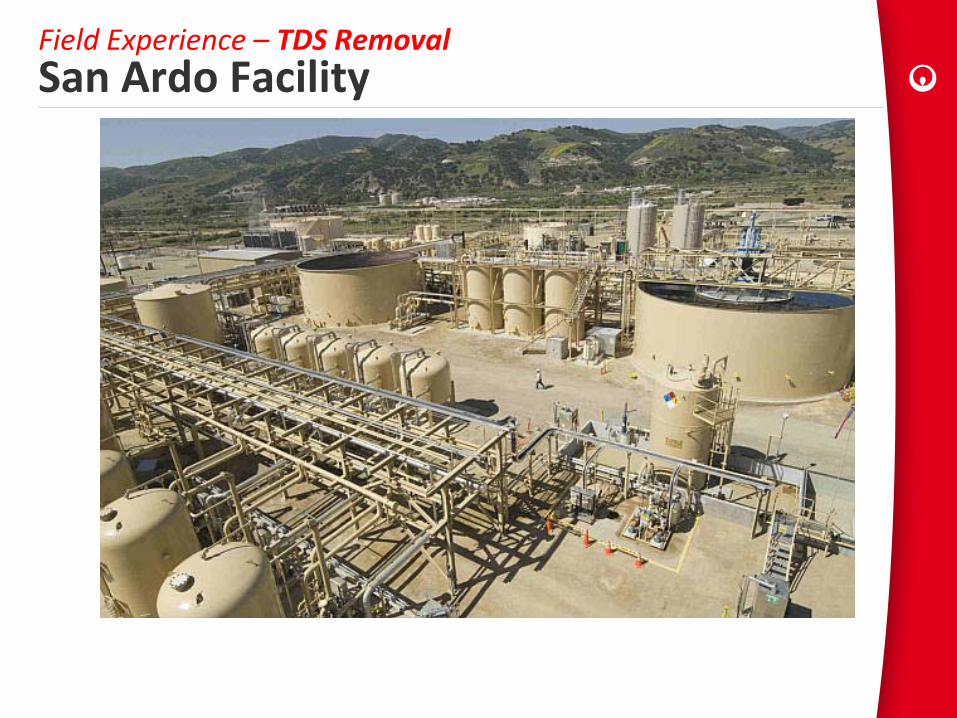
Field Experience – TDS Removal San Ardo Facility
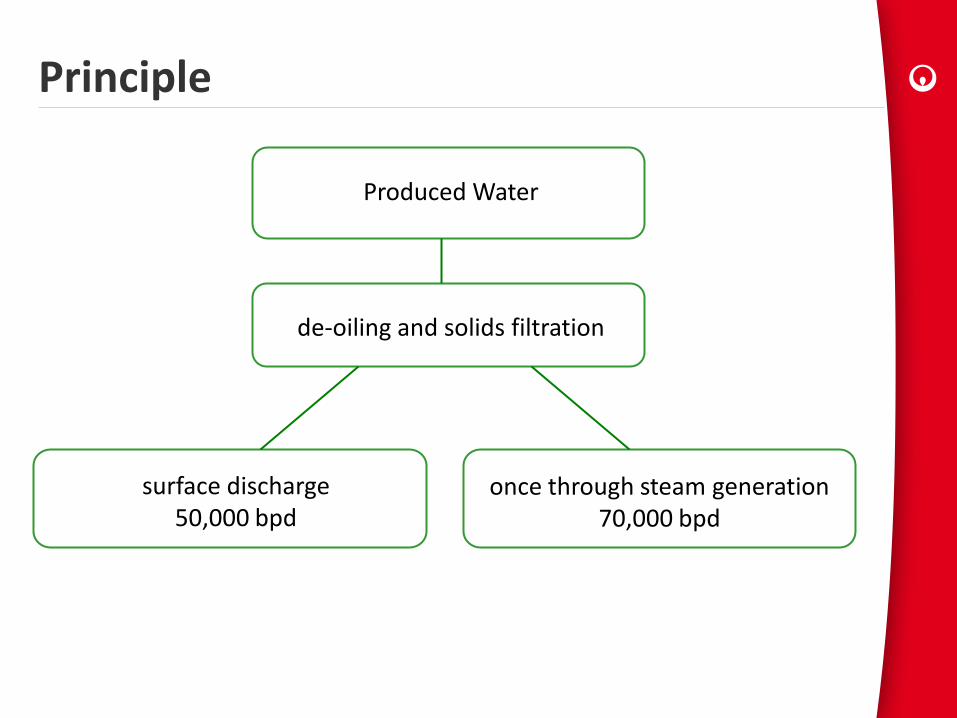
Principle
de-oiling and solids filtration
surface discharge 50,000 bpd
once through steam generation 70,000 bpd
Produced Water
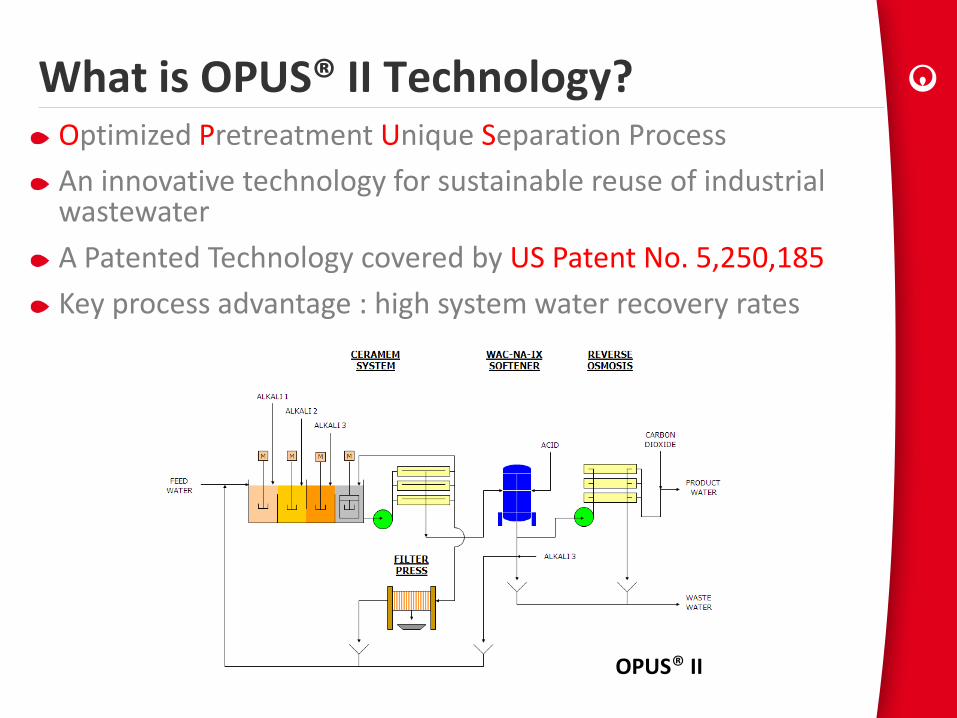
What is OPUS® II Technology? Optimized Pretreatment Unique Separation Process An innovative technology for sustainable reuse of industrial wastewater A Patented Technology covered by US Patent No. 5,250,185 Key process advantage : high system water recovery rates
OPUS® II
So what does all of this mean? Flowback and produced water is manageable There are various options to address differences in geography, chemistry, and producer requirements There is much activity in the development of technology and process to further improve the situation No one wants the water issue to be a barrier
21