Embed Size (px)
Citation preview

Collection and Analysis of Geothermal Gases
Lisa Shevenell' Fraser Goff Lois Gritzo
P. E. Trujillo, Jr.
LA-10482-0BES
UC-66b Issued: July 1985
·Undergraduate Student at Los Alamos. Los Alamos National Laboratory, Los Alamos, NM 87545.
Los Alamos National Laboratory Los Alamos, New Mexico 87545
r
COLLECTION AND ANALYSIS OF GEOTHERMAL GASES
by
Lisa Shevenell, Fraser Goff, Lois Gritzo, and P. E. Trujillo, Jr.
ABSTRACT
Rapid, reliable procedures are described for the collection and analysis of geothermal gases at Los Alamos National Laboratory. Gases covered are H2, He, Ar, 02, N2, CH4, C2H6, C02, and H2S. The methods outlined are suitable for geothermal exploration.
I. INTRODUCTION
Because of the rapid increase in the development and use of geothermal
resources in the 1 ast 20 years, many new geochemi cal techn iques h ave been
applied in geothermal exploration (e.g., Fournier, 1981). The geochemistry of
geothermal gases can be used to predict the subsurface temperature of
hydrothermal reservoirs if the gas sampled at the surface did not
re-equil ibrate as it traveled from a boil ing interface at depth to a surface
fumarole or hot spring (D'Amore and Panichi, 1980; Norman and Bernhardt,
1981). This exploration method is particularly useful for deep geothermal
reservoirs that do not directly supply hot water to surface springs and/or
for areas where only acid-sulfate hot springs occur (Goff and Vuataz, 1984;
Goff et al., 1985).
The object of this report is to describe rapid but reliable methods for
the collection and analysis of geothermal gases suitable for geothermal
exploration purposes. Gases covered in this report are H2, He, Ar, 02'
N2, CH 4 , C2H6 , CO2, and H2S. With modification, the analytical
methods could be refined to include more gases such as CO, S02' N20,
etc., or to detect ultraminute quantities of some gases. Noble gases other
than He and Ar are not covered by these procedures.
1

II. COLLECTING GAS SAMPLES A. Apparatu s
The basic apparatus used to collect gas samples consists of the following
items (Figs. 1 and 2): several meters of plastic tubing, a small hand pump, several sizes of funnels, SOO-m£ glass sample bottles with stopcocks at both
ends, a long collapsible wooden pole, masking tape and markers, and two bottle
clamps. One piece of tubing is attached to the suction stem of the hand pump and to one stopcock on the sample bott 1 e. Another pi ece of tubi ng connects
the other stopcock of the sampl e bottle with the stem of the funnel. Hence, tubing is attached to both openings on the sample bottle with the pump at one end and the funnel at the other end. The clamps are attached to the end of
the wooden pole in such a way that the funne 1 can be clamped to the pole. The purpose of this arrangement is to reach the funnel over the main area of
gas discharge and/or to keep the technician a safe distance away from boiling
springs or superheated fumaroles.
B. Procedure The sampling procedure is described below. 1. Locate the area where the most bubbles surface (spring) or where the
largest volume of gas issues (fumarole). 2. Place the wide end of the funnel into the bubbling water making sure
that the rim of the funnel is completely submerged. If sampling a fumarole,
dig out the area of interest, set the funnel into the earth, and pack earth
around the funnel. If the rim of the funnel is not completely covered, you
will contaminate your gas sample with air. 3. Begin pumping with the hand pump being careful not to suck water up
through the tubing into the sample bottle. As you pump while sampling a gaseous spring, you will see the water level rise in the funnel. When the water level approaches the apex of the funnel, cease pumping until gas fills
the funne 1. 4. Pump vigorously for about 2 minutes (lZS-m£ bottles) to S minutes
(SOO-m£ bottles) unti 1 all the air is out of the sample bottle and has been
replaced with geothermal gas. S. Close both stopcockS on the sample bottle before the funnel is
removed from the spring or fumarole.
2

Fig. 1. The apparatus used to collect gas samples from springs and fumaroles.
Fig. 2. The use of the apparatus is illustrated during the sampling of a bubbling spring.
3

6. Wrap masking tape around the stopcocks to avoid accidental opening of the gas bottle and contamination of the sample.
7. Wrap masking tape around the body of the bottle. With a felt marker, write the field number, sample name, or other identifier on the tape.
8. Record field number, sample name, date, location (and other important observat ions) in a fi e 1 d book. Hi gh-pressure procedures can and tub ing.
gas discharges may require little be easily adapted to sampling wells by
C. Potential Difficulties
or no pumping. These using appropriate valves
1. When sampling, if air appears to be leaking into the sample bottle, start the sampling procedure from the beginning.
2. If water enters the sample bottle while you are taking a sample, try to empty the water out of the bottle and start sampl ing again. If you have an extra sample bottle, it is best to use an uncontaminated bottle to take the sample.
III. MECHANICS OF GEOTHERMAL GAS ANALYSIS
A. The _Ga~ Chrom~tograph (GC) A gas chromatograph is an analytical instrument that physically separates
two or more gases based on their differential flow rate between a stationary phase (packed column) and a gas phase (Thompson, 1977). The instrument used
in the work reported here is a Hewlett-Packard 5832A gas chromatograph with a separate Hewlett-Packard l8850A terminal unit.
The basic concept of gas chromatography is that gas samples flow through a column (tube) filled with packing through which a specific carrier gas also flows (Supelco, 1980). There are three column-carrier gas setups routinely used in this procedure to analyze the different gases found in samples: the Poropak QS column with helium carrier gas, the Molecular Sieve 5A column with
helium carrier gas, and the Molecular Sieve 5A column with argon carrier gas. Both the Poropak QS column and the Molecular Sieve 5A column are 15 feet long, 1/8 inch in diameter, and 80/100 mesh. Each column-carrier gas setup is used to quantitatively detect different gases (Table 0. The various gases in geothermal gas samples flow through the column at different rates (due to
4

TABLE I
PARAMETERS USED FOR THE THREE RUN SETUPS DESCRIBED IN TEXT
Run 1 Run 2 Run 3 Molecular Sieve Molecular Sieve Poropak with
Parameter with Helium with Argon Helium
TEMPl (DC) 0 -40 35
TIMEl 5.0 3.5 7.0
RATE (DC/m) 30.00 0 20.00
TEMP2 (DC) 295 100
TIME2 11.0 5.0
CHT SPD 0.50 0.50 0.50
ATTN 2 5 7 6
TCD SGNL A +B A
SLP SENS 0.40 0.40 1.00
AREA REJ 200 200 250
OPTN 0 0 0
VLV /EXT 2[TIME] 0.1 2[TIME] 0.1 2[TIME] 0.1
VLV/EXT -2[TIME] 0.2 -2[TIME] 0.2 -2[TIME] 0.2
SLP SENS 0.05[TIME] 12.0 (delete) 0.2[TlME] 3.0
INJ TEMP (DC) 100 50 100
TCD TEMP (DC) 250 200 200
OVEN I'1AX (DC) 300 300 225
their size, molecular weight, and polarity) and, therefore, come out of the
column at different times. The time at which an individual gas leaves the
column is called its retention time, and different gases have different
characteristic retention times. When gases exit the column, they enter the
thermal conductivity detector (TCD), and their presence in the gas mixture is
recorded on a printer in the form of peaks, followed by a retention time. The
area under these peaks is calculated by an integrator and recorded on the
printer. From these areas, one can calculate the percentage of each
constituent of the gas sample.
There are three major parts of the GC system (Fig. 3): the injection
system with vacuum pump, the gas chromatograph (GC), and the printer/
5

0\
Fig. 3. The gas chromatograph system described in this report, including the injection system, the GC, and the printer.
integrator. The injection system is the segment of the GC system through
which gas is introduced, accurately pressurized, and injected into the GC.
The gas chromatograph separates the gases in the column, detects their
relative proportions, and sends information to the printer. The printer is
attached to the GC and records its findings. Various parameters are entered
on the printer's keyboard to control operation of the GC and to enhance the
quality of analysis (Table I). The samples, carrier gases, standard gases,
and liquid nitrogen (for cooling purposes) flow to the GC through stainless
steel or copper tubing. Stainless steel is used wherever H2S is present to
avoid reaction with copper.
Each day that the GC is used, premixed gas standards are run through the
system (Table II). Two standards are routinely run through the GC: a mixed
standard that s imul ates a typi ca 1 geothermal gas for all runs and a pure
CO 2 standard for the Poropak column with helium carrier run. Air is also
analyzed as a standard to correct for gas samples that contain air
contamination. Each standard flows through tubing from a tank to a manifold
on the injection part of the system. The amount of each type of gas in the
mixed standard is known and printed on the tank. Standards are analyzed so
that the technician has the response of a known volume of gas to compare with
the responses obtained when running volumes of sample through the GC.
Identical volumes of sample and standard gases are injected into the GC
during each run using a corrmercially available gas injection valve that will
contain a known volume of gas (1 cm3 for the apparatus described here).
Gas pressure is accurately measured before each run. When the pressure,
volume, and response spectra of samples and standards are known, the
volume-percentage of each gas component can be calculated.
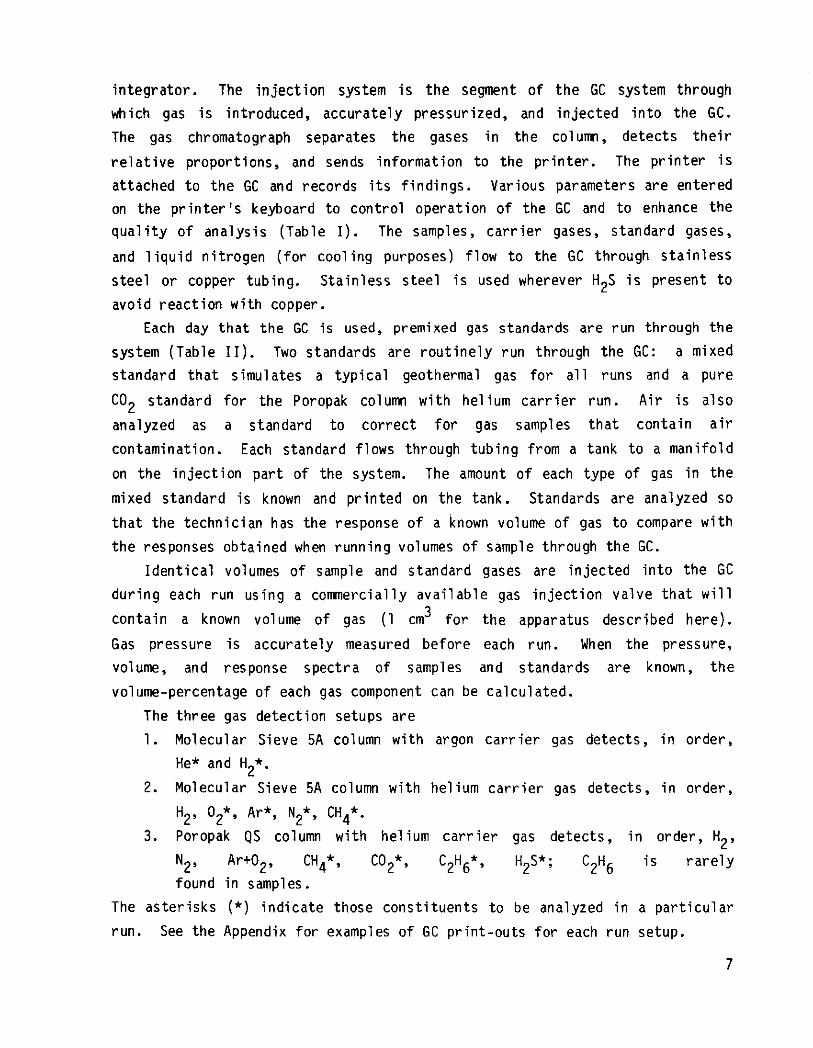
The three gas detection setups are
1. Molecular Sieve SA column with argon carrier gas detects, in order,
He* and H2*.
2. Molecular Sieve SA column with helium carrier gas detects, in order,
3. H2, 02*' Ar*, N2*' CH 4*· Poropak QS column with
Ar+02' CH 4*, in samples.
helium carrier gas detects,
H2S*; C2H6
in order, H2 ,
rarely is N2,
found
The asterisks (*) indicate those constituents to be analyzed in a particular
run. See the Appendix for examples of GC print-outs for each run setup.
7
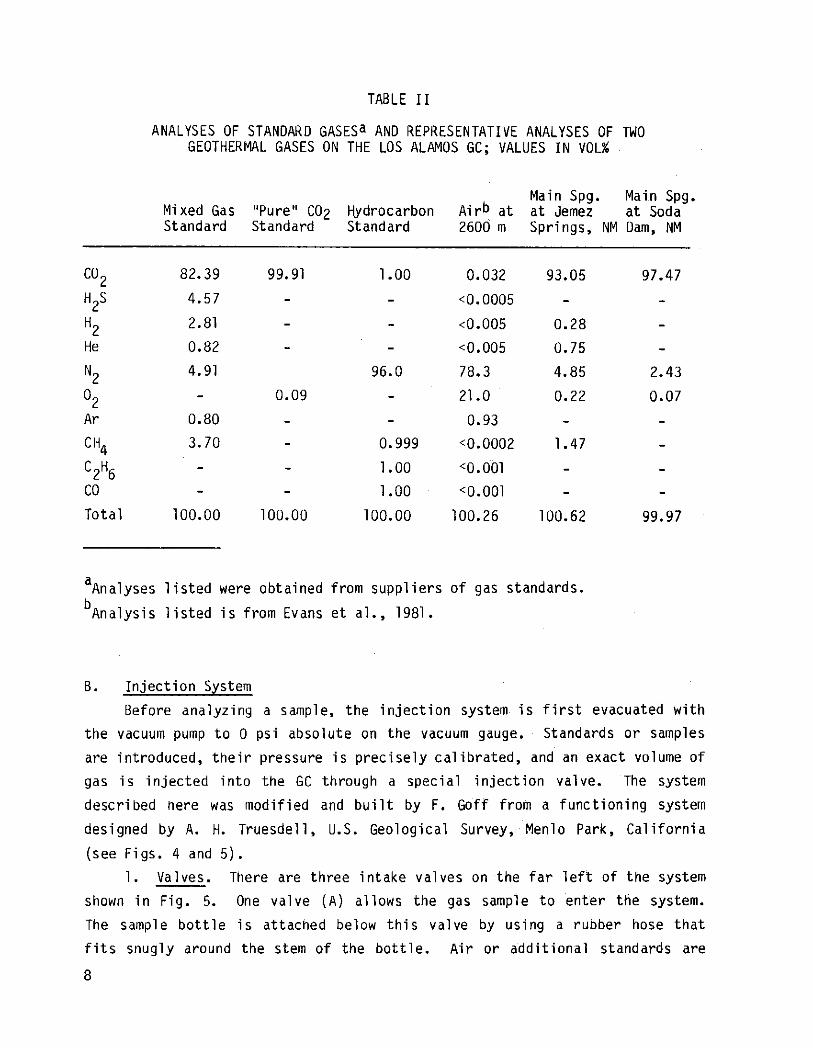
TABLE II
ANALYSES OF STANDARD GASESa AND REPRESENTATIVE ANALYSES OF TWO GEOTHERMAL GASES ON THE LOS ALAMOS GC; VALUES IN VOL%
CO 2 H S 2 H2 He
N2 O2 Ar
CH4 C2H6 CO
Total
aAnalyses b 1 . Ana YS1 s
Airb at Main Spg.
Mixed Gas "Pure" CO2 Hydrocarbon at Jemez Standard Standard Standard 2600 m Springs,
82.39 99.91 1.00 0.032 93.05
4.57 <0.0005
2.81 <0.005 0.28
0.82 <0.005 0.75
4.91 96.0 78.3 4.85
0.09 21.0 0.22
0.80 0.93
3.70 0.999 <0.0002 1.47
1.00 <0.001
1.00 <0.001
100.00 100.00 100.00 100.26 100.62
listed were obtained from suppliers of gas standards.
listed is from Evans et al., 1981.
B. Injection System
Main Spg. at Soda
NM [)am, NM
97.47
2.43
0.07
99.97
Before analyzing a sample, the injection system is first evacuated with
the vacuum pump to 0 psi absolute on the vacuum gauge. Standards or samples
are introduced, their pressure is precisely calibrated, and an exact volume of
gas is injected into the GC through a special injection valve. The system
descritJed nere was modified and built by F. Goff from a functioning system
designed by A. H. Truesdell, U.S. Geological Survey, Menlo Park, California
(see Figs. 4 and 5).
1. Valves. There are three intake valves on the far left of the system
shown in Fig. 5. One valve (A) allows the gas sample to enter the system.
The sample bottle is attacned below this valve by using a rubber hose that
fits snugly around the stem of the bottle. Air or additional standards are
8

Fig. o.
Fig. 4. The injection system.
\---- Carrier Gas, In
Carrier Gas and Sample, Out to GC
A, B, C, D, E, F, G: Values described in text H: Piston cylinder I: Coiled tubing can be immersed in dewar of dry ice·ethanol J: Rough pressure gauge to protect system from overpressure K: Precise pressure gauge, 0 to 30 psi absolute L: Valco 6·port gas injection valve with 1·cm3 coiled loop
Schematic diagram of the gas injection system: enter at the 1 eft, are pressure-adjusted in injected into the GC on the right.
samples or standards the center, and are
9

admitted into the system as standards through this valve. Valve B allows a
CO2 standard to enter the system. Valve C allows the mixed standard to
enter the system.
There are two other valves (0 and E) in Fig. 5 which control access to
the vacuum pump. These valves are always left closed if a sample that you
wish to analyze is in the system. Before running the next sample or standard,
these valves are opened, as well as two additional valves, F and G, described
below, so that the vacuum pump will purge all existing gas from the system
before you introduce a new gas sample. The system is ready for a new sample
when the large pressure gauge (K) reads 0 psia.
Two valves that control the pressure of the gas (F and G, Fig. 5) are
located in the center of the injection system. When both valves are closed,
gas will not enter the pressure-regulating part of the injection system; gas
will be trapped to the left of knob F. Opening the left valve allows gas to
enter the section of the system containing the large pressure gauge and the
piston cylinder. Opening the right valve (G) allows gas to pass into the
right (injection) part of the system. The gas is removed from this section
and injected into the GC for analysis.
2. Pisto~~~~er (H, Fig. 5). The piston cylinder is used to
precisely adjust pressure in the injection system. Turning the crank on the
piston cylinder counterclockwise (out) decreases the pressure in the system,
while turning it clockwise (in) increases the pressure. By thoughtful use of
the piston cylinder and valves, the pressure of sample and standard gases can
be varied as necessary, and sample gas pressures can be increased well above
their original collection pressure. For example, when keeping the left center
knob closed (F, Fig. 5), a clockwise turning of the crank increases the
pressure from this valve toward the right. If both center valves are closed,
clockwise turning of the crank increases the pressure in the center section of
the system--the part containing the large press~re ~auge.
Before each run, the fcrar:lkijs tllllf1T!led ~!'I 1Jtqe 'C'(!)'Unterclockwise direction as
far as it will go. Most SiaII1I!l]es ifrrom fumaroles, springs, and gas seeps need
to be pressurized to get (gl!l~1I analytical results; therefore, the crcank'Shaft
should extend outward as 'far as possible in order to allow 'for nla'X'imum
compression of each sample.
10

C. The Detector
The
GC.
, " ':":- ,,1 ON-dFF switch for the detector is located in a small DOX on top of
The dete~tormust be turned on only after the carrier gas is turned , '. ' J •
the
on and a flow is established t~rough the columns. The detector requires a
half-hour warm-up period before use. The method for checking and adjusting
flow is described below.
D. The printer/KeYboard'
The parameters needed tocontrq 1 the GC operati on, stri.pc~art .recorder,
and data integration are entered and deleted by. pressingc,ertain key
combi nat ions. To enter par.ameters, press the funct ion key, th.e numeri cal . .' .' ! .' " ' ~' , .
value desired, and ,then the enter key.
Exampl e: TEMP 1 200 ENTER
If you wish to omit a command, punch out.the full command. then press the , ' . ' , ' " , .
delete key.
Exampl e: TEMP 1 200 DELETE
To pri nt an enteredpa(,ameter value, press ,the Hst key.fo 11 owed by the
parameter key.
Example: LIST -. TEMP. 1
To 1 ist all entered parameter~~ press the list key twice in succession.
Before starting to run gas through the GC, always ,check to see if the
stripchart base 1 ine . is stable and .propt;rly located. Press STGCDNL
, START .....
ZERO, CHT to st~rt the printer. Once you see where the base 1 iriels
locatea,adjust the pen position so, that it lines up, with the small black line
on the printer glass. The base line is adjusted with the knobs labeled
"coarse" and "fine," which are located in the same box as the detector ON-OFF
switch (Section D, above). When the base line is properly located,. press STOP CHART"
The red 1 i ghts on the
operational mode of the GC.
right side of tre printer indicate the current
When, th~ rep. 1 ightison .in the READY positiori,
11

the GC is ready to run a sample. If the gas sample is already loaded into the
injection system, press ~~~RT to begin analysis of the gas.
If you wish to termlnate a run before its completion or if you make some
type of mistake, press the ESCA~~ key and begin functions anew.
E. Operational Gases
Several additional gas tanks having appropriate valves and hardware are
required to make the GC operational. Large cyl inders of pure He and Ar with
filters attached to their respective gas regulators provide carrier gases to
the analytical system at 60 pSi. A second large cylinder of Ar provides gas
at 60 psi to actuate various mechanisms inside the GC and injection system.
A dewar of liquid N2 must be filled each day to provide coolant for the GC
during temperature-ramping analyses or during analyses that must be performed
cold. The liquid N2 is introduced into the GC at 8 to 10 psi using
compressed air.
Carrier Gases. The carrier gases He and Ar flow through copper tubing
that is attached to the back of the GC. The copper tubing should be
identified with either an Ar or an He label. Once the appropriate carrier gas
is attached, pressurize the system and check the connections for leaks with
"snoop" (a soapy mixture). If bubbles form around the connections, then there
is a leak. Tighten the nuts and check with "snoop" until the leak has been
eliminated. If no bubbles form, there is no leak. Be careful not to
overti ghten the nuts.
Once the carr ier gas is attached and turned on, the flow mus t be
adjusted. On the right-hand side of the GC on the top are two knobs labeled
A and B. The flow of the carr ier gas through each column, A and B, is
adjusted by turning these knobs and subsequently checking the flows by
pressing LIST ~ and LIST ~ on the keyboard. To increase the flow, turn the
knob counterclockwise. To decrease the flow, turn clockwise. Continue
adjusting and checking the flows until the flow through Column A equals the
flow through Column B.
F. Changin~_~~l~~~
Before changing the columns inside the insulated compartment of the GC,
be sure to turn off the de1:.e_ctor. The two columns should be labeled A and
B. B is attached to the back connections in this compartment, and A is
12

attached to the front connections using wrenches. The ends of each column should be engraved with either the letter I (injection side) or the letter D
(detection side). Attach the I side on the left and the D side on the
right. Tighten the connections with wrenches, pressurize the system, and
check for leaks with "snoop."
IV. PROCEDURE FOR GAS ANALYSIS
A. Run 1 - Molecular Sieve with Helium - Detection of O2, Ar, N2, and CH4
The col umns must be "baked out" (heated) overni ght at 290·C to cl eanse the
columns of any adsorbed gas impurities present. The procedure for baking out foll ows.
1. With the detector off, attach the Molecular Sieve columns inside the
GC.
2. Turn GC to ON in back and to OPERATE in the front.
3. Adjust the flow rate of carr i er gas, He, so that the flow through
Columns A and B equals 30.
4. Set the starting temperature to 295·C; press TEMP 1 295 ENTER.
5. Set the injection temperature to 100·C; press i~~;-lOO ENT~~ 6. Set the thermal conductivity detector t0250·C; press i~~p
250 ENTER.
7. Set the oven maximum to 300·C; press ~X~N 300 ENTER
8. Let the columns bake out overnight.
9. When you arrive the following morning, check the flow rates and
adjust them unt i 1 they equal 30. When the flows are equal, turn on
the detector to let it warm up (approximately 1/2 hour).
10. Enter each of the parameters for Run 1 found in Table I followed by
ENTER .
11. Fill the liquid nitrogen tank.
12. Check flows again to make sure they equal 30.
13. Check the location of the b<:sf ine and adjust, if necessary.
When the GC is ready, the following sequence is carried out to run a sample (see Figs. 3, 4, and 5):
13

14. Open the' two lever valves connecting' the vacuum pump to the gas
injection system and evacuate (thi s' can b~ done. after. Step 8i n'the
previous list) •
. 15. Open the two center knob val ves;
16. After the system is completely evacuated and the pressure gauge reads
o psia, close the two lever valves.
17. Release the sample or standard into the ~ystem with the proper valve
and stopcock •.
18. Close the left knob valve (~) and pressurize the si\mple or standard
wi th the cran.k on the pi stan cyl i nder (the. pressures uS.ed can vary,
dependi ng on the pressure and va 1 ume of the samples to be analyzed';
8 to 12 psia is commonly used by the authors).
19. Close the right knob valve (G).
20. When the red 1 i ght near READY on the keyboard 1 i ghts up, press the STAAT key RUN .
21. After you hear the val ve on the small cyl inder open and clpse, open
the right rear lever valve (E) to let the vacuum pump evacuate that
part of the system.
To repeat the run wjththe same gas:
22. Close the right rear lever valve (E, Figs. 4 and 5).
23. Open the right knob valve (G, Figs. 4 and 5).
24. Repressurize gas with crank.
25. Close right knob valve. . STAAT
26. Press RUN. when .GC is ready.
Note: Kunni n9Your standards twi ce at two different pressures is mandatory
to ensure that you have satisfactory data for the computations in Section.V.
Before running the next gas or standard, open the two center knob valves
and the right rear (E, Figs. 4 and 5) and left front (D, Figs. 4 and 5) lever
valves to evacuate the system. If you plan to run a sample, attach the bottle
to the rubber tubing and open the lever valve directly above it (make sure the
stopcock on the sample bottle is closed). When the entire system is
evacuated, repeat the outlined procedure with successive gases.
14
B. Run
1. Z. 3. 4. 5. 6. 7. 8. 9.
10. 11.
lZ. 13. 14.
15.
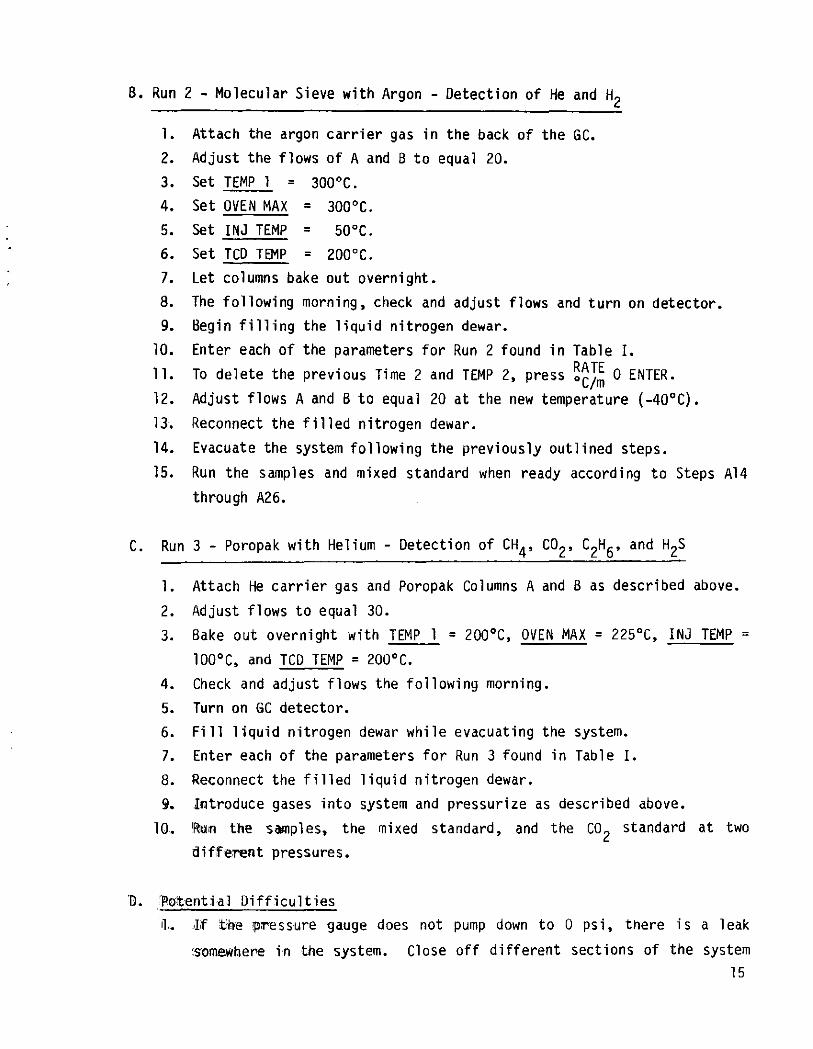
Z - Molecular Sieve with Argon - Detection of He and HZ
Attach the argon carrier gas in the back of the GC. Adjust the flows of A and B to equal 20. Set TEMP 1 = 300°C. Set OVEN MAX = 300°C. Set INJ TEMP = 50°C. Set TCD TEMP = 200°C. Let columns bake out overnight.
The following morning, check and adjust flows and turn on detector. Begin filling the liquid nitrogen dewar. Enter each of the parameters for Run Z found in Table I.
To delete the previous Time 2 and TEMP 2, press ~~J~ 0 ENTER. Adjust flows A and B to equal ZO at the new temperature (-40°C). Reconnect the filled nitrogen dewar. Evacuate the system following the previously outlined steps.
Run the samples and mixed standard when ready according to Steps A14 through AZ6.
C. Run 3 - Poropak with Helium - Detection of CH4, COZ' C2H6, and H2S
1. Attach He carrier gas and Poropak Columns A and B as described above.
Z. Adjust flows to equal 30. 3. Bake out overnight with TEMP 1 = ZOO°C, OVEN MAX = ZZSoc, INJ TEMP =
100°C, and TCD TEMP = 200°C. 4. Check and adjust flows the following morning. 5. Turn on GC detector. 6. Fill liquid nitrogen dewar while evacuating the system. 7. Enter each of the parameters for Run 3 found in Table I. B. Reconnect the filled liquid nitrogen dewar. 9. Introduce gases into system and pressurize as described above.
10. lfttiln the samples, the mixed standard, and the COZ standard at two different pressures.
'1'). :Peitential Difficulties ll~ ,If titre rpl:ressure gauge does not pump down to 0 ps i, there is a 1 eak
:S'emewhere in the system. Close off different sections of the system 15
16
with the various valves to see which sections do pump down to ° psi.
Once you have isolated the leaky section, pressurize the system, check
each junction and connection for leaks with "snoop," and fix the leak.
2. If air is in the CO 2 line, an early peak will occur at approxi
mately 1.6 minutes when running the CO2
standard through the
Poropak setup. With the vacuum pump on, let a small volume of CO 2 flow through the system for about 1 minute to flush out air.
3. If air is in your sample, you will see a peak after Ar at about 5.4
minutes when using the hel ium-Molecular Sieve setup.
for leaks. Try tightening a clamp around the hose that
First, check
fits over the
sample bottle stem. See if the system pumps down to O. Finally, run
air through the system as a standard. Use this air analysis to
remove the effects of air contamination from the samples.
4. If water has entered the sample bottle, it will be detected as a peak
at about 14 minutes when us ing the hel ium-Poropak setup. Make a
mixture of ethanol and dry ice in an insulated container (dewar).
Place the ethanol/dry ice mixture around the coil of tubing (I, Figs.
4 and 5). When you let gases into the system, water will be frozen
out of the gas in this section of tubing. Before running a different
sample, heat the coil with a blow dryer and evacuate the system to
° psi using the vacuum pump. Sometimes the ethanol and dry ice
freeze out H2
S also; therefore, be careful to avoid this problem,
if possible.
5. When using the argon-Molecular Sieve setup, you may get a very shaky
base line. First, try heating the system to 250°C for 1/2 to 1
hour. If heating does not help, you will have to adjust the flows
through A and B manually using a bubble manometer so that they are
equa 1 .
6. If a sample is run and
detectable in the gas,
properly into the GC.
a straight line results, there may be nothing
or it may be that the gas was not injected
Reintroduce gas to the right half of the
injection system and repeat the run. Notice if the gas injection
valve opens and closes (L, Fig. 5). If the valve does not open and
close, be sure that the VLV/EXT commands have been entered. If a
straight 1 ine is sti 11 the result of a run, check to see that the

detector is on and run the sample at a higher pressure. Check to see
that the detector is working by running a standard through the GC.
7. After pressing START CHART, the base line should be vertically
straight. If the base 1 ine slopes, repeatedly and slowly adjust the
position with the fine and coarse knobs. If this procedure fails to
stabil ize the base 1 ine, decrease the slope sensitivity. Do not
decrease the slope sensitivity after running the standards or samples
unless you plan to run the standard or samples a second time using
the new slope sensitivity.
8. When running a standard, if significantly different retention times
result between runs on different days, the flow rates must not be the
same. The flows may not be what the GC indicates that they are. It
is not imperative that the retention times be the same on subsequent
days. However, if you wi sh the flows to be equal to those used on
previous days, adjust the flows manually with a flow meter or bubble
manometer.
9. Many other problems may be encountered during operation of a GC. If
the above 1 ist does not help solve your problem, consult a trouble
shooter's guide written for your GC or.contact your repairperson.
V. COMPUTATIONS
The purpose of performing the following calculations is to determine the
"true" volume percent of each of the gas cons tituents. The GC response
(integrated area or counts) has a nearly linear relationship with pressure.
The slope of the line between the two pressures at which the gas stan
dard was run must be determined. The y-intercept of the line, corre
sponding to the integrated area intersecting the y-axis, must also be
determined to correct the obtained responses to true percents. The slope and
y-intercept must be computed for each gas constituent, H2, He, Ar, N2,
CO2
, CH4
, and H2S, using the data obtained by running the standard through
the GC. Each gas will have a different slope and y-intercept. Use the
tabulated slopes and intercepts calculated from the standard data to correct
your sample gases to their true percent compositions. Values used in the
following equations are in reference to the standard. The slope of the
standard line, m, for a single gas component is
17

In Eq.
Yl
Y2
Xl
x2
m =
( 1 )
=
=
=
=
( 1 )
the GC response of the standard, integrated area, obtained at the
lower of the two pressures used to run the standard.
the GC response of the standard obtained at the higher of the two
pressures used to run the standard.
the true volume percent of the particular gas constituent in the
standard.
the absolute pressure used to obtain Y2 divided by the absolute
pressure used to obtain Yl multiplied by the true percent, Xl.
This value may exceed 100%.
The y-intercept
b = Yl - m (xl) , ( 2)
where other symbols retain the same meanings.
To obtain the true volume percent of a particular gas constituent in the
sample (Xi)' we let
y. - b , m
( 3)
where
Yi = the GC response, integrated area, of the particular gas
constituent in the sample. This area must correspond to the same
pressure as the lower pressure used to run the standard. If this
pressure and the pressure used to run the sample are different,
multiply or divide the sample's integrated area by the proportion
of these two pressures, as the case warrants.
Example Calculations
See Figs. A-5 and A-6 for GC data from Men's Bathhouse mudpot,
Valles Caldera, New Mexico.
18

1. Average the He and H responses of the two 8-ps i standard resu1 ts and the
two 4-psi standard results.
He at 8 ps i
6648
6600
13248 -;- 2 = 6624 = Y2(He)
He at 4 psi
3286
3268
6554 -;- 2 = 3277 = Y1(He)
H2 at 8 psi
35920
35630 ---.-71550 -;- 2 = 35775 = Y2(H 2)
H2 at 4 psi
17510
17700
35210 -;- 2 = 17605 = Y1(H2)
2. Calculate the slope and intercept for he1 ium. The true percentage of He
in the standard is 0.80%.
m = (6624 - 3277) = 4183.75 (1.60 - 0.80)
b = 3277 - 4183.75(0.80) = -70
where X2 = 8(O.80L = 1.60 4
3. Calculate the slope and intercept for hydrogen. The true percentage of H2
in the standard is 2.81%.
m = 1l~U~_l7605'- = 6466.9 (5.62 - 2.81)
b = 17605 - 6466.19(2.81) = -565
where X2 = 8(2.81) = 5.62 4
4. Using the data obtained from the mudpot. Men's Bathhouse. Fig. A-6.
calculate the true volume percentage of H2 and He in the sample.
Yi for He = 480
Yi for H2 = 2792
xi(He) = 480_-___ (~70) = 0.131% 4183.75
xi (H2) = 279L~~C~56U = 0.519% 6466.19
19

Hence, there is 0.131% He and 0.519% H2 by volume in the geothermal gas from Men's Bathhouse mudpot.
5. Follow the same procedure as outlined in the example to determine the
percentages of any other gas constituents that may be found in the sample.
Sometimes water may contaminate a sample, and an extra peak will occur on the print-out when using the Poropak column. The extra peak, which occurs
after H2S, must be normalized out before doing the pr"evious calculations. The procedure used to el iminate the effects of water are described by us ing an example for clarification (see Fig. A-7).
1. Add all GC percentages, except the water percentage. Let us assume we
obtain three peaks having the following percentage areas.
0.103% 98.232 0.744 ---
99.079%
2. Divide the previous sum by 100.
99.079% = 0.99079 100
3. Divide one by the value from Step 2 to obtain the normalizing factor.
1 = 1 .0092956 0.99079
4. Multiply the integrated area of each of the remaining constituents by the
factor obtained in Step 3.
20
2826 x 1.0092956 = 2852 2704000 x 1.0092956 = 2729135 20490 x 1.0092956 = 20680

5. Use these corrected (normalized) integrated areas to calculate the true
percentages, us ing the slopes and intercepts cal cul ated from the standard
run on the same day.
ACKNOWLEDGMENTS
The second author wishes to thank Cathy Janik and William Evans of the
U.S. Geological Survey, Menlo Park, California, for teaching him their own
special ized methods of geothermal gas analysis. The Los Alamos system is a
hybrid design of their two vastly different procedures. Jamie N. Gardner
kindly reviewed the manuscript.
REFERENCES
D'Amore, F., and Panichi, C., 1980, "Evaluation of deep temperatures of hydrotherma 1 sys terns by a new gas geothermometer," Geochim. Cosmochim. Acta 44, 549-556.
Evans, W. C., Banks, N. G., and White, L. D., 1981, "Analysis of gas samples from the summit crater," in P. W. Lipman and D. R. Mullineux (eds.), The 1980 Er1Jtions of Mount-S-t. Helens, Washington, US Geol. Surv. Prof. Paper 125 , pp. 221-231.
Fournier, R. 0., 1981, "Application of water geochemistry to geothermal exploration and reservoir engineering," in L. Rybach and L. J. P. Muffler (eds.), Geothermal Systems: Principles-and Case Histories, John Wiley and Sons, New York, pp. 109-143.
Goff, F., and Vuataz, F., 1984, "Hydrogeochemistry of the Qualibou Caldera geothermal system, St. Lucia, West Indies," Trans. Geotherm. Res. Council §.' 377-382.
Goff, F., Gardner, J., Vidale, R., and Charles, R., 1985, "Geochemistry and isotopes of fluids from Sulphur Springs, Valles Caldera, New Mexico." J. Volcano Geotherm. Res. (in press).
Norman, D., and Bernhardt, C., 1981, "Assessment of geothermal reservoirs by analysis of gases in thermal waters," Final Technical report, New Mexico Energy Institute, New Mexico State University, Las Cruces, 130 pp.
Supelco, 1980, "Column selection for gas and light hydrocarbon analysis," Bulletin 786A, Supelco, Inc., Supelco Park, Bellefonte, Pennsylvania, 12 pp.
Thompson, B., 1977, "Fundamentals of gas analysis by gas chromatography," Technical report, Varian Corp., 611 Hansen Way, Palo Alto, California, 94 pp.
21

APPENDIX
GC EXAMPLE PRINT-OUTS
Figures A-l through A-7 are examples of the GC print-outs for each run setup.
~179 2.67
RT AREA AREA" 1.79 3650 4.092 2.67 85540 95.908
Fig. A-l. Example response of the Mol ecul ar Sieve 5A with argon carrier gas using a mixed standard.
~===-- Ar 5.06
__ --------------------'J CO2
21.51
RT AREA AREA" 1.88 672 0.035 5.06 12900 0.671 9.39 94140 4.896
10.46 70040 3.643 21.51 1745000 90.755
Fig. A-2. Example response of the Molecular Sieve 5A with helium carrier gas using a mixed standard.
22

Fig. A-3.
~;;H;2~1;.3;4~~~~~~~~~~~~~=IllC=: N2 1.59 ~ CH4 2.53
_---------------------' CO2 4.61
~===================-- H2S 12.42
RT AREA AREA %
1.34 1941 0.048 1.59 206600 5.096 1.72 35820 0.883 2.53 157100 3.875 4.61 3479000 85.807
12.42 174000 4.292
Example response of the Poropak mixed standard.
QS with hel ium carrier gas
Air 1.61
__ ---------------------' CO2 4.41
RT 1.61 4.41
AREA 4058
5686000
AREA %
0.071 99.929
using a
Fig. A-4. Example response of the Poropak QS with helium using CO2 standard.
23

8 psia
t He 1.14
H2 1.65
RT AREA AREA %
1.14 6648 15.617 1.65 35920 84.383
\ He 1.14
H2 1.65
RT AREA AREA %
1.14 6600 15.629 1.65 35630 84.371
4 psia
FHe 1.14
H2 1.63
RT AREA AREA %
1.14 3286 15.801 1.63 17510 84.199
f== He 1.13 H2 1.63
RT AREA AREA %
1.13 3268 15.586 1.63 17700 84.414
Fig. A-S. Argon with Molecular Sieve SA example response at (from top) 8 pSi, 8 psi, 4 pSi, and 4 psi.
to a mixed standard
24

Fig. A-6.
Men's Bathhouse Mudpot, 8 pSia
~ 1.13 I H2 1.61
RT
1.13 1.61
AREA
480 2792
AREA %
14.670 85.330
Argon with Molecular Sieve 5A example response to a sample (Men's Bathhouse mudpot) at 8 psi.
Air 1.63
~==========================================:=JC02 4S4
H2S 12.65
H2O 14.79
RT AREA AREA %
1.63 2826 0.103 4.84 2704000 98.232
12.65 20490 0.744 14.79 25340 0.921
Fig. A-7. The Poropak QS with helium response to water contamination,
'* u.s. GOVERNMENT PRINTING OFFICE 1965-57&034120109 25