Embed Size (px)
Citation preview
Collecting DataCloud InsightsNetAppJanuary 27, 2022
This PDF was generated from https://docs.netapp.com/us-en/cloudinsights/task_getting_started_with_cloud_insights.html on January 27, 2022. Always checkdocs.netapp.com for the latest.
Table of Contents
Collecting Data . . . . . . . . . . . . . . . . . . . . . . . . . . . . . . . . . . . . . . . . . . . . . . . . . . . . . . . . . . . . . . . . . . . . . . . . . . . 1
Getting started gathering data . . . . . . . . . . . . . . . . . . . . . . . . . . . . . . . . . . . . . . . . . . . . . . . . . . . . . . . . . . . . . 1
Acquisition Unit Requirements . . . . . . . . . . . . . . . . . . . . . . . . . . . . . . . . . . . . . . . . . . . . . . . . . . . . . . . . . . . . . 3
Configuring Acquisition Units . . . . . . . . . . . . . . . . . . . . . . . . . . . . . . . . . . . . . . . . . . . . . . . . . . . . . . . . . . . . . . 4
Configuring an Agent to Collect Data . . . . . . . . . . . . . . . . . . . . . . . . . . . . . . . . . . . . . . . . . . . . . . . . . . . . . . . 11
Configuring Data Collectors . . . . . . . . . . . . . . . . . . . . . . . . . . . . . . . . . . . . . . . . . . . . . . . . . . . . . . . . . . . . . . 35
Determining data collector acquisition status. . . . . . . . . . . . . . . . . . . . . . . . . . . . . . . . . . . . . . . . . . . . . . . . . 36
Managing configured data collectors . . . . . . . . . . . . . . . . . . . . . . . . . . . . . . . . . . . . . . . . . . . . . . . . . . . . . . . 37
Researching a failed data collector . . . . . . . . . . . . . . . . . . . . . . . . . . . . . . . . . . . . . . . . . . . . . . . . . . . . . . . . 39
Collecting Data
Getting started gathering data
After you have signed up for Cloud Insights and log in to your environment for the first time, you will be guided
through the following steps in order to begin collecting and managing data.
Data collectors discover information from your data sources, such as storage devices, network switches, and
virtual machines. The information gathered is used for analysis, validation, monitoring and troubleshooting.
Cloud Insights utilizes three types of data collectors:
• Operating Systems
• Services
• Infrastructure
Select your first data collector from the supported vendors and models available. You can easily add additional
data collectors later.
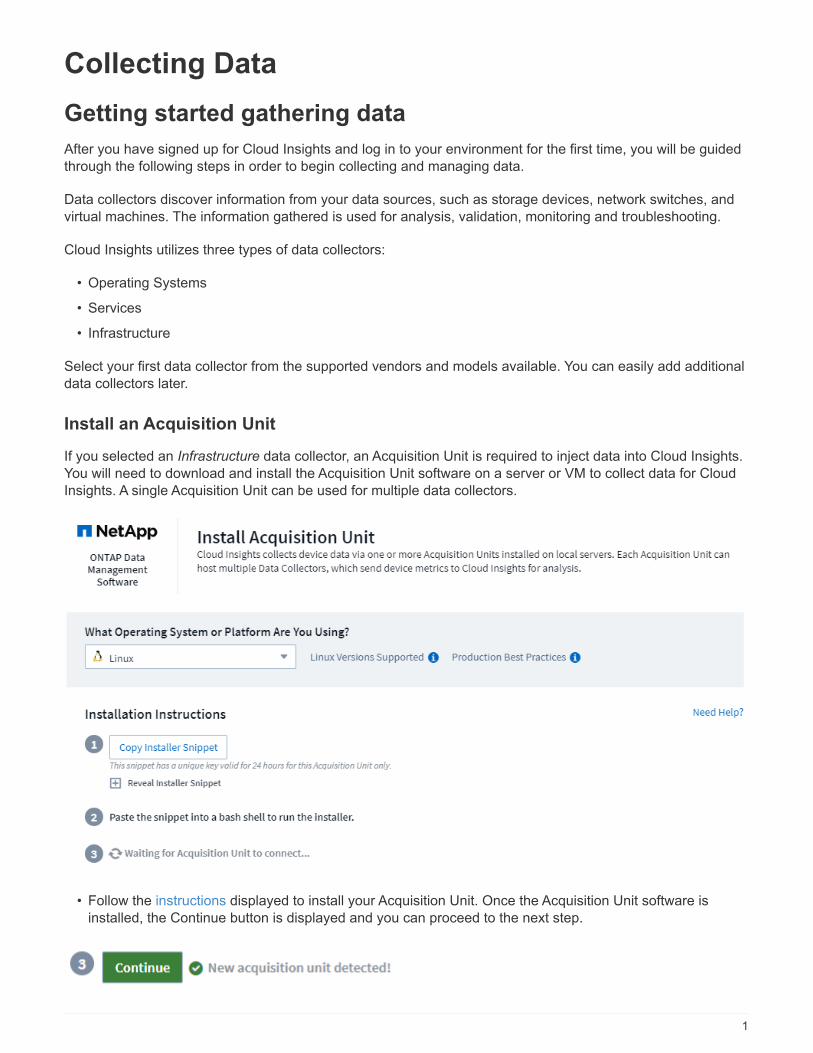
Install an Acquisition Unit
If you selected an Infrastructure data collector, an Acquisition Unit is required to inject data into Cloud Insights.
You will need to download and install the Acquisition Unit software on a server or VM to collect data for Cloud
Insights. A single Acquisition Unit can be used for multiple data collectors.
• Follow the instructions displayed to install your Acquisition Unit. Once the Acquisition Unit software is
installed, the Continue button is displayed and you can proceed to the next step.
1
You may set up additional acquisition units later if needed. For example, you may want different Acquisition
Units collecting information from data centers in different regions.
Configure the Data Collector - Infrastructure
For Infrastructure data collectors, you will be asked to fill out the data collector fields presented:
• Give the data collector a unique and meaningful name.
• Enter the user name and password to connect to the device, as appropriate.
• Fill in any other mandatory fields in Configuration and Advanced Configuration sections.
• Click Test Connection to test the connection to the device.
• Click Add Collector to save the data collector.
You will be able to configure additional data collectors later.
Configure the Data Collector - Operating Systems and Services
Operating System:
For Operating System data collectors, choose a platform (MacOS, Linux, Windows) to install a Cloud Insights
Agent.
You must have at least one agent to collect data from Services.
The agent also collects data from the host itself, for use in Cloud Insights. This data is categorized as "Node"
data in widgets, etc.
• Open a terminal or command window on the agent host or VM, and paste the displayed command to install
the agent.
• When installation is complete, click Complete Setup.
Services:
For Service data collectors, click on a tile to open the instructions page for that service.
• Choose a platform and an Agent Access Key.
• If you don’t have an agent installed on that platform, follow the instructions to install the agent.
• Click Continue to open the data collector instruction page.
• Follow the instructions to configure the data collector.
• When configuration is complete, click Complete Setup.
Add Dashboards
Depending on the type of initial data collector you selected to configure (storage, switch, etc.), one or more
relevant dashboards will be imported. For example, if you configured a storage data collector, a set of storage-
related dashboards will be imported, and one will be set as your Cloud Insights Home Page. You can change
the home page from the Dashboards > Show All Dashboards list.
You can import additional dashboards later, or create your own.
2
That’s all there is to it
After you complete the initial setup process, your environment will begin to collect data.
If your initial setup process is interrupted (for example, if you close the browser window), you will need to follow
the steps manually:
• Choose a Data Collector
• Install an Agent or Acquisition Unit if prompted
• Configure the Data Collector
Acquisition Unit Requirements
You must install an Acquisition Unit (AU) in order to acquire information from your
infrastructure data collectors (storage, VM, port, EC2, etc.). Before you install the
Acquisition Unit, you should ensure that your environment meets operating system, CPU,
memory, and disk space requirements.
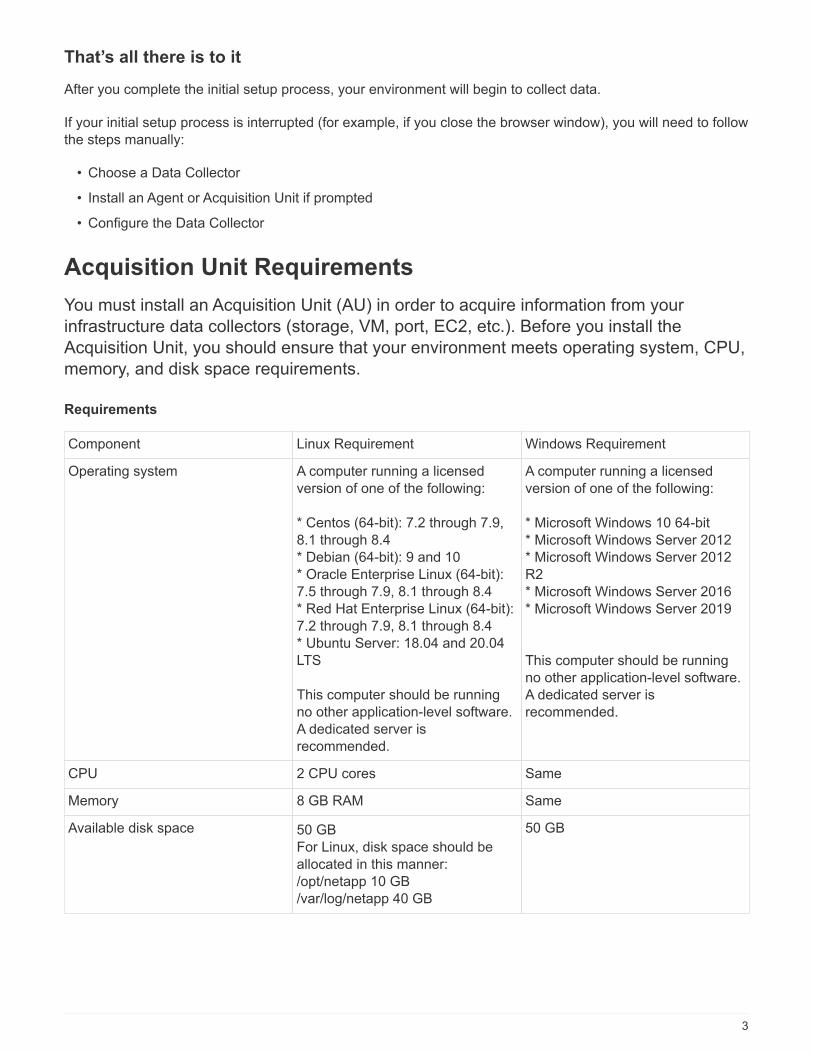
Requirements
Component Linux Requirement Windows Requirement
Operating system A computer running a licensed
version of one of the following:
* Centos (64-bit): 7.2 through 7.9,
8.1 through 8.4
* Debian (64-bit): 9 and 10
* Oracle Enterprise Linux (64-bit):
7.5 through 7.9, 8.1 through 8.4
* Red Hat Enterprise Linux (64-bit):
7.2 through 7.9, 8.1 through 8.4
* Ubuntu Server: 18.04 and 20.04
LTS
This computer should be running
no other application-level software.
A dedicated server is
recommended.
A computer running a licensed
version of one of the following:
* Microsoft Windows 10 64-bit
* Microsoft Windows Server 2012
* Microsoft Windows Server 2012
R2
* Microsoft Windows Server 2016
* Microsoft Windows Server 2019
This computer should be running
no other application-level software.
A dedicated server is
recommended.
CPU 2 CPU cores Same
Memory 8 GB RAM Same
Available disk space 50 GB
For Linux, disk space should be
allocated in this manner:
/opt/netapp 10 GB
/var/log/netapp 40 GB
50 GB
3
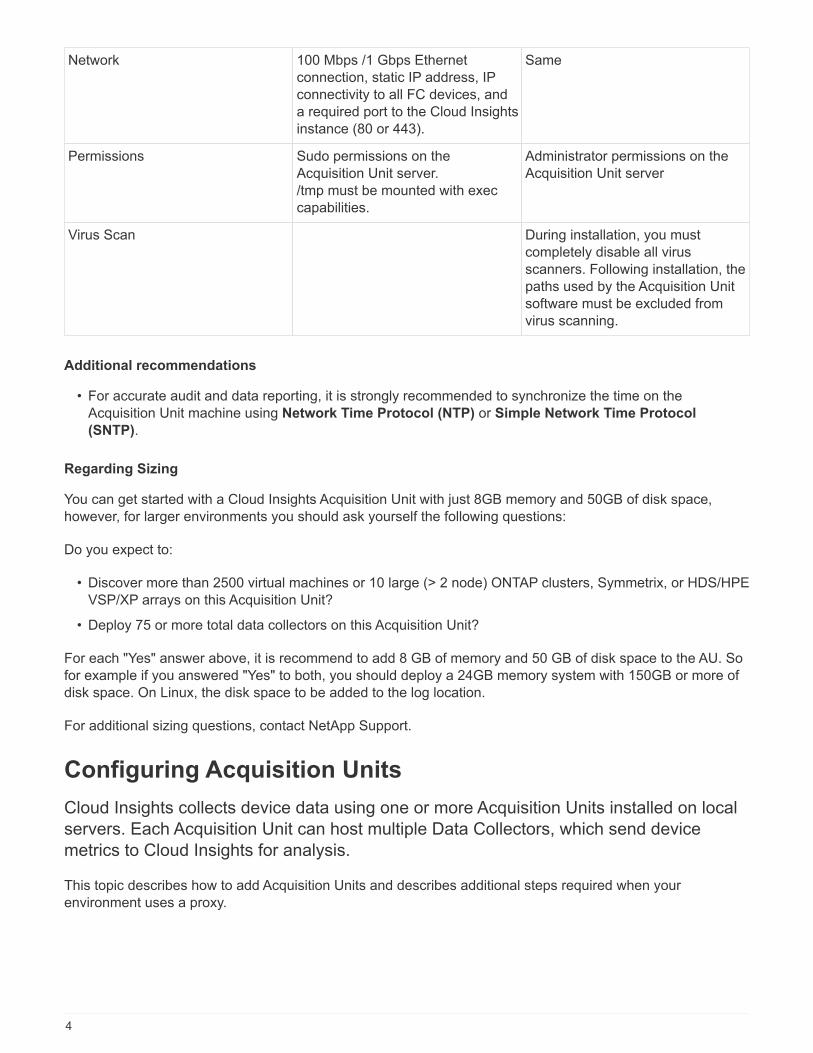
Network 100 Mbps /1 Gbps Ethernet
connection, static IP address, IP
connectivity to all FC devices, and
a required port to the Cloud Insights
instance (80 or 443).
Same
Permissions Sudo permissions on the
Acquisition Unit server.
/tmp must be mounted with exec
capabilities.
Administrator permissions on the
Acquisition Unit server
Virus Scan During installation, you must
completely disable all virus
scanners. Following installation, the
paths used by the Acquisition Unit
software must be excluded from
virus scanning.
Additional recommendations
• For accurate audit and data reporting, it is strongly recommended to synchronize the time on the
Acquisition Unit machine using Network Time Protocol (NTP) or Simple Network Time Protocol
(SNTP).
Regarding Sizing
You can get started with a Cloud Insights Acquisition Unit with just 8GB memory and 50GB of disk space,
however, for larger environments you should ask yourself the following questions:
Do you expect to:
• Discover more than 2500 virtual machines or 10 large (> 2 node) ONTAP clusters, Symmetrix, or HDS/HPE
VSP/XP arrays on this Acquisition Unit?
• Deploy 75 or more total data collectors on this Acquisition Unit?
For each "Yes" answer above, it is recommend to add 8 GB of memory and 50 GB of disk space to the AU. So
for example if you answered "Yes" to both, you should deploy a 24GB memory system with 150GB or more of
disk space. On Linux, the disk space to be added to the log location.
For additional sizing questions, contact NetApp Support.
Configuring Acquisition Units
Cloud Insights collects device data using one or more Acquisition Units installed on local
servers. Each Acquisition Unit can host multiple Data Collectors, which send device
metrics to Cloud Insights for analysis.
This topic describes how to add Acquisition Units and describes additional steps required when your
environment uses a proxy.
4
For accurate audit and data reporting, it is strongly recommended to synchronize the time on the
Acquisition Unit machine using Network Time Protocol (NTP) or Simple Network Time
Protocol (SNTP).
Adding a Linux Acquisition Unit
Before you begin
• If your system is using a proxy, you must set the proxy environment variables before the acquisition unit is
installed. For more information, see Setting proxy environment variables.
Steps for Linux Acquisition Unit Installation
1. Log in as Administrator or Account Owner to your Cloud Insights environment.
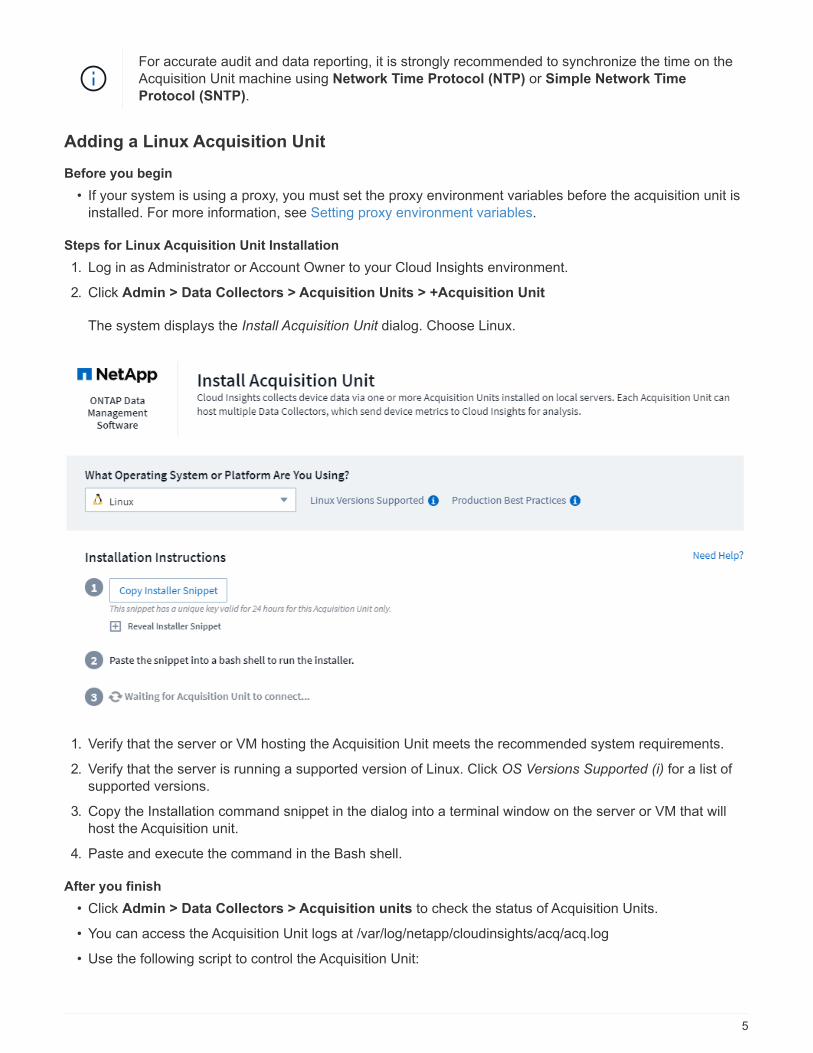
2. Click Admin > Data Collectors > Acquisition Units > +Acquisition Unit
The system displays the Install Acquisition Unit dialog. Choose Linux.
1. Verify that the server or VM hosting the Acquisition Unit meets the recommended system requirements.
2. Verify that the server is running a supported version of Linux. Click OS Versions Supported (i) for a list of
supported versions.
3. Copy the Installation command snippet in the dialog into a terminal window on the server or VM that will
host the Acquisition unit.
4. Paste and execute the command in the Bash shell.
After you finish
• Click Admin > Data Collectors > Acquisition units to check the status of Acquisition Units.
• You can access the Acquisition Unit logs at /var/log/netapp/cloudinsights/acq/acq.log
• Use the following script to control the Acquisition Unit:
5
◦ cloudinsights-service.sh (stop, start, restart, check the status)
• Use the following script to uninstall the Acquisition Unit:
◦ cloudinsights-uninstall.sh
Setting proxy environment variables
For environments that use a proxy, you must set the proxy environment variables before you add the
Acquisition Unit. The instructions for configuring the proxy are provided on the Add Acquisition Unit dialog.
1. Click + in Have a Proxy Server?
2. Copy the commands to a text editor and set your proxy variables as needed.
Note: Be aware of restrictions on special characters in proxy username and password fields: '%' and '!' are
allowed in the username field. ':', '%', and '!' are allowed in the password field.
3. Run the edited command in a terminal using the Bash shell.
4. Install the Acquisition Unit software.
Proxy Configuration
The Acquisition Unit uses 2-way/mutual authentication to connect to the Cloud Insights server. The client
certificate must be passed to the Cloud Insights server to be authenticated. To accomplish this, the proxy must
be set up to forward the https request to the Cloud Insights server without decrypting the data.
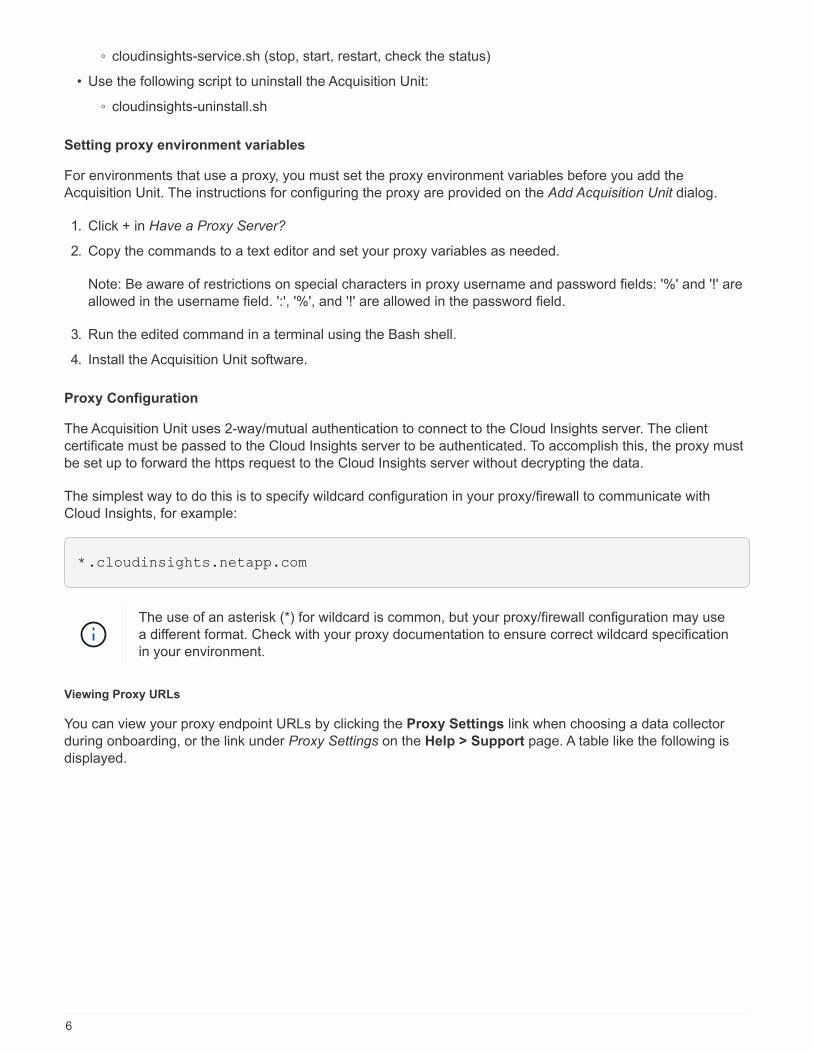
The simplest way to do this is to specify wildcard configuration in your proxy/firewall to communicate with
Cloud Insights, for example:
*.cloudinsights.netapp.com
The use of an asterisk (*) for wildcard is common, but your proxy/firewall configuration may use
a different format. Check with your proxy documentation to ensure correct wildcard specification
in your environment.
Viewing Proxy URLs
You can view your proxy endpoint URLs by clicking the Proxy Settings link when choosing a data collector
during onboarding, or the link under Proxy Settings on the Help > Support page. A table like the following is
displayed.
6
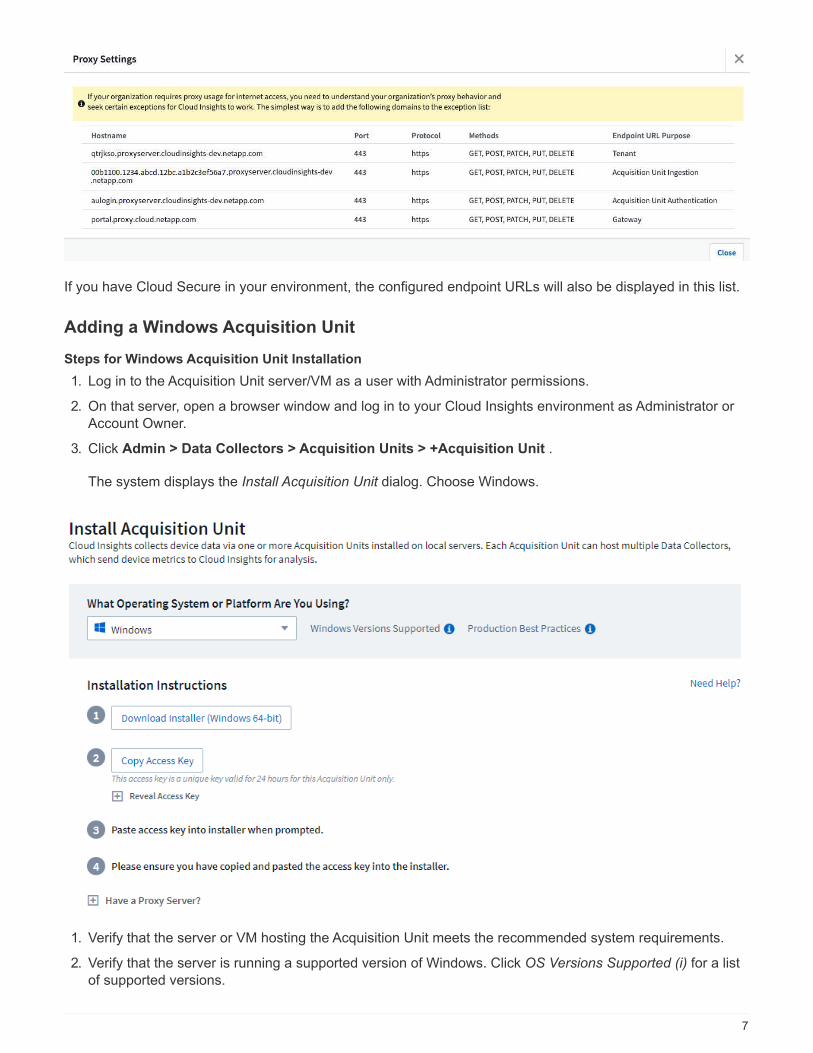
If you have Cloud Secure in your environment, the configured endpoint URLs will also be displayed in this list.
Adding a Windows Acquisition Unit
Steps for Windows Acquisition Unit Installation
1. Log in to the Acquisition Unit server/VM as a user with Administrator permissions.
2. On that server, open a browser window and log in to your Cloud Insights environment as Administrator or
Account Owner.
3. Click Admin > Data Collectors > Acquisition Units > +Acquisition Unit .
The system displays the Install Acquisition Unit dialog. Choose Windows.
1. Verify that the server or VM hosting the Acquisition Unit meets the recommended system requirements.
2. Verify that the server is running a supported version of Windows. Click OS Versions Supported (i) for a list
of supported versions.
7
3. Click the Download Installer (Windows 64-bit) button.
4. Copy the Access Key. You will need this during the Installation.
5. On the Acquisition Unit server/VM, execute the downloaded installer.
6. Paste the Access Key into the installation wizard when prompted.
7. During installation, you will be presented with the opportunity to provide your proxy server settings.
After you finish
• Click Admin > Data Collectors > Acquisition units to check the status of Acquisition Units.
• You can access the Acquisition Unit log in <install dir>\Cloud Insights\Acquisition Unit\log\acq.log
• Use the following script to stop, start, restart, or check the status of the Acquisition Unit:
cloudinsights-service.sh
Proxy Configuration
The Acquisition Unit uses 2-way/mutual authentication to connect to the Cloud Insights server. The client
certificate must be passed to the Cloud Insights server to be authenticated. To accomplish this, the proxy must
be set up to forward the https request to the Cloud Insights server without decrypting the data.
The simplest way to do this is to specify wildcard configuration in your proxy/firewall to communicate with
Cloud Insights, for example:
*.cloudinsights.netapp.com
The use of an asterisk (*) for wildcard is common, but your proxy/firewall configuration may use
a different format. Check with your proxy documentation to ensure correct wildcard specification
in your environment.
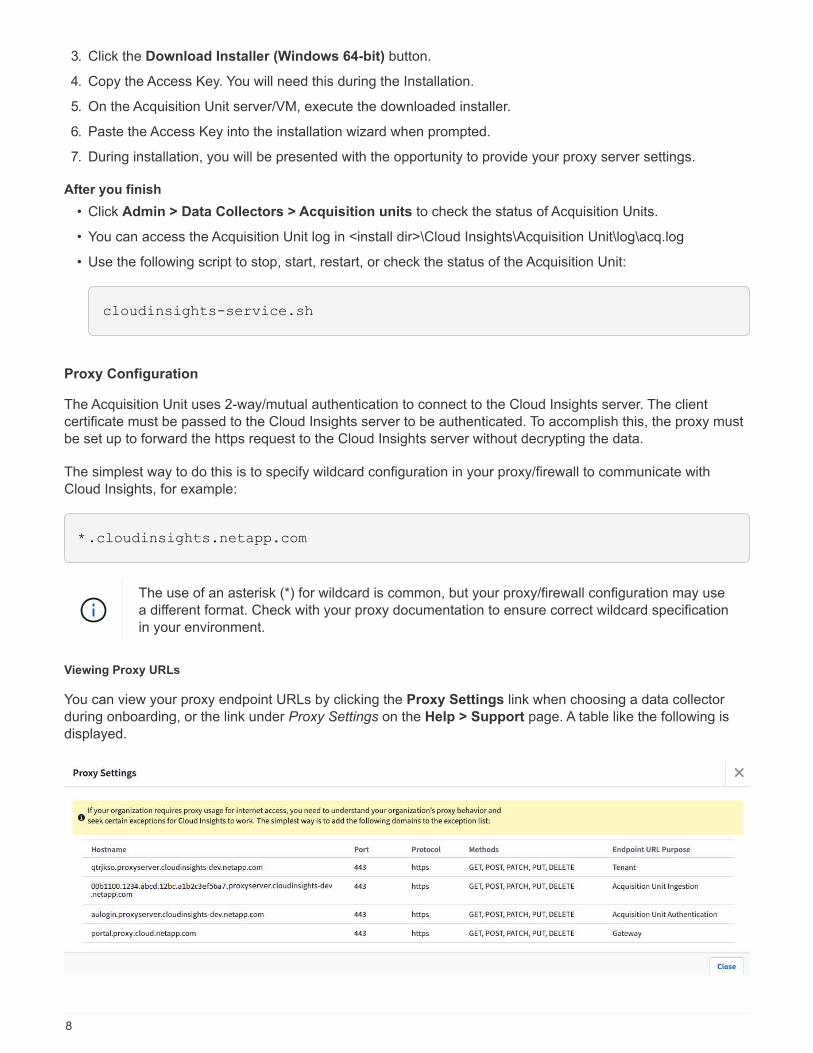
Viewing Proxy URLs
You can view your proxy endpoint URLs by clicking the Proxy Settings link when choosing a data collector
during onboarding, or the link under Proxy Settings on the Help > Support page. A table like the following is
displayed.
8
If you have Cloud Secure in your environment, the configured endpoint URLs will also be displayed in this list.
Uninstalling an Acquisition Unit
To uninstall the Acquisition Unit software, do the following:
Windows:
1. On the Acquisition Unit server/VM, open Control Panel and choose Uninstall a Program. Select the Cloud
Insights Acquisition Unit program for removal.
2. Click Uninstall and follow the prompts.
Linux:
1. On the Acquisition Unit server/VM, run the following command:
sudo cloudinsights-uninstall.sh -p
2. For help with uninstall, run:
sudo cloudinsights-uninstall.sh --help
Both:
1. After uninstalling the AU software, go to Admin > Data Collectors and select the Acquisition Units tab.
2. Click the Options button to the right of the Acquisition Unit you wish to uninstall, and select Delete. You can
delete an Acquisition Unit only if there are no data collectors assigned to it.
NOTE:You cannot delete the default Acquisition Unit. Select another AU as the default before deleting the old
one.
Reinstalling an Acquisition Unit
To re-install an Acquisition Unit on the same server/VM, you must follow these steps:
Before you begin
You must have a temporary Acquisition Unit configured on a separate server/VM before re-installing an
Acquisition Unit.
Steps
1. Log in to the Acquisition Unit server/VM and uninstall the AU software.
2. Log into your Cloud Insights environment and go to Admin > Data Collectors.
3. For each data collector, click the Options menu on the right and select Edit. Assign the data collector to the
temporary Acquisition Unit and click Save.
You can also select multiple data collectors of the same type and click the Bulk Actions button. Choose
Edit and assign the data collectors to the temporary Acquisition Unit.
9
4. After all of the data collectors have been moved to the temporary Acquisition Unit, go to Admin > Data
Collectors and select the Acquisition Units tab.
5. Click the Options button to the right of the Acquisition Unit you wish to re-install, and select Delete. You can
delete an Acquisition Unit only if there are no data collectors assigned to it.
6. You can now re-install the Acquisition Unit software on the original server/VM. Click +Acquisition Unit and
follow the instructions above to install the Acquisition Unit.
7. Once the Acquisition Unit has been re-installed, assign your data collectors back to the Acquisition Unit.
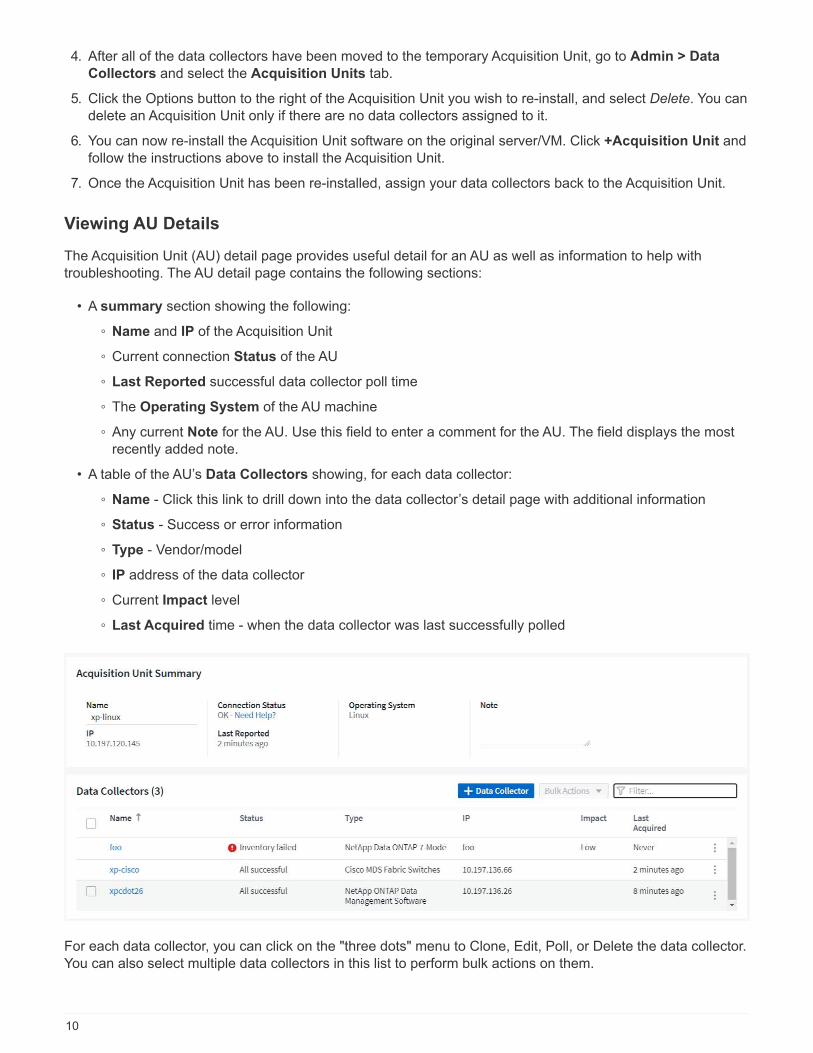
Viewing AU Details
The Acquisition Unit (AU) detail page provides useful detail for an AU as well as information to help with
troubleshooting. The AU detail page contains the following sections:
• A summary section showing the following:
◦ Name and IP of the Acquisition Unit
◦ Current connection Status of the AU
◦ Last Reported successful data collector poll time
◦ The Operating System of the AU machine
◦ Any current Note for the AU. Use this field to enter a comment for the AU. The field displays the most
recently added note.
• A table of the AU’s Data Collectors showing, for each data collector:
◦ Name - Click this link to drill down into the data collector’s detail page with additional information
◦ Status - Success or error information
◦ Type - Vendor/model
◦ IP address of the data collector
◦ Current Impact level
◦ Last Acquired time - when the data collector was last successfully polled
For each data collector, you can click on the "three dots" menu to Clone, Edit, Poll, or Delete the data collector.
You can also select multiple data collectors in this list to perform bulk actions on them.
10
To restart the Acquisition Unit, click the Restart button at the top of the page. Drop down this button to attempt
to Restore Connection to the AU in the event of a connection problem.
Configuring an Agent to Collect Data
Cloud Insights uses Telegraf as its agent for collection of integration data. Telegraf is a
plugin-driven server agent that can be used to collect and report metrics, events, and
logs. Input plugins are used to collect the desired information into the agent by accessing
the system/OS directly, by calling third-party APIs, or by listening to configured streams
(i.e. Kafka, statsD, etc). Output plugins are used to send the collected metrics, events,
and logs from the agent to Cloud Insights.
The current Telegraf version for Cloud Insights is 1.19.3.
For accurate audit and data reporting, it is strongly recommended to synchronize the time on the
Agent machine using Network Time Protocol (NTP) or Simple Network Time Protocol
(SNTP).
If you want to verify the installation files before instaling the Agent, see the section below on
Verifying Checksums.
Installing an Agent
If you are installing a Service data collector and have not yet configured an Agent, you are prompted to first
install an Agent for the appropriate Operating System. This topic provides instructions for installing the Telegraf
agent on the following Operating Systems:
• Windows
• RHEL and CentOS
• Ubuntu and Debian
• macOS
• Kubernetes
To install an agent, regardless of the platform you are using, you must first do the following:
1. Log into the host you will use for your agent.
2. Log in to your Cloud Insights site and go to Admin > Data Collectors.
3. Click on +Data Collector and choose a data collector to install.
1. Choose the appropriate platform for your host (Windows, Linux, macOS, etc.)
2. Follow the remaining steps for each platform.
Once you have installed an agent on a host, you do not need to install an agent again on that
host.
11
Once you have installed an agent on a server/VM, Cloud Insights collects metrics from that
system in addition to collecting from any data collectors you configure. These metrics are
gathered as "Node" metrics.
If you are using a proxy, read the proxy instructions for your platform before installing the
Telegraf agent.
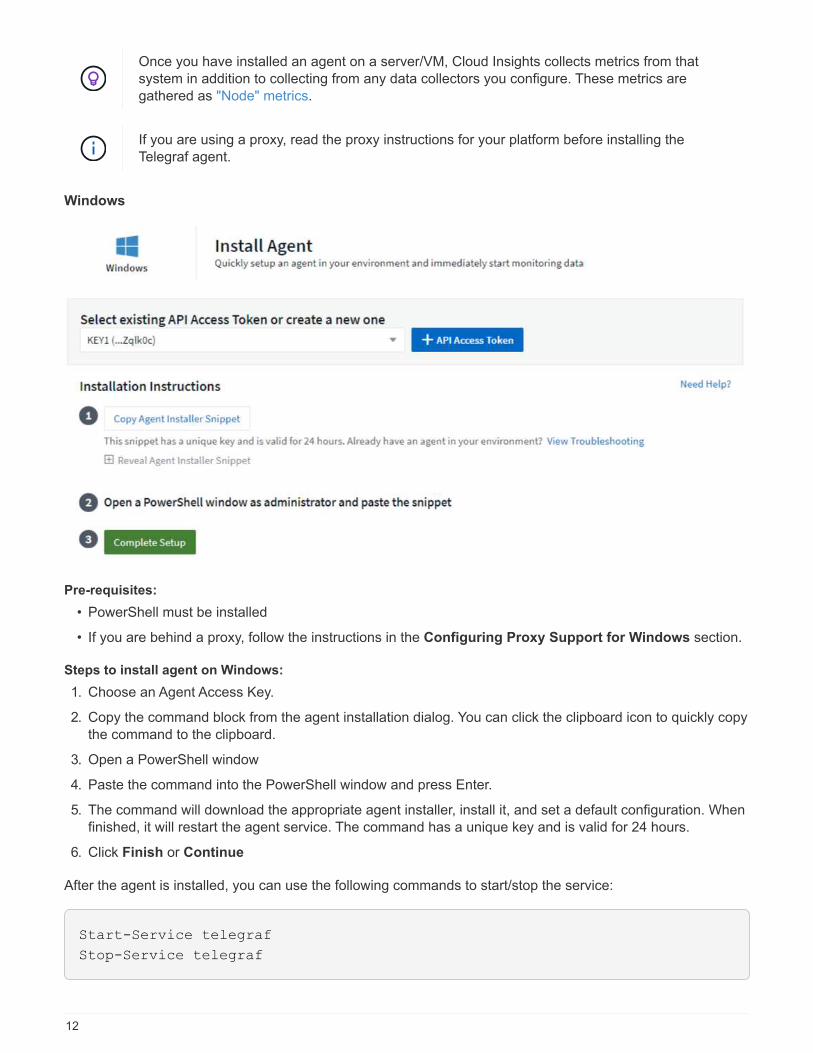
Windows
Pre-requisites:
• PowerShell must be installed
• If you are behind a proxy, follow the instructions in the Configuring Proxy Support for Windows section.
Steps to install agent on Windows:
1. Choose an Agent Access Key.
2. Copy the command block from the agent installation dialog. You can click the clipboard icon to quickly copy
the command to the clipboard.
3. Open a PowerShell window
4. Paste the command into the PowerShell window and press Enter.
5. The command will download the appropriate agent installer, install it, and set a default configuration. When
finished, it will restart the agent service. The command has a unique key and is valid for 24 hours.
6. Click Finish or Continue
After the agent is installed, you can use the following commands to start/stop the service:
Start-Service telegraf
Stop-Service telegraf
12
Configuring Proxy Support for Windows
The steps below outline the actions needed to set the http_proxy/https_proxy environment
variables. For some proxy environments, users may also need to set the no_proxy environment
variable.
For systems residing behind a proxy, perform the following to set the https_proxy and/or http_proxy
environment variable(s) PRIOR to installing the Telegraf agent:
[System.Environment]::SetEnvironmentVariable(“https_proxy”,
“<proxy_server>:<proxy_port>”,
[System.EnvironmentVariableTarget]::Machine)
Uninstalling the Agent
To uninstall the agent on Windows, do the following in a PowerShell window:
1. Stop and delete the Telegraf service:
Stop-Service telegraf
sc.exe delete telegraf
2. Remove the certificate from the trustore:
cd Cert:\CurrentUser\Root
rm E5FB7B68C08B1CA902708584C274F8EFC7BE8ABC
3. Delete the C:\Program Files\telegraf folder to remove the binary, logs, and configuration files
4. Remove the SYSTEM\CurrentControlSet\Services\EventLog\Application\telegraf key from the registry
Upgrading the Agent
To upgrade the telegraf agent, do the following:
1. Stop and delete the telegraf service:
Stop-Service telegraf
sc.exe delete telegraf
2. Delete the SYSTEM\CurrentControlSet\Services\EventLog\Application\telegraf key from the registry
3. Delete C:\Program Files\telegraf\telegraf.conf
4. Delete C:\Program Files\telegraf\telegraf.exe
5. Install the new agent.
13
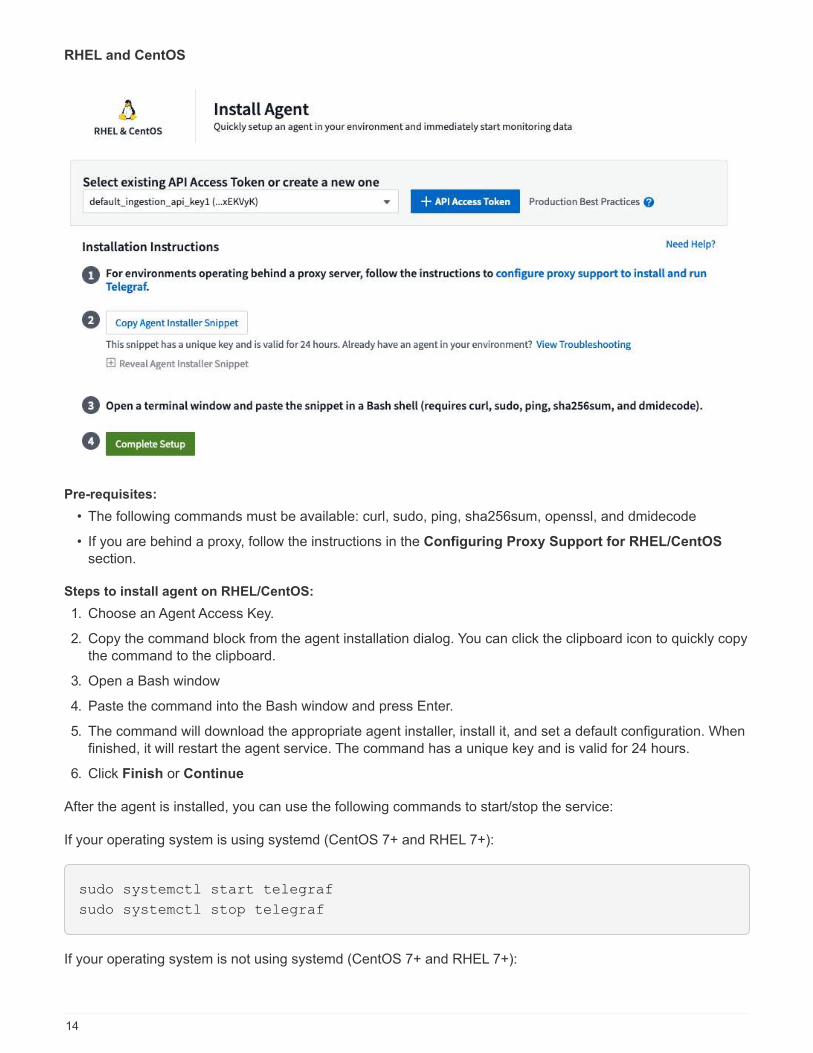
RHEL and CentOS
Pre-requisites:
• The following commands must be available: curl, sudo, ping, sha256sum, openssl, and dmidecode
• If you are behind a proxy, follow the instructions in the Configuring Proxy Support for RHEL/CentOS
section.
Steps to install agent on RHEL/CentOS:
1. Choose an Agent Access Key.
2. Copy the command block from the agent installation dialog. You can click the clipboard icon to quickly copy
the command to the clipboard.
3. Open a Bash window
4. Paste the command into the Bash window and press Enter.
5. The command will download the appropriate agent installer, install it, and set a default configuration. When
finished, it will restart the agent service. The command has a unique key and is valid for 24 hours.
6. Click Finish or Continue
After the agent is installed, you can use the following commands to start/stop the service:
If your operating system is using systemd (CentOS 7+ and RHEL 7+):
sudo systemctl start telegraf
sudo systemctl stop telegraf
If your operating system is not using systemd (CentOS 7+ and RHEL 7+):
14
sudo service telegraf start
sudo service telegraf stop
Configuring Proxy Support for RHEL/CentOS
The steps below outline the actions needed to set the http_proxy/https_proxy environment
variables. For some proxy environments, users may also need to set the no_proxy environment
variable.
For systems residing behind a proxy, perform the following steps PRIOR to installing the Telegraf agent:
1. Set the https_proxy and/or http_proxy environment variable(s) for the current user:
export https_proxy=<proxy_server>:<proxy_port>
2. Create /etc/default/telegraf, and insert definitions for the https_proxy and/or http_proxy variable(s):
https_proxy=<proxy_server>:<proxy_port>
Uninstalling the Agent
To uninstall the agent on RHEL/CentOS, in a Bash terminal, do the following:
1. Stop the Telegraf service:
systemctl stop telegraf (If your operating system is using systemd
(CentOS 7+ and RHEL 7+)
/etc/init.d/telegraf stop (for systems without systemd support)
2. Remove the Telegraf agent:
yum remove telegraf
3. Remove any configuration or log files that may be left behind:
rm -rf /etc/telegraf*
rm -rf /var/log/telegraf*
Upgrading the Agent
To upgrade the telegraf agent, do the following:
15
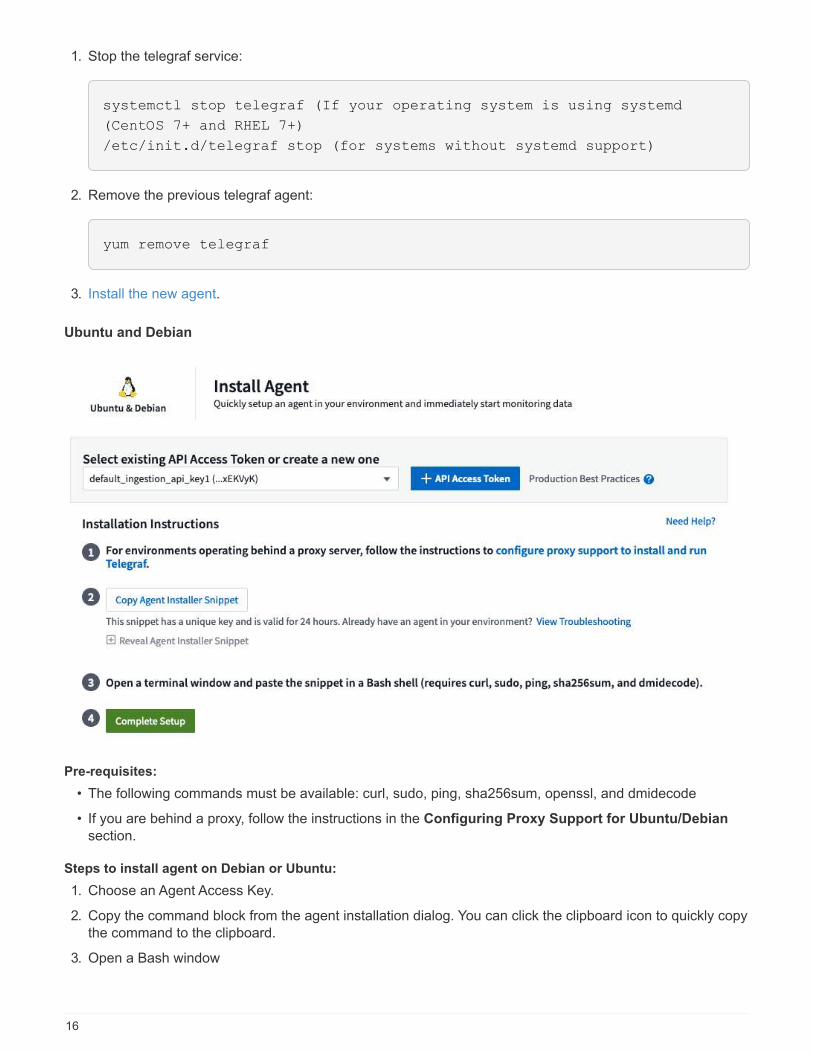
1. Stop the telegraf service:
systemctl stop telegraf (If your operating system is using systemd
(CentOS 7+ and RHEL 7+)
/etc/init.d/telegraf stop (for systems without systemd support)
2. Remove the previous telegraf agent:
yum remove telegraf
3. Install the new agent.
Ubuntu and Debian
Pre-requisites:
• The following commands must be available: curl, sudo, ping, sha256sum, openssl, and dmidecode
• If you are behind a proxy, follow the instructions in the Configuring Proxy Support for Ubuntu/Debian
section.
Steps to install agent on Debian or Ubuntu:
1. Choose an Agent Access Key.
2. Copy the command block from the agent installation dialog. You can click the clipboard icon to quickly copy
the command to the clipboard.
3. Open a Bash window
16
4. Paste the command into the Bash window and press Enter.
5. The command will download the appropriate agent installer, install it, and set a default configuration. When
finished, it will restart the agent service. The command has a unique key and is valid for 24 hours.
6. Click Finish or Continue
After the agent is installed, you can use the following commands to start/stop the service:
If your operating system is using systemd:
sudo systemctl start telegraf
sudo systemctl stop telegraf
If your operating system is not using systemd:
sudo service telegraf start
sudo service telegraf stop
Configuring Proxy Support for Ubuntu/Debian
The steps below outline the actions needed to set the http_proxy/https_proxy environment
variables. For some proxy environments, users may also need to set the no_proxy environment
variable.
For systems residing behind a proxy, perform the following steps PRIOR to installing the Telegraf agent:
1. Set the https_proxy and/or http_proxy environment variable(s) for the current user:
export https_proxy=<proxy_server>:<proxy_port>
2. Create /etc/default/telegraf, and insert definitions for the https_proxy and/or http_proxy variable(s):
https_proxy=<proxy_server>:<proxy_port>
Uninstalling the Agent
To uninstall the agent on Ubuntu/Debian, in a Bash terminal, run the following:
1. Stop the Telegraf service:
systemctl stop telegraf (If your operating system is using systemd)
/etc/init.d/telegraf stop (for systems without systemd support)
2. Remove the Telegraf agent:
17
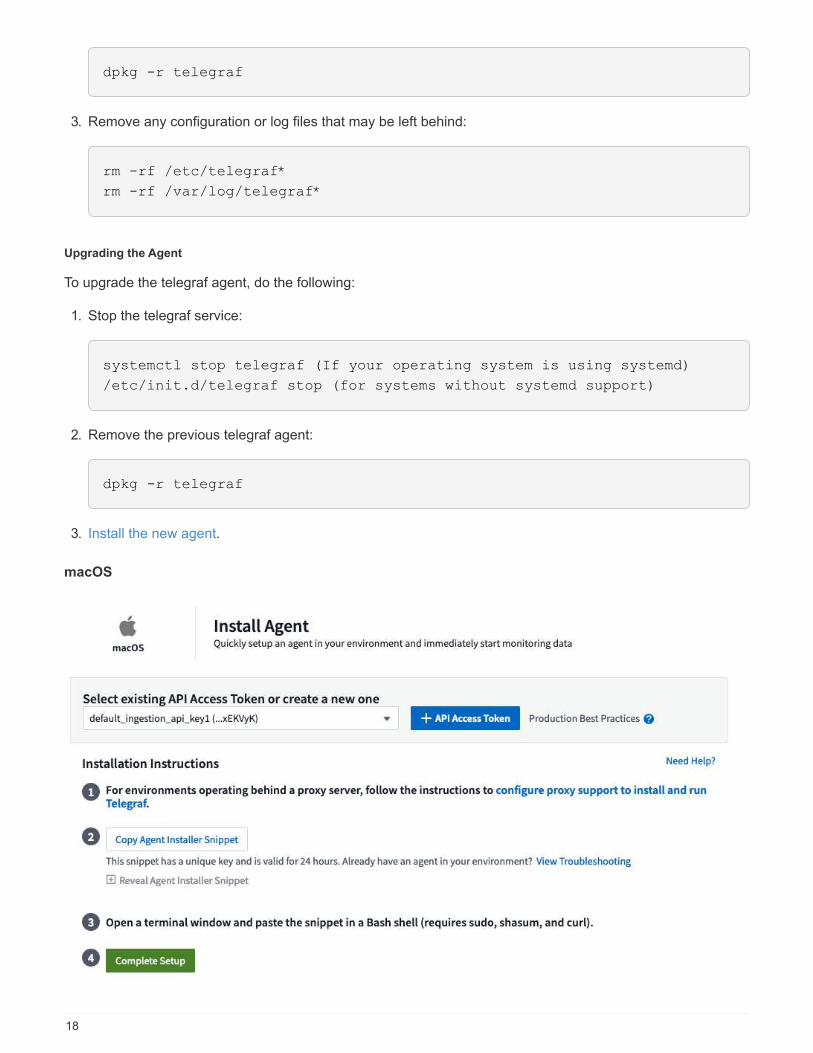
dpkg -r telegraf
3. Remove any configuration or log files that may be left behind:
rm -rf /etc/telegraf*
rm -rf /var/log/telegraf*
Upgrading the Agent
To upgrade the telegraf agent, do the following:
1. Stop the telegraf service:
systemctl stop telegraf (If your operating system is using systemd)
/etc/init.d/telegraf stop (for systems without systemd support)
2. Remove the previous telegraf agent:
dpkg -r telegraf
3. Install the new agent.
macOS
18
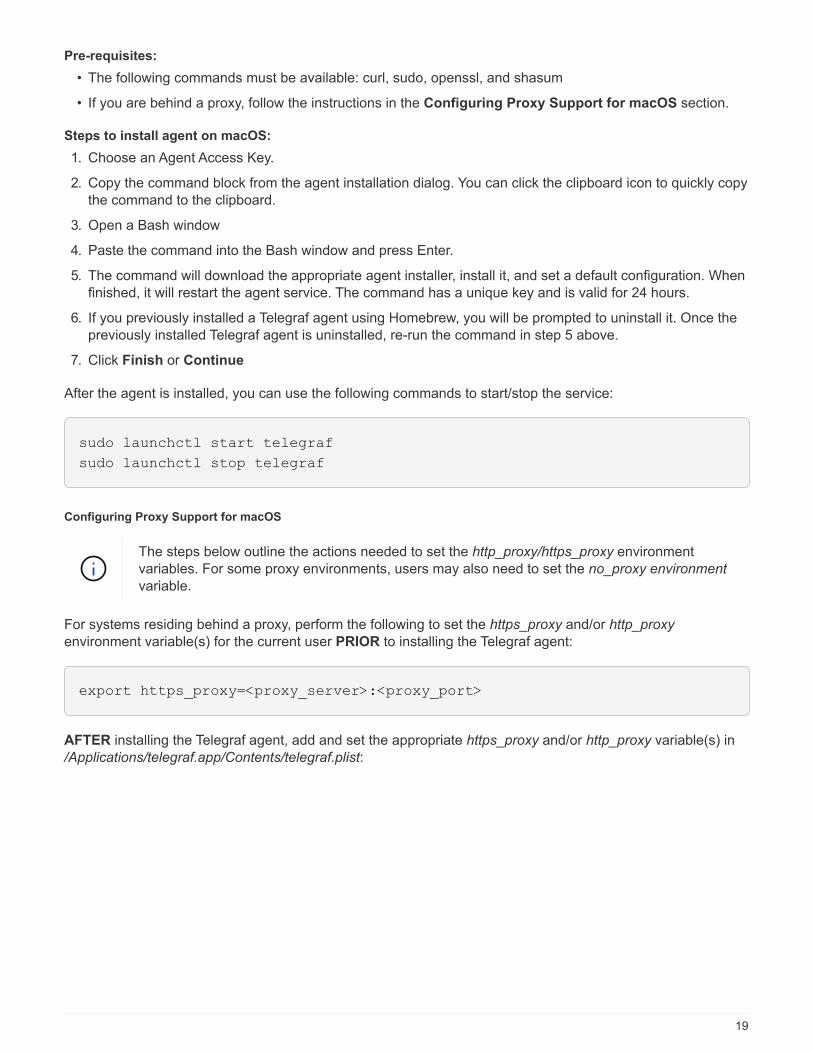
Pre-requisites:
• The following commands must be available: curl, sudo, openssl, and shasum
• If you are behind a proxy, follow the instructions in the Configuring Proxy Support for macOS section.
Steps to install agent on macOS:
1. Choose an Agent Access Key.
2. Copy the command block from the agent installation dialog. You can click the clipboard icon to quickly copy
the command to the clipboard.
3. Open a Bash window
4. Paste the command into the Bash window and press Enter.
5. The command will download the appropriate agent installer, install it, and set a default configuration. When
finished, it will restart the agent service. The command has a unique key and is valid for 24 hours.
6. If you previously installed a Telegraf agent using Homebrew, you will be prompted to uninstall it. Once the
previously installed Telegraf agent is uninstalled, re-run the command in step 5 above.
7. Click Finish or Continue
After the agent is installed, you can use the following commands to start/stop the service:
sudo launchctl start telegraf
sudo launchctl stop telegraf
Configuring Proxy Support for macOS
The steps below outline the actions needed to set the http_proxy/https_proxy environment
variables. For some proxy environments, users may also need to set the no_proxy environment
variable.
For systems residing behind a proxy, perform the following to set the https_proxy and/or http_proxy
environment variable(s) for the current user PRIOR to installing the Telegraf agent:
export https_proxy=<proxy_server>:<proxy_port>
AFTER installing the Telegraf agent, add and set the appropriate https_proxy and/or http_proxy variable(s) in
/Applications/telegraf.app/Contents/telegraf.plist:
19
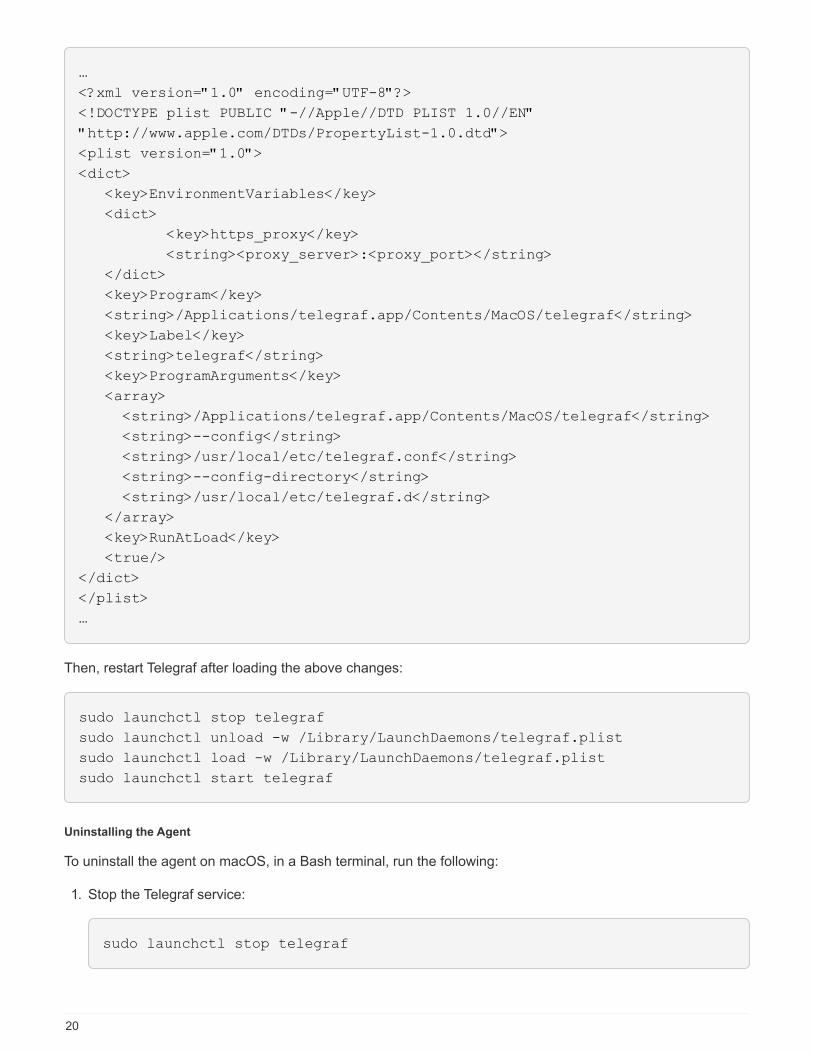
…
<?xml version="1.0" encoding="UTF-8"?>
<!DOCTYPE plist PUBLIC "-//Apple//DTD PLIST 1.0//EN"
"http://www.apple.com/DTDs/PropertyList-1.0.dtd">
<plist version="1.0">
<dict>
<key>EnvironmentVariables</key>
<dict>
<key>https_proxy</key>
<string><proxy_server>:<proxy_port></string>
</dict>
<key>Program</key>
<string>/Applications/telegraf.app/Contents/MacOS/telegraf</string>
<key>Label</key>
<string>telegraf</string>
<key>ProgramArguments</key>
<array>
<string>/Applications/telegraf.app/Contents/MacOS/telegraf</string>
<string>--config</string>
<string>/usr/local/etc/telegraf.conf</string>
<string>--config-directory</string>
<string>/usr/local/etc/telegraf.d</string>
</array>
<key>RunAtLoad</key>
<true/>
</dict>
</plist>
…
Then, restart Telegraf after loading the above changes:
sudo launchctl stop telegraf
sudo launchctl unload -w /Library/LaunchDaemons/telegraf.plist
sudo launchctl load -w /Library/LaunchDaemons/telegraf.plist
sudo launchctl start telegraf
Uninstalling the Agent
To uninstall the agent on macOS, in a Bash terminal, run the following:
1. Stop the Telegraf service:
sudo launchctl stop telegraf
20
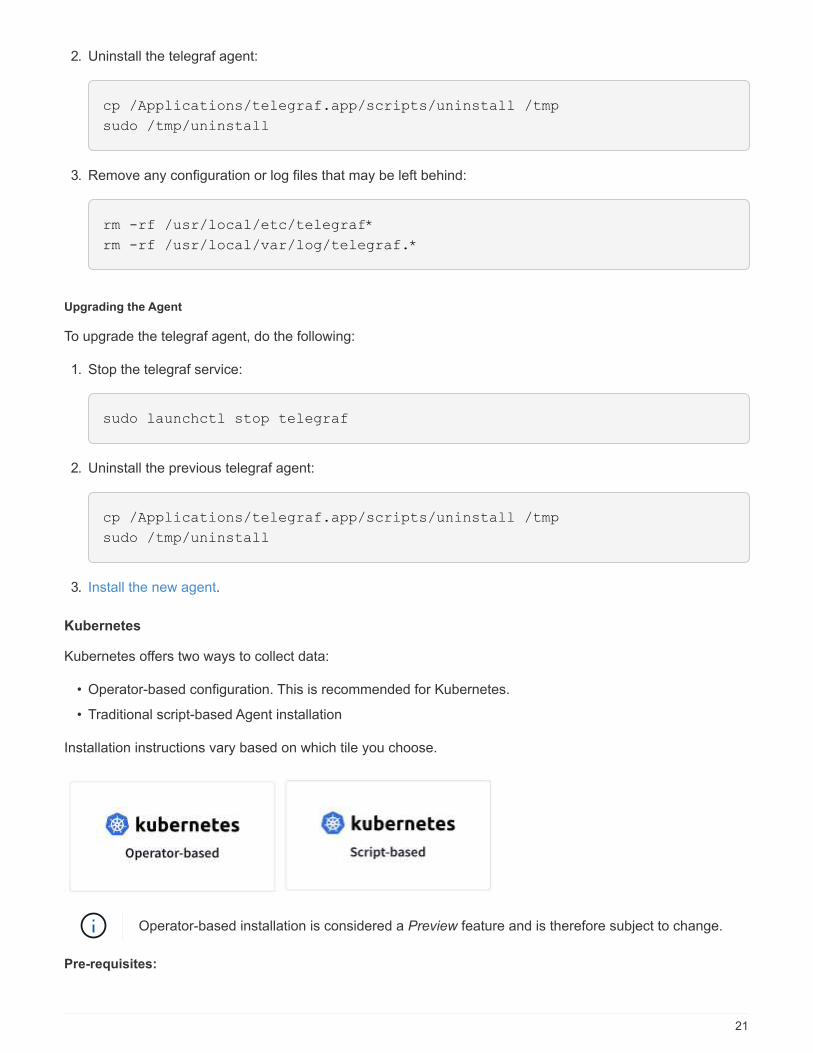
2. Uninstall the telegraf agent:
cp /Applications/telegraf.app/scripts/uninstall /tmp
sudo /tmp/uninstall
3. Remove any configuration or log files that may be left behind:
rm -rf /usr/local/etc/telegraf*
rm -rf /usr/local/var/log/telegraf.*
Upgrading the Agent
To upgrade the telegraf agent, do the following:
1. Stop the telegraf service:
sudo launchctl stop telegraf
2. Uninstall the previous telegraf agent:
cp /Applications/telegraf.app/scripts/uninstall /tmp
sudo /tmp/uninstall
3. Install the new agent.
Kubernetes
Kubernetes offers two ways to collect data:
• Operator-based configuration. This is recommended for Kubernetes.
• Traditional script-based Agent installation
Installation instructions vary based on which tile you choose.
Operator-based installation is considered a Preview feature and is therefore subject to change.
Pre-requisites:
21
• The following commands must be available: curl, sudo, openssl, sha256sum, and kubectl
For best results, add these commands to the PATH.
• kube-state-metrics must be installed. See below for more information. kube-state-metrics is automatically
installed with Operator-based installation.
• If you are behind a proxy, follow the instructions in the Configuring Proxy Support for Kubernetes
section.
• If you are running a Kubernetes variant that requires security context constraints, follow the instructions in
the Configuring the Agent to Collect Data from Kubernetes section. Operator-based installation installs
this for you.
• You must have permissions to create Kubernetes cluster roles and role bindings.
• Operator-based installation has been tested and is expected to work with AWS EKS 1.18 and OpenShift
3.11.
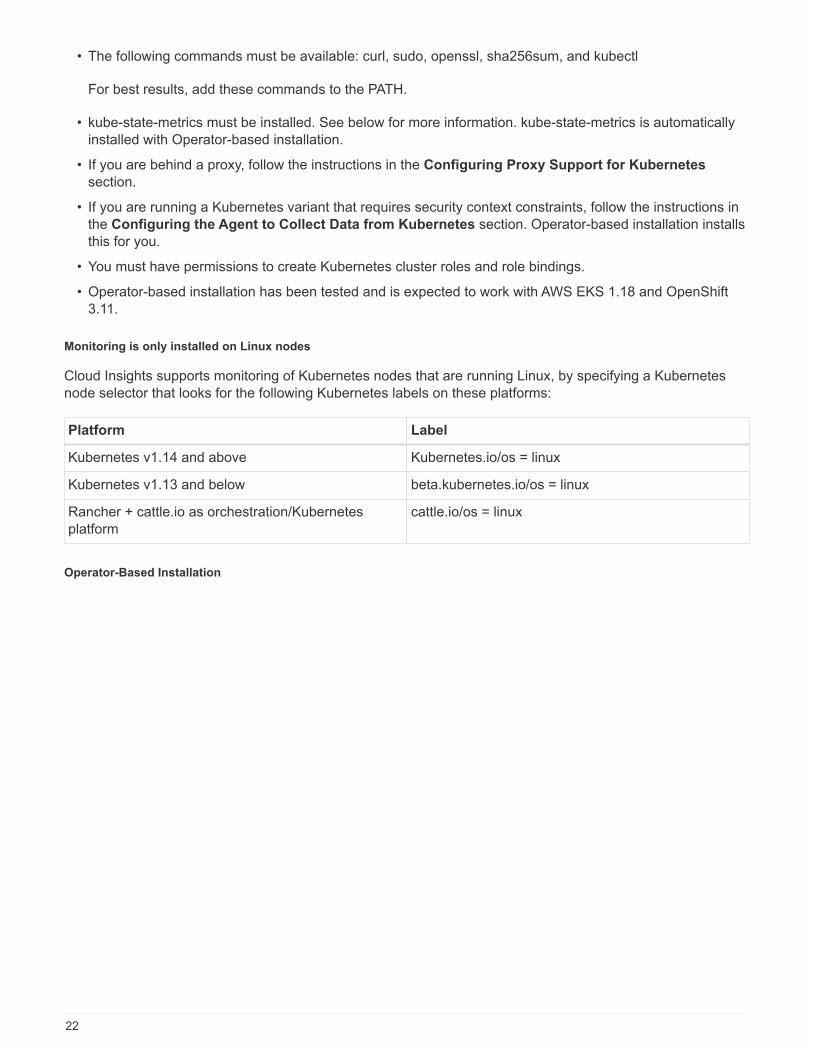
Monitoring is only installed on Linux nodes
Cloud Insights supports monitoring of Kubernetes nodes that are running Linux, by specifying a Kubernetes
node selector that looks for the following Kubernetes labels on these platforms:
Platform Label
Kubernetes v1.14 and above Kubernetes.io/os = linux
Kubernetes v1.13 and below beta.kubernetes.io/os = linux
Rancher + cattle.io as orchestration/Kubernetes
platform
cattle.io/os = linux
Operator-Based Installation
22
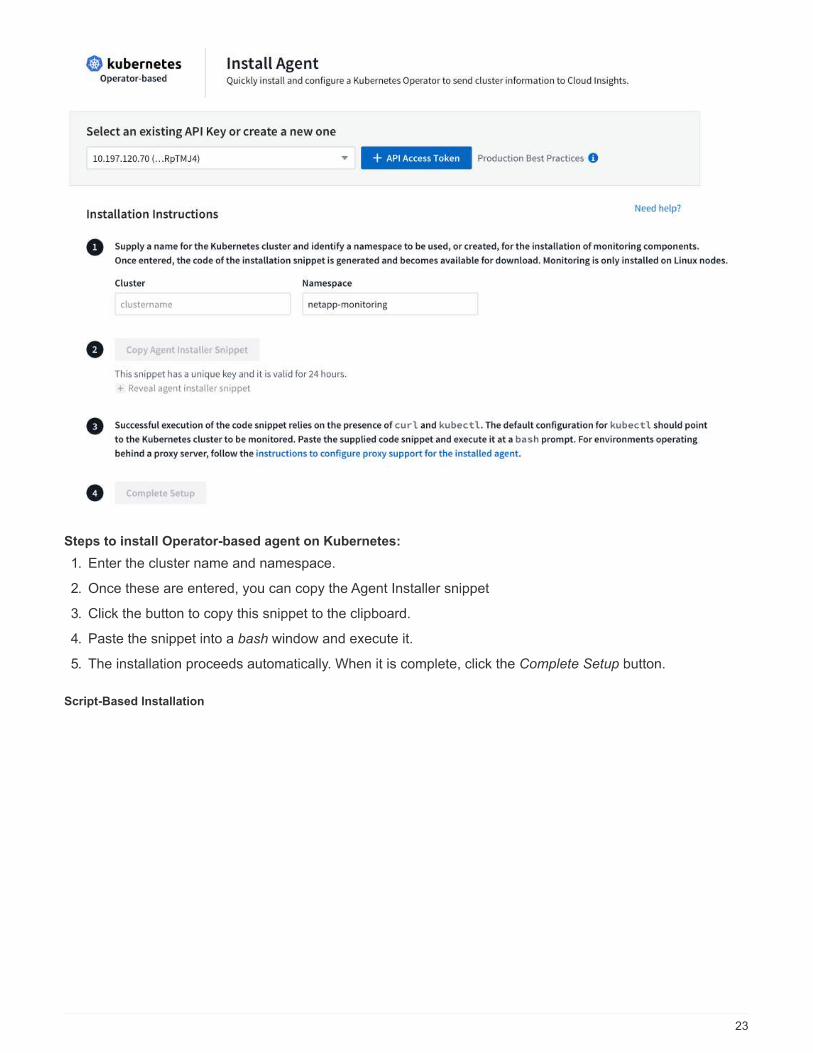
Steps to install Operator-based agent on Kubernetes:
1. Enter the cluster name and namespace.
2. Once these are entered, you can copy the Agent Installer snippet
3. Click the button to copy this snippet to the clipboard.
4. Paste the snippet into a bash window and execute it.
5. The installation proceeds automatically. When it is complete, click the Complete Setup button.
Script-Based Installation
23
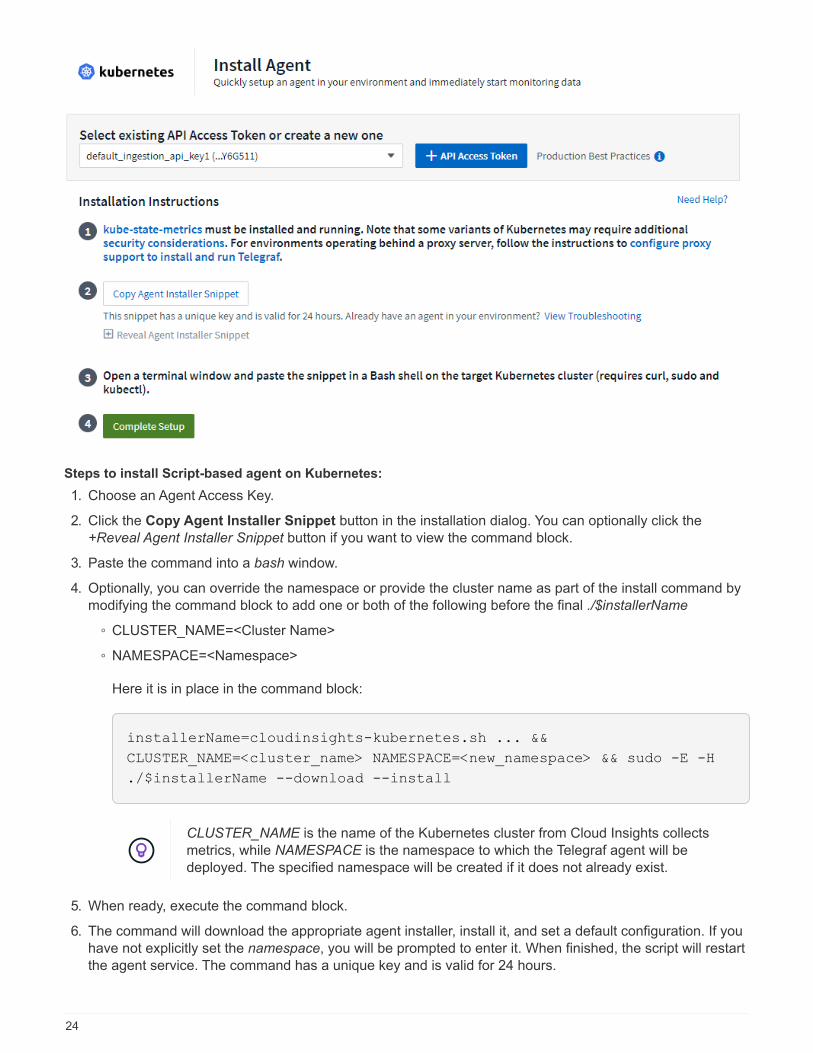
Steps to install Script-based agent on Kubernetes:
1. Choose an Agent Access Key.
2. Click the Copy Agent Installer Snippet button in the installation dialog. You can optionally click the
+Reveal Agent Installer Snippet button if you want to view the command block.
3. Paste the command into a bash window.
4. Optionally, you can override the namespace or provide the cluster name as part of the install command by
modifying the command block to add one or both of the following before the final ./$installerName
◦ CLUSTER_NAME=<Cluster Name>
◦ NAMESPACE=<Namespace>
Here it is in place in the command block:
installerName=cloudinsights-kubernetes.sh ... &&
CLUSTER_NAME=<cluster_name> NAMESPACE=<new_namespace> && sudo -E -H
./$installerName --download --install
CLUSTER_NAME is the name of the Kubernetes cluster from Cloud Insights collects
metrics, while NAMESPACE is the namespace to which the Telegraf agent will be
deployed. The specified namespace will be created if it does not already exist.
5. When ready, execute the command block.
6. The command will download the appropriate agent installer, install it, and set a default configuration. If you
have not explicitly set the namespace, you will be prompted to enter it. When finished, the script will restart
the agent service. The command has a unique key and is valid for 24 hours.
24
7. When finished, click Complete Setup.
DaemonSet, ReplicaSet, and Stopping/Starting the agent
A DaemonSet and ReplicaSet will be created on the Kubernetes cluster to run the required Telegraf
agents/pods. By default, these Telegraf agents/pods will be scheduled on both master and non-master nodes.
To facilitate stopping and restarting of the agent, generate the Telegraf DaemonSet YAML and ReplicaSet
YAML using the following commands. Note that these commands are using the default namespace "ci-
monitoring". If you have set your own namespace, substitute that namespace in these and all subsequent
commands and files:
If you have set your own namespace, substitute that namespace in these and all subsequent commands and
files:
kubectl --namespace ci-monitoring get ds telegraf-ds -o yaml >
/tmp/telegraf-ds.yaml
kubectl --namespace ci-monitoring get rs telegraf-rs -o yaml >
/tmp/telegraf-rs.yaml
You can then use the following commands to stop and start the Telegraf service:
kubectl --namespace ci-monitoring delete ds telegraf-ds
kubectl --namespace ci-monitoring delete rs telegraf-rs
kubectl --namespace ci-monitoring apply -f /tmp/telegraf-ds.yaml
kubectl --namespace ci-monitoring apply -f /tmp/telegraf-rs.yaml
Configuring Proxy Support for Kubernetes
The steps below outline the actions needed to set the http_proxy/https_proxy environment
variables. For some proxy environments, users may also need to set the no_proxy environment
variable.
For systems residing behind a proxy, perform the following to set the https_proxy and/or http_proxy
environment variable(s) for the current user PRIOR to installing the Telegraf agent:
export https_proxy=<proxy_server>:<proxy_port>
AFTER installing the Telegraf agent, add and set the appropriate https_proxy and/or http_proxy environment
variable(s) to the telegraf-ds daemonset and telegraf-rs replicaset.
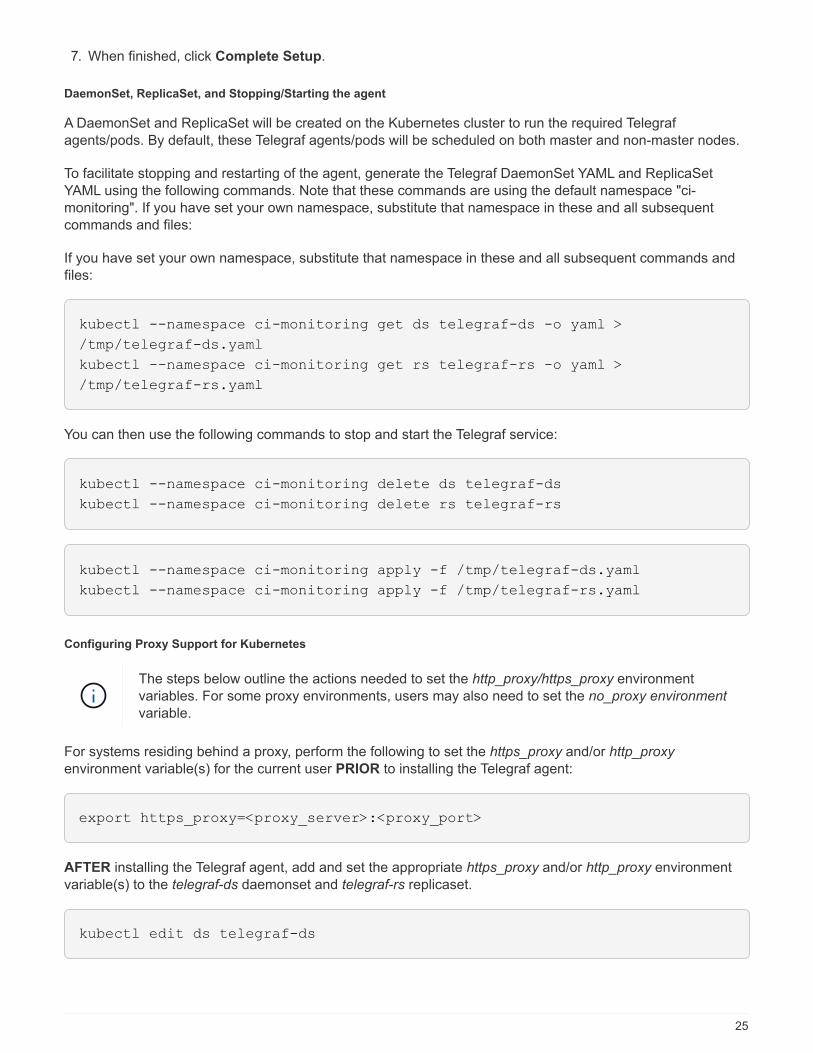
kubectl edit ds telegraf-ds
25
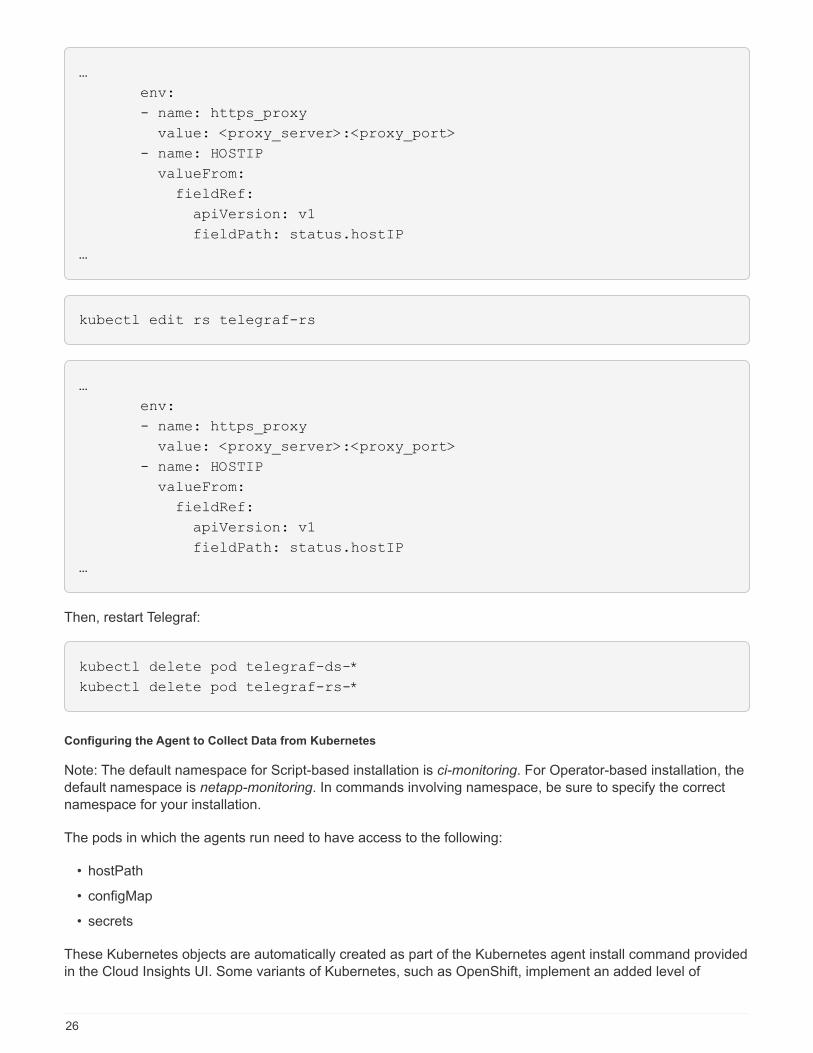
…
env:
- name: https_proxy
value: <proxy_server>:<proxy_port>
- name: HOSTIP
valueFrom:
fieldRef:
apiVersion: v1
fieldPath: status.hostIP
…
kubectl edit rs telegraf-rs
…
env:
- name: https_proxy
value: <proxy_server>:<proxy_port>
- name: HOSTIP
valueFrom:
fieldRef:
apiVersion: v1
fieldPath: status.hostIP
…
Then, restart Telegraf:
kubectl delete pod telegraf-ds-*
kubectl delete pod telegraf-rs-*
Configuring the Agent to Collect Data from Kubernetes
Note: The default namespace for Script-based installation is ci-monitoring. For Operator-based installation, the
default namespace is netapp-monitoring. In commands involving namespace, be sure to specify the correct
namespace for your installation.
The pods in which the agents run need to have access to the following:
• hostPath
• configMap
• secrets
These Kubernetes objects are automatically created as part of the Kubernetes agent install command provided
in the Cloud Insights UI. Some variants of Kubernetes, such as OpenShift, implement an added level of
26
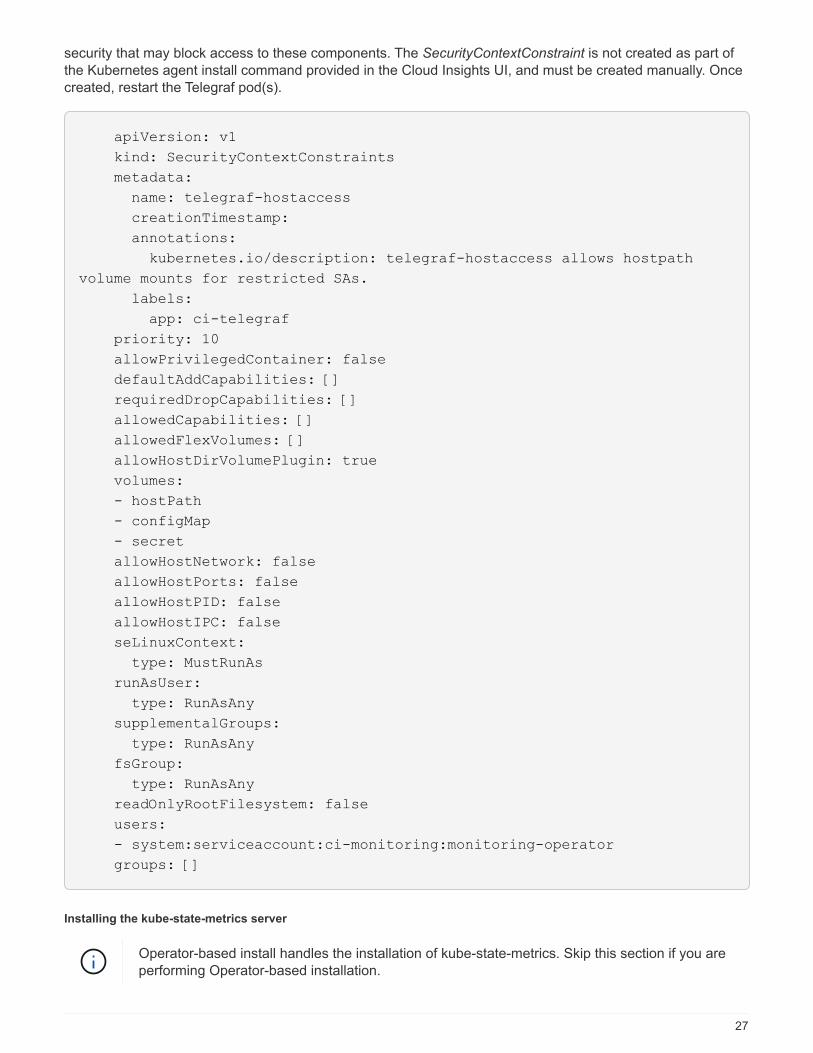
security that may block access to these components. The SecurityContextConstraint is not created as part of
the Kubernetes agent install command provided in the Cloud Insights UI, and must be created manually. Once
created, restart the Telegraf pod(s).
apiVersion: v1
kind: SecurityContextConstraints
metadata:
name: telegraf-hostaccess
creationTimestamp:
annotations:
kubernetes.io/description: telegraf-hostaccess allows hostpath
volume mounts for restricted SAs.
labels:
app: ci-telegraf
priority: 10
allowPrivilegedContainer: false
defaultAddCapabilities: []
requiredDropCapabilities: []
allowedCapabilities: []
allowedFlexVolumes: []
allowHostDirVolumePlugin: true
volumes:
- hostPath
- configMap
- secret
allowHostNetwork: false
allowHostPorts: false
allowHostPID: false
allowHostIPC: false
seLinuxContext:
type: MustRunAs
runAsUser:
type: RunAsAny
supplementalGroups:
type: RunAsAny
fsGroup:
type: RunAsAny
readOnlyRootFilesystem: false
users:
- system:serviceaccount:ci-monitoring:monitoring-operator
groups: []
Installing the kube-state-metrics server
Operator-based install handles the installation of kube-state-metrics. Skip this section if you are
performing Operator-based installation.
27
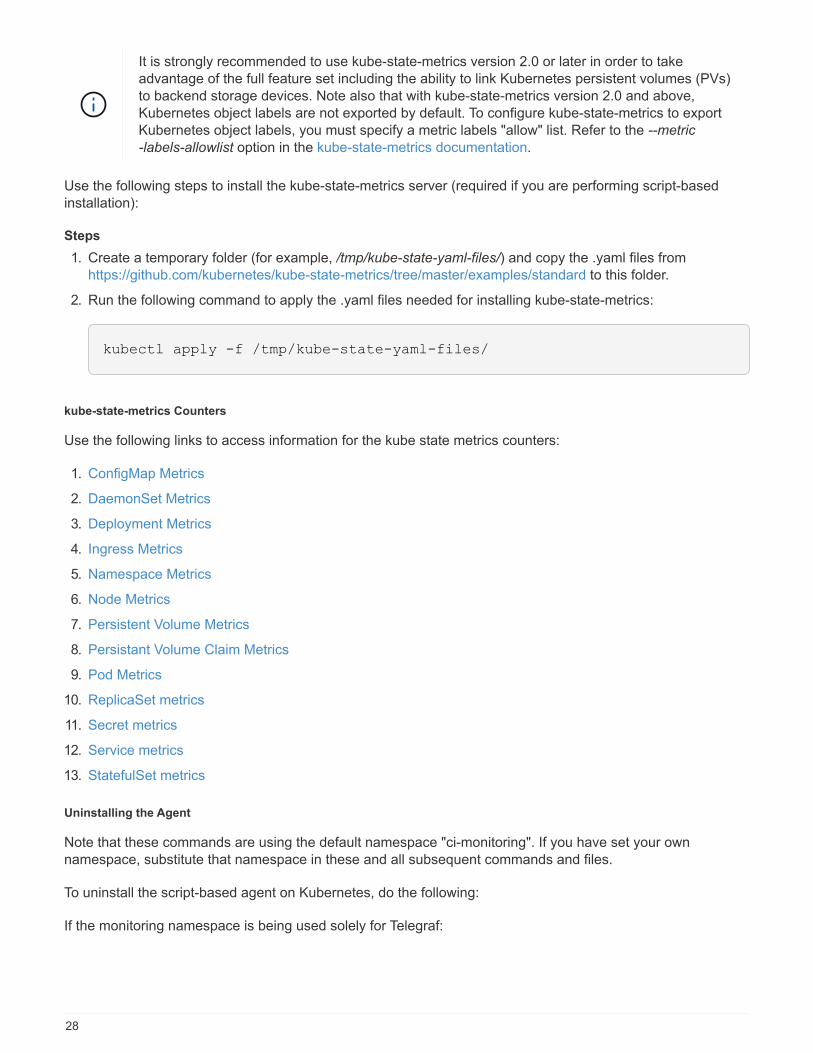
It is strongly recommended to use kube-state-metrics version 2.0 or later in order to take
advantage of the full feature set including the ability to link Kubernetes persistent volumes (PVs)
to backend storage devices. Note also that with kube-state-metrics version 2.0 and above,
Kubernetes object labels are not exported by default. To configure kube-state-metrics to export
Kubernetes object labels, you must specify a metric labels "allow" list. Refer to the --metric
-labels-allowlist option in the kube-state-metrics documentation.
Use the following steps to install the kube-state-metrics server (required if you are performing script-based
installation):
Steps
1. Create a temporary folder (for example, /tmp/kube-state-yaml-files/) and copy the .yaml files from
https://github.com/kubernetes/kube-state-metrics/tree/master/examples/standard to this folder.
2. Run the following command to apply the .yaml files needed for installing kube-state-metrics:
kubectl apply -f /tmp/kube-state-yaml-files/
kube-state-metrics Counters
Use the following links to access information for the kube state metrics counters:
1. ConfigMap Metrics
2. DaemonSet Metrics
3. Deployment Metrics
4. Ingress Metrics
5. Namespace Metrics
6. Node Metrics
7. Persistent Volume Metrics
8. Persistant Volume Claim Metrics
9. Pod Metrics
10. ReplicaSet metrics
11. Secret metrics
12. Service metrics
13. StatefulSet metrics
Uninstalling the Agent
Note that these commands are using the default namespace "ci-monitoring". If you have set your own
namespace, substitute that namespace in these and all subsequent commands and files.
To uninstall the script-based agent on Kubernetes, do the following:
If the monitoring namespace is being used solely for Telegraf:
28
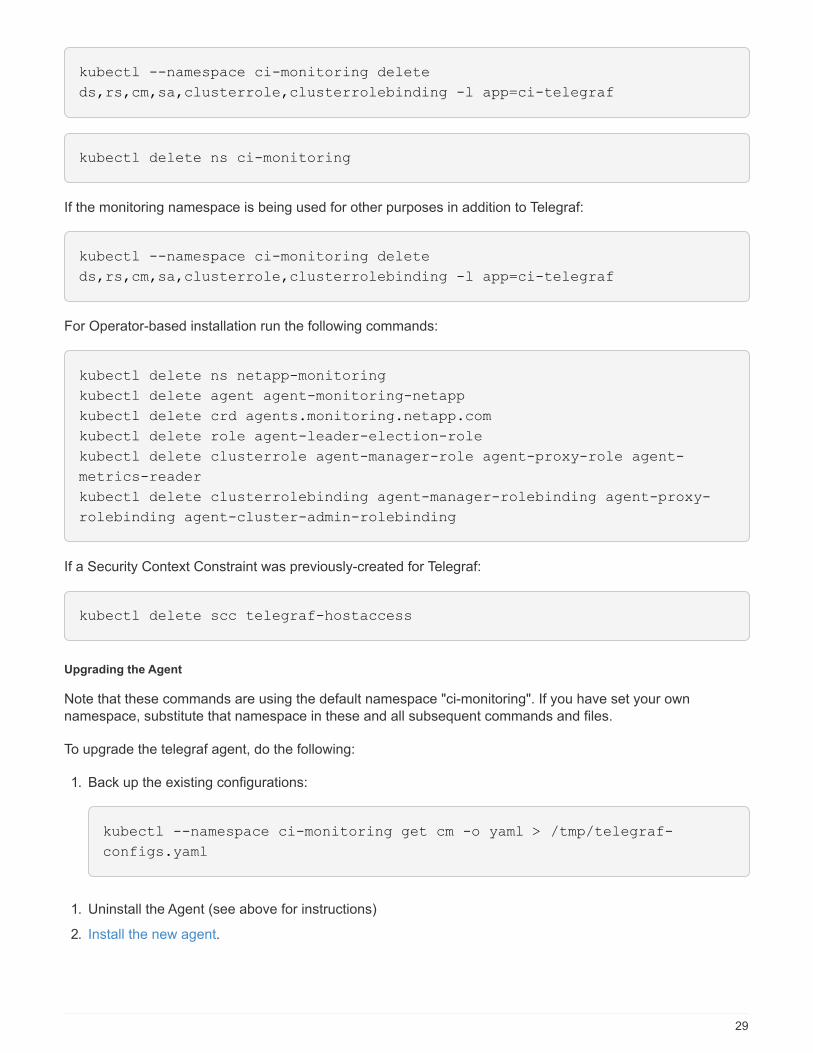
kubectl --namespace ci-monitoring delete
ds,rs,cm,sa,clusterrole,clusterrolebinding -l app=ci-telegraf
kubectl delete ns ci-monitoring
If the monitoring namespace is being used for other purposes in addition to Telegraf:
kubectl --namespace ci-monitoring delete
ds,rs,cm,sa,clusterrole,clusterrolebinding -l app=ci-telegraf
For Operator-based installation run the following commands:
kubectl delete ns netapp-monitoring
kubectl delete agent agent-monitoring-netapp
kubectl delete crd agents.monitoring.netapp.com
kubectl delete role agent-leader-election-role
kubectl delete clusterrole agent-manager-role agent-proxy-role agent-
metrics-reader
kubectl delete clusterrolebinding agent-manager-rolebinding agent-proxy-
rolebinding agent-cluster-admin-rolebinding
If a Security Context Constraint was previously-created for Telegraf:
kubectl delete scc telegraf-hostaccess
Upgrading the Agent
Note that these commands are using the default namespace "ci-monitoring". If you have set your own
namespace, substitute that namespace in these and all subsequent commands and files.
To upgrade the telegraf agent, do the following:
1. Back up the existing configurations:
kubectl --namespace ci-monitoring get cm -o yaml > /tmp/telegraf-
configs.yaml
1. Uninstall the Agent (see above for instructions)
2. Install the new agent.
29
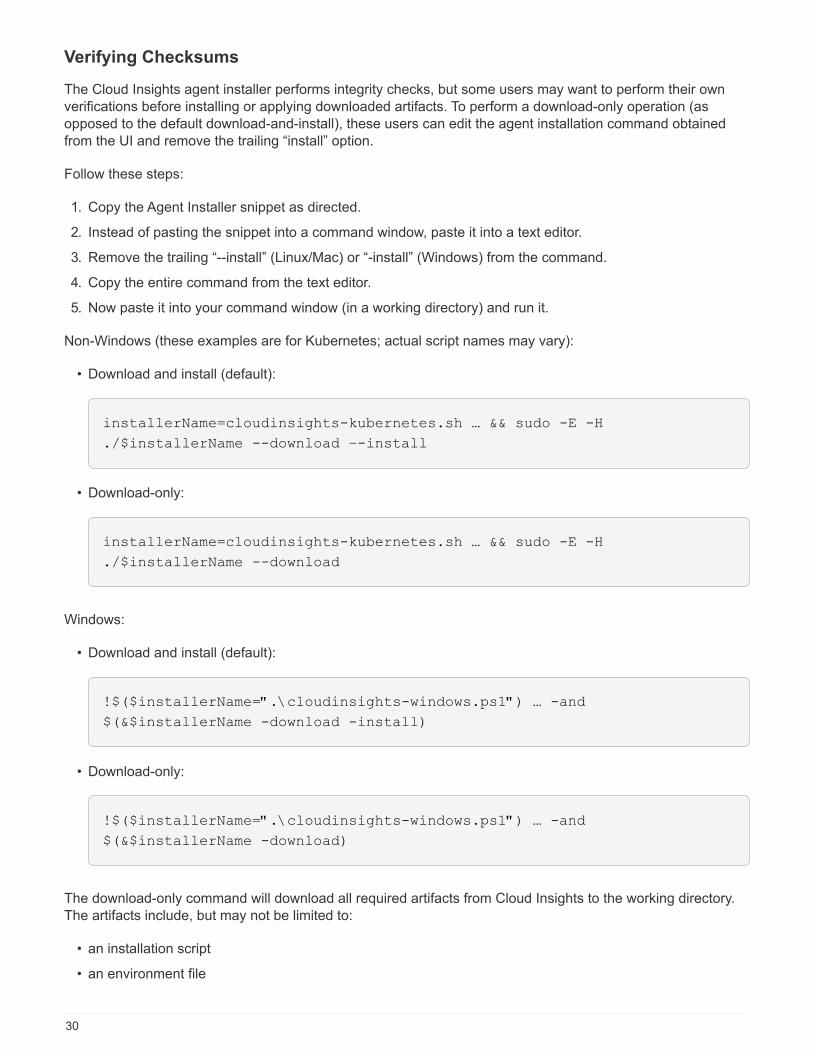
Verifying Checksums
The Cloud Insights agent installer performs integrity checks, but some users may want to perform their own
verifications before installing or applying downloaded artifacts. To perform a download-only operation (as
opposed to the default download-and-install), these users can edit the agent installation command obtained
from the UI and remove the trailing “install” option.
Follow these steps:
1. Copy the Agent Installer snippet as directed.
2. Instead of pasting the snippet into a command window, paste it into a text editor.
3. Remove the trailing “--install” (Linux/Mac) or “-install” (Windows) from the command.
4. Copy the entire command from the text editor.
5. Now paste it into your command window (in a working directory) and run it.
Non-Windows (these examples are for Kubernetes; actual script names may vary):
• Download and install (default):
installerName=cloudinsights-kubernetes.sh … && sudo -E -H
./$installerName --download –-install
• Download-only:
installerName=cloudinsights-kubernetes.sh … && sudo -E -H
./$installerName --download
Windows:
• Download and install (default):
!$($installerName=".\cloudinsights-windows.ps1") … -and
$(&$installerName -download -install)
• Download-only:
!$($installerName=".\cloudinsights-windows.ps1") … -and
$(&$installerName -download)
The download-only command will download all required artifacts from Cloud Insights to the working directory.
The artifacts include, but may not be limited to:
• an installation script
• an environment file
30
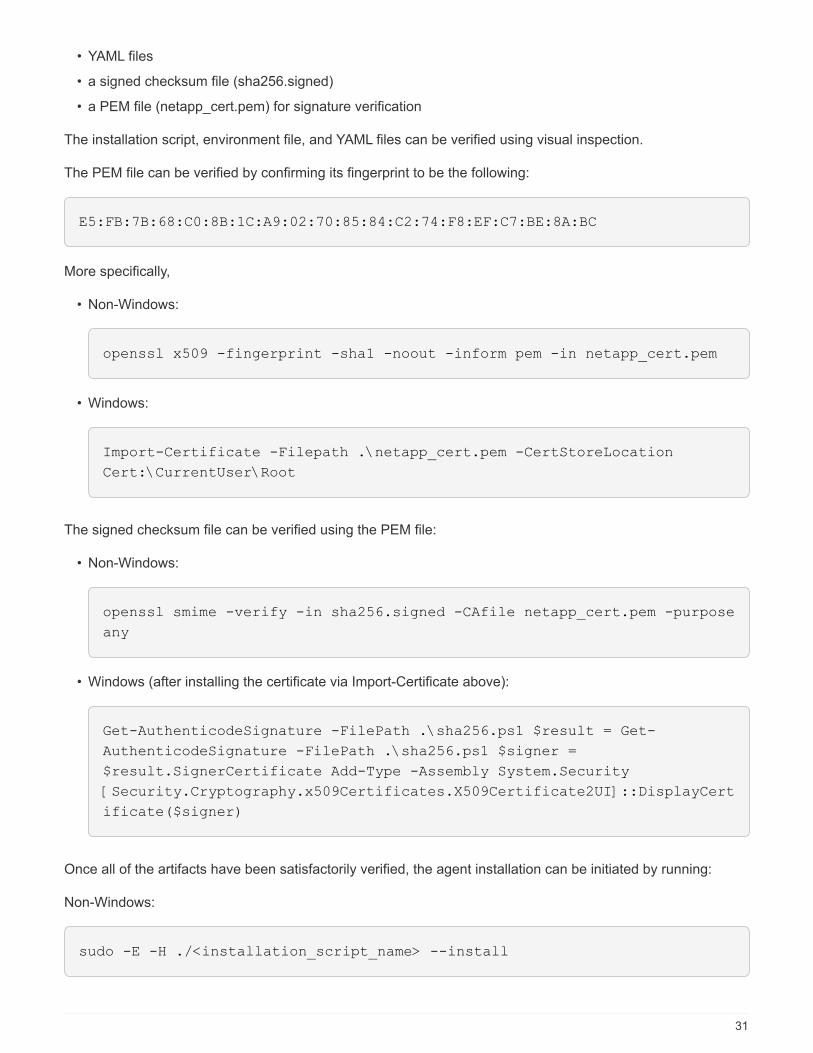
• YAML files
• a signed checksum file (sha256.signed)
• a PEM file (netapp_cert.pem) for signature verification
The installation script, environment file, and YAML files can be verified using visual inspection.
The PEM file can be verified by confirming its fingerprint to be the following:
E5:FB:7B:68:C0:8B:1C:A9:02:70:85:84:C2:74:F8:EF:C7:BE:8A:BC
More specifically,
• Non-Windows:
openssl x509 -fingerprint -sha1 -noout -inform pem -in netapp_cert.pem
• Windows:
Import-Certificate -Filepath .\netapp_cert.pem -CertStoreLocation
Cert:\CurrentUser\Root
The signed checksum file can be verified using the PEM file:
• Non-Windows:
openssl smime -verify -in sha256.signed -CAfile netapp_cert.pem -purpose
any
• Windows (after installing the certificate via Import-Certificate above):
Get-AuthenticodeSignature -FilePath .\sha256.ps1 $result = Get-
AuthenticodeSignature -FilePath .\sha256.ps1 $signer =
$result.SignerCertificate Add-Type -Assembly System.Security
[Security.Cryptography.x509Certificates.X509Certificate2UI]::DisplayCert
ificate($signer)
Once all of the artifacts have been satisfactorily verified, the agent installation can be initiated by running:
Non-Windows:
sudo -E -H ./<installation_script_name> --install
31
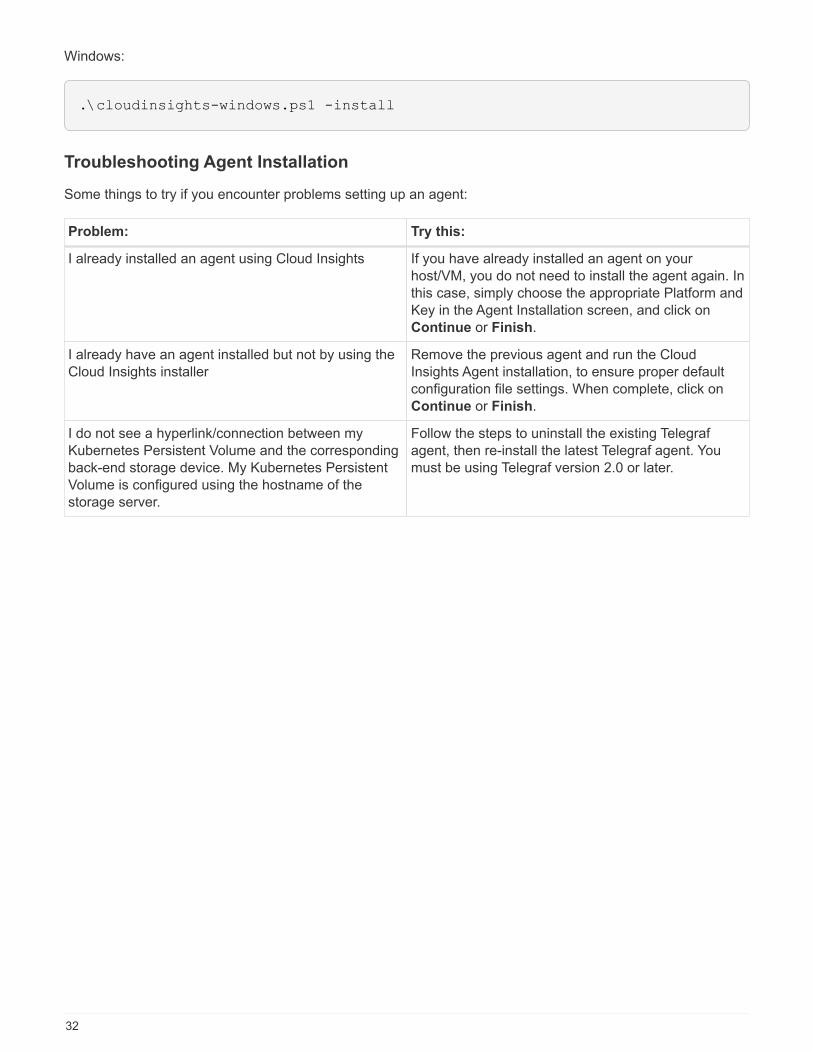
Windows:
.\cloudinsights-windows.ps1 -install
Troubleshooting Agent Installation
Some things to try if you encounter problems setting up an agent:
Problem: Try this:
I already installed an agent using Cloud Insights If you have already installed an agent on your
host/VM, you do not need to install the agent again. In
this case, simply choose the appropriate Platform and
Key in the Agent Installation screen, and click on
Continue or Finish.
I already have an agent installed but not by using the
Cloud Insights installer
Remove the previous agent and run the Cloud
Insights Agent installation, to ensure proper default
configuration file settings. When complete, click on
Continue or Finish.
I do not see a hyperlink/connection between my
Kubernetes Persistent Volume and the corresponding
back-end storage device. My Kubernetes Persistent
Volume is configured using the hostname of the
storage server.
Follow the steps to uninstall the existing Telegraf
agent, then re-install the latest Telegraf agent. You
must be using Telegraf version 2.0 or later.
32
Problem: Try this:
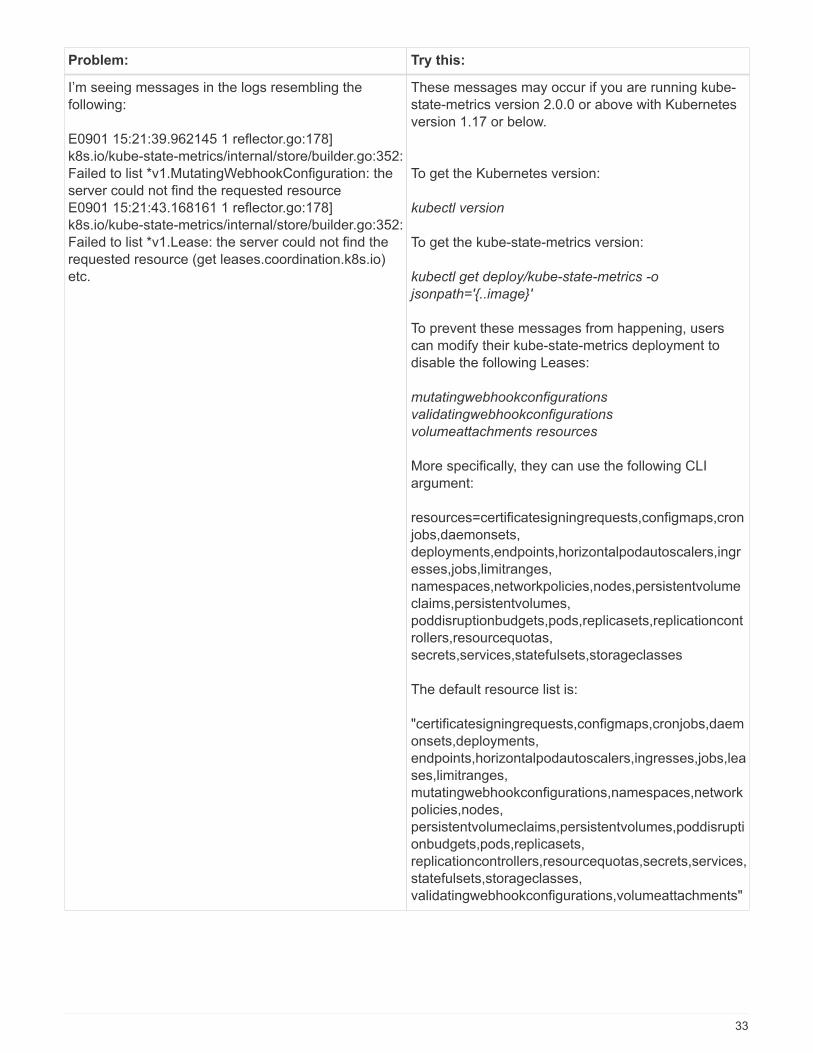
I’m seeing messages in the logs resembling the
following:
E0901 15:21:39.962145 1 reflector.go:178]
k8s.io/kube-state-metrics/internal/store/builder.go:352:
Failed to list *v1.MutatingWebhookConfiguration: the
server could not find the requested resource
E0901 15:21:43.168161 1 reflector.go:178]
k8s.io/kube-state-metrics/internal/store/builder.go:352:
Failed to list *v1.Lease: the server could not find the
requested resource (get leases.coordination.k8s.io)
etc.
These messages may occur if you are running kube-
state-metrics version 2.0.0 or above with Kubernetes
version 1.17 or below.
To get the Kubernetes version:
kubectl version
To get the kube-state-metrics version:
kubectl get deploy/kube-state-metrics -o
jsonpath='{..image}'
To prevent these messages from happening, users
can modify their kube-state-metrics deployment to
disable the following Leases:
mutatingwebhookconfigurations
validatingwebhookconfigurations
volumeattachments resources
More specifically, they can use the following CLI
argument:
resources=certificatesigningrequests,configmaps,cron
jobs,daemonsets,
deployments,endpoints,horizontalpodautoscalers,ingr
esses,jobs,limitranges,
namespaces,networkpolicies,nodes,persistentvolume
claims,persistentvolumes,
poddisruptionbudgets,pods,replicasets,replicationcont
rollers,resourcequotas,
secrets,services,statefulsets,storageclasses
The default resource list is:
"certificatesigningrequests,configmaps,cronjobs,daem
onsets,deployments,
endpoints,horizontalpodautoscalers,ingresses,jobs,lea
ses,limitranges,
mutatingwebhookconfigurations,namespaces,network
policies,nodes,
persistentvolumeclaims,persistentvolumes,poddisrupti
onbudgets,pods,replicasets,
replicationcontrollers,resourcequotas,secrets,services,
statefulsets,storageclasses,
validatingwebhookconfigurations,volumeattachments"
33
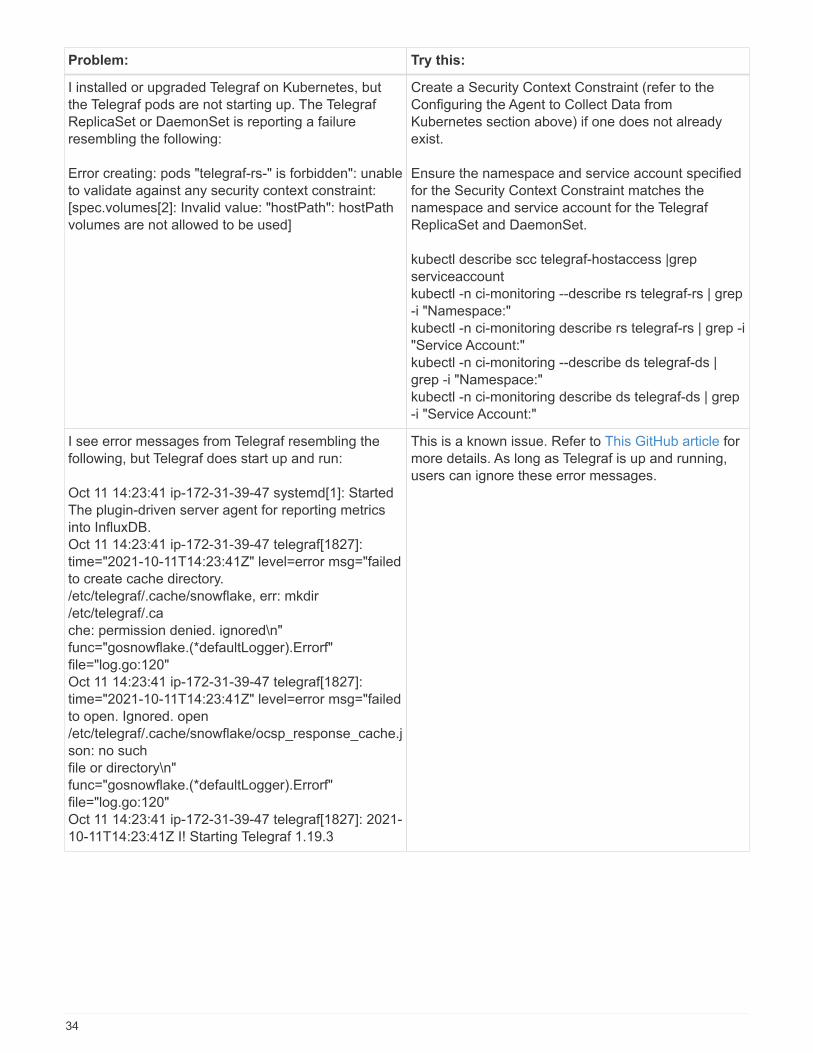
Problem: Try this:
I installed or upgraded Telegraf on Kubernetes, but
the Telegraf pods are not starting up. The Telegraf
ReplicaSet or DaemonSet is reporting a failure
resembling the following:
Error creating: pods "telegraf-rs-" is forbidden": unable
to validate against any security context constraint:
[spec.volumes[2]: Invalid value: "hostPath": hostPath
volumes are not allowed to be used]
Create a Security Context Constraint (refer to the
Configuring the Agent to Collect Data from
Kubernetes section above) if one does not already
exist.
Ensure the namespace and service account specified
for the Security Context Constraint matches the
namespace and service account for the Telegraf
ReplicaSet and DaemonSet.
kubectl describe scc telegraf-hostaccess |grep
serviceaccount
kubectl -n ci-monitoring --describe rs telegraf-rs | grep
-i "Namespace:"
kubectl -n ci-monitoring describe rs telegraf-rs | grep -i
"Service Account:"
kubectl -n ci-monitoring --describe ds telegraf-ds |
grep -i "Namespace:"
kubectl -n ci-monitoring describe ds telegraf-ds | grep
-i "Service Account:"
I see error messages from Telegraf resembling the
following, but Telegraf does start up and run:
Oct 11 14:23:41 ip-172-31-39-47 systemd[1]: Started
The plugin-driven server agent for reporting metrics
into InfluxDB.
Oct 11 14:23:41 ip-172-31-39-47 telegraf[1827]:
time="2021-10-11T14:23:41Z" level=error msg="failed
to create cache directory.
/etc/telegraf/.cache/snowflake, err: mkdir
/etc/telegraf/.ca
che: permission denied. ignored\n"
func="gosnowflake.(*defaultLogger).Errorf"
file="log.go:120"
Oct 11 14:23:41 ip-172-31-39-47 telegraf[1827]:
time="2021-10-11T14:23:41Z" level=error msg="failed
to open. Ignored. open
/etc/telegraf/.cache/snowflake/ocsp_response_cache.j
son: no such
file or directory\n"
func="gosnowflake.(*defaultLogger).Errorf"
file="log.go:120"
Oct 11 14:23:41 ip-172-31-39-47 telegraf[1827]: 2021-
10-11T14:23:41Z I! Starting Telegraf 1.19.3
This is a known issue. Refer to This GitHub article for
more details. As long as Telegraf is up and running,
users can ignore these error messages.
34
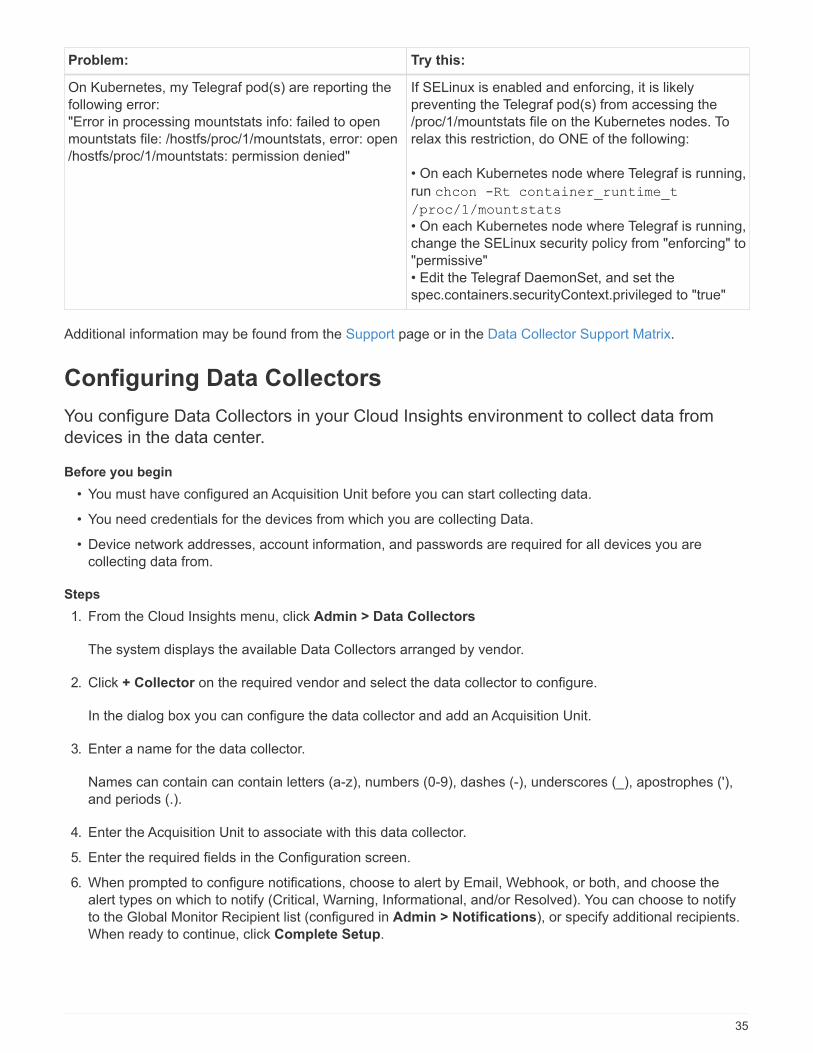
Problem: Try this:
On Kubernetes, my Telegraf pod(s) are reporting the
following error:
"Error in processing mountstats info: failed to open
mountstats file: /hostfs/proc/1/mountstats, error: open
/hostfs/proc/1/mountstats: permission denied"
If SELinux is enabled and enforcing, it is likely
preventing the Telegraf pod(s) from accessing the
/proc/1/mountstats file on the Kubernetes nodes. To
relax this restriction, do ONE of the following:
• On each Kubernetes node where Telegraf is running,
run chcon -Rt container_runtime_t
/proc/1/mountstats
• On each Kubernetes node where Telegraf is running,
change the SELinux security policy from "enforcing" to
"permissive"
• Edit the Telegraf DaemonSet, and set the
spec.containers.securityContext.privileged to "true"
Additional information may be found from the Support page or in the Data Collector Support Matrix.
Configuring Data Collectors
You configure Data Collectors in your Cloud Insights environment to collect data from
devices in the data center.
Before you begin
• You must have configured an Acquisition Unit before you can start collecting data.
• You need credentials for the devices from which you are collecting Data.
• Device network addresses, account information, and passwords are required for all devices you are
collecting data from.
Steps
1. From the Cloud Insights menu, click Admin > Data Collectors
The system displays the available Data Collectors arranged by vendor.
2. Click + Collector on the required vendor and select the data collector to configure.
In the dialog box you can configure the data collector and add an Acquisition Unit.
3. Enter a name for the data collector.
Names can contain can contain letters (a-z), numbers (0-9), dashes (-), underscores (_), apostrophes ('),
and periods (.).
4. Enter the Acquisition Unit to associate with this data collector.
5. Enter the required fields in the Configuration screen.
6. When prompted to configure notifications, choose to alert by Email, Webhook, or both, and choose the
alert types on which to notify (Critical, Warning, Informational, and/or Resolved). You can choose to notify
to the Global Monitor Recipient list (configured in Admin > Notifications), or specify additional recipients.
When ready to continue, click Complete Setup.
35
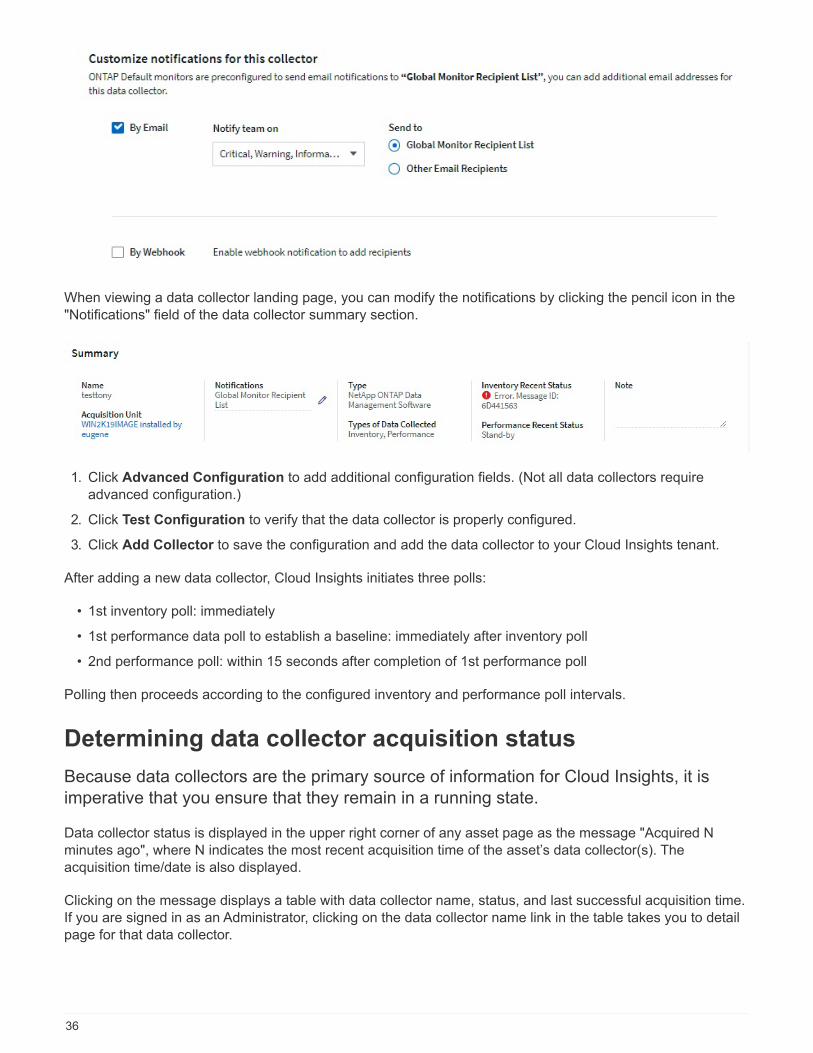
When viewing a data collector landing page, you can modify the notifications by clicking the pencil icon in the
"Notifications" field of the data collector summary section.
1. Click Advanced Configuration to add additional configuration fields. (Not all data collectors require
advanced configuration.)
2. Click Test Configuration to verify that the data collector is properly configured.
3. Click Add Collector to save the configuration and add the data collector to your Cloud Insights tenant.
After adding a new data collector, Cloud Insights initiates three polls:
• 1st inventory poll: immediately
• 1st performance data poll to establish a baseline: immediately after inventory poll
• 2nd performance poll: within 15 seconds after completion of 1st performance poll
Polling then proceeds according to the configured inventory and performance poll intervals.
Determining data collector acquisition status
Because data collectors are the primary source of information for Cloud Insights, it is
imperative that you ensure that they remain in a running state.
Data collector status is displayed in the upper right corner of any asset page as the message "Acquired N
minutes ago", where N indicates the most recent acquisition time of the asset’s data collector(s). The
acquisition time/date is also displayed.
Clicking on the message displays a table with data collector name, status, and last successful acquisition time.
If you are signed in as an Administrator, clicking on the data collector name link in the table takes you to detail
page for that data collector.
36
Managing configured data collectors
The Installed Data Collectors page provides access to the data collectors that have been
configured for Cloud Insights. You can use this page to modify existing data collectors.
Steps
1. In the Cloud Insights menu, click Admin > Data Collectors
The Available Data Collectors screen is displayed.
2. Click Installed Data Collectors
A list of all of the installed Data Collectors is displayed. The list provides collector
name, status, the IP address the collector is accessing, and when data was last acquired
from the a device. Action that can be performed on this screen include:
◦ Control polling
◦ Change data collector credentials
◦ Clone data collectors
Controlling Data Collector polling
After making a change to a data collector, you might want it to poll immediately to check
your changes, or you might want to postpone the data collection on a data collector for one,
three, or five days while you work on a problem.
Steps
1. In the Cloud Insights menu, click Admin > Data Collectors
2. Click Installed Data Collectors
3. Select the check box to the left of the Data Collector you want to change
4. Click Bulk Actions and select the polling action you want to take.
Bulk actions can be performed simultaneously on multiple Data Collectors. Select the data
collectors, and chose the action to perform from the Bulk Action menu.
Editing data collector information
You can edit existing data collector setup information.
To edit a single data collector:
1. In the Cloud Insights menu, click Admin > Data Collectors to open the list of installed Data Collectors.
2. In the options menu to the right of the data collector you want to modify, click Edit.
The Edit Collector dialog is opened.
3. Enter the changes and click Test Configuration to test the new configuration or click Save to save the
configuration.
You can also edit multiple data collectors:
37
1. Select the check box to the left of each data collector you want to change.
2. Click the Bulk Actions button and choose Edit to open the Edit data Collector dialog.
3. Modify the fields as above.
The data collectors selected must be the same vendor and model, and reside on the same
Acquisition Unit.
When editing multiple data collectors, the Data Collector Name field shows “Mixed” and cannot be edited.
Other fields such as user name and password show “Mixed” and can be edited. Fields that share the same
value across the selected data collectors show the current values and can be edited.
When editing multiple data collectors, the Test Configuration button is not available.
Cloning data collectors
Using the clone facility, you can quickly add a data source that has the same credentials
and attributes as another data source. Cloning allows you to easily configure multiple
instances of the same device type.
Steps
1. In the Cloud Insights menu, click Admin > Data Collectors.
2. Click Installed Data Collectors.
3. Click the check box to the left of the data collector you want to copy.
4. In the options menu to the right of the selected data collector, click Clone.
The Clone Data Collector dialog is displayed.
5. Enter new information in the required fields.
6. Click Save.
After you finish
The clone operation copies all other attributes and settings to create the new data collector.
Performing bulk actions on data collectors
You can simultaneously edit some information for multiple data collectors. This feature allows you to initiate a
poll, postpone polling, and resume polling on multiple data collectors. In addition, you can delete multiple data
collectors.
Steps
1. In the Cloud Insights menu, click Admin > Data Collectors
2. Click Installed Data Collectors
3. Click the check box to the left of the data collectors you want to modify.
4. In the options menu to the right, click the option you want to perform.
After you finish
The operation you selected is performed on the data collectors. When you chose to delete data collectors, a
dialog is displayed requiring you to conform the action.
38
Researching a failed data collector
If a data collector has failure message and a High or Medium Impact, you need to
research this problem using the data collector summary page with its linked information.
Use the following steps to determine the cause of failed data collectors. Data collector failure messages are
displayed on the Admin menu and on the Installed Data Collectors page.
Steps
1. Click Admin > Data Collectors > Installed Data Collectors.
2. Click the linked Name of the failing data collector to open the Summary page.
3. On the Summary page, check the Comments area to read any notes that might have been left by another
engineer who might also be investigating this failure.
4. Note any performance messages.
5. Move your mouse pointer over the segments of the Event Timeline graph to display additional information.
6. Select an error message for a Device and displayed below the Event Timeline and click the Error details
icon that displays to the right of the message.
The Error details include the text of the error message, most likely causes, information in use, and
suggestions of what can be tried to correct the problem.
7. In the Devices Reported By This Data Collector area, you might filter the list to display only devices of
interest, and you can click the linked Name of a device to display the asset page for that device.
8. When you return to the data collector summary page, check the Show Recent Changes area at the
bottom of the page to see if recent changes could have caused the problem.
39
Copyright Information
Copyright © 2022 NetApp, Inc. All rights reserved. Printed in the U.S. No part of this document
covered by copyright may be reproduced in any form or by any means-graphic, electronic, or
mechanical, including photocopying, recording, taping, or storage in an electronic retrieval system-
without prior written permission of the copyright owner.
Software derived from copyrighted NetApp material is subject to the following license and disclaimer:
THIS SOFTWARE IS PROVIDED BY NETAPP “AS IS” AND WITHOUT ANY EXPRESS OR IMPLIED
WARRANTIES, INCLUDING, BUT NOT LIMITED TO, THE IMPLIED WARRANTIES OF
MERCHANTABILITY AND FITNESS FOR A PARTICULAR PURPOSE, WHICH ARE HEREBY
DISCLAIMED. IN NO EVENT SHALL NETAPP BE LIABLE FOR ANY DIRECT, INDIRECT,
INCIDENTAL, SPECIAL, EXEMPLARY, OR CONSEQUENTIAL DAMAGES (INCLUDING, BUT NOT
LIMITED TO, PROCUREMENT OF SUBSTITUTE GOODS OR SERVICES; LOSS OF USE, DATA, OR
PROFITS; OR BUSINESS INTERRUPTION) HOWEVER CAUSED AND ON ANY THEORY OF
LIABILITY, WHETHER IN CONTRACT, STRICT LIABILITY, OR TORT (INCLUDING NEGLIGENCE OR
OTHERWISE) ARISING IN ANY WAY OUT OF THE USE OF THIS SOFTWARE, EVEN IF ADVISED OF
THE POSSIBILITY OF SUCH DAMAGE.
NetApp reserves the right to change any products described herein at any time, and without notice.
NetApp assumes no responsibility or liability arising from the use of products described herein,
except as expressly agreed to in writing by NetApp. The use or purchase of this product does not
convey a license under any patent rights, trademark rights, or any other intellectual property
rights of NetApp.
The product described in this manual may be protected by one or more U.S. patents,
foreign patents, or pending applications.
RESTRICTED RIGHTS LEGEND: Use, duplication, or disclosure by the government is subject to
restrictions as set forth in subparagraph (c)(1)(ii) of the Rights in Technical Data and
Computer Software clause at DFARS 252.277-7103 (October 1988) and FAR 52-227-19 (June 1987).
Trademark Information
NETAPP, the NETAPP logo, and the marks listed at http://www.netapp.com/TM are trademarks of
NetApp, Inc. Other company and product names may be trademarks of their respective owners.
40