Embed Size (px)
Citation preview


• TP, SRP
• NO2+NO3, NH4, TKN
• SO4
• Fe
• DOM, DOC, DIC
• Chlorophyll a
• TSS

0.000
0.050
0.100
0.150
0.200
0.250
0.300
0.350
0.400
0.450
Tota
l Ph
osp
ho
rus
(mg/
l)
Date
2012 Total Phosphorus (mg/l)
Surface Bottom


• Dissolved Oxygen (mg/l)
• Conductivity (mS/cm)
• Specific Conductance (mS/cm @ 25°C)
• Salinity (ppt)
• Temperature (C°)
• pH
• ORP (mV)

• % organic matter
• Fe/Mn bound P
• Ca bound P
• N
• SO4
• Fe


A
Some changes in structure and function of community, some loss of native taxa, unexpected/tolerant taxa sustained, anomalies infrequent
Extreme changes in structure and function, wholesale changes in taxa, virtual absence of sensitive taxa, predominance by one or a few tolerant, taxa, extremely low taxa richness, abnormalities and anomalies extremely elevated
Natural structure and function of community
Structure & function similar to natural community with some additional taxa and biomass, no or incidental anomalies, sensitive invasive taxa may be present
B
C
D
E
F
ORW Uses
Stressor Gradient [Effect of Human Activity]
LOW HIGH
Attainability Threshold
Bio
logi
cal C
on
dit
ion
[S
pe
cifi
c to
Eco
typ
e]
Algae Identification on Wild Goose Lake
27-May-08
6-foot composite sample
Taxa Division
#
count
ed
Concentrati
on
(units/ml)
Relative %
concentrati
on
Aulacoseira sp Bacillariophyta 2 8 0.6
Crucigenia sp. Chlorophyta 62 256 20.7
Oocystis sp. Chlorophyta 54 223 18
Pediastrum sp. Chlorophyta 3 12 1
Scenedesmus sp. Chlorophyta 41 169 13.7
Schroederia sp. Chlorophyta 8 33 2.7
Selenastrum sp. Chlorophyta 96 396 32
Spondylosium sp. Chlorophyta 3 12 1
Staurastrum sp. Chlorophyta 3 12 1
Staurodesmus sp. Chlorophyta 8 33 2.7
Tetraedron sp. Chlorophyta 5 21 1.7
Dinobryon sp. Chrysophyta 7 29 2.3
Cryptomonas sp. Cryptophyta 6 25 2
Woronichinia naegeliana Cyanophyta 1 4 0.3
Peridinium sp. Pyrrhophyta 1 4 0.3
Algae Identification on Wild Goose Lake
16-Jun-08
6-foot composite sample
Taxa Division
#
counte
d
Concentrati
on
(units/ml)
Relative %
concentrati
on
Aulacoseira sp Bacillariophyta 1 8 0.3
Pennales Diatoms Bacillariophyta 6 48 2
Cosmarium sp Chlorophyta 11 88 3.6
Crucigenia sp. Chlorophyta 143 1146 47.4
Dictyosphaerium sp. Chlorophyta 4 32 1.3
Oocystis sp. Chlorophyta 20 160 6.6
Pediastrum sp. Chlorophyta 2 16 0.7
Scenedesmus sp. Chlorophyta 28 224 9.3
Schroederia sp. Chlorophyta 2 16 0.7
Spondylosium sp. Chlorophyta 9 72 3
Staurastrum sp. Chlorophyta 8 64 2.6
Staurodesmus sp. Chlorophyta 5 40 1.7
Cryptomonas sp. Cryptophyta 6 48 2
Anabaena sp. Cyanophyta 1 8 0.3
Aphanocapsa sp. Cyanophyta 7 56 2.3
Aphanothece sp. Cyanophyta 8 64 2.6
Chroococcus sp. Cyanophyta 2 16 0.7
Merismopedia sp. Cyanophyta 1 8 0.3
Microcystis sp. Cyanophyta 3 24 1
Rhabdogloea smithii Cyanophyta 27 216 8.9
Ceratium hirundinella Pyrrhophyta 3 24 1
Peridinium sp. Pyrrhophyta 5 40 1.7
Algae Identification on Wild Goose Lake
14-Jul-08
6-foot composite sample
Taxa Division
#
counte
d
Concentrati
on
(units/ml)
Relative %
concentrati
on
Oocystis sp. Chlorophyta 4 32 1.3
Scenedesmus sp. Chlorophyta 16 127 5.2
Tetraedron sp Chlorophyta 1 8 0.3
Cryptomonas sp. Cryptophyta 17 135 5.6
Anabaena sp. Cyanophyta 25 198 8.2
Aphanizomenon sp. Cyanophyta 62 491 20.2
Aphanocapsa sp. Cyanophyta 106 840 34.6
Aphanothece sp. Cyanophyta 59 467 19.3
Microcystis sp. Cyanophyta 16 127 5.2
Algae Identification on Wild Goose Lake
25-Aug-08
6-foot composite sample
Taxa Division
#
counte
d
Concentrati
on
(units/ml)
Relative %
concentrati
on
Scenedesmus sp. Chlorophyta 2 49 0.7
Cryptomonas sp. Cryptophyta 4 97 1.3
Anabaena sp. Cyanophyta 10 243 3.3
Aphanizomenon sp. Cyanophyta 259 6302 85.5
Aphanocapsa sp. Cyanophyta 14 341 4.6
Aphanothece sp. Cyanophyta 10 243 3.3
Chroococcus sp. Cyanophyta 3 73 1
Microcystis sp. Cyanophyta 2 49 0.7
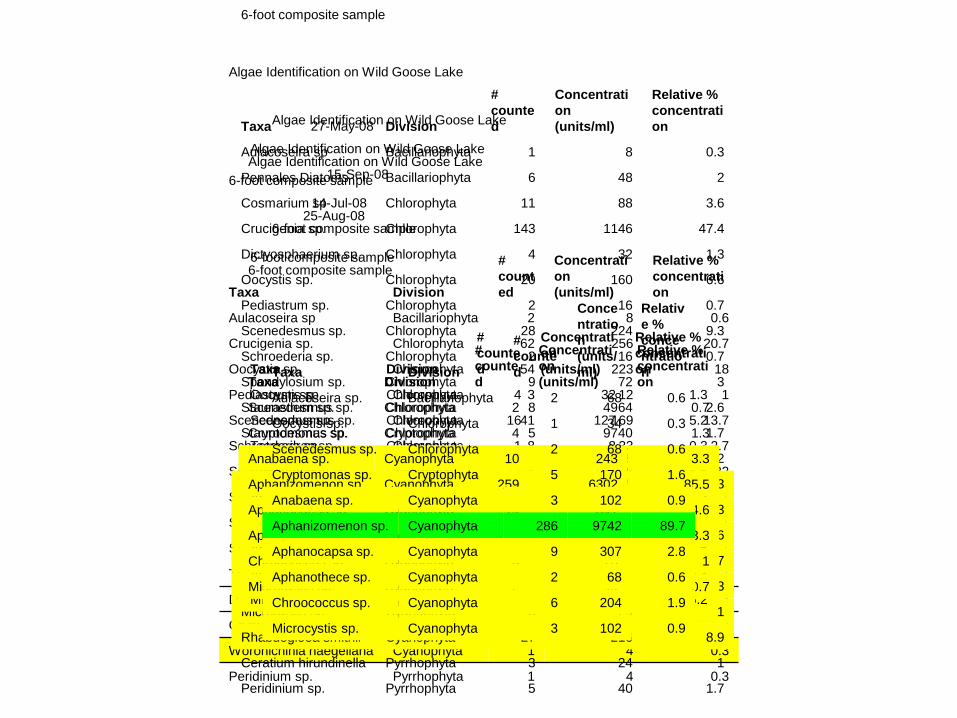
Algae Identification on Wild Goose Lake
15-Sep-08
6-foot composite sample
Taxa Division
#
counte
d
Conce
ntratio
n
(units/
ml)
Relativ
e %
conce
ntratio
n
Aulacoseira sp. Bacillariophyta 2 68 0.6
Oocystis sp. Chlorophyta 1 34 0.3
Scenedesmus sp. Chlorophyta 2 68 0.6
Cryptomonas sp. Cryptophyta 5 170 1.6
Anabaena sp. Cyanophyta 3 102 0.9
Aphanizomenon sp. Cyanophyta 286 9742 89.7
Aphanocapsa sp. Cyanophyta 9 307 2.8
Aphanothece sp. Cyanophyta 2 68 0.6
Chroococcus sp. Cyanophyta 6 204 1.9
Microcystis sp. Cyanophyta 3 102 0.9
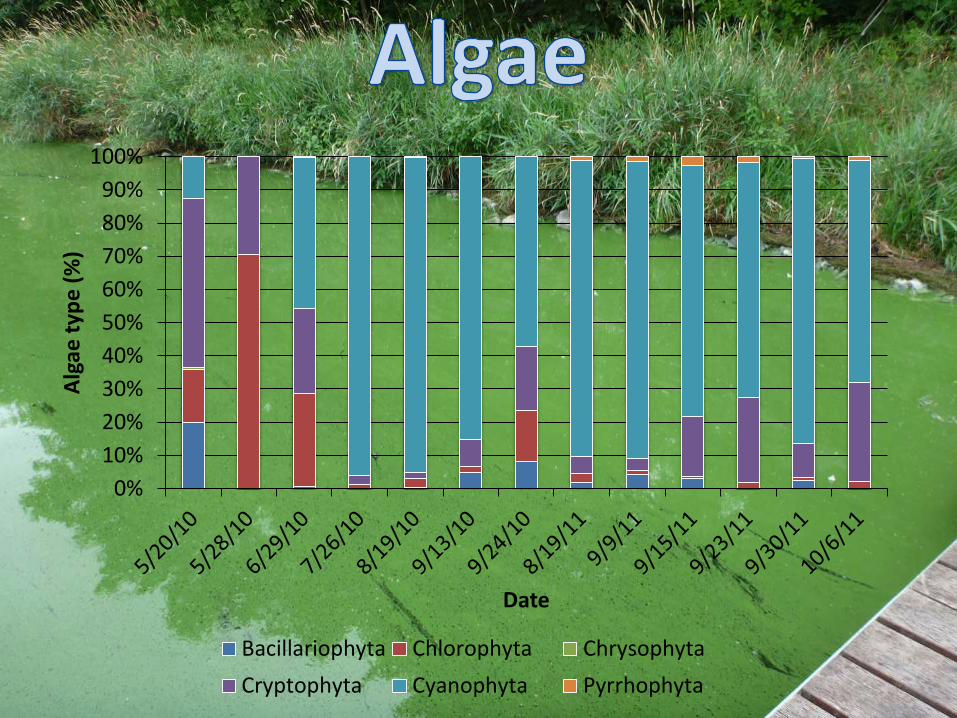
0%
10%
20%
30%
40%
50%
60%
70%
80%
90%
100%
Alg
ae t
ype
(%
)
Date
Bacillariophyta Chlorophyta Chrysophyta
Cryptophyta Cyanophyta Pyrrhophyta
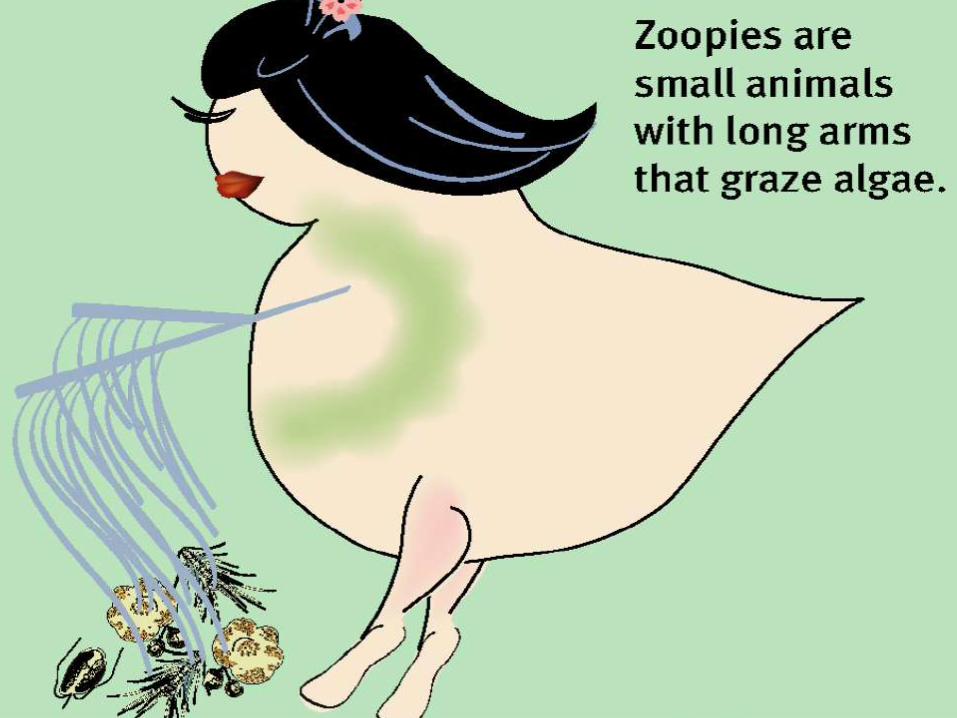

• Population can change daily
• Indication of fish community
• Greatly affected by algae composition
• Could be a good indicator of lake recovery
• Ephippia remain viable for decades


Trichotria sp. 0 0 0 0 0 0 0 0 0
0
0
Nauplii (not counted in richness) 151 520.95 0 26 36 37
Calanoid nauplius 3 7 10 34.5 5 2 1
Cyclopoid nauplius 4 59 78 141 486.45 21 34 36
0
COPEPODA total 100 345 0 20 23 38
Calanoid total 13 44.85 0 0 4 3
Cyclopoid total 87 300.15 0 20 19 35
0
Cryptocyclops sp. 0 1 2
Cyclops sp. 0 1 1
Diacyclops sp. 5 9 14 48.3 1
Diaptomus sp. 4 2 3 9 31.05 4 3
Epischura lacustris 1 3 4 13.8
Microcyclops sp. 32 12 28 72 248.4 19 17 32
Paracyclops sp. 1 1 3.45
Thermocyclops sp. 0
0
CLADOCERA total 31 106.95 0 12 11 13
0
Bosmina/Eubosmina spp. 0
Ceriodaphnia sp. 0
Daphnia spp. 31 106.95 0 12 11 13
Daphnia ambigua 0 2 5
Daphnia galeata mendotae 1 7 20 28 96.6 6 3 5
Daphnia laevis 0
Daphnia lumholtzi 0 1
Daphnia pulex 3 3 10.35 2 3 2
Daphnia rosea 0 3 3 1
Diaphanosoma spp. 0 0 0 0 0 0
Diaphanosoma bergei 0
Diaphanosoma brachyurum 0
Holopedium gibberum 0
Sida crystalina 0
0
ARTHROPODA 0

Wild Goose Lake, 2008
0
200
400
600
800
1000
1200
27
-May
-08
10
-Ju
n-0
8
24
-Ju
n-0
8
8-J
ul-
08
22
-Ju
l-0
8
5-A
ug-
08
19
-Au
g-0
8
2-S
ep-0
8
# /
m3
Rotifera
Copepoda
Cladocera

Zooplankton Total Sample Concentration
0
200
400
600
800
1000
1200
1400
5/23/2005 6/12/2005 7/2/2005 7/22/2005 8/11/2005 8/31/2005
Zoopla
nkto
n (
anim
als
/L)
0
10
20
30
40
50
60
70
80
90
100
BG
and C
hl a
Zooplankton Blue Green Algae Relative Conc (%) Chlorophyll (ug/L)


Floristic Quality Index
NCI
(Nichols, 1999)
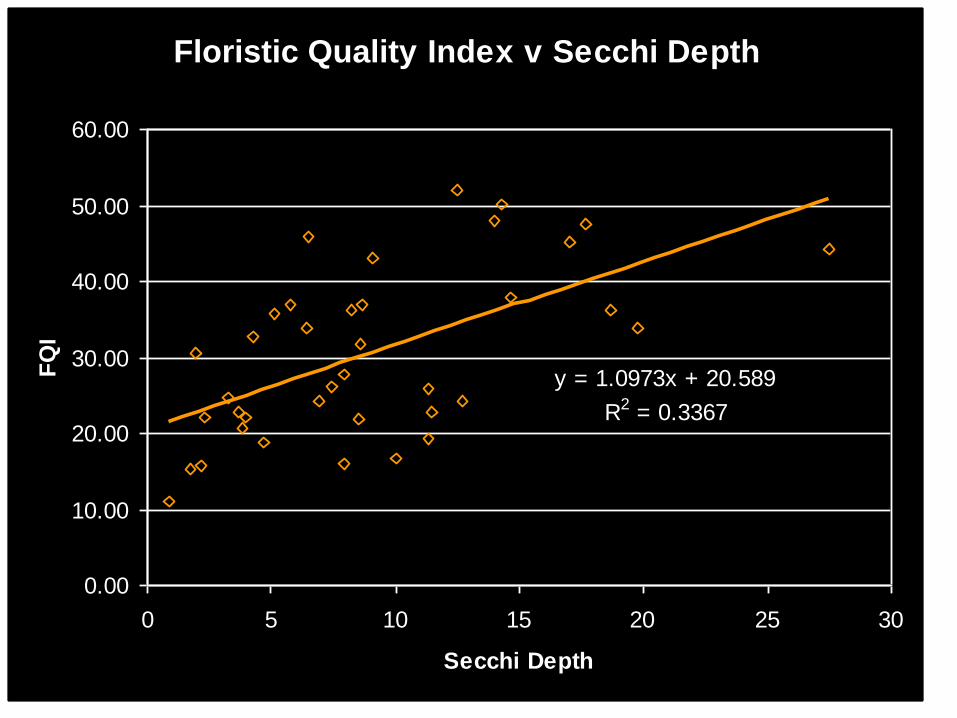
Floristic Quality Index v Secchi Depth
y = 1.0973x + 20.589
R2 = 0.3367
0.00
10.00
20.00
30.00
40.00
50.00
60.00
0 5 10 15 20 25 30
Secchi Depth
FQ
I

Floristic Quality Index v TP
y = -0.1029x + 34.936
R2 = 0.2212
0.00
10.00
20.00
30.00
40.00
50.00
60.00
0 50 100 150 200 250 300
TP
FQ
I

Floristic Quality Index v Chl a
y = -0.1609x + 33.73
R2 = 0.1765
0.00
10.00
20.00
30.00
40.00
50.00
60.00
0 50 100 150 200
Chl a
FQ
I


Hard Surface 7%
Landscaping 4%
Lawn 31%
Bare Soil 1%
Natural 57%
Big Lake Shoreline Buffer Composition


Row Crop 46%
Mixed Ag 2%
Pasture/Grass
9%
Medium Density
Residential 6%
Rural Residential
7%
Wetlands 2%
Forest 17%
Lake 11%
Land Use in the Long Lake Watershed

Reckhow 1977 Lakes < 50 meters model:
Nurnberg total phosphorus model: where
Osgood Lake mixing index:
Essentially all models are wrong, but some are useful. - George E. P. Box

• Chemical suite much like lakes
• Flow reading taken every foot
– Determines volume
– Volume x concentration = discharge
• Important to calibrate models

Using sediment cores
Element Source Analysis location
Core Dating
Core interpretation -record of ecological change -timing and magnitude -quantitative reconstruction of feeding groups
210Pb From natural radium minerals
SCWRS
137Cs Atmospheric tests of nuclear bombs
SCWRS
14C Cosmic rays hitting earth’s atmosphere
Arizona
Core Analysis -biogeochemical -biological, algae, chironomidae -sediment character -etc.

Whole system reconstruction: • Diatoms (WA nutrient inferences; littoral-pelagial
production)
• Pigments: non-siliceous algae (HPLC)
• Zooplankton - fish and trophic interactions
• Chironomids (maybe) - benthic and littoral dynamics
• Macrophytes - plant macrofossils
• Geochemistry - nutrient cycling
• Mineral magnetics - terrestrial inputs

Nutrients
Diatom-inferred TP
Response
Algal production and
composition
sedimentary pigments
Fish communities
Zooplankton-inferred fish
density
Macrophytes
Macrofossils
Predictors


Diatoms-a powerful tool
-1000s of species worldwide, fast turnover, preserve well -excellent indicators of environmental conditions -method for quantitative reconstruction of enviro variables
Slide courtesy of Mark Edlund

Diatom analysis
Samples taken from near core top to assess modern conditions in lake
Samples taken from below European settlement horizon to assess natural or background nutrient levels in lakes
Apply modern calibration models to fossil assemblages to calculate historical nutrient levels
Slide courtesy of Mark Edlund

The paleo approach 2. -sample many lakes that span environmental gradients -sample modern chemistry -sample surface sediments, analyze modern diatom communities -use ordination techniques, CCA -generate transfer function using weighted averaging regression to estimate species-enviro optima

Lotus Lake
Planktonic Benthic
pre-European settlement
1850-1891
1900-1950
1960-2006
Slide courtesy of Joy Ramstack-Hobbs

1700
1750
1800
1850
1900
1950
2000
2050
10 20 30 40
TP (ug/l)Y
ea
r
Horse Lake
1700
1750
1800
1850
1900
1950
2000
2050
10 20 30 40 50
TP (ug/l)
Ye
ar
Lotus Lake
Slide courtesy of Joy Ramstack-Hobbs

Sediment core imaging, magnetics, and 210-Pb
gamma analysis
core imaging can identify major changes in sedimentation history such as loss of macrophytes or drying of lake beds (paleosols)
peaks in magnetic susceptibility can indicate landuse changes from: -European land clearance -historical lake level changes impact on sediment character
Unsupported levels of 210Pb at or below zero indicate sediments deposited >150 yrs ago, i.e. pre-European settlement
(top of core sectioned in field)
Slide courtesy of Mark Edlund

1700
1750
1800
1850
1900
1950
2000
0.00 0.02 0.04 0.06 0.08
Sediment Accumulation (g/cm2
yr)
lea
d-2
10
ag
e (
yr)
1700
1750
1800
1850
1900
1950
2000
0.00 0.10 0.20 0.30 0.40
Sediment Accumulation (g/cm2
yr)
lea
d-2
10
ag
e (
yr)
Horse Lake Lotus Lake
Sediment Accumulation Rates
Slide courtesy of Joy Ramstack-Hobbs

Altered biological structure and the reconstruction of fish
• How do we get to fish from the sediment record? – directly: fish scales
– indirectly - through zooplankton assemblage structure
– Pigments – grazing indicators
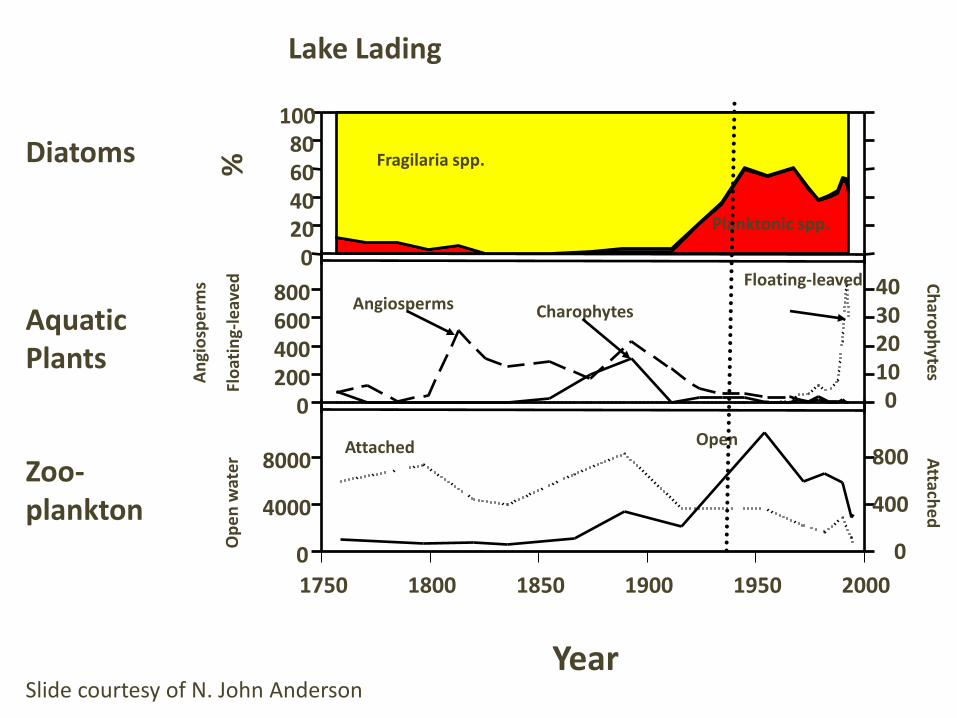
Slide courtesy of N. John Anderson

• Pigments are an important record of non-siliceous algae
• Pigment losses are well studied
• Zooplankton can increase transfer rate
Slide courtesy of N. John Anderson

• Pigment analysis • Pheophorbide as a grazing indicator • Good agreement with %Daphnia – a important grazer (in terms of grazing
rates)
Slide courtesy of N. John Anderson

• Herbarium records
• Sporadic monitoring data
• Natural history observations
Slide courtesy of N. John Anderson
0
20
40
60
80
100
0
200
400
600
800
1750 1800 1850 1900 1950 2000
0
4000
8000
0
10
20
30
40
0
400
800
Lake Lading
%
An
gio
spe
rms
Flo
atin
g-le
aved
Ch
arop
hytes
Op
en
wat
er A
ttache
d
Diatoms
Aquatic Plants
Zoo-plankton
Fragilaria spp.
Planktonic spp.
Angiosperms Charophytes
Floating-leaved
Attached Open
Year Slide courtesy of N. John Anderson

1750 1800 1850 1900 1950 2000
0
100
200
300
400
500
0
50
100
150
200
250
Lake Lading
TP
Fish Plants
Mac
rofo
ssils
nu
mb
ers
/ 1
00
cm3
µ
gTotal p
ho
sph
oru
s/ L
CP
UE P
lanktivo
rou
s Fish
Slide courtesy of N. John Anderson

Floristic Quality v Alkalinity
y = -0.0528x + 30.661
R2 = 0.2472
0.00
10.00
20.00
30.00
40.00
50.00
0 50 100 150 200
Alkalinity
FQ
I

Floristic Quality v pH
y = -5.9621x + 73.918
R2 = 0.2276
0.00
10.00
20.00
30.00
40.00
50.00
6.5 7 7.5 8 8.5 9 9.5 10
pH
FQ
I
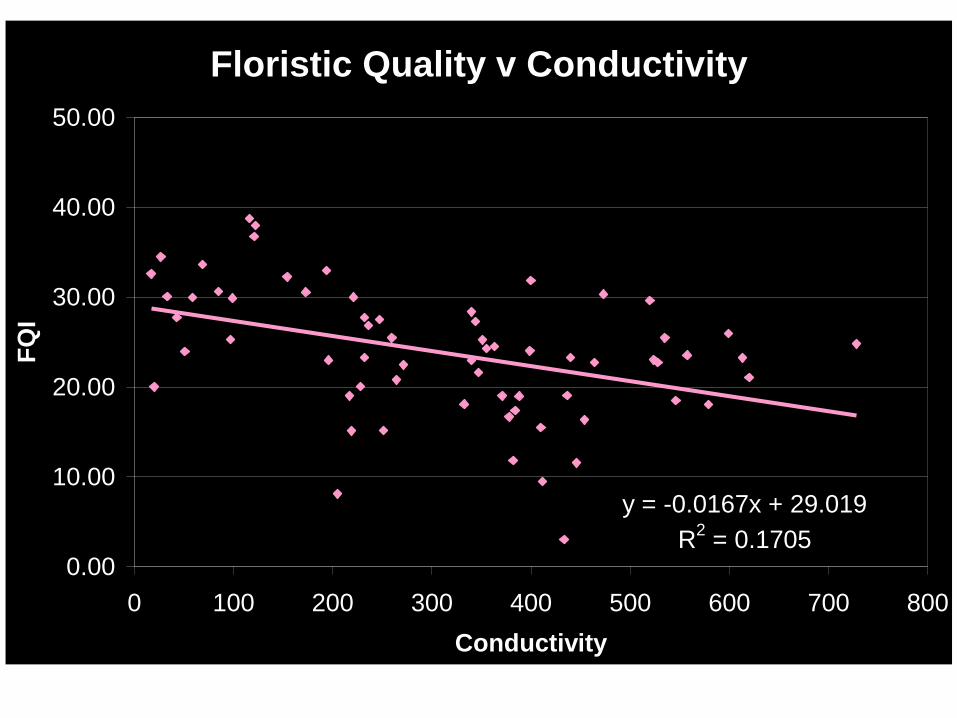
Floristic Quality v Conductivity
y = -0.0167x + 29.019
R2 = 0.1705
0.00
10.00
20.00
30.00
40.00
50.00
0 100 200 300 400 500 600 700 800
Conductivity
FQ
I