Embed Size (px)
Citation preview

COLLAR: Collaborative Activity Recognition for
Realistic Multiverse Game1
Technical Report
Version 1.0
Ubiquitous Computing Lab Kyung Hee University
July 2009
Approved by
Project Supervisor
Date
1Hung Q. Ngo, La The Vinh, Pham The Dung, Manhyung Han, Kyoho Koo, Hyun-Mak Jin, Dong-Jin, Lim, Sungyoung Lee, and Young-Koo Lee.

‐2‐
Table of Contents
1 Introduction.................................................................................................................................................... 3
1.1 Motivation .............................................................................................................................................. 3
1.2 Approaches ............................................................................................................................................. 4
2 Related Work .................................................................................................................................................. 6
2.1 Augmented artifacts ................................................................................................................................. 6
2.2 Robotics .................................................................................................................................................. 6
2.3 Wireless Sensor(/actuator) networks ......................................................................................................... 7
3 Our Experience in Developing Standalone Activity Recognition Systems .............................................................. 9
3.1 Wearable Accelerometer‐based AR Using Semi Markov Conditional Random Fields ...................................... 9
3.2 Video‐based AR: Estimation of 3‐D Human Body Posture via Co‐Registration of 3‐D Human Model and Sequential Stereo Information ............................................................................................ 12
3.3 DISTIN: Distributed Inference and Optimization in Large‐Scale Networks .................................................... 17
4 COLLAR: A Framework for Ad‐hoc Spontaneous Collaborative AR ...................................................................... 22
4.1 Infrastructure‐based or Infrastructure‐less? ............................................................................................. 22
4.2 The requirements for a Collaborative AR system ....................................................................................... 23
4.3 A Distributed Hypothesis Testing Approach to Collaborative AR ................................................................. 23
4.4 Initial Results ......................................................................................................................................... 25
5 Conclusion .................................................................................................................................................... 26
6 References .................................................................................................................................................... 27

‐3‐
1 Introduction
1.1 Motivation
The increasing demand on public healthcare service due to the aging population has become a major problem in developed countries, driving a need to build ubiquitous healthcare systems. In such systems, activity recognition (AR) is an indispensable component. By analyzing human’s activity, much useful information about human’s health condition could be extracted. According to gerontologists, identifying everyday activity such as sleeping, food preparation, housekeeping, entertainment, and exercise is often more valuable than biometric information for the early detection of emerging physical and mental health problems ‐ particularly for the elderly.
Besides novel applications in life‐care systems, AR systems can also provide more realistic and enjoyable behaviors of the gamers in ubiquitous gamming. Current entertaining applications have not made use of AR technologies to provide more enjoyable and interactive games. Gamers still have to pay too much attention on the keyboards or joystick to react to the game challenges. With an AR‐based gamming, the gamer can actively play as if he is on a real playground, with the story adapted to his guestures or movements. It is also more healthier for the player since he can move all parts of his body instead of sitting on the chair moving his fingers hours after hours.
The practical benefits, the scientific complexity, and the speed and price of current hardware have intensified the effort within the research community towards automatic capture and analysis of human activity. This is evident by looking at the number of publications, special sessions/issues at the major conference/journals as well as the number of workshops directly devoted to such topics. However, there are several drawbacks of the existing work in AR systems, such as i) There are no current widely accepted activity recognition techniques; ii) Current approaches are limited to a number of simple activities such as walking, running, standing; iii) Activity recognition accuracy is not very high; and iv) No efficient way to setup a home for activity recognition
The collaborative activity recognition (COLLAR) is a topic of much current interest. By enabling collaborative AR between standalone systems, we are able to i) incorporate different AR tcheniques into a common framework; ii) infer higher level of activities and situations, from the consensus between collaborative AR systems in the environment; iii) increase the accuracy and timeliness of the inferred situation/activity through such consensus; and iv) efficiently and dynamically setup the AR system without establishing the infrastructure e.g. the backend servers. The existing challenges in collaborative AR are the dynamic, ad‐hoc spontaneous nature of the system, real‐time requirements for emergency response, and the robustness and accuracy in the detected situations. A formal method to support collaborative AR in different applications, in an efficient and distributed manner, must be developed.
To further motivate the necessity of our collaborative AR work, consider three sample application scenarios as follows. In the first scenario, a user wears different types of sensors including bio sensors to monitor body temperature, heart beats and blood pressure, etc. Her shoes and wrist are also equipped with motion sensors. In case there is a heart attack, the bio sensors can collaborate with the motion sensors to further enhance the recognition of the situation. In the second scenario, the living space is equipped with several cameras, and user is also wearing some sort of accelerometer‐based sensors. The collaboration can be initiated between the cameras, or between the cameras and the wearable sensors, right after each system detects the fall of the user, so as to enhance the detection result. In the third scenario, users carry their handheld devices when participating in social activities. The devices, acting as an activity logging, infer such kind of social interactions by collaborating with one another. By analyzing such kind of historical data, physician can detect early cognitive decline and suggest treatments.

‐4‐
Sample Application 1: Detect a heart attack by the collaboration between bio sensors and accelerometer‐based sensors
Sample Application 2: Detect the fall of elderly people by the collaboration between video‐based sensors and accelerometer‐based sensors.
1.2 Approaches
In general, a collaborative activity recognition system is a system that comprises a group of entities capable of sensing, inferring, and actuating that communicate their locally inferred activity to their neighbors (defined by communication range or scope of the application) in order to achieve a more accurate/reliable summary of the situation. Note that we presume that AR entities within a certain area have common views of the situation and can agree on a time‐ and space‐ dependent collaborative context through short‐range communication.

‐5‐
The collaboration among smart entities may not only be based on communicating contextual information but also sensed and fused data in addition to possible next actions to perform. Moreover, collaborating components can follow a consensus‐based or a consensus‐free approach in which negotiated decisions or local decisions are taken respectively. Consensus‐free — entities may need to take local decisions hence they do not negotiate a common decision and communicate different information, i.e., sensory data, fused information, context/sub context and next action(s) in order to aid this local decision making. Consensus‐based—a system/sub‐system may need negotiated outcomes, consequently entities are compelled to communicate different information in order to take a common decision. A hibrid of these two resulted in an ad‐hoc spontaneous approach, in which the entities dynamically establish collaborative AR groups to first agree on a common situation, then decide on their own their individual situation by comparing their local decision with the overall agreement.
In the illustrated figure above, we have two simple situations: IN or OUT of a room with an on‐going meeting or seminar. In subfigure A, the consensus between entities n1 to n8 (e.g., smart phones, projector, audio‐visual sensors) allow them to infer that their users are participating in a presentation, thus the phones should switch to vibration mode. When a user gets out of the room as in subfigures B, C, and D, his smart phone forms a new collaborative group to reach a consensus that the user is now e.g. on the corridor.
The proposed AR framework in this technical report consists of three main modules, namely video‐based AR, accelerometer and physiological‐based AR, and collaborative AR. Key functions of the video‐based human activity recognition module consist of detection of interesting moving person(s), tracking of such person(s) from frame to frame, and analysis of subject tracks to recognize their behavior. The accelerometer‐physiological based AR supports robustness in AR as well as determining micro‐behaviors and social activities. Micro‐behavior recognition will enable the development of persuasion techniques. The collaborative AR framework leverages the representation and inference power of consensus‐based DHT mechanism to allow the collaboration between desperate AR systems to enhance the accuracy of the inferred activities and situations.

‐6‐
2 Related Work
In this section we briefly survey existing projects that support collaborative context recognition. These projects can be classified into three subcategories based on their application domains, including augmented artifacts, multirobot, wireless sensor and actuator networks (WSAN), and activity recognition (AR).
2.1 Augmented artifacts
One of the best‐known projects in the augmented artifacts domain is Smart‐Its [11] which was part of the EU‐funded Disappearing Computer Initiative. The idea behind the project is to develop smart small‐scale embedded devices known also as Smart‐Its that are able to sense, actuate, compute and communicate. These smart devices are introduced to help develop and study collective context awareness and increase the widespread deployment of ubiquitous computing systems [12].
The intercommunication of Smart‐Its is based on a stateless peer‐to‐peer protocol where local broadcast of context and other information within a certain proximity is supported, (i.e., a direct communication scheme) [11]. The generic nature of Smart‐Its enables them to form different kinds of systems, e.g., common goal‐oriented systems that might implement a consensus‐based and/or a consensus‐free approach.
Another related project is Cooperative Artifacts [15]. The concept is based on an infrastructure‐less approach to allow easier deployment of these artifacts when cooperatively assessing specific situations in the environment. The cooperation among artifacts is solely based on sharing their knowledge through protocol‐based direct communication. The knowledge base in each artifact comprises three types of knowledge; domain knowledge, observational knowledge and inferred knowledge. In an artifact, facts are defined as “the foundation for any decision‐making and action‐taking within the artifact”, while rules allow inference of advanced or upgraded knowledge based on facts and other rules [15]. Key knowledge is inferred knowledge that is the knowledge inferred from previous facts. These facts are based on the previously mentioned three local types of knowledge and/or the knowledge shared by cooperating artifacts. These artifacts cooperate by sharing a knowledge base through a query/response technique. It is worth mentioning that there are also actuation rules that are responsible for triggering a corresponding action. In one application [15], a group of chemical containers were modelled as Cooperative Artifacts equipped with infrared light sensors and ultrasonic sensors to ensure that all artifacts (containers) are within an approved safety area and that certain artifacts stay within an acceptable distance of each other. Actuation is simplified in this application to the control of LEDs to raise an alarm if safety constraints are not met. Clearly, each Cooperative Artifact is capable of sensing, perception (fusion), inference, actuation, direct communication and sharing of the knowledge.
2.2 Robotics
The robotics domain is a very important source of inspiration for collaboration schemes and context‐aware systems. In this section, we discuss a number of robotic systems that emphasise their collaboration aspects. In the cooperative sensing field, Grocholsky et al. [10] propose a scheme for anonymous cooperation in robotic sensor networks. The scheme involves a decentralized architecture that enables entities to globally and anonymously cooperate in sensing without the need for global knowledge. The idea is based on a Decentralised Data Fusion (DDF) algorithm. The DDF is seen as a decentralised alternative approach to the typically centralised Kalman filtering and Bayesian estimation techniques. It provides means for fusing information in a distributed network of sensors. Moreover, a DDF node depends on data gathered from a group of sensors to generate estimates of sometime varying state that may then be propagated. Aggregation of information in a single node is the fusion of local sensor data, local predictions and the directly communicated information (estimates) from other nodes. Based on this fused information, a subsequent decision is taken locally by the node.
The authors break what they describe as Anonymous Collaborative Decision Making into a coordinated and cooperative solutions providing definitions for both. They perceive a cooperative solution “to be a predictive jointly optimal negotiated group decision in the sense of a Nash equilibrium” [10]. On the other hand, “in coordinated solutions there

‐7‐
is no mechanism for this negotiated outcome. Decision makers act locally but exchange information that may influence each others’ subsequent decisions” [10]. Cooperative and coordinated solutions can be seen here as a consensus‐based and a consensus‐free solutions respectively. Furthermore, nodes/robotic sensors communicate directly and propagate their information in the whole network.
Millibots [19] is a research project at the Robotics Institute in Carnegie Mellon University that, as the name conveys, has designed “a team of heterogeneous centimetre‐scale robots which coordinate to provide real‐time surveillance and reconnaissance” [19]. This collaboration is defined as “the explicit exchange of information between members of a team”, this is clearly done using direct communication. Also, collaborative sensing is presented as being “where the sensing process itself is distributed between one or more robots”; this view is believed to be a consensus‐free one that does not involve negotiated decisions. One of the interesting applications of the Millibots team is collaborative mapping, i.e., team members are able to collaborate to collect and fuse sensory information (based on a Bayesian technique) in order to create a map of the encompassing area.
Parunak et al. [20] provide their view of collaborative sensing through swarming of multiple Unmanned Aerial Vehicles (UAV) noticeably for military imaging applications. They define different types of coordination that can occur within a group of UAVs: spatial, temporal, and team coordination. Spatial coordination is concerned with efficiently distributing UAVs over an observed area while temporal coordination ensures the timeliness of all UAVs’ behaviour and information exchange. Team coordination is basically inspired from natural systems (e.g., colonies of social insects), and aims at optimising distribution of roles among UAVs and managing their formation, maintenance and dispersion. There are three principles and techniques that are needed to achieve collaborative sensing in this context. First is team and role coordination which comprises dynamic entity classification and dynamic role activation. The dynamic classification enables adding or removing roles to or from an entity while dynamic activation enables changing roles over time within an entity. Second is local optimisation where each UAV is assumed to make local decisions (i.e., consensus‐free), in order to accomplish the overall designated mission on time, i.e., UAVs are capable of reconfiguration based on their perceived quality in which the goal is achieved, for example the image quality. Third are the techniques inspired from natural systems, for instance, stigmergy [17]. Basically, the scheme described employs the idea of digital pheromones from which maps are formed to enable real‐time path planning.
2.3 Wireless Sensor(/actuator) networks
The CoSense project [22, 23] developed in the Palo‐Alto Research Centre (PARC), has aimed at providing a collaborative sensing scheme for target recognition and condition monitoring. Moreover, the focus is on energy‐constrained environments filled with low‐observable targets. An energy‐efficient sensor collaboration is presented in [22, 23]. This collaboration is information‐driven, i.e., which dynamically determines who should sense, what to sense and to whom the sensed information must be passed. An assumption is made that each sensor has its communication and local sensing range. Furthermore, a sensor node is assumed to have local estimation capabilities of the cost of sensing, processing, and direct data communication to another node in terms of its power usage. The Information‐Driven approach subsequently enables each sensor node to efficiently manage its communication and process resources. This entails that sensor selection is based on a local decision thus exhibiting a consensus‐free approach. Also, a leader node holds the current belief and receives all passed information for fusion for a certain period of time. This leader node may then act as a relay station. Otherwise, the belief can travel through the network where the leadership is changed dynamically.
From the prominent projects reviewed above, we make a comparison table contrasting our current direction in COLLAR with those related work, and highlight the differences of our approach. As illustrated, our framework is more flexible allowing an infrastructure‐less approach to building AR system, and is the first to address the needs for ad‐hoc spontaneous mechanism for collaborative AR.

‐8‐
Project Domain Approaches
Augmented Artifacts
Robotics WSAN AR Consensus‐free
Consensus‐based
Adhoc Spontaneou
Smart‐Its o o o o
Cooperative Artifacts o o o
Anonymous collaborative decision making
o o o o
Millibots o o
UAV collaborative sensing
o o
Cosense o o
COLLAR o o o o o o o
Table 1: Comparison of existing work in collaborative context recognition.

‐9‐
3 Our Experience in Developing Standalone Activity Recognition Systems
In this section we provide our experience in building standalone systems for AR through the finished and on‐going research projects. We also describe our previous work in developing distributed optimization and consensus algorithms for large‐scale networks.
3.1 Wearable Accelerometer‐based AR Using Semi Markov Conditional Random Fields
Because of its great application, activity recognition is gaining more and more attention of researchers. While there is a variety of approaches such as using video [16], deployed sensors [6], many researchers prefer accelerometer and gyroscope sensors thanks to their low cost, low power requirement, portability, and versatile characteristics. This is the reason why in our research we also use accelerometers as the input for the activity recognition system.
We apply the semi‐Markov Conditional Random Fields (semiCRF) [21] for our AR system. Futhermore we propose a novel algorithm which helps to reduce the complexity of training and inference by more than 10 times in comparison with the original work. In our model, we assume that
are the input signal and input label respectively. Our goal is to optimize the model parameter so that P(Y|X) is maximized. Making use of semi‐Markov conditional random fields, we present here a block diagram of our recognition system as in following figures.
Figure 1 Quantization module

‐10‐
Figure 2 Recognition Module
In our experiment, we use WiltiltV3 sensor to collect totally about 80 hours of daily activities including 4 expected routines: Dinner, Commuting, Lunch, Office work, the sampling rate is 20Hz, however after that we down the sampling rate to about 2.5 Hz in order to reduce the computation load. An example of our data collection tools on Pda is presented in the following picture.
Figure 3 Data Collection Tool
Table 1 Low level activities occurring during the routines.
In our experiments, we use an available dataset of longterm activities, which has been published at http://www.mis.infor matik.tu‐darmstadt.de/data. Then we demonstrate our result in comparison with the original one. Here we briefly describe the dataset, more details can be found in [?]. The dataset contains 7 days of continuous data

‐11‐
(except the sleeping time), measured by two triaxial accelerometers, one at the wrist and the other in the right pocket. The sensor's sampling frequency was set at 100Hz. Nonetheless, in the published dataset the author calculated the mean value of every 0.4s window, therefore the actual sampling frequency was approximately 2.5Hz. Totally, it has 34 labeled activities of which a subset of 24 activities occurred during the routines. Table 1 lists all the annotated activities, which are then grouped into 5 daily routines as can be seen in table 2.
Table 2 Daily routines
Table 3 Recognition result
In the experiment, we use a 50%‐overlapped‐sliding window, which has a length of 512 samples (about 3.41 minutes). Within the window, mean, standard deviation and mean crossing rate are extracted from each signal, after that these values are combined with time of frame to form a feature vector. Finally, we use leave‐one‐out cross validation rule to measure the result of recognition as can be seen in table 3. Figure 6 demonstrates an example of recognition result together with the ground truth. Obviously, our result shows a remarkable improvement in comparison with the achievement of [10] and [3], except dinner routine which has a lower precision and recall rate than those of [3], with 3 other routines undoubtedly we obtain better results. Since we use similar features (mean, standard deviation, time) as the original work, the improvement can be explained as the result of taking into account the inter‐relationship together with the duration of activities. The parameter value after training point out that the model pushes a penalty on each transition by a negative value of weight. In Table 4we present an example of transition matrix after training. It can be seen that the potential of most likely transitions such as "office work ‐ lunch", "commuting ‐ dinner" or "lunch ‐ office" is always the highest to encourage the prediction of these events. In addition to the accuracy, our solution also has a practical training time when it takes about 2 hours of training with totaly about 72 hours of data in a system with CPU Intel Dualcore 1.83GHz, 512 MB RAM. Evidently, we proposed an efficient algorithm making semi‐CRF a practical model for scalable activity recognition.
Table 4 Transition weights.
‐12‐
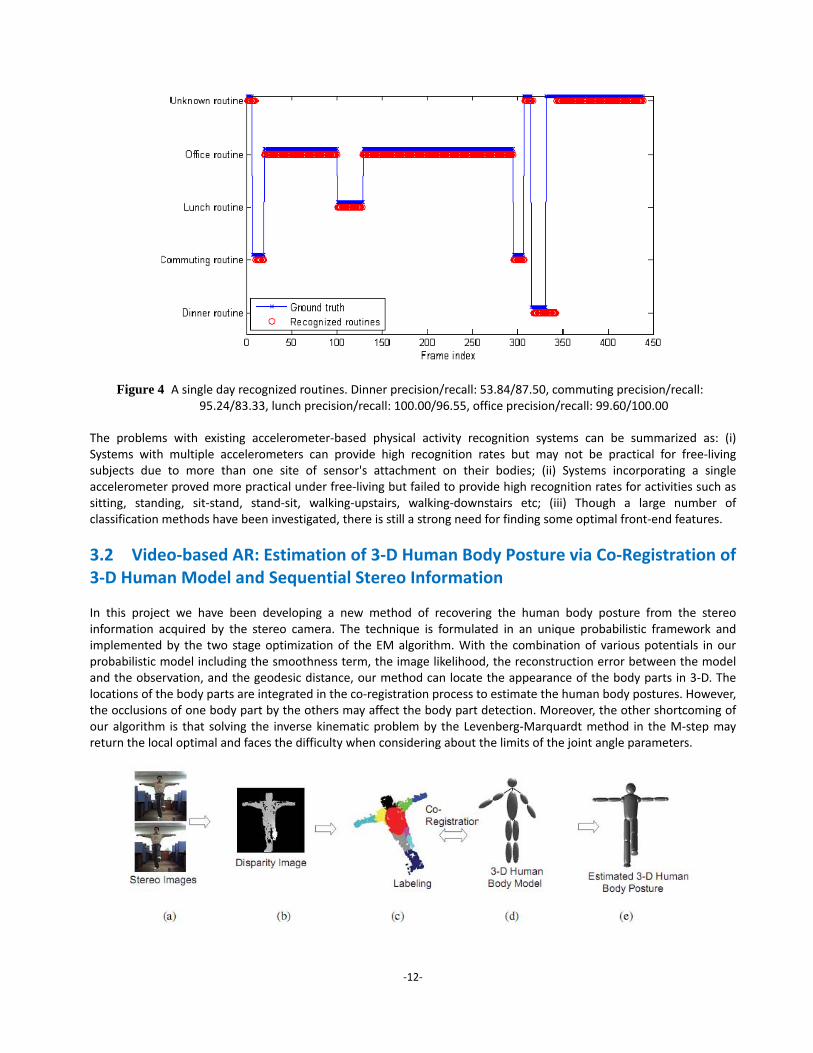
Figure 4 A single day recognized routines. Dinner precision/recall: 53.84/87.50, commuting precision/recall: 95.24/83.33, lunch precision/recall: 100.00/96.55, office precision/recall: 99.60/100.00
The problems with existing accelerometer‐based physical activity recognition systems can be summarized as: (i) Systems with multiple accelerometers can provide high recognition rates but may not be practical for free‐living subjects due to more than one site of sensor's attachment on their bodies; (ii) Systems incorporating a single accelerometer proved more practical under free‐living but failed to provide high recognition rates for activities such as sitting, standing, sit‐stand, stand‐sit, walking‐upstairs, walking‐downstairs etc; (iii) Though a large number of classification methods have been investigated, there is still a strong need for finding some optimal front‐end features.
3.2 Video‐based AR: Estimation of 3‐D Human Body Posture via Co‐Registration of 3‐D Human Model and Sequential Stereo Information
In this project we have been developing a new method of recovering the human body posture from the stereo information acquired by the stereo camera. The technique is formulated in an unique probabilistic framework and implemented by the two stage optimization of the EM algorithm. With the combination of various potentials in our probabilistic model including the smoothness term, the image likelihood, the reconstruction error between the model and the observation, and the geodesic distance, our method can locate the appearance of the body parts in 3‐D. The locations of the body parts are integrated in the co‐registration process to estimate the human body postures. However, the occlusions of one body part by the others may affect the body part detection. Moreover, the other shortcoming of our algorithm is that solving the inverse kinematic problem by the Levenberg‐Marquardt method in the M‐step may return the local optimal and faces the difficulty when considering about the limits of the joint angle parameters.

‐13‐
Figure 5 Our proposed methods of estimating 3‐D human body posture from stereo images. (a) A set of stereo images. (b) Estimated disparity image. (c) Labeling the body parts of the 3‐D data. (d) Fitting the 3‐D model with the 3‐D
data. (e) Final estimated body posture.
We have evaluated our proposed techniques with the simulation and real data.
Experiments with Synthetic Data: For generating the simulation data, we manually define some joint angle trajectories as depicted by the dashed lines in Fig. 6. Only the rotational angles corresponding to the elbow and shoulder joints are tested in our experiments, the values of the other rotational angles are fixed. From the set of angle trajectories, we create a sequence of human poses and their disparity images up to 110 frames. Some samples of the disparity images are picked up and shown in the first and third rows in Figure 6.
We apply our algorithm to recover the human postures from the synthetic disparity images. Due to the simulation data, the cues of RGB images are not available, so we eliminated them from computation. Some samples of the recovered human poses are depicted in the second and fourth rows in Figure 6. To validate our algorithm, we plot the estimated angle trajectories by the solid lines to compare with the synthetic angle trajectories plotted by the dashed line in Figure 7. This figure have shown the good estimation of the kinematic parameters achieved by our method.
Figure 6 The results of recovering postures (second and fourth rows) from the synthetic disparity images (first and third rows). The numbers below each picture indicate the frame index.

‐14‐
Figure 7 Comparison between the estimation and the ground‐truth joint angles (synthetic data) in the simulated experiments. (a) and (b) Two joint angles of the shoulders. (c) and (d) Two joint angles of the elbows.
Experiments with Real Data: The real experiments are implemented with the stereo data acquired from the stereo camera (Bumble Bee 2.0 of Point Grey Research). In Section 2.1, we describe the use of GCS algorithm to extract the disparity images and computing the 3‐D data for each frame. The characters perform some deterministic activities in around 2‐4 meters from the camera to create the video sequences. The reconstructed body poses can be validated by visually checking the trajectories of some rotational angles.
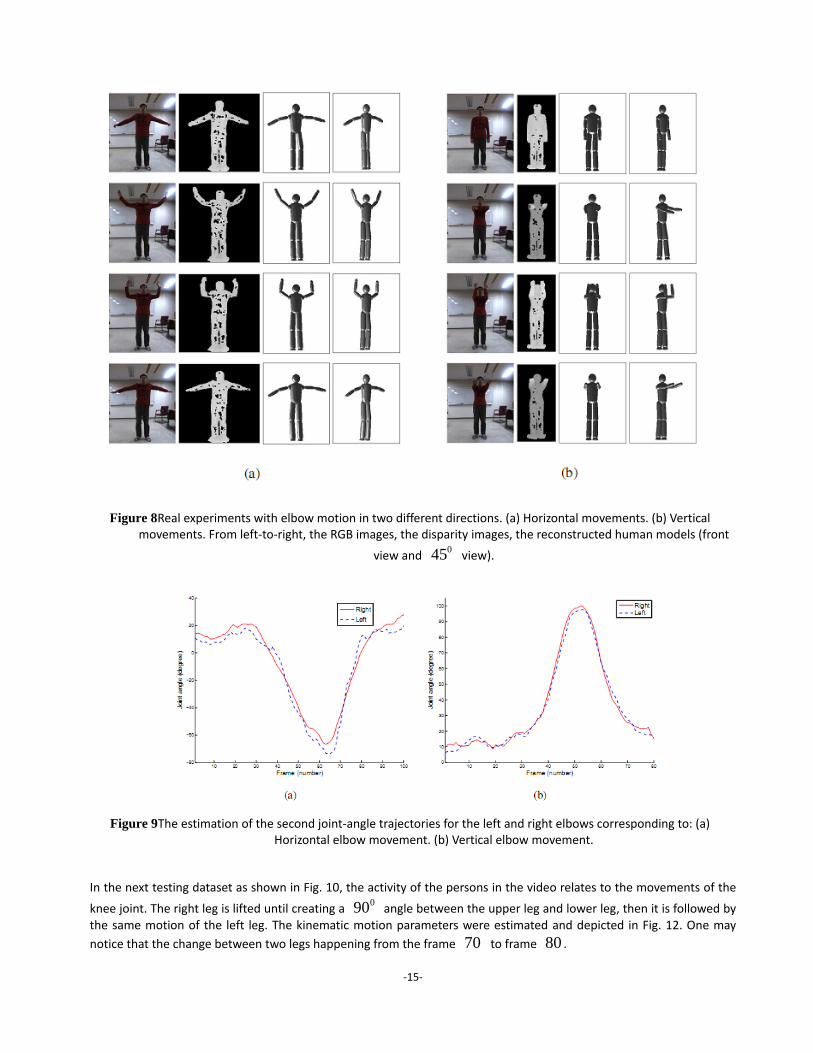
On the first experiment, we test the movements of an elbow on both vertical and horizontal directions as in Figure 8. In each figure, the sequence of activities is illustrated in a video stream from top‐to‐bottom in a column. Observing the
real pictures, the angle changes between the upper arm and the lower arm are approximated to be 090 . In Figure 9,
the recovered values on the second kinematic angles at the joint elbow exactly reflect the arm motion in real data (The elbow angles in real data and in model are supplementary angles). The joint angles may receive positive or negative values, depending on the way that two kinematic angles are combined to orient the arm movements.
‐15‐
Figure 8 Real experiments with elbow motion in two different directions. (a) Horizontal movements. (b) Vertical movements. From left‐to‐right, the RGB images, the disparity images, the reconstructed human models (front
view and 045 view).
Figure 9 The estimation of the second joint‐angle trajectories for the left and right elbows corresponding to: (a) Horizontal elbow movement. (b) Vertical elbow movement.
In the next testing dataset as shown in Fig. 10, the activity of the persons in the video relates to the movements of the
knee joint. The right leg is lifted until creating a 090 angle between the upper leg and lower leg, then it is followed by
the same motion of the left leg. The kinematic motion parameters were estimated and depicted in Fig. 12. One may
notice that the change between two legs happening from the frame 70 to frame 80 .

‐16‐
In order to track the movements of two joint angles, we consider the sequence of activity in Figure 10. Assuming that two rotational angles of shoulder are caused by rotating the whole arms around the z ‐axis and x ‐axis. We can
observer both trajectories of two measured kinematic angles from Fig. 12 with the top curves reflecting the rotational angles by the z ‐axis and the bottom for the rotational angles by the x ‐axis. To explain the meaning of the plot, we
visualize the overall progress in Figure 11. By order, the whole arms are rotated by the z ‐axis from 0180 to
0360
(vertical movement, around frame 1‐45), then around the x ‐axis from 00 to
090 (around frame 45‐60) to
facilitate the horizontal movements. Finally, to expand to left or right side, two arms are continuously rotated around
the z ‐axis 090 and
090 (from around frame 60 to the end).
Figure 10 Real experiments with other motions: (a) Knee movements. (b) Shoulder movements. From left‐to‐right, the
RGB images, the disparity images, the reconstructed human models (front view and 045 view).

‐17‐
Figure 11 The changes of two joint‐angles during the movements of the shoulders (experiment depicted in Fig. 10).
Figure 12 The estimation of the joint‐angle trajectories for the left and right of: (a) Knee movements. (b) Shoulders movement.
Figure 12 shows the results of running our algorithm on free movements. The subjects perform complicated activities with all arms and legs. In here, we only depicts three images out of the sequence and their estimated poses in the two below rows with two alternative views. The location of body parts in 3‐D space and the human poses have been correctly recovered in the outcomes.
Figure 13 A qualitative evaluation of reconstructed human body posture from: (a) A walking sequences. (b) Arbitrary activity sequences.
3.3 DISTIN: Distributed Inference and Optimization in Large‐Scale Networks
In this project we developed efficient distributed algorithms for effective inference, learning and control in large‐scale real‐world distributed systems, such as sensor networks. These algorithms must perform the global inference and optimization tasks required by sensor network applications, while being robust to network losses and failures, and limiting communication and power requirements. In addition to developing theoretically‐founded algorithms, we seek to evaluate these methods on data from real sensor network deployments, and to implement some of these approaches on real deployed systems. Our efficient method is leveraged by representation and inference approaches from probabilistic graphical models, and by novel networking and message passing algorithms.
Our research results include two major parts. We first develop a distributed algorithm for solving the facility location

‐18‐
problem in wireless sensor networks (WSNs). This optimization problem is important to study since it captures many important application scenarios in WSNs, involving effective approach to hierarchically organizing network topology for efficient data aggregation, distributed event detection, estimation, localization, and tracking. We present our novel message‐broadcast algorithm derived using factor graph and message‐passing approach, to solve the distributed facility location problem efficiently. Next, we solve the problem of gathering correlated data in WSNs using cluster‐based approach. This is well‐known as a killing‐application and an indispensable building block for decision‐making tasks in WSNs. The application is formulated as a distributed facility location problem, so that we can apply our proposed message‐broadcast protocol to solve. We also analyze the trade‐offs between minimizing energy‐cost and balancing the loads between nodes in the network.
Min‐Sum Message‐Broadcast Protocol for Distributed Facility Location In this project we have proposed a distributed and localized algorithm for solving the facility location problem in large‐scale WSNs. We show how the facility location problem can be used as means of providing self‐configuration ability to WSNs with the selection of subset of designated nodes as service providers for the remaining nodes. For general network models, it is known that facility location is an NP‐hard problem. There are a variety of algorithms with guaranteed constant approximations in the literature, which can be generally classified into three subcategories based on the techniques applied, including rounding of linear programs, local search heuristics, and primal‐dual methods. However, the quality of approximation, and convergence rate including time and message complexity, are not efficient for a distributed realization in large‐scale WSNs.
An example illustrating valid and invalid configurations in WNSs via behavioral modeling. (a) A toy WSN with (b) a valid configuration and (c) a one‐hop invalid configuration between x2 and x4, which becomes (d) a valid configuration in two‐hop neighborhood setting. Note that a solid arrow indicates client‐‐facility association, and in the last configuration, node s4 sends data to facility node s3 through s2
We first reformulate the facility location as a min‐sum labeling problem. Specifically, we force the algorithm to search for the optimal labeling in a constrained search space containing valid configurations only. This allows us to reduce the time and message complexity in finding the optimal solution. The behavioral modeling approach can be accommodated by a factor graph that represents the characteristic (i.e., indicator) function for the given behavior. Factorizations of this characteristic function can give important structural information about the model. Thus, we use the recent modeling and computational methodology of factor graphs and message‐passing [5], which are very convenient for distributed realization in WSNs, to model and solve the min‐sum labeling problem. Each node in the network uses local information obtained from its neighborhood to calculate, update, and exchange messages with neighboring nodes only. Thus, no message routing mechanisms are invoked. The near‐optimal set of service nodes emerges after a bounded number of

‐19‐
iterations using such simple and localized message‐passing rules (thus named MEPA), in contrast with the random initialization in current heuristics, which may end up with suboptimal solutions. Simulation results show that the MEPA protocol can quickly achieve a good approximation of the minimum cost found by a centralized Mixed Integer Linear Programming (MILP) algorithm using CPLEX optimization package. We also show via simulations that MEPA is very scalable, robust, and adaptive, as a result of the highly localized nature of the algorithm [6,9]. To the best of our knowledge, this is the first time the distributed facility location problem in large‐scale networks is formulated as a min‐sum labeling problem and efficiently solved using the message‐passing approach.
The ratios presented in this figure show that the costs found by BMP quickly converge to the optimal cost, as the number of iterations increases. Specifically, after 6 iterations, BMP can achieve an approximation ratio around 1.1. Moreover, the convergence rate and approximation ratio are fairly identical and consistent for different node density, showing that the BMP protocol is quite scalable.

‐20‐
Cluster‐Based Correlated Data Gathering in Wireless Sensor Networks Our objective is to minimize the total communication cost such that a maximum number of successful data gathering cycles can be achieved until the first/last node dies. We first reformulate the problem of finding a Minimum Cost Hierarchical Architecture (MCHA) as a min‐sum labeling problem. The near‐optimal set of cluster head (CH) nodes emerges after a few iterations using Broadcast MEPA message‐passing rules. Since the CH selection is in favor of nodes with higher residual energy to reduce the reclustering rate which is energy wasted, we provide an analysis on the trade‐off between the residual energy and the communication cost. Through extensive simulations, we can affirm that MCHA is able to effectively prolong the network lifetime, and very scalable, robust, and adaptive, as a result of the highly localized nature of the Broadcast MEPA algorithm [7,8].

‐21‐
For MASEN, we compare our MHCA algorithm with the Minimum‐Energy Gathering Algorithm (MEGA) described [10], which computes a Minimum Spanning Arborescence structure for aggregating raw data at intermediate nodes and a Shortest Path Tree for relaying the aggregated data from intermediate nodes to the sink. Through simulation analysis, we show that our cluster‐based data aggregation approach can achieve good performance in terms of network lifetime and robustness.
For SENMA, we compare our MHCA algorithm with the cost of the Energy Efficient Clustering (EEC) protocol proposed in [11]. Briefly described, EEC finds clusters of nodes in which a node checks if it is a volunteer CH or not probabilistically; if a node is not a CH, it becomes a member node of the closest CH within a maximum of k hops. As we see in the figure above, the performance of MCHA is far better than that of EEC.

‐22‐
4 COLLAR: A Framework for Ad‐hoc Spontaneous Collaborative AR
4.1 Infrastructure‐based or Infrastructure‐less?
Creating context awareness generally follows two main approaches. In self‐supported context awareness such as smart phones, designers build the ability to perceive context, reason with it, and act accordingly into the device or its dedicated hardware support. In infrastructure‐supported context awareness, designers obtain context‐aware capabilities by harnessing a hardware and software infrastructure external to and associated with the device’s space. Such an infrastructure might implement the context‐aware behavior of specific objects and devices or act as a general context‐aware infrastructure. An infrastructure can help link inputs from new sensors to new kinds of responsive artifacts, enabling context‐aware behaviors that are even more interesting. One advantage of self‐supported context awareness is reduced dependency on external infrastructure. Other artifacts that users wear or carry, such as smart phones, also benefit greatly from the self‐contained feature of self‐supported context awareness because it requires little change in the object’s appearance or operation. However, implementing self‐supported context awareness poses challenges, including i) embedding sensors unobtrusively, ii) reasoning with the context efficiently and accurately given limited computational resources, and iii) enabling appropriate actions.
The relationship between context‐aware artifacts and the context‐awareness infrastructure. The infrastructure uses a feedback
mechanism to determine the commands it issues and the context information it shares with various artifacts.
On the other hand, an infrastructure is more useful for facilitating interactions and function because it acts as a mechanism for detecting, combining, and reasoning with different objects’ disparate context information. Such an infrastructure might consist of middleware running on a dedicated computer and connected wirelessly to various artifacts. In any case, as Marc Langheinrich and his colleagues put it [11], An infrastructure for smart things should not only consist of an architecture to represent objects and events, but also provide various services. Smart things (or their virtual proxies) may need location information, they want to discover services in their physical proximity, and they may want to communicate to other (possibly remote) physical objects.

‐23‐
A context‐aware infrastructure can support single or multiple objects. The above figure offers one perspective on the relationship between a context‐aware infrastructure and a context‐aware artifact collection. The infrastructure first receives the contextual information and, if appropriate, reasons with it. It then either issues commands or feeds contextual information to the application or artifact for appropriate actions (perhaps after its own reasoning). Finally, the application might provide feedback to the infrastructure. Benefits from infrastructure supports may include i) hardware, platform, and language independence; ii) ease of maintenance, in that administrators can change infrastructure linked services, sensors, and artifacts while the system is running; and iii) improved context awareness economics, which involves reaping maximum effect from a sensor. An infrastructure approach supports this by letting different artifacts and applications use the sensor’s data. Moreover, an infrastructure allows computational resource sharing, and it can reason once—such as inferring high‐level situations from raw sensed data—and different artifacts can reuse that reasoning. A supporting infrastructure can synthesize contextual information—that is, unlike a single artifact’s sensors, it can recognize situations using a critical mass of sensory inputs. Various sensors can feed the infrastructure information about the user’s context (using, say, a positioning engine), and the infrastructure can then instruct other artifacts to respond accordingly. Furthermore, because this approach decouples the infrastructure from the artifacts, users can update infrastructures and add new artifacts to an existing environment. Additionally, the infrastructure provides resources for context‐aware capabilities, requiring less of the artifacts themselves. Given two distinctive approaches above, before implementing context awareness, developers should consider the question: How can the system reason with and use context for a particular application given the constraints of cost, reasoning efficiency, timeliness of action, and user intelligibility? Collaborative context, as we already defined, is the context acquired through networking between sensors and higher‐level devices in a pervasive computing environment and can be used to increase the range of context availability and context reliability, thus can be an intermediate solution.
4.2 The requirements for a Collaborative AR system
The basic tasks in collaborative context‐awareness are: context representation; nodes share similar knowledge, context fusion; correlated context obtained from heterogeneous sources is aggregated, context inference; nodes are able to infer new context, thus, deducing additional knowledge about the environment, context dissemination; context is propagated across the network, thus, all nodes are able to share similar interpretation of the environment, and, context reasoning; nodes are able to deduce whether context is reliable and matches certain constraints and requirements. Also, to develop context‐aware applications for smart spaces, designers must integrate perceptual components from various vendors. For instance, perceptual components such as audiovisual processing and multimodal fusion components are integral elements of smart space applications. These components provide information about human actors’ identity, location, activities, and sometimes goals through person trackers, person‐identification components, and other situation identification elements. Perceptual components are usually computationally demanding because they often perform real‐time processing of vast amounts of data. Legacy middleware frameworks facilitate integration of pervasive smart space applications, yet they make no attempt to standardize perceptual component data and interfaces. Also, obtaining context in the absence of a fixed network is complicated due to the unreliability of wireless connectivity. Thus, a node must know how to acquire and share context in dynamic, ad‐hoc environments, both when context is acquired directly from the source or through other nodes in a collaborative manner.
4.3 A Distributed Hypothesis Testing Approach to Collaborative AR
We focus on a Bayesian hypothesis testing problem, which involves a set 1 2{ , ,..., }MH H H H of hypotheses,
along with a known prior probability distribution 0 on H. For activity recognition applications, the set of activities
‐24‐
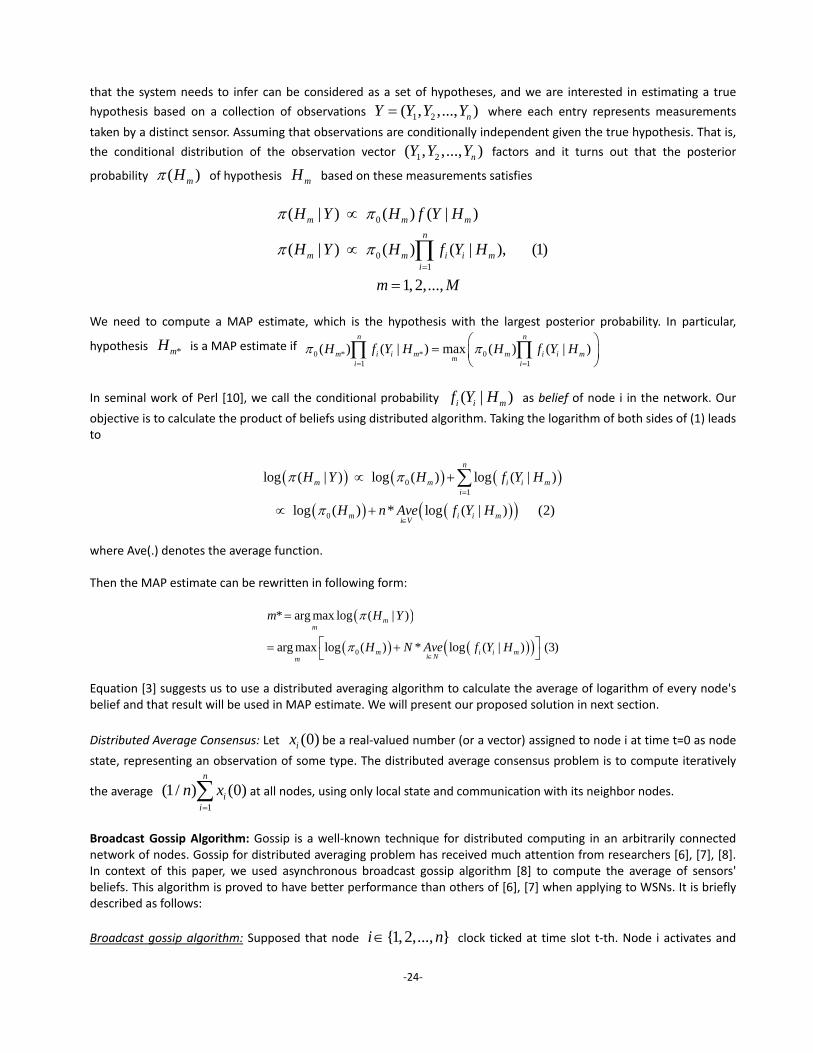
that the system needs to infer can be considered as a set of hypotheses, and we are interested in estimating a true
hypothesis based on a collection of observations 1 2( , ,..., )nY Y Y Y where each entry represents measurements
taken by a distinct sensor. Assuming that observations are conditionally independent given the true hypothesis. That is,
the conditional distribution of the observation vector 1 2( , ,..., )nY Y Y factors and it turns out that the posterior
probability ( )mH of hypothesis mH based on these measurements satisfies
0
01
( | ) ( ) ( | )
( | ) ( ) ( | ), (1)
1,2,...,
m m m
n
m m i i mi
H Y H f Y H
H Y H f Y H
m M
We need to compute a MAP estimate, which is the hypothesis with the largest posterior probability. In particular,
hypothesis *mH is a MAP estimate if 0 * * 0
1 1
( ) ( | ) max ( ) ( | )n n
m i i m m i i mm
i i
H f Y H H f Y H
In seminal work of Perl [10], we call the conditional probability ( | )i i mf Y H as belief of node i in the network. Our
objective is to calculate the product of beliefs using distributed algorithm. Taking the logarithm of both sides of (1) leads to
0
1
0
log ( | ) log ( ) log ( | )
log ( ) * log ( | ) (2)
n
m m i i mi
m i i mi V
H Y H f Y H
H n Ave f Y H
where Ave(.) denotes the average function.
Then the MAP estimate can be rewritten in following form:
0
* arg max log ( | )
arg max log ( ) * log ( | ) (3)
mm
m i i mi Nm
m H Y
H N Ave f Y H
Equation [3] suggests us to use a distributed averaging algorithm to calculate the average of logarithm of every node's belief and that result will be used in MAP estimate. We will present our proposed solution in next section.
Distributed Average Consensus: Let (0)ix be a real‐valued number (or a vector) assigned to node i at time t=0 as node
state, representing an observation of some type. The distributed average consensus problem is to compute iteratively
the average 1
(1/ ) (0)n
ii
n x at all nodes, using only local state and communication with its neighbor nodes.
Broadcast Gossip Algorithm: Gossip is a well‐known technique for distributed computing in an arbitrarily connected network of nodes. Gossip for distributed averaging problem has received much attention from researchers [6], [7], [8]. In context of this paper, we used asynchronous broadcast gossip algorithm [8] to compute the average of sensors' beliefs. This algorithm is proved to have better performance than others of [6], [7] when applying to WSNs. It is briefly described as follows:
Broadcast gossip algorithm: Supposed that node {1,2,..., }i n clock ticked at time slot t‐th. Node i activates and

‐25‐
the following events occur:
1) Node i broadcasts its current state value, ( )ix t over the network.
2) The broadcasted value is successfully received by all neighbor nodes of node i, which are nodes in neighbor set
( )N i .
3) Each node k in ( )N i uses the broadcasted value ( )ix t to update its own state value according to:
( 1) ( ) (1 ) ( ), ( )k k ix t x t x t k N i where (0,1) is the mixing parameter of the algorithm.
4) The remaining nodes in the network, including i, update their state value as ( 1) ( )k kx t x t
Gossip based DHT: We propose a method for solving DHT problem. First, broadcast gossip is used to calculate the distributed averaging of logarithm of sensors' beliefs. Then a MAP estimator combines that result with the prior probability to determine the most probable hypothesis or event. This whole process is called GossipDHT algorithm.
GossipDHT Algorithm: Suppose that each node i has measurement Yi of observed event.
1) Initialization: Each node compute vector of logarithm of conditional probability
(0) log ( | ), 1,...i i i mx f Y H m M
2) Gossiping (broadcast gossip algorithm) to obtain average vector x
3) Each node uses a MAP estimator to find out the most probably event
0* arg max(log ( ) * [ ])mm
m H n x m (4) where [ ]x m is the m‐th element of vector x .
The problem of network size: It is clear that the MAP estimator in equation (3) depends on the number of sensors N. It will be simple if N has been already known; otherwise we have to estimate it. We can use a simple and lightweight
method as follows. Assume it can be ensured that only one node has set (0) 1ix , while all other nodes have set
(0) 0ix at initialization. By using gossip algorithm, each node obtains the average value 1/x n , which is the
reciprocal of the number of nodes.
Especially, in the case of equally prior probability 0 0( ) ( ), , {1,..., }i jH H i j M , we do not need to estimate
the number of nodes because the MAP estimate in (3) becomes the maximum likelihood estimate (MLE):
* arg max log ( | )i i mi Nm
m Ave f Y H
(5)
Therefore (4) reduced to simply form * arg max( [ ])m
m x m
4.4 Initial Results
In our experiment, we implement the belief consensus algorithm [4] and our GossipDHT algorithm. The performance is evaluated in terms of number of rounds for all nodes to compute the exact MAP estimate. We use geometric random graph introduced by Gupta and Kumar [11] to model WSNs. Network connectivity is described by a graph ( , )G V E , which is constructed as follows. The vertex set V is associated with N
sensor nodes uniformly distributed in a square unit area. The edges of the graph correspond to

‐26‐
communication between the sensor nodes. In particular, two nodes are connected if the Euclidean distance between them is smaller than some transmission radius R. It is well-known that the minimum value of R to
ensure graph connectivity has to be scaled in the order of log( ) /N N [6]. In our experiments, the
connectivity radius and the mixing parameter are chosen as log( ) /R N N , and 1/ 2 .
The figure below shows an example of geometric random graph with 100 nodes. We plot the evolution of
logarithm of the posterior estimated log ( | )mH Y . The graph shows that after a while of exchanging
messages, all nodes arrive at a consensus on each hypothesis probability so that they know the most probable hypothesis about the event.
A sensor network with 100 nodes.
Evolution of estimate logarithm of posterior
The convergence rate to consensus of the broadcast gossip and belief consensus algorithm is shown in the figure below. It is obtained by averaging the total number of rounds incurred over 20 executions on a network of 100 nodes. As we can see, the gossip-based outperforms the belief consensus in terms of communication cost.
Rate of convergence to consensus
5 Conclusion
In this technical report we aim to develop an accurate and robust human activity recognition (AR) system for ubiquitous life‐care and gamming environments. The AR system will incorporate video, accelerometer and physiological signals, and leverage the collaborations between these devices/systems to improve the timeliness, robustness and scope of

‐27‐
activities of daily living capabilities (for example, it can determine many complex activities such as taking pills, doing exercises, or undergoing serious situations like heart attacks, falling down, etc.)
The proposed AR framework consists of three main modules, namely video‐based AR, accelerometer and physiological‐based AR, and collaborative AR. Key functions of the video‐based human activity recognition module consist of detection of interesting moving person(s), tracking of such person(s) from frame to frame, and analysis of subject tracks to recognize their behavior. The accelerometer‐physiological based AR supports robustness in AR as well as determining micro‐behaviors and social activities. Micro‐behavior recognition will enable the development of persuasion techniques. The collaborative AR framework leverages the representation and inference power of consensus‐based DHT mechanism to allow the collaboration between desperate AR systems to enhance the accuracy of the inferred activities and situations. We are currently collecting real data to train and test the system.
6 References
[1] P. Mirchandani and R. Francis, Discrete location theory. John Wiley and Sons, 1990. [2] W. Heinzelman, A. Chandrakasan, and H. Balakrishnan, “An application‐specific protocol architecture for wireless microsensor
networks," IEEE Trans. Wireless.Commun., vol. 1, no. 4, pp. 660‐670, Oct. 2002. [3] O. Younis and S. Fahmy, “HEED: A hybrid, energy‐efficient, distributed clustering approach for ad hoc sensor networks," IEEE Trans.
Mobile Comput., vol. 3, no. 4, Oct.‐Dec. 2004. [4] R. Rajagopalan and P. K. Varshney, “Data aggregation techniques in sensor networks: A survey," IEEE Communications Surveys and
Tutorials, vol. 8, no. 4, pp.48‐63, 4th Quarter 2006. [5] F. R. Kschischang, B. Frey, and H. Loeliger, “Factor graphs and the sum‐product algorithm," IEEE Trans. Inform. Theory, vol. 47, no. 2,
pp. 498‐519, Nov. 2001. [6] Hung Quoc Ngo, T.M.Tam, Young‐Koo Lee, and Sungyoung Lee, " A Message‐Passing Approach to Min‐Cost Distributed Clustering in
Wireless Sensor Networks", ATC’08: IEEE Int’l Conf. on Advanced Tech. for Comm. 2008, Hanoi, Vietnam, Oct. 6‐10, 2008. [7] Tran Minh Tam, Hung Q. Ngo, Miso Kim, and Sungyoung Lee, “Minimum Cost Hierarchical Architecture for Correlated Data
Gathering in Sensor Networks with Mobile Access”, Proc. Of The Fourth Int’l Conf. on Intelligent Sensors, Sensor Networks and Information Processing (ISSNIP08), Australia
[8] Tran Minh Tam, Hung Q. Ngo, P.T.H.Truc, and Sungyoung Lee, “Lifetime Optimized Hierarchical Architecture for Correlated Data Gathering in Wireless Sensor Networks”, Proc. Of The Eleventh IEEE Int’l Conf. on Comm. Systems (ICCS08), China.
[9] Hung Q. Ngo, Sungyoung Lee, Young‐Koo Lee, “Factor Graph Approach to Distributed Facility Location in Large‐Scale Networks”, ISIT09: The 2009 IEEE International Symposium on Information Theory, Seoul, Korea, June 28, 2009.
[10] P. von Rickenbach and R. Wattenhofer, “Gathering correlated data in sensor networks," in Proc. ACM DIALM‐POCM'04, Philadelphia, Pennsylvania, USA, Oct. 2004.
[11] S. Bandyopadhyay and E. Coyle, “An energy efficient hierarchical clustering algorithm for wireless sensor networks," in Proc. IEEE INFOCOM'03, Apr. 2005, pp. 1713‐1723.
[12] L. Liao, T. Choudhury, D. Fox, and H. Kautz. Training conditional random fields using virtual evidence boosting. In Proceeding of the International Joint Conference on Artificial Intelligence (IJCAI),2007.
[13] L. Liao, D. Fox, and H. Kautz. Extracting places and activities from gps traces using hierarchical conditional random fields. International Journal of Robotics Research, 2007.
[14] Paul Lukowicz, Thad E. Starner, Gerhard Troster, and Jamie A. Ward. Activity recognition of assembly tasks using body‐worn microphones and accelerometers. IEEE Transaction on Pattern Analysis and Machine Intelligence, 28:1553–1567, 2006.
[15] M.Lampe, M.Strassner, and E.Fleisch. A ubiqitous computing environment for aircraft maintenance. In Proceeding of ACM Symp. Applied Computing, pages 1586–1592, 2004.
[16] E Munguia‐Tapia, S. Intille, and K Larson. Activity recognition in the home setting using simple and ubiquitous sensors. In Proceeding of PERVASIVE, 2004.
[17] World Health Organization. Global strategy on diet, physical activity and health. Technical report, 2004. [18] L. R. Rabiner. A tutorial on hidden markov models and selected applications in speech recognition. In Proceeding of the IEEE, 1989. [19] Nishkam Ravi, Nikhil Dandekar, Prreetham Mysore, and Michael L Littman. Activity recognition from accelerometer data. American
Association for Artificial Intelligence, 2005. [20] R.A.Washburn and H.J.Montoye. The assessment of physical activity by questionare. Am.J.Epidemiol., 123:563–576, 1986. [21] Sunita Sarawagi and William Cohen. Semi‐markov conditional random fields for information extraction. In Proceedings of Advances
in Neural Information Processing Systems (NIPS), 2004. [22] Dairazalia Snchez, Monica Tentori, and Jess Favela. Activity recognition for the smart hospital. IEEE Intelligent Systems, 23:50–57,
2008. [23] Jaakko Suutala, Susanna Pirttikangas, and Juha Rning. Discriminative temporal smoothing for activity recognition from wearable
sensors. In Proceeding of International Symposium on Ubiquitous Computing Systems, 2007.

‐28‐
[24] T. Truyen, D. Phung, H. Bui, and S. Venkatesh. Hierarchical semimarkov conditional random fields for recursive sequential data. In Proceeding of International Conference on Advances in Neural Information Processing (NIPS), 2008.
[25] D. L. Vail, M. M. Veloso, and J. D. Lafferty. Conditional random fields for activity recognition. In Proceedings of the International Conference on Autonomous Agents and Multi‐agent Systems, 2007.