Embed Size (px)
Citation preview
Southern California’s Experience
Collaborative Planning for Goods Movement
Presented to Joint Informational Meeting of
the California Transportation Commission and
the Washington State Transportation CommissionAugust 19, 2014
Hasan Ikhrata Executive Director
Southern California Association of Governments 1
Southern California’s Goods Movement System
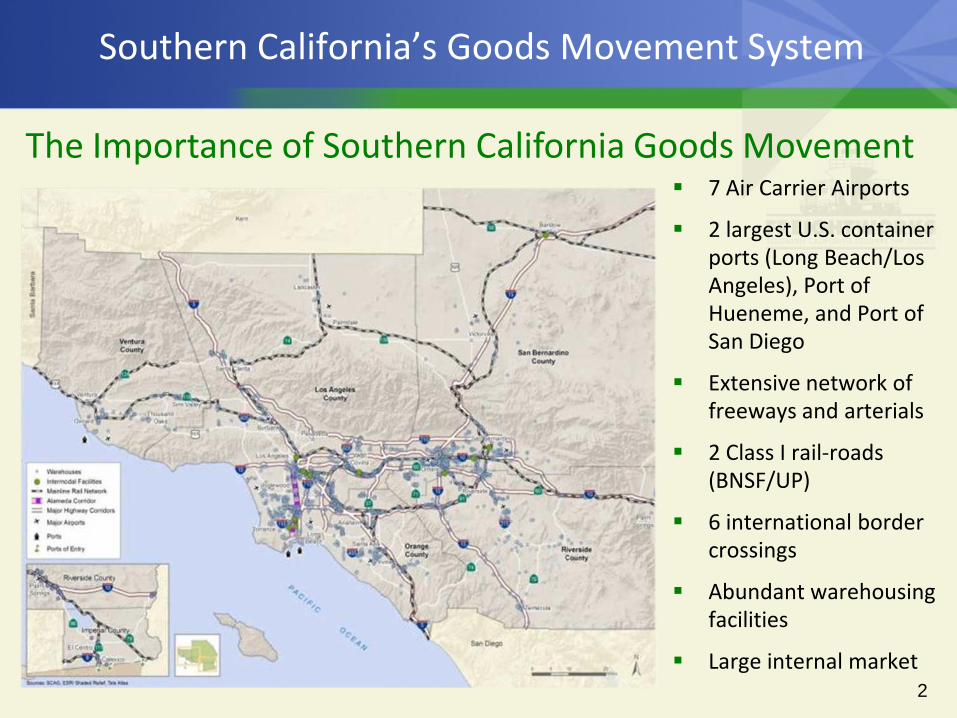
7 Air Carrier Airports
2 largest U.S. container ports (Long Beach/Los Angeles), Port of Hueneme, and Port of San Diego
Extensive network of freeways and arterials
2 Class I rail-roads (BNSF/UP)
6 international border crossings
Abundant warehousing facilities
Large internal market
The Importance of Southern California Goods Movement
2
Goods Movement System and the Economy
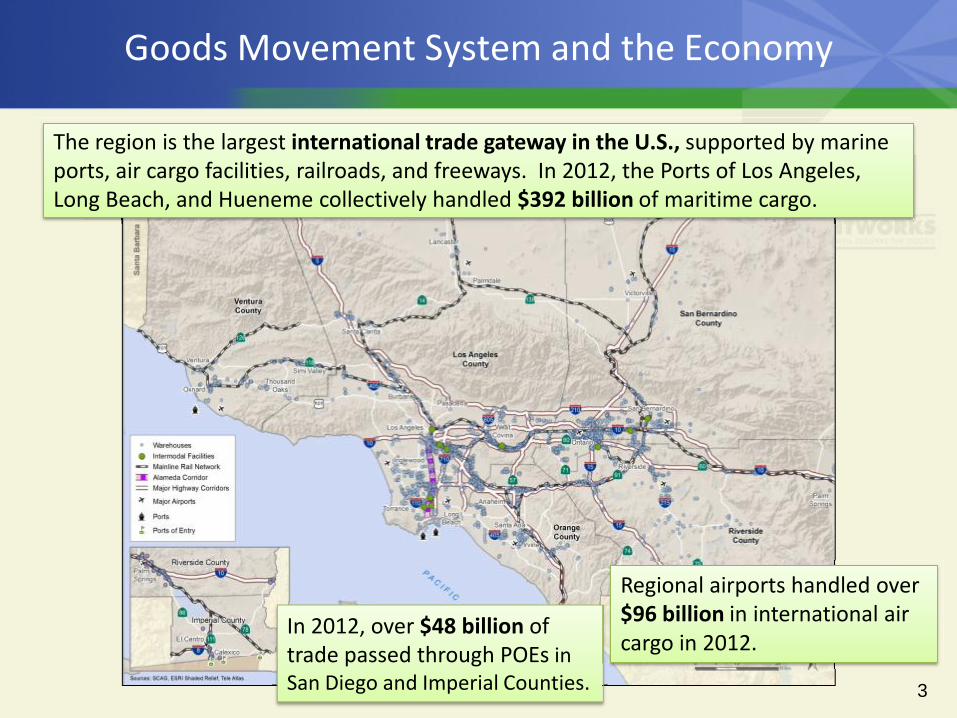
The region is the largest international trade gateway in the U.S., supported by marine ports, air cargo facilities, railroads, and freeways. In 2012, the Ports of Los Angeles, Long Beach, and Hueneme collectively handled $392 billion of maritime cargo.
In 2012, over $48 billion of trade passed through POEs in San Diego and Imperial Counties.
Regional airports handled over $96 billion in international air cargo in 2012.
3
4
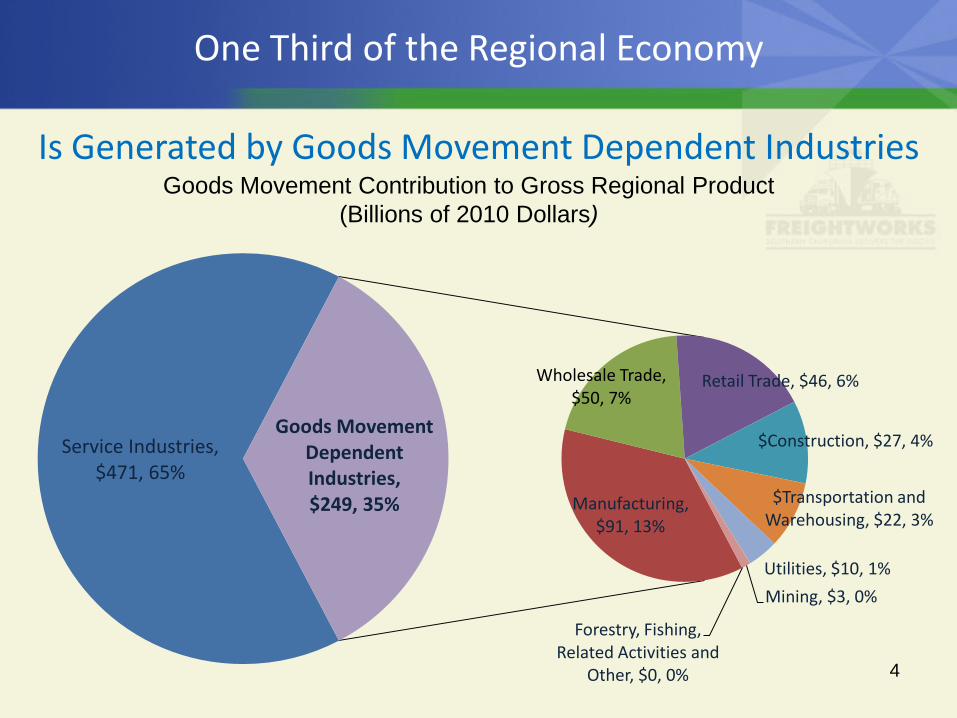
Service Industries, $471, 65%
Manufacturing, $91, 13%
Wholesale Trade, $50, 7%
Retail Trade, $46, 6%
$Construction, $27, 4%
$Transportation and Warehousing, $22, 3%
Utilities, $10, 1% Mining, $3, 0%
Forestry, Fishing, Related Activities and
Other, $0, 0%
Goods Movement Dependent Industries, $249, 35%
Goods Movement Contribution to Gross Regional Product(Billions of 2010 Dollars)
One Third of the Regional Economy
Is Generated by Goods Movement Dependent Industries
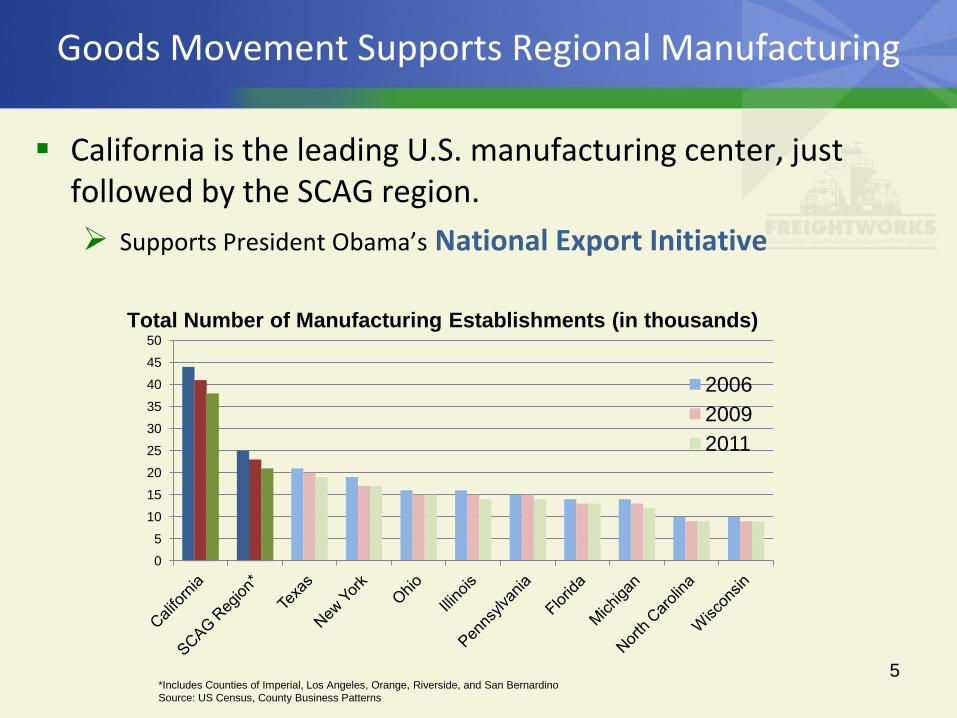
Goods Movement Supports Regional Manufacturing
California is the leading U.S. manufacturing center, just followed by the SCAG region. Supports President Obama’s National Export Initiative
5
0
5
10
15
20
25
30
35
40
45
50
200620092011
*Includes Counties of Imperial, Los Angeles, Orange, Riverside, and San BernardinoSource: US Census, County Business Patterns
Total Number of Manufacturing Establishments (in thousands)
followed by the SCAG region.
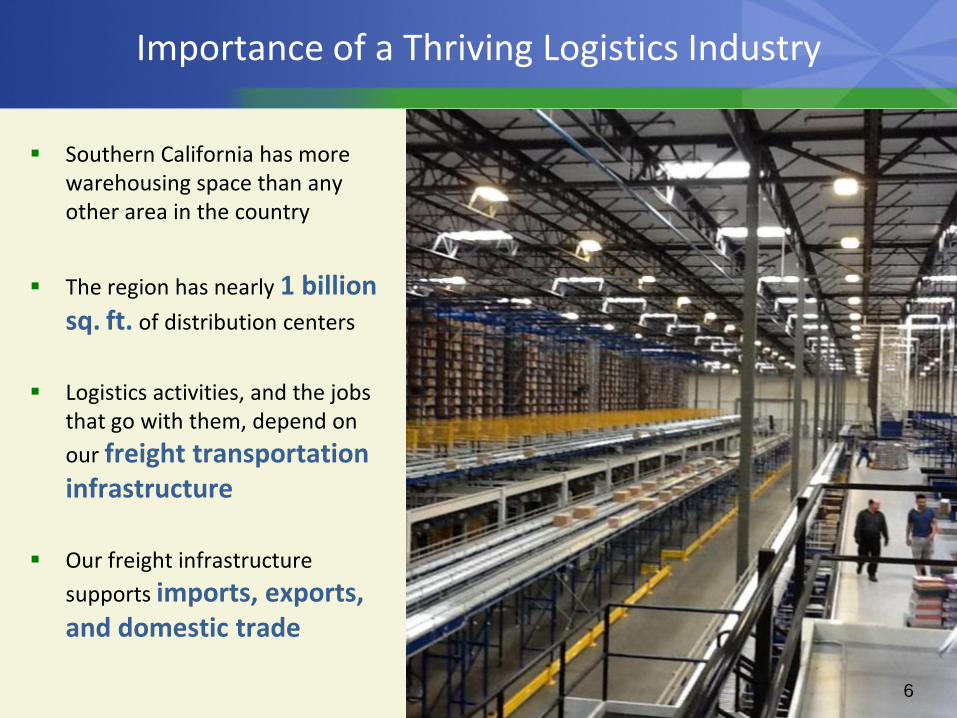
Importance of a Thriving Logistics Industry
Southern California has more warehousing space than any other area in the country
The region has nearly 1 billion sq. ft. of distribution centers
Logistics activities, and the jobs that go with them, depend on our freight transportation infrastructure
Our freight infrastructure supports imports, exports, and domestic trade
6
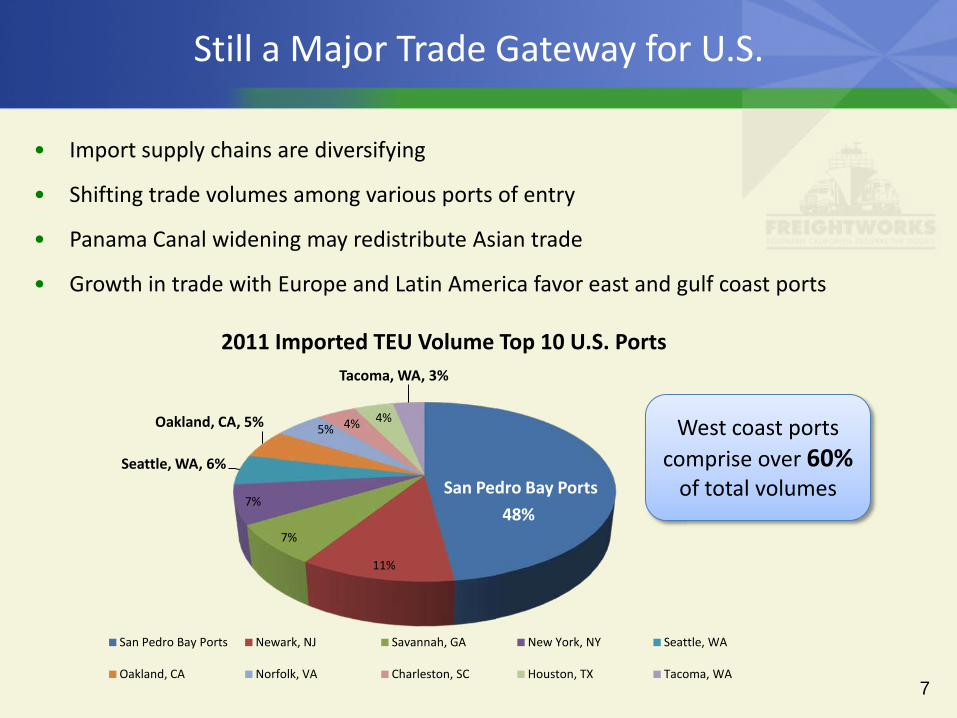
48%
11%
7%
7%
Seattle, WA, 6%
Oakland, CA, 5% 5% 4% 4%
Tacoma, WA, 3%
2011 Imported TEU Volume Top 10 U.S. Ports
San Pedro Bay Ports Newark, NJ Savannah, GA New York, NY Seattle, WA
Oakland, CA Norfolk, VA Charleston, SC Houston, TX Tacoma, WA
Still a Major Trade Gateway for U.S.
• Import supply chains are diversifying
• Shifting trade volumes among various ports of entry
• Panama Canal widening may redistribute Asian trade
• Growth in trade with Europe and Latin America favor east and gulf coast ports
7
San Pedro Bay Ports
West coast ports comprise over 60%
of total volumes
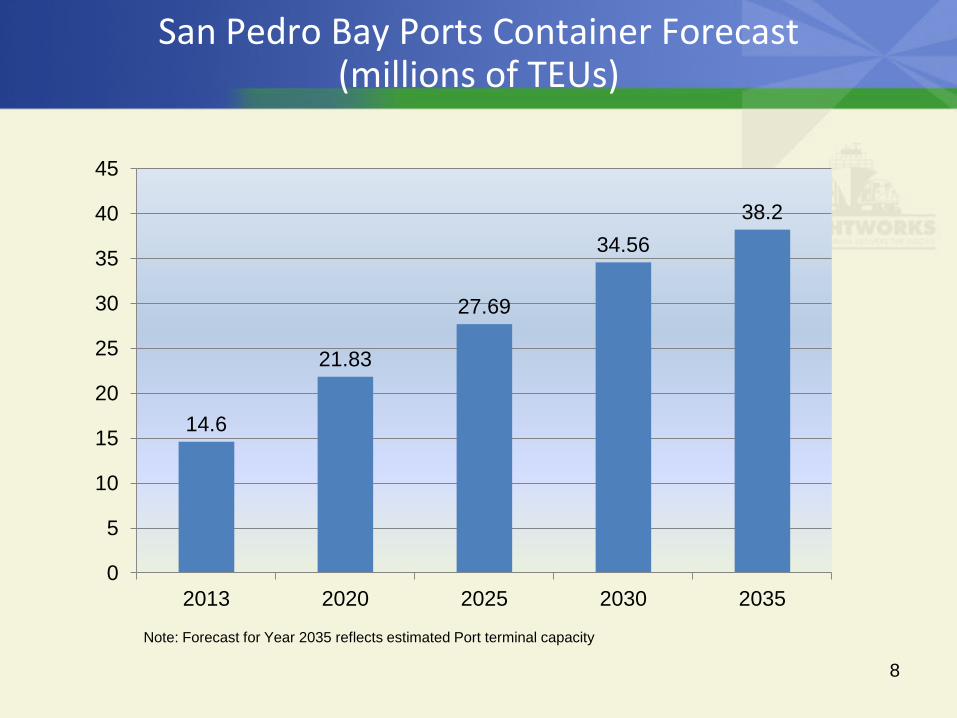
San Pedro Bay Ports Container Forecast (millions of TEUs)
8
14.6
21.83
27.69
34.5638.2
0
5
10
15
20
25
30
35
40
45
2013 2020 2025 2030 2035
Note: Forecast for Year 2035 reflects estimated Port terminal capacity
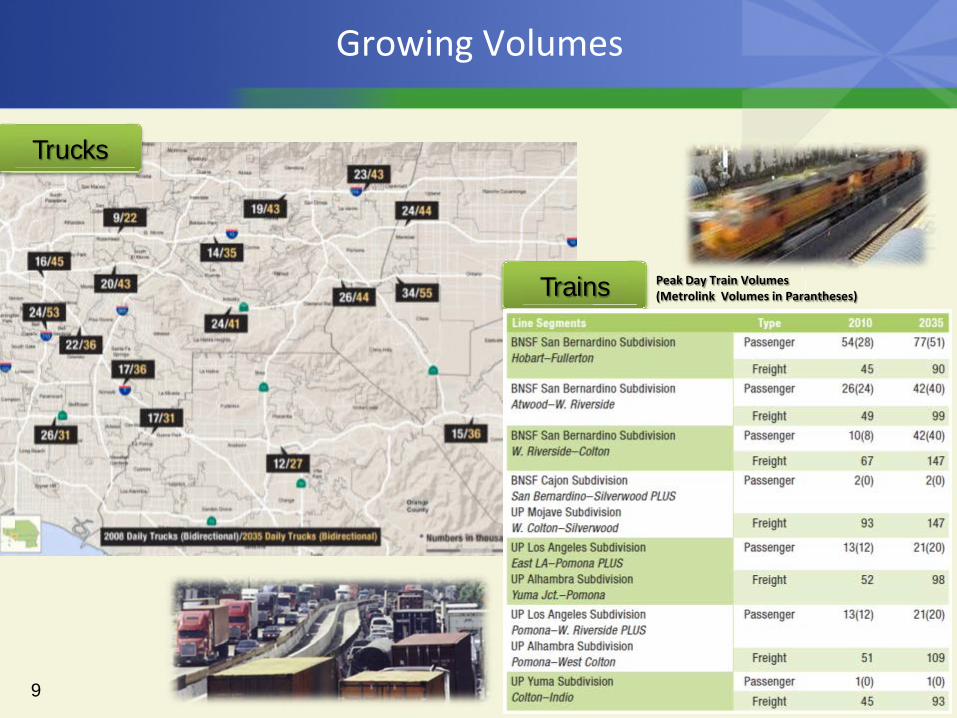
Growing Volumes
Trucks
Trains Peak Day Train Volumes (Metrolink Volumes in Parantheses)
9
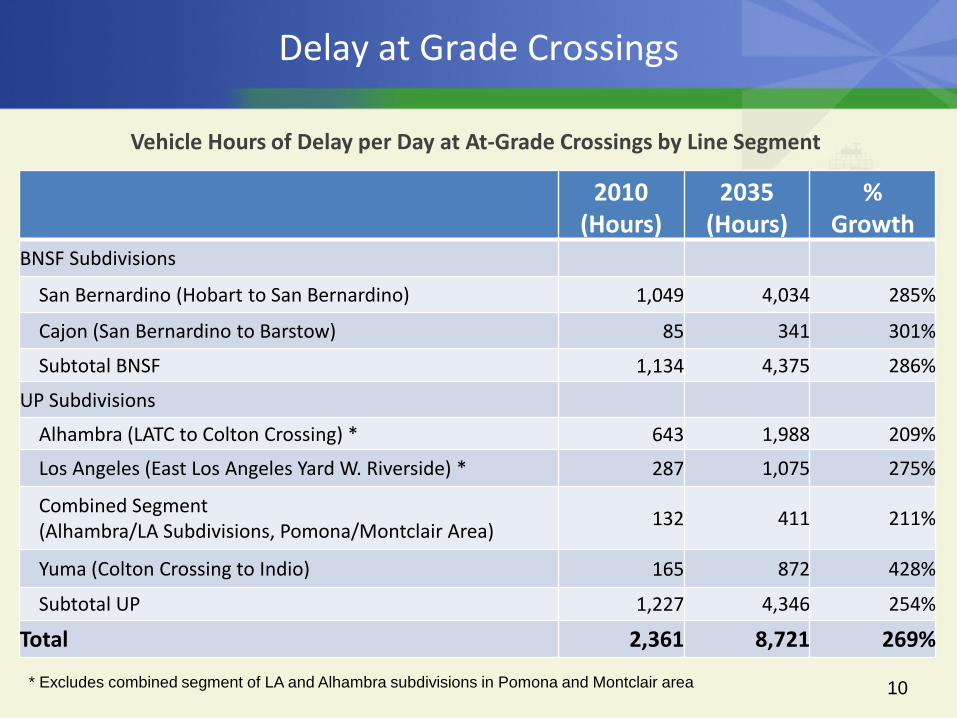
Delay at Grade Crossings
2010
(Hours) 2035
(Hours) %
Growth BNSF Subdivisions
San Bernardino (Hobart to San Bernardino) 1,049 4,034 285%
Cajon (San Bernardino to Barstow) 85 341 301%
Subtotal BNSF 1,134 4,375 286%
UP Subdivisions
Alhambra (LATC to Colton Crossing) * 643 1,988 209%
Los Angeles (East Los Angeles Yard W. Riverside) * 287 1,075 275%
Combined Segment (Alhambra/LA Subdivisions, Pomona/Montclair Area) 132 411 211%
Yuma (Colton Crossing to Indio) 165 872 428%
Subtotal UP 1,227 4,346 254%
Total 2,361 8,721 269%
10
Vehicle Hours of Delay per Day at At-Grade Crossings by Line Segment
* Excludes combined segment of LA and Alhambra subdivisions in Pomona and Montclair area
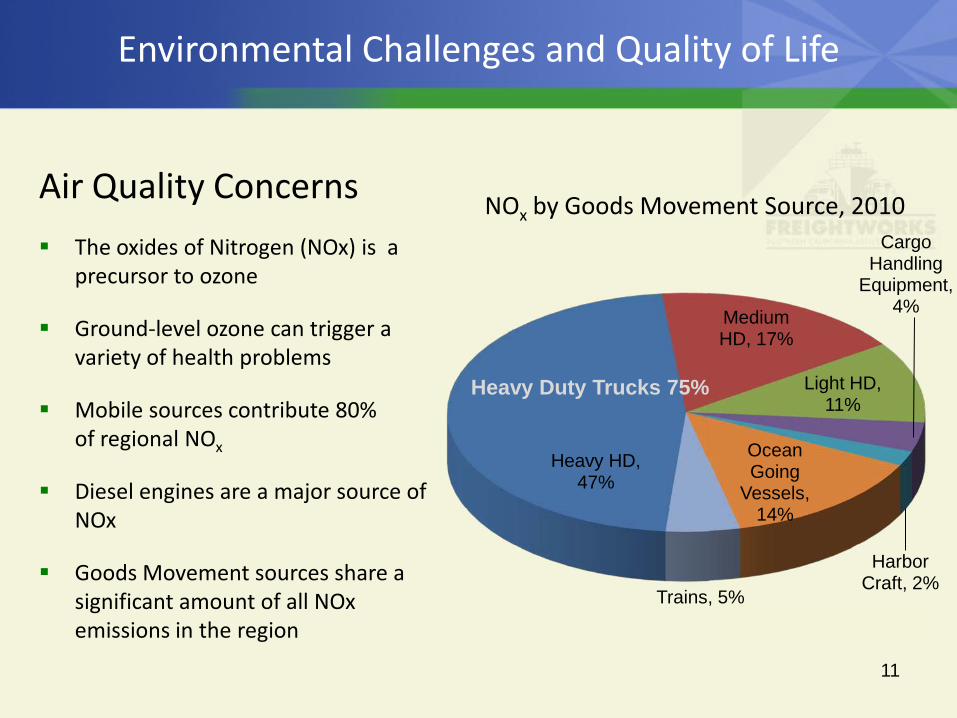
Environmental Challenges and Quality of Life
Air Quality Concerns The oxides of Nitrogen (NOx) is a
precursor to ozone
Ground-level ozone can trigger a variety of health problems
Mobile sources contribute 80%of regional NOx
Diesel engines are a major source of NOx
Goods Movement sources share a significant amount of all NOx emissions in the region
11
NOx by Goods Movement Source, 2010
Heavy HD, 47%
Medium HD, 17%
Light HD, 11%
Cargo Handling
Equipment, 4%
Harbor Craft, 2%
Ocean Going
Vessels, 14%
Trains, 5%
Heavy Duty Trucks 75%
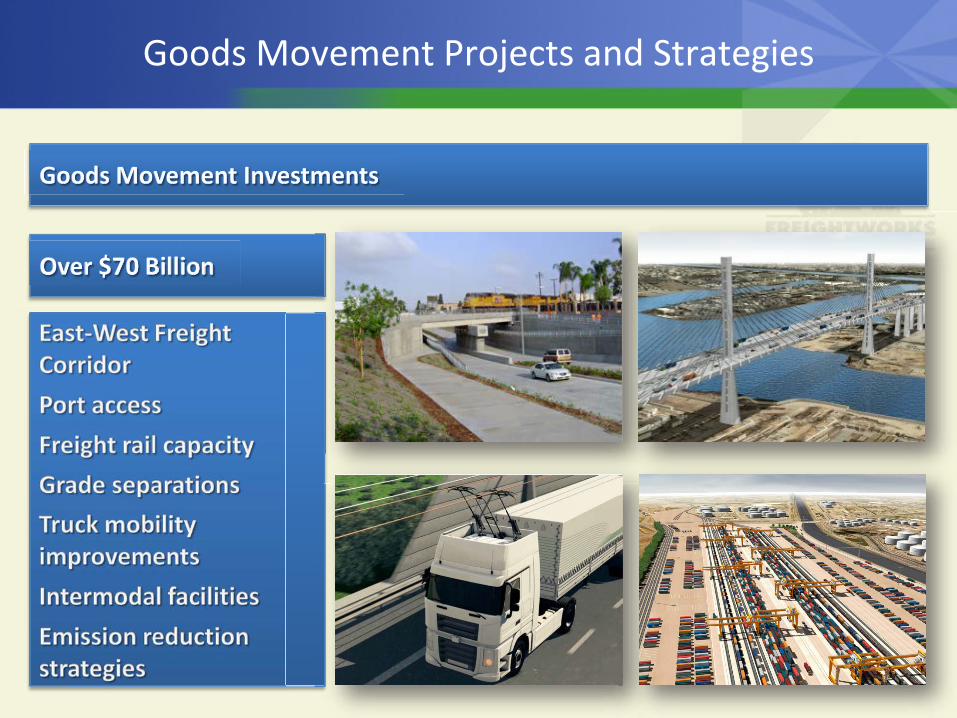
Goods Movement Projects and Strategies
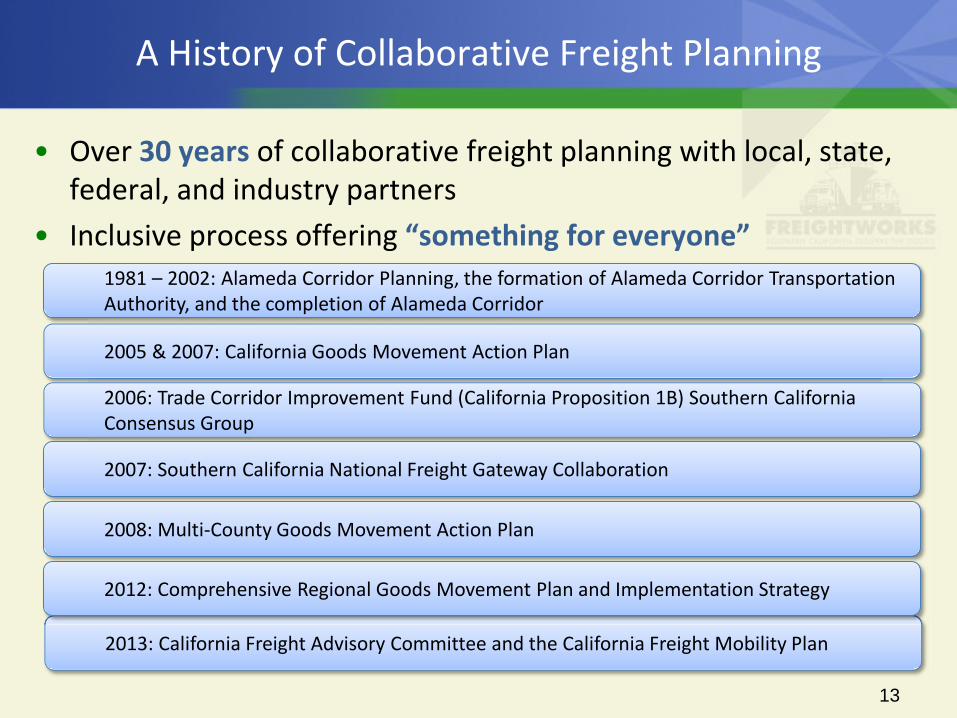
A History of Collaborative Freight Planning
• Over 30 years of collaborative freight planning with local, state, federal, and industry partners
• Inclusive process offering “something for everyone”
13
2013: California Freight Advisory Committee and the California Freight Mobility Plan
1981 – 2002: Alameda Corridor Planning, the formation of Alameda Corridor Transportation Authority, and the completion of Alameda Corridor
2005 & 2007: California Goods Movement Action Plan
2006: Trade Corridor Improvement Fund (California Proposition 1B) Southern California Consensus Group
2007: Southern California National Freight Gateway Collaboration
2008: Multi-County Goods Movement Action Plan
2012: Comprehensive Regional Goods Movement Plan and Implementation Strategy
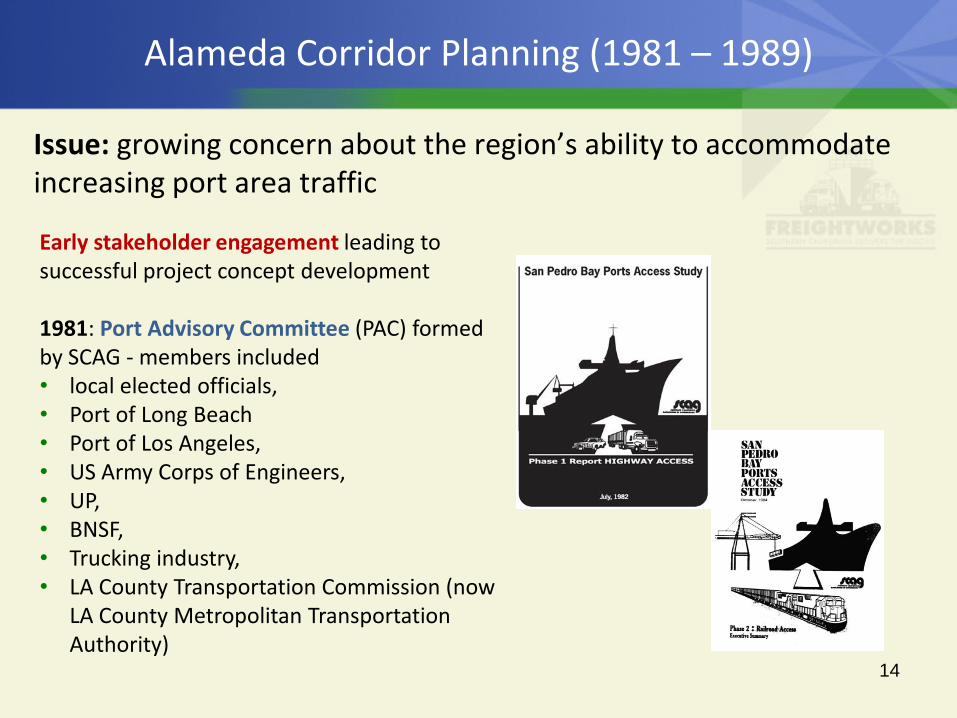
Alameda Corridor Planning (1981 – 1989)
Issue: growing concern about the region’s ability to accommodate increasing port area traffic
14
Early stakeholder engagement leading to successful project concept development
1981: Port Advisory Committee (PAC) formed by SCAG - members included • local elected officials, • Port of Long Beach • Port of Los Angeles, • US Army Corps of Engineers, • UP, • BNSF, • Trucking industry, • LA County Transportation Commission (now
LA County Metropolitan Transportation Authority)
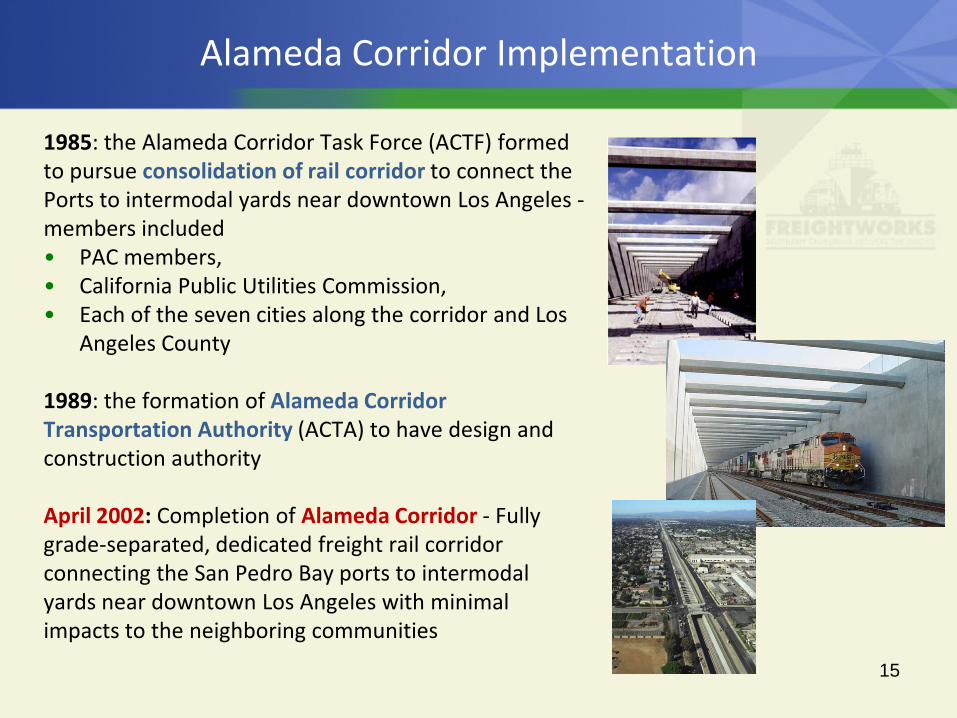
Alameda Corridor Implementation
1985: the Alameda Corridor Task Force (ACTF) formed to pursue consolidation of rail corridor to connect the Ports to intermodal yards near downtown Los Angeles - members included • PAC members, • California Public Utilities Commission, • Each of the seven cities along the corridor and Los
Angeles County 1989: the formation of Alameda Corridor Transportation Authority (ACTA) to have design and construction authority April 2002: Completion of Alameda Corridor - Fully grade-separated, dedicated freight rail corridor connecting the San Pedro Bay ports to intermodal yards near downtown Los Angeles with minimal impacts to the neighboring communities
15
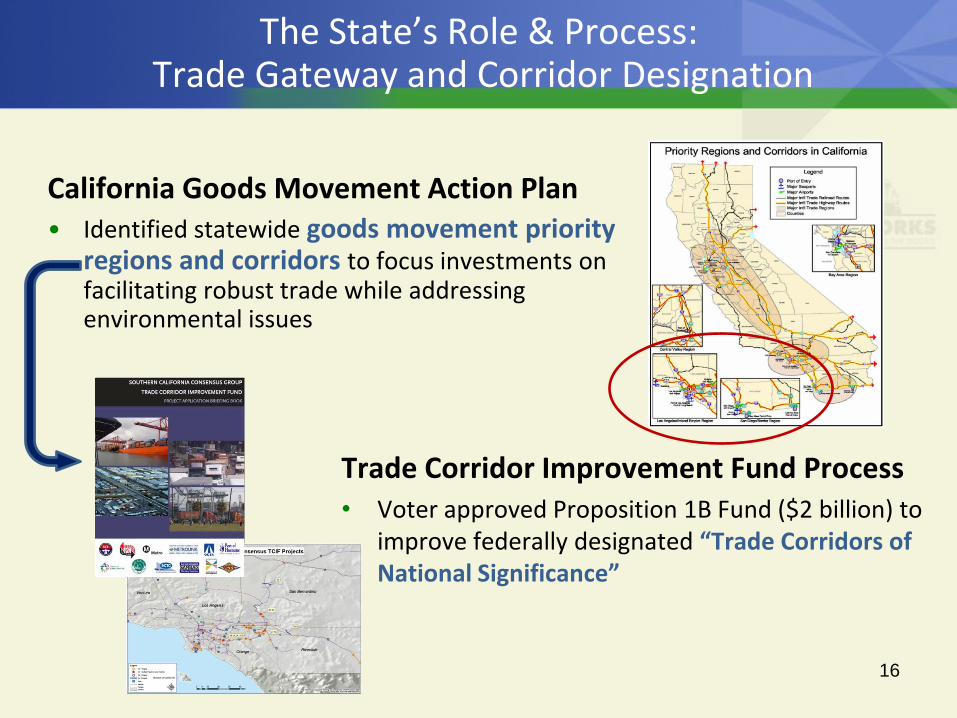
The State’s Role & Process: Trade Gateway and Corridor Designation
California Goods Movement Action Plan • Identified statewide goods movement priority
regions and corridors to focus investments on facilitating robust trade while addressing environmental issues
16
Trade Corridor Improvement Fund Process • Voter approved Proposition 1B Fund ($2 billion) to
improve federally designated “Trade Corridors of National Significance”
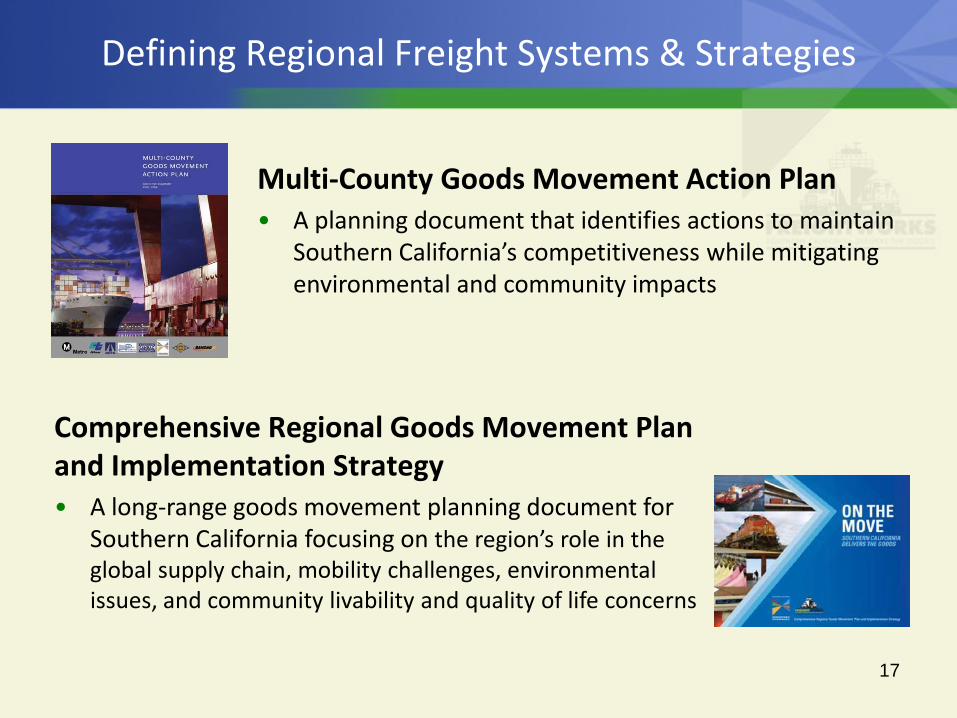
Defining Regional Freight Systems & Strategies
17
Multi-County Goods Movement Action Plan • A planning document that identifies actions to maintain
Southern California’s competitiveness while mitigating environmental and community impacts
Comprehensive Regional Goods Movement Plan and Implementation Strategy • A long-range goods movement planning document for
Southern California focusing on the region’s role in the global supply chain, mobility challenges, environmental issues, and community livability and quality of life concerns
Solidifying Collaborative Partnership
18
Southern California National Freight Gateway Collaboration • A Memorandum of Understanding galvanizing our commitment, through
partnership, to achieve Southern California’s economic vitality and strategic growth while addressing environmental issues and advancing quality of life
• Signatory agencies include federal, state, and local agencies that oversee transportation infrastructure development, environmental protection, and economic development
• Advisory role in development of SCAG’s Comprehensive Regional Goods Movement Plan and Implementation Strategy
19
Solidifying Collaborative Partnership
California Freight Advisory Committee • Established in response to MAP-21 guidance • A cross-sectional representation of public and private freight stakeholders
tasked to – (1) advise the State on freight-related priorities, issues, projects, and funding
needs; – (2) serve as a forum for discussion for State transportation decisions affecting
freight mobility; – (3) communicate and coordinate regional priorities with other organizations;
– (4) promote the sharing of information between the private and public sectors on freight issues; and
– (5) participate in the development of the State freight plan • SCAG and our Southern California partner agencies are active members
California’s Collaborative Planning Model
• Establish a bottom-up process—identify and designate critical trade gateways and corridors
• Commit to early stakeholder engagement—from system level planning to project concept development
• Develop an Institutional framework—MOUs or Joint Powers Authority (JPA) to convene multijurisdictional and multimodal interests for project implementation
Inclusive process offering “something for everyone”
20
To learn more about SCAG and our efforts to encourage a more sustainable Southern California now and in the future, please visit www.scag.ca.gov.
Hasan Ikhrata Executive Director Southern California Association of Governments