Embed Size (px)
Citation preview
Kyle HaileyApril 2013
NFS Tuning for Oracle
http://dboptimizer.com
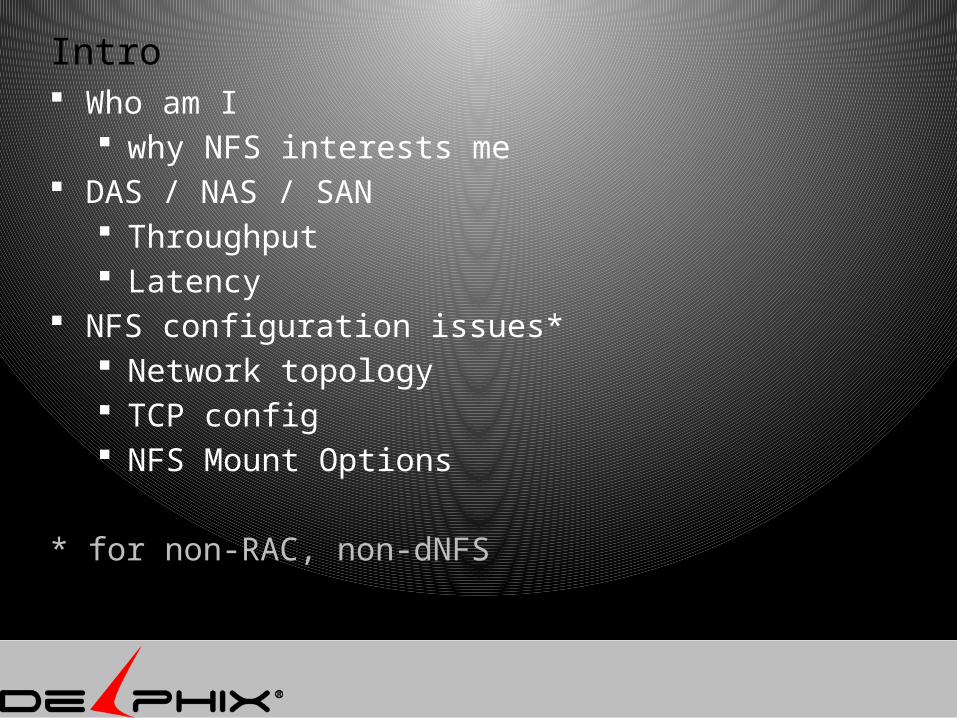
Intro Who am I
why NFS interests me DAS / NAS / SAN
Throughput Latency
NFS configuration issues* Network topology TCP config NFS Mount Options
* for non-RAC, non-dNFS

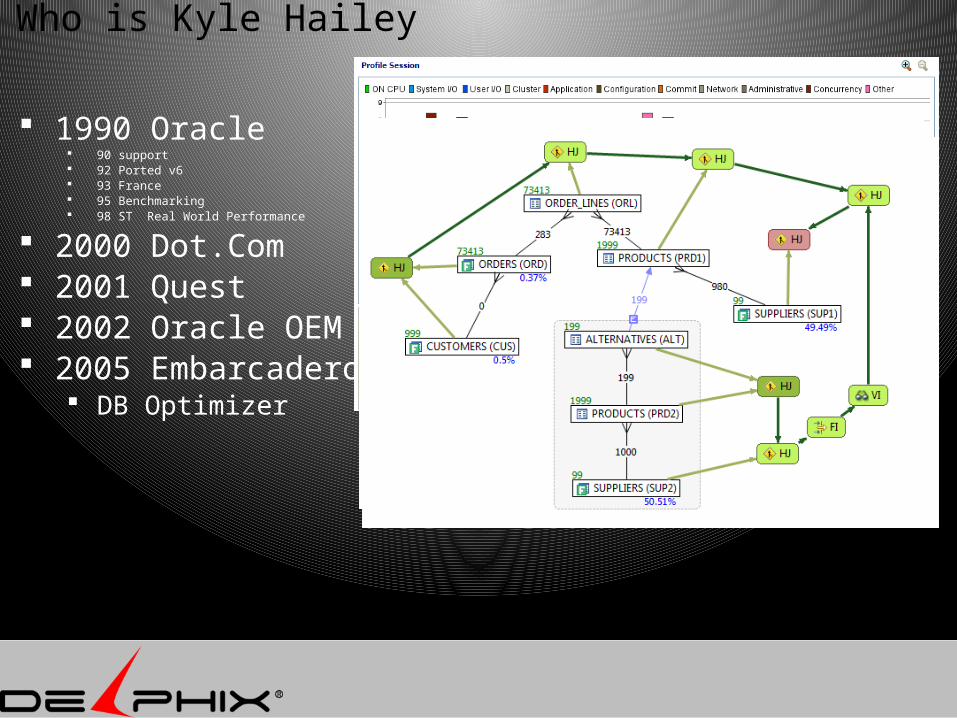
Who is Kyle Hailey
1990 Oracle 90 support 92 Ported v6 93 France 95 Benchmarking 98 ST Real World Performance
2000 Dot.Com 2001 Quest 2002 Oracle OEM 10g Success!
First successful OEM design
Who is Kyle Hailey
1990 Oracle 90 support 92 Ported v6 93 France 95 Benchmarking 98 ST Real World Performance
2000 Dot.Com 2001 Quest 2002 Oracle OEM 10g 2005 Embarcadero
DB Optimizer

Who is Kyle Hailey
1990 Oracle 90 support 92 Ported v6 93 France 95 Benchmarking 98 ST Real World Performance
2000 Dot.Com 2001 Quest 2002 Oracle OEM 10g 2005 Embarcadero
DB Optimizer Delphix
When not being a Geek- Have a little 4 year old boy who takes up all my time

Typical Architecture
Database
File system
Production
Instance
Database
File system
Development
Instance
Database
File system
QA
Instance
Database
UAT
Instance
File system
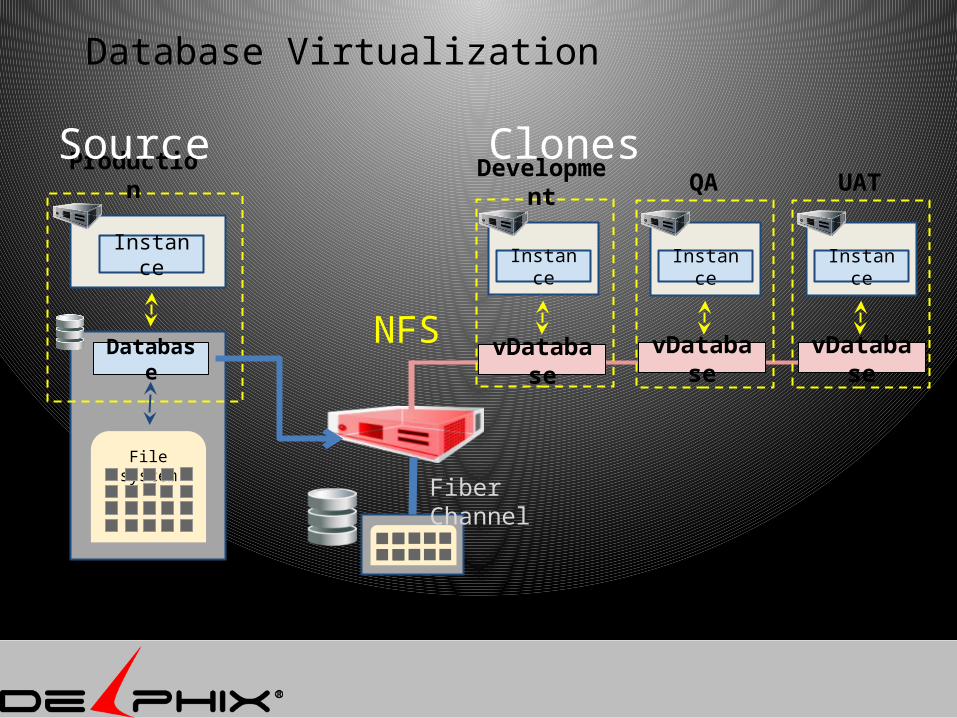
Database Virtualization
Development
Instance
Database
Production
Instance
File system
vDatabase
QA
Instance
UAT
Instance
vDatabase
vDatabase
NFS
Source Clones
Fiber Channel
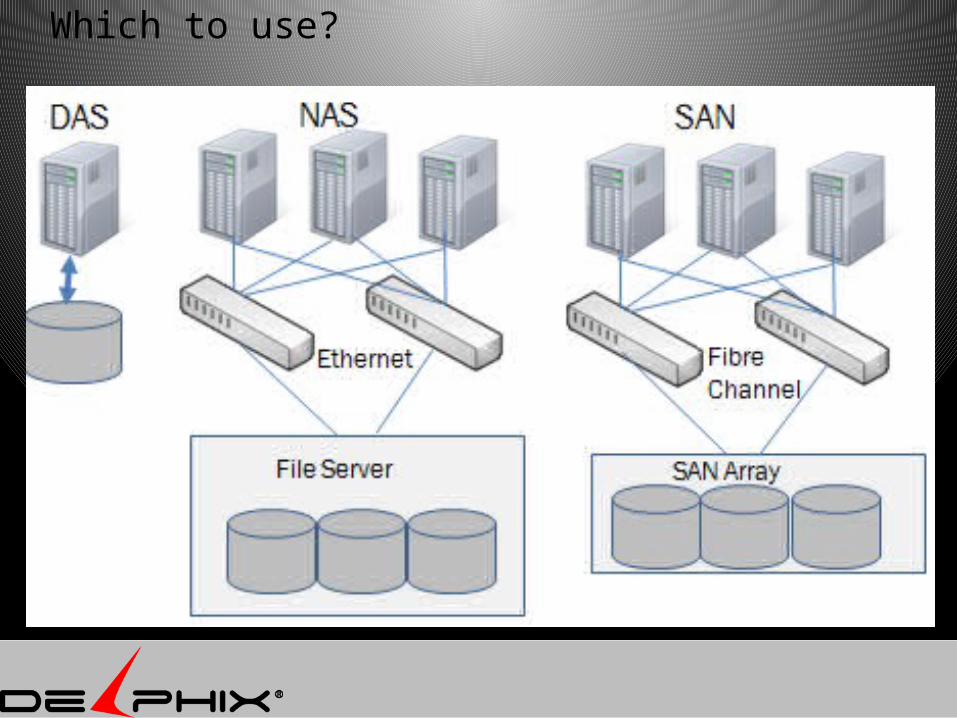
Which to use?

DAS is out of the picture
Fibre Channel

NFS - available everywhere

NFS is attractive but is it fast enough?
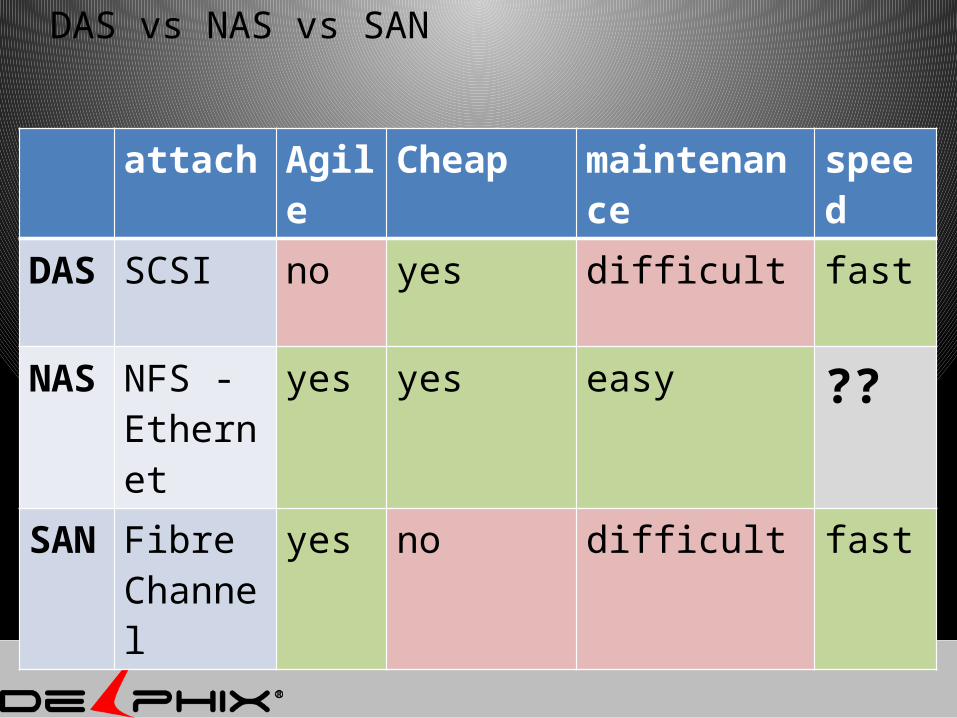
DAS vs NAS vs SAN
attach Agile
Cheap maintenance
speed
DAS
SCSI no yes difficult fast
NAS
NFS - Ethernet
yes yes easy ??
SAN
Fibre Channel
yes no difficult fast
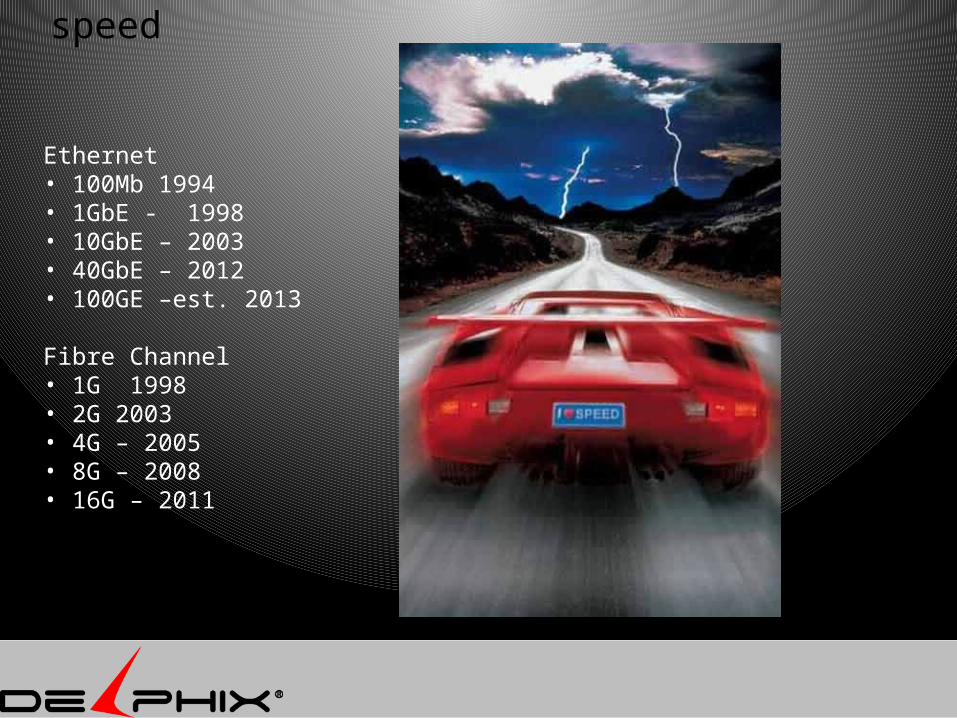
speed
Ethernet • 100Mb 1994• 1GbE - 1998• 10GbE – 2003• 40GbE – 2012• 100GE –est. 2013
Fibre Channel• 1G 1998• 2G 2003• 4G – 2005• 8G – 2008• 16G – 2011
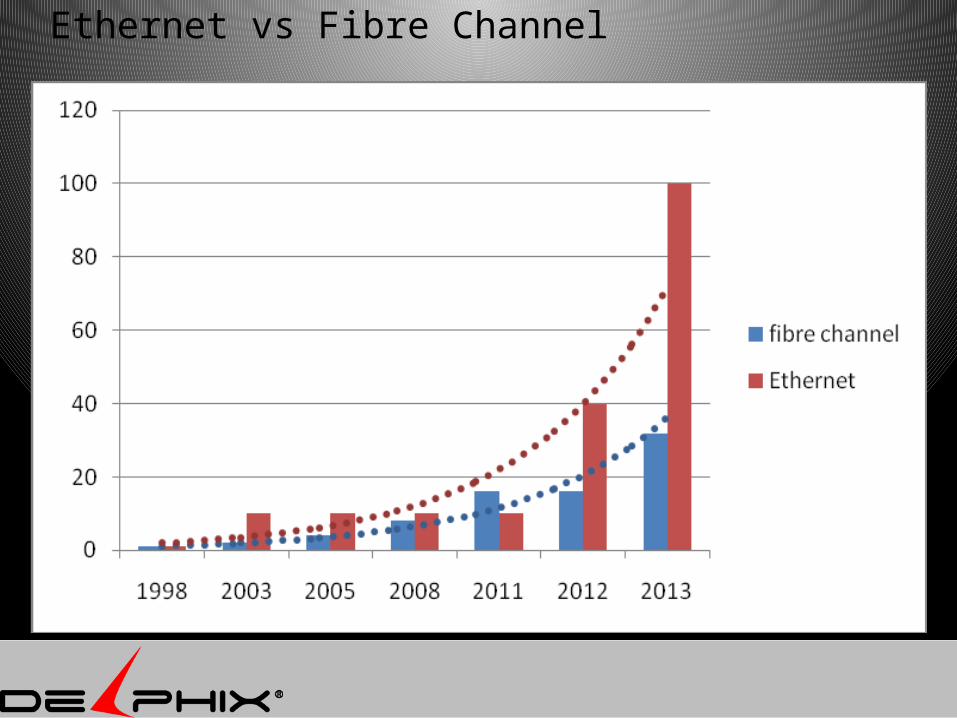
Ethernet vs Fibre Channel
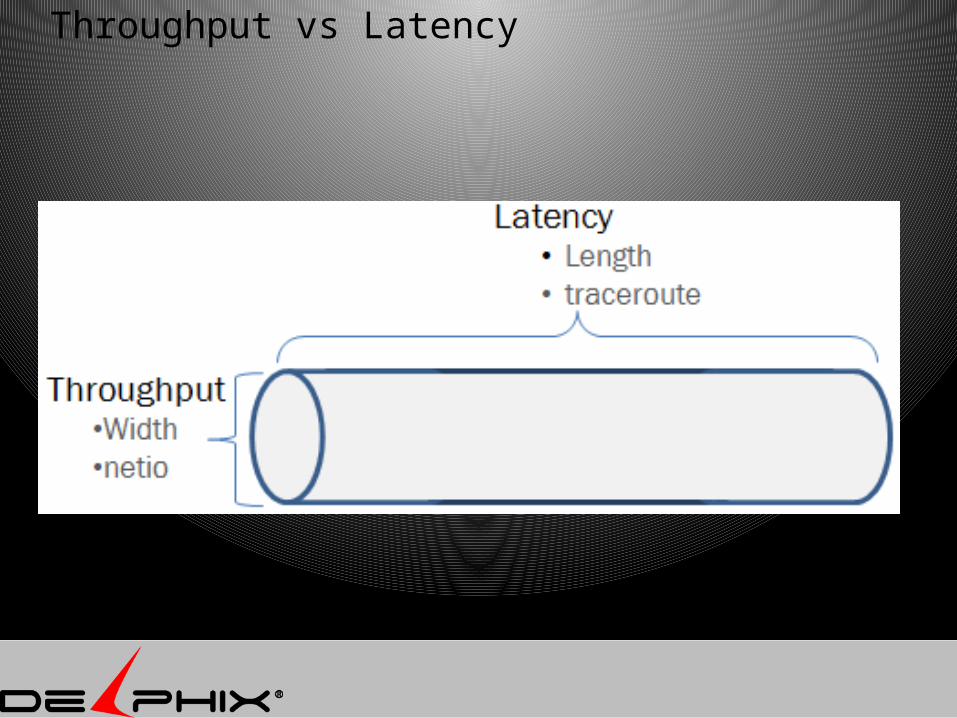
Throughput vs Latency
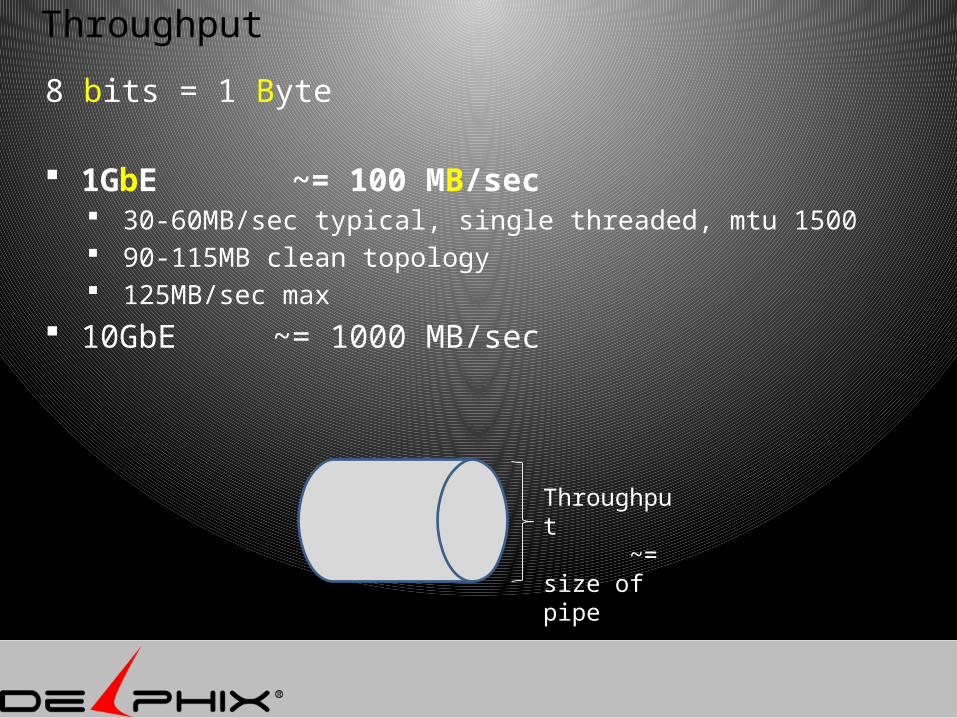
Throughput
8 bits = 1 Byte
1GbE ~= 100 MB/sec 30-60MB/sec typical, single threaded, mtu 1500 90-115MB clean topology 125MB/sec max
10GbE ~= 1000 MB/sec
Throughput ~= size of pipe
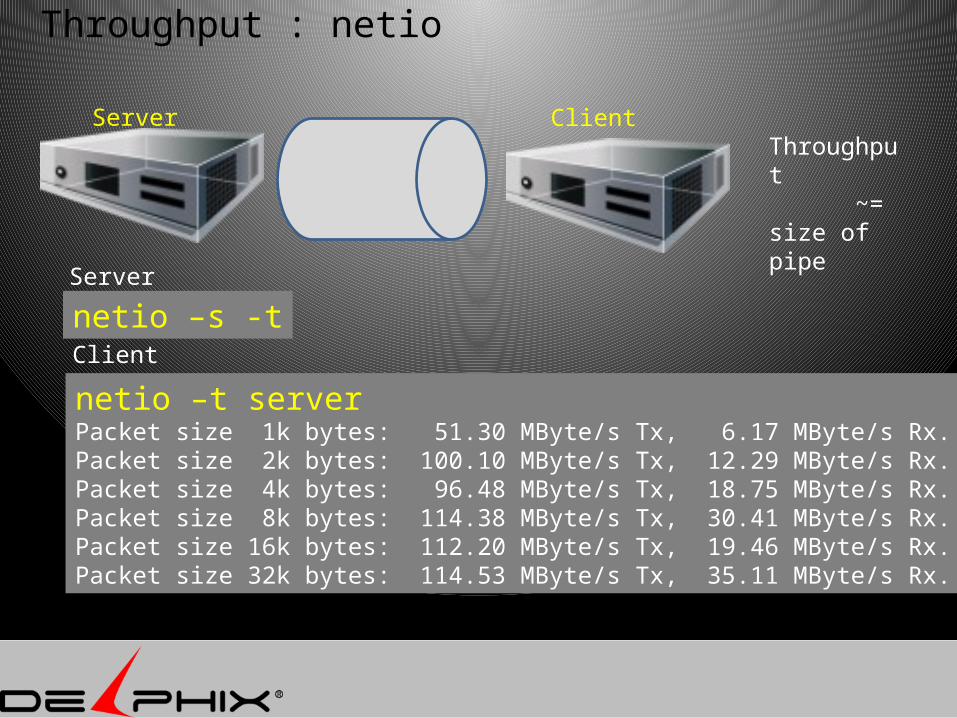
Throughput : netio
netio –s -t
netio –t serverPacket size 1k bytes: 51.30 MByte/s Tx, 6.17 MByte/s Rx.Packet size 2k bytes: 100.10 MByte/s Tx, 12.29 MByte/s Rx.Packet size 4k bytes: 96.48 MByte/s Tx, 18.75 MByte/s Rx.Packet size 8k bytes: 114.38 MByte/s Tx, 30.41 MByte/s Rx.Packet size 16k bytes: 112.20 MByte/s Tx, 19.46 MByte/s Rx.Packet size 32k bytes: 114.53 MByte/s Tx, 35.11 MByte/s Rx.
Server
Client
Throughput ~= size of pipe
Server Client
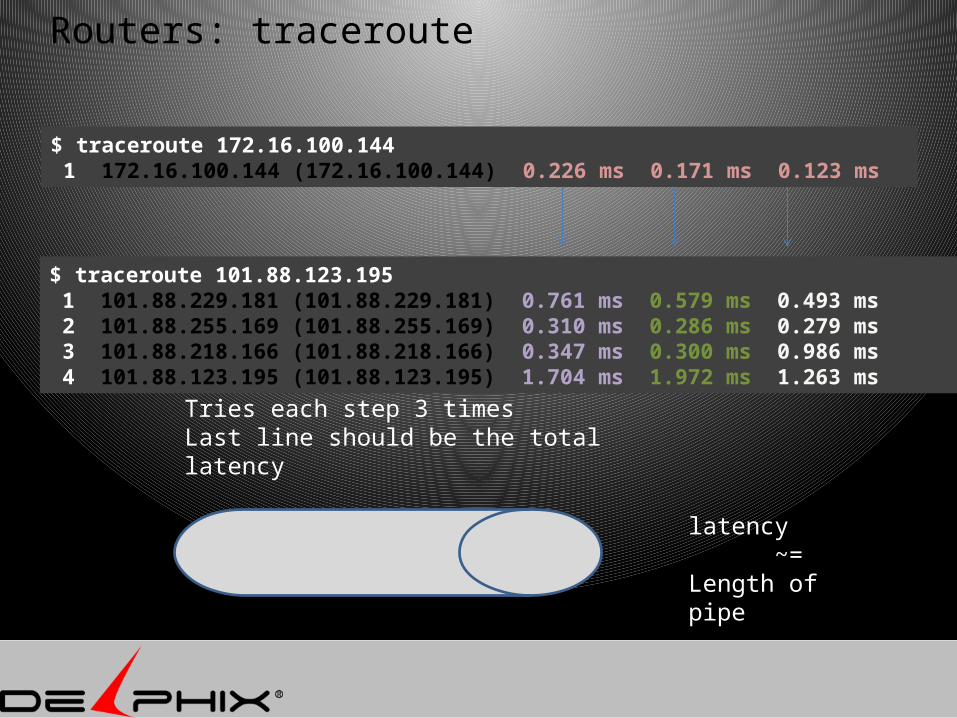
Routers: traceroute
$ traceroute 101.88.123.195 1 101.88.229.181 (101.88.229.181) 0.761 ms 0.579 ms 0.493 ms 2 101.88.255.169 (101.88.255.169) 0.310 ms 0.286 ms 0.279 ms 3 101.88.218.166 (101.88.218.166) 0.347 ms 0.300 ms 0.986 ms 4 101.88.123.195 (101.88.123.195) 1.704 ms 1.972 ms 1.263 ms
$ traceroute 172.16.100.144 1 172.16.100.144 (172.16.100.144) 0.226 ms 0.171 ms 0.123 ms
Tries each step 3 timesLast line should be the total latency
latency ~= Length of pipe
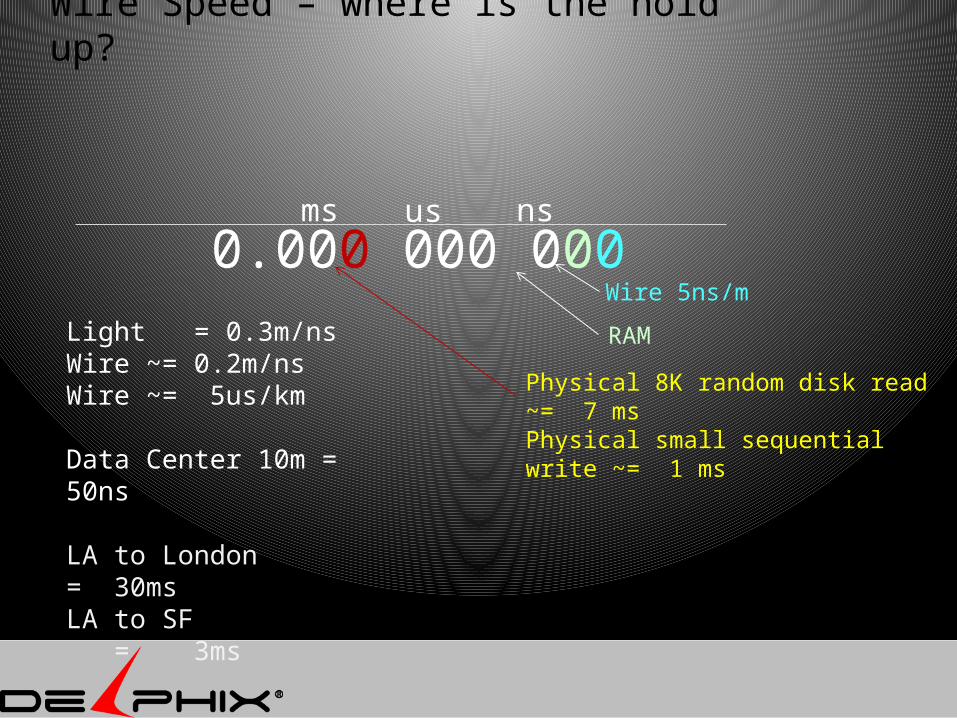
Wire Speed – where is the hold up?
0.000 000 000ms
us ns
Physical 8K random disk read ~= 7 msPhysical small sequential write ~= 1 ms
RAM
Wire 5ns/m
Light = 0.3m/nsWire ~= 0.2m/nsWire ~= 5us/km
Data Center 10m = 50ns
LA to London = 30msLA to SF = 3ms
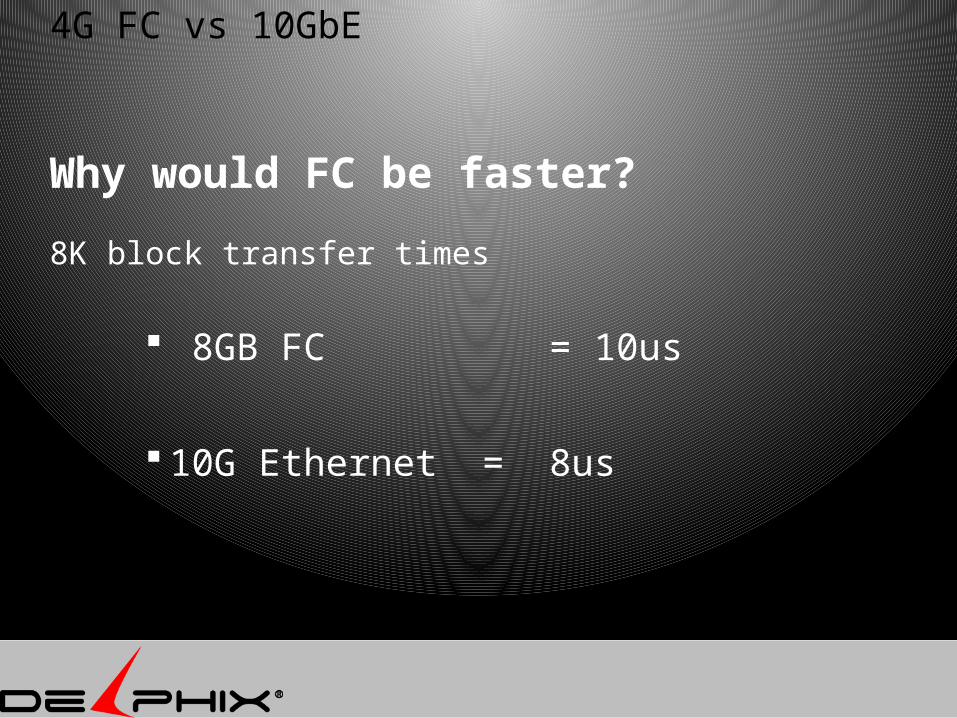
4G FC vs 10GbE
Why would FC be faster?
8K block transfer times
8GB FC = 10us
10G Ethernet = 8us
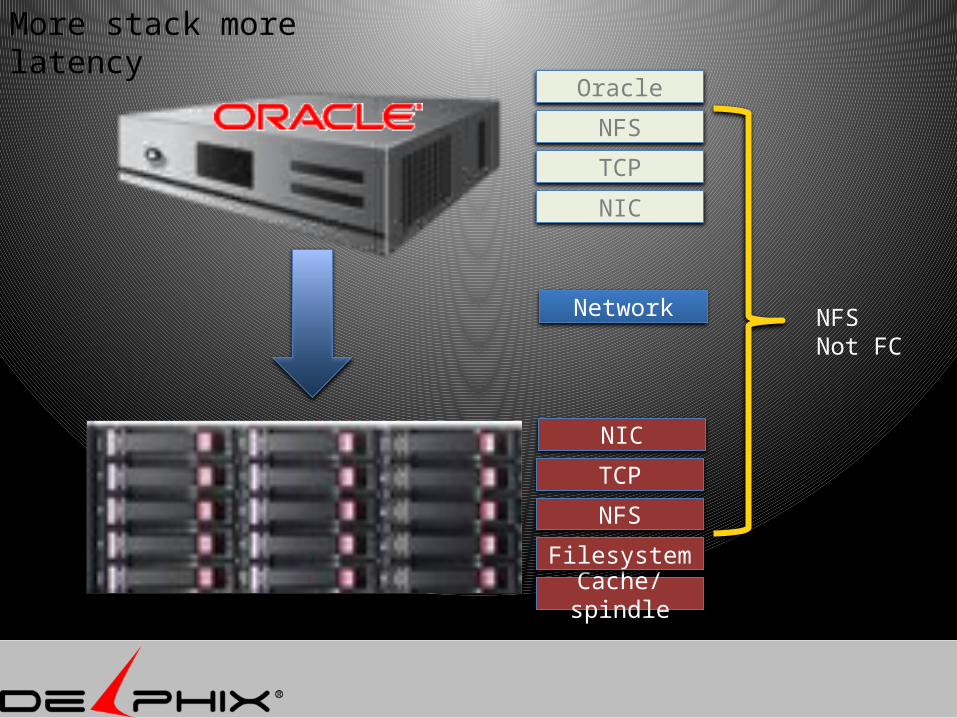
Oracle
NFS
TCP
Network
TCP
NFS
Cache/spindle
More stack more latency
Filesystem
NIC
NIC
NFSNot FC
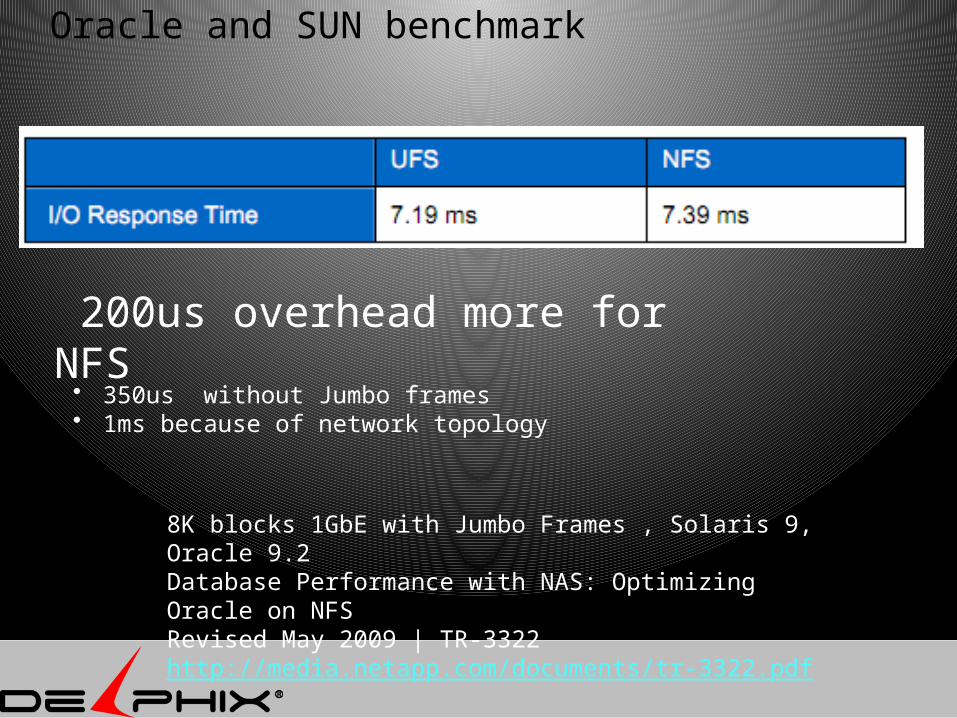
Oracle and SUN benchmark
8K blocks 1GbE with Jumbo Frames , Solaris 9, Oracle 9.2Database Performance with NAS: Optimizing Oracle on NFS Revised May 2009 | TR-3322http://media.netapp.com/documents/tr-3322.pdf
200us overhead more for NFS
• 350us without Jumbo frames• 1ms because of network topology
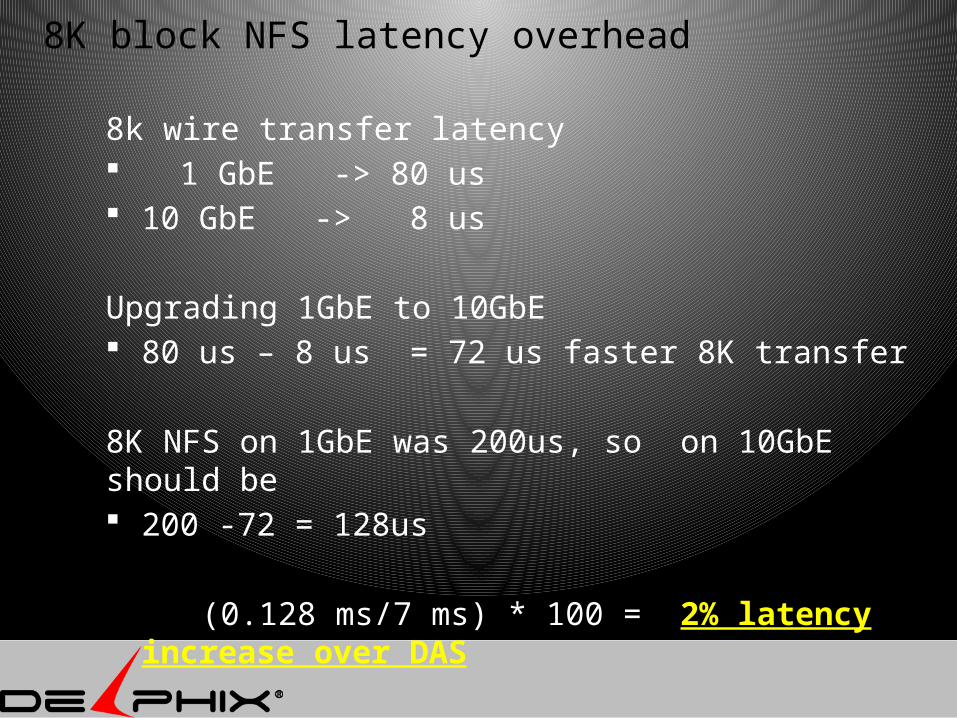
8K block NFS latency overhead
8k wire transfer latency 1 GbE -> 80 us 10 GbE -> 8 us
Upgrading 1GbE to 10GbE 80 us – 8 us = 72 us faster 8K transfer
8K NFS on 1GbE was 200us, so on 10GbE should be 200 -72 = 128us
(0.128 ms/7 ms) * 100 = 2% latency increase over DAS
* 6ms as a typical 8K disk read
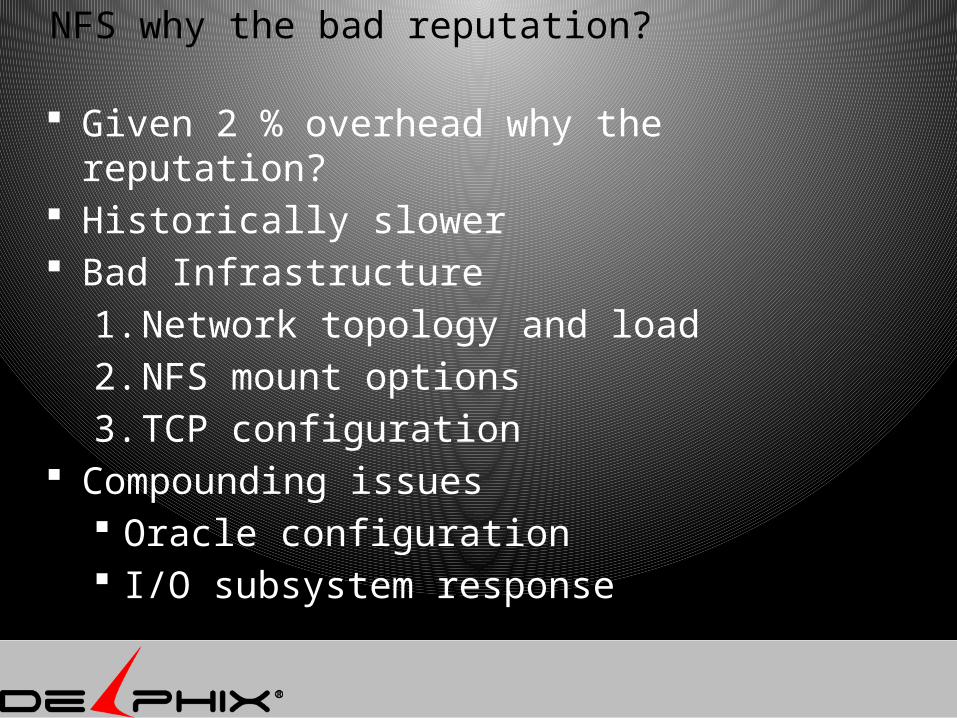
NFS why the bad reputation?
Given 2 % overhead why the reputation? Historically slower Bad Infrastructure
1. Network topology and load2. NFS mount options3. TCP configuration
Compounding issues Oracle configuration I/O subsystem response
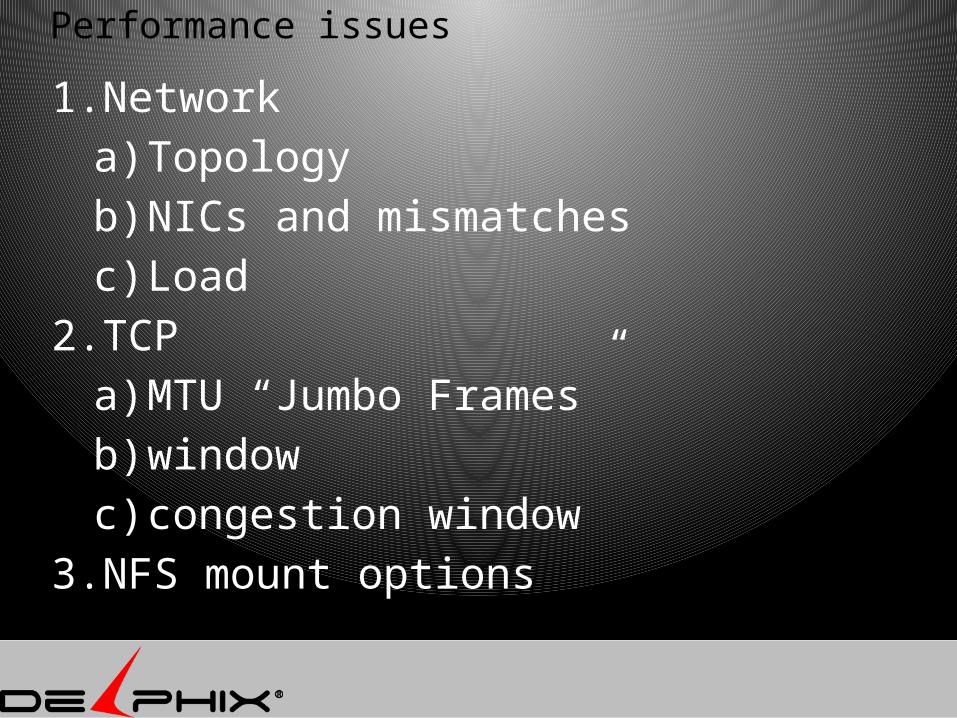
Performance issues
1. Networka) Topologyb) NICs and mismatchesc) Load
2. TCPa) MTU “Jumbo Frames”b) window c) congestion window
3. NFS mount options
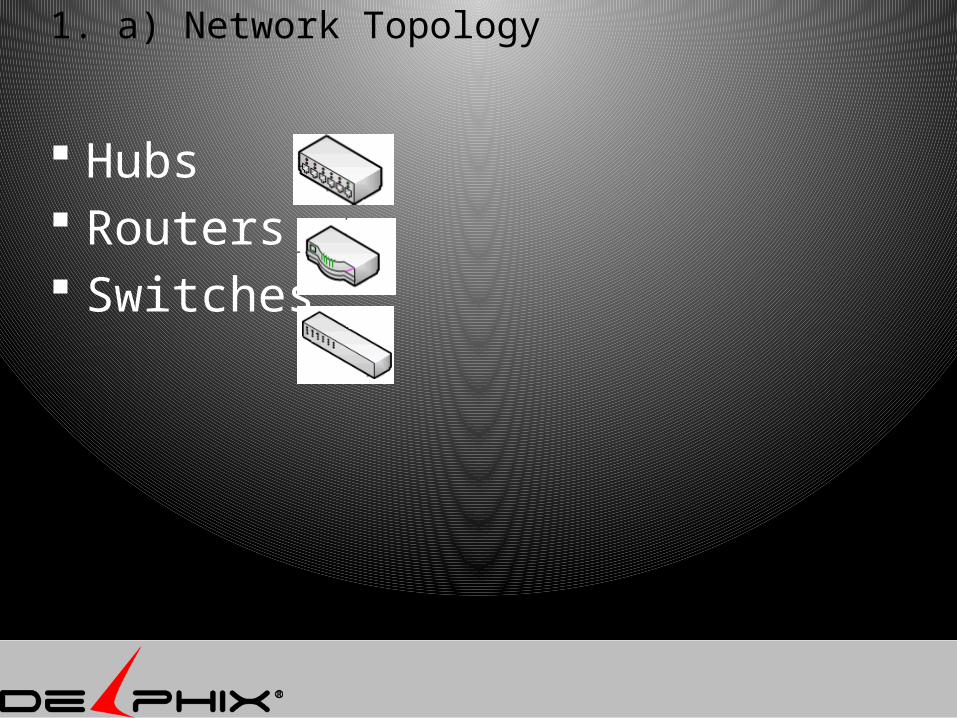
Hubs Routers Switches
1. a) Network Topology
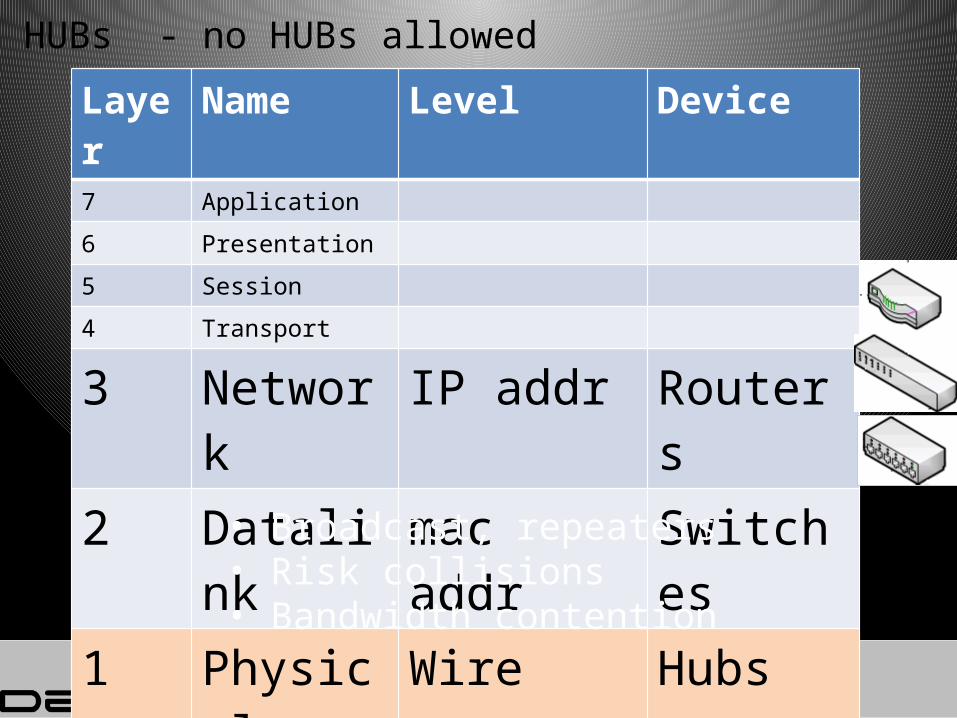
HUBs - no HUBs allowed
Layer
Name Level Device
7 Application
6 Presentation
5 Session
4 Transport
3 Network
IP addr Routers
2 Datalink
mac addr Switches
1 Physical
Wire Hubs
• Broadcast, repeaters• Risk collisions• Bandwidth contention
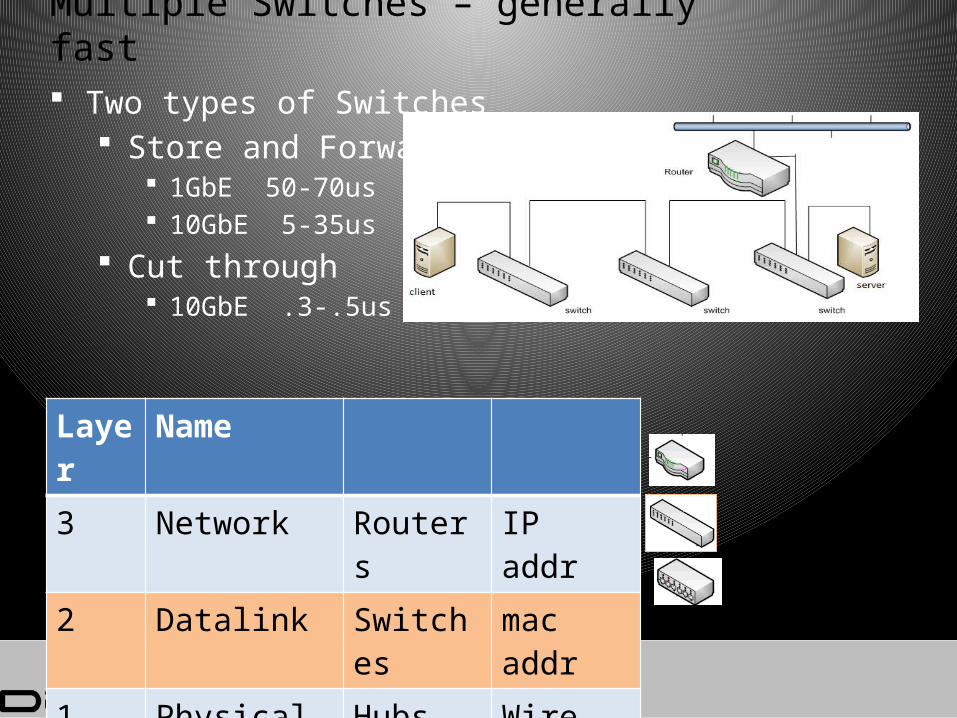
Multiple Switches – generally fast
Two types of Switches Store and Forward
1GbE 50-70us 10GbE 5-35us
Cut through 10GbE .3-.5us
Layer
Name
3 Network Routers IP addr
2 Datalink Switches
mac addr
1 Physical Hubs Wire
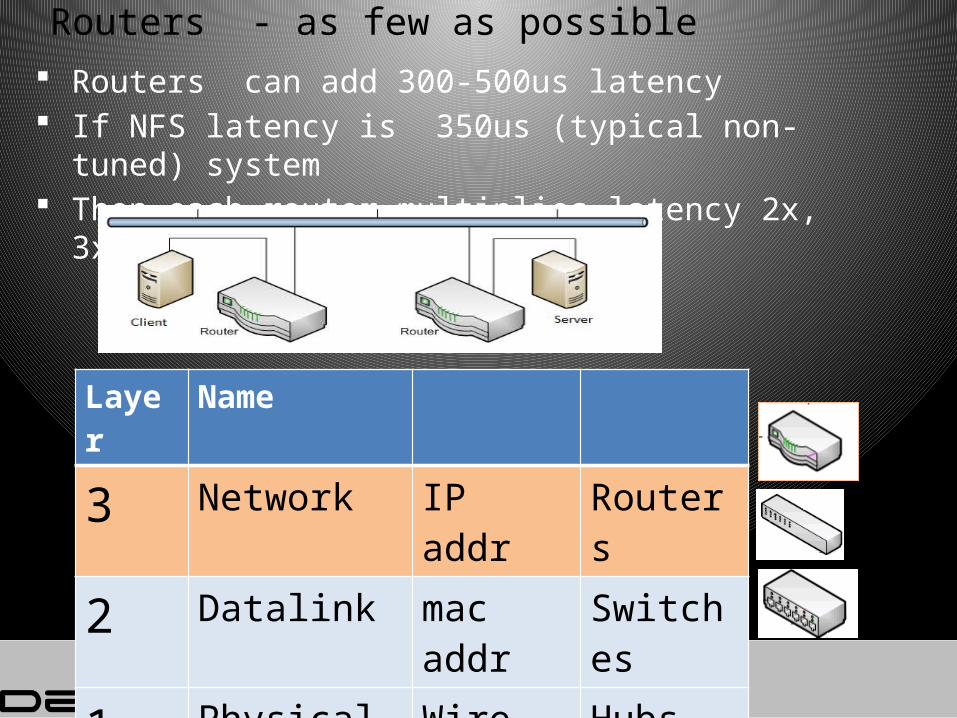
Routers - as few as possible Routers can add 300-500us latency If NFS latency is 350us (typical non-tuned) system Then each router multiplies latency 2x, 3x, 4x etc
Layer
Name
3 Network IP addr Routers
2 Datalink mac addr
Switches
1 Physical Wire Hubs
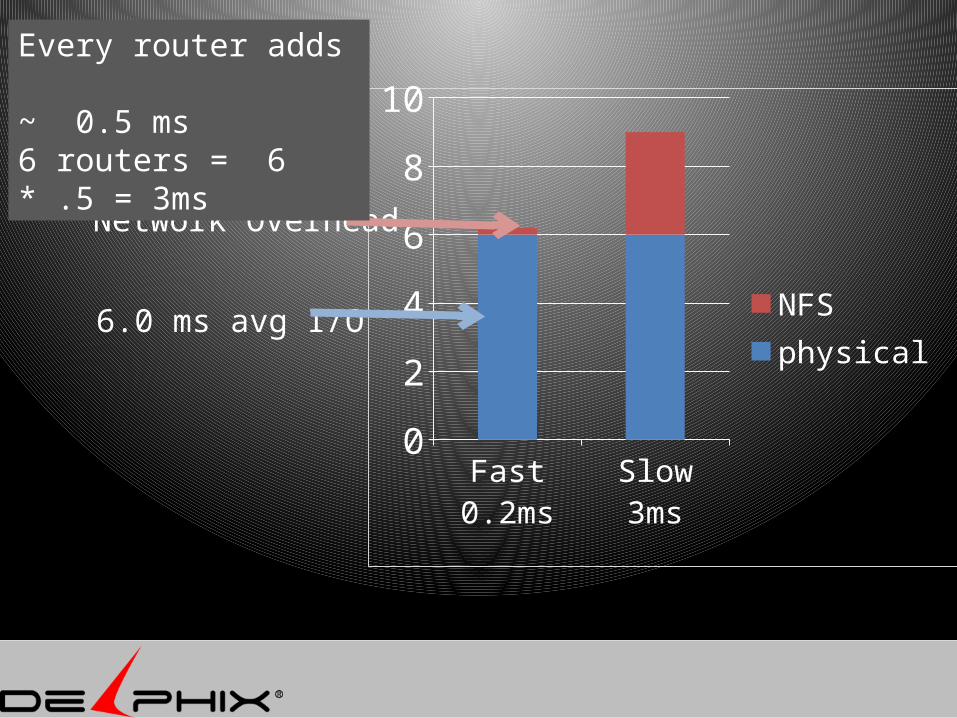
6.0 ms avg I/O
Fast 0.2ms
Slow 3ms
0
2
4
6
8
10
NFSphysical
Network Overhead
Every router adds ~ 0.5 ms6 routers = 6 * .5 = 3ms
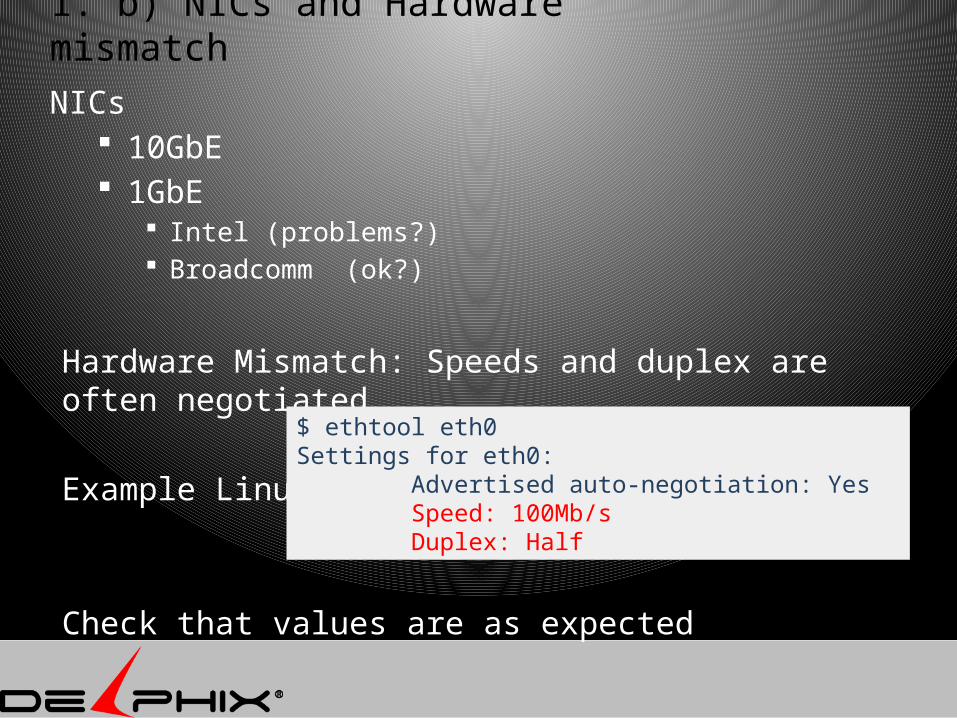
1. b) NICs and Hardware mismatch
NICs 10GbE 1GbE
Intel (problems?) Broadcomm (ok?)
Hardware Mismatch: Speeds and duplex are often negotiated
Example Linux:
Check that values are as expected
$ ethtool eth0Settings for eth0: Advertised auto-negotiation: Yes Speed: 100Mb/s Duplex: Half
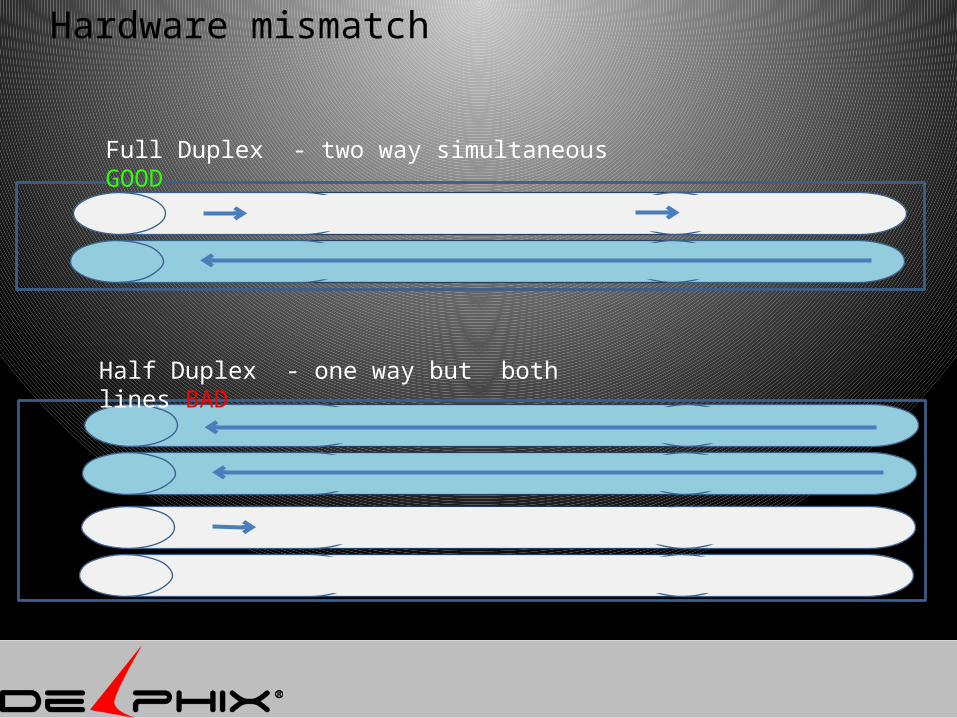
Hardware mismatch
Full Duplex - two way simultaneous GOOD
Half Duplex - one way but both lines BAD
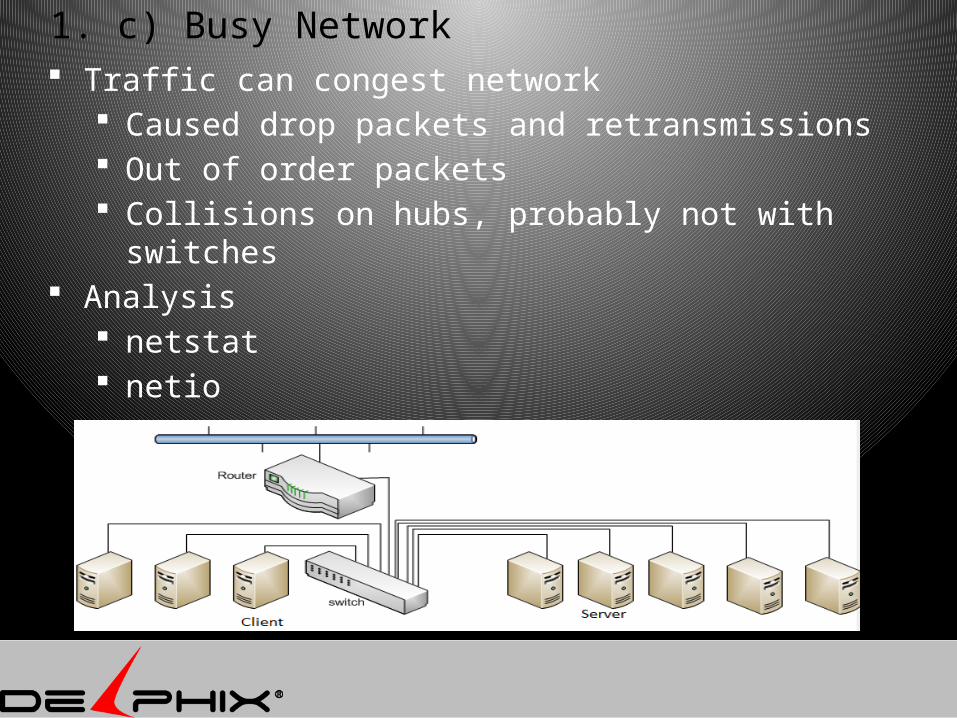
1. c) Busy Network Traffic can congest network
Caused drop packets and retransmissions Out of order packets Collisions on hubs, probably not with switches
Analysis netstat netio
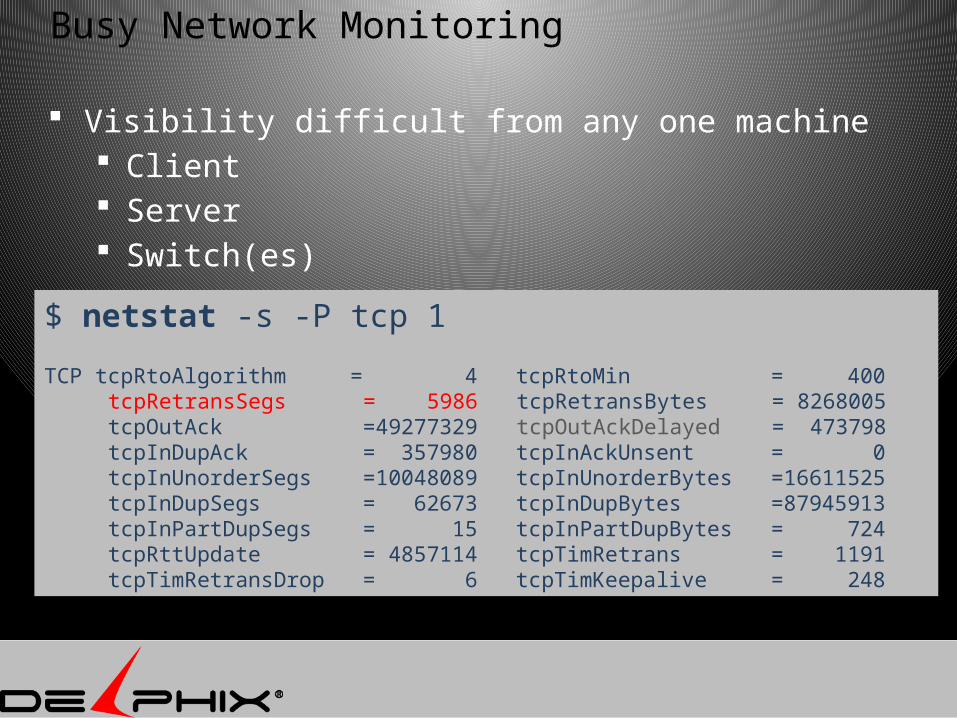
Busy Network Monitoring
Visibility difficult from any one machine Client Server Switch(es)
$ netstat -s -P tcp 1
TCP tcpRtoAlgorithm = 4 tcpRtoMin = 400 tcpRetransSegs = 5986 tcpRetransBytes = 8268005 tcpOutAck =49277329 tcpOutAckDelayed = 473798 tcpInDupAck = 357980 tcpInAckUnsent = 0 tcpInUnorderSegs =10048089 tcpInUnorderBytes =16611525 tcpInDupSegs = 62673 tcpInDupBytes =87945913 tcpInPartDupSegs = 15 tcpInPartDupBytes = 724 tcpRttUpdate = 4857114 tcpTimRetrans = 1191 tcpTimRetransDrop = 6 tcpTimKeepalive = 248
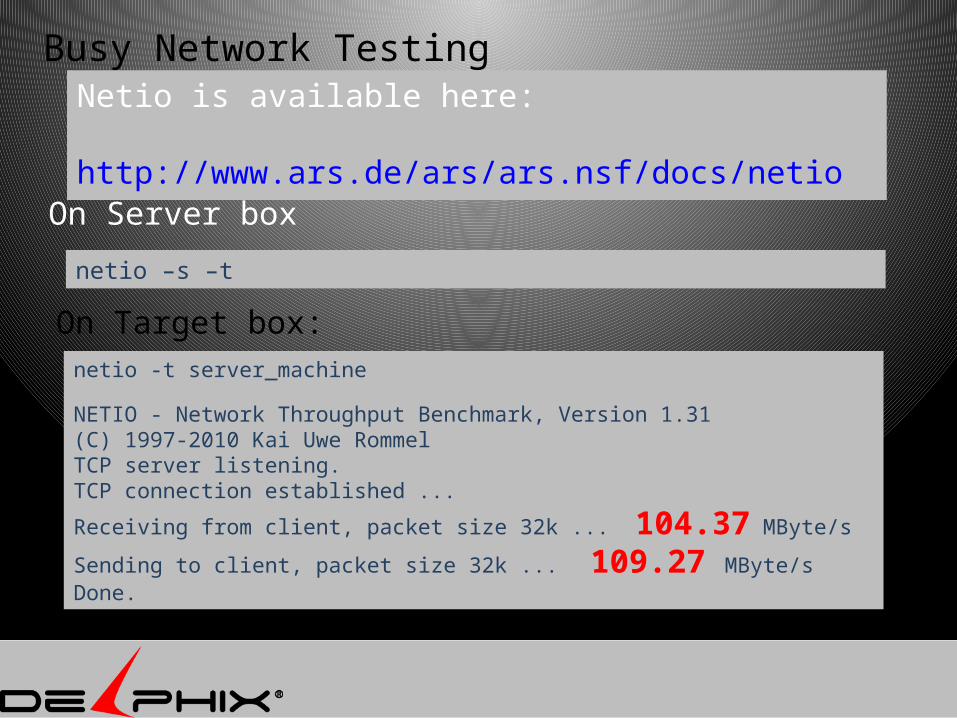
Busy Network Testing
On Server box
netio -t server_machine
NETIO - Network Throughput Benchmark, Version 1.31(C) 1997-2010 Kai Uwe RommelTCP server listening.TCP connection established ...
Receiving from client, packet size 32k ... 104.37 MByte/s
Sending to client, packet size 32k ... 109.27 MByte/sDone.
On Target box:
netio –s –t
Netio is available here: http://www.ars.de/ars/ars.nsf/docs/netio
2. TCP Configuration
a) MTU (Jumbo Frames)b) TCP window c) TCP congestion window
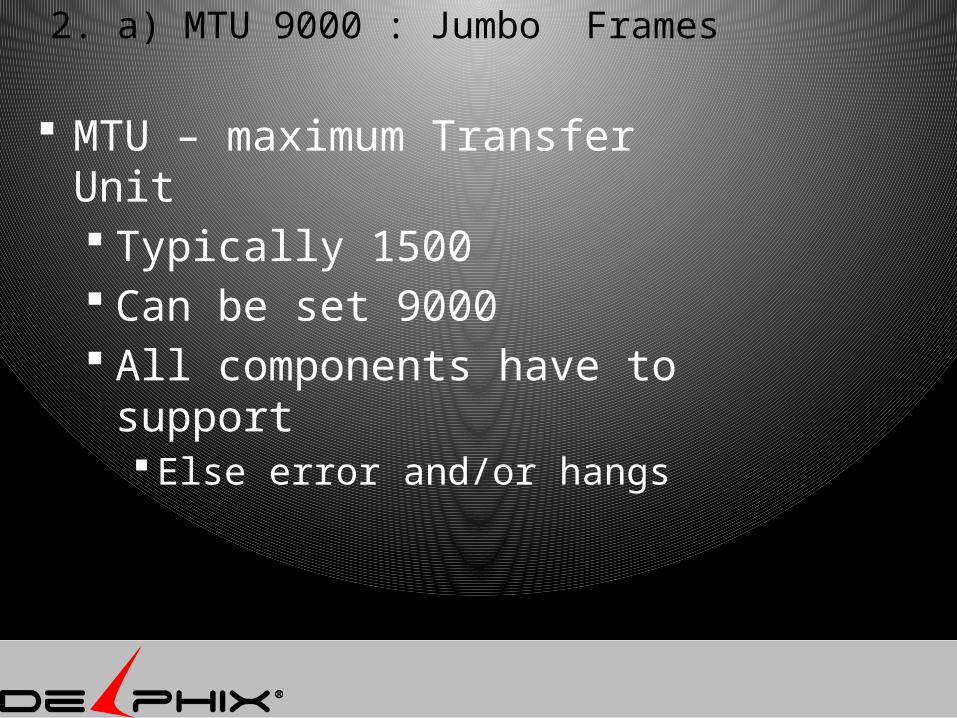
2. a) MTU 9000 : Jumbo Frames
MTU – maximum Transfer Unit Typically 1500 Can be set 9000 All components have to
support Else error and/or hangs
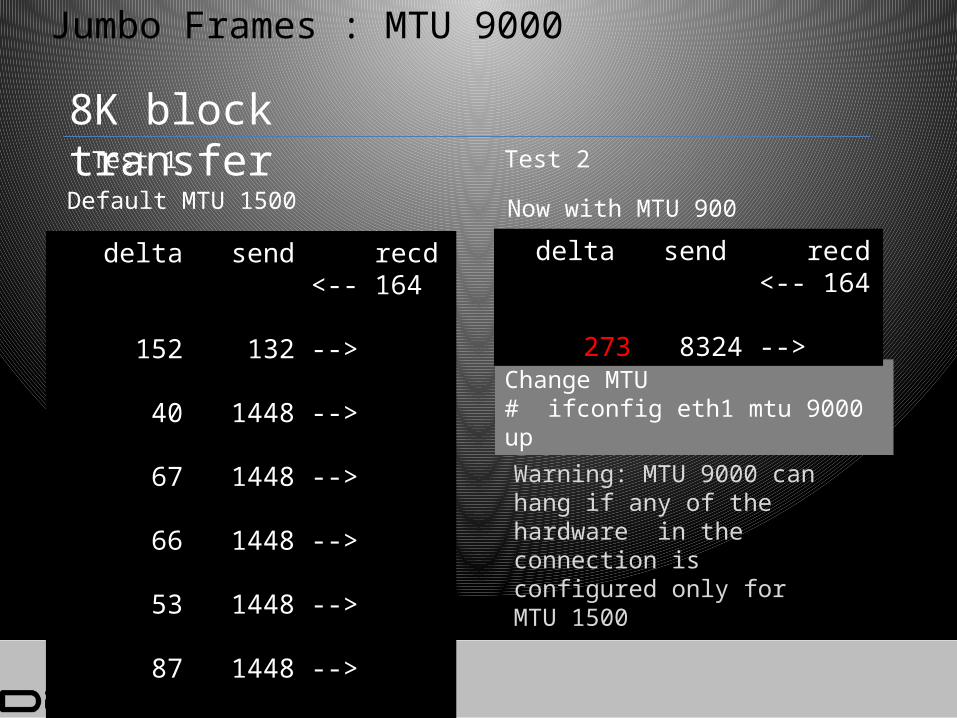
Jumbo Frames : MTU 9000
Change MTU# ifconfig eth1 mtu 9000 up
delta send recd <-- 164 273 8324 -->
delta send recd <-- 164 152 132 --> 40 1448 --> 67 1448 --> 66 1448 --> 53 1448 --> 87 1448 --> 95 952 --> = 560
Default MTU 1500
8K block transfer
Now with MTU 900
Warning: MTU 9000 can hang if any of the hardware in the connection is configured only for MTU 1500
Test 1 Test 2
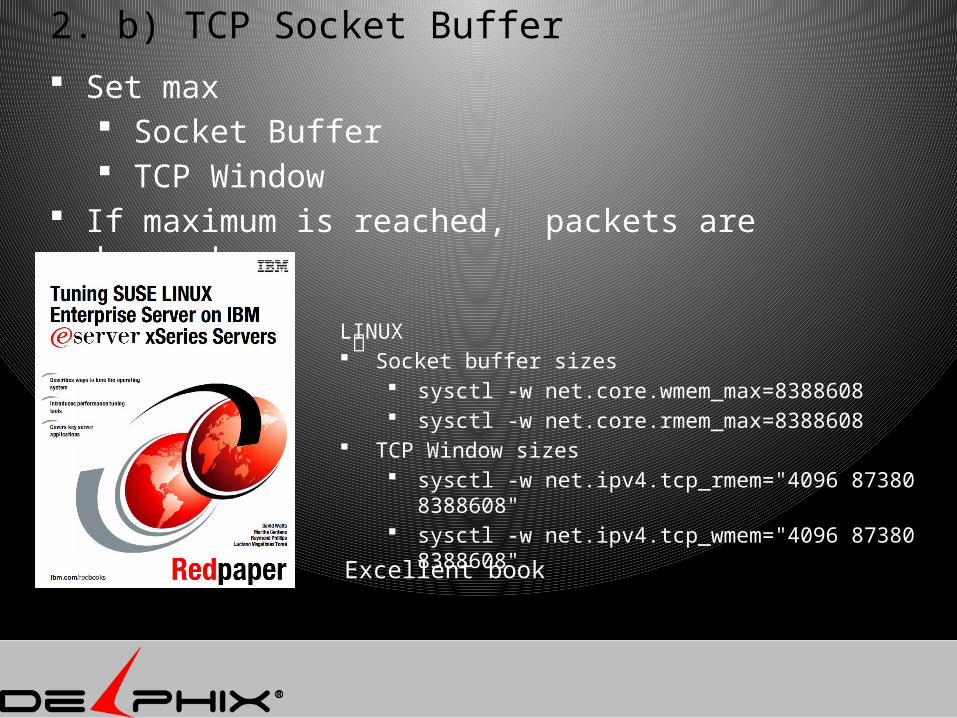
2. b) TCP Socket Buffer
LINUX Socket buffer sizes
sysctl -w net.core.wmem_max=8388608 sysctl -w net.core.rmem_max=8388608
TCP Window sizes sysctl -w net.ipv4.tcp_rmem="4096 87380
8388608" sysctl -w net.ipv4.tcp_wmem="4096 87380
8388608"Excellent book
Set max Socket Buffer TCP Window
If maximum is reached, packets are dropped.
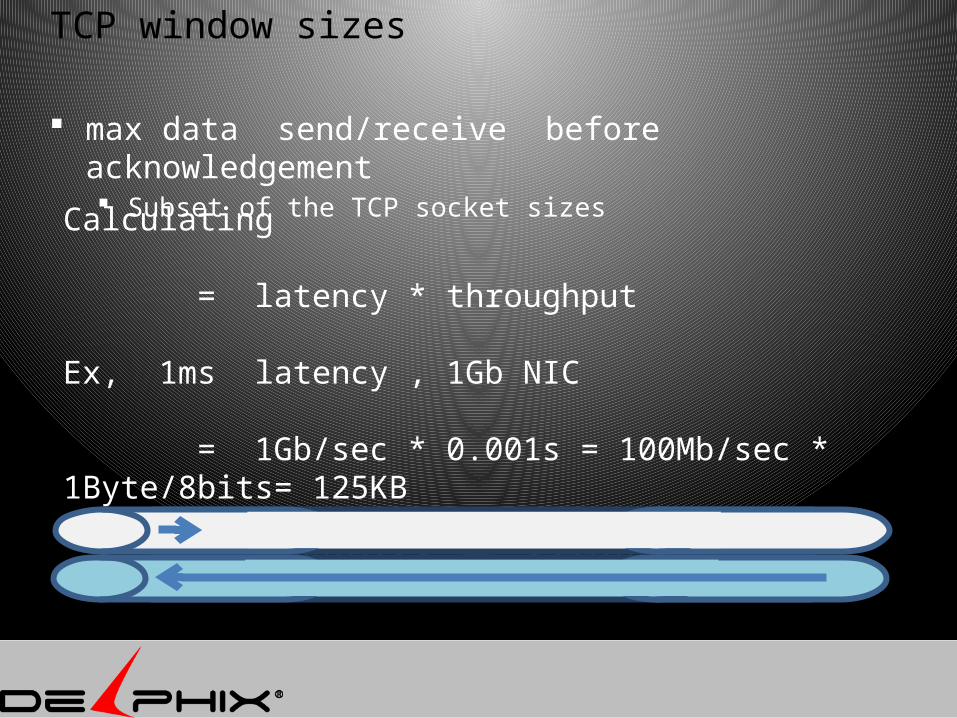
TCP window sizes
max data send/receive before acknowledgement Subset of the TCP socket sizes
Calculating
= latency * throughput
Ex, 1ms latency , 1Gb NIC
= 1Gb/sec * 0.001s = 100Mb/sec * 1Byte/8bits= 125KB
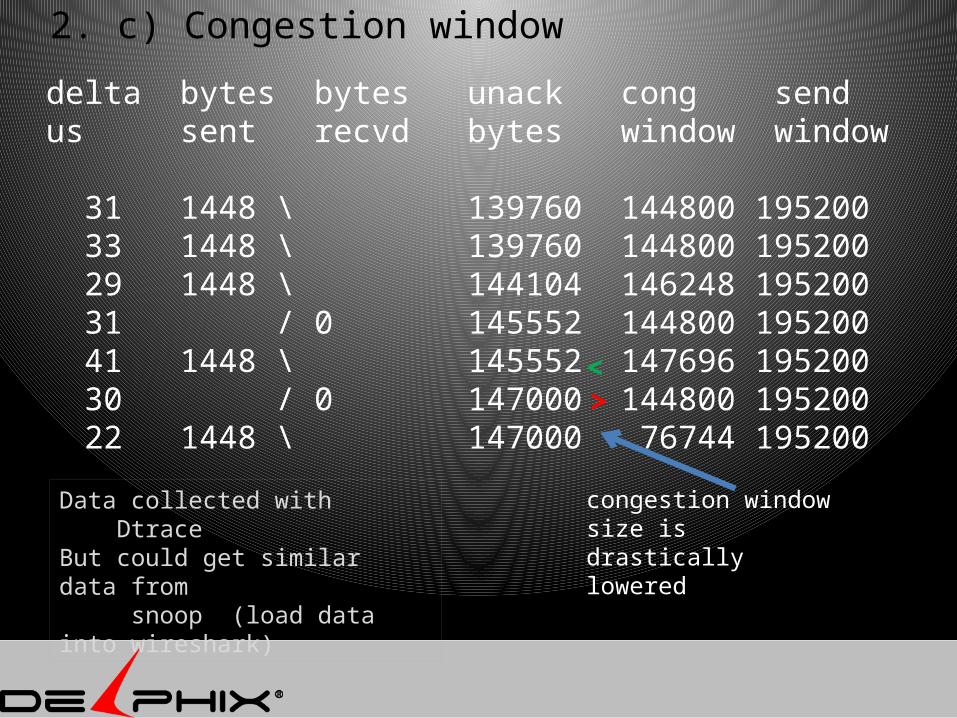
2. c) Congestion window
delta bytes bytes unack cong send us sent recvd bytes window window 31 1448 \ 139760 144800 195200 33 1448 \ 139760 144800 195200 29 1448 \ 144104 146248 195200 31 / 0 145552 144800 195200 41 1448 \ 145552 147696 195200 30 / 0 147000 144800 195200 22 1448 \ 147000 76744 195200
congestion window size is drastically lowered
Data collected with DtraceBut could get similar data from snoop (load data into wireshark)
<>
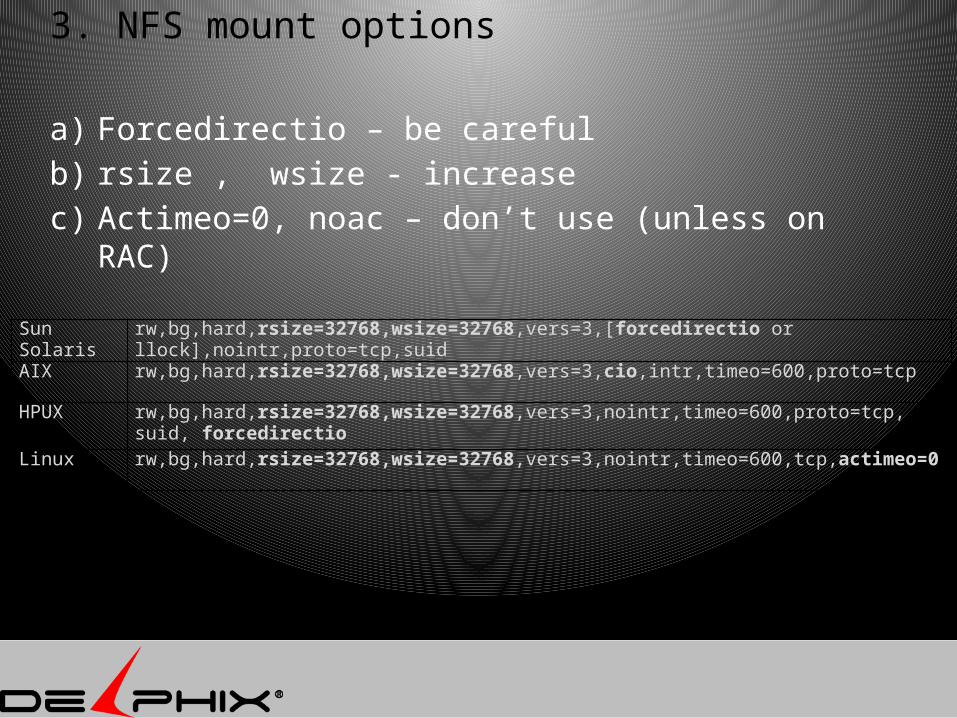
3. NFS mount options
a) Forcedirectio – be carefulb) rsize , wsize - increasec) Actimeo=0, noac – don’t use (unless on RAC)
Sun Solaris rw,bg,hard,rsize=32768,wsize=32768,vers=3,[forcedirectio or llock],nointr,proto=tcp,suid
AIX rw,bg,hard,rsize=32768,wsize=32768,vers=3,cio,intr,timeo=600,proto=tcp
HPUX rw,bg,hard,rsize=32768,wsize=32768,vers=3,nointr,timeo=600,proto=tcp, suid, forcedirectio
Linux rw,bg,hard,rsize=32768,wsize=32768,vers=3,nointr,timeo=600,tcp,actimeo=0
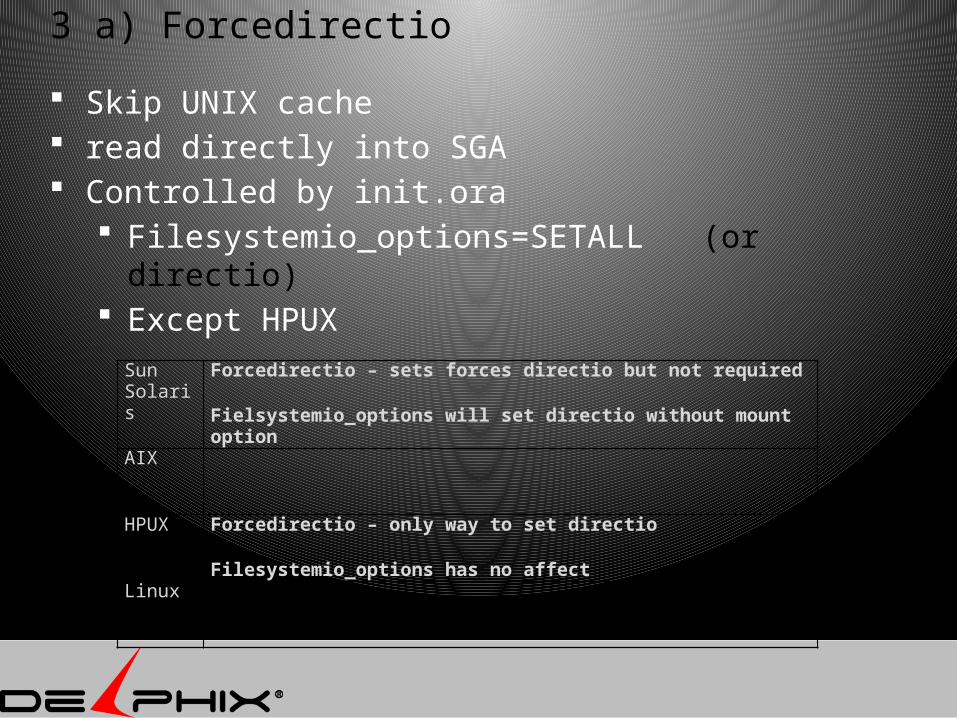
3 a) Forcedirectio
Skip UNIX cache read directly into SGA Controlled by init.ora
Filesystemio_options=SETALL (or directio) Except HPUX
Sun Solaris
Forcedirectio – sets forces directio but not required
Fielsystemio_options will set directio without mount optionAIX
HPUX Forcedirectio – only way to set directio
Filesystemio_options has no affectLinux
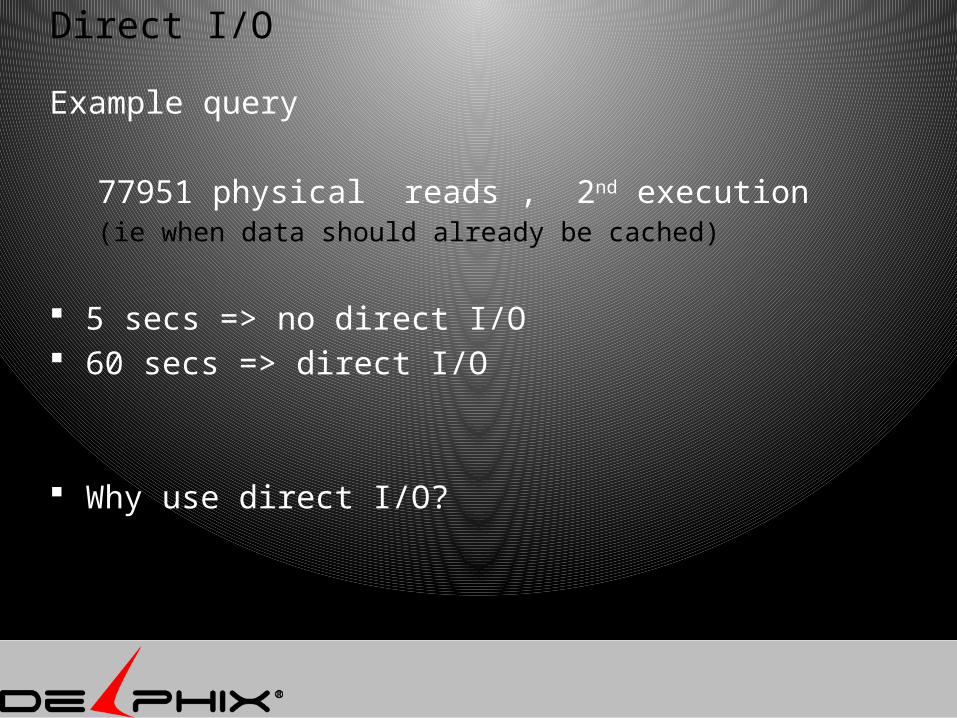
Direct I/O
Example query
77951 physical reads , 2nd execution (ie when data should already be cached)
5 secs => no direct I/O 60 secs => direct I/O
Why use direct I/O?
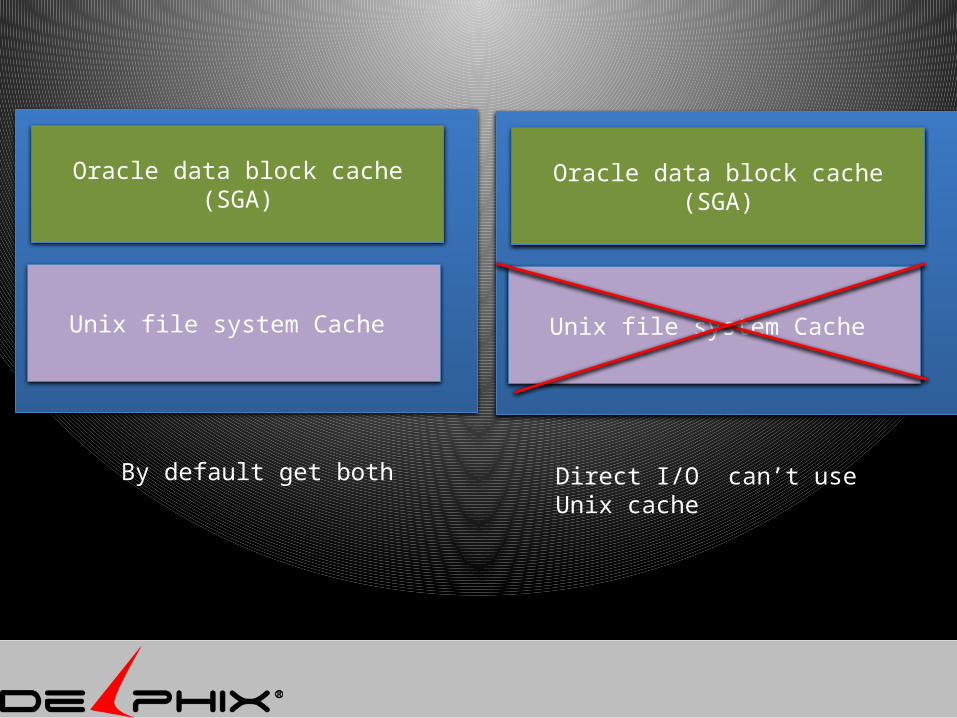
Oracle data block cache (SGA)
Unix file system Cache
By default get both
Oracle data block cache (SGA)
Unix file system Cache
Direct I/O can’t use Unix cache
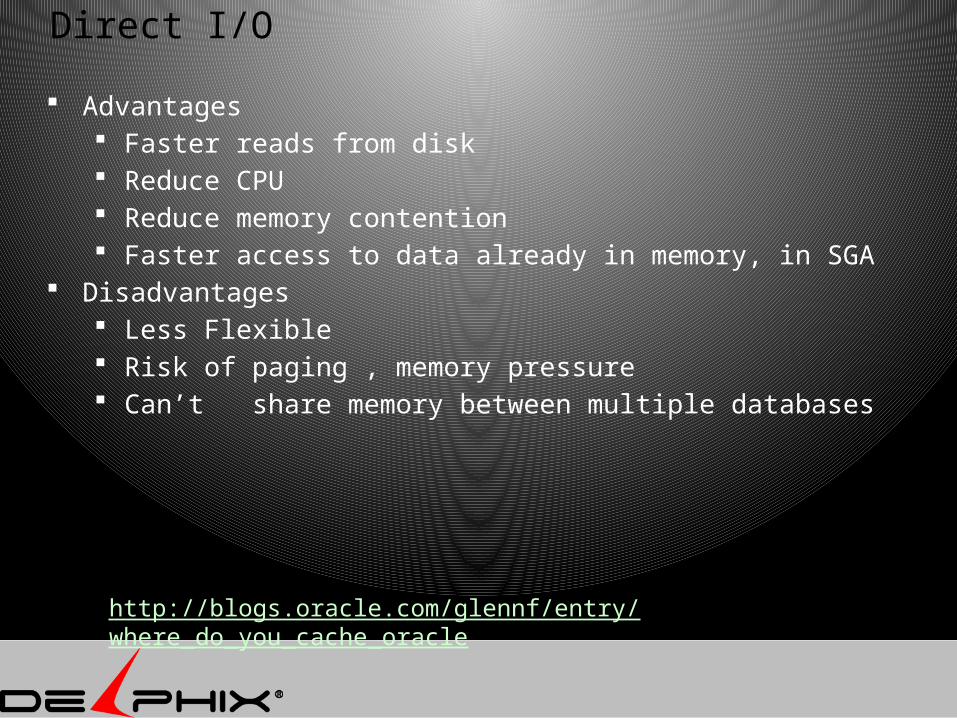
Direct I/O
Advantages Faster reads from disk Reduce CPU Reduce memory contention Faster access to data already in memory, in SGA
Disadvantages Less Flexible Risk of paging , memory pressure Can’t share memory between multiple databases
http://blogs.oracle.com/glennf/entry/where_do_you_cache_oracle
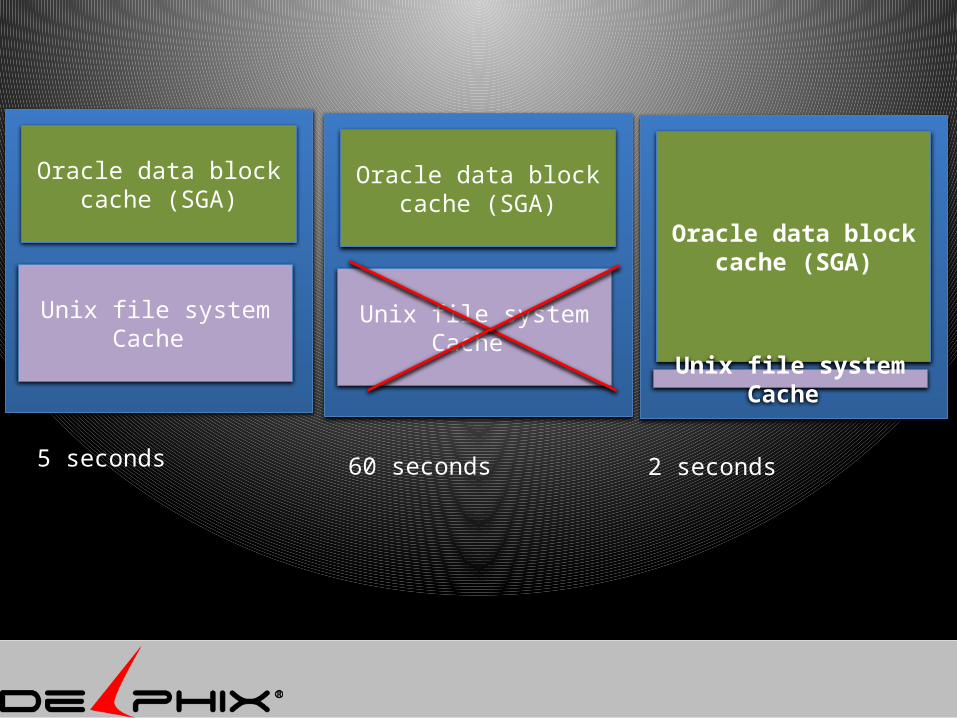
Oracle data block cache (SGA)
Unix file system Cache
5 seconds
Oracle data block cache (SGA)
Unix file system Cache
Oracle data block cache (SGA)
Unix file system Cache
60 seconds 2 seconds
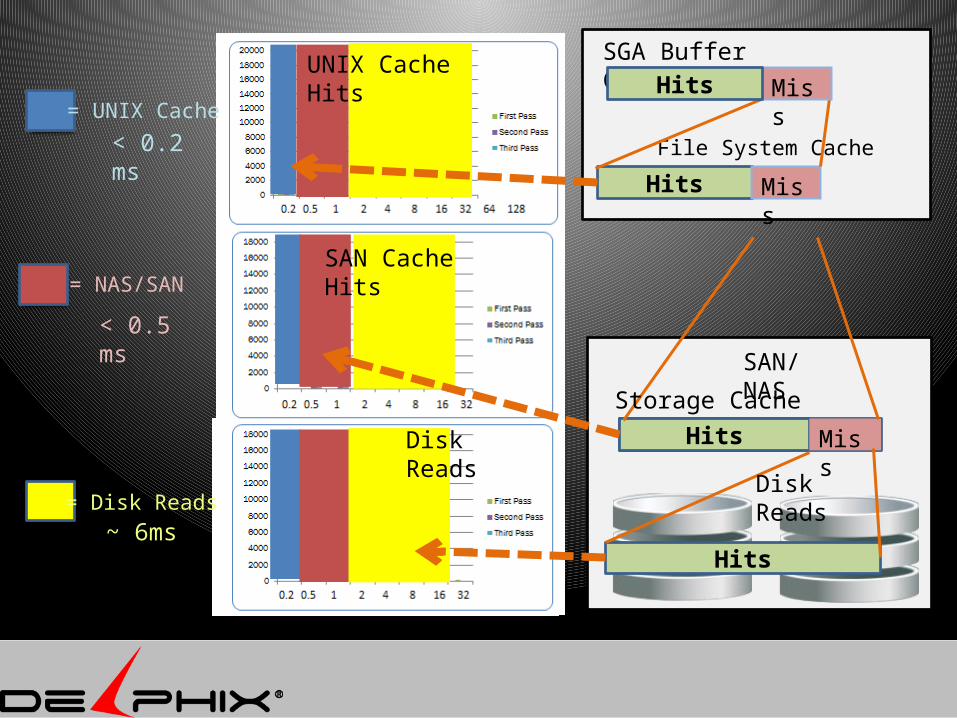
= UNIX Cache
= NAS/SAN
= Disk Reads
SGA Buffer Cache
Hits Miss
Storage Cache
Hits
SAN/NAS
Hits Miss
File System Cache
Disk Reads
Miss
HitsUNIX Cache Hits
SAN Cache Hits
Disk Reads
~ 6ms
< 0.5 ms
< 0.2 ms
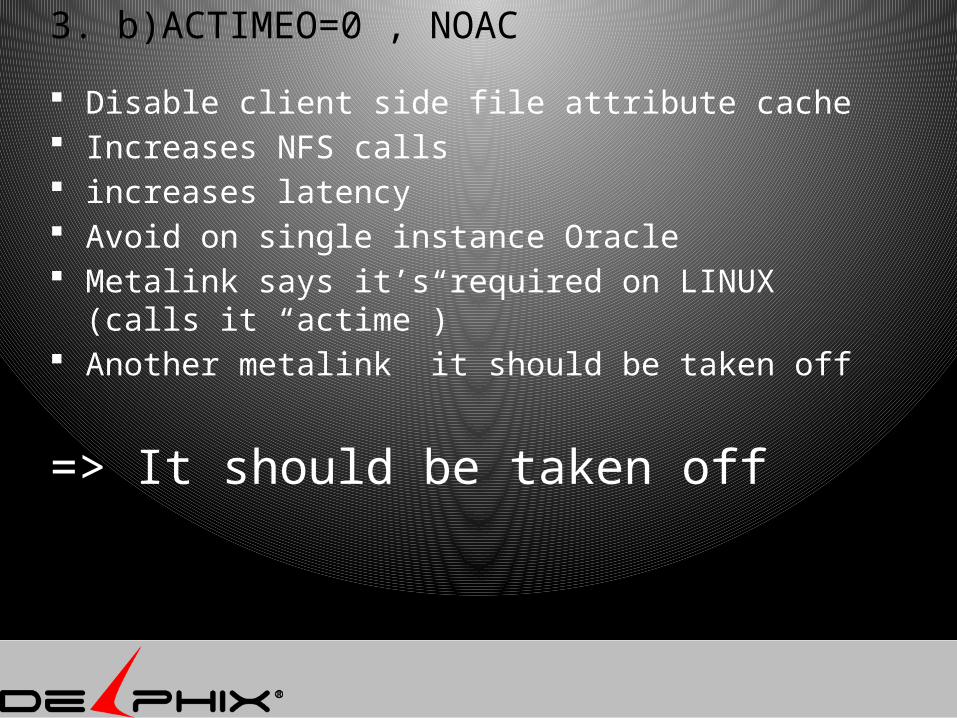
3. b)ACTIMEO=0 , NOAC
Disable client side file attribute cache Increases NFS calls increases latency Avoid on single instance Oracle Metalink says it’s required on LINUX (calls it
“actime”) Another metalink it should be taken off
=> It should be taken off
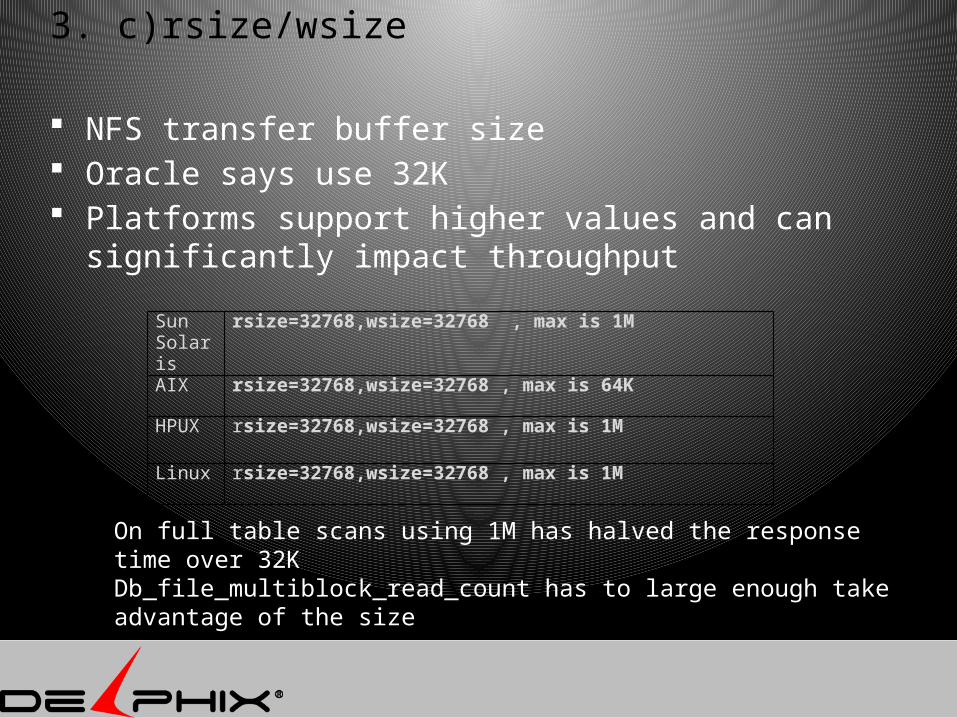
3. c)rsize/wsize
NFS transfer buffer size Oracle says use 32K Platforms support higher values and can
significantly impact throughput
Sun Solaris
rsize=32768,wsize=32768 , max is 1M
AIX rsize=32768,wsize=32768 , max is 64K
HPUX rsize=32768,wsize=32768 , max is 1M
Linux rsize=32768,wsize=32768 , max is 1M
On full table scans using 1M has halved the response time over 32KDb_file_multiblock_read_count has to large enough take advantage of the size
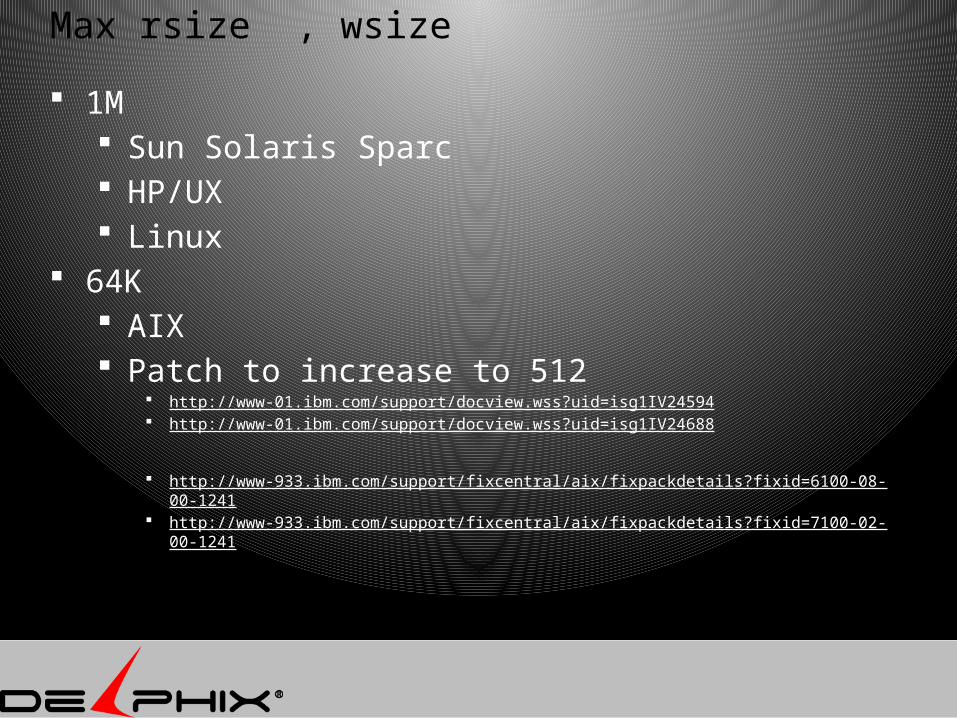
Max rsize , wsize
1M Sun Solaris Sparc HP/UX Linux
64K AIX Patch to increase to 512
http://www-01.ibm.com/support/docview.wss?uid=isg1IV24594 http://www-01.ibm.com/support/docview.wss?uid=isg1IV24688
http://www-933.ibm.com/support/fixcentral/aix/fixpackdetails?fixid=6100-08-00-1241 http://www-933.ibm.com/support/fixcentral/aix/fixpackdetails?fixid=7100-02-00-1241
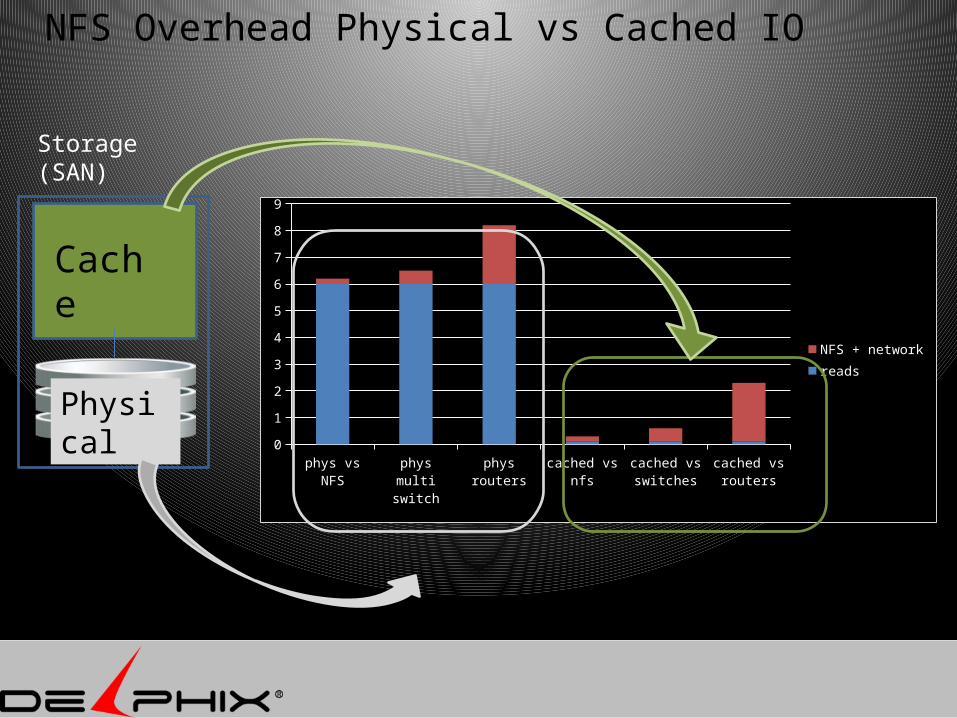
NFS Overhead Physical vs Cached IO
phys vs NFS phys multi switch
phys routers
cached vs nfs
cached vs switches
cached vs routers
0
1
2
3
4
5
6
7
8
9
NFS + networkreads
Cache
Physical
Storage(SAN)
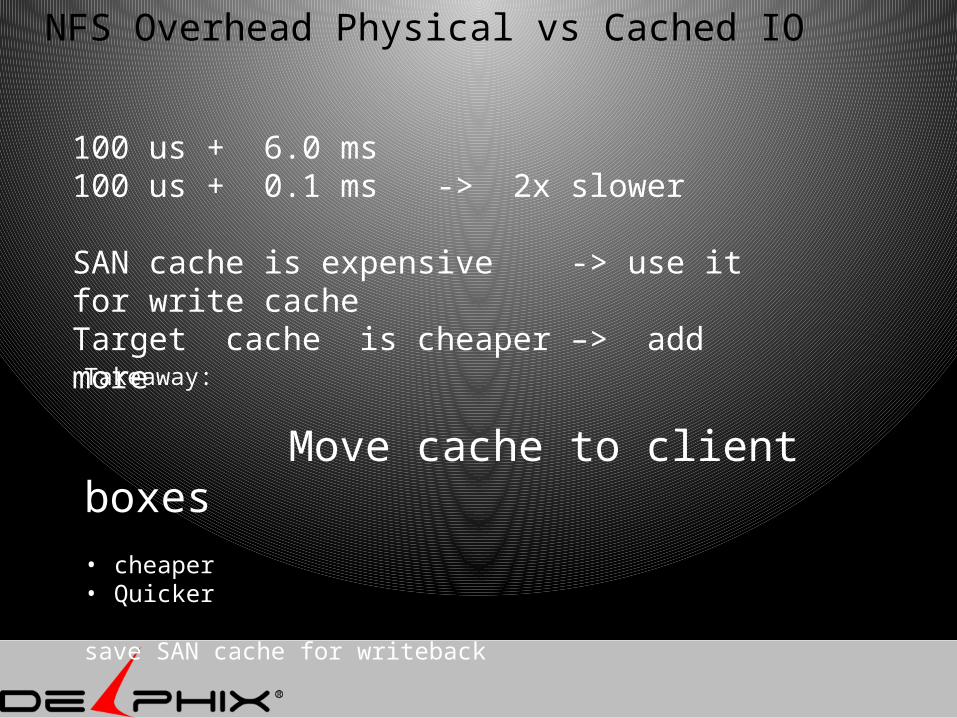
NFS Overhead Physical vs Cached IO
100 us + 6.0 ms 100 us + 0.1 ms -> 2x slower
SAN cache is expensive -> use it for write cacheTarget cache is cheaper –> add moreTakeaway:
Move cache to client boxes • cheaper • Quicker
save SAN cache for writeback
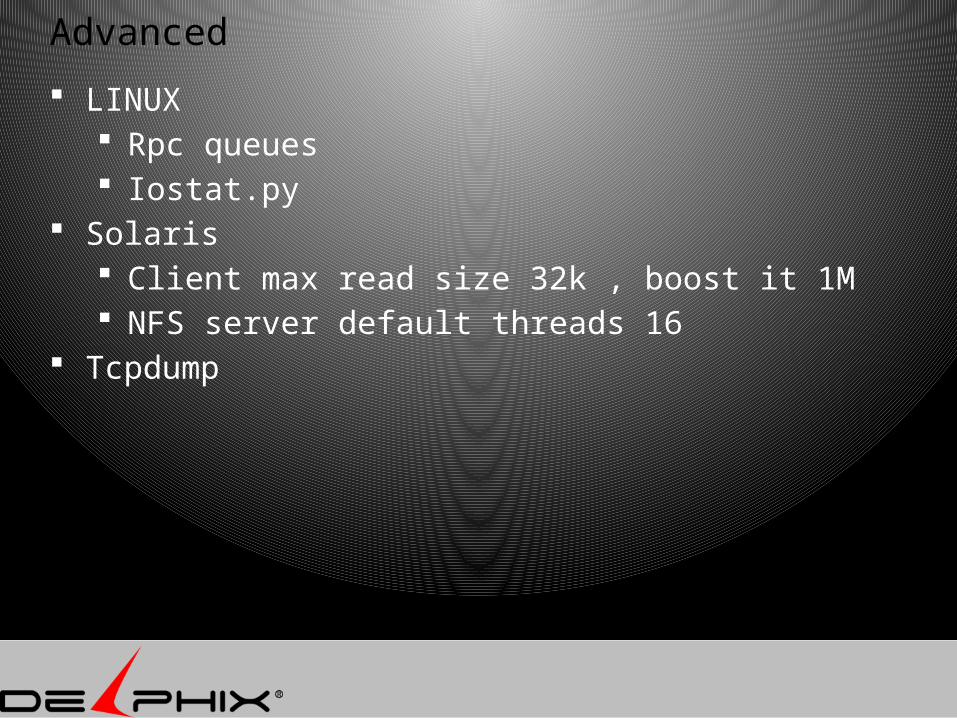
Advanced
LINUX Rpc queues Iostat.py
Solaris Client max read size 32k , boost it 1M NFS server default threads 16
Tcpdump
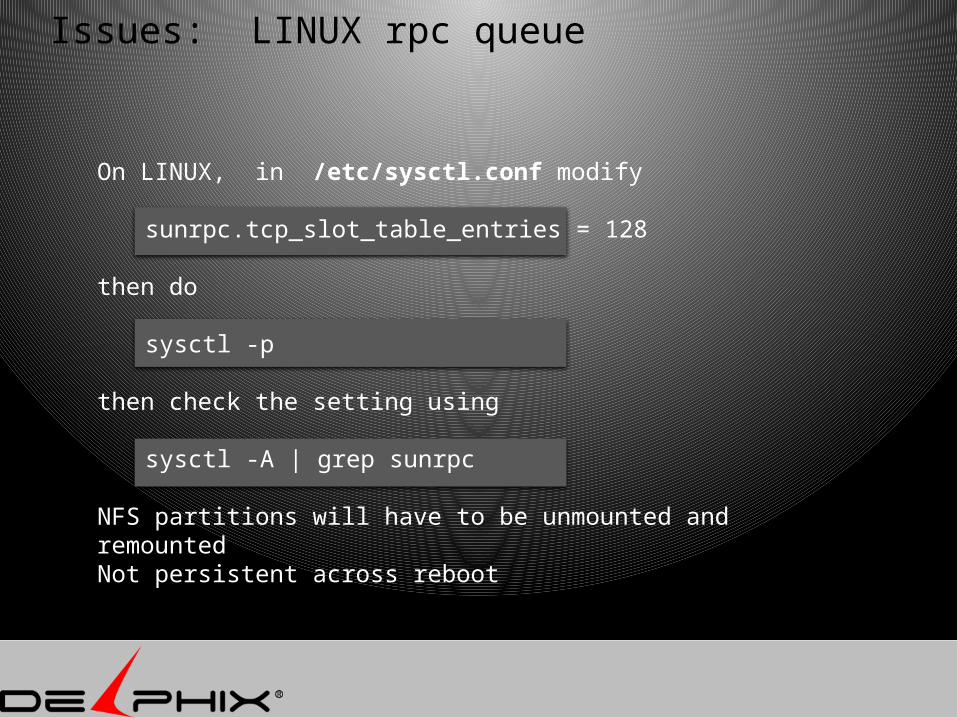
On LINUX, in /etc/sysctl.conf modify
sunrpc.tcp_slot_table_entries = 128
then do
sysctl -p
then check the setting using
sysctl -A | grep sunrpc
NFS partitions will have to be unmounted and remountedNot persistent across reboot
Issues: LINUX rpc queue
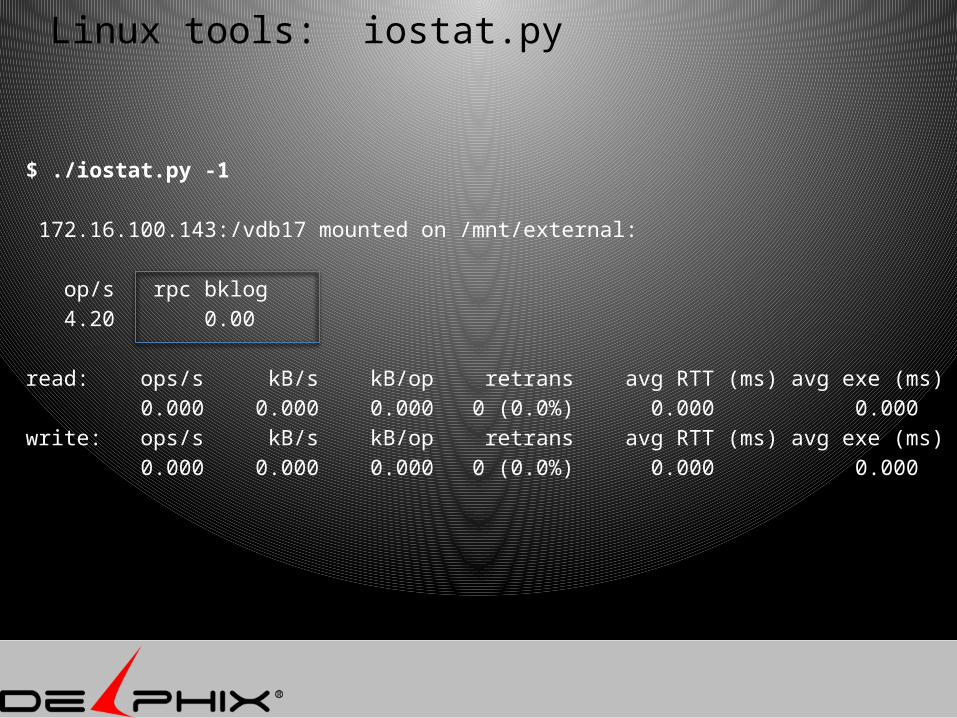
Linux tools: iostat.py
$ ./iostat.py -1
172.16.100.143:/vdb17 mounted on /mnt/external: op/s rpc bklog 4.20 0.00
read: ops/s kB/s kB/op retrans avg RTT (ms) avg exe (ms) 0.000 0.000 0.000 0 (0.0%) 0.000 0.000write: ops/s kB/s kB/op retrans avg RTT (ms) avg exe (ms) 0.000 0.000 0.000 0 (0.0%) 0.000 0.000
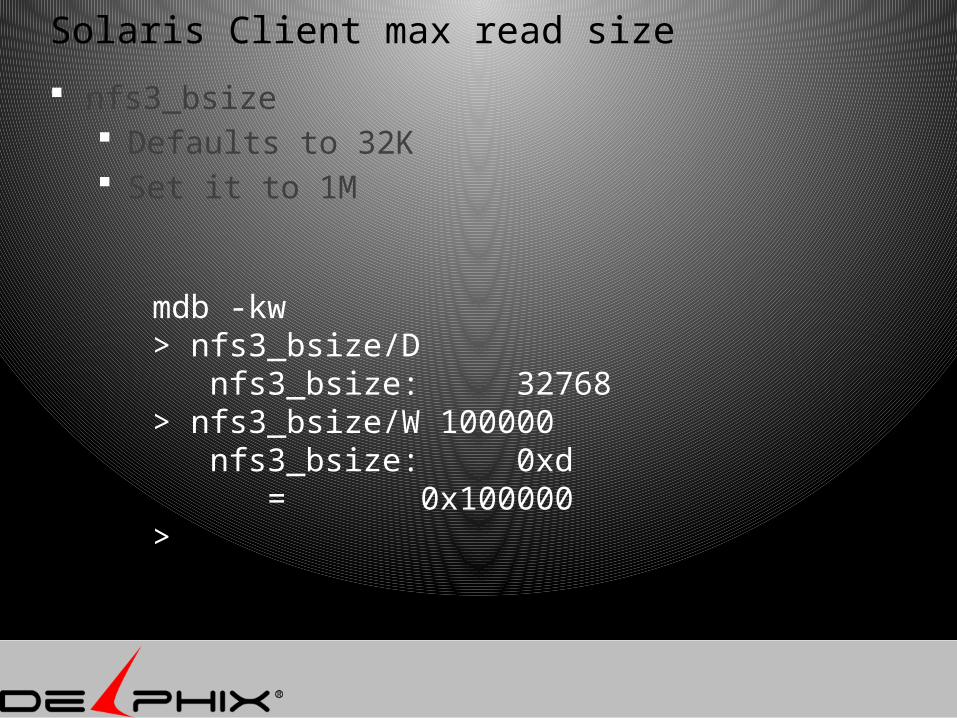
Solaris Client max read size
nfs3_bsize Defaults to 32K Set it to 1M
mdb -kw> nfs3_bsize/D nfs3_bsize: 32768> nfs3_bsize/W 100000 nfs3_bsize: 0xd = 0x100000>
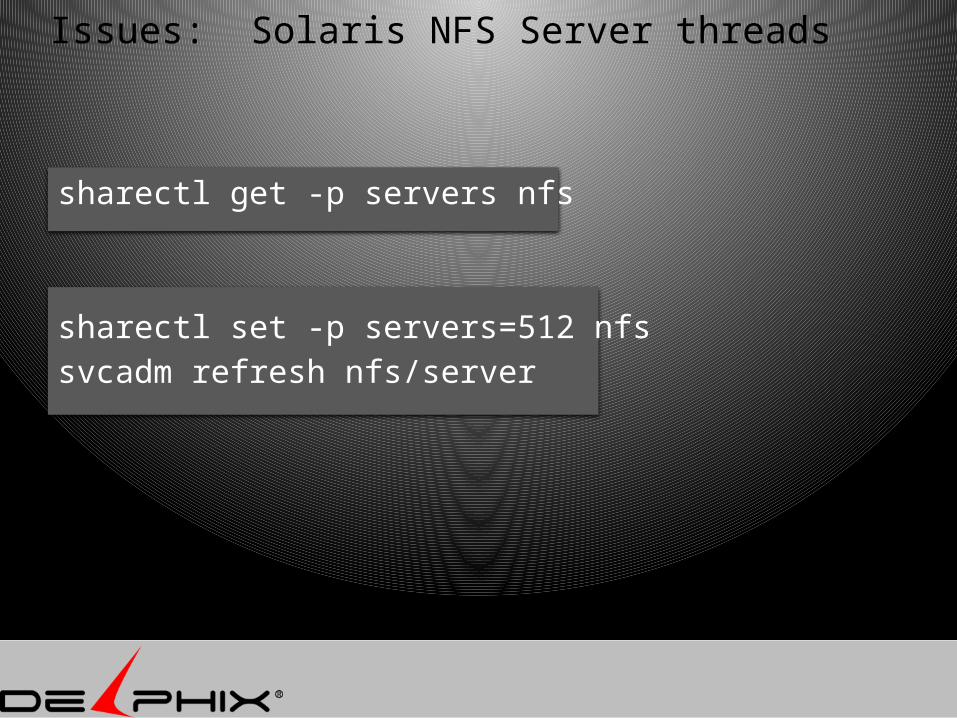
sharectl get -p servers nfs
sharectl set -p servers=512 nfssvcadm refresh nfs/server
Issues: Solaris NFS Server threads
Oracle
NFS
TCP
Network
TCP
NFS
Cache/SAN
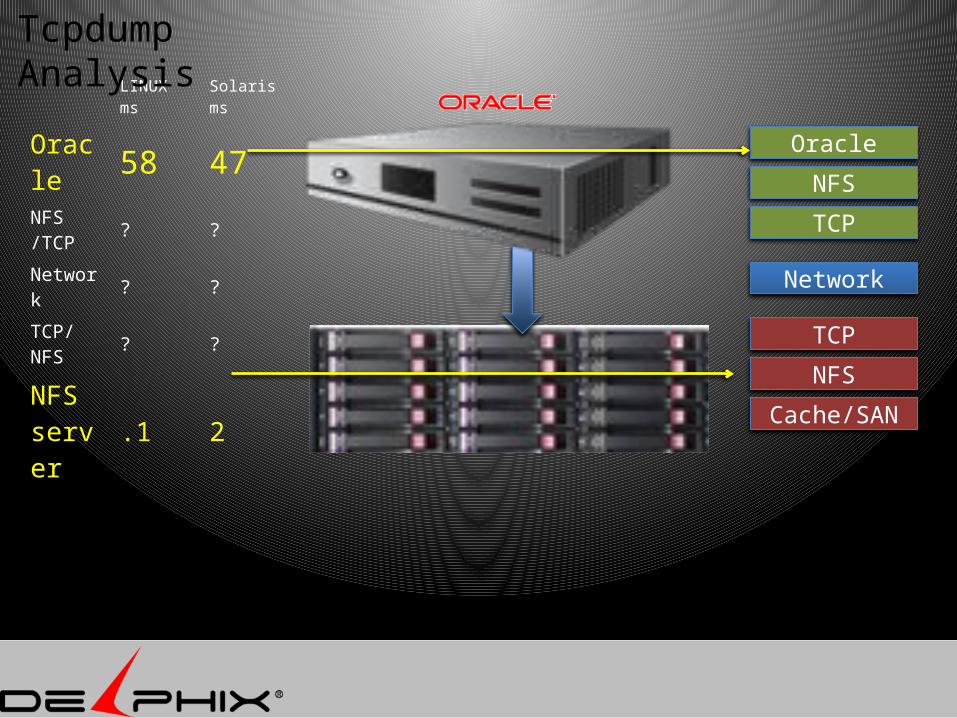
LINUXms
Solarisms
Oracle 58 47NFS /TCP
? ?
Network
? ?
TCP/NFS
? ?
NFS server
.1 2
Tcpdump Analysis
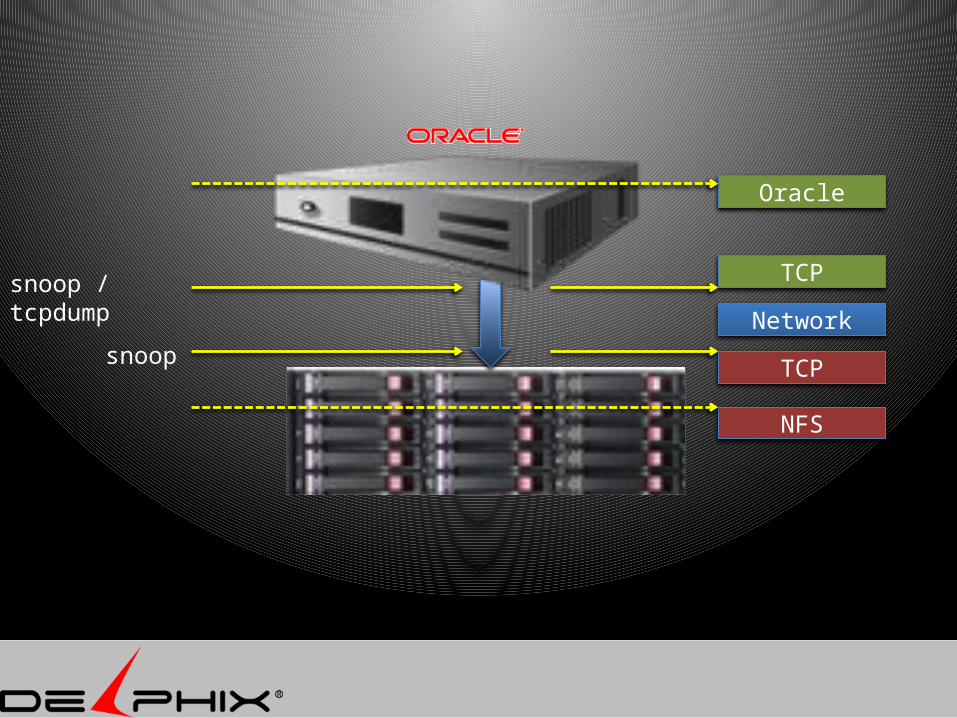
TCP
Network
TCP
snoop / tcpdump
snoop
Oracle
NFS
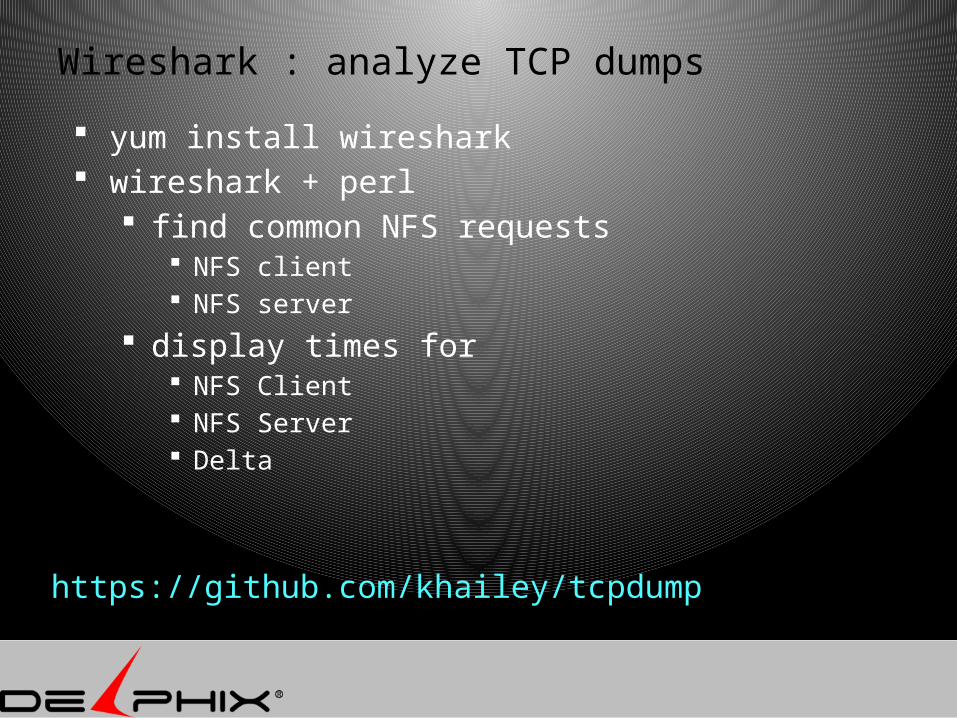
Wireshark : analyze TCP dumps
yum install wireshark wireshark + perl
find common NFS requests NFS client NFS server
display times for NFS Client NFS Server Delta
https://github.com/khailey/tcpdump
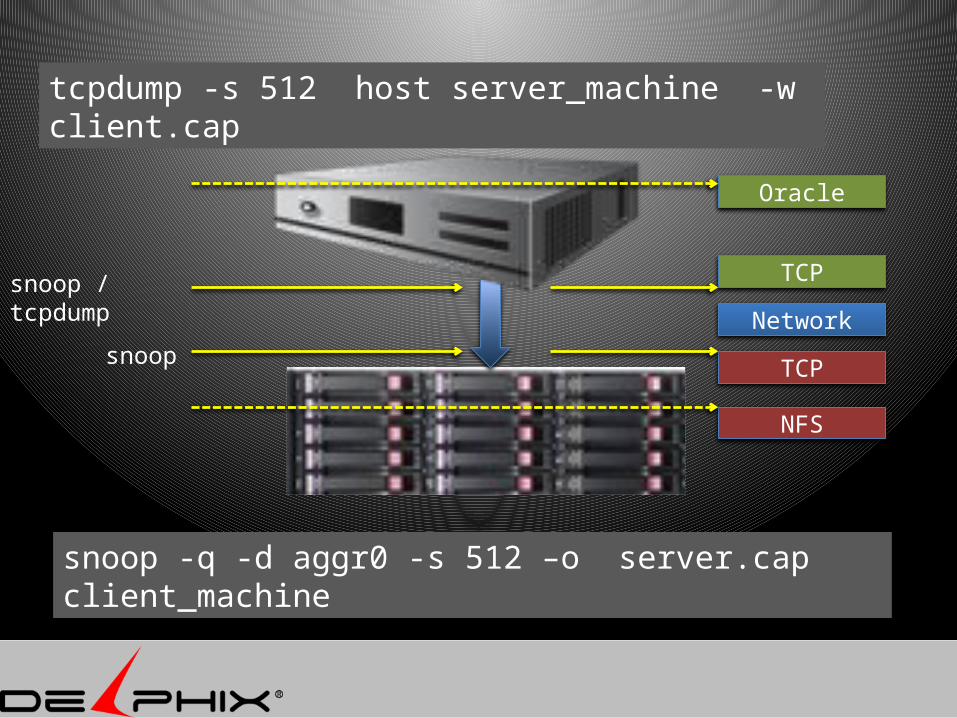
TCP
Network
TCP
snoop / tcpdump
snoop
Oracle
NFS
tcpdump -s 512 host server_machine -w client.cap
snoop -q -d aggr0 -s 512 –o server.cap client_machine
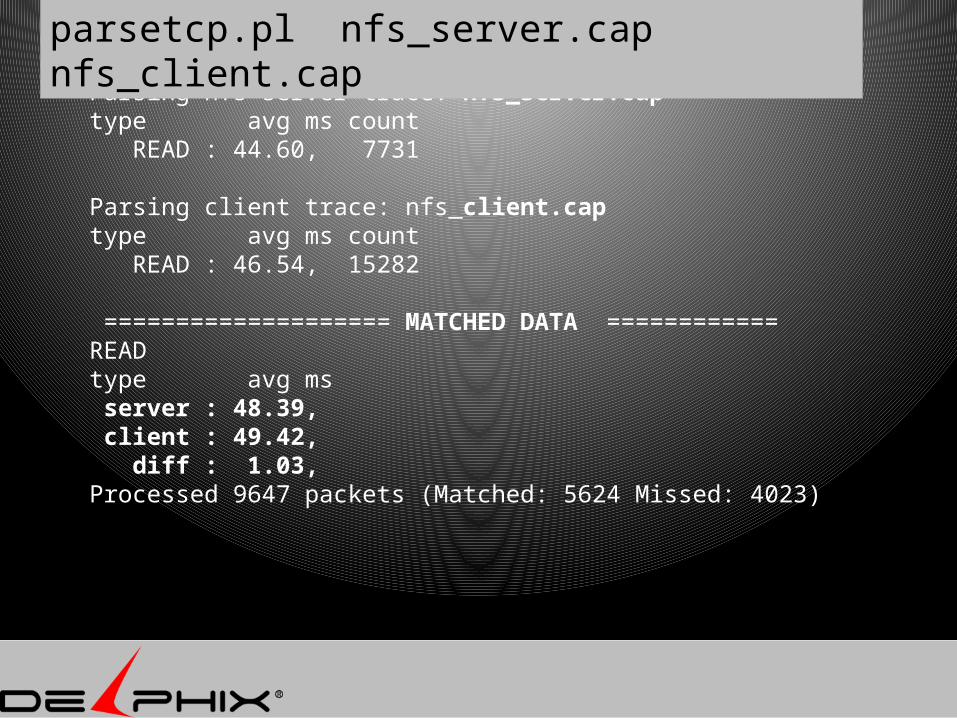
Parsing nfs server trace: nfs_server.captype avg ms count READ : 44.60, 7731
Parsing client trace: nfs_client.captype avg ms count READ : 46.54, 15282
==================== MATCHED DATA ============READtype avg ms server : 48.39, client : 49.42, diff : 1.03, Processed 9647 packets (Matched: 5624 Missed: 4023)
parsetcp.pl nfs_server.cap nfs_client.cap
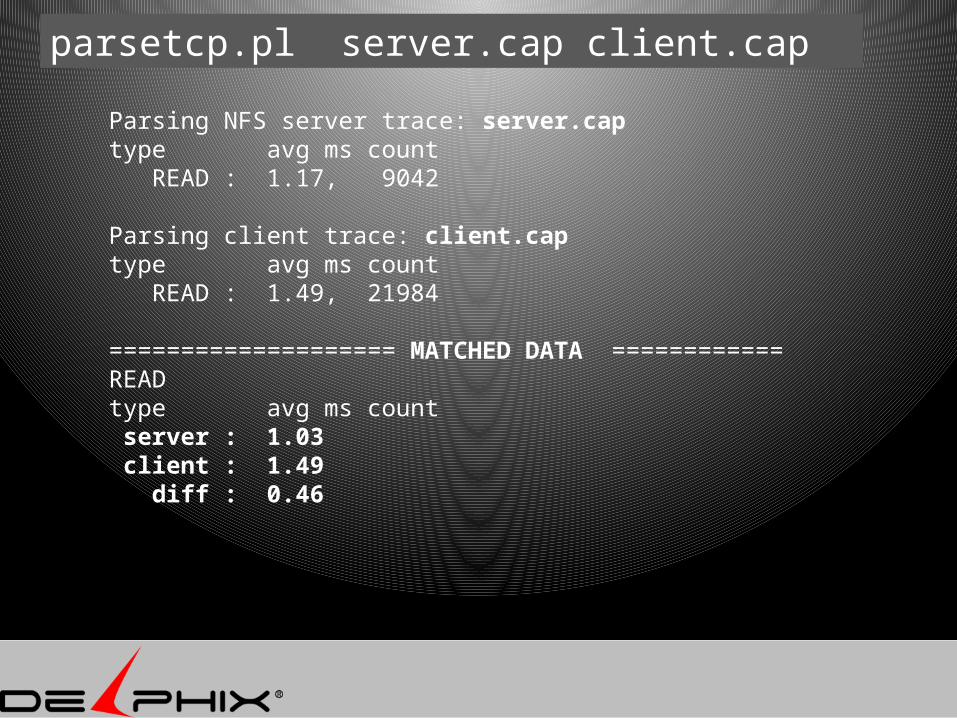
Parsing NFS server trace: server.captype avg ms count READ : 1.17, 9042
Parsing client trace: client.captype avg ms count READ : 1.49, 21984
==================== MATCHED DATA ============READtype avg ms count server : 1.03 client : 1.49 diff : 0.46
parsetcp.pl server.cap client.cap
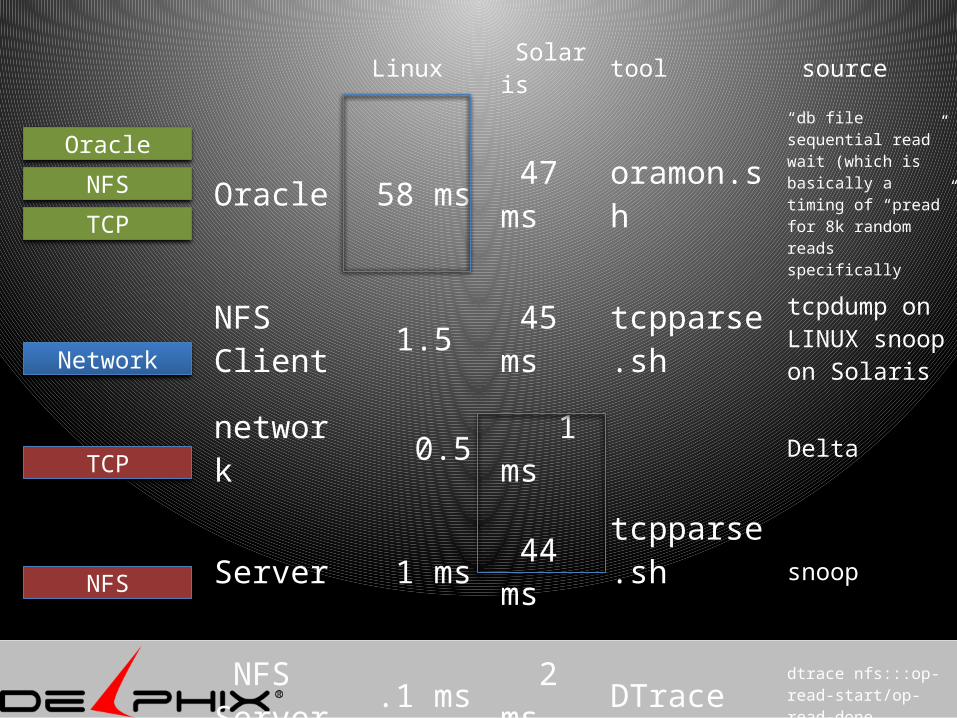
Linux Solaris tool source
Oracle 58 ms 47 ms
oramon.sh
“db file sequential read” wait (which is basically a timing of “pread” for 8k random reads specifically
NFS Client
1.5 45 ms
tcpparse.sh
tcpdump on LINUX snoop on Solaris
network 0.5 1 ms
Delta
Server 1 ms 44 ms
tcpparse.sh snoop
NFS Server
.1 ms 2 ms
DTrace dtrace nfs:::op-read-start/op-read-done
Oracle
NFS
TCP
Network
TCP
NFS
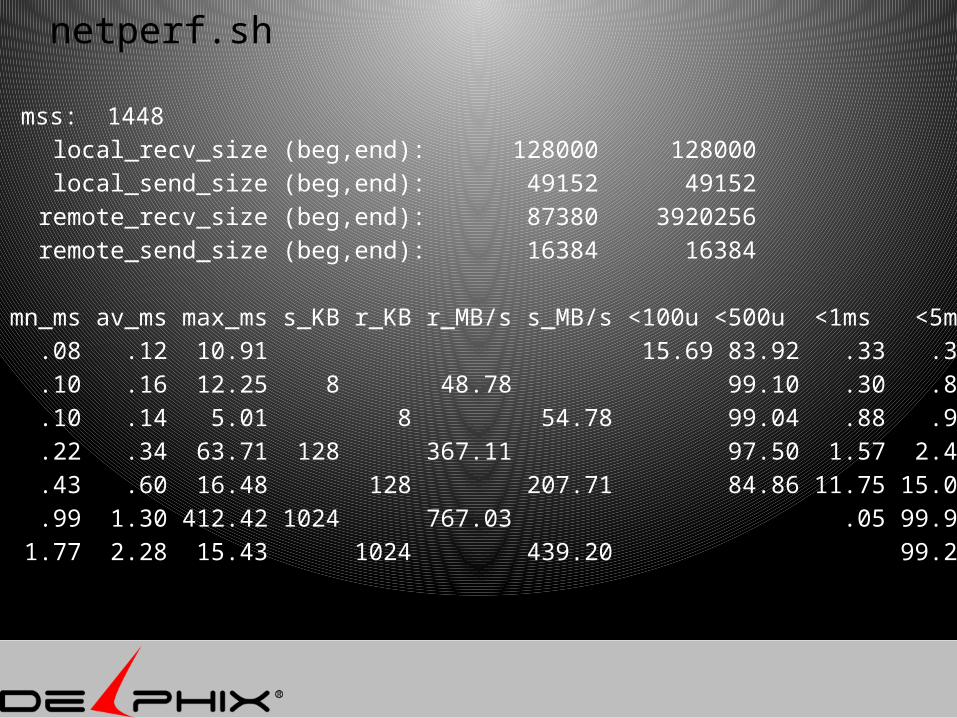
netperf.sh
mss: 1448 local_recv_size (beg,end): 128000 128000 local_send_size (beg,end): 49152 49152 remote_recv_size (beg,end): 87380 3920256 remote_send_size (beg,end): 16384 16384
mn_ms av_ms max_ms s_KB r_KB r_MB/s s_MB/s <100u <500u <1ms <5ms <10ms <50ms <100m <1s >1s p90 p99 .08 .12 10.91 15.69 83.92 .33 .38 .01 .01 .12 .54 .10 .16 12.25 8 48.78 99.10 .30 .82 .07 .08 .15 .57 .10 .14 5.01 8 54.78 99.04 .88 .96 .15 .60 .22 .34 63.71 128 367.11 97.50 1.57 2.42 .06 .07 .01 .35 .93 .43 .60 16.48 128 207.71 84.86 11.75 15.04 .05 .10 .90 1.42 .99 1.30 412.42 1024 767.03 .05 99.90 .03 .08 .03 1.30 2.25 1.77 2.28 15.43 1024 439.20 99.27 .64 .73 2.65 5.35
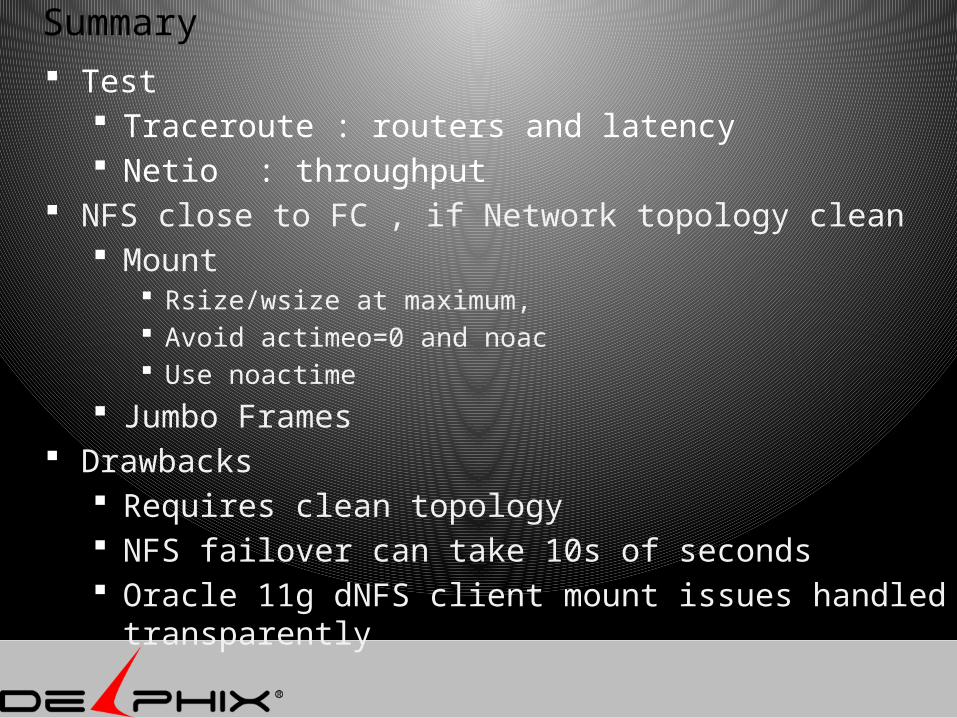
Summary Test
Traceroute : routers and latency Netio : throughput
NFS close to FC , if Network topology clean Mount
Rsize/wsize at maximum, Avoid actimeo=0 and noac Use noactime
Jumbo Frames Drawbacks
Requires clean topology NFS failover can take 10s of seconds Oracle 11g dNFS client mount issues handled
transparently

NFS
gigabit switch can be anywhere from 10 to 50 times cheaper than an FC switch
Conclusion: Give NFS some love
http://github.com/khailey
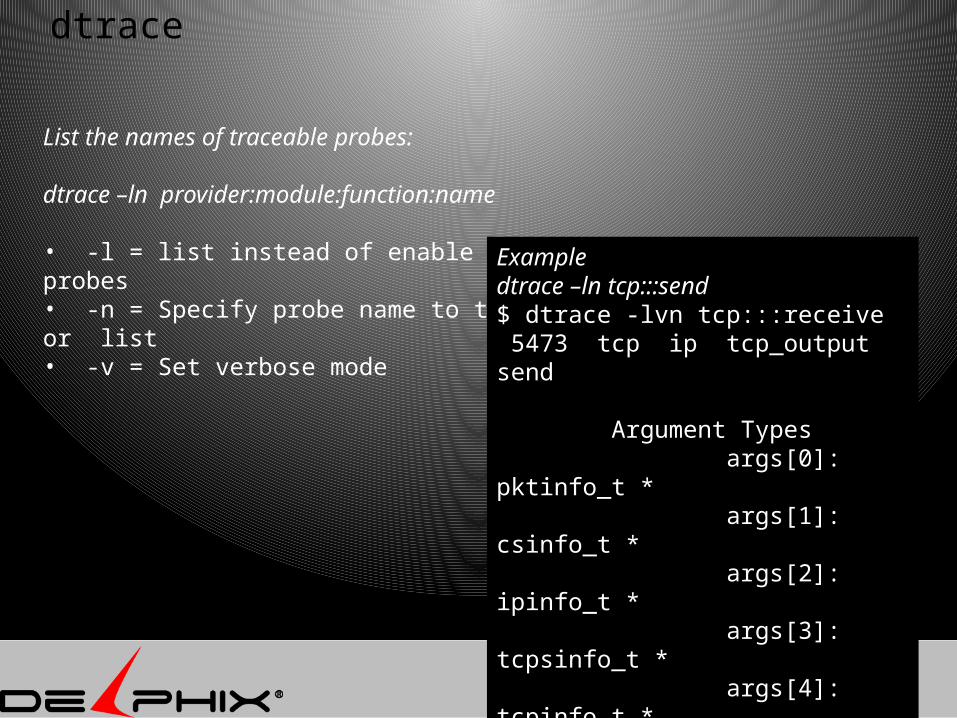
dtrace
List the names of traceable probes:
dtrace –ln provider:module:function:name
• -l = list instead of enable probes • -n = Specify probe name to trace or list• -v = Set verbose mode
Example dtrace –ln tcp:::send$ dtrace -lvn tcp:::receive 5473 tcp ip tcp_output send
Argument Types args[0]: pktinfo_t * args[1]: csinfo_t * args[2]: ipinfo_t * args[3]: tcpsinfo_t * args[4]: tcpinfo_t *
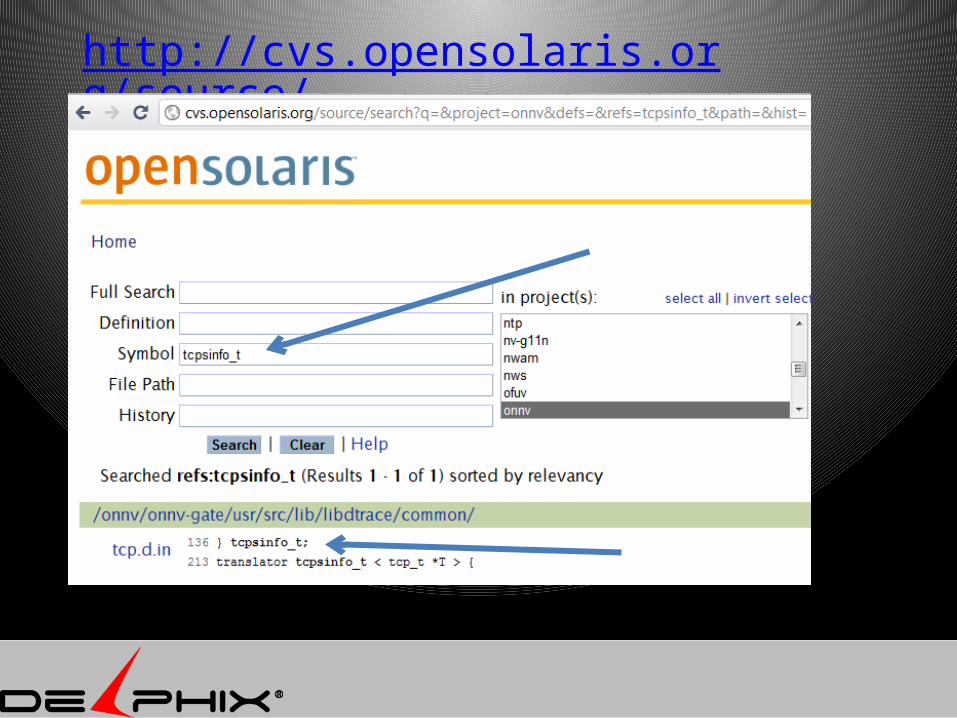
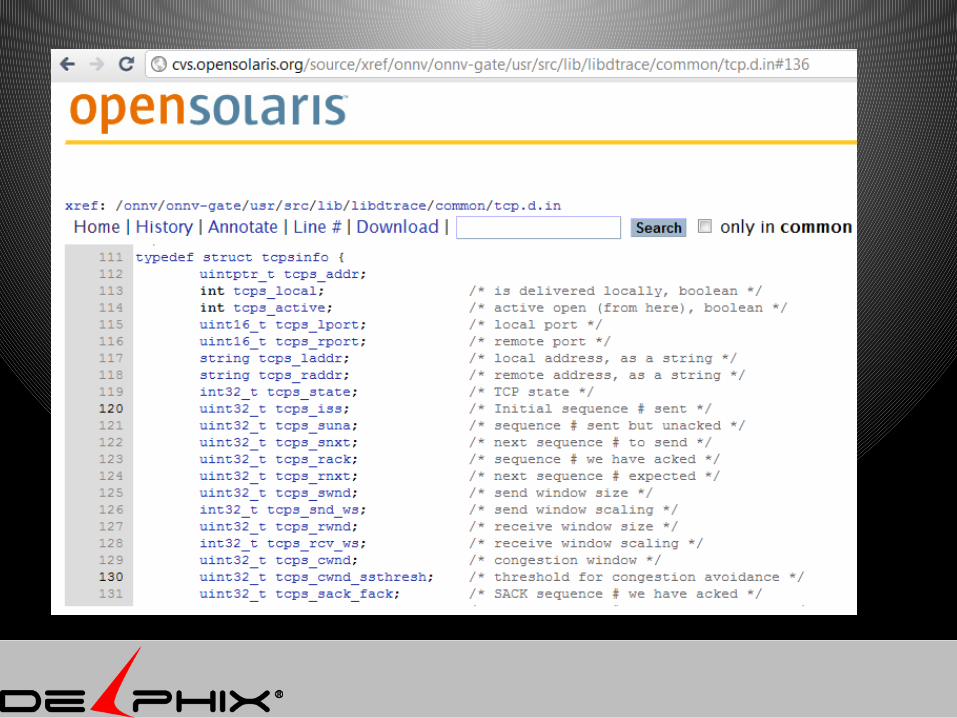
http://cvs.opensolaris.org/source/
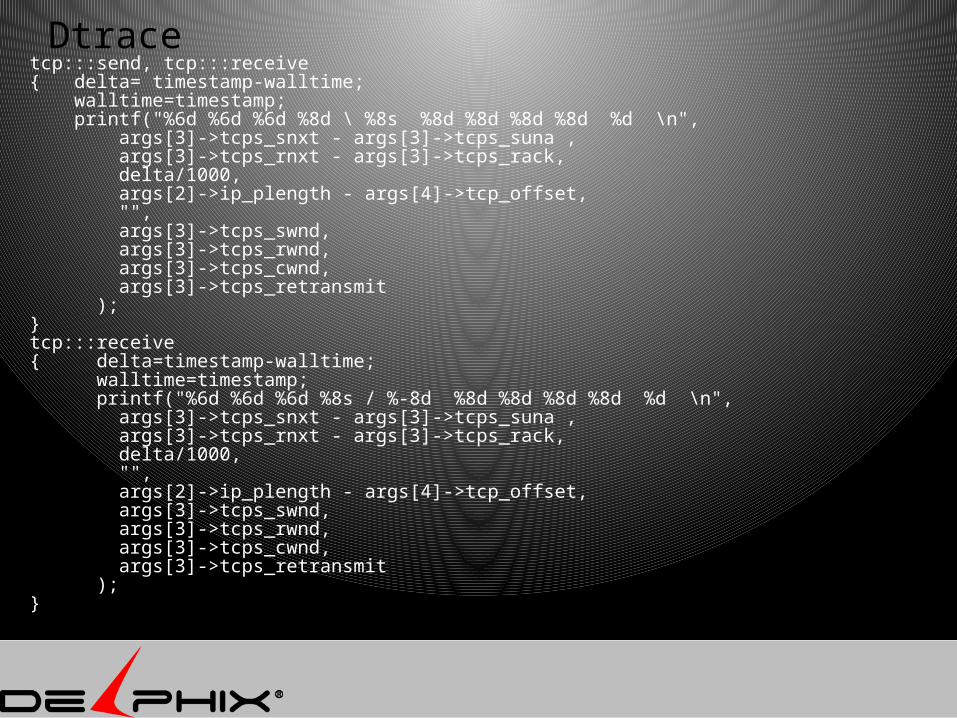
Dtracetcp:::send, tcp:::receive{ delta= timestamp-walltime; walltime=timestamp; printf("%6d %6d %6d %8d \ %8s %8d %8d %8d %8d %d \n", args[3]->tcps_snxt - args[3]->tcps_suna , args[3]->tcps_rnxt - args[3]->tcps_rack, delta/1000, args[2]->ip_plength - args[4]->tcp_offset, "", args[3]->tcps_swnd, args[3]->tcps_rwnd, args[3]->tcps_cwnd, args[3]->tcps_retransmit );}tcp:::receive{ delta=timestamp-walltime; walltime=timestamp; printf("%6d %6d %6d %8s / %-8d %8d %8d %8d %8d %d \n", args[3]->tcps_snxt - args[3]->tcps_suna , args[3]->tcps_rnxt - args[3]->tcps_rack, delta/1000, "", args[2]->ip_plength - args[4]->tcp_offset, args[3]->tcps_swnd, args[3]->tcps_rwnd, args[3]->tcps_cwnd, args[3]->tcps_retransmit );}

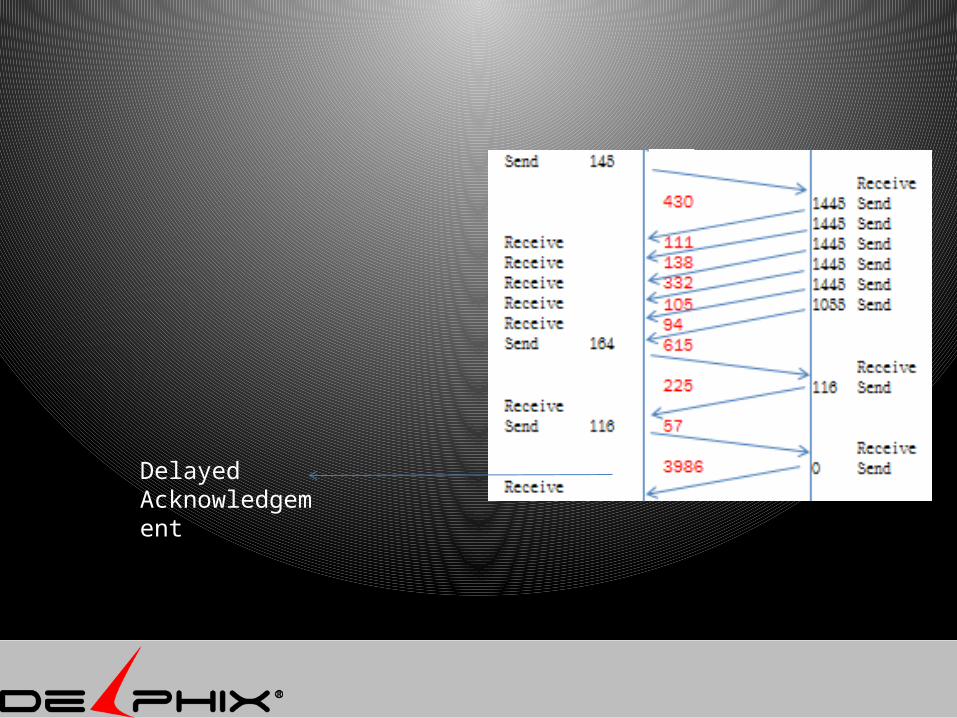
Delayed Acknowledgement
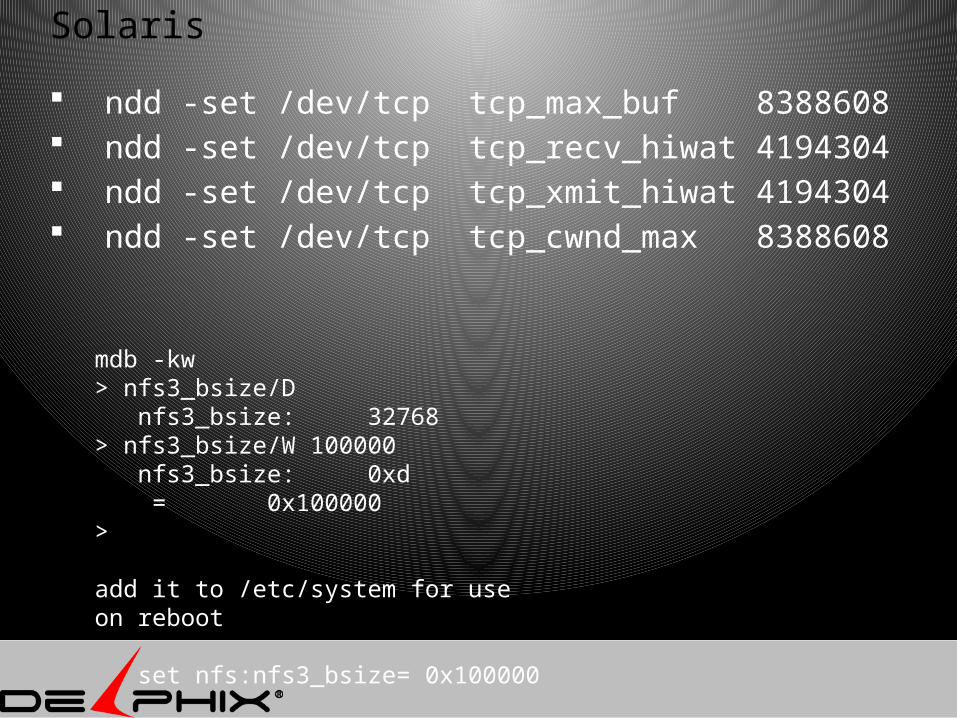
Solaris
ndd -set /dev/tcp tcp_max_buf 8388608 ndd -set /dev/tcp tcp_recv_hiwat 4194304 ndd -set /dev/tcp tcp_xmit_hiwat 4194304 ndd -set /dev/tcp tcp_cwnd_max 8388608
mdb -kw> nfs3_bsize/D nfs3_bsize: 32768> nfs3_bsize/W 100000 nfs3_bsize: 0xd = 0x100000>
add it to /etc/system for use on reboot
set nfs:nfs3_bsize= 0x100000
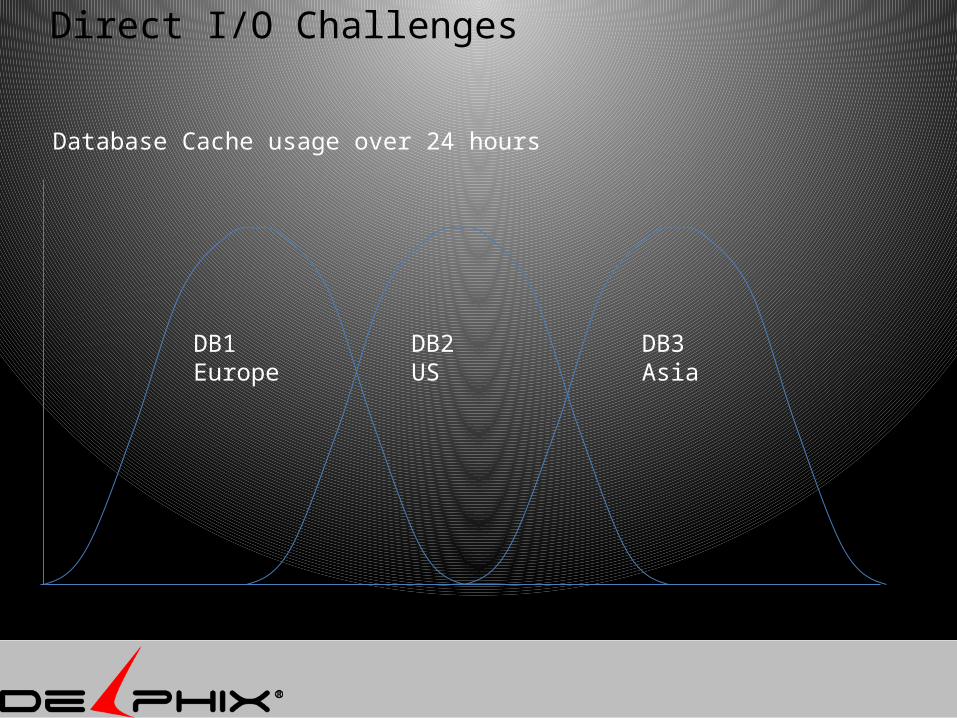
Direct I/O Challenges
DB1Europe
DB2US
DB3Asia
Database Cache usage over 24 hours