Embed Size (px)
Citation preview

COLLABORATE. INNOVATE. EDUCATE.
What Smartphone Bicycle GPS Data Can Tell Us
About Current Modeling Efforts
Katie Kam, The University of Texas at AustinQiqian (Angela) Yang, The Fresno Council of Governments
Jennifer Duthie, Network Modeling Center, The University of Texas at Austin
Presenter: Qiqian (Angela) Yang

COLLABORATE. INNOVATE. EDUCATE.
Take Away From This Presentation:
• GPS app to track cycle routes estimate bike trips for travel demand modeling
• A GPS data “cleaning” process a sample set of data
• Differences in GPS data and other methods of estimation unique bicycle demand characteristics
COLLABORATE. INNOVATE. EDUCATE.
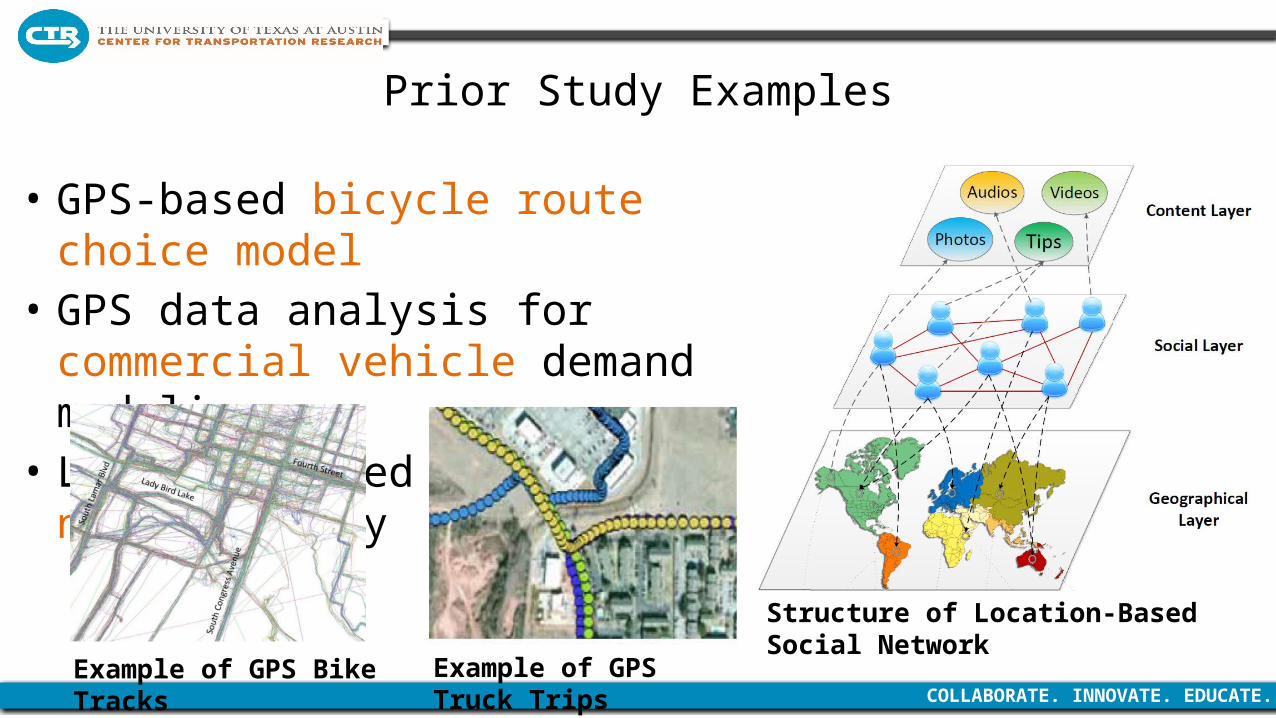
Prior Study Examples
• GPS-based bicycle route choice model• GPS data analysis for commercial
vehicle demand modeling • Location-based social network study
Example of GPS Bike Tracks
Structure of Location-Based Social Network
Example of GPS Truck Trips

COLLABORATE. INNOVATE. EDUCATE.
Research Purposes
• Find out GPS bicycle tracking data V.S.
current modeling estimation efforts
• Move forward Incorporating GPS bicycle
data into the transportation demand modeling process
• The role GPS bicycle data has? In the trip generation and trip
distribution steps
• How to prepare the data? Resulting dataset can be
considered a sample dataset suitable for MPO model
Questions we asked
COLLABORATE. INNOVATE. EDUCATE.
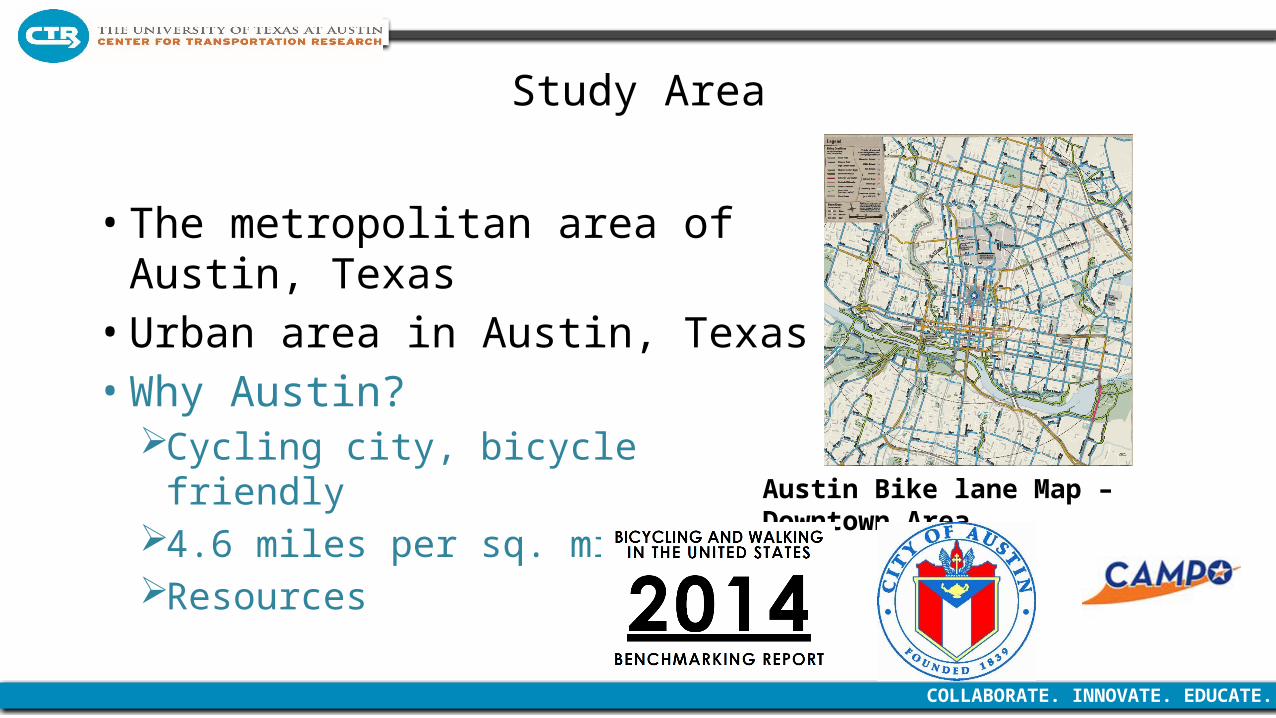
Study Area
• The metropolitan area of Austin, Texas
• Urban area in Austin, Texas• Why Austin?
Cycling city, bicycle friendly4.6 miles per sq. mileResources
Austin Bike lane Map – Downtown Area

COLLABORATE. INNOVATE. EDUCATE.
Data Collection 1
• CycleTrack app was developed by the San Francisco County Transportation Authority
• Collected by volunteers that biked (not randomly selected) in Austin, Texas.316 volunteers May 1st to October 31st, 20111,048,576 continuously collected
GPS pointsCycleTracks Application Screens

COLLABORATE. INNOVATE. EDUCATE.
Bicyclist Recruiting Process
CycleTracks Austin Website Screen Shot

COLLABORATE. INNOVATE. EDUCATE.
Postcards Distributed in May and September of 2011 to Area Bicyclists

COLLABORATE. INNOVATE. EDUCATE.
Data Collection 2
• CAMPO – 2006-2007 Household Travel Survey.
• CAMPO – 2010 estimation, from 2010 Travel Demand Model.
CAMPO 2010 Model - Bike Trips Origin and Destination Data Screen Shot

COLLABORATE. INNOVATE. EDUCATE.
Methodology - CycleTrack GPS Data Preparation
Recruit Bicyclists
Record Bike Trips
GPS points to bike trips
Kept the weekday
trips
Attach TAZ and
Time Period
Delete Recurring
Trips
Peak vs Off Peak
Reformat GPS Trip Tables
Points to trips Trip tables finalization

COLLABORATE. INNOVATE. EDUCATE.
Summery Statistic of Trip User Characteristics
Gender (n = 302) Age of Participants (n = 304)

COLLABORATE. INNOVATE. EDUCATE.
Why Data Cleaning ?
• Additional cleaning – recurring trips
• Keep the O/D pattern consistent with the CAMPO HH Travel Survey method;
Before After

COLLABORATE. INNOVATE. EDUCATE.
Methodology - Data Cleaning
1,048,57
6 poin
ts
• Kept beginning and ending points.
650 weekday
trips
• Joined CAMPO 2010 TAZ layer.• Defined trip time periods. • Defined the recurring trips.
486 non-recurring
trips
• Finalized the final CycleTracks dataset.
Layers Issues
Four time period?
Repeated trips in the same day?
No User ID?
COLLABORATE. INNOVATE. EDUCATE.
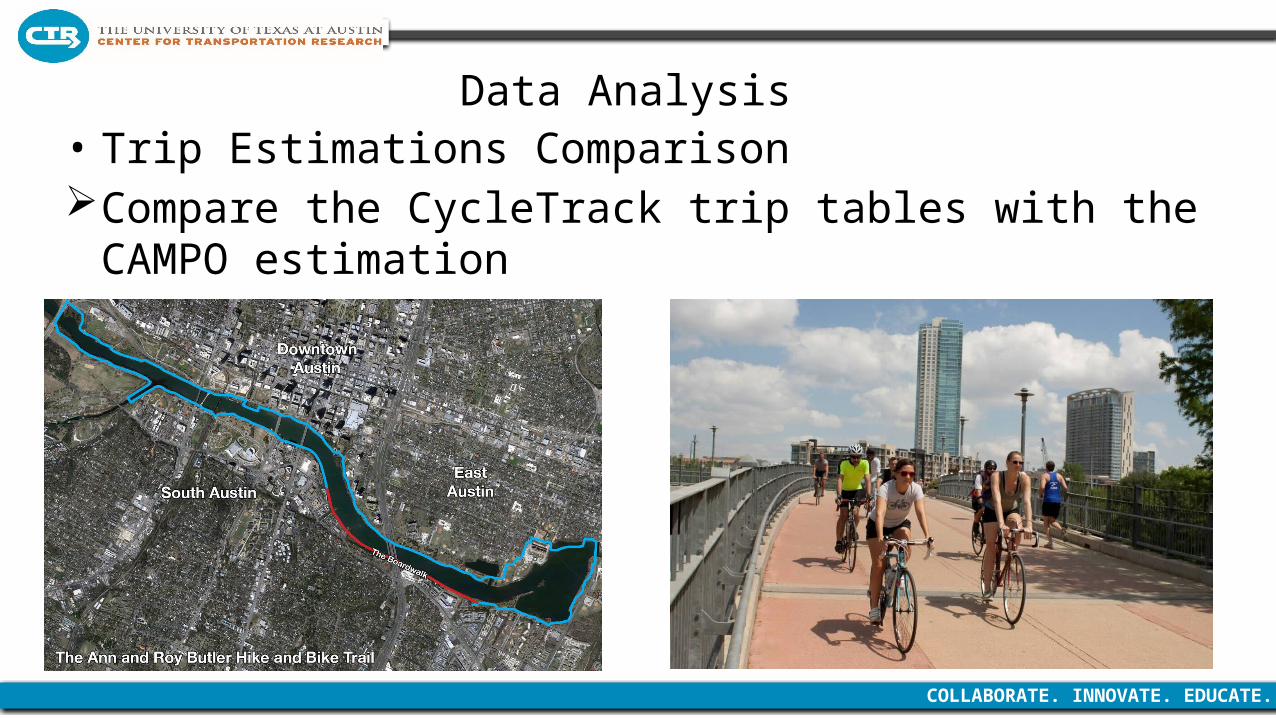
Data Analysis • Trip Estimations Comparison Compare the CycleTrack trip tables with the CAMPO estimation

COLLABORATE. INNOVATE. EDUCATE.
Trip Estimation Comparison
Origin – Off Peak Hour Origin – Peak Hour
Legend
HWY
polylakes
O_OP_ZeroTrip
Differences_GPS_V.S._CAMPO
diff_op_or
-14 - 0 (53)
0 (1,750)
1 - 20 (231)
21 - 40 (93)
41 - 100 (110)
101 - 275 (21)
Legend
HWY
polylakes
O_PK_ZeroTrip
Differences_GPS_V.S._CAMPO
diff_pk_or
-19 - 0 (77)
1 - 0 (1,771)
1 - 20 (268)
21 - 40 (94)
41 - 100 (44)
101 - 129 (4)

COLLABORATE. INNOVATE. EDUCATE.
Trip Estimation Comparison
Origin – Off Peak Hour Origin – Peak Hour
Legend
HighUsageBikeRoute
LowUsageBikeRoute
O_OP_NegativeTrip
diff_op_or
-14 - -12 (2)
-11 - -5 (3)
-4 - -3 (6)
-2 (13)
-1 - 0 (29)
Legend
HighUsageBikeRoute
LowUsageBikeRoute
O_PK_NegativeTrip
diff_pk_or
-19 - -12 (5)
-11 - -5 (9)
-4 - -3 (10)
-2 (11)
-1 - 0 (41)
COLLABORATE. INNOVATE. EDUCATE.
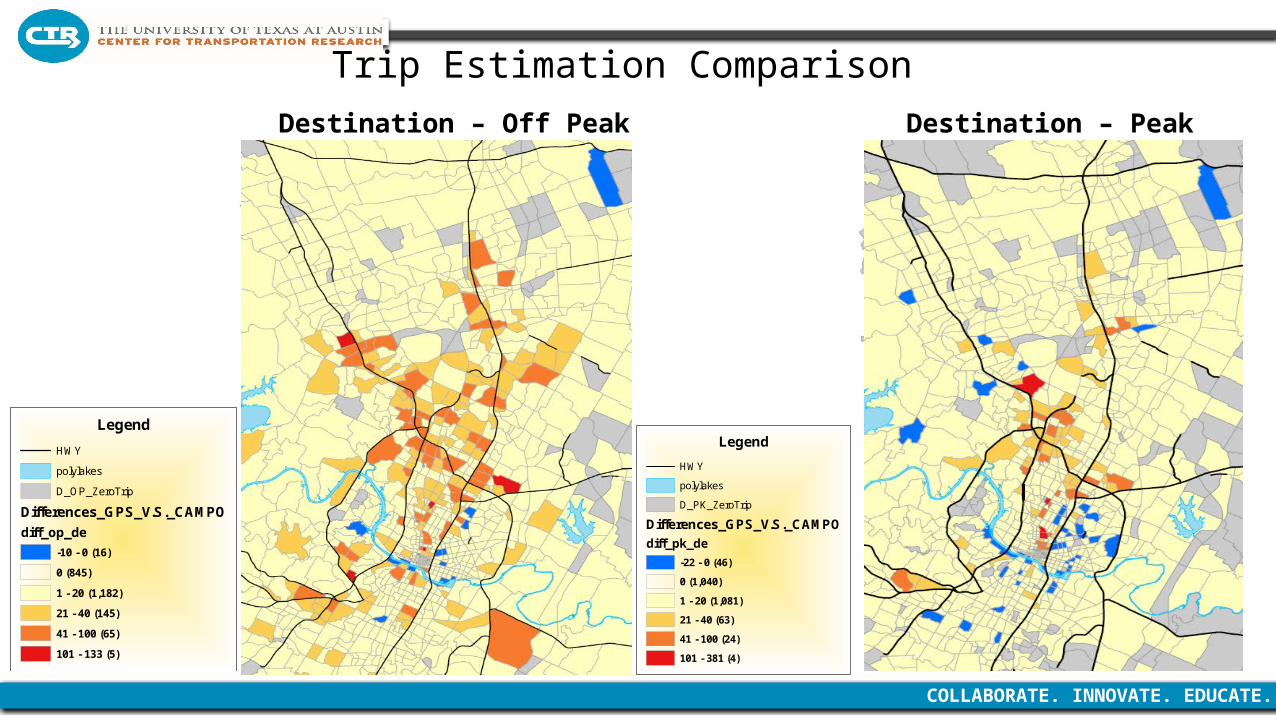
Trip Estimation Comparison
Destination – Off Peak Hour Destination – Peak Hour
Legend
HWY
polylakes
D_OP_ZeroTrip
Differences_GPS_V.S._CAMPO
diff_op_de
-10 - 0 (16)
0 (845)
1 - 20 (1,182)
21 - 40 (145)
41 - 100 (65)
101 - 133 (5)
Legend
HWY
polylakes
D_PK_ZeroTrip
Differences_GPS_V.S._CAMPO
diff_pk_de
-22 - 0 (46)
0 (1,040)
1 - 20 (1,081)
21 - 40 (63)
41 - 100 (24)
101 - 381 (4)

COLLABORATE. INNOVATE. EDUCATE.
Trip Estimation Comparison
Destination – Off Peak Hour Destination – Peak Hour
Legend
HighUsageBikeRoute
LowUsageBikeRoute
D_OP_NegativeTrip
diff_op_de
<-13 (0)
-12 - -5 (1)
-4 - -3 (2)
-2 (3)
-1 - 0 (10)
Legend
HighUsageBikeRoute
LowUsageBikeRoute
D_PK_NegativeTrip
diff_pk_de
-22 - -13 (1)
-12 - -5 (4)
-4 - -3 (2)
-2 (9)
-1 - 0 (28)

COLLABORATE. INNOVATE. EDUCATE.
Comparison of CAMPO and GPS Data Collection
Cycl eTrack CAMPO CAMPO GPS equi pmentSi ze of val i d sampl e 316 1500 153Val i d bi cycl e tri ps 486 421 N/ A
Sampl e col l ecti on Conveni ence Random RandomWho compl eted the survey Bi cycl i sts Househol ders Househol ders
Avai l abl e data uni t Tri psData update frequency Anyti me
CostOther appl i cati ons Many
Days ri di ng bi ke/ per week10 years
COMPARISON
Less (pol i cy anal ysi s)Total $1 mi l l i on, $200/ per survey
CycleTracks : Non-authorized travel monitoringTransportation infrastructure need analysisAir quality/GHG emission reduction studyTransportation and public health modeling, etc.
COLLABORATE. INNOVATE. EDUCATE.
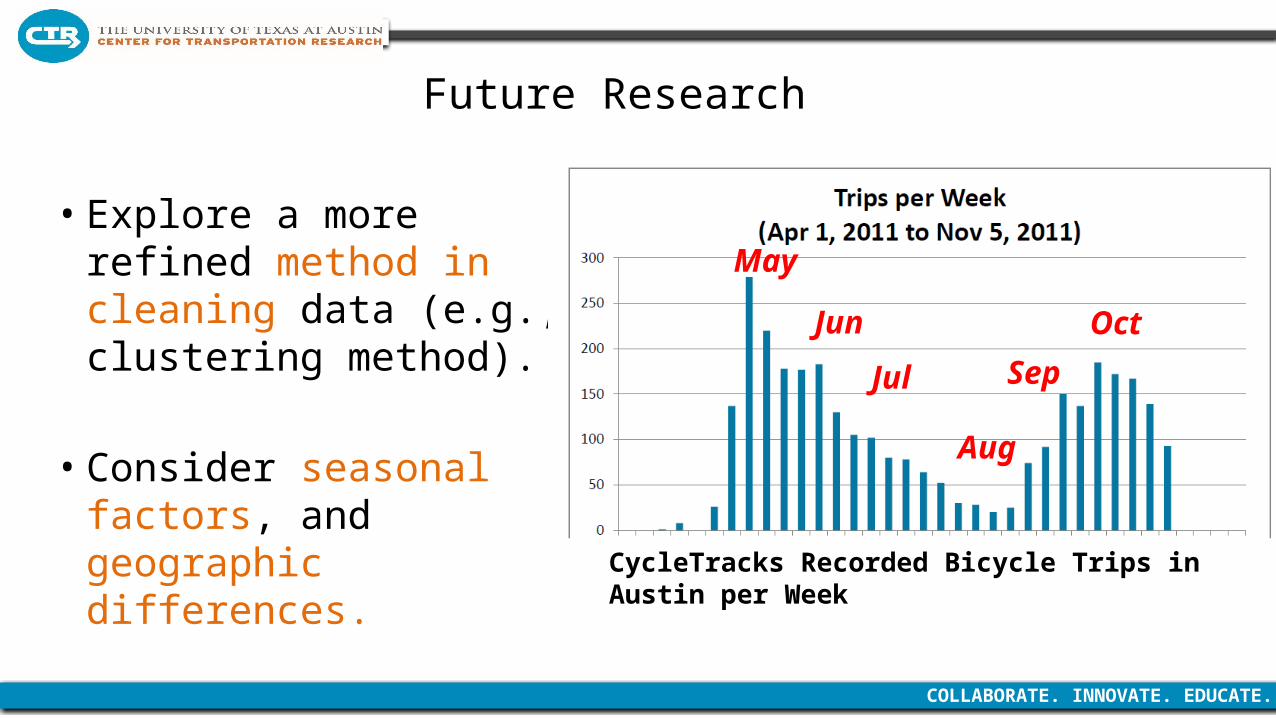
Future Research
• Explore a more refined method in cleaning data (e.g., clustering method).
• Consider seasonal factors, and geographic differences. CycleTracks Recorded Bicycle Trips in Austin per Week
May
Jun
Jul
Aug
Sep
Oct
COLLABORATE. INNOVATE. EDUCATE.
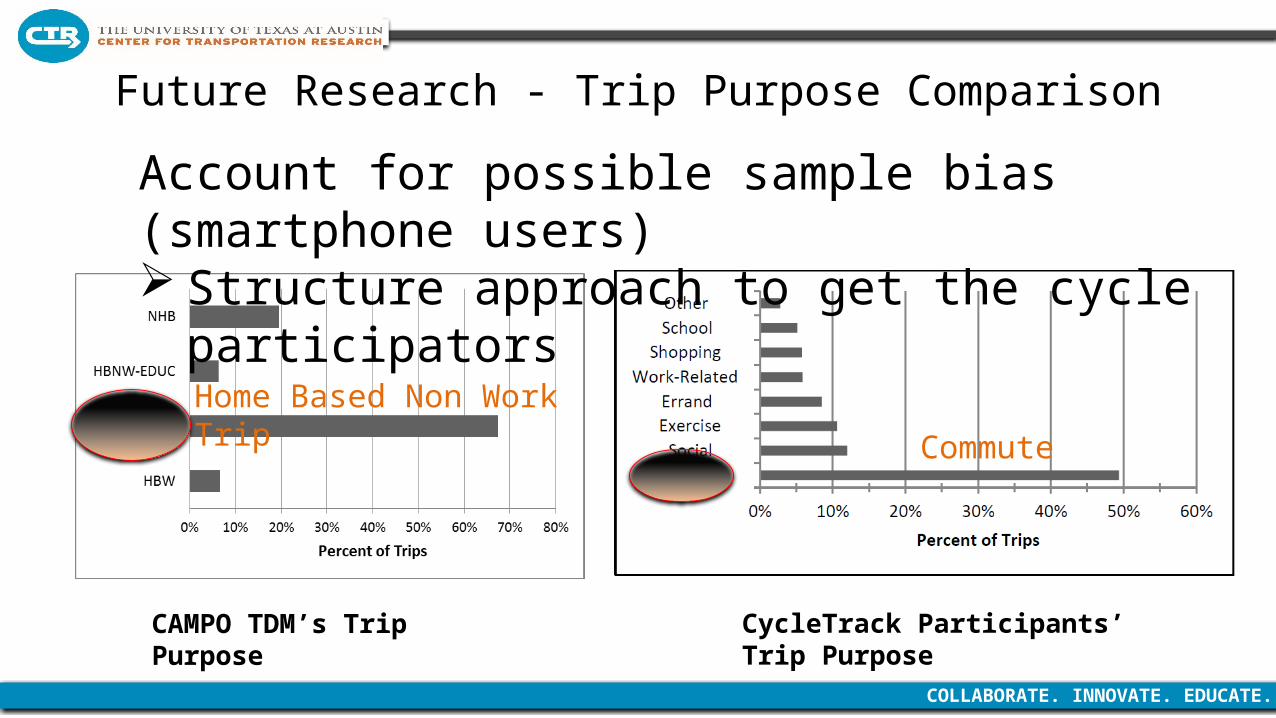
Future Research - Trip Purpose Comparison
CycleTrack Participants’ Trip PurposeCAMPO TDM’s Trip Purpose
Home Based Non Work Trip
Commute
Account for possible sample bias (smartphone users) Structure approach to get the cycle participators

COLLABORATE. INNOVATE. EDUCATE.
Take Away From This Presentation:
• CycleTracks or other similar GPS app to track cycle routes may be used to estimate bike trips for travel demand modeling
• Acquired GPS data requires a data “cleaning” process that converts the data into a sample set of data
• Seeing differences in GPS data results to other methods of estimation (e.g., household surveys) can reveal areas of town with unique bicycle demand characteristics

COLLABORATE. INNOVATE. EDUCATE.
Thank you!
Contact information:Angela Yang: [email protected] Kam: [email protected] Duthie: [email protected]