Embed Size (px)
Citation preview
our teachers
our school
our message
Clovis USD
Cole Elementary
School 2014-15
School Accountability Report Card
Published in 2015-16
Mr. Marshall Hamm Principal
615 West Stuart Avenue Clovis, CA 93612
Grades: K-6 Phone: (559) 327-6200
cole.cusd.com
CDS Code: 10-62117-6005847
Janet Young, Superintendent • [email protected] • Phone: (559) 327-9000
Clovis Unified School District • 1450 Herndon Avenue Clovis, CA 93611 • www.cusd.com
2014-15 School Accountability Report Card • Published by School Innovations & Achievement • www.sia-us.com
3Cole Elementary School SARC
Principal’s MessageAs you read this Cole Elementary School Accountability Report Card for the 2014-15 school year, I believe you will find a picture of a school with a solid record of providing a quality education, faculty that is profes-sionally skilled and personally committed to meeting the learning needs of students, and a diverse student body that is motivated to perform well both academically and in cocurricular programs. All of these factors are the reason Cole Elementary continues to be successful year after year, having been recognized three times as a California Distinguished School. Cole Elementary continued this tradition of excellence this past school year by being awarded the Clovis Unified School District Exemplary School Award, an honor that has been given to the Bulldogs multiple times.
Cole’s mission statement provides the template to ensure that Cole strives to promote educational growth, productive citizenship and lifelong learning through quality instruction that is aligned with the California state standards. Our motto—PAW Pride: Positive Attitudes Work—reflects our belief that through hard work and having a positive attitude, students will be successful academically. We urge you to become involved at Cole Elementary School. Research shows that children who have parents involved at school generally perform better. We look forward to working with you!
Sincerely,
Marshall Hamm
Principal
Clovis USD Governing Board
The Clovis Unified School District Governing Board consists of seven board seats. Each seat represents a geographic
portion of the district. Board member terms are four years.
Ginny Hovsepian, president
Christopher Casado, vice president
Jim Van Volkinburg, D.D.S.; clerk
Sandra A. Bengel, member
Betsy Sandoval, member
Brian Heryford, member
Richard Lake, C.P.A.; member
School Mission StatementThe Cole Elementary mission is to support all students in becoming successful learners.
School Accountability Report Card
In accordance with state and federal requirements, the School Accountability
Report Card (SARC) is put forth annually by all public schools as a tool
for parents and interested parties to stay informed of the school’s progress, test
scores and achievements.
District Mission StatementTo be a quality educational system
providing the resources for all students to reach their potential in mind,
body and spirit.
DIstrict Vision StatementClovis Unified School District strives
to be America’s benchmark for excellence in education.
Clovis Unified School District Core ValuesIn Clovis Unified, we hold ourselves accountable to a set of core values that we consider nonnegotiable. These values are expressed in the following key phrases and words:
• Students: Educate the whole child in mind, body and spirit; a fair break for every kid; every child can learn, and we can teach every child; meet the educational needs of all students; student-centered decision-making.
• Employees: It’s people, not programs; support our employees; mutual respect; professionalism; commitment; shared decision-making; accountability; high standards, both individually and collectively.
• Community: Educational is a partnership; parent involvement; community involvement; business partnerships; collaboration with all stakeholders; mutual effort.
• Expectations: Continuous improvement; quality education; clear expectations; win with class, lose with dignity; do the right thing; integrity; innovation; forward thinking; the higher the expectation, the greater the achievement.
• Schools and facilities: World class; community-centered; kids deserve the best; community accessible.
“Where Character Counts”
School Vision StatementCole Elementary envisions a community of lifelong learners, built on a foundation of collaboration, mutual responsibility, and maintaining high expectations for all students to reach their fullest potential in mind, body, and spirit.
School Values• All children can learn, and we can teach all children
• Hard work promotes achievement
• Educational success is a partnership between the school, the family and the community
Parental InvolvementCole enjoys the benefits of a very supportive community and provides a variety of options for parents who want to be involved. Since 1973, CUSD has benefited from the formation of a parent advisory group known as the School Assessment Review Team (SART). SART committees meet on a quarterly basis and provide a forum for school personnel and interested parents to meet and discuss items related to the effectiveness of the school’s operation. Parents may also become involved at school by joining the Cole Foundation, a very active group that organizes activities and fundraises for the school. In addition, parents may volunteer in the classroom and as crossing guards; serve on various committees, such as the School Site Council (SSC), English Learner Advisory Committee (ELAC), or Intercultural Diversity Advisory Council (IDAC); and partici-pate in a wide variety of other activities. Community pride, support and involvement continue to be a major factor in Cole’s success. For more information on how to become involved at the school, please contact Stacy Gray, Cole’s SART coordinator, at (559) 246-6778.
4
District Aims 1. Maximize student achievement for all
students
2. Operate with increasing efficiency and effectiveness
3. Develop, sustain and value a quality workforce
“Be the Best You Can be in Mind, Body and Spirit”
Professional DevelopmentMany factors determined staff-development needs during the 2015-16 year, including teacher needs, assess-ment and formal and informal discussions between faculty and the administration. Areas of priority included the following:
• Strategies for improving student achievement in math using the new textbook
• Strategies for improving student achievement in reading comprehension including utilizing social science and science text for reading instruction
• Developing a personal Web page and using technology to improve lesson engagement
• Closing the achievement gap with our Focus Group Students
Teachers: Professional growth time for teachers is provided each week on early release Wednesdays. During this time, teachers share best practices and strategies; review student performance data to inform instruction, intervention and reteaching; and provide information gleaned from conferences.
Teachers are aware of school and district funds that can provide for substitutes so that staff may observe other exemplary teachers, meet in grade-level articulation sessions or attend conferences that focus on student achievement.
Teachers, upon their return from these conferences, share valuable information with their colleagues. The district also provides professional growth opportunities that offer demonstration school forums and educa-tional seminars. New teachers to the profession or grade level are further supported through the many work-shops of the Beginning Teacher Support and Assessment (BTSA) program and through their association with individual support providers.
Cole places strong emphasis on professional growth and provides many formal and informal avenues for teachers to continue their development.
Paraprofessionals and other school personnel: Cole believes that paraprofessionals and other school per-sonnel make a strong and valuable impact on students and their efforts toward educational excellence. All personnel are made aware of the availability of school and district staff development and training funds. Per-sonnel are invited to attend meetings in which school resources are being allocated, participate in forums on current educational topics, attend school committees and be involved in the planning of the yearly program.
Volunteers: Cole utilizes many members of the community to enhance support to its students and strengthen the ties within the entire community. Training for volunteers is provided at the district or site level. Volunteer members participate in many capacities, including the high school physical-education tutorial program, cross-ing guards, parent classroom volunteers, SSC and SART.
The district focused all professional development activities around five identified needs: First time best in-struction, mastery learning, professional learning communities, transitioning to the Common Core, and sys-tematic interventions.
In the 2014-15 school year, we dedicated two additional days for professional development. This brings a total of five professional development days for our certificated staff. During the 2015-16 school year, teachers were offered professional development opportunities during professional development days, release days during the school year, in after-school workshops, on early release days and within the classroom. Two-hundred-and-forty-one teachers received continuous professional development and classroom coaching through the CUSD Beginning Teacher Support and Assessment (BTSA) Induction program. In addition, 114 elementary teachers are participating in a three-year math partnership grant that includes 61 hours of intensive profes-sional development plus 42 hours of follow-up coaching in the classroom.
Three-Year DataProfessional Development Days
2013-14 2014-15 2015-16
Cole ES 3 days 5 days 5 days
Suspensions and ExpulsionsThis table shows the school, district, and state suspension and expulsion rates for the most recent three-year period. Note: Students are only counted one time, regardless of the number of suspensions.
Three-Year DataSuspensions and Expulsions
Cole ES Clovis USD California
12-13 13-14 14-15 12-13 13-14 14-15 12-13 13-14 14-15
Suspension rates 3.3% 5.3% 5.6% 5.1% 4.4% 4.8% 5.1% 4.4% 3.8%
Expulsion rates 0.0% 0.0% 0.0% 0.1% 0.1% 0.1% 0.1% 0.1% 0.1%
School SafetyCole has a School Safety Plan and School Crisis Intervention Plan on file and available to all parents as well as the general public. Both plans are reviewed and updated annually. Most recently, the School Safety Plan was updated in August 2015. The staff develops them with input from parents and community members to ensure a safe and nonviolent environment on all of the CUSD campuses.
The School Safety Plan covers a variety of situations such as injuries, acts of violence, earthquakes and suicide. In addition, Cole utilizes a “safety week” each month to review and discuss safety procedures with both faculty and students. A safety drill is practiced and reviewed each month as well. Cole has four campus monitors who provide adult supervision during both cafeteria and playground lunches. Cole faculty and staff have as-signed duties before school, during recess and after school. Parent volunteers also help provide additional supervision before and after school.
5Cole Elementary School SARC
Three-Year DataClassrooms by Size
2012-13 2013-14 2014-15
GradeNumber of Students
1-20 21-32 33+ 1-20 21-32 33+ 1-20 21-32 33+
K 2 4 1 4 4
1 1 4 2 4 4
2 1 4 2 3 1 5
3 1 4 1 4 2 1
4 3 3 1 3
5 1 2 3 3
6 1 3 3 3
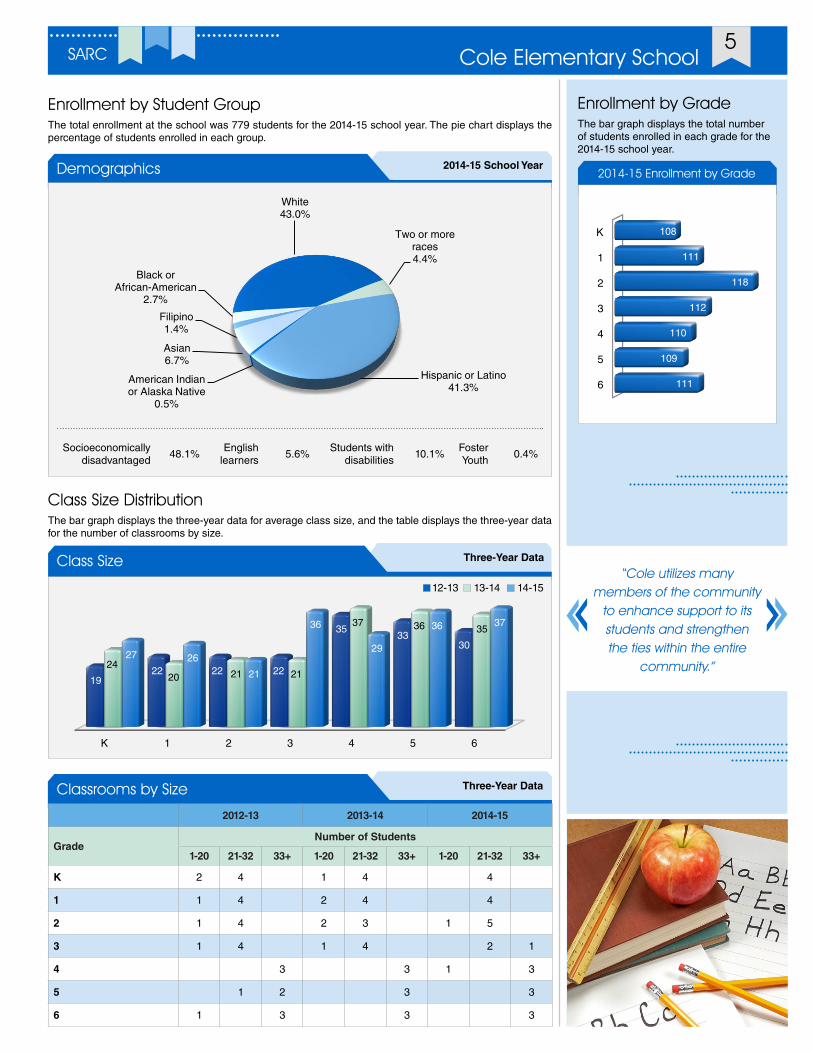
Enrollment by Student GroupThe total enrollment at the school was 779 students for the 2014-15 school year. The pie chart displays the percentage of students enrolled in each group.
2014-15 School YearDemographics
Socioeconomically disadvantaged
48.1%English
learners5.6%
Students with disabilities
10.1%Foster Youth
0.4%
Enrollment by GradeThe bar graph displays the total number of students enrolled in each grade for the 2014-15 school year.
2014-15 Enrollment by Grade
Class Size DistributionThe bar graph displays the three-year data for average class size, and the table displays the three-year data for the number of classrooms by size.
Three-Year DataClass Size
13-1412-13 14-15
K
1
2
3
4
5
6
108
111
118
112
110
109
111Hispanic or Latino
41.3%American Indian or Alaska Native
0.5%
Asian6.7%
Filipino1.4%
Black or African-American
2.7%
White43.0%
Two or more races4.4%
“Cole utilizes many members of the community
to enhance support to its students and strengthen the ties within the entire
community.”
K 1 2 3 4 5 6
1922 22 22
3533
30
2420 21 21
37 36 35
27 26
21
36
29
36 37
6
Federal Intervention ProgramSchools and districts receiving Title I funding that fail to meet AYP over two consecutive years in the same content area (English language arts or mathematics) or on the same indicator enter into Program Improve-ment (PI). Each additional year that the district or school(s) do not meet AYP results in advancement to the next level of intervention. The percentage of schools identified for Program Improvement is calculated by taking the number of schools currently in PI within the district and dividing it by the total number of Title I schools within the district.
This table displays the 2015-16 Program Improvement status for the school and district. For detailed informa-tion about PI identification, please visit www.cde.ca.gov/ta/ac/ay/tidetermine.asp.
2015-16 School YearFederal Intervention Program
Cole ES Clovis USD
Program Improvement status Not In PI In PI
First year of Program Improvement ² 2011-2012
Year in Program Improvement ² Year 3
Number of schools currently in Program Improvement 9
Percentage of schools currently in Program Improvement 56.30%
California Physical Fitness TestEach spring, all students in grades 5, 7 and 9 are required to participate in the California Physical Fitness Test (PFT). The Fitnessgram® is the designated PFT for students in California public schools put forth by the State Board of Education. The PFT measures six key fitness areas:
1. Aerobic Capacity
2. Body Composition
3. Flexibility
4. Abdominal Strength and Endurance
5. Upper Body Strength and Endurance
6. Trunk Extensor Strength and Flexibility
Encouraging and assisting students in establishing lifelong habits of regular physical activity is the primary goal of the Fitnessgram. The table shows the percentage of students meeting the fitness standards of being in the “healthy fitness zone” for the most recent testing period. For more detailed information on the California PFT, please visit www.cde.ca.gov/ta/tg/pf.
Percentage of Students Meeting Fitness Standards
2014-15 School Year
Grade 5
Four of six standards 17.6%
Five of six standards 20.4%
Six of six standards 48.1%
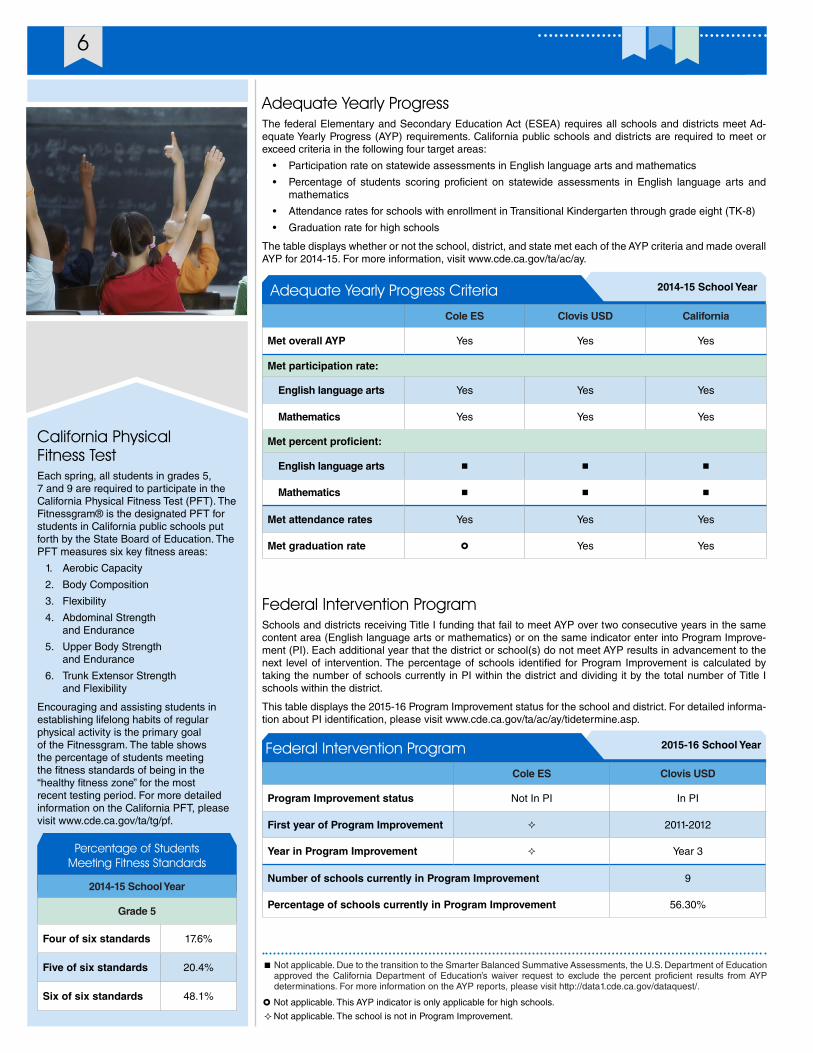
Adequate Yearly ProgressThe federal Elementary and Secondary Education Act (ESEA) requires all schools and districts meet Ad-equate Yearly Progress (AYP) requirements. California public schools and districts are required to meet or exceed criteria in the following four target areas:
• Participation rate on statewide assessments in English language arts and mathematics
• Percentage of students scoring proficient on statewide assessments in English language arts and mathematics
• Attendance rates for schools with enrollment in Transitional Kindergarten through grade eight (TK-8)
• Graduation rate for high schools
The table displays whether or not the school, district, and state met each of the AYP criteria and made overall AYP for 2014-15. For more information, visit www.cde.ca.gov/ta/ac/ay.
2014-15 School YearAdequate Yearly Progress Criteria
Cole ES Clovis USD California
Met overall AYP Yes Yes Yes
Met participation rate:
English language arts Yes Yes Yes
Mathematics Yes Yes Yes
Met percent proficient:
English language arts n n n
Mathematics n n n
Met attendance rates Yes Yes Yes
Met graduation rate � Yes Yes
²Not applicable. The school is not in Program Improvement.
� Not applicable. This AYP indicator is only applicable for high schools.
Not applicable. Due to the transition to the Smarter Balanced Summative Assessments, the U.S. Department of Education approved the California Department of Education’s waiver request to exclude the percent proficient results from AYP determinations. For more information on the AYP reports, please visit http://data1.cde.ca.gov/dataquest/.
n
7Cole Elementary School SARC
California Assessment of Student Performance and Progress/Standardized Testing and Reporting Results Beginning in the 2013-14 school year, the Standardized Testing and Reporting (STAR) Program was eliminated and replaced by a new set of assessments called the California Assessment of Student Performance and Progress (CAASPP).
For the 2015 school year, the CAASSP included a mix of online and paper-pencil assessments. The online component contained the Smarter Balanced English language arts/literacy and mathematics tests. The paper-pencil science assessments of CAASPP included the California Standards Test (CST), California Modified Assessment (CMA) and California Alternate Performance Assessment (CAPA). There was also the optional Standards-based tests in Spanish for reading/language arts.
The CST is a multiple-choice test in science for varying grade levels. The CMA is a modified assessment for students with disabilities who have an Individualized Education Plan (IEP). The CAPA is an alternate assessment for students with significant cognitive disabilities who are unable to take the CST with accommodations or modifications or the CMA with accommodations.
For more information on the CAASPP assessments, please visit www.cde.ca.gov/ta/tg/ca.
CAASPP by Student Group: English Language Arts and MathematicsThe tables on the following pages display the information on student achievement at each performance level in English language arts and mathematics for the school by student groups for grades 3-6.
Levels of achievement include:
• Level 1 = Standard not met
• Level 2 = Standard nearly met
• Level 3 = Standard met
• Level 4 = Standard exceeded
Note: The number of students tested includes students who did not receive a score. However, the number of students tested is not the number that was used to calculate the performance level percentages. The performance level percentages are calculated using students with scores.
California Standards Tests for All Students: Science (grades 5, 8 and 10)The tables show the percentage of students in grades 5, 8 and 10 who scored at Proficient or Advanced levels (meeting or exceeding state standards) in science.
Three-Year DataStudents Scoring at Proficient or Advanced Levels
Cole ES Clovis USD California
Subject 12-13 13-14 14-15 12-13 13-14 14-15 12-13 13-14 14-15
Science 64% 62% 73% 76% 79% 77% 59% 60% 56%
California Standards Tests Results by Student Group: Science (grades 5, 8 and 10)
2014-15 School YearStudents Scoring at Proficient or Advanced Levels
Group Science
All students in the district 77%
All students at the school 73%
Male 74%
Female 71%
Black or African-American v
American Indian or Alaska Native v
Asian v
Filipino v
Hispanic or Latino 69%
Native Hawaiian or Pacific Islander v
White 78%
Two or more races v
Socioeconomically disadvantaged 64%
English learners v
Students with disabilities v
Students receiving Migrant Education services v
Foster youth ±
v Scores are not shown when the number of students tested is 10 or fewer, either because the number of students tested in this category is too small for statistical accuracy or to protect student privacy.
± Information is not available at this time.
California Assessment of Student Performance and Progress Results for All Students (grades 3-8 and 11)The table below shows the percentage of students meeting or exceeding the state standards in English language arts/literacy and mathematics.
2014-15 School YearPercentage of Students Meeting or Exceeding State Standards
Subject Cole ES Clovis USD California
English language arts/literacy 47% 60% 44%
Mathematics 46% 50% 33%
8
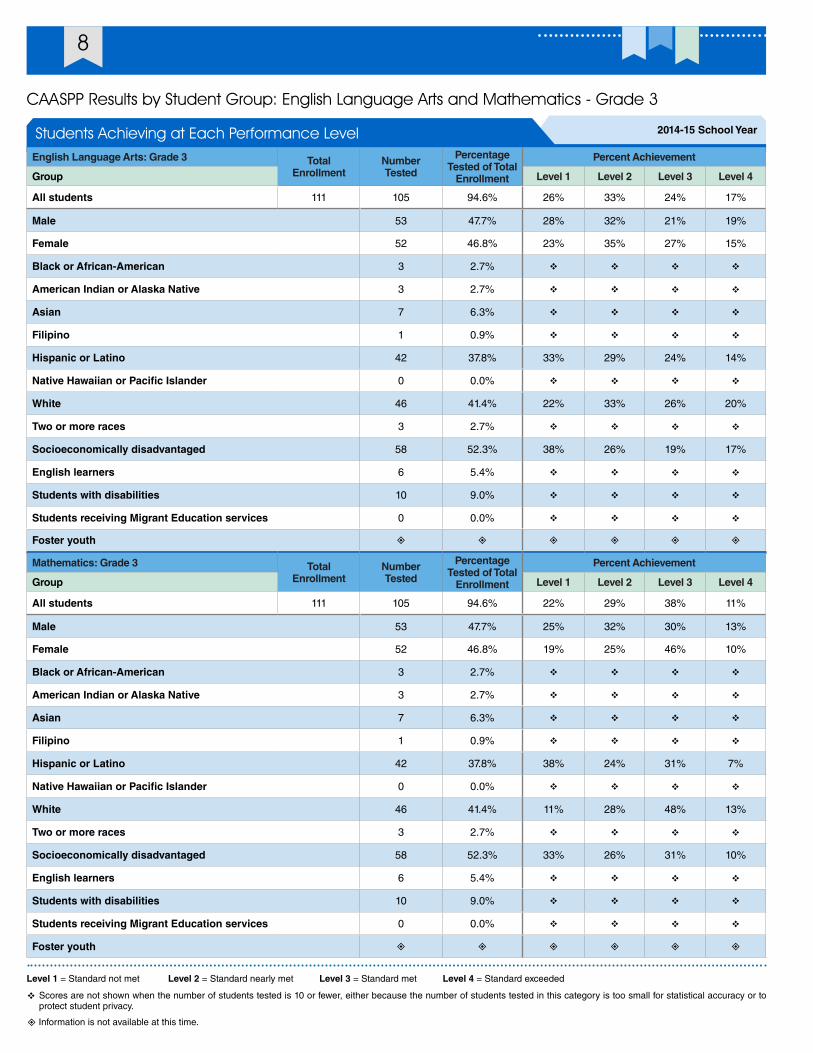
CAASPP Results by Student Group: English Language Arts and Mathematics - Grade 3
Level 1 = Standard not met Level 2 = Standard nearly met Level 3 = Standard met Level 4 = Standard exceeded
v Scores are not shown when the number of students tested is 10 or fewer, either because the number of students tested in this category is too small for statistical accuracy or to protect student privacy.
2014-15 School YearStudents Achieving at Each Performance LevelEnglish Language Arts: Grade 3 Total
EnrollmentNumber Tested
Percentage Tested of Total
Enrollment
Percent Achievement
Group Level 1 Level 2 Level 3 Level 4
All students 111 105 94.6% 26% 33% 24% 17%
Male 53 47.7% 28% 32% 21% 19%
Female 52 46.8% 23% 35% 27% 15%
Black or African-American 3 2.7% v v v v
American Indian or Alaska Native 3 2.7% v v v v
Asian 7 6.3% v v v v
Filipino 1 0.9% v v v v
Hispanic or Latino 42 37.8% 33% 29% 24% 14%
Native Hawaiian or Pacific Islander 0 0.0% v v v v
White 46 41.4% 22% 33% 26% 20%
Two or more races 3 2.7% v v v v
Socioeconomically disadvantaged 58 52.3% 38% 26% 19% 17%
English learners 6 5.4% v v v v
Students with disabilities 10 9.0% v v v v
Students receiving Migrant Education services 0 0.0% v v v v
Foster youth ± ± ± ± ± ±
Mathematics: Grade 3 Total Enrollment
Number Tested
Percentage Tested of Total
Enrollment
Percent Achievement
Group Level 1 Level 2 Level 3 Level 4
All students 111 105 94.6% 22% 29% 38% 11%
Male 53 47.7% 25% 32% 30% 13%
Female 52 46.8% 19% 25% 46% 10%
Black or African-American 3 2.7% v v v v
American Indian or Alaska Native 3 2.7% v v v v
Asian 7 6.3% v v v v
Filipino 1 0.9% v v v v
Hispanic or Latino 42 37.8% 38% 24% 31% 7%
Native Hawaiian or Pacific Islander 0 0.0% v v v v
White 46 41.4% 11% 28% 48% 13%
Two or more races 3 2.7% v v v v
Socioeconomically disadvantaged 58 52.3% 33% 26% 31% 10%
English learners 6 5.4% v v v v
Students with disabilities 10 9.0% v v v v
Students receiving Migrant Education services 0 0.0% v v v v
Foster youth ± ± ± ± ± ±
± Information is not available at this time.
9Cole Elementary School SARC
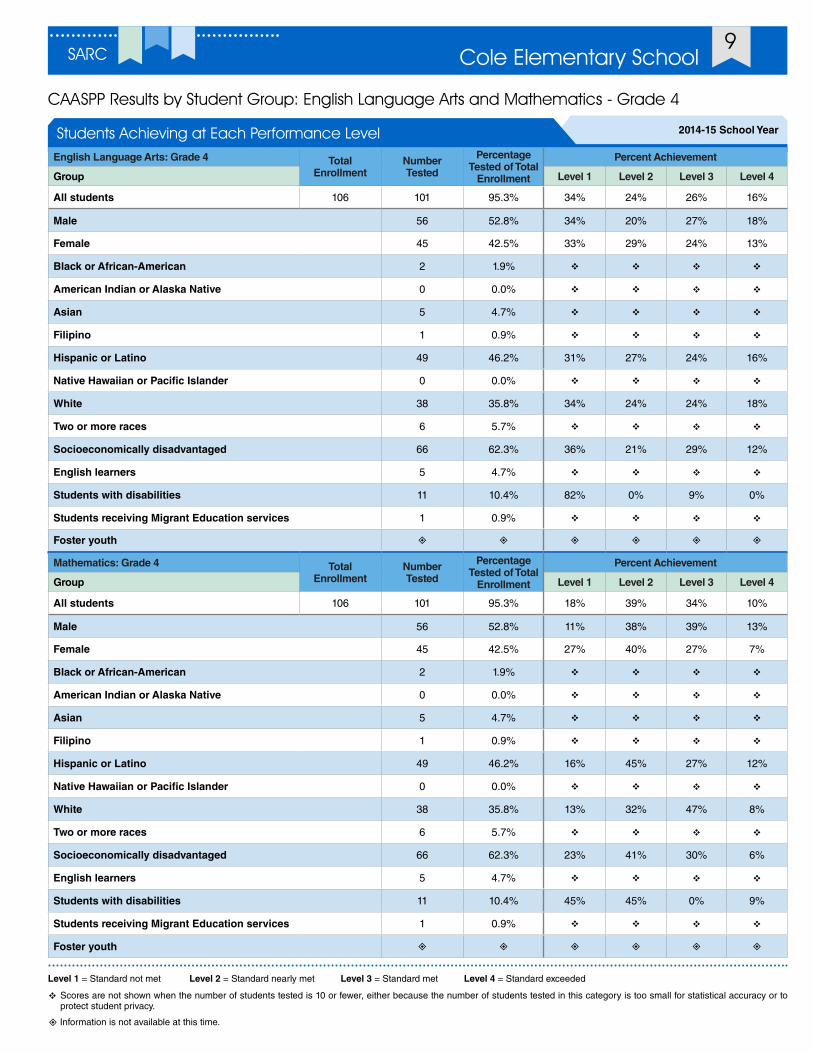
CAASPP Results by Student Group: English Language Arts and Mathematics - Grade 4
Level 1 = Standard not met Level 2 = Standard nearly met Level 3 = Standard met Level 4 = Standard exceeded
v Scores are not shown when the number of students tested is 10 or fewer, either because the number of students tested in this category is too small for statistical accuracy or to protect student privacy.
2014-15 School YearStudents Achieving at Each Performance LevelEnglish Language Arts: Grade 4 Total
EnrollmentNumber Tested
Percentage Tested of Total
Enrollment
Percent Achievement
Group Level 1 Level 2 Level 3 Level 4
All students 106 101 95.3% 34% 24% 26% 16%
Male 56 52.8% 34% 20% 27% 18%
Female 45 42.5% 33% 29% 24% 13%
Black or African-American 2 1.9% v v v v
American Indian or Alaska Native 0 0.0% v v v v
Asian 5 4.7% v v v v
Filipino 1 0.9% v v v v
Hispanic or Latino 49 46.2% 31% 27% 24% 16%
Native Hawaiian or Pacific Islander 0 0.0% v v v v
White 38 35.8% 34% 24% 24% 18%
Two or more races 6 5.7% v v v v
Socioeconomically disadvantaged 66 62.3% 36% 21% 29% 12%
English learners 5 4.7% v v v v
Students with disabilities 11 10.4% 82% 0% 9% 0%
Students receiving Migrant Education services 1 0.9% v v v v
Foster youth ± ± ± ± ± ±
Mathematics: Grade 4 Total Enrollment
Number Tested
Percentage Tested of Total
Enrollment
Percent Achievement
Group Level 1 Level 2 Level 3 Level 4
All students 106 101 95.3% 18% 39% 34% 10%
Male 56 52.8% 11% 38% 39% 13%
Female 45 42.5% 27% 40% 27% 7%
Black or African-American 2 1.9% v v v v
American Indian or Alaska Native 0 0.0% v v v v
Asian 5 4.7% v v v v
Filipino 1 0.9% v v v v
Hispanic or Latino 49 46.2% 16% 45% 27% 12%
Native Hawaiian or Pacific Islander 0 0.0% v v v v
White 38 35.8% 13% 32% 47% 8%
Two or more races 6 5.7% v v v v
Socioeconomically disadvantaged 66 62.3% 23% 41% 30% 6%
English learners 5 4.7% v v v v
Students with disabilities 11 10.4% 45% 45% 0% 9%
Students receiving Migrant Education services 1 0.9% v v v v
Foster youth ± ± ± ± ± ±
± Information is not available at this time.
10
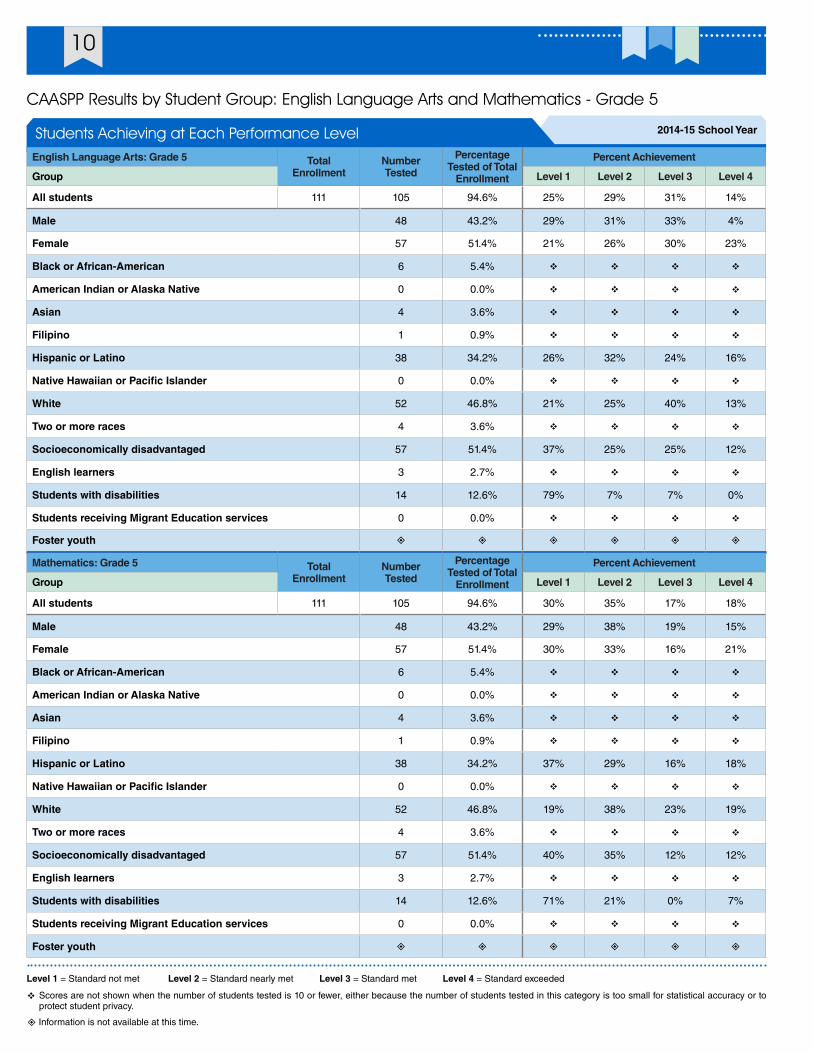
CAASPP Results by Student Group: English Language Arts and Mathematics - Grade 5
Level 1 = Standard not met Level 2 = Standard nearly met Level 3 = Standard met Level 4 = Standard exceeded
v Scores are not shown when the number of students tested is 10 or fewer, either because the number of students tested in this category is too small for statistical accuracy or to protect student privacy.
2014-15 School YearStudents Achieving at Each Performance LevelEnglish Language Arts: Grade 5 Total
EnrollmentNumber Tested
Percentage Tested of Total
Enrollment
Percent Achievement
Group Level 1 Level 2 Level 3 Level 4
All students 111 105 94.6% 25% 29% 31% 14%
Male 48 43.2% 29% 31% 33% 4%
Female 57 51.4% 21% 26% 30% 23%
Black or African-American 6 5.4% v v v v
American Indian or Alaska Native 0 0.0% v v v v
Asian 4 3.6% v v v v
Filipino 1 0.9% v v v v
Hispanic or Latino 38 34.2% 26% 32% 24% 16%
Native Hawaiian or Pacific Islander 0 0.0% v v v v
White 52 46.8% 21% 25% 40% 13%
Two or more races 4 3.6% v v v v
Socioeconomically disadvantaged 57 51.4% 37% 25% 25% 12%
English learners 3 2.7% v v v v
Students with disabilities 14 12.6% 79% 7% 7% 0%
Students receiving Migrant Education services 0 0.0% v v v v
Foster youth ± ± ± ± ± ±
Mathematics: Grade 5 Total Enrollment
Number Tested
Percentage Tested of Total
Enrollment
Percent Achievement
Group Level 1 Level 2 Level 3 Level 4
All students 111 105 94.6% 30% 35% 17% 18%
Male 48 43.2% 29% 38% 19% 15%
Female 57 51.4% 30% 33% 16% 21%
Black or African-American 6 5.4% v v v v
American Indian or Alaska Native 0 0.0% v v v v
Asian 4 3.6% v v v v
Filipino 1 0.9% v v v v
Hispanic or Latino 38 34.2% 37% 29% 16% 18%
Native Hawaiian or Pacific Islander 0 0.0% v v v v
White 52 46.8% 19% 38% 23% 19%
Two or more races 4 3.6% v v v v
Socioeconomically disadvantaged 57 51.4% 40% 35% 12% 12%
English learners 3 2.7% v v v v
Students with disabilities 14 12.6% 71% 21% 0% 7%
Students receiving Migrant Education services 0 0.0% v v v v
Foster youth ± ± ± ± ± ±
± Information is not available at this time.

11Cole Elementary School SARC
CAASPP Results by Student Group: English Language Arts and Mathematics - Grade 6
Level 1 = Standard not met Level 2 = Standard nearly met Level 3 = Standard met Level 4 = Standard exceeded
v Scores are not shown when the number of students tested is 10 or fewer, either because the number of students tested in this category is too small for statistical accuracy or to protect student privacy.
2014-15 School YearStudents Achieving at Each Performance LevelEnglish Language Arts: Grade 6 Total
EnrollmentNumber Tested
Percentage Tested of Total
Enrollment
Percent Achievement
Group Level 1 Level 2 Level 3 Level 4
All students 108 101 93.5% 19% 21% 47% 14%
Male 48 44.4% 29% 19% 42% 10%
Female 53 49.1% 9% 23% 51% 17%
Black or African-American 7 6.5% v v v v
American Indian or Alaska Native 0 0.0% v v v v
Asian 7 6.5% v v v v
Filipino 1 0.9% v v v v
Hispanic or Latino 42 38.9% 14% 19% 57% 10%
Native Hawaiian or Pacific Islander 0 0.0% v v v v
White 41 38.0% 17% 22% 41% 20%
Two or more races 3 2.8% v v v v
Socioeconomically disadvantaged 58 53.7% 24% 21% 41% 14%
English learners 0 0.0% v v v v
Students with disabilities 9 8.3% v v v v
Students receiving Migrant Education services 0 0.0% v v v v
Foster youth ± ± ± ± ± ±
Mathematics: Grade 6 Total Enrollment
Number Tested
Percentage Tested of Total
Enrollment
Percent Achievement
Group Level 1 Level 2 Level 3 Level 4
All students 108 101 93.5% 16% 27% 37% 21%
Male 48 44.4% 13% 33% 35% 19%
Female 53 49.1% 19% 21% 38% 23%
Black or African-American 7 6.5% v v v v
American Indian or Alaska Native 0 0.0% v v v v
Asian 7 6.5% v v v v
Filipino 1 0.9% v v v v
Hispanic or Latino 42 38.9% 21% 21% 40% 17%
Native Hawaiian or Pacific Islander 0 0.0% v v v v
White 41 38.0% 10% 29% 34% 27%
Two or more races 3 2.8% v v v v
Socioeconomically disadvantaged 58 53.7% 24% 28% 31% 17%
English learners 0 0.0% v v v v
Students with disabilities 9 8.3% v v v v
Students receiving Migrant Education services 0 0.0% v v v v
Foster youth ± ± ± ± ± ±
± Information is not available at this time.
12
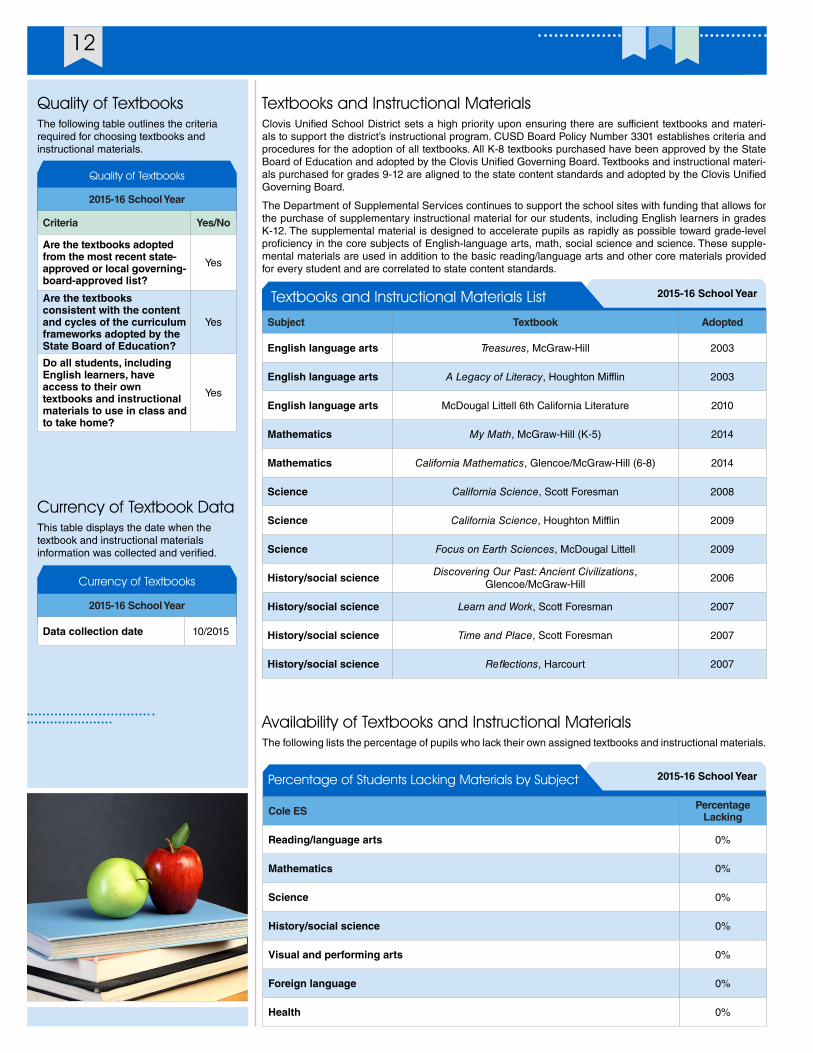
Textbooks and Instructional MaterialsClovis Unified School District sets a high priority upon ensuring there are sufficient textbooks and materi-als to support the district’s instructional program. CUSD Board Policy Number 3301 establishes criteria and procedures for the adoption of all textbooks. All K-8 textbooks purchased have been approved by the State Board of Education and adopted by the Clovis Unified Governing Board. Textbooks and instructional materi-als purchased for grades 9-12 are aligned to the state content standards and adopted by the Clovis Unified Governing Board.
The Department of Supplemental Services continues to support the school sites with funding that allows for the purchase of supplementary instructional material for our students, including English learners in grades K-12. The supplemental material is designed to accelerate pupils as rapidly as possible toward grade-level proficiency in the core subjects of English-language arts, math, social science and science. These supple-mental materials are used in addition to the basic reading/language arts and other core materials provided for every student and are correlated to state content standards.
2015-16 School YearTextbooks and Instructional Materials List
Subject Textbook Adopted
English language arts Treasures, McGraw-Hill 2003
English language arts A Legacy of Literacy, Houghton Mifflin 2003
English language arts McDougal Littell 6th California Literature 2010
Mathematics My Math, McGraw-Hill (K-5) 2014
Mathematics California Mathematics, Glencoe/McGraw-Hill (6-8) 2014
Science California Science, Scott Foresman 2008
Science California Science, Houghton Mifflin 2009
Science Focus on Earth Sciences, McDougal Littell 2009
History/social science Discovering Our Past: Ancient Civilizations, Glencoe/McGraw-Hill
2006
History/social science Learn and Work, Scott Foresman 2007
History/social science Time and Place, Scott Foresman 2007
History/social science Reflections, Harcourt 2007
Currency of Textbook DataThis table displays the date when the textbook and instructional materials information was collected and verified.
Currency of Textbooks
2015-16 School Year
Data collection date 10/2015
Quality of TextbooksThe following table outlines the criteria required for choosing textbooks and instructional materials.
Quality of Textbooks
2015-16 School Year
Criteria Yes/No
Are the textbooks adopted from the most recent state-approved or local governing-board-approved list?
Yes
Are the textbooks consistent with the content and cycles of the curriculum frameworks adopted by the State Board of Education?
Yes
Do all students, including English learners, have access to their own textbooks and instructional materials to use in class and to take home?
Yes
Availability of Textbooks and Instructional MaterialsThe following lists the percentage of pupils who lack their own assigned textbooks and instructional materials.
2015-16 School YearPercentage of Students Lacking Materials by Subject
Cole ES Percentage Lacking
Reading/language arts 0%
Mathematics 0%
Science 0%
History/social science 0%
Visual and performing arts 0%
Foreign language 0%
Health 0%
13Cole Elementary School SARC
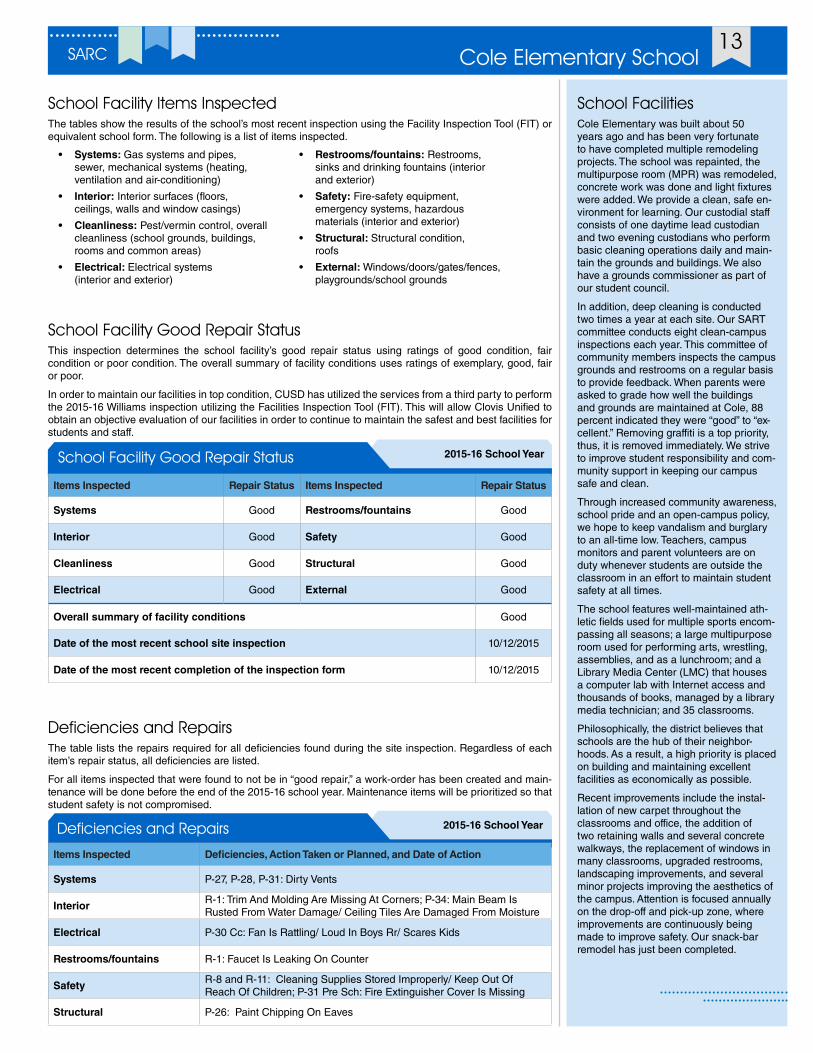
• Systems: Gas systems and pipes, sewer, mechanical systems (heating, ventilation and air-conditioning)
• Interior: Interior surfaces (floors, ceilings, walls and window casings)
• Cleanliness: Pest/vermin control, overall cleanliness (school grounds, buildings, rooms and common areas)
• Electrical: Electrical systems (interior and exterior)
• Restrooms/fountains: Restrooms, sinks and drinking fountains (interior and exterior)
• Safety: Fire-safety equipment, emergency systems, hazardous materials (interior and exterior)
• Structural: Structural condition, roofs
• External: Windows/doors/gates/fences, playgrounds/school grounds
School Facility Items Inspected The tables show the results of the school’s most recent inspection using the Facility Inspection Tool (FIT) or equivalent school form. The following is a list of items inspected.
School FacilitiesCole Elementary was built about 50 years ago and has been very fortunate to have completed multiple remodeling projects. The school was repainted, the multipurpose room (MPR) was remodeled, concrete work was done and light fixtures were added. We provide a clean, safe en-vironment for learning. Our custodial staff consists of one daytime lead custodian and two evening custodians who perform basic cleaning operations daily and main-tain the grounds and buildings. We also have a grounds commissioner as part of our student council.
In addition, deep cleaning is conducted two times a year at each site. Our SART committee conducts eight clean-campus inspections each year. This committee of community members inspects the campus grounds and restrooms on a regular basis to provide feedback. When parents were asked to grade how well the buildings and grounds are maintained at Cole, 88 percent indicated they were “good” to “ex-cellent.” Removing graffiti is a top priority, thus, it is removed immediately. We strive to improve student responsibility and com-munity support in keeping our campus safe and clean.
Through increased community awareness, school pride and an open-campus policy, we hope to keep vandalism and burglary to an all-time low. Teachers, campus monitors and parent volunteers are on duty whenever students are outside the classroom in an effort to maintain student safety at all times.
The school features well-maintained ath-letic fields used for multiple sports encom-passing all seasons; a large multipurpose room used for performing arts, wrestling, assemblies, and as a lunchroom; and a Library Media Center (LMC) that houses a computer lab with Internet access and thousands of books, managed by a library media technician; and 35 classrooms.
Philosophically, the district believes that schools are the hub of their neighbor-hoods. As a result, a high priority is placed on building and maintaining excellent facilities as economically as possible.
Recent improvements include the instal-lation of new carpet throughout the classrooms and office, the addition of two retaining walls and several concrete walkways, the replacement of windows in many classrooms, upgraded restrooms, landscaping improvements, and several minor projects improving the aesthetics of the campus. Attention is focused annually on the drop-off and pick-up zone, where improvements are continuously being made to improve safety. Our snack-bar remodel has just been completed.
Deficiencies and RepairsThe table lists the repairs required for all deficiencies found during the site inspection. Regardless of each item’s repair status, all deficiencies are listed.
For all items inspected that were found to not be in “good repair,” a work-order has been created and main-tenance will be done before the end of the 2015-16 school year. Maintenance items will be prioritized so that student safety is not compromised.
2015-16 School YearDeficiencies and Repairs
Items Inspected Deficiencies, Action Taken or Planned, and Date of Action
Systems P-27, P-28, P-31: Dirty Vents
Interior R-1: Trim And Molding Are Missing At Corners; P-34: Main Beam Is Rusted From Water Damage/ Ceiling Tiles Are Damaged From Moisture
Electrical P-30 Cc: Fan Is Rattling/ Loud In Boys Rr/ Scares Kids
Restrooms/fountains R-1: Faucet Is Leaking On Counter
Safety R-8 and R-11: Cleaning Supplies Stored Improperly/ Keep Out Of Reach Of Children; P-31 Pre Sch: Fire Extinguisher Cover Is Missing
Structural P-26: Paint Chipping On Eaves
School Facility Good Repair Status This inspection determines the school facility’s good repair status using ratings of good condition, fair condition or poor condition. The overall summary of facility conditions uses ratings of exemplary, good, fair or poor.
In order to maintain our facilities in top condition, CUSD has utilized the services from a third party to perform the 2015-16 Williams inspection utilizing the Facilities Inspection Tool (FIT). This will allow Clovis Unified to obtain an objective evaluation of our facilities in order to continue to maintain the safest and best facilities for students and staff.
2015-16 School YearSchool Facility Good Repair Status
Items Inspected Repair Status Items Inspected Repair Status
Systems Good Restrooms/fountains Good
Interior Good Safety Good
Cleanliness Good Structural Good
Electrical Good External Good
Overall summary of facility conditions Good
Date of the most recent school site inspection 10/12/2015
Date of the most recent completion of the inspection form 10/12/2015
14
Types of Services FundedContinued from left
The Local Control Accountability Plan (LCAP) is an important component of the LCFF. Under the LCFF, all districts are required to prepare an LCAP, which describes how they intend to meet annual goals for all pupils, with specific activities to address state and local priorities identified pursuant to Education Code (EC) Section 52060(d). Each school district must engage parents, educators, employees and the community to establish these plans. Parental and community engagement of all stakeholders is critical to the development of the district LCAP. CUSD continues to work with all stakeholder groups in holding various district and school com-mittee meeting and forums designed to gather information on various specific areas of importance.
The plans will describe the school district’s overall vision for students, annual goals and specific actions the district will take to achieve the vision and goals.
The LCAPs must focus on eight areas identified as state priorities. District plans will also demonstrate how the district’s budget will help achieve the goals and assess each year how well the strategies in the plan were able to improve outcomes.
Clovis Unified Schools are committed to establishing a true partnership with all facets of the Clovis Learning Community. CUSD values feedback and input. Parents continue to make positive differences in the lives of the children we all support. We know from research that participation in your child’s education will not only bring success to your child, but other children in the school. Our parents truly make a difference in the lives of Clovis kids!
CUSD is proud and pleased to offer a variety of parent involvement opportunities that improve our overall program. Depending on the type of categorical funding a site may receive, district or school parent councils and committees are required under certain requirements and guidelines. Such advisory committees in the CUSD include the following:
• School Site Council (SSC)• English Learner Advisory Committee (ELAC)• District Advisory Committee (DAC)• District English Learner Advisory Committee (DELAC)• District Migrant Education Parent Advisory Committee (DMEPAC)• District Indian Education Parent Advisory Committee (IPAC)• School- and district-level School Assessment Review Team (SART)• Intercultural and Diversity Advisory Council (IDAC)
We encourage all parents and guardians to become involved with their child’s education, at the classroom level, the schoolwide level, as well as the district level. Each school’s Single Plan for Student Achievement (SPSA) describes the school’s basic educational program and the categorical supplementary programs/ser-vices that are designed to support student achievement of each and every student. Parental involvement is a necessary and vital part of developing the SPSA as well as our overall program. At the district level, parent committees provide input into each site’s SPSA and to the district’s Local Education Agency Plan (LEAP). If you would like additional information on any of the District Parent Council or Committee, please call your child’s school. The principal, learning director or guidance instructional specialist (GIS) would be happy to assist you. You could also visit www.cusd.com/?s=special+projects. These two school committees meet on a quarterly basis. The committees consist of administration, staff and parents. Students are also involved at the intermediate and secondary level.
Listed below are several parent committees that assist with categorical programs and funding. For more information, please call your school or go to: www.cusd.com/?s=special+projects.
School Site Council (SSC): All schools receiving categorical funds are required to form an SSC. The SSC is composed of parents, school personnel and students at the secondary level and is responsible for devel-oping, implementing and evaluating the SPSA programs. Members serve for two years and are elected by their peers.
District Advisory Committee (DAC)/School Advisory Committee (SAC): The entirety of the SSC acts as the SAC. The SAC serves as an advisory committee for the purpose of advising schools regarding supple-mental education programs and acting as a liaison for their school community. They serve to share informa-tion and comments both at the district and site level. These education programs are supplemental education opportunities provide to students who are disadvantaged, English learners (ELs), foster youth or at-risk. The SSC has approved to designate our SSC pursuant to California Education Code Section 52852 to function as the School Advisory Committee.
English Language Advisory Committee (ELAC): All schools enrolling 21 or more English learners are re-quired to form an ELAC. The ELAC is composed of parents and school personnel. The ELAC provides input and makes recommendations to the principal, staff and SSC regarding services for English learners, as well as conducting an annual survey. Members serve for two years.
District English Language Advisory Committee (DELAC): Whenever there are 51 or more EL students in the district, there shall be a functioning DELAC. It is important that each school site ELAC elect a DELAC representative and arrange to have that representative attend every DELAC meeting. Currently, the DELAC bylaws require each DELAC representative to be: 1) a parent/guardian of an EL or former EL (i.e., a reclassi-fied fluent English-proficient student) currently enrolled at the site he/she represents, and 2) elected to serve as the DELAC representative by the site ELAC.
Continued on page 15
Types of Services Funded“Children Are Our Most Precious
Resource”
On an annual basis, Clovis Unified School District submits the application for funding consolidated categorical aid programs, commonly called the ConApp. The ap-plication is submitted in two parts: Part I, which contains program and demographic information, is submitted by June 1 each year; Part II, which contains the budget information and additional program data, is submitted by January 31 each year. The categorical programs included in the ap-plication are Title I, Part A – Improving the Academic Achievement of the Disadvan-taged Improving; Title I, Part C – Migrant Education; Title II, Part A – Preparing, Training, and Recruiting High Quality Teachers and Principals; and Title III – Language Instruction for Limited English Proficient and Immigrant Students. Essen-tially, these funds are designed to assist students in mastering state standards.
The 2013-14 California Department of Education (CDE) budget package replaces the previous K-12 finance system with a new Local Control Funding Formula (LCFF). For school districts and charter schools, the LCFF creates base, supplemental, and concentration grants in place of most previously existing K-12 funding streams, including revenue limits and most state categorical programs. For county offices of education (COEs), the LCFF creates separate funding streams for oversight activities and instructional programs.
The goal of the LCFF is to significantly simplify how state funding is provided to local educational agencies (LEAs). Under the new funding system, revenue limits and most state categorical programs are eliminated. LEAs will receive fund-ing based on the demographic profile of the students they serve and gain greater flexibility to use these funds to improve outcomes of students. The LCFF creates funding targets based on these student characteristics.
Continued to the right
15Cole Elementary School SARC
Types of Services FundedContinued from page 14
The following is an overview of the categorical funding and programs in CUSD. These funds are further dis-cussed and outlined in each school’s SPSA and at the committee meetings.
Rationale: General district funds provide support for the district’s base/core curriculum program. Some chil-dren have special characteristics, not reflective of the general school population, that affect their success in the base/core programs.
Some come from economically disadvantaged homes. Some are educationally disadvantaged or lack Eng-lish-language proficiency because they have a primary language other than English. Children, such as those described above, require supplemental services and materials not generally provided through the base/core curriculum program. The needs of our children are identified and supplemental services and materials are planned and targeted to meet their special needs. Categorical funds are to be used to provide the financial support to meet these special needs.
Philosophy: All CUSD schools offer students with special needs the same kind of high-quality learning opportunities and access to the core curriculum in all curricular areas. Categorical funds are designed to support additional assistance to help students succeed in the regular classroom program (base/core cur-riculum) and address any learning gaps. The focus is on the effective utilization of supplementary materials, personnel, and staff development. Staff development activities are used to improve instructional practices and strategies to increase the ability of teachers and other staff to challenge and assist all students to reach their fullest potential.
Categorical Program Descriptions
1. After School Safety and Education Funds (ASES): This state-funded and administered program provides three year grant funding to establish or expand after school programs that provide students with academic support and intervention, enrichment opportunities and supportive services to help the students meet state and local standards in core content areas. The purpose of the ASES program is to create additional educational and recreational opportunities for students within the learning community while providing a safe environment for students. The goals of this program are to: 1) improve academic achievement, and 2) provide enrichment opportunities that reinforce and complement the academic program.
2. Title I, Part A (Improving the Academic Achievement of the Disadvantaged): A federal-funded program to provide high-quality opportunities for students in high-poverty schools to meet district and state content and performance standards.
3. Title I, Part A, Title X, Part C (Homeless Education): Education for Homeless Children and Youths: Title I, Part A funds to provide comparable services to homeless children that assist them to effectively take advantage of educational opportunities as provided to children in schools funded under Title I, Part A. These comparable services shall be provided to homeless children in public and private schools, shelters and other locations where children may live, institutions for neglected children and, where appropriate, local institutions such as local community day school programs. This reservation requirement is not formula driven.
4. Title I, Part C (Migrant Education Program): A federal-funded program focused on providing services for migratory students and their families.
5. Title I, Part D: Local Delinquent Programs: A funded program that serve students who are neglected, delinquent or at-risk, including programs involving collaboration with locally operated correctional facilities.
6. Title II, Part A (Preparing, Training, and Recruiting High Quality Teachers and Principals): A federal-funded program focused on teacher and principal training and recruitment programs.
7. Title III (Language Instruction for Limited English Proficient and Immigrant Students): A federal-funded program focused on assisting school districts in teaching English to limited English proficient students (English learners) and immigrants and helping these students meet the same challenging state standards required of all other students.
8. Title VII (Indian Education Formula Grant): A federal-funded program focused on helping Native American/Alaskan Native students meet the same challenging state standards required of all other students.
The goal of the CUSD staff is to create and maintain the best educational environment possible. This can be accomplished with your support and input. If you have any questions, concerns or would like to become more involved in the educational process at your school, please contact your school principal. Your school can as-sist you in learning more about categorical programs. You may want to become involved in your school’s SSC, ELAC or attend the annual Title I Parent Meeting. During the fall, each school will send additional Information about these activities. At the district level, we encourage you to become involved with our DELAC. We encour-age and look forward to your involvement in the programs we offer our learning community.
If you have any questions, please call your child’s school or the CUSD Department of Supplemental Services at (559) 327-9086, additional information may be found at www.cusd.com/?s=special+projects.
Social MediaFollow Clovis Unified news and events on Twitter and Facebook; Clovis Unified uses Facebook and Twitter to update our com-munity on current events and decisions impacting our schools. Parents, students, employees and community members are invited to follow the district by clicking on the social-media icons located on the right-hand side of the district website, www.cusd.com.
Public Internet AccessInternet access is available at all CUSD school sites, public libraries and other locations that are publicly accessible (i.e., the California State Library). Access to the Internet at libraries and public locations is generally provided on a first-come, first-serve basis. Other use restrictions include the hours of operation, the length of time that a workstation may be used (depend-ing on availability), the types of software programs available on a workstation and the ability to print documents.
For information on usage of Fresno County public libraries, including public use of computers with Internet access, please call (559) 488-3195 or visit www.fresnolibrary.org.
“PAW Pride: Positive Attitudes Work.”
16
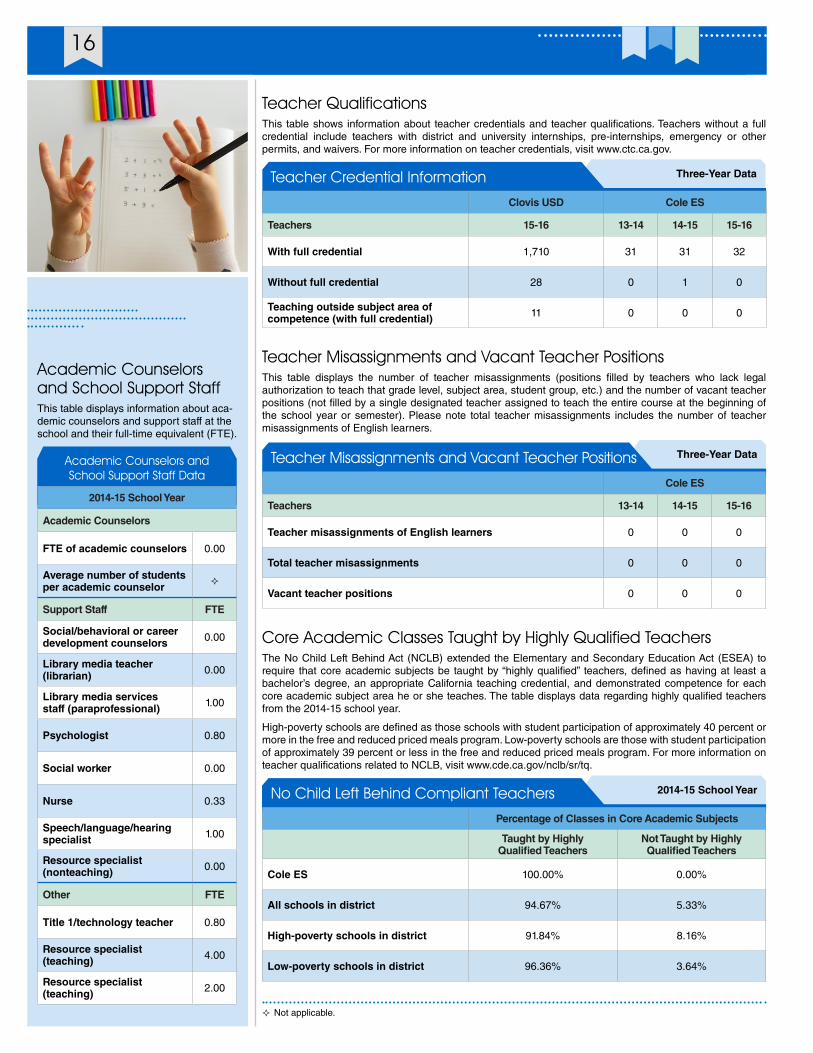
Academic Counselors and School Support StaffThis table displays information about aca-demic counselors and support staff at the school and their full-time equivalent (FTE).
Academic Counselors and School Support Staff Data
2014-15 School Year
Academic Counselors
FTE of academic counselors 0.00
Average number of students per academic counselor ²
Support Staff FTE
Social/behavioral or career development counselors 0.00
Library media teacher (librarian) 0.00
Library media services staff (paraprofessional) 1.00
Psychologist 0.80
Social worker 0.00
Nurse 0.33
Speech/language/hearing specialist 1.00
Resource specialist (nonteaching) 0.00
Other FTE
Title 1/technology teacher 0.80
Resource specialist (teaching) 4.00
Resource specialist (teaching) 2.00
Teacher QualificationsThis table shows information about teacher credentials and teacher qualifications. Teachers without a full credential include teachers with district and university internships, pre-internships, emergency or other permits, and waivers. For more information on teacher credentials, visit www.ctc.ca.gov.
Three-Year DataTeacher Credential Information
Clovis USD Cole ES
Teachers 15-16 13-14 14-15 15-16
With full credential 1,710 31 31 32
Without full credential 28 0 1 0
Teaching outside subject area of competence (with full credential) 11 0 0 0
Teacher Misassignments and Vacant Teacher PositionsThis table displays the number of teacher misassignments (positions filled by teachers who lack legal authorization to teach that grade level, subject area, student group, etc.) and the number of vacant teacher positions (not filled by a single designated teacher assigned to teach the entire course at the beginning of the school year or semester). Please note total teacher misassignments includes the number of teacher misassignments of English learners.
Three-Year DataTeacher Misassignments and Vacant Teacher Positions
Cole ES
Teachers 13-14 14-15 15-16
Teacher misassignments of English learners 0 0 0
Total teacher misassignments 0 0 0
Vacant teacher positions 0 0 0
Core Academic Classes Taught by Highly Qualified TeachersThe No Child Left Behind Act (NCLB) extended the Elementary and Secondary Education Act (ESEA) to require that core academic subjects be taught by “highly qualified” teachers, defined as having at least a bachelor’s degree, an appropriate California teaching credential, and demonstrated competence for each core academic subject area he or she teaches. The table displays data regarding highly qualified teachers from the 2014-15 school year.
High-poverty schools are defined as those schools with student participation of approximately 40 percent or more in the free and reduced priced meals program. Low-poverty schools are those with student participation of approximately 39 percent or less in the free and reduced priced meals program. For more information on teacher qualifications related to NCLB, visit www.cde.ca.gov/nclb/sr/tq.
2014-15 School YearNo Child Left Behind Compliant Teachers
Percentage of Classes in Core Academic Subjects
Taught by Highly Qualified Teachers
Not Taught by Highly Qualified Teachers
Cole ES 100.00% 0.00%
All schools in district 94.67% 5.33%
High-poverty schools in district 91.84% 8.16%
Low-poverty schools in district 96.36% 3.64%
² Not applicable.
2013-14 School Accountability Report Card
17Cole Elementary School
Data for this year’s SARC was provided by the California Department of Education (CDE), school and district offices. For additional information on California schools and districts and comparisons of the school to the district, the county and the state, please visit DataQuest at http://data1.cde.ca.gov/dataquest. DataQuest is an online resource that provides reports for accountability, test data, enrollment, graduates, dropouts, course enrollments, staffing and data regarding English learners. Per Education Code Section 35256, each school district shall make hard copies of its annually updated report card available, upon request, on or before February 1 of each year.
All data accurate as of December 2015.
School Accountability Report Card
Published by:
www.sia-us.com | 800.487.9234
SARC
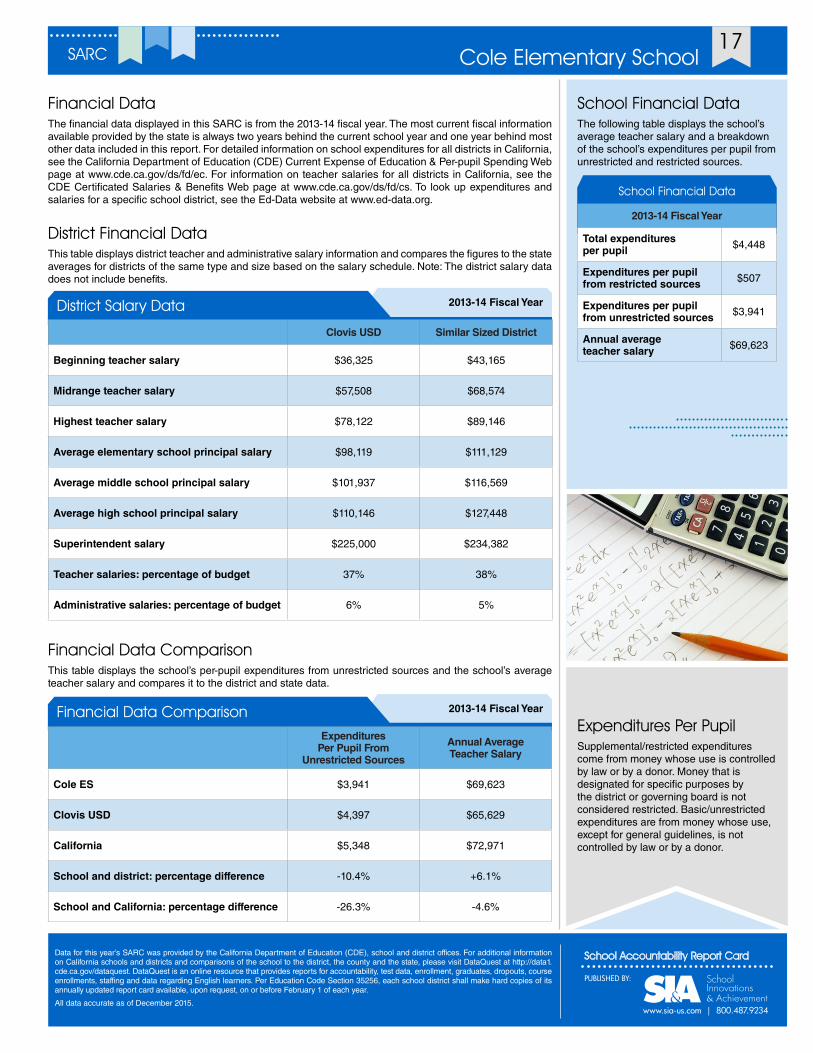
School Financial Data
2013-14 Fiscal Year
Total expenditures per pupil $4,448
Expenditures per pupil from restricted sources $507
Expenditures per pupil from unrestricted sources $3,941
Annual average teacher salary $69,623
School Financial DataThe following table displays the school’s average teacher salary and a breakdown of the school’s expenditures per pupil from unrestricted and restricted sources.
Expenditures Per PupilSupplemental/restricted expenditures come from money whose use is controlled by law or by a donor. Money that is designated for specific purposes by the district or governing board is not considered restricted. Basic/unrestricted expenditures are from money whose use, except for general guidelines, is not controlled by law or by a donor.
Financial Data The financial data displayed in this SARC is from the 2013-14 fiscal year. The most current fiscal information available provided by the state is always two years behind the current school year and one year behind most other data included in this report. For detailed information on school expenditures for all districts in California, see the California Department of Education (CDE) Current Expense of Education & Per-pupil Spending Web page at www.cde.ca.gov/ds/fd/ec. For information on teacher salaries for all districts in California, see the CDE Certificated Salaries & Benefits Web page at www.cde.ca.gov/ds/fd/cs. To look up expenditures and salaries for a specific school district, see the Ed-Data website at www.ed-data.org.
District Financial DataThis table displays district teacher and administrative salary information and compares the figures to the state averages for districts of the same type and size based on the salary schedule. Note: The district salary data does not include benefits.
2013-14 Fiscal YearDistrict Salary Data
Clovis USD Similar Sized District
Beginning teacher salary $36,325 $43,165
Midrange teacher salary $57,508 $68,574
Highest teacher salary $78,122 $89,146
Average elementary school principal salary $98,119 $111,129
Average middle school principal salary $101,937 $116,569
Average high school principal salary $110,146 $127,448
Superintendent salary $225,000 $234,382
Teacher salaries: percentage of budget 37% 38%
Administrative salaries: percentage of budget 6% 5%
Financial Data ComparisonThis table displays the school’s per-pupil expenditures from unrestricted sources and the school’s average teacher salary and compares it to the district and state data.
2013-14 Fiscal YearFinancial Data ComparisonExpenditures
Per Pupil From Unrestricted Sources
Annual Average Teacher Salary
Cole ES $3,941 $69,623
Clovis USD $4,397 $65,629
California $5,348 $72,971
School and district: percentage difference -10.4% +6.1%
School and California: percentage difference -26.3% -4.6%
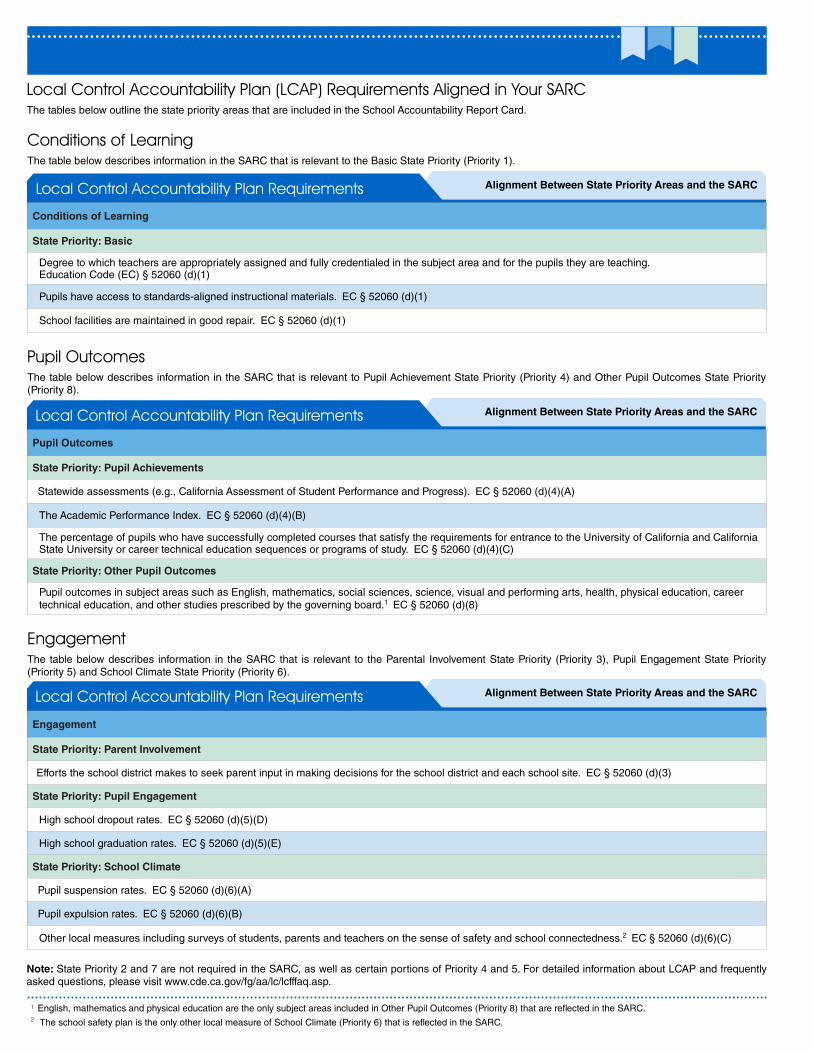
Local Control Accountability Plan (LCAP) Requirements Aligned in Your SARCThe tables below outline the state priority areas that are included in the School Accountability Report Card.
Note: State Priority 2 and 7 are not required in the SARC, as well as certain portions of Priority 4 and 5. For detailed information about LCAP and frequently asked questions, please visit www.cde.ca.gov/fg/aa/lc/lcfffaq.asp.
Conditions of LearningThe table below describes information in the SARC that is relevant to the Basic State Priority (Priority 1).
Alignment Between State Priority Areas and the SARCLocal Control Accountability Plan Requirements
Conditions of Learning
State Priority: Basic
Degree to which teachers are appropriately assigned and fully credentialed in the subject area and for the pupils they are teaching. Education Code (EC) § 52060 (d)(1)
Pupils have access to standards-aligned instructional materials. EC § 52060 (d)(1)
School facilities are maintained in good repair. EC § 52060 (d)(1)
Pupil OutcomesThe table below describes information in the SARC that is relevant to Pupil Achievement State Priority (Priority 4) and Other Pupil Outcomes State Priority (Priority 8).
Alignment Between State Priority Areas and the SARCLocal Control Accountability Plan Requirements
Pupil Outcomes
State Priority: Pupil Achievements
Statewide assessments (e.g., California Assessment of Student Performance and Progress). EC § 52060 (d)(4)(A)
The Academic Performance Index. EC § 52060 (d)(4)(B)
The percentage of pupils who have successfully completed courses that satisfy the requirements for entrance to the University of California and California State University or career technical education sequences or programs of study. EC § 52060 (d)(4)(C)
State Priority: Other Pupil Outcomes
Pupil outcomes in subject areas such as English, mathematics, social sciences, science, visual and performing arts, health, physical education, career technical education, and other studies prescribed by the governing board.1 EC § 52060 (d)(8)
EngagementThe table below describes information in the SARC that is relevant to the Parental Involvement State Priority (Priority 3), Pupil Engagement State Priority (Priority 5) and School Climate State Priority (Priority 6).
English, mathematics and physical education are the only subject areas included in Other Pupil Outcomes (Priority 8) that are reflected in the SARC. 1
The school safety plan is the only other local measure of School Climate (Priority 6) that is reflected in the SARC.2
Alignment Between State Priority Areas and the SARCLocal Control Accountability Plan Requirements
Engagement
State Priority: Parent Involvement
Efforts the school district makes to seek parent input in making decisions for the school district and each school site. EC § 52060 (d)(3)
State Priority: Pupil Engagement
High school dropout rates. EC § 52060 (d)(5)(D)
High school graduation rates. EC § 52060 (d)(5)(E)
State Priority: School Climate
Pupil suspension rates. EC § 52060 (d)(6)(A)
Pupil expulsion rates. EC § 52060 (d)(6)(B)
Other local measures including surveys of students, parents and teachers on the sense of safety and school connectedness.2 EC § 52060 (d)(6)(C)