Embed Size (px)
Citation preview

Cold Storage
ISSN: 1948-903X
Released August 22, 2019, by the National Agricultural Statistics Service (NASS), Agricultural Statistics Board, United States Department of
Agriculture (USDA).
July 2019 Highlights Total natural cheese stocks in refrigerated warehouses on July 31, 2019 were down 1 percent from the previous month
and down 3 percent from July 31, 2018.
Butter stocks were up 1 percent from last month and up 4 percent from a year ago.
Total frozen poultry supplies on July 31, 2019 were up 2 percent from the previous month but down 4 percent from a
year ago. Total stocks of chicken were up 2 percent from the previous month but down 3 percent from last year. Total
pounds of turkey in freezers were up 3 percent from last month but down 6 percent from July 31, 2018.
Total frozen fruit stocks were up 18 percent from last month but down 18 percent from a year ago.
Total frozen vegetable stocks were up 12 percent from last month but down 2 percent from a year ago.
Total red meat supplies in freezers were up 3 percent from the previous month and up 1 percent from last year. Total
pounds of beef in freezers were up 12 percent from the previous month but down 6 percent from last year. Frozen pork
supplies were down 3 percent from the previous month but up 9 percent from last year. Stocks of pork bellies were down
7 percent from last month but up 37 percent from last year.
Records Record highs and lows for the month of July can be found on pages 20-23.

2 Cold Storage (August 2019) USDA, National Agricultural Statistics Service
This page intentionally left blank.

Cold Storage (August 2019) 3 USDA, National Agricultural Statistics Service
Contents Nuts, Dairy Products, Frozen Eggs, and Frozen Poultry in Cold Storage – United States: July 31, 2019
with Comparisons ................................................................................................................................................................... 4
Frozen Fruit and Frozen Juice Concentrate in Cold Storage – United States: July 31, 2019 with Comparisons ................... 5
Frozen Vegetables and Frozen Potatoes in Cold Storage – United States: July 31, 2019 with Comparisons ........................ 6
Frozen Red Meat and Commodities in Cold Storage – United States: July 31, 2019 with Comparisons .............................. 7
Nuts and Dairy Products in Cold Storage – Regions: July 31, 2019 with Comparisons ........................................................ 8
Frozen Poultry in Cold Storage – Regions: July 31, 2019 with Comparisons ........................................................................ 9
Frozen Fruit and Frozen Juice Concentrate in Cold Storage – Regions: July 31, 2019 with Comparisons .......................... 12
Frozen Vegetables in Cold Storage – Regions: July 31, 2019 with Comparisons ................................................................ 14
Frozen Potatoes in Cold Storage – Regions: July 31, 2019 with Comparisons .................................................................... 18
Frozen Red Meat in Cold Storage – Regions: July 31, 2019 with Comparisons .................................................................. 19
Record Highs and Lows of Nuts, Dairy Products, Frozen Eggs, and Frozen Poultry in Cold Storage –
United States: July 2019 ....................................................................................................................................................... 20
Record Highs and Lows of Frozen Fruit and Frozen Juice Concentrate in Cold Storage – United States:
July 2019 ............................................................................................................................................................................... 21
Record Highs and Lows of Frozen Vegetables and Frozen Potatoes in Cold Storage – United States: July 2019 .............. 22
Record Highs and Lows of Frozen Red Meat and Commodities in Cold Storage – United States: July 2019..................... 23
Cold Storage Regional Listing .............................................................................................................................................. 24
Definitions ............................................................................................................................................................................. 24
Publication Notes .................................................................................................................................................................. 25
Statistical Methodology ........................................................................................................................................................ 26
Information Contacts ............................................................................................................................................................ 26

4 Cold Storage (August 2019) USDA, National Agricultural Statistics Service
Nuts, Dairy Products, Frozen Eggs, and Frozen Poultry in Cold Storage – United States: July 31, 2019 with Comparisons
Commodity
Stocks in all warehouses July 31, 2019
as a percent of
Public warehouse
stocks
July 31, 2018
June 30, 2019
July 31, 2019
July 31, 2018
June 30, 2019
July 31, 2019
(1,000 pounds) (1,000 pounds) (1,000 pounds) (percent) (percent) (1,000 pounds)
Nuts Shelled Pecans ....................................................... In-Shell Pecans ....................................................... Dairy products Butter ............................................................. Natural cheese American .................................................... Swiss ......................................................... Other .......................................................... Total natural cheese ................................... Frozen eggs Whites ............................................................ Yolks .............................................................. Whole and mixed ........................................... Unclassified ................................................... Total frozen eggs ........................................... Frozen poultry Chicken Broilers, fryers, and roasters ...................... Hens, mature chickens ............................... Breasts and breast meat ............................ Drumsticks ................................................. Leg quarters ............................................... Legs ........................................................... Thigh and thigh quarters ............................ Thigh Meat ................................................. Wings ......................................................... Paws and feet ............................................ Other .......................................................... Total chicken .............................................. Turkey Whole turkeys Toms ...................................................... Hens ...................................................... Total whole turkeys ................................ Breasts ...................................................... Legs ........................................................... Mechanically deboned meat ....................... Other .......................................................... Unclassified ............................................... Total turkey ................................................ Ducks ............................................................. Total frozen poultry ........................................
65,379
89,383
318,325
823,342 32,189
557,449 1,412,980
3,220 1,095
13,169 12,307 29,791
16,379 6,310
170,472 36,503 81,554 15,527 9,182
23,595 88,979 33,573
395,575 877,649
181,480 147,906 329,386 99,010 14,039 10,182 34,366
107,944 594,927
4,285
1,476,861
68,779
124,389
326,297
785,914 27,417
569,005 1,382,336
3,517 1,034
17,489 15,329 37,369
21,506 7,253
178,494 36,660 54,022 11,287 8,726
39,835 62,652 25,608
390,172 836,215
148,822 137,083 285,905 105,349
9,737 10,636 26,174
100,913 538,714
4,052
1,378,981
68,390
98,316
329,763
775,887 27,203
560,923 1,364,013
3,285 927
17,742 13,634 35,588
20,556 8,735
176,784 42,510 64,315 12,579 7,237
40,496 65,004 27,593
384,654 850,463
160,294 149,710 310,004 100,621 10,053 8,394
25,546 102,400 557,018
3,820
1,411,301
105
110
104
94 85
101 97
102 85
135 111 119
126 138 104 116 79 81 79
172 73 82 97 97
88 101 94
102 72 82 74 95 94
89
96
99
79
101
99 99 99 99
93 90
101 89 95
96 120 99
116 119 111 83
102 104 108 99
102
108 109 108 96
103 79 98
101 103
94
102
318,577
1,026,044
35,071
1,315,986

Cold Storage (August 2019) 5 USDA, National Agricultural Statistics Service
Frozen Fruit and Frozen Juice Concentrate in Cold Storage – United States: July 31, 2019 with Comparisons
Commodity
Stocks in all warehouses July 31, 2019
as a percent of
Public warehouse
stocks
July 31, 2018
June 30, 2019
July 31, 2019
July 31, 2018
June 30, 2019
July 31, 2019
(1,000 pounds) (1,000 pounds) (1,000 pounds) (percent) (percent) (1,000 pounds)
Frozen fruit Apples ........................................................... Apricots ......................................................... Blackberries Individual quick frozen ............................... Pails and tubs ............................................ Barrels, 400 lbs net .................................... Concentrate ............................................... Total blackberries ...................................... Blueberries .................................................... Boysenberries ................................................ Cherries, tart (ripe tart pitted) ......................... Cherries, tart (juice stock) .............................. Cherries, tart (juice concentrate) .................... Cherries, sweet .............................................. Grapes .......................................................... Peaches ........................................................ Raspberries, black ......................................... Raspberries, red Individual quick frozen ............................... Pails and tubs ............................................ Barrels, 400 lbs net .................................... Concentrate ............................................... Total red raspberries .................................. Strawberries Individual quick frozen and poly ................. Pails and tubs ............................................ Barrels and drums ..................................... Juice stock ................................................. Total strawberries ...................................... Other ............................................................. Total frozen fruit ............................................. Frozen juice concentrate Orange .......................................................... (Gallon equivalent) ..................................... Other ............................................................. Total frozen juice concentrate ........................
30,609 9,538
25,723 1,681
10,207 1,103
38,714 175,163
1,044
167,724 9,683 3,708
16,941 3,719
37,622 2,718
55,768 9,483
46,228 1,978
113,457
138,909 122,929 100,883 10,475
373,196 395,232
1,379,068
691,110 69,837
318,509
1,009,619
28,122 3,760
8,830 1,094 2,070
670 12,664 93,422
1,294
84,115 8,151 2,009
10,117 4,351
38,043 998
18,124 4,776
15,087 1,611
39,598
111,976 101,099 43,433 12,982
269,490 357,543
953,677
859,757 86,879
315,548
1,175,305
26,265 3,820
23,770 1,502 6,486
762 32,520
174,769
2,052 116,277
8,061 2,441
14,057 4,348
42,976 1,656
45,881 8,206
31,051 2,853
87,991
109,289 101,100 48,034 13,680
272,103 335,842
1,125,178
822,044 83,068
319,662
1,141,706
86 40
92 89 64 69 84
100
197 69 83 66 83
117 114 61
82 87 67
144 78
79 82 48
131 73 85
82
119
100
113
93
102
269 137 313 114 257 187
159 138 99
122 139 100 113 166
253 172 206 177 222
98
100 111 105 101 94
118
96
101
97
1,009,525
288,586

6 Cold Storage (August 2019) USDA, National Agricultural Statistics Service
Frozen Vegetables and Frozen Potatoes in Cold Storage – United States: July 31, 2019 with Comparisons
Commodity
Stocks in all warehouses July 31, 2019
as a percent of
Public warehouse
stocks
July 31, 2018
June 30, 2019
July 31, 2019
July 31, 2018
June 30, 2019
July 31, 2019
(1,000 pounds) (1,000 pounds) (1,000 pounds) (percent) (percent) (1,000 pounds)
Frozen vegetables Asparagus ...................................................... Lima beans .................................................... Green beans, regular cut ............................... Green beans, french style .............................. Broccoli, spears ............................................. Broccoli, chopped and cut .............................. Brussels sprouts ............................................ Carrots, diced ................................................ Carrots, other ................................................. Cauliflower ..................................................... Corn, cut ........................................................ Corn, cob ....................................................... Mixed vegetables ........................................... Okra ............................................................... Onion rings .................................................... Onions, other ................................................. Blackeye peas ............................................... Green peas .................................................... Peas and carrots mixed ................................. Spinach .......................................................... Squash, summer/zucchini .............................. Southern greens ............................................ Other .............................................................. Total frozen vegetables .................................. Frozen potatoes French fries .................................................... Other .............................................................. Total frozen potatoes .....................................
10,971 29,161
115,005 12,886 44,166 38,981 17,102 65,564 87,118 24,701
257,797 105,145
60,139 41,318 16,534 58,276 2,089
341,193 7,424
52,689 44,933 12,352
422,205
1,867,749
859,456 237,286
1,096,742
7,220
14,441 82,556 9,879
43,927 32,061 12,774
100,442 64,844 18,926
240,636 137,539
47,214 28,658 15,146 72,312 1,413
233,194 9,098
41,009 40,456 12,907
355,236
1,621,888
945,264 239,233
1,184,497
7,266
11,091 125,306 16,307 46,102 36,625 12,927 84,444 57,293 19,664
250,696 137,583
52,246 43,014 12,919 64,493 1,615
385,010 9,951
39,446 37,845 15,254
354,927
1,822,024
907,021 227,094
1,134,115
66 38
109 127 104 94 76
129 66 80 97
131
87 104 78
111 77
113 134 75 84
123 84
98
106 96
103
101 77
152 165 105 114 101 84 88
104 104 100
111 150 85 89
114 165 109 96 94
118 100
112
96 95
96
1,554,241
1,037,169

Cold Storage (August 2019) 7 USDA, National Agricultural Statistics Service
Frozen Red Meat and Commodities in Cold Storage – United States: July 31, 2019 with Comparisons
Commodity
Stocks in all warehouses July 31, 2019
as a percent of
Public warehouse
stocks
July 31, 2018
June 30, 2019
July 31, 2019
July 31, 2018
June 30, 2019
July 31, 2019
(1,000 pounds) (1,000 pounds) (1,000 pounds) (percent) (percent) (1,000 pounds)
Frozen red meat Beef Boneless .................................................... Beef cuts ................................................... Total beef .................................................. Pork Picnics, bone-in ......................................... Hams Bone-in .................................................. Boneless ................................................ Total hams ............................................. Bellies ........................................................ Loins Bone-in .................................................. Boneless ................................................ Total loins .............................................. Ribs ........................................................... Butts .......................................................... Trimmings .................................................. Other ......................................................... Variety meats ............................................. Unclassified ............................................... Total pork .................................................. Other red meat Veal ........................................................... Lamb and mutton ....................................... Total other red meat .................................. Total frozen red meat ..................................... Commodities Stored in coolers ............................................ Stored in freezers .......................................... Total Commodities .........................................
444,089 40,159
484,248
8,157
71,184 96,379
167,563 38,556
7,261
19,353 26,614 84,171 13,218 40,372 86,046 34,439 52,893
552,029
18,096 42,129 60,225
1,096,502
1,886,067 7,956,332
9,842,399
372,195 33,450
405,645
7,920
64,578 104,021 168,599 56,468
22,133 24,545 46,678
101,647 17,218 47,862 89,917 31,184 51,961
619,454
4,257 40,025 44,282
1,069,381
1,901,801 7,421,098
9,322,899
419,605 35,497
455,102
7,940
72,816 99,740
172,556 52,646
20,762 25,567 46,329 84,867 18,363 47,597 87,126 31,306 53,060
601,790
4,717 43,055 47,772
1,104,664
1,860,482 7,774,576
9,635,058
94 88 94
97
102 103 103 137
286 132 174 101 139 118 101 91
100 109
26 102 79
101
99 98
98
113 106 112
100
113 96
102 93
94
104 99 83
107 99 97
100 102 97
111 108 108
103
98 105
103
448,699
553,233
47,742
1,049,674
1,383,331 6,290,252
7,673,583

8 Cold Storage (August 2019) USDA, National Agricultural Statistics Service
Nuts and Dairy Products in Cold Storage – Regions: July 31, 2019 with Comparisons
Commodity
Stocks in all warehouses July 31, 2019
as a percent of
July 31, 2018
June 30, 2019
July 31, 2019
July 31, 2018
June 30, 2019
(1,000 pounds) (1,000 pounds) (1,000 pounds) (percent) (percent)
Nuts 1 Shelled Pecans South Atlantic .......................................... East South Central .................................. West South Central ................................. In-shell Pecans South Atlantic .......................................... East South Central .................................. West South Central ................................. Dairy products Natural cheese American, total New England ........................................... Middle Atlantic ......................................... East North Central ................................... West North Central .................................. South Atlantic .......................................... East South Central .................................. West South Central ................................. Mountain ................................................. Pacific ..................................................... Other New England ........................................... Middle Atlantic ......................................... East North Central ................................... West North Central .................................. South Atlantic .......................................... East South Central .................................. West South Central ................................. Mountain ................................................. Pacific .....................................................
15,824 1,195
48,360
31,986 57
57,340
66,662 68,320
341,762 144,755
710 15,491 10,196 60,944
114,502
651 19,003
380,344 47,940 27,133 17,239 1,850 4,130
59,159
16,653 1,047
51,079
40,823 1,409
82,157
71,180 77,502
342,193 110,969
288 12,838 5,519
56,622 108,803
826
15,284 372,576 46,029 39,112 24,536 2,580 2,344
65,718
16,771 803
50,816
34,469 1,409
62,438
69,688 74,628
344,149 119,968
275 9,813 5,858
47,069 104,439
697
14,799 369,374 45,208 39,604 29,007 1,639 2,575
58,020
106 67
105
108 2,472
109
105 109 101 83 39 63 57 77 91
107 78 97 94
146 168 89 62 98
101 77 99
84 100 76
98 96
101 108 95 76
106 83 96
84 97 99 98
101 118 64
110 88
1 New England and Middle Atlantic combined with South Atlantic. East North Central combined with East South Central. Pacific, Mountain, and West North Central combined with West South Central.

Cold Storage (August 2019) 9 USDA, National Agricultural Statistics Service
Frozen Poultry in Cold Storage – Regions: July 31, 2019 with Comparisons
Commodity
Stocks in all warehouses July 31, 2019
as a percent of
July 31, 2018
June 30, 2019
July 31, 2019
July 31, 2018
June 30, 2019
(1,000 pounds) (1,000 pounds) (1,000 pounds) (percent) (percent)
Frozen poultry Chicken 1 Broilers, fryers, and roasters South Atlantic ........................................... East South Central ................................... West South Central .................................. Pacific ...................................................... Hens, mature chickens South Atlantic ........................................... East South Central ................................... West South Central .................................. Pacific ...................................................... Breasts and breast meat South Atlantic ........................................... East South Central ................................... West South Central .................................. Pacific ...................................................... Drumsticks South Atlantic ........................................... East South Central ................................... West South Central .................................. Pacific ...................................................... Leg quarters South Atlantic ........................................... East South Central ................................... West South Central .................................. Pacific ...................................................... Legs South Atlantic ........................................... East South Central ................................... West South Central .................................. Pacific ...................................................... Thigh and thigh quarters South Atlantic ........................................... East South Central ................................... West South Central .................................. Pacific ...................................................... Thigh meat South Atlantic ........................................... East South Central ................................... West South Central .................................. Pacific ...................................................... Wings South Atlantic ........................................... East South Central ................................... West South Central .................................. Pacific ...................................................... Paws and feet South Atlantic ........................................... East South Central ................................... West South Central .................................. Pacific ...................................................... Other South Atlantic ........................................... East South Central ................................... West South Central .................................. Pacific ...................................................... Total chicken South Atlantic ........................................... East South Central ................................... West South Central .................................. Pacific ......................................................
8,351 1,737 3,234 3,057
2,207
605 3,004
494
50,561 34,177 69,451 16,283
11,264 6,240
16,950 2,049
42,448 12,446 25,239 1,421
9,312 2,874 1,649 1,692
4,957 1,435 2,046
744
14,521 2,182 3,383 3,509
37,880 9,588
36,183 5,328
21,491 6,723 5,237
122
162,413 57,105
138,399 37,658
365,405 135,112 304,775 72,357
10,165 1,442 6,296 3,603
2,868
117 4,192
76
64,726 29,118 72,090 12,560
14,134 9,160
11,807 1,559
24,029 9,168
20,207 618
7,858
591 1,294 1,544
4,695 1,014 2,267
750
30,709 2,739 4,317 2,070
22,712 8,351
27,548 4,041
16,141 5,021 3,845
601
134,446 45,853
174,295 35,578
332,483 112,574 328,158 63,000
9,422 1,539 6,368 3,227
3,855
111 4,324
445
64,202 32,441 68,110 12,031
16,835 10,279 13,893 1,503
29,476 9,837
24,173 829
8,994
702 1,375 1,508
4,319
792 1,584
542
31,482 2,792 4,105 2,117
22,933 8,212
29,738 4,121
18,807 5,342 2,943
501
136,168 48,291
161,077 39,118
346,493 120,338 317,690 65,942
113 89
197 106
175 18
144 90
127 95 98 74
149 165 82 73
69 79 96 58
97 24 83 89
87 55 77 73
217 128 121 60
61 86 82 77
88 79 56
411
84 85
116 104
95 89
104 91
93 107 101 90
134 95
103 586
99
111 94 96
119 112 118 96
123 107 120 134
114 119 106 98
92 78 70 72
103 102 95
102
101 98
108 102
117 106 77 83
101 105 92
110
104 107 97
105
See footnote(s) at end of table. --continued
10 Cold Storage (August 2019) USDA, National Agricultural Statistics Service
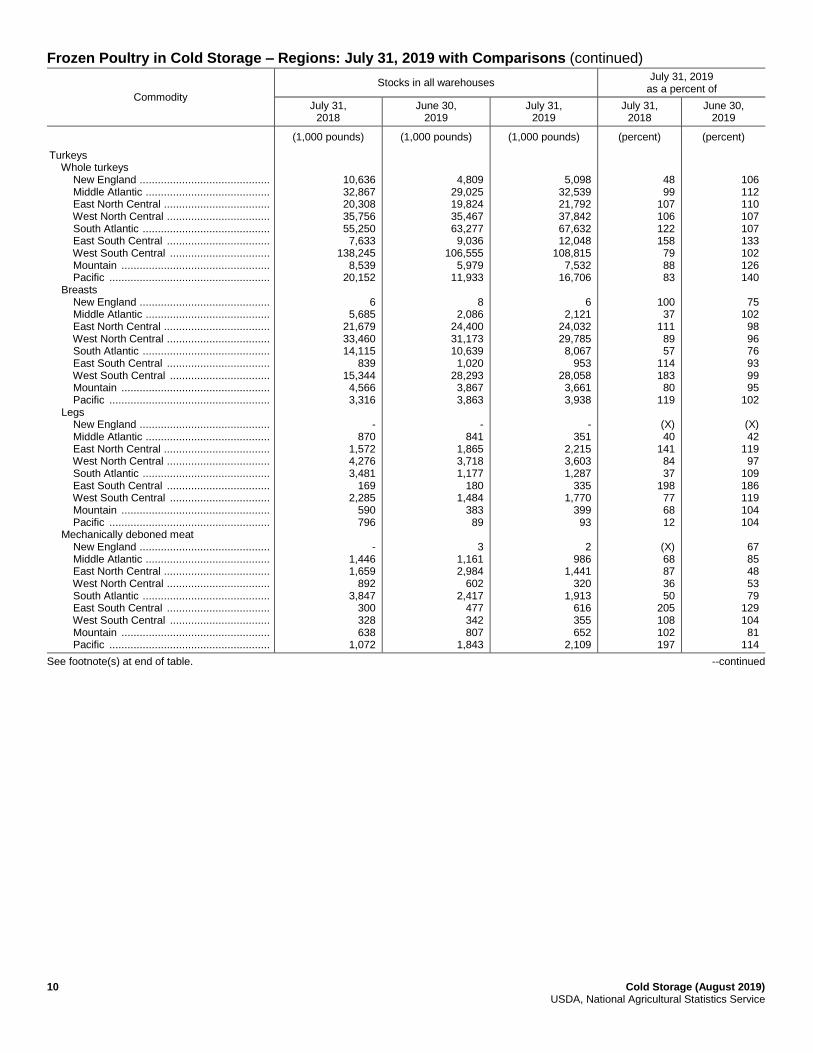
Frozen Poultry in Cold Storage – Regions: July 31, 2019 with Comparisons (continued)
Commodity
Stocks in all warehouses July 31, 2019
as a percent of
July 31, 2018
June 30, 2019
July 31, 2019
July 31, 2018
June 30, 2019
(1,000 pounds) (1,000 pounds) (1,000 pounds) (percent) (percent)
Turkeys Whole turkeys New England ........................................... Middle Atlantic ......................................... East North Central ................................... West North Central .................................. South Atlantic .......................................... East South Central .................................. West South Central ................................. Mountain ................................................. Pacific ..................................................... Breasts New England ........................................... Middle Atlantic ......................................... East North Central ................................... West North Central .................................. South Atlantic .......................................... East South Central .................................. West South Central ................................. Mountain ................................................. Pacific ..................................................... Legs New England ........................................... Middle Atlantic ......................................... East North Central ................................... West North Central .................................. South Atlantic .......................................... East South Central .................................. West South Central ................................. Mountain ................................................. Pacific ..................................................... Mechanically deboned meat New England ........................................... Middle Atlantic ......................................... East North Central ................................... West North Central .................................. South Atlantic .......................................... East South Central .................................. West South Central ................................. Mountain ................................................. Pacific .....................................................
10,636 32,867 20,308 35,756 55,250 7,633
138,245 8,539
20,152
6 5,685
21,679 33,460 14,115
839 15,344 4,566 3,316
-
870 1,572 4,276 3,481
169 2,285
590 796
-
1,446 1,659
892 3,847
300 328 638
1,072
4,809 29,025 19,824 35,467 63,277 9,036
106,555 5,979
11,933
8 2,086
24,400 31,173 10,639 1,020
28,293 3,867 3,863
-
841 1,865 3,718 1,177
180 1,484
383 89
3
1,161 2,984
602 2,417
477 342 807
1,843
5,098 32,539 21,792 37,842 67,632 12,048
108,815 7,532
16,706
6 2,121
24,032 29,785 8,067
953 28,058 3,661 3,938
-
351 2,215 3,603 1,287
335 1,770
399 93
2
986 1,441
320 1,913
616 355 652
2,109
48 99
107 106 122 158 79 88 83
100 37
111 89 57
114 183 80
119
(X) 40
141 84 37
198 77 68 12
(X) 68 87 36 50
205 108 102 197
106 112 110 107 107 133 102 126 140
75
102 98 96 76 93 99 95
102
(X) 42
119 97
109 186 119 104 104
67 85 48 53 79
129 104 81
114
See footnote(s) at end of table. --continued

Cold Storage (August 2019) 11 USDA, National Agricultural Statistics Service
Frozen Poultry in Cold Storage – Regions: July 31, 2019 with Comparisons (continued)
Commodity
Stocks in all warehouses July 31, 2019
as a percent of
July 31, 2018
June 30, 2019
July 31, 2019
July 31, 2018
June 30, 2019
(1,000 pounds) (1,000 pounds) (1,000 pounds) (percent) (percent)
Other New England ........................................... Middle Atlantic ......................................... East North Central ................................... West North Central .................................. South Atlantic ........................................... East South Central ................................... West South Central .................................. Mountain .................................................. Pacific ...................................................... Unclassified New England ........................................... Middle Atlantic ......................................... East North Central ................................... West North Central .................................. South Atlantic ........................................... East South Central ................................... West South Central .................................. Mountain .................................................. Pacific ...................................................... Total turkey New England ........................................... Middle Atlantic ......................................... East North Central ................................... West North Central .................................. South Atlantic ........................................... East South Central ................................... West South Central .................................. Mountain .................................................. Pacific ...................................................... Ducks New England ............................................... Middle Atlantic ............................................. East North Central ....................................... West North Central ...................................... South Atlantic .............................................. East South Central ....................................... West South Central ...................................... Mountain ...................................................... Pacific ..........................................................
3
3,750 7,136 4,264
12,310 444
3,443 651
2,365
5 6,900
16,177 16,346 49,093
337 11,412 2,245 5,429
10,650 51,518 68,531 94,994
138,096 9,722
171,057 17,229 33,130
226 1,399
337 254 60
- -
27 1,982
36
2,831 6,255 5,221 6,367
831 2,472
606 1,555
6
4,795 14,232 17,312 47,879
226 8,479 3,473 4,511
4,862
40,739 69,560 93,493
131,756 11,770
147,625 15,115 23,794
62 1,949
266 133 121
- 1
11 1,509
35
2,885 4,938 5,159 6,532
935 2,703
591 1,768
6
4,271 14,454 14,957 49,102
148 10,990 3,150 5,322
5,147
43,153 68,872 91,666
134,533 15,035
152,691 15,985 29,936
59 1,864
275 158 155
- - 7
1,302
1,167
77 69
121 53
211 79 91 75
120 62 89 92
100 44 96
140 98
48 84
100 96 97
155 89 93 90
26 133 82 62
258 (X) (X) 26 66
97
102 79 99
103 113 109 98
114
100 89
102 86
103 65
130 91
118
106 106 99 98
102 128 103 106 126
95 96
103 119 128 (X) (X) 64 86
- Represents zero. (X) Not applicable. 1 New England and Middle Atlantic combined with South Atlantic. East North Central combined with East South Central. West North Central
combined with West South Central. Mountain combined with Pacific.

12 Cold Storage (August 2019) USDA, National Agricultural Statistics Service
Frozen Fruit and Frozen Juice Concentrate in Cold Storage – Regions: July 31, 2019 with Comparisons
Commodity
Stocks in all warehouses July 31, 2019
as a percent of
July 31, 2018
June 30, 2019
July 31, 2019
July 31, 2018
June 30, 2019
(1,000 pounds) (1,000 pounds) (1,000 pounds) (percent) (percent)
Frozen fruit Apples New England ............................................... Middle Atlantic ............................................. East North Central ....................................... West North Central ...................................... South Atlantic .............................................. East South Central ...................................... West South Central ..................................... Mountain ..................................................... Pacific ......................................................... Blueberries New England ............................................... Middle Atlantic ............................................. East North Central ....................................... West North Central ...................................... South Atlantic .............................................. East South Central ...................................... West South Central ..................................... Mountain ..................................................... Pacific ......................................................... Cherries, tart (ripe tart pitted) New England ............................................... Middle Atlantic ............................................. East North Central ....................................... West North Central ...................................... South Atlantic .............................................. East South Central ...................................... West South Central ..................................... Mountain ..................................................... Pacific ......................................................... Cherries, sweet New England ............................................... Middle Atlantic ............................................. East North Central ....................................... West North Central ...................................... South Atlantic .............................................. East South Central ...................................... West South Central ..................................... Mountain ..................................................... Pacific ......................................................... Peaches New England ............................................... Middle Atlantic ............................................. East North Central ....................................... West North Central ...................................... South Atlantic .............................................. East South Central ...................................... West South Central ..................................... Mountain ..................................................... Pacific ......................................................... Raspberries, red New England ............................................... Middle Atlantic ............................................. East North Central ....................................... West North Central ...................................... South Atlantic .............................................. East South Central ...................................... West South Central ..................................... Mountain ..................................................... Pacific .........................................................
188 1,503
20,199 176 124 27
1,074 33
7,285
14,420 5,594
50,653 958
6,418 135
1,273 34
95,678
- 7,904
128,900 159 70 11
880 20,694 9,106
-
1,126 10,112
23 215 489 414
- 4,562
51
1,040 6,193
542 2,065
315 649 46
26,721
632 1,930 2,435
986 347
2,454 1,688 2,478
100,507
128 2,282
18,720 118 172 96
1,292 88
5,226
7,362 2,508
30,503 2,585 7,152
7 710 199
42,396
- 6,238
70,717 173 136
6 660
3,495 2,690
3
1,086 3,721
66 295 273 500
- 4,173
27
1,080 8,159
491 1,411
720 580 17
25,558
127 2,020 2,242 1,462
268 874
1,197 70
31,338
119 1,695
17,466 124 376 128
1,011 76
5,270
9,836 2,920
43,384 1,511 8,594
8 842 358
107,316
- 6,453
95,280 276 232
8 622
6,006 7,400
4
935 7,166
60 268 271 508
- 4,845
33
1,002 7,307
594 1,661
124 513 18
31,724
266 2,331 2,306 1,749
268 988
1,162 125
78,796
63 113 86 70
303 474 94
230 72
68 52 86
158 134
6 66
1,053 112
(X) 82 74
174 331 73 71 29 81
(X) 83 71
261 125 55
123 (X)
106
65 96
118 110 80 39 79 39
119
42 121 95
177 77 40 69 5
78
93 74 93
105 219 133 78 86
101
134 116 142 58
120 114 119 180 253
(X)
103 135 160 171 133 94
172 275
133 86
193 91 91 99
102 (X)
116
122 93 90
121 118 17 88
106 124
209 115 103 120 100 113 97
179 251
See footnote(s) at end of table. --continued

Cold Storage (August 2019) 13 USDA, National Agricultural Statistics Service
Frozen Fruit and Frozen Juice Concentrate in Cold Storage – Regions: July 31, 2019 with Comparisons (continued)
Commodity
Stocks in all warehouses July 31, 2019
as a percent of
July 31, 2018
June 30, 2019
July 31, 2019
July 31, 2018
June 30, 2019
(1,000 pounds) (1,000 pounds) (1,000 pounds) (percent) (percent)
Strawberries, total New England ............................................... Middle Atlantic ............................................. East North Central ....................................... West North Central ...................................... South Atlantic .............................................. East South Central ....................................... West South Central ...................................... Mountain ...................................................... Pacific .......................................................... Other New England ............................................... Middle Atlantic ............................................. East North Central ....................................... West North Central ...................................... South Atlantic .............................................. East South Central ....................................... West South Central ...................................... Mountain ...................................................... Pacific .......................................................... Frozen juice concentrate Orange 1 New England ............................................... East North Central ....................................... West North Central ...................................... South Atlantic .............................................. East South Central ....................................... West South Central ...................................... Mountain ...................................................... Pacific .......................................................... Other New England ............................................... Middle Atlantic ............................................. East North Central ....................................... West North Central ...................................... South Atlantic .............................................. East South Central ....................................... West South Central ...................................... Mountain ...................................................... Pacific .......................................................... Total frozen juice concentrate 2 New England ............................................... Middle Atlantic ............................................. East North Central ....................................... West North Central ...................................... South Atlantic .............................................. East South Central ....................................... West South Central ...................................... Mountain ...................................................... Pacific ..........................................................
152
7,972 16,129 6,119
10,700 8,342
29,184 811
293,787
55,202 19,282
147,223 10,523 8,487
268 16,696
76 137,475
- 2,765
310 665,774
11 9,011 5,691 7,548
4,297
50,788 54,755 3,318
34,050 533
9,219 2,900
158,649
4,297 50,788 57,520 3,628
699,824 544
18,230 8,591
166,197
251
7,939 14,724 5,946
11,446 2,278
28,563 310
198,033
38,934 13,247
153,237 9,234 5,106
460 10,194
122 127,009
- 2,914
344 818,630
16 16,612 1,193
20,048
16,541 42,504 36,145 3,504
43,092 481
23,030 7,532
142,719
16,541 42,504 39,059 3,848
861,722 497
39,642 8,725
162,767
247
7,714 14,763 4,999
12,680 2,235
24,940 276
204,249
40,148 12,049
121,240 9,798 5,018
539 16,809
122 130,119
- 2,857
330 786,303
16 11,539 1,144
19,855
15,067 43,339 34,298 3,549
45,856 478
25,127 7,562
144,386
15,067 43,339 37,155 3,879
832,159 494
36,666 8,706
164,241
163 97 92 82
119 27 85 34 70
73 62 82 93 59
201 101 161 95
(X) 103 106 118 145 128 20
263
351 85 63
107 135 90
273 261 91
351 85 65
107 119 91
201 101 99
98 97
100 84
111 98 87 89
103
103 91 79
106 98
117 165 100 102
(X) 98 96 96
100 69 96 99
91
102 95
101 106 99
109 100 101
91
102 95
101 97 99 92
100 101
- Represents zero. (X) Not applicable. 1 Middle Atlantic combined with South Atlantic. 2 Middle Atlantic orange juice combined with South Atlantic.

14 Cold Storage (August 2019) USDA, National Agricultural Statistics Service
Frozen Vegetables in Cold Storage – Regions: July 31, 2019 with Comparisons
Commodity
Stocks in all warehouses July 31, 2019
as a percent of
July 31, 2018
June 30, 2019
July 31, 2019
July 31, 2018
June 30, 2019
(1,000 pounds) (1,000 pounds) (1,000 pounds) (percent) (percent)
Frozen vegetables 1 Asparagus Middle Atlantic ............................................. East North Central ....................................... West North Central ...................................... South Atlantic .............................................. West South Central ..................................... Mountain ..................................................... Pacific ......................................................... Lima beans Middle Atlantic ............................................. East North Central ....................................... West North Central ...................................... South Atlantic .............................................. West South Central ..................................... Mountain ..................................................... Pacific ......................................................... Green beans, regular cut Middle Atlantic ............................................. East North Central ....................................... West North Central ...................................... South Atlantic .............................................. West South Central ..................................... Mountain ..................................................... Pacific ......................................................... Green beans, french style Middle Atlantic ............................................. East North Central ....................................... West North Central ...................................... South Atlantic .............................................. West South Central ..................................... Mountain ..................................................... Pacific ......................................................... Broccoli, spears Middle Atlantic ............................................. East North Central ....................................... West North Central ...................................... South Atlantic .............................................. West South Central ..................................... Mountain ..................................................... Pacific ......................................................... Broccoli, chopped and cut Middle Atlantic ............................................. East North Central ....................................... West North Central ...................................... South Atlantic .............................................. West South Central ..................................... Mountain ..................................................... Pacific .........................................................
270 7,488
122 660 352
1 2,078
2,859 2,619
107 7,645
613 79
15,239
17,054 35,448 10,964 4,026 2,374
156 44,983
1,880 2,924
200 226 54 1
7,601
11,372 10,201
807 2,617 8,656
12 10,501
5,234 7,475
188 1,860 8,274
292 15,658
323 4,081
124 285 476
- 1,931
1,733 1,006
664 3,396
191 -
7,451
10,384 27,697 4,676 2,287 1,155
98 36,259
1,621 2,171
515 566 41
- 4,965
12,532 13,842 2,469 3,105 6,021
- 5,958
2,725 5,972
410 1,730 9,081
39 12,104
332 4,068
100 260 445
- 2,061
1,750
767 337
2,390 188
- 5,659
16,110 36,791 10,878 3,154 1,011
106 57,256
1,735 2,559
419 736 21
- 10,837
12,263 14,199 2,301 3,216 7,716
- 6,407
2,128 6,050
459 1,634 7,642
53 18,659
123 54 82 39
126 (X) 99
61 29
315 31 31 (X) 37
94
104 99 78 43 68
127
92 88
210 326 39 (X)
143
108 139 285 123 89 (X) 61
41 81
244 88 92 18
119
103 100 81 91 93 (X)
107
101 76 51 70 98 (X) 76
155 133 233 138 88
108 158
107 118 81
130 51 (X)
218
98 103 93
104 128 (X)
108
78 101 112 94 84
136 154
See footnote(s) at end of table. --continued

Cold Storage (August 2019) 15 USDA, National Agricultural Statistics Service
Frozen Vegetables in Cold Storage – Regions: July 31, 2019 with Comparisons (continued)
Commodity
Stocks in all warehouses July 31, 2019
as a percent of
July 31, 2018
June 30, 2019
July 31, 2019
July 31, 2018
June 30, 2019
(1,000 pounds) (1,000 pounds) (1,000 pounds) (percent) (percent)
Brussels sprouts Middle Atlantic ............................................. East North Central ....................................... West North Central ...................................... South Atlantic .............................................. West South Central ...................................... Mountain ...................................................... Pacific .......................................................... Carrots, diced Middle Atlantic ............................................. East North Central ....................................... West North Central ...................................... South Atlantic .............................................. West South Central ...................................... Mountain ...................................................... Pacific .......................................................... Carrots, other Middle Atlantic ............................................. East North Central ....................................... West North Central ...................................... South Atlantic .............................................. West South Central ...................................... Mountain ...................................................... Pacific .......................................................... Cauliflower Middle Atlantic ............................................. East North Central ....................................... West North Central ...................................... South Atlantic .............................................. West South Central ...................................... Mountain ...................................................... Pacific .......................................................... Corn, cut Middle Atlantic ............................................. East North Central ....................................... West North Central ...................................... South Atlantic .............................................. West South Central ...................................... Mountain ...................................................... Pacific .......................................................... Corn, cob Middle Atlantic ............................................. East North Central ....................................... West North Central ...................................... South Atlantic .............................................. West South Central ...................................... Mountain ...................................................... Pacific ..........................................................
2,110 2,002
578 3,750
905 2,439 5,318
11,503 20,647 1,968
677 2,316
- 28,453
7,077
14,131 4,168 1,013 4,597
49 56,083
3,274 6,395
255 365
3,403 323
10,686
20,496 28,944 18,694 13,225 1,989
55 174,394
2,140 8,501
19,233 1,717 1,552 1,292
70,710
1,610 1,287
523 2,613 1,020
- 5,721
9,130
29,394 6,974
222 1,833
- 52,889
4,748 9,786 3,570 1,142 5,100
267 40,231
2,255 5,831
465 965
3,842 102
5,466
11,489 15,285 22,691 3,678 2,721
23 184,749
3,068 4,144
19,878 2,283 1,890 2,265
104,011
1,854 1,836
495 2,600
951 -
5,191
6,724 26,893 3,595
168 1,750
- 45,314
4,715 7,736 2,755 1,084 4,911
226 35,866
2,409 6,584
510 653
3,849 60
5,599
10,585 15,980 18,465 10,628 2,234
23 192,781
2,774 5,137
17,891 2,300 1,734 2,430
105,317
88 92 86 69
105 (X) 98
58
130 183 25 76 (X)
159
67 55 66
107 107 461 64
74
103 200 179 113 19 52
52 55 99 80
112 42
111
130 60 93
134 112 188 149
115 143 95
100 93 (X) 91
74 91 52 76 95 (X) 86
99 79 77 95 96 85 89
107 113 110 68
100 59
102
92 105 81
289 82
100 104
90
124 90
101 92
107 101
See footnote(s) at end of table. --continued

16 Cold Storage (August 2019) USDA, National Agricultural Statistics Service
Frozen Vegetables in Cold Storage – Regions: July 31, 2019 with Comparisons (continued)
Commodity
Stocks in all warehouses July 31, 2019
as a percent of
July 31, 2018
June 30, 2019
July 31, 2019
July 31, 2018
June 30, 2019
(1,000 pounds) (1,000 pounds) (1,000 pounds) (percent) (percent)
Mixed vegetables Middle Atlantic ............................................. East North Central ....................................... West North Central ...................................... South Atlantic .............................................. West South Central ..................................... Mountain ..................................................... Pacific ......................................................... Okra Middle Atlantic ............................................. East North Central ....................................... West North Central ...................................... South Atlantic .............................................. West South Central ..................................... Mountain ..................................................... Pacific ......................................................... Onion rings Middle Atlantic ............................................. East North Central ....................................... West North Central ...................................... South Atlantic .............................................. West South Central ..................................... Mountain ..................................................... Pacific ......................................................... Onions, other Middle Atlantic ............................................. East North Central ....................................... West North Central ...................................... South Atlantic .............................................. West South Central ..................................... Mountain ..................................................... Pacific ......................................................... Blackeye peas Middle Atlantic ............................................. East North Central ....................................... West North Central ...................................... South Atlantic .............................................. West South Central ..................................... Mountain ..................................................... Pacific ......................................................... Green peas Middle Atlantic ............................................. East North Central ....................................... West North Central ...................................... South Atlantic .............................................. West South Central ..................................... Mountain ..................................................... Pacific .........................................................
6,127
22,019 268
1,648 8,540
819 20,718
2,445
342 185
8,858 26,111
1 3,376
463
5,274 587
3,248 1,048 5,111
803
7,074 3,700 1,208
471 2,398 8,612
34,813
760 41
- 373 218
- 697
23,383 47,996 50,485 14,864 1,404
87 202,974
5,134
10,343 923
1,576 6,950
507 21,781
1,968
125 237
6,695 18,127
- 1,506
426
6,479 558
2,710 1,768 2,389
816
4,766 2,725 1,203 1,092 2,105 8,735
51,686
426 11 21
352 51
- 552
9,499
13,606 19,524 16,310 1,378
13 172,864
5,427
11,306 1,091 3,341 6,431
653 23,997
2,301
175 257
8,453 29,280
597 1,951
375
6,270 480
1,737 1,370 1,949
738
4,362 2,416 1,106 1,258 2,285 8,056
45,010
505 9
21 398 66
- 616
26,191 18,686 55,554 16,874 1,389
28 266,288
89 51
407 203 75 80
116
94 51
139 95
112 59,700
58
81 119 82 53
131 38 92
62 65 92
267 95 94
129
66 22 (X)
107 30 (X) 88
112 39
110 114 99 32
131
106 109 118 212 93
129 110
117 140 108 126 162 (X)
130
88 97 86 64 77 82 90
92 89 92
115 109 92 87
119 82
100 113 129 (X)
112
276 137 285 103 101 215 154
See footnote(s) at end of table. --continued

Cold Storage (August 2019) 17 USDA, National Agricultural Statistics Service
Frozen Vegetables in Cold Storage – Regions: July 31, 2019 with Comparisons (continued)
Commodity
Stocks in all warehouses July 31, 2019
as a percent of
July 31, 2018
June 30, 2019
July 31, 2019
July 31, 2018
June 30, 2019
(1,000 pounds) (1,000 pounds) (1,000 pounds) (percent) (percent)
Peas and carrots mixed Middle Atlantic ............................................. East North Central ....................................... West North Central ...................................... South Atlantic .............................................. West South Central ...................................... Mountain ...................................................... Pacific .......................................................... Spinach Middle Atlantic ............................................. East North Central ....................................... West North Central ...................................... South Atlantic .............................................. West South Central ...................................... Mountain ...................................................... Pacific .......................................................... Squash, summer/zucchini Middle Atlantic ............................................. East North Central ....................................... West North Central ...................................... South Atlantic .............................................. West South Central ...................................... Mountain ...................................................... Pacific .......................................................... Southern greens Middle Atlantic ............................................. East North Central ....................................... West North Central ...................................... South Atlantic .............................................. West South Central ...................................... Mountain ...................................................... Pacific .......................................................... Other Middle Atlantic ............................................. East North Central ....................................... West North Central ...................................... South Atlantic .............................................. West South Central ...................................... Mountain ...................................................... Pacific .......................................................... Total frozen vegetables Middle Atlantic ............................................. East North Central ....................................... West North Central ...................................... South Atlantic .............................................. West South Central ...................................... Mountain ...................................................... Pacific ..........................................................
607 905 134 535 210
- 5,033
12,574 3,958 1,305 8,030 8,809 2,913
15,100
3,865 10,881
145 2,123 7,415
45 20,459
4,384
200 6
2,546 4,490
3 723
67,534 67,368 20,966 14,172 19,424 18,190
214,551
214,485 309,459 132,573 94,649
115,152 40,480
960,951
496
1,086 86
574 463
- 6,393
11,308 2,666 1,253 9,111 6,298
847 9,526
2,718
15,210 278
2,200 5,608
71 14,371
3,610
42 212
1,850 6,526
91 576
53,388 55,216 20,149 12,496 16,393 17,828
179,766
155,357 228,005 107,403 77,238 99,038 33,275
921,572
891
1,063 185 533 547
- 6,732
10,145 2,554 1,241 8,705 6,051
809 9,941
2,426
13,658 274
1,742 5,074
79 14,592
4,179
47 81
2,096 7,933
400 518
54,101 53,772 22,774 13,675 16,813 17,572
176,220
174,282 238,556 141,269 87,635
109,691 33,041
1,037,550
147 117 138 100 260 (X)
134
81 65 95
108 69 28 66
63
126 189 82 68
176 71
95 24
1,350 82
177 13,333
72
80 80
109 96 87 97 82
81 77
107 93 95 82
108
180 98
215 93
118 (X)
105
90 96 99 96 96 96
104
89 90 99 79 90
111 102
116 112 38
113 122 440 90
101 97
113 109 103 99 98
112 105 132 113 111 99
113
- Represents zero. (X) Not applicable. 1 New England combined with Middle Atlantic. East South Central combined with South Atlantic.

18 Cold Storage (August 2019) USDA, National Agricultural Statistics Service
Frozen Potatoes in Cold Storage – Regions: July 31, 2019 with Comparisons
Commodity
Stocks in all warehouses July 31, 2019
as a percent of
July 31, 2018
June 30, 2019
July 31, 2019
July 31, 2018
June 30, 2019
(1,000 pounds) (1,000 pounds) (1,000 pounds) (percent) (percent)
Frozen potatoes French fries New England ............................................... Middle Atlantic ............................................. East North Central ....................................... West North Central ...................................... South Atlantic .............................................. East South Central ...................................... West South Central ..................................... Mountain ..................................................... Pacific ......................................................... Other New England ............................................... Middle Atlantic ............................................. East North Central ....................................... West North Central ...................................... South Atlantic .............................................. East South Central ...................................... West South Central ..................................... Mountain ..................................................... Pacific ......................................................... Total frozen potatoes New England ............................................... Middle Atlantic ............................................. East North Central ....................................... West North Central ...................................... South Atlantic .............................................. East South Central ...................................... West South Central ..................................... Mountain ..................................................... Pacific .........................................................
18,372 32,581 67,928 89,074 58,497
670 32,072
164,522 395,740
14,915 8,886
39,523 20,596 14,056
426 17,150 66,020 55,714
33,287 41,467
107,451 109,670 72,553 1,096
49,222 230,542 451,454
17,716 35,727 82,308 95,353 75,363 1,072
36,412 163,145 438,168
14,565 14,724 42,571 19,317 13,781
743 17,727 63,631 52,174
32,281 50,451
124,879 114,670 89,144 1,815
54,139 226,776 490,342
17,725 39,495 67,762 94,607 79,039
900 37,754
157,048 412,691
14,372 10,743 36,034 19,853 14,148
643 19,564 62,659 49,078
32,097 50,238
103,796 114,460 93,187 1,543
57,318 219,707 461,769
96 121 100 106 135 134 118 95
104
96 121 91 96
101 151 114 95 88
96
121 97
104 128 141 116 95
102
100 111 82 99
105 84
104 96 94
99 73 85
103 103 87
110 98 94
99
100 83
100 105 85
106 97 94

Cold Storage (August 2019) 19 USDA, National Agricultural Statistics Service
Frozen Red Meat in Cold Storage – Regions: July 31, 2019 with Comparisons
Commodity
Stocks in all warehouses July 31, 2019
as a percent of
July 31, 2018
June 30, 2019
July 31, 2019
July 31, 2018
June 30, 2019
(1,000 pounds) (1,000 pounds) (1,000 pounds) (percent) (percent)
Frozen red meat Beef Boneless New England ........................................... Middle Atlantic ......................................... East North Central ................................... West North Central .................................. South Atlantic ........................................... East South Central ................................... West South Central .................................. Mountain .................................................. Pacific ...................................................... Beef cuts New England ........................................... Middle Atlantic ......................................... East North Central ................................... West North Central .................................. South Atlantic ........................................... East South Central ................................... West South Central .................................. Mountain .................................................. Pacific ...................................................... Total beef New England ........................................... Middle Atlantic ......................................... East North Central ................................... West North Central .................................. South Atlantic ........................................... East South Central ................................... West South Central .................................. Mountain .................................................. Pacific ...................................................... Other meat 1 Veal Middle Atlantic ......................................... East North Central ................................... West South Central .................................. Pacific ...................................................... Lamb and mutton Middle Atlantic ......................................... East North Central ................................... West South Central .................................. Pacific ...................................................... Total other meat Middle Atlantic ......................................... East North Central ................................... West South Central .................................. Pacific ......................................................
110 161,774 47,267 91,990 15,071 1,220
51,420 15,016 60,221
166 855
9,313 10,524 2,261
511 1,263 3,458
11,808
276 162,629 56,580
102,514 17,332 1,731
52,683 18,474 72,029
12,618 993
3,905 580
18,141 3,962 5,151
14,875
30,759 4,955 9,056
15,455
283 147,948 36,207 82,862 11,934 1,321
26,666 12,011 52,963
528
1,870 7,956 5,964 1,573
396 2,090 3,970 9,103
811
149,818 44,163 88,826 13,507 1,717
28,756 15,981 62,066
3,332 92
294 539
18,242 2,708 3,187
15,888
21,574 2,800 3,481
16,427
282 185,295 39,442 94,004 9,221 1,615
28,984 11,665 49,097
673
1,858 7,709 7,871 1,460
517 2,131 3,553 9,725
955
187,153 47,151
101,875 10,681 2,132
31,115 15,218 58,822
3,872 120 182 543
19,334 2,669 3,063
17,989
23,206 2,789 3,245
18,532
256 115 83
102 61
132 56 78 82
405 217 83 75 65
101 169 103 82
346 115 83 99 62
123 59 82 82
31 12 5
94
107 67 59
121
75 56 36
120
100 125 109 113 77
122 109 97 93
127 99 97
132 93
131 102 89
107
118 125 107 115 79
124 108 95 95
116 130 62
101
106 99 96
113
108 100 93
113
1 New England and South Atlantic combined with Middle Atlantic. East South Central combined with East North Central. West North Central combined with West South Central. Mountain combined with Pacific.
20 Cold Storage (August 2019) USDA, National Agricultural Statistics Service
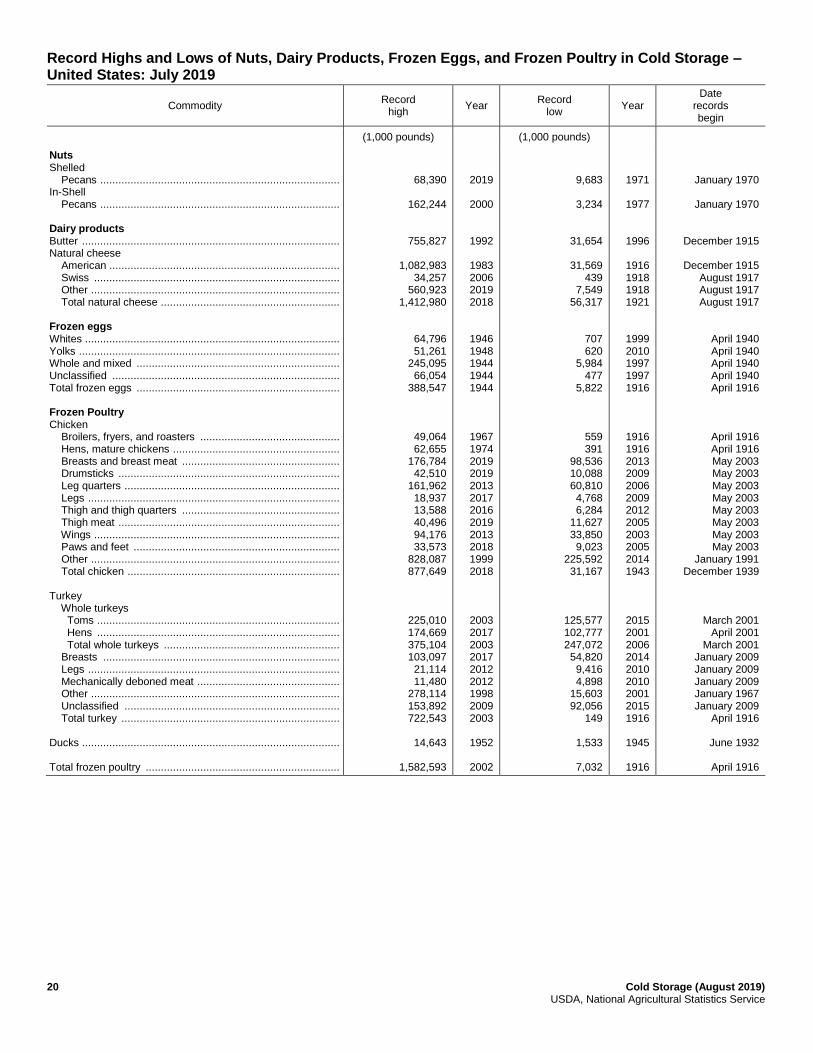
Record Highs and Lows of Nuts, Dairy Products, Frozen Eggs, and Frozen Poultry in Cold Storage – United States: July 2019
Commodity Record
high Year
Record low
Year Date
records begin
(1,000 pounds) (1,000 pounds)
Nuts Shelled Pecans ............................................................................... In-Shell Pecans ............................................................................... Dairy products Butter ..................................................................................... Natural cheese American ............................................................................ Swiss ................................................................................. Other .................................................................................. Total natural cheese ........................................................... Frozen eggs Whites .................................................................................... Yolks ...................................................................................... Whole and mixed ................................................................... Unclassified ........................................................................... Total frozen eggs ................................................................... Frozen Poultry Chicken Broilers, fryers, and roasters .............................................. Hens, mature chickens ....................................................... Breasts and breast meat .................................................... Drumsticks ......................................................................... Leg quarters ....................................................................... Legs ................................................................................... Thigh and thigh quarters .................................................... Thigh meat ......................................................................... Wings ................................................................................. Paws and feet .................................................................... Other .................................................................................. Total chicken ...................................................................... Turkey Whole turkeys Toms ................................................................................ Hens ................................................................................ Total whole turkeys .......................................................... Breasts .............................................................................. Legs ................................................................................... Mechanically deboned meat ............................................... Other .................................................................................. Unclassified ....................................................................... Total turkey ........................................................................ Ducks ..................................................................................... Total frozen poultry ................................................................
68,390
162,244
755,827
1,082,983 34,257
560,923 1,412,980
64,796 51,261
245,095 66,054
388,547
49,064 62,655
176,784 42,510
161,962 18,937 13,588 40,496 94,176 33,573
828,087 877,649
225,010 174,669 375,104 103,097 21,114 11,480
278,114 153,892 722,543
14,643
1,582,593
2019
2000
1992
1983 2006 2019 2018
1946 1948 1944 1944 1944
1967 1974 2019 2019 2013 2017 2016 2019 2013 2018 1999 2018
2003 2017 2003 2017 2012 2012 1998 2009 2003
1952
2002
9,683
3,234
31,654
31,569 439
7,549 56,317
707 620
5,984 477
5,822
559 391
98,536 10,088 60,810 4,768 6,284
11,627 33,850 9,023
225,592 31,167
125,577 102,777 247,072 54,820 9,416 4,898
15,603 92,056
149
1,533
7,032
1971
1977
1996
1916 1918 1918 1921
1999 2010 1997 1997 1916
1916 1916 2013 2009 2006 2009 2012 2005 2003 2005 2014 1943
2015 2001 2006 2014 2010 2010 2001 2015 1916
1945
1916
January 1970
January 1970
December 1915
December 1915 August 1917 August 1917 August 1917
April 1940 April 1940 April 1940 April 1940 April 1916
April 1916 April 1916 May 2003 May 2003 May 2003 May 2003 May 2003 May 2003 May 2003 May 2003
January 1991 December 1939
March 2001 April 2001
March 2001 January 2009 January 2009 January 2009 January 1967 January 2009
April 1916
June 1932
April 1916

Cold Storage (August 2019) 21 USDA, National Agricultural Statistics Service
Record Highs and Lows of Frozen Fruit and Frozen Juice Concentrate in Cold Storage – United States: July 2019
Commodity Record
high Year
Record low
Year Date
records begin
(1,000 pounds) (1,000 pounds)
Frozen fruit Apples ................................................................................... Apricots ................................................................................. Blackberries Individual quick frozen ....................................................... Pails and tubs .................................................................... Barrels, 400 lbs net ............................................................ Concentrate ....................................................................... Total blackberries .............................................................. Blueberries ............................................................................ Boysenberries ........................................................................ Cherries, tart (ripe tart pitted) ................................................. Cherries, tart (juice stock) ...................................................... Cherries, sweet ...................................................................... Grapes .................................................................................. Peaches ................................................................................ Raspberries, black ................................................................. Raspberries, red Individual quick frozen ....................................................... Pails and tubs .................................................................... Barrels, 400 lbs net ............................................................ Concentrate ....................................................................... Total red raspberries .......................................................... Strawberries Individual quick frozen and poly ......................................... Pails and tubs .................................................................... Barrels and drums ............................................................. Juice stock ......................................................................... Total strawberries .............................................................. Other ..................................................................................... Total frozen fruit ..................................................................... Frozen juice concentrate Orange .................................................................................. Other ..................................................................................... Total frozen juice concentrate ................................................
80,495 32,035
31,684 7,459
13,696 1,762
43,885 260,675
22,083
215,247 10,606 23,994 13,732 62,290 12,113
55,768 28,194 46,228 3,973
113,457
296,726 163,191 123,168 40,571
501,958 502,270
1,615,087
2,249,040 548,628
2,700,781
1995 1946
2016 1992 2013 1992 2016 2016
1959 1987 1990 2015 1951 2016 1959
2018 1995 2018 2016 2018
2002 2007 2013 2009 2000 2017
2016
1998 1995
1998
8,107 3,363
7,765 1,424 3,597
49 2,004 1,617
1,044
49,999 718
8,881 733
3,220 814
6,827 8,206
16,303 435
20,389
109,289 82,233 28,117 10,475 32,640 26,064
18,533
94,230 11,766
11,766
1949 1953
1992 2017 2008 2007 1939 1945
2018 1967 1995 2003 1998 1944 2011
1992 2019 2008 2003 1972
2019 2002 2002 2018 1944 1964
1923
1950 1944
1944
June 1944 June 1945
June 1992 June 1992 June 1992 June 1992 June 1938 June 1938
January 1959 January 1967 January 1990 January 1978
June 1944 June 1944
January 1959
June 1992 June 1992 June 1992 June 1992
January 1959
January 2002 January 2002 January 2002 January 2002
June 1938 June 1938
June 1923
September 1949 June 1944
June 1944

22 Cold Storage (August 2019) USDA, National Agricultural Statistics Service
Record Highs and Lows of Frozen Vegetables and Frozen Potatoes in Cold Storage – United States: July 2019
Commodity Record
high Year
Record low
Year Date
records begin
(1,000 pounds) (1,000 pounds)
Frozen Vegetables Asparagus .............................................................................. Lima beans ............................................................................ Green beans, regular cut ....................................................... Green beans, french style ...................................................... Broccoli, spears ..................................................................... Broccoli, chopped and cut ...................................................... Brussels sprouts .................................................................... Carrots, diced ........................................................................ Carrots, other ......................................................................... Cauliflower ............................................................................. Corn, cut ................................................................................ Corn, cob ............................................................................... Mixed vegetables ................................................................... Okra ....................................................................................... Onion rings ............................................................................ Onions, other ......................................................................... Blackeye peas ....................................................................... Green peas ............................................................................ Peas and carrots mixed ......................................................... Spinach .................................................................................. Squash, summer/zucchini ...................................................... Southern greens .................................................................... Other ...................................................................................... Total frozen vegetables .......................................................... Frozen potatoes French fries ............................................................................ Other ...................................................................................... Total frozen potatoes .............................................................
34,728 71,543
169,238 43,056 70,373
150,122 24,168 95,109
128,748 49,973
301,633 151,875
67,369 71,015 16,534 66,582 14,413
456,725 16,336
131,132 68,411 45,581
422,205
2,028,612
1,012,479 279,584
1,282,588
1961 1963 2016 1991 1985 1999 1981 2016 2000 1991 2016 1992
2017 1998 2018 2012 1978 2010 1967 1999 1998 1974 2018
2016
2001 2017
2001
4,033 7,084
33,834 12,355 21,357 29,224
923 21,205 27,457
998 27,032 4,854
9,980
11,799 3,238 5,383 1,511 7,457 4,734
811 29,001 12,352 4,402
776,005
27,542 67,802
316,707
1938 1989 1960 2017 1997 1973 1945 1977 1977 1945 1972 1971
1956 1973 2009 1973 2016 1937 2008 1937 1979 2018 1937
1966
1956 1973
1973
June 1938
January 1960 January 1960 January 1960 January 1972 January 1972
June 1944 January 1976 January 1976
June 1944 January 1970 January 1970
January 1956 January 1972 January 1973 January 1973 January 1972
December 1936 January 1956
December 1936 January 1979 January 1972
December 1936
January 1962
January 1956 January 1971
January 1971
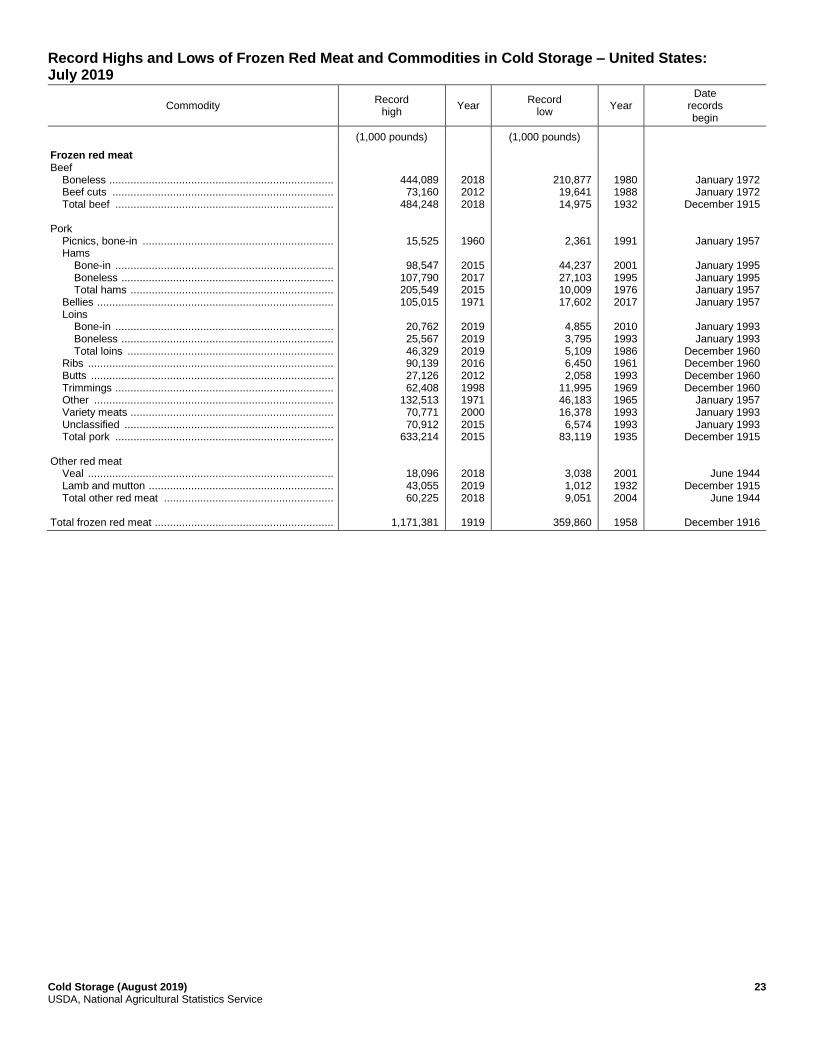
Cold Storage (August 2019) 23 USDA, National Agricultural Statistics Service
Record Highs and Lows of Frozen Red Meat and Commodities in Cold Storage – United States: July 2019
Commodity Record
high Year
Record low
Year Date
records begin
(1,000 pounds) (1,000 pounds)
Frozen red meat Beef Boneless .......................................................................... Beef cuts ......................................................................... Total beef ........................................................................ Pork Picnics, bone-in ............................................................... Hams Bone-in ........................................................................ Boneless ...................................................................... Total hams ................................................................... Bellies .............................................................................. Loins Bone-in ........................................................................ Boneless ...................................................................... Total loins .................................................................... Ribs ................................................................................. Butts ................................................................................ Trimmings ........................................................................ Other ............................................................................... Variety meats ................................................................... Unclassified ..................................................................... Total pork ........................................................................ Other red meat Veal ................................................................................. Lamb and mutton ............................................................. Total other red meat ........................................................ Total frozen red meat ...........................................................
444,089 73,160
484,248
15,525
98,547 107,790 205,549 105,015
20,762 25,567 46,329 90,139 27,126 62,408
132,513 70,771 70,912
633,214
18,096 43,055 60,225
1,171,381
2018 2012 2018
1960
2015 2017 2015 1971
2019 2019 2019 2016 2012 1998 1971 2000 2015 2015
2018 2019 2018
1919
210,877 19,641 14,975
2,361
44,237 27,103 10,009 17,602
4,855 3,795 5,109 6,450 2,058
11,995 46,183 16,378 6,574
83,119
3,038 1,012 9,051
359,860
1980 1988 1932
1991
2001 1995 1976 2017
2010 1993 1986 1961 1993 1969 1965 1993 1993 1935
2001 1932 2004
1958
January 1972 January 1972
December 1915
January 1957
January 1995 January 1995 January 1957 January 1957
January 1993 January 1993
December 1960 December 1960 December 1960 December 1960
January 1957 January 1993 January 1993
December 1915
June 1944 December 1915
June 1944
December 1916

24 Cold Storage (August 2019) USDA, National Agricultural Statistics Service
Cold Storage Regional Listing
New England: Connecticut, Maine, Massachusetts, New Hampshire, Rhode Island, Vermont.
Middle Atlantic: New Jersey, New York, Pennsylvania.
South Atlantic: Delaware, Florida, Georgia, Maryland, North Carolina, South Carolina, Virginia, West Virginia.
East North Central: Illinois, Indiana, Michigan, Ohio, Wisconsin.
East South Central: Alabama, Kentucky, Mississippi, Tennessee.
West North Central: Iowa, Kansas, Minnesota, Missouri, Nebraska, North Dakota, South Dakota.
West South Central: Arkansas, Louisiana, Oklahoma, Texas.
Mountain: Arizona, Colorado, Idaho, Montana, Nevada, New Mexico, Utah, Wyoming.
Pacific: Alaska, California, Oregon, Washington.
Definitions
Beef, boneless: Includes all boxed boneless beef, such as ground beef, roasts, steaks, loins, strips, rounds, trimmings, etc.
Excludes variety meats (edible offal), such as tongues, livers, hearts, kidneys, and other organs removed from slaughtered
beef.
Beef cuts: Includes all boxed primal beef cuts, bone-in.
Orange juice concentrate: Adjusted to 42.0 degrees Brix equivalent (9.896 pounds per gallon).
Pork, boneless hams: Includes full ham, bone removed and individual muscles separated.
Pork, boneless loins: Includes pork tenderloins.
Pork, ribs: Includes spareribs and backribs.
Pork, trimmings: Includes 42% regular trimmings, 72% special trimmings, boneless picnic meat, jowls, neckbone
trimmings, blade, cheek, head, and shank meat, etc. Packaged bacon, sausage, and processed items, such as hot dogs and
luncheon meats, are not included.
Pork, other: Includes ears, tails, feet, neckbones and snouts.
Pork, variety meats: Includes tongues, kidneys, livers, stomachs, hearts, chitterlings, salivary glands, and other organs
removed from slaughtered hogs.
Pork, unclassified: Includes product unable to be classified elsewhere in this report.
Public refrigerated storages: Refrigerated facilities maintained for storing food for others at specified rates per unit.
Private and semiprivate refrigerated storages: Refrigerated facilities maintained by an operator to facilitate his principal
function as a producer, processor, or manufacturer of food products. The space is used to store the owner’s products,
although some space may be used by others at specified rates per unit stored. Working space, chill rooms, and curing rooms
in meat storages are not included in the storage statistics.
Cold Storage (August 2019) 25 USDA, National Agricultural Statistics Service
Publication Notes Published April 2, 2019: The 2018 revisions to commodities were a result of updated facility information. Please refer to
the Cold Storage 2018 Summary, published April 2, 2019 for all the 2018 cold storage commodity estimates. All updated
data is also available on our Quick Stats website.
Published December 22, 2012: Beginning with the February 22, 2013 release, estimates for shelled and in-shell peanuts
are scheduled to be discontinued.
Published February 22, 2011: Beginning with the January 31, 2010 data, cherries, tart (juice) was published under two
categories: cherries, tart (juice stock) and cherries, tart (juice concentrate). All updated data is also available on our Quick
Stats website.
Published June 22, 2010: A change in classification of reported data beginning with May 31, 2010 in the Other Chicken
category resulted in an increase of Leg Quarters, Legs, and Paws and Feet along with a corresponding decrease in Other
Chicken. There was also an increase in reported data for Drumsticks, Leg Quarters, Paws and Feet, and Other Chicken
due to increased coverage and participation of facilities in the survey. Updated historic data prior to May 31, 2010 for
these facilities were unavailable. All updated data is also available on our Quick Stats website.
Published February 22, 2010: A change in classification of reported data beginning with January 31, 2009 in the Other
Chicken category resulted in an increase of Leg Quarters along with a corresponding decrease in Other Chicken. The
updated 2009 data for these categories was published in the Cold Storage 2009 Summary, released on February 22, 2010.
The Total Chicken category was unaffected by this change in reporting. All updated data is also available on our Quick
Stats website.
Published October 22, 2009: Beginning with the February 22, 2010 Cold Storage report, Other Turkey was separated
into the following five categories: breast meat, legs, mechanically deboned meat, other, and unclassified. The 2009 data
for these categories was published in the Cold Storage 2009 Summary, released on February 22, 2010. Data for the five
categories prior to 2009 was not available. All updated data is also available on our Quick Stats website.
Published June 22, 2009: Beginning with April 30, 2009 revised estimates, an increase in strawberry inventory was the
result of increased coverage of cold storage facilities as well as updated plant information. The April 2009 revisions of
frozen strawberries covered the following categories: Total, IQF and Poly, Pails and Tubs, Barrels and Drums, and Juice
Stock. Updated historic reported strawberry data prior to April 2009 was unavailable. Year to year relationships for
strawberry and the total fruit categories were impacted by this change.

26 Cold Storage (August 2019) USDA, National Agricultural Statistics Service
Statistical Methodology
Survey Procedures: Questionnaires are mailed about the 24th of each month to all operators on the list of approximately
800 public and private cold storage warehouses. In addition, data are obtained from special surveys and other sources. All
survey data represent stocks as of the end of the month.
Data are collected from warehouses artificially cooled to a temperature of 50 degrees Fahrenheit or lower, and whose food
products are normally stored for 30 days or more. All food items in these facilities are reported regardless of the number
of days stored at the time of the report. Also included are specialized storage facilities meeting the 30 day requirement,
such as fruit houses, dairy manufacturing plants, frozen fruit, fruit juice, vegetable processors, and poultry and meat
packing plants. Excluded are stocks in space maintained by wholesalers, jobbers, distributors, chain stores, locker plants
containing individual lockers, meat packer branch houses, and frozen food processors whose entire inventories are turned
over more than once a month.
All commodities reported on the cold storage report are regardless of ownership or origin. NASS does not differentiate
between commodities owned by manufacturer, producer, wholesaler, retailer, government owned, or domestically
produced vs. imported.
Estimating Procedures: Data for reporting firms are added to estimates for non-reporting firms to obtain regional and
National totals. Estimates for non-reporting firms are obtained by multiplying the previous month's figure by a percent
change from the previous month. The percent change is calculated for each item from totals of the current and previous
month summed from firms that reported both months.
Revision Policy: Data are revised the following month based on late reports or corrected data. Final figures are published
in the annual summary in February of the following year.
Reliability: Reports are received from approximately 660 firms each month which represent about 80 percent of the total
capacity. Firms that are not on the list or firms who have never reported are not represented in the data. Plants storing
butter or cheese are required under Federal law as defined in Public Laws 106-532 and 107-171 to complete the monthly
Cold Storage report. Monthly data can vary due to different firms reporting month to month. Survey data are also subject
to non-sampling errors such as omissions and mistakes in reporting and in processing the data. While these errors cannot
be measured directly, they are minimized by carefully reviewing all reported data for consistency and reasonableness.
Information Contacts
Listed below are the commodity specialists in the Livestock Branch of the National Agricultural Statistics Service to
contact for additional information. E-mail inquiries may be sent to [email protected]
Travis Averill, Chief, Livestock Branch ......................................................................................................... (202) 720-3570
Tony Dorn, Head, Poultry and Specialty Commodities Section ..................................................................... (202) 690-3223
Holly Brenize – Poultry Slaughter ............................................................................................................. (202) 720-0585
Alissa Cowell-Mytar – Cold Storage, Capacity of Refrigerated Warehouses .......................................... (202) 720-4751
Liana Cuffman – Catfish and Trout, Egg Products, Mink, Census of Aquaculture ................................. (202) 720-8784
Adam Peters – Broiler Hatchery, Chicken Hatchery ................................................................................ (202) 690-3237
Kim Linonis – Layers, Eggs ..................................................................................................................... (202) 690-3676
Fatema Haque – Turkey Hatchery, Turkeys Raised ................................................................................. (202) 720-3244
Vacant – Cost of Pollination, Honey, Honey Bee Colonies ..................................................................... (202) 720-6147

Access to NASS Reports For your convenience, you may access NASS reports and products the following ways:
All reports are available electronically, at no cost, on the NASS web site: www.nass.usda.gov
Both national and state specific reports are available via a free e-mail subscription. To set-up this free
subscription, visit www.nass.usda.gov and click on “National” or “State” in upper right corner above “search”
box to create an account and select the reports you would like to receive.
Cornell’s Mann Library has launched a new website housing NASS’s and other agency’s archived reports. The
new website, https://usda.library.cornell.edu. All email subscriptions containing reports will be sent from the new
website, https://usda.library.cornell.edu. To continue receiving the reports via e-mail, you will have to go to the
new website, create a new account and re-subscribe to the reports. If you need instructions to set up an account or
subscribe, they are located at: https://usda.library.cornell.edu/help. You should whitelist notifications@usda-
esmis.library.cornell.edu in your email client to avoid the emails going into spam/junk folders.
For more information on NASS surveys and reports, call the NASS Agricultural Statistics Hotline at (800) 727-9540,
7:30 a.m. to 4:00 p.m. ET, or e-mail: [email protected].
The U.S. Department of Agriculture (USDA) prohibits discrimination against its customers, employees, and applicants for
employment on the basis of race, color, national origin, age, disability, sex, gender identity, religion, reprisal, and where
applicable, political beliefs, marital status, familial or parental status, sexual orientation, or all or part of an individual's
income is derived from any public assistance program, or protected genetic information in employment or in any program
or activity conducted or funded by the Department. (Not all prohibited bases will apply to all programs and/or
employment activities.)
If you wish to file a Civil Rights program complaint of discrimination, complete the USDA Program Discrimination
Complaint Form (PDF), found online at www.ascr.usda.gov/filing-program-discrimination-complaint-usda-customer, or
at any USDA office, or call (866) 632-9992 to request the form. You may also write a letter containing all of the
information requested in the form. Send your completed complaint form or letter to us by mail at U.S. Department of
Agriculture, Director, Office of Adjudication, 1400 Independence Avenue, S.W., Washington, D.C. 20250-9410, by fax
(202) 690-7442 or email at [email protected].