Embed Size (px)
Citation preview

© 2010 The MITRE Corporation. All rights reserved.
Approved for Public Release: 10-4820. Distribution Unlimited.
M T R 0 8 0 3 1 5
M I T R E T E C H N I C A L R E P O R T
COIN 1.0 Formulation
The views, opinions and/or findings contained in this report are those of The MITRE Corporation and should not be construed as an official government position, policy, or decision, unless designated by other documentation. ©2010 The MITRE Corporation. All Rights Reserved.
For more information about this document, please contact: Dr. Brian Tivnan [email protected] 703-983-3829
Emmett Beeker, Tobin Bergen-Hill, Zoe A. Henscheid, Dr. Garry Jacyna, Matthew T. K. Koehler, Laurie Litwin, Adam McLeod, Matthew McMahon, Sarah K. Mulutzie, Dr. Neal Rothleder, Rajani Shenoy, Dr. Brian F. Tivnan, Thomas J. Wilk
Dr. Jessica G. Turnley Galisteo Consulting Group, Inc.
May 2010

Report Documentation Page Form ApprovedOMB No. 0704-0188
Public reporting burden for the collection of information is estimated to average 1 hour per response, including the time for reviewing instructions, searching existing data sources, gathering andmaintaining the data needed, and completing and reviewing the collection of information. Send comments regarding this burden estimate or any other aspect of this collection of information,including suggestions for reducing this burden, to Washington Headquarters Services, Directorate for Information Operations and Reports, 1215 Jefferson Davis Highway, Suite 1204, ArlingtonVA 22202-4302. Respondents should be aware that notwithstanding any other provision of law, no person shall be subject to a penalty for failing to comply with a collection of information if itdoes not display a currently valid OMB control number.
1. REPORT DATE MAY 2010 2. REPORT TYPE
3. DATES COVERED 00-00-2010 to 00-00-2010
4. TITLE AND SUBTITLE COIN 1.0 Formulation
5a. CONTRACT NUMBER
5b. GRANT NUMBER
5c. PROGRAM ELEMENT NUMBER
6. AUTHOR(S) 5d. PROJECT NUMBER
5e. TASK NUMBER
5f. WORK UNIT NUMBER
7. PERFORMING ORGANIZATION NAME(S) AND ADDRESS(ES) MITRE,202 Burlington Rd ,Bedford,MA,01730
8. PERFORMING ORGANIZATIONREPORT NUMBER
9. SPONSORING/MONITORING AGENCY NAME(S) AND ADDRESS(ES) 10. SPONSOR/MONITOR’S ACRONYM(S)
11. SPONSOR/MONITOR’S REPORT NUMBER(S)
12. DISTRIBUTION/AVAILABILITY STATEMENT Approved for public release; distribution unlimited
13. SUPPLEMENTARY NOTES
14. ABSTRACT
15. SUBJECT TERMS
16. SECURITY CLASSIFICATION OF: 17. LIMITATION OF ABSTRACT Same as
Report (SAR)
18. NUMBEROF PAGES
148
19a. NAME OFRESPONSIBLE PERSON
a. REPORT unclassified
b. ABSTRACT unclassified
c. THIS PAGE unclassified
Standard Form 298 (Rev. 8-98) Prescribed by ANSI Std Z39-18

© 2010 The MITRE Corporation. All rights reserved.
Approved for Public Release: 10-4820. Distribution Unlimited.

iii
© 2010 The MITRE Corporation. All rights reserved.
Executive Summary
The Counterinsurgency (COIN) Model is intended to be a test bed for examining the important dynamics involved in the counterinsurgency environment. It is therefore designed to capture salient civilian population characteristics as well as Coalition and Insurgent “kinetic” and non-kinetic activities. The basis for this model is a civil violence model created by Joshua Epstein of the Brookings Institution. This peer-reviewed model captures the dynamics of spontaneous rebellions and does so with a striking paucity of model parameters. Epstein’s model includes only two types of agents: civilians and cops. Civilians can be in one of three states: quiet, actively rebelling, or jailed. Civilians begin in a quiet state and actively rebel based upon their grievance toward an abstract central government and their assessment of the risk associated with rebelling. Civilians become jailed if cops can capture them while they are rebelling. The simplicity of the Epstein model, coupled with its comprehensive evaluation within the modeling community, makes it an ideal starting point for extending to create our COIN model.
To extend Epstein’s model for a counterinsurgency, it was necessary to add an additional type of agent, namely, dedicated foreign fighters. We also added agent behaviors, such as bomb making, killing, kidnapping, patrolling, and moving convoys. Also, due to the importance of a civilian populace in a counterinsurgency campaign, the civilians were greatly modified.
The civilian modifications include the addition of many civilian characteristics: demographic characteristics: ethnicity, religion, wealth, gender, marital status, and tribe; identity groups; social groups; multiple notions of grievance and activation; and jobs or social roles. These added civilian characteristics allow the model to represent more realistic social behavior. Civilians interact with each other affecting their feeling of grievance toward the major “institutions” within the model (the Coalition, the Iraqi Army, the Iraqi Police, Sahwas, and Foreign Fighters). Civilians use these grievance values together with perceptions of institutional legitimacy to create activations (either in support or opposition) towards these institutions. These activations are then used to determine if the civilian will be active or passive in their assigned job. Jobs include Iraqi Government, Iraqi Army, Iraqi Police, “General Citizen”, Trouble Maker, and Insurgent. Currently, civilians are assigned a job and may change their jobs after two weeks of being inactive in their current job.
In addition to the civilians, Coalition Forces move about the environment in one of four ways: enforcing (arresting those opposed to the Coalition); patrolling (looking for bombers and IEDs); conducting named operations (specifically looking for bomb making facilities that were identified via Blue HUMINT); or traveling in convoys . Foreign Fighters take one of the following three actions: make bombs, emplace and detonate bombs, or kidnap individuals opposed to Foreign Fighters. Furthermore, there is a coevolutionary dynamic between Coalition force vehicle protection and Foreign Fighters’ design of IEDs. As Coalition forces develop new ways to protect the force, the Foreign Fighters design new IEDs capable of neutralizing Coalition innovation.
The remainder of this document goes into much more detail on all characteristics and features of the model outlined above.

iv
© 2010 The MITRE Corporation. All rights reserved.

v
© 2010 The MITRE Corporation. All rights reserved.
Table of Contents
1 Introduction 1-1
1.1 Study Objectives 1-1
1.2 The Challenge Problem 1-1
1.2.1 Why Samarra? 1-2
1.3 COIN 1-3
1.4 Why Agent-Based Modeling? 1-3
1.5 Purpose of Model Formulation 1-4
1.6 Organization of This Report 1-4
2 The Underlying Civil Violence Model 2-1
2.1 Description of Joshua Epstein’s Basic Civil Violence Model 2-1
2.2 Summary of Results From NetLogo’s Rebellion Model 2-3
3 The Expansion of the Civil Violence Model 3-1
3.1 Actors 3-1
3.2 Central Authorities/Institutions and the Resulting Vectors of Legitimacy, Grievance, Net Risk, and Activation Values 3-1
3.3 Jobs of the Civilians Actors 3-6
3.4 Behaviors of Coalition and Foreign Fighters 3-8
3.5 Behaviors of Civilians 3-9
4 Additional Functionality 4-1
4.1 Identity Groups and Social Groups 4-1
4.2 Relative Hardship 4-2
4.3 Hardship Interactions between Identity Groups and Social Groups 4-2
4.4 Activation Level Interactions Between Two Civilians “On the Street” (i.e., Between Neighbors) 4-3
5 Simulation Approach for the COIN Model 5-1
5.1 The Three Prototypes 5-1
5.1.1 The NetLogo Prototype 5-2
5.1.1.1 Initial NetLogo Prototype Results 5-2
5.1.2 The Repast Prototype 5-10
5.1.2.1 Initial NetLogo to Repast Porting Exercise 5-10

vi
© 2010 The MITRE Corporation. All rights reserved.
5.1.2.2 Implementing the COIN Model in Repast 5-11
5.1.3 The C++ Scalable Simulation of the Simple Rebellion Model 5-11
5.1.3.1 C++ Serial Results 5-12
5.1.3.2 Parallel C++ Implementation and Results 5-14
5.2 Parallel Simulations for Computational Experimentation 5-20
5.2.1 The Infrastructure for Complex Systems Engineering (ICE) 5-20
5.2.2 Parallelization within the ICE 5-22
5.3 High Performance Applications for Computational Efficiency 5-23
5.3.1 Biased Random Number Generator 5-23
5.3.2 Line-of-Sight (LOS) Engine 5-24
5.3.3 Intelligent Route Planning 5-25
5.4 Data Analysis 5-28
5.4.1 Agent Interaction Tables 5-28
5.4.2 Genetic Algorithms 5-30
5.4.2.1 Background on Genetic Algorithms 5-30
5.4.2.2 MITRE GA Work That Will Be Leveraged for the COIN Model 5-31
5.4.3 Complex Time Series Analysis 5-34
5.4.3.1 Jittered Time Series Plots 5-34
5.4.3.2 Comparison of Time Series Data 5-34
5.4.4 Delayed Outcome Reinforcement Plot (DORP) 5-35
Appendix A Acronyms A-1
Appendix B Bibliography B-1
Appendix C End Notes for COIN Model Formulation for JIEDDO C-1
C.1 End Note on the Initial Distribution C-1
C.2 End Note on Persuasion C-2
C.3 End Note on Events C-2
Appendix D Key COIN Model Parameters D-1
D.1 Environment Parameters D-1
D.2 Agent Parameters D-1
Appendix E Emotional and Attitudinal Convergence E-1

vii
© 2010 The MITRE Corporation. All rights reserved.
Appendix F White Papers Developed for the COIN Model by Galisteo Consulting Group, Inc.F-1
Appendix G Random Number Generator (RNG) Synchronization Between NetLogo and Repast Models G-1
G.1 Explicit Uses G-1
G.2 Implicit Uses G-2
G.3 Agent Sets G-2

viii
© 2010 The MITRE Corporation. All rights reserved.
List of Figures
Figure 1-1. Image of Samarra, Iraq 1-2
Figure 2-1. “Bursty” Rebellion Behavior (Active Rebellions) 2-3
Figure 2-2. “Bursty” Rebellion Behavior—Jailed Civilians(blue) & Active Civilians (black) 2-4
Figure 2-3. Average Hardship of Quiet Agents (top graph) and Number of Active Civilians (bottom graph) 2-5
Figure 2-4. Distribution of the Duration of Rebellious Activity 2-6
Figure 2-5. Distribution of the Inter-Arrival Times of Rebellious Activity 2-6
Figure 2-6. Distribution of the Active Rebellion Sizes 2-7
Figure 2-7. Comparison of the Effect of Cop Vision and Civilian Vision on Average Active Civilians 2-8
Figure 2-8. Comparison of the Effect of the Floor Function in the Probability of Arrest Calculation 2-9
Figure 3-1. Depiction of 10,000 Randomly Produced Draws From a Triangular Distribution With Bias Toward 1.0 3-3
Figure 3-2. Sample Civilian’s Grievance and Activation Calculations 3-4
Figure 5-1. Three Prototypes of the COIN Model 5-2
Figure 5-2. Mean Number of General Citizens Kidnapped for Each Day of the Run 5-3
Figure 5-3. Mean Number of General Citizens Arrested for Each Day of the Run 5-3
Figure 5-4. Insurgents’ Mean Perceived Hardship for Each Day of the Run 5-4
Figure 5-5. Iraqi Police’ Mean Perceived Hardship for Each Day of the Run 5-5
Figure 5-6. Insurgents’ Mean Relative Hardship for Each Day of the Run 5-5
Figure 5-7. Iraqi Police’s Mean Relative Hardship for Each Day of the Run 5-6
Figure 5-8. General Citizens’ Mean Daily Activation Values for the Coalition Institution 5-7
Figure 5-9. General Citizens’ Mean Daily Activation Values for the Foreign Fighter Institution 5-7
Figure 5-10. Insurgent’s Mean Daily Activation Values for the Foreign Fighter Institution 5-8
Figure 5-11. Iraqi Army’s Mean Daily Activation Values for the Iraqi Army Institution 5-8
Figure 5-12. Civilians’ Job Changes Over 24 Runs 5-9
Figure 5-13. Depiction of IED Explosions for 24 Runs 5-10
Figure 5-14. Number of Agents vs. Runtime for the C++ Prototype 5-13
Figure 5-15. Grid Size vs. Runtime for the C++ Prototype 5-13

ix
© 2010 The MITRE Corporation. All rights reserved.
Figure 5-16. Charts Depicted the Rebellious Behavior for the Serial C++ Implementation of the Rebellion Model for Various Grid Sizes 5-14
Figure 5-17. Basic LAM/MPI Constructs 5-15
Figure 5-18. Illustration of the Sub-Grids 5-16
Figure 5-19. Illustration of the Parallel C++ Process 5-17
Figure 5-20. Illustration of the Rebellious Behavior for the Parallel C++ Implementation of the Rebellion Model 5-18
Figure 5-21. Number of Processors vs. Runtime for a 2000 x 2000 Grid in the Parallel C++ Version 5-19
Figure 5-22. Comparison of the Processing Time for the Parallel and Serial C++ Versions as a Function of the Number of Agents 5-20
Figure 5-23. Infrastructure of Complex Systems Engineering (ICE) Diagram 5-21
Figure 5-24. Shape of the Biased PRNG Probability Density Function 5-23
Figure 5-25. Histograms of Over 10,000 Calls to Two Different Bias Values of the Biased PRNG 5-24
Figure 5-26. Simple Benchmark Runs of the LOS Engine on an Intel 2.4 GHz Core-2 Duo Machine 5-25
Figure 5-27, Nearest Neighbor Regions on a Simple Map (Black dots indicate waypoint positions) 5-27
Figure 5-28. Path Derived From Hand-Placed Waypoints on an Urban Map (Yellow lines indicate the path and the red dots indicate the waypoint) 5-28
Figure 5-29. Agent Interaction Table 5-29
Figure 5-30. Density Playback Example 5-29
Figure 5-31. Utility Function Tool 5-33
Figure 5-32. Jittered Casualties Over Time 5-34
Figure 5-33. Static Raster Field DORP 5-36
Figure 5-34. Static Vector Field DORP 5-37
Figure 5-35. Animated Time Series DORP 5-37
Figure 36: The elements of power 2
Figure D-1. Agent Schematic D-2
Figure D-2. Attitude Adjustments Based on Two Civilians Interacting D-11

x
© 2010 The MITRE Corporation. All rights reserved.
Figure D-3. Hamming Distance Examples of Non-Optimal Bomb Designs (top graph) and Optimal Bomb Design (bottom graph) D-22

xi
© 2010 The MITRE Corporation. All rights reserved.
List of Tables
Table 3-1. Activation Values Used for Determining a Civilian’s Behavior in Their Job 3-7
Table 5-1. Comparison of the Performances of the NetLogo and C++ Versions of the NetLogo Rebellion Model 5-12
Table D-1. Capture and Kill Thresholds D-15
Table D-2. Probability of Misidentifying Targets D-16

xii
© 2010 The MITRE Corporation. All rights reserved.

1-1
© 2010 The MITRE Corporation. All rights reserved.
1 Introduction
The Counterinsurgency (COIN) Model, built for the Joint Improvised Explosive Device (IED) Defeat Organization Operations Research Systems Analysis (ORSA) Division (JIEDDO/ORSA), leverages MITRE COIN research1 on how the various actors in a COIN environment interact and how different events and interactions can shape the behavior of the actors. Specifically, the model addresses:
1) Civilians and how their orientation towards Coalition and insurgent forces changes over time and
2) IED and Counter-IED (C-IED) operations.
The focus of the model is C-IED; however, since C-IED is part of COIN and the Department of Defense (DoD) has described COIN as being a subset of Irregular Warfare (IW)2, we will refer to the model as the COIN Model throughout this document.
1.1 Study Objectives
The C-IED Agent Based Modeling Support to JIEDDO/ORSA had four objectives by phases as described below:
Phase 1: Define an initial formulation and model including: an environment, a set of agents, and interaction rule sets that create representative dynamics of the trends and patterns seen in IED usage and other acts of violence.
Phase 2: Enhance the environment and the rule sets to create a richer and more dynamic system.
Phase 3: Further explore environmental factors and mature agent rule sets and allow for individual agent learning.
Phase 4: Produce and provide a study of the C-IED dynamics of Samarra, which is the basis for the challenge problem.
We met the first three of these objectives during Fiscal Year 2008 (FY08). The fourth objective was not completed in FY08, but MITRE did accomplish this objective by end of the Calendar Year 2008 (CY08). In Fiscal Year 2009 (FY09), MITRE conducted additional experiments and runs to more closely integrate the kinetic and non-kinetic aspects of the model.
1.2 The Challenge Problem The JIEDDO challenge problem for the C-IED Agent Based Modeling Support is to determine whether a simulation model can be created to generate dynamics that are distributionally
1 Tivnan, B. (2008). Counterinsurgency (COIN) Sandbox for Decision Support (CISADS). Retrieved
October 6, 2008 from MITRE Technical Innovation Exchange: http://www.mitre.org/news/events/exchange08/24.html.
2 Department of Defense. (2007). Irregular Warfare Joint Operating Concept (Version 1). Department of Defense. p.2.

1-2
© 2010 The MITRE Corporation. All rights reserved.
equivalent to the COIN dynamics occurring in Iraq, with particular emphasis on the C-IED dynamics.
1.2.1 Why Samarra?
The area of interest (AOI) chosen for the challenge problem was Samarra, Iraq. This city is located between Mosul and Baghdad and it is relatively isolated (see Figure 1-1). This isolation is partially due to the fact that Coalition forces made Samarra a bermed city with only two points of entry/exit – one in the North and one in the South – both of which are manned with security forces.
Figure 1-1. Image of Samarra, Iraq
(From www.maps.google.com and Google Earth)
The city has significant Coalition and transient traffic throughout, has distinct neighborhoods, and has had some flash points associated with its areas of cultural significance, such as the Golden Mosque, Spiral Minaret, and the Shrine of the Hidden Imam. Additionally, the city provides a microcosm of Iraqi COIN issues such as:
There are multiple religions and tribes, economic troubles, infrastructure degradation and redevelopment
There is a diverse “Blue” presence (Coalition Forces, Iraqi Army, Iraqi National - Local Police, Concerned Local citizens (CLCs))
There is a diverse “Red” presence (Al-Qaeda in Iraq (AQI), local criminal and insurgent groups, foreign fighters, and transient/opportunistic fighters)

1-3
© 2010 The MITRE Corporation. All rights reserved.
The city is moderately-sized (150,000-200,000 civilians)
Additionally, JIEDDO has amassed a reasonable amount of data for the area from Coalition Force Operational Reports and we have access to data from the resident Army Units and other data sources such as Blue Force Tracker (BFT) and Ground Moving Target Indicator (GMTI). Samarra was thus chosen as the AOI for the study because some data exists on the dynamics under study, it is moderately-sized, and yet contains many of the COIN issues of concern for JIEDDO.
1.3 COIN According to the Forward in the Counterinsurgency Field Manual (FM 3-24):
A counterinsurgency campaign is, as described in this manual, a mix of offensive, defensive, and stability operations conducted along multiple lines of operations. It requires Soldiers and Marines to employ a mix of familiar combat tasks and skills more often associated with nonmilitary agencies. The balance between them depends on the local situation. Achieving this balance is not easy. It requires leaders at all levels to adjust their approach constantly. They must ensure that their Soldiers and Marines are ready to be greeted with either a handshake or a hand grenade while taking on missions only infrequently practiced until recently at our combat training centers. Soldiers and Marines are expected to be nation builders as well as warriors. They must be prepared to help reestablish institutions and local security forces and assist in rebuilding infrastructure and basic services. They must be able to facilitate establishing local governance and the rule of law. The list of such tasks is long; performing them involves extensive coordination and cooperation with many intergovernmental, host-nation, and international agencies. …Conducting a successful counterinsurgency campaign requires a flexible, adaptive force led by agile, well-informed, culturally astute leaders3.
The Counterinsurgency Manual further emphasizes that COIN is characterized by rapidly changing situations, a heterogeneous enemy, and learning competitions between the counterinsurgents and the insurgents. Thus the side that learns faster and adapts more rapidly wins. The Counterinsurgency Manual also stresses that the civilian population is the center of gravity in an insurgency4. These are the important aspects of COIN that should be represented in any model of COIN.
1.4 Why Agent-Based Modeling? We have chosen to use agent-based modeling (ABM) to address the study problem. Modeling humans is challenging because humans are difficult to predict, have heterogeneous
3 Headquarters Department of the Army. (2006). FM 3-24 Counterinsurgency. Washington DC:
Headquarters Department of the Army. 4 Ibid, p.3-13.

1-4
© 2010 The MITRE Corporation. All rights reserved.
characteristics and are adaptive. Closed form solutions to human problems are difficult to create without using herculean simplifying assumptions that call into question any potential insights that may be gained. However, one can usually specify important features that should be modeled for a specific problem, such as defining characteristics (sex, wealth, etc.) and behavioral rules. Having defined these important features one can only “solve” the system by running a simulation5. This specification implies that humans are discrete, boundedly rational, purposive actors within the specified system. Therefore, while closed-form solutions relying on micro-level equilibria such as game theory may be of limited utility, agent-based modeling, on the other hand, is a natural platform with which to study these systems.
1.5 Purpose of Model Formulation A model formulation provides information on the model’s intended use and a description of what is included in the model and how it is represented within the model. It thus provides the following:
Demystifies the “Black Box” Enhances model transparency Supports an independent verification Increases traceability in model results Aids in collaborative development and engages a larger community in discussion.
The COIN model formulation is contained in Chapters 2 – 4 of this document.
1.6 Organization of This Report
The following chapters provide information on the COIN model and the simulation approach we have used to implement the COIN model formulation. Specifically, Chapters 2-4 describe the COIN model formulation: Chapter 2 describes the underlying civil violence model and results from a NetLogo version of that civil violence model; Chapter 3 describes how the COIN Model expands on the ideas within the civil violence model; and Chapter 4 describes the additional functionality that is being added to the COIN Model. Chapter 5 describes the simulation approach we have taken to implement the COIN model formulation.
This document also has several appendices. Appendix A is an Acronym List, Appendix B provides a bibliography and Appendix C contains “end notes” related to the document. Appendix D contains a description of the specific implementation of key parameters in the COIN Model. Appendices E and F contain white papers that were used as reference sources for the COIN model formulation. Finally, Appendix G contains information on the synchronization of a random number generator, which was required for determining numerical identity between two of our COIN Model prototypes.
5 Buss, S., et al. (1991). On the Predictability of Coupled Automata: An Allegory about Chaos.
Complex Systems 5, 525-539.

2-1
© 2010 The MITRE Corporation. All rights reserved.
2 The Underlying Civil Violence Model
This chapter describes Joshua Epstein’s basic civil violence model that was used as a point of departure for the COIN Model.
2.1 Description of Joshua Epstein’s Basic Civil Violence Model The COIN Model builds upon Joshua Epstein’s model of civil violence for a general rebellion of civilians against a central authority6. Epstein’s model was chosen as the baseline since it is a peer-reviewed, tractable model of a generalized rebellion against a central authority. In Epstein’s model there is a representation of a civilian’s political grievance against a central authority; this grievance is based upon the perceived hardship experienced by the civilian and the civilian’s perceived legitimacy of the central authority. For Epstein, both the perceived hardship (H) and the perceived legitimacy (L) are exogenous to the agents and grievance (G) is assumed to have the following relationship: G = H (1 – L). Thus, if legitimacy is extremely high, a great hardship will not induce a political grievance; however if the perceived legitimacy is low, a grievance will be experienced by a civilian experiencing hardship. In addition to grievance, Epstein’s model also includes a representation of a civilian’s risk aversion (R) in determining whether a civilian will actively rebel or not. In Epstein’s model, perceived hardship and risk aversion are heterogeneous across all civilians and are drawn from a uniform distribution on the interval 0 to 1, i.e., U(0,1). Legitimacy also is drawn from U(0,1) but is equal across all civilians for a specific run.
According to Epstein’s model, before a civilian decides to actively rebel, the civilian first estimates the probability of being arrested. Epstein assumed that this estimate increases as the ratio of cops to already rebellious civilians (i.e., number of “actives”) increases. The civilian bases this estimate on the ratio of the number of cops (C) within its vision (v) to the number of actives (actively rebellious civilians) within its vision. In Epstein’s model, vision is spatial and indicates that the civilian has a certain range from its geographical location within which it can locate cops and other civilians. Vision is thus analogous to situational awareness in the operational context. The ratio of the number of cops to the number of actives is denoted as (C/A)v and the relation for the probability of arrest is calculated as follows:
P = 1 – exp[-k(C/A)v],
where the constant k provides a probability of 0.9 when C = 1 and A = 1. In Epstein’s model the vision of an agent is exogenous and equal across all agents. It is important to note that since vision is limited, the information a civilian receives based on its vision is local information – thus the determination of the probability of arrest is based upon the civilian’s local geographic environment. Epstein defines a civilian’s net risk (N) as N = R*P and the determination of whether a civilian becomes actively rebellious is based on the equation G – N > T, where T is a non-negative threshold value.
6 Epstein, J. M. (2002). Modeling civil violence: an agent-based computational approach. PNAS, 99,
7243-7250.

2-2
© 2010 The MITRE Corporation. All rights reserved.
In Epstein’s model, the cops are the representation of the central authority and they never defect to the rebellious side. As a result, in Epstein’s model the cops do not have a sense of their own hardship or perceived legitimacy of the central authority. The cops also have a vision (v*) and this allows them to inspect all areas within v* for actively rebellious civilians. If they find one or more actively rebellious civilians, they arrest a randomly chosen actively rebellious civilian and that civilian is jailed for a given amount of time. The jail term is exogenous and is based upon a maximum jail term set by the user (J_max). Thus the jail term j is drawn from a U(0, J_max).
From his reasonably simple model Epstein generated a number of interesting dynamics - one of these is individual deceptive behavior. Individual civilians will become actively rebellious in the absence of cops, but as the ratio of cops to actives increases the civilians will become quiet, and then become active once again as the cops leave the area. Another dynamic of interest relates to the density of actives relative to cops; if, through random movement, a high density of actives occurs in the absence of cops there may be enough “inertia” created such that a wide rebellion is sustained. Epstein states that his model exhibits punctuated equilibrium by “having long periods of relative stability punctuated by rebellious activity”7 8. Epstein also notes that the inter-arrival time between rebellious outbursts of a size greater than 50 is lognormal. This is of interest as all random distributions contained in the model are uniform; therefore, one could postulate that this distribution comes from the interaction of the agents. Moreover, this type of result is one that can be checked against data coming from the area of interest. A final dynamic is that of a society’s ability to absorb decreases in political legitimacy. If political legitimacy is decreased slowly it is unlikely that there will be a major rebellion since the cops can keep up with the activation of a few civilians at a time. If, however, legitimacy is lowered very quickly (even if less than the incremental decrease), then there is a high likelihood that there will be a large rebellious outbreak.
For its starting point, our implementation uses Wilensky’s 9 representation of Epstein’s civil violence model. Wilensky’s interpretation differs from Epstein’s civil violence model in two areas:
1) The cop vision (v*) is modeled identically to the civilian vision (v), i.e., v* = v, and
7 (Epstein, 2002, p. 7245).
8 According to biology literature, punctuated equilibrium is characterized by essentially
“homeostatic equilibria disturbed only ‘rarely’ by rapid and episodic events” that then even out into new homeostatic equilibria. [Eldredge, N. & Gould, S.J. (1972). Punctuated Equilibria: An Alternative to Phyletic Gradualism. In T. Schopf (Ed.), Models in Paleobiology (pp 82-115). San Francisco, CA: Freeman, Cooper and Co. p.84.].
9 Wilensky, U. (2004). NetLogo Rebellion model:
http://ccl.northwestern.edu/netlogo/models/Rebellion. Center for Connected Learning and Computer-Based Modeling, Northwestern University, Evanston, IL.

2-3
© 2010 The MITRE Corporation. All rights reserved.
2) The probability of arrest is modeled as P = 1 – exp [-k * floor (C/A)v]),which results in an integer value for the (C/A) ratio.
According to Wilensky, “without this change, the model does not exhibit “punctuated equilibrium.‖
10
2.2 Summary of Results From NetLogo’s Rebellion Model In order to more fully understand the dynamics of the NetLogo Rebellion model we undertook a series of experiments with it. As expected we saw the same “bursty” behavior reported by Epstein (see Figure 2-1).
Figure 2-1. “Bursty” Rebellion Behavior (Active Rebellions)
Underlying this “bursty” behavior are relationships that are similar to those articulated by Epstein. For example, as depicted below, the number of jailed civilians decreases as the number of active civilians increases (see Figure 2-2).
10 Ibid.

2-4
© 2010 The MITRE Corporation. All rights reserved.
Figure 2-2. “Bursty” Rebellion Behavior—Jailed Civilians(blue) & Active Civilians (black)
Also, as the average hardship for the quiet agents reaches a peak, it is followed closely by a spike in the number of active civilians and a decrease in the average hardship for the quiet agents (see Figure 2-3).

2-5
© 2010 The MITRE Corporation. All rights reserved.
Figure 2-3. Average Hardship of Quiet Agents (top graph) and Number of Active Civilians (bottom graph)
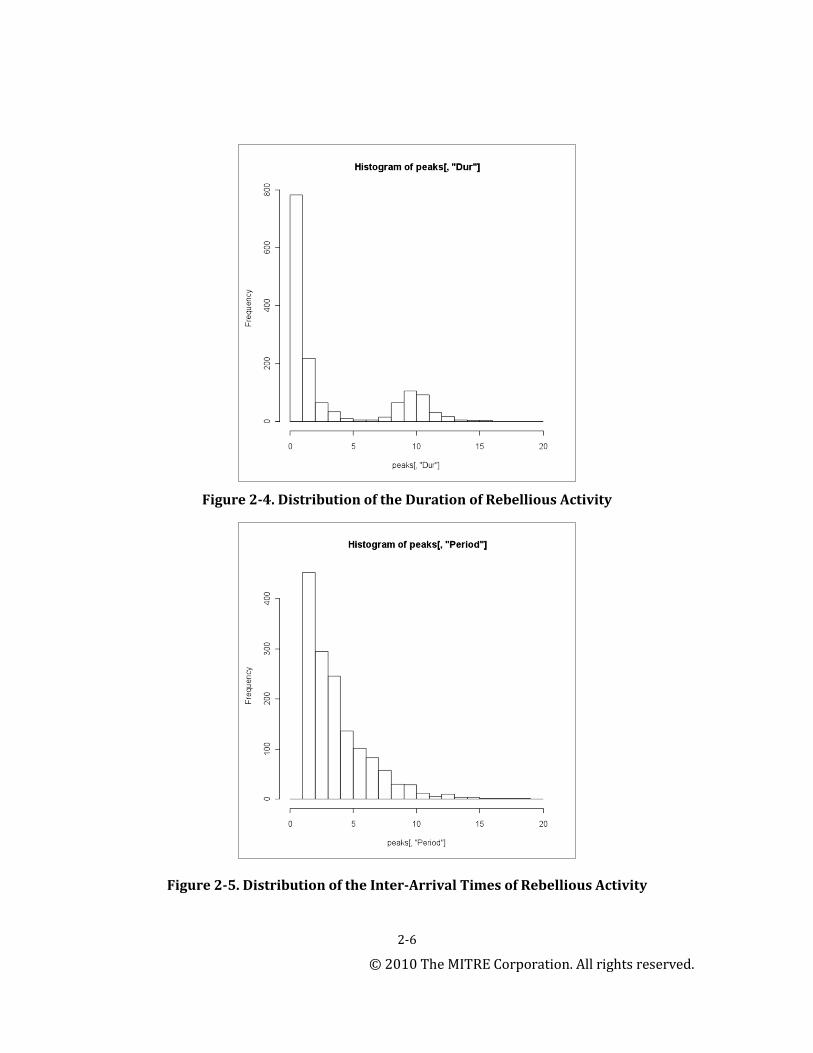
Other dynamics of interest from this model include the distribution of the duration of rebellious activity (which approximates a negative exponential), distribution of the inter-arrival times of rebellious activity (which approximates a negative exponential), and the distribution of rebellion size (which approaches a power-law early on but is soon overtaken by noise) (see Figures 2-4 –2-6).
2-6
© 2010 The MITRE Corporation. All rights reserved.
Figure 2-4. Distribution of the Duration of Rebellious Activity
Figure 2-5. Distribution of the Inter-Arrival Times of Rebellious Activity

2-7
© 2010 The MITRE Corporation. All rights reserved.
Figure 2-6. Distribution of the Active Rebellion Sizes
Some runs were conducted on the NetLogo Rebellion model to determine the significance of modeling the cop vision (v*) as being identical to the civilian vision (v). By introducing v* to the NetLogo Rebellion model and examining the results, it was determined that the civilian vision v is the driver behind the number of actively rebellious civilians and the resulting number of
Log o
f t
he
Nu
mb
er o
f R
ebel
lion
s
Log of the Size of Rebellions

2-8
© 2010 The MITRE Corporation. All rights reserved.
jailed civilians (see Figure 2-7). As a result, the COIN Model will use the NetLogo Rebellion model construct of v* = v.
Figure 2-7. Comparison of the Effect of Cop Vision and Civilian Vision on Average Active Civilians
Some runs were also performed to look at the effect of using the floor function in the probability of arrest calculation, P = 1 – exp [-k * floor (C/A)v]. As previously mentioned this calculation differs from Epstein’s original formulation, resulting in an integer value for the (C/A) ratio. The top graph in Figure 2-8 displays the number of active, jailed, and quiet agents for the first 200 time steps of a NetLogo Rebellion run where the floor function was used in the probability of arrest calculation. The bottom graph displays the number of active, jailed and quiet agents for the first 200 time steps

2-9
© 2010 The MITRE Corporation. All rights reserved.
of a NetLogo Rebellion run, where the floor function was not used. Note that the “bursty” pattern is seen only when the floor function is used in the calculation. As a result, the current version of the COIN Model uses the floor function in the calculation of the probability of arrest. However, more analysis is being performed on this topic to provide the modeling team with more insight.
Figure 2-8. Comparison of the Effect of the Floor Function in the Probability of Arrest Calculation

2-10
© 2010 The MITRE Corporation. All rights reserved.

3-1
© 2010 The MITRE Corporation. All rights reserved.
3 The Expansion of the Civil Violence Model
This chapter describes how the Epstein’s basic civil violence model was expanded for the COIN Model.
Epstein’s model of civil violence, which models a simple spontaneous rebellion, provides a good starting point for modeling the rebellious nature of counterinsurgency. However, there are many more attributes of a counterinsurgency that need to be modeled and it requires one to look at the various authorities/institutions that are involved, as well as the characteristics of the civilians and insurgents and how they may be influenced. As a result, the COIN Model expands upon several aspects of Epstein’s model of civil violence – specifically the number of actors and their roles, number of central authorities, legitimacy, grievance, and the activation of civilians. Each of these will be discussed in greater detail in the following subsections.
3.1 Actors In the COIN Model, there are several actors: the Coalition forces, foreign fighters, and civilians. The Coalition forces map very readily into Epstein’s cop representation. The foreign fighters will be modeled similar to the Coalition forces except they will represent the opposing side. The civilians will have nine “job” categories: general citizen, Iraqi Army (IA), Iraqi Police (IP), Iraqi Local Government Official (ILG), Sahwas11, Blue Human Intelligence (HUMINT), Red HUMINT, Trouble Maker, and Insurgent. Again, the COIN Model may need to ultimately include additional “jobs”, but this is the initial set that will be used. Note that the Trouble Makers represent the criminal/anti-stability segment of the civilians. All actors also have a “role”, which is associated with the actions that they perform in the scenario. Currently, the role categories are: none, enforce, kidnap, patrol, bomber, bomb maker, and cache; it is envisioned however that these categories will be expanded in the future to include explosive ordnance disposal (EOD) teams, civil affair functions, and additional IED supply chain roles among others.
3.2 Central Authorities/Institutions and the Resulting Vectors of Legitimacy, Grievance, Net Risk, and Activation Values
Instead of having one central authority, the COIN Model has a representation of several central authorities/institutions. For the initial COIN Model there are five “institutions” 12: the Coalition, the foreign fighters, the IA, the IP, and the Sahwas.
As a result of modeling more than one central institution, the COIN Model incorporates “vectors” of perceptions of legitimacy, grievances, and activations related to each of the five institutions. Thus, for the initial COIN Model, each civilian has five perceptions of legitimacy
11 “Sahwa” is an Arabic term meaning “awakening”. We use the term “Sahwas” to refer to the
Awakening Councils, meaning the concerned local citizens (CLC) who are against Al-Qaeda. 12
The term “institution” seems appropriate since in the social sciences institution can refer to any type of entity. According to Talcott Parsons, “Th[e] body of rules governing action in pursuit of immediate ends in so far as they exercise moral authority derivable from a common value system may be called social institutions.” (Parsons, 1937, 1961, p. 407)

3-2
© 2010 The MITRE Corporation. All rights reserved.
(L1, L2, L3, L4, and L5) corresponding to the five institutions13. Similar to Epstein’s model of civil violence, at the beginning of the scenario run, random draws from U(0,1) are performed for each civilian to determine their initial individual perceptions of the legitimacy for each of the five institutions. These random draws are done only for the initial instantiation of the civilian perceptions of the five legitimacy vectors. As the COIN Model is executed, the perceptions of legitimacy become endogenous to the model (see Section 4.4). Note, however, that if a civilian has a job that is tied to a specific institution (see Section 3.3), the random draw for that civilian’s perception of the legitimacy of that institution is rigged to be biased towards being Pro- that institution. This was done to ensure that the majority of civilians that were given a specific job title at the beginning of a run had activation values along that job’s institutional vector that aligned positively with their job. See Appendix D Section D.2.1.4.1 for a discussion of rigged legitimacy.
In the COIN Model the civilians experience hardship and their hardship value is used along with their perceptions of legitimacy to determine their grievances associated with the five institutions (G1, G2, G3, G4, and G5), where Gi= H (1 – Li).
While the civilians in the COIN Model have a vector of grievances associated with the vector of institutions, the civilians still retain a single risk aversion value (R) that they use in their calculation of net risk. “‘Risk aversion’ is a dimension of a construct addressed in literature as ‘risk attitude.14 An individual having a constant risk attitude from one decision to another is in line with the classic approach of expected utility theory15. Individuals will differ in their risk attitudes from each other, but evidence shows that individuals tend to be risk averse when the stakes are high (which they are in the case of a counterinsurgency) and risk seeking when stakes are low16. The COIN Model thus keeps risk aversion heterogeneous across all civilians. However, unlike Epstein’s civil violence model, which used a random draw for risk aversion from a U(0,1) distribution, the COIN Model uses a random draw from a distribution that is skewed towards being risk averse. Currently the COIN Model uses a random draw from a triangular distribution (0,1) with a bias of 1.0 as indicated in Figure 3-1.
13 The Iraqi Government is not endogenous to the model. The IA and the IP institutions, which are
distinct from each other, are proxies for the Iraqi Government. Thus, in the COIN Model we have a vector of five perceived legitimacies corresponding to the five institutions (Coalition, IA, IP, Sahwas, and Foreign Fighters).
14 Turnley, Jessica. (June 2008) Measuring Risk Attitudes. [This is a white paper that was developed
for this project and is included in Appendix F.] 15
Von Neuman, J. and Morgenstern, O. (1947) Theory of games and economic behavior, 2nd ed. Princeton, NJ: Princeton University Press.
16 (Turnley, Measuring Risk Attitudes, June 2008).

3-3
© 2010 The MITRE Corporation. All rights reserved.
Figure 3-1. Depiction of 10,000 Randomly Produced Draws From a Triangular Distribution With Bias Toward 1.0
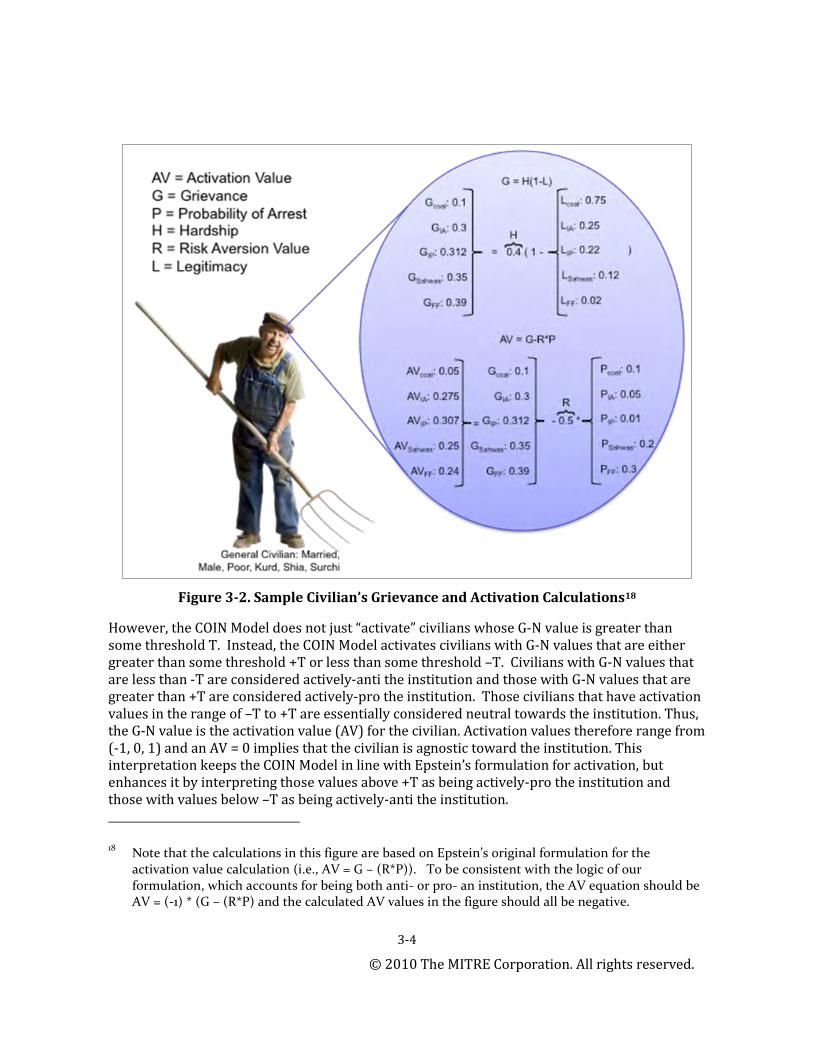
Similar to Epstein’s model of civil violence, a civilian’s net risk for a given institution i is: Ni = R * Pi. However, in the COIN formulation of Pi: Pi = 1 – exp [-k * floor (Ci/Ai)v], the term Ci is the total number of institution members within the calculating civilian’s vision and the term Ai is the number of civilians within the calculating civilian’s vision that are actively-anti the specified institution. Since the civilians have a vector of legitimacies and a vector of net risks for each of the five institutions, the civilians also have a vector of activation values (AV1, AV2, AV3, AV4, and AV5). Additionally, “active” connotes not only “actively rebelling against an institution”, but also “actively engaged for an institution”. These two types of activations will be referred to as “actively-anti” and “actively-pro” throughout the remainder of this document. To determine whether a civilian is actively-anti or actively-pro a specific institution, the COIN Model uses Epstein’s calculation of grievance and net risk, such that: AVi = -1 * (Gi - Ni) 17. See Figure 3-2 for a depiction of a sample civilian’s perception calculations.
17 Note that while we have kept the format of the activation equation the same as Epstein’s
formulation, we have changed the sign of the activation value by multiplying by -1. This was done because from an intuitive standpoint, it seemed to make more sense that a negative number would indicate rebellion or being actively-anti an institution and a positive number would indicate being actively-pro an institution.
0
25
50
75
100
125
150
175
200
225
0.0
00
.04
0.0
80
.12
0.1
60
.20
0.2
40
.28
0.3
20
.36
0.4
00
.44
0.4
80
.52
0.5
60
.60
0.6
40
.68
0.7
20
.76
0.8
00
.84
0.8
80
.92
0.9
61
.00
Fre
qu
en
cy
Risk Aversion Value
3-4
© 2010 The MITRE Corporation. All rights reserved.
Figure 3-2. Sample Civilian’s Grievance and Activation Calculations18
However, the COIN Model does not just “activate” civilians whose G-N value is greater than some threshold T. Instead, the COIN Model activates civilians with G-N values that are either greater than some threshold +T or less than some threshold –T. Civilians with G-N values that are less than -T are considered actively-anti the institution and those with G-N values that are greater than +T are considered actively-pro the institution. Those civilians that have activation values in the range of –T to +T are essentially considered neutral towards the institution. Thus, the G-N value is the activation value (AV) for the civilian. Activation values therefore range from (-1, 0, 1) and an AV = 0 implies that the civilian is agnostic toward the institution. This interpretation keeps the COIN Model in line with Epstein’s formulation for activation, but enhances it by interpreting those values above +T as being actively-pro the institution and those with values below –T as being actively-anti the institution.
18 Note that the calculations in this figure are based on Epstein’s original formulation for the
activation value calculation (i.e., AV = G – (R*P)). To be consistent with the logic of our formulation, which accounts for being both anti- or pro- an institution, the AV equation should be AV = (-1) * (G – (R*P) and the calculated AV values in the figure should all be negative.

3-5
© 2010 The MITRE Corporation. All rights reserved.
Note that a civilian’s calculation of those that are actively-anti an institution (Ai) is fairly straight forward for the IA, IP, and Sahwa institutions. For each of these three institutions, Ai consists of the number of civilians with “general citizen” or “Trouble Maker” jobs that are actively-anti the institution. The calculation of those that are actively-anti either the Coalition or the Foreign Fighters is slightly different since being actively-pro one of these institutions is actually actively-anti the other institution. Thus, when a civilian is determining its probability of arrest by the Coalition institution, Ai consists of the sum of the number of civilians with a “general citizen” job that are actively-anti the Coalition, the number of civilians that are active in their jobs of “Insurgents” and “Red HUMINT”, and the number of “general citizen” civilians who are pro-foreign fighters. Similarly when a civilian is determining its probability of being detained by the Foreign Fighter institution, Ai consists of the number of civilians with the “general citizen” or “Trouble Maker” jobs that are actively-anti the Foreign Fighters, the number of civilians that are active in their jobs of “Blue HUMINT” and those “general citizen” civilians who are pro-Coalition.
In the COIN Model, it was decided that the activation threshold values (+T and –T) will be heterogeneous across the civilians. This decision can be supported by behavioral decision research which suggests “that different responses to the same decision are a function of far more complex factors than just risk attitude”19 and that it is driven by “the perceptual, cognitive, and learning factors that cause human decision behavior to deviate from that predicted by the normative ‘economic man’ model.”20 In the current COIN Model, each civilian’s upper threshold (+T) is drawn from the range (0.05, 0.15) and this range was based on Epstein’s choice of 0.1 as the threshold value used for his civil violence model21. For the sake of model simplicity, a civilian’s lower threshold (-T) is set as the symmetrical opposite of the upper threshold: -T = -1 * (+T). It was decided that these upper and lower thresholds would be held constant over the course of the run for the civilians. Additionally, a civilian uses their threshold values for all five activation vectors.
However, it is envisioned that the civilians’ upper and lower thresholds could change over the course of the run and would be tied very closely to the civilians’ perception of the legitimacy of the institution – thus the civilians could have different threshold values associated with the five different activation vectors . We are postulating that not only would a civilian’s perception of the legitimacy of an institution attenuate their grievance towards that institution since G = H (1-L), but also that a civilian’s perception of the accepted legitimacy of an institution would allow that civilian to tolerate certain levels of short-term procedural injustice on the part of individuals associated with that institution without calling the entire system into question.22 23
19 (Turnley, Measuring Risk Attitudes, June 2008, p. 4).
20 Payne, John W., Bettman, James R. and Johnson, Eric J. (1992). Behavioral Decision Research: A
Constructive Processing Perspective. Annual Review of Psychology, 43, pp.87-131. (p.88). 21
(Epstein, 2002, p. 7245). 22
KA Hegtvedt and C Johnson. (2000) Justice beyond the individual: a future with legitimation. Social Psychology Quarterly. Vol.63. Pp.343-366. p.306.
23 Turnley, Jessica. (August 2008) Legitimacy and Power. [This is a white paper that was developed for
this project and which is included in Appendix F.]

3-6
© 2010 The MITRE Corporation. All rights reserved.
Note that currently no experimentation has been done with respect to allowing civilians to have different thresholds values associated with the five different activation vectors; nor has there been any experimentation of allowing the upper and lower thresholds to change over the course of the run. We are just suggesting that these might be areas for experimentation.
3.3 Jobs of the Civilians Actors There has been much discussion as to how the initial distribution of civilians amongst the “job” categories should occur. The current version of the COIN Model has jobs that are hard-coded at the onset of a run24. Each job is tied to a specific institution and civilians will only be active in their job if their activation value is actively-pro the specified institution. For example, civilians that have an IA job are only concerned with their IA activation value when determining whether they will be active in their job or not. Those IAs whose IA activation value is actively-pro will act as enforcers (i.e., similar to Epstein’s ‘cops”) and will look to arrest foreign fighters and insurgents. Note that we still allow all of the activation values to vary over the course of a run in the current version of the model, and if these activation values are actively-anti a given institution they can “rebel” against the institution.
This brings up an issue however with the civilians that have a “general citizen” job. There is no activation value related to the “general citizen” job. The suggested solution for the current version of the COIN Model is that these civilians will not really behave in any manner other than to “help” other activated agents in determining their net risk. Thus, when civilians with jobs other than “general citizen” are assessing their net risk (N), they will include in their assessment the actively-anti activation values of the nearby civilians with “general citizen” jobs. Table 3-1 below summarizes the activation values that are used in the current version of the model to determine whether the civilian is active or not in his job. Note that the actual behavior for each of the jobs has yet to be finalized.
24 See Appendix C’s End Note on Jobs of the Civilian Actors for a discussion of additional options
that are being explored.

3-7
© 2010 The MITRE Corporation. All rights reserved.
Table 3-1. Activation Values Used for Determining a Civilian’s Behavior in Their Job
Activation Type:
Job Categories:
IA IP Sahwa Blue HUMINT
Red HUMINT
Trouble Maker
Insurgent General Citizen*
ILG**
IA Pro
Anti Anti or Pro
Pro
IP Pro Anti Anti or Pro
Pro
Sahwa Pro Anti Anti or Pro
Coalition Pro Anti Anti or Pro
Foreign Fighter
Pro Pro Anti or Pro
Anti
*In the current version of the COIN Model, as discussed above, the “general citizen” civilian does not behave in any specific manner, but is used by the other civilians in their calculations of net-risk. Note that if a “general citizen” is actively anti- or pro- on multiple activation vectors, all of its actively-anti or actively-pro values can be used in other civilians’ net risk assessments. In a future version of the COIN Model, the strongest activation value could be used to determine which activation would govern a general citizen’s behavior and to allow all civilians to self-assign their job. ** We wanted to include Iraqi Local Government officials in the COIN Model so they could be specific targets for the foreign fighters and insurgents. For simplicity sake the current version of the COIN Model ties the Iraqi Local Government Official job to the foreign fighter vector. The assumption is that a civilian who is active in their ILG job would be actively-anti the foreign fighter institution. We realize that this is a strong assumption and, therefore, requires further investigation. However, since individuals, who are Iraqi government representatives in the AOI, are not paid well and are often targeted by the foreign fighters and insurgents, we felt this assumption provided a good and simple starting point. Additionally, in order to get at the idea that the ILG job must also believe that the Iraqi Government is legitimate, we tied the Iraqi Local Government job to being not only anti- the foreign fighter vector, but also actively pro- either the IA or the IP vector.
In the current COIN Model, civilians may change jobs over the course of a run. The current model is run for a period of six weeks and after two weeks have passed, a civilian may decide to change jobs if they have been inactive in their job for the entire two-week period. After two weeks have passed during the model run, those civilians who do not have a “Trouble Maker” job are given an opportunity (on an expected value of once per day) to decide whether to change their jobs. Trouble makers are fixed for a given run – they are not allowed to change jobs and no other civilians are allowed to become a trouble maker.
The civilians that have an opportunity to decide whether or not to change their jobs will make that decision based on their job activity level over the past two week period of time. Those civilians who have jobs that are not General Citizen or ILG will decide to change jobs if they have been completely inactive in their job for a full two weeks and have been actively-anti- the institution associated with their jobs for those two weeks. For example, an civilian with an IA job would need to be actively-anti the IA institution for the two week period in order to change to a different job.

3-8
© 2010 The MITRE Corporation. All rights reserved.
Those civilians with an ILG job decide to change jobs in a similar manner; however, since the ILG job is tied to being actively anti- the foreign fighter institution, a civilian with an ILG job will change jobs if they have been actively-pro the foreign fighter institution for the two week period. Those civilians with a General Citizen job will decide to change jobs if their activation values indicate that they would have been active in another job every day of the last two weeks.
In any case, once a civilian has decided that they need to change jobs, the civilians will check to see which of their activation values have been active consistently for the last week and the highest activation value will be used to determine the job change according to the following reasoning:
If active-Pro IA, will change job to be IA. If active-Pro IP, will change job to be IP. If active-Pro Sahwa, will change job to Sahwa. If active-Pro Coalition, will change job to Blue HUMINT. If active-Pro FF, will change job to either Red HUMINT or Insurgent with a 50-50
probability between the two jobs. If active-Anti FF and either active-Pro IA or active-Pro IP, will change job to Iraqi Local
Government Official. If have been inactive in their job for two weeks and have not been consistently active-
Pro any of the five institutions, then will change job to General Citizen.
3.4 Behaviors of Coalition and Foreign Fighters The Coalition forces with a role of enforce will act similar to the simple NetLogo Rebellion model cops in that they will jail any civilians that are actively against the Coalition forces. Further, the idea of enforcement in Epstein’s model has been extended to include misidentifying rebellious civilians and also occasionally killing civilians during the arresting procedure. This idea is explained more fully in Appendix D: Key COIN Model Parameters. Similarly, the foreign fighters that have a role of kidnap act similar to the Coalition forces that have a role of enforce and they are allowed to capture any civilian that is actively against the foreign fighters. The foreign fighters also have the capability of misidentifying civilians as being actively against the foreign fighters and have the capability of killing civilians during their kidnapping act.
Those Coalition forces with the role of patrol conduct a patrol of an area looking specifically for bombers, IEDs, and bomb-making facilities (referred to as caches for the remainder of this document). Coalition forces that have a role of convoy travel through the terrain along specified convoy routes. Their only behavior is to travel through the terrain to be observed and targeted by the foreign fighters.
The foreign fighters with the bomb maker role create IEDs, while the foreign fighters with the bomber role emplace and set off the IEDs. The foreign fighters with a cache role are a repository for the bombs being made by their bomb maker(s).

3-9
© 2010 The MITRE Corporation. All rights reserved.
A more complete discussion of the patrol, convoy, bomber, cache and bomb maker behaviors is provided in Appendix D.
3.5 Behaviors of Civilians In the current version of the COIN Model, we have defined a time step as being one minute in length to account for both the kinetic and social interactions in a meaningful manner. As a result, we have altered the movement behavior of all agents that move “by foot” – to include the civilians and the Coalition enforcers and foreign fighter kidnappers. Thus, unlike the NetLogo Rebellion model’s civilians, multiple agents in the COIN Model can occupy the same grid-square and those agents that move “by foot” will move a random distance of two grid-squares at most25. Civilians who move “by foot” will move with an expected value of once every two minutes, while Coalition forces and foreign fighters who move “by foot” will move with an expected value of once every one and one-third minute.
In the current version of the COIN Model, all civilians have the same rebellious behavior as the simple NetLogo Rebellion model’s civilians – that is, they will decide to actively rebel if appropriate against a specific institution. However, unlike the simple NetLogo Rebellion model, since we have defined a time step as being one minute in length, the COIN Model allows the civilians to determine whether they will rebel or not with an expected value of twice per day.
In addition to the behavior of rebelling, civilians who have jobs other than “general citizen” have actions associated with their jobs and, if the civilians are actively-pro the institution associated with their job, they will be perform the action associated with their job. Currently, the civilians with jobs of IA and IP have the role of “enforce” and can act similar to the simple NetLogo Rebellion model cops in that they can perform the behavior of jailing other civilians that are actively rebelling against the IA and IP institution respectively. The civilians with a Sahwa job are allowed to perform the behavior of killing other civilians that are actively rebelling against the Sahwa institution. This is based on data from the AOI that indicates that the Sahwas are armed and while they do not “arrest” other civilians, they do occasionally kill other civilians. The civilians with the Trouble Maker and Insurgent26 jobs can perform a behavior similar to that of jailing in that they are allowed to capture/kidnap other civilians. Similar to the Coalition forces and foreign fighters, the civilians who can arrest/kidnap also have the capability of misidentifying “rebellious” civilians and have the capability of killing civilians during their arresting/kidnapping act. Please see Appendix D Section D.2.1.12.1 for further details on the implementation of the jailing/kidnapping behaviors.
25 The current COIN Model has the civilians randomly milling about the terrain space, although they
mostly stay in their geographic neighborhood. It is envisioned that, as the COIN Model is improved upon, civilians will no longer move at random but will purposefully move according to daily activities – such as going to/from from home, the market place, school, religious centers, etc.,.
26 Civilians with the Insurgent job actually fall into one of two categories: (1) kidnappers and (2)
bombers. The civilian insurgent bombers are those civilians with the Insurgent job that have high pro-FF activation values; the remaining civilians with the Insurgent job are classified as “kidnappers”. The Insurgent “Kidnappers” are the civilians that are allowed to perform the behavior similar to jailing discussed in this paragraph.

3-10
© 2010 The MITRE Corporation. All rights reserved.
Note that the civilians with the Insurgent job, whose activation values on the foreign fighter vector are high, will emplace bombs. The civilians with the Blue HUMINT job currently provide reports on the locations of caches to Coalition forces, while those with Red HUMINT jobs report the location of Coalition patrols and convoys to the bombers. Please see Appendix D Section D.2.1.12 for further details on the implementation of the Insurgent Bomber, Blue HUMINT and Red HUMINT behaviors.
In the current COIN Model, the civilians with the “general citizen and the ILG jobs perform no action other than rebelling against a specific institution if appropriate. However, they can be used by other civilians in those civilian’s calculation of net-risk for rebelling against a specific institution.
Note also that the active ILG civilians are specific targets for the foreign fighter enforcers and the active insurgent enforcers. The foreign fighter and insurgent enforcers will first target the ILG for kidnapping and assassination; if there are no ILG within the foreign fighter or insurgent area of operation, the foreign fighter and insurgent enforcers will focus their attention on other civilians who are actively anti- the foreign fighter institution.

4-1
© 2010 The MITRE Corporation. All rights reserved.
4 Additional Functionality
This chapter describes a number of additional features that we added to the Epstein model, such as socio-cultural attributes, relative hardship, and interactions between socio-cultural groups.
4.1 Identity Groups and Social Groups The first major departure from Epstein’s civil violence model is that the civilians are given attributes/traits that further define them as individuals. In the current COIN Model, there are six attributes/traits: ethnicity, tribal affiliation, religion, gender, marital status and wealth. (Appendix D Section 2.1.2 discusses these attributes in more detail.) The different combinations of these traits results in unique identity groups and the COIN Model will have the civilians interact with their identity group. In the current COIN Model the identity group is based on shared traits.27
The second major departure from Epstein’s model is the idea that in addition to having an identity group, the civilians also have a social group with which they interact. A civilian’s social group is based on its familial ties and is therefore tied to tribal affiliations and the geographical location of the civilian. It should be noted that introducing the ideas of social group and identity group interactions adds another dimension to Epstein’s model in that the civilians will not only have geospatial interactions based upon their vision (v), but also will interact in a non-geospatial manner. More detail on both identity group traits and the social group structure is provided in Appendix D Sections 2.17 and 2.1.8.
We have been discussing homophily and how it should affect the manner in which Identity Groups and Social Groups are formed. There are two types of homophily – status and value. Status homophily is objective in nature, meaning there is no value judgment/emotion tied to the degrees of “likeness”. Value homophily, however, is subjective in nature and is based on similarities that are tied to value, attitudes, and beliefs. According to Identity Theory28 29, identity groups are role-based, i.e., they are based on a set of expected behaviors; Social Identity Theory30 suggests that Social (Identity) Groups are affective in nature. Thus we believe that in
27 Identity groups are not well understood and they can be based on different attributes depending
on the situation/culture, etc. Since we have been unable to determine an initial ranking of the attributes as to their relative importance in forming an identity group, we have decided that ALL six attributes will be used initially to form the identity groups. This way we are not claiming to have knowledge as to what is/is not important but we also have the hooks in place to create identity groups. Then if at some future point, a psychology and Iraqi expert can specifically identify the important attributes, it can be implemented.
28 Stryker, Sheldon. (1968) Identity Salience and Role Performance. Journal of Marriage and the
Family . 4, pp. 558-564 29
Hogg, Michael A., Deborah J. Terry and Katherine M. White. (1995) A Tale of Two Theories: A Critical Comparison of Identity Theory with Social Identity Theory. Social Psychology Quarterly 58 (4), pp. 255-269.
30 Hogg, et.al.

4-2
© 2010 The MITRE Corporation. All rights reserved.
the future the COIN Model should base the Identity Groups on status homophily traits (e.g., gender, marital status, and wealth) and the Social Groups should be based on value homiphily traits (e.g., tribe, ethnicity, and religion). This is expected to be incorporated in FY10.
4.2 Relative Hardship
The third departure from Epstein’s model is related to Epstein’s idea of perceived hardship, which is perceived physical or economic deprivation. Research on relative deprivation indicates that a person’s hardship would be a function of the distance between that person’s own perceived level of hardship and the perceived hardship of those with which the person interacts31. Further, research has shown that temporal relative deprivation has often been cited by social scientists as the stimulus for violent social movements such as insurgencies or civil war, or for socially deviant behavior such as crime.32 33 As a result of this research, the COIN Model has the concept of both perceived hardship and relative hardship.
In the COIN Model, perceived hardship is the civilian’s initial perception of its hardship based on what the civilian has experienced. At each time step in the model, agents may experience a set of events (good and bad), and the effect that these events have on a civilian’s perceived hardship will be added to (if positive) or subtracted from (if negative) an unbounded perceived hardship measure. This will give the civilian a weak experiential memory of his perceived hardship. Note that events are not “played” in the current version of the COIN Model. In the current version, at the beginning of the scenario run, the civilians draw a perceived hardship from a normal distribution with a mean of 0.5 and standard deviation of 0.1667.
Throughout the model run, the civilians will compare their perceived hardship to the perceived hardship of others in their social and identity groups. These interactions are passive in nature and involve an individual assessing their environment and their own personal situation to others’ situations, resulting in an individual’s perception of their relative hardship – i.e., their hardship relative to their social and identity groups.
4.3 Hardship Interactions between Identity Groups and Social Groups
A civilian may interact with its social group and/or its identity group and compare its perceived hardship with the social group member’s hardship or the identity groups’ average hardship, respectively34 35. In the model, a civilian will interact with one member of its social group with
31 Runciman, Walter Garrison (1966) Relative deprivation and social justice : a study of attitudes to
social inequality in twentieth-century England, University of California Press. Berkeley, CA. 32
Merton, Robert K. (1938) Social Structure and Anomie. American Sociological Review, 3 pp 672-82. 33
Gurr, Ted Robert. (1970) Why Men Rebel. Princeton University Press. Princeton, NJ. 34
It should be noted that all civilians except those with the Trouble Maker job are allowed to interact and affect each other’s hardship. Since the Trouble Makers are those civilians that are fomenters of criminal activity/ instability but the trouble that they create is not related to an insurgency, the current COIN Model does not allow them to affect others’ perceived levels of hardship; nor do other civilians affect the Trouble Maker’s perceived level of hardship.

4-3
© 2010 The MITRE Corporation. All rights reserved.
an expected value of once every 45 minutes and will interact with its entire identity group with an expected value of once per week.
When the civilian interacts with a single member of its social group, the civilian compares its perceived hardship to the perceived hardship of that social group member. This interaction will result in the two civilians adjusting their perceived hardship based on the concept of “gruntlement”36 37 to come up with their own relative hardship value. The civilians that are interacting apply the gruntlement scale and their hardship values may become more alike. (See Appendix D Section D.2.10 for the details on how gruntlement has been coded within the COIN Model for adjusting the civilian hardship levels.) For model book-keeping purposes, as soon as an individual has a new relative hardship value based on an interaction with a member of their social group, the average of their Identity Group’s hardship is automatically updated.
When the civilian interacts with its identity group, the civilian compares its perceived hardship with the average hardship experienced by its entire identity group. In doing so, the civilian comes up with a new relative hardship value which is the average of its own perceived hardship and the average hardship of the identity group:
relativeHardship = (perceivedHardship + idHardship)/2.0;.
The civilian’s relative hardship value is the hardship value (H) that will be used to calculate the vector of grievances for the civilian.38 Also, note that this relative hardship value is set as the civilian’s perceived hardship value for the next time step.39
4.4 Activation Level Interactions Between Two Civilians “On the Street” (i.e., Between Neighbors)
In addition to interacting with social groups and identity groups, the COIN Model assumes that the civilians will also interact with other civilians that they encounter on the street – i.e., bump into during their daily activities in their local neighborhood40. This is a fourth major departure from Epstein’s model. This neighborhood interaction results in the exchange of information
35 Further note that in the current COIN Model, jailed and kidnapped civilians may still continue to
interact with their social group and their identity group, as it is assumed that they will have some sort of contact with these groups. This is supported by anecdotal evidence from the field.
36 Turnley, Jessica. (2004). Emotional and attitudinal convergence.
37 See Appendix E for the J. Turnley Emotional and attitudinal convergence paper.
38 Note if we decide that grievance can and should range from -1 to +1, we would not need to change
the bound on the relative hardship from (0,1) to (-1,1). 39
Since civilians with the Trouble Maker job are not allowed to interact and affect other civilians’ hardships, nor do they have their own hardship adjusted, their relative hardship value is set to be equivalent to their perceived hardship value. This allows them to still calculate their own grievance and activation values for purposes of determining their own behavior.
40 Note that since civilians are instantiated in a local geographic area that is biased by tribal
affiliation, their interaction with their neighbors will essentially include their family members.

4-4
© 2010 The MITRE Corporation. All rights reserved.
relative to the activation levels of the civilians41. During the simulation run, civilians will bump into their neighbors with an expected value of once every half an hour if they are in an urban area and once every hour if they are located in a more open area. The probability that these neighbors will actually interact with each other if they do bump into each other on the street is based on Carley’s equation for relative similarity42. Carley’s relative similarity approach is based on similarity in Euclidean space and the probability of interaction between two individuals is predicted in terms of relative similarity. Thus in the COIN Model, the probability that civilian i will interact with civilian j is a function of how many traits i and j share relative to the number of traits that i shares with each member of the local civilian population. For purposes of the COIN Model, we will define i’s “local civilian population” as those civilians that are within civilian i’s vision. Recall that since a civilian’s vision is limited, the information a civilian receives based on its vision is local situational awareness – thus similar to the determination of the probability of arrest as discussed in Chapter 2: The Underlying Civil Violence Model, the probability of a neighbor interaction also is based upon the civilian’s local environment and therefore its local situational awareness. See Appendix D Section D.2.1.9 for the details on how Carley’s relative similarity approach has been used within the COIN Model.
Once a civilian determines that he will interact with another civilian, the civilians exchange information on their activation levels. Essentially they discuss how engaged they are with respect to being active. This exchange of information on their attitudes toward the various institutions incorporates the idea of “gruntlement”43 44. The civilians that are interacting apply the gruntlement scale and may become more alike. See Appendix D Section D.2.1.10 for the details on how gruntlement has been coded within the COIN Model for the civilian activation levels.
Additionally, based on research on the affective dimension of engagement in political processes45, the COIN Model incorporates the idea of impressionability46 as a way to “flip” civilians from one extreme position to another. The idea of using an impressionability parameter is based on work by Duncan Watts and Peter Dodds that has found that “under most conditions…large cascades of influence are driven not by influentials, but by a critical mass of
41 It should be noted that all civilians except those with the Trouble Maker job are allowed to interact
and affect each other’s hardship. Since the Trouble Makers are those civilians that are fomenters of criminal activity/ instability but the trouble that they create is not related to an insurgency, the current COIN Model does not allow them to affect others’ perceived levels of hardship.
42 Carley, Kathleen . (1991) . A Theory of Group Stability. American Sociological Review, 56 (3), pp 331-
354. 43
Turnley, Jessica. (2004). 44
See Appendix E for the J. Turnley Emotional and attitudinal convergence paper. 45
Granbert, Donald and Brown, Thad. (1992). The Perception of Ideological Distance. The Western Political Quarterly , 45 (3), pp 727-750.
46 We are currently reviewing literature on “persuasion” to come to some understanding of the
interdependence of affect and cognition and the role each plays in the “flipping” of one’s extreme position to another extreme position. See End Note on Persuasion in Appendix C.

4-5
© 2010 The MITRE Corporation. All rights reserved.
easily influenced individuals”47. The impressionability value is heterogeneous across all civilians and is drawn from a normal distribution with a mean of zero and a standard deviation of 1. Thus, the majority of the civilians are relatively neutral in their ability to be influenced, while some civilians have impressionability values greater or equal to 1 and some civilians have impressionability values less than or equal to -1. Impressionability values greater than or equal to 1 will indicate highly impressionable/ easily influenced individuals, and values less than or equal to -1 will indicate individuals who are obstinate in their opinion. Highly impressionable civilians are those individuals that have the capability of having their extreme activation value flipped to the opposite extreme. “Obstinate” civilians will totally ignore the civilians with which they interact in the local environment and their activation values will never be adjusted via an encounter with a neighbor.
Thus, in the COIN Model in the determination of how civilians will interact with each other on the street (i.e., their local environment), the Carley equation determines whether the civilians actually bump into each other and converse. Then, a combination of “gruntlement” and impressionability determine the effects of that interaction. If civilian i does interact with civilian j and i is obstinate, anything j says is discounted by i. If i’s impressionability lies in the larger neutral persuasion region, the gruntlement scale determines how the activation values for i and j are adjusted. If i is highly impressionable and the following two items are true: (1) i has an extreme activation value and (2) the activation values for i and j lie on opposite sides of the activation scale, then i will be flipped to the opposing view (i.e., to j’s side of the activation scale) and i will be just as extreme as he was in his original view.
The civilians’ activation sequence within the COIN Model is as follows48:
Having civilians adjust their perceived hardships based on their affective ties (i.e., their social group and identity group)
Using civilian’s perceptions of legitimacies (i.e., beliefs) to determine their activation levels for each activation type, and
Having the civilians adjust their activation levels (behaviors) and adapt based on their local environment.
Note that if the civilians adjust their activation levels based on their local environment, the model backs out the Grievance value associated with the new activation value. To do this we assumed that there are no “cops” in the area and the net risk is therefore zero. This reduces our Chapter 3 equation for the activation value from AV = -1 * (G- N) to AV = -G. Thus, grievance is just the negative of the activation value. Then, since the civilian’s hardship has already been
47 Watts, Duncan and Peter Dodds. (2007). Influentials, Networks, and Public Opinion Formation.
Journal of Consumer Research. 48
There has been much debate in psychology and the behavioral science literature as to the relationship between cognition and emotion/affect. We have chosen this activation sequence based upon R.B. Zajonc’s position that “affect and cognition are separate and partially independent systems and that, although they ordinarily function conjointly, affect could be generated without a prior cognitive process.” (from page 117 of: Zajonc, R. B. (1984). On the Primacy of Affect. American Psychologist, 39, 117-123)

4-6
© 2010 The MITRE Corporation. All rights reserved.
determined and is used across all activation values, the civilian’s perception of legitimacy must be changed to account for the new activation value and its associated grievance. This makes legitimacy endogenous to the model.
In addition to civilians interacting directly with other civilians on the street, the civilians may also interact directly with the Coalition forces or foreign fighters49. As discussed above, events will occur that may adjust the civilians’ perceived hardships. Additionally, these events may affect the civilians’ perceptions of the legitimacy of the five institutions. In the current version of the model, events are not “played”, and the events need to be fleshed out more to determine what will be included50.
The COIN Model is a work-in-progress but the description provided in Chapters 2-4 of this report is the current state of the model. Appendix D provides some additional details on how specific parameters were instantiated within the current version.
49 Please see the End Note on Civilian-Coalition/Foreign Fighter Interactions in Appendix C.
50 Please see the End Note on Events in Appendix C.

5-1
© 2010 The MITRE Corporation. All rights reserved.
5 Simulation Approach for the COIN Model
Our basic simulation approach for the COIN Model uses open-source, non-proprietary development environments. We have conducted rapid prototyping of the COIN model formulation in the NetLogo51 environment, are working on a scalable version of the model formulation in Repast52, and have implemented a super-scalable version of a simple model in C++53 as a proof-of-concept. We have also been researching and working on how to:
Parallelize the simulations for computational experimentation, Best use high performance applications for computational efficiency, Improve upon random number generators, Devise an efficient algorithm for dynamic route planning, Conduct line-of-sight (LOS) calculations, and Handle data generation, data storage, and data analysis.
This chapter discusses all of these aspects in greater detail.
5.1 The Three Prototypes We have implemented three prototypes of the COIN Model, ranging from the NetLogo prototype with 103 “thick” agents to a super-scalable C++simulation with 108 relatively simply agents. The Repast simulation lies somewhere in between and is aimed at using agents that have near the same complexity as the NetLogo agents, but which operates at the JIEDDO challenge problem scale of 105 agents. Figure 5-1 provides an illustration of these three prototypes, along with their level of complexity and scale.
51 http://ccl.northwestern.edu/netlogo/
52 http://repast.sourceforge.net/
53 http://www.cplusplus.com

5-2
© 2010 The MITRE Corporation. All rights reserved.
Figure 5-1. Three Prototypes of the COIN Model
5.1.1 The NetLogo Prototype
Rapid prototyping of the model formulation has been conducted in NetLogo. The current NetLogo prototype has around 5000 total agents (3300 civilians, 809 Coalition forces that act as security forces, 25 Coalition patrol agents, 809 foreign fighters, 100 bombers, 50 caches, and 25 bomb makers). A single run encompasses 5 weeks of simulated time and runs in 9-11 hours of clock time when providing maximum output and in 4 hours when providing minimum output.
5.1.1.1 Initial NetLogo Prototype Results
Initial runs of the NetLogo prototype of the COIN Model have been performed providing the team with some initial results. A small sample of these results is provided here. The graphs below are box and whisker plots displaying mean values for 24 runs. Figures 5-2 - 5-11 display the trend of the mean values, the first and third quartiles of the results, and the smallest and largest values for each day modeled in the run. These graphs also display any outliners in the data. The red and blue lines represent the actual mean values from two simulation runs – these are the runs that had the minimum (blue line) and maximum value (red line) at the end of the run. These two lines provide an indication of whether the run exhibiting either the maximum or the minimum value at the end of the run was consistently at the high or low end during the run.
Figures 5-2 and 5-3 provide a sample of the kidnap and arrest results, respectively. These samples are for the mean number of General Citizens kidnapped and arrested.
Scale (Number of Agents)
NetLogo: 103 AgentsCOIN, C-IEDLaptop
C++: 108 Agents (Epstein, Civil Violence Agents)Computing Cluster
(multi-node, distributed memory)
101 103102 105104 106 107 108
Repast: 105AgentsCOIN, C-IEDHigh-End Workstation
(multi-core, shared memory)
Challenge Problem Scale
Degree of Complexity
Developmental Trajectory for Target Platform

5-3
© 2010 The MITRE Corporation. All rights reserved.
Figure 5-2. Mean Number of General Citizens Kidnapped for Each Day of the Run
Figure 5-3. Mean Number of General Citizens Arrested for Each Day of the Run

5-4
© 2010 The MITRE Corporation. All rights reserved.
Figures 5-4 -5-7 provide a sample of the perceived and relative hardships experienced by the civilians over the course of a run. Figure 5-4 displays the mean perceived hardship values of the civilians that have an Insurgent job, while Figure 5-5 displays the mean perceived hardship of the civilians that have an IP job. Figures 5-6 and 5-7 display the mean relative hardships for those same civilians.
Figure 5-4. Insurgents’ Mean Perceived Hardship for Each Day of the Run

5-5
© 2010 The MITRE Corporation. All rights reserved.
Figure 5-5. Iraqi Police’ Mean Perceived Hardship for Each Day of the Run
Figure 5-6. Insurgents’ Mean Relative Hardship for Each Day of the Run

5-6
© 2010 The MITRE Corporation. All rights reserved.
Figure 5-7. Iraqi Police’s Mean Relative Hardship for Each Day of the Run
The data set also contains several charts that display the mean activation values of the civilian agents for each of the five institutions. The data is displayed by job and activation value type (e.g., job type of IA and activation type of Coalition) for each day of the run. Figures 5-8 – 5-11 provide samples of these graphs.

5-7
© 2010 The MITRE Corporation. All rights reserved.
Figure 5-8. General Citizens’ Mean Daily Activation Values for the Coalition Institution
Figure 5-9. General Citizens’ Mean Daily Activation Values for the Foreign Fighter Institution

5-8
© 2010 The MITRE Corporation. All rights reserved.
Figure 5-10. Insurgent’s Mean Daily Activation Values for the Foreign Fighter Institution
Figure 5-11. Iraqi Army’s Mean Daily Activation Values for the Iraqi Army Institution

5-9
© 2010 The MITRE Corporation. All rights reserved.
A large amount of data has been collected on the civilians’ job changing actions. Figure 5-12 provides a sample data set of the number of job changes that occur in 24 runs of the NetLogo prototype. The top table provides the total number of job changes across the 24 runs and the bottom table provides the average number of job changes among the 24 runs.
Figure 5-12. Civilians’ Job Changes Over 24 Runs
The right side of Figure 5-13 is a visual display of the locations where IED explosions occurred during all 24 runs, while the left side of the figure depicts the NetLogo prototype’s terrain to provide a better feel for the lay-down of the IED explosions on the terrain.
Total Count Over All Runs
From: Gen Cit IP IA Sahwa BH Insurg RH ILGGen Cit 0 102 153 83 124 60 47 1314IP 297 428 0 13 12 9 7 121IA 381 0 612 17 18 10 10 173Sahwa 2 0 0 0 0 0 0 NABH 3 0 0 0 0 0 0 0Insurg 57 0 1 0 0 0 0 6ILG 321 8 10 4 10 1 0 0
Average Count Over All Runs
From: Gen Cit IP IA Sahwa BH Insurg RH ILGGen Cit 0.00 4.25 6.38 3.46 5.17 2.50 1.96 54.75IP 12.38 17.83 0.00 0.54 0.50 0.38 0.29 5.04IA 15.88 0.00 25.50 0.71 0.75 0.42 0.42 7.21Sahwa 0.08 0.00 0.00 0.00 0.00 0.00 0.00 0.00BH 0.13 0.00 0.00 0.00 0.00 0.00 0.00 0.00Insurg 2.38 0.00 0.04 0.00 0.00 0.00 0.00 0.25ILG 13.38 0.33 0.42 0.17 0.42 0.04 0.00 0.00
To:
To:

5-10
© 2010 The MITRE Corporation. All rights reserved.
Figure 5-13. Depiction of IED Explosions for 24 Runs
Note that the right side of this figure provides a sample of the type of visual display for IED location data that are being created for this study. Also it must be noted that for the 24 sample runs depicted in the figure, the number of bombers and the number of IEDs are greater than what might be found in the AOI. In the visual display, the IED explosions are denoted with colored dots that are on a red-white color spectrum scale. Red dots represent those areas that had the fewest IED explosions and white dots indicate the areas that had the most IED explosions.
5.1.2 The Repast Prototype
We also have been working on creating a more scalable version of the NetLogo prototype. In preparation for this portion of the effort, the team conducted an initial porting of a representation of Epstein’ civil violence model (the NetLogo simple Rebellion model) into a Repast representation. This porting was successful and we were able to prove numerical identity between the NetLogo Rebellion representation and the Repast Rebellion representation.
5.1.2.1 Initial NetLogo to Repast Porting Exercise
In conducting this exercise, we found that porting the NetLogo script to Java is relatively straightforward. Although there are many NetLogo primitives (e.g. ask, one-of, in-radius) that do not have a direct Java equivalent, suitable replacements can be found. Additionally, the programmatic flow of the Repast code can mimic the NetLogo code without too much difficulty. We learned, however, that the key to achieving numerical identity is through the synchronized usage of a common random number generator (RNG).
The NetLogo Java Application Programming Interface (API) contains a special implementation of the Mersenne Twister RNG that can be used by a Repast application. Obviously, to achieve numerical identity between NetLogo and Repast, they both must use the same RNG seed. From

5-11
© 2010 The MITRE Corporation. All rights reserved.
there, the Repast instance must make the same queries in the same order as the NetLogo instance. This is not straightforward and the rules governing the use of the RNG must be examined on a primitive-by-primitive basis. Appendix G contains a summary of the RNG synchronization that needs to be between NetLogo and Repast code bases to determine if they are numerically equivalent.
We have also gained knowledge on what is required for conducting parallel runs on a high-performance computing environment and this knowledge will be used once we have completed the serial runs using the large-scale Repast prototype.
5.1.2.2 Implementing the COIN Model in Repast
We currently are building a Repast prototype based on an early version of the NetLogo prototype of the model formulation. When running the Repast prototype at the same scale as the NetLogo prototype (i.e., simulating 5000 agents, 5 weeks of time, and providing minimum output), the Repast prototype initially took 28 hours of clock time to run on a single machine. We were able to reduce the clock time to be equivalent to the NetLogo time of 4 hours by optimizing a section of the runtime code.
With this last optimization, we also were able to scale the Repast prototype to the challenge problem size, meaning we can represent a population of 150,000 agents on a single computer processor without running out of memory. However, running the simulation on a single processor with 150,000 agents over 5 weeks of simulated time would take approximately 15 weeks of clock time. Obviously, this clock time is undesirable and we are continuing to optimize the Repast prototype and are developing a fine-toothed threading strategy to improve the run time.
5.1.3 The C++ Scalable Simulation of the Simple Rebellion Model
In order to determine how quickly scalability could be achieved, an implementation of the simple NetLogo Rebellion model in C++ was undertaken. This C++ implementation used only standard C++ libraries, which provide arrays, vectors, linked lists, maps, etc. Thus, the implementation promoted code re-use and inheritance. The implementation took less than 8 hours and started with the following items:
A simple scheduler class to schedule agent behavior, where agents are scheduled in a serial manner based on the order the agent was added to the scheduler. (This scheduler easily could be expanded.)
A simple parent agent class, where virtual functions force the derived classes to implement certain routines (e.g., step() and initialize()).
A two-dimensional (2D) grid class, which provides similar functionality to the Repast 2D grid class in terms of basic queries, calculating neighborhoods, etc.

5-12
© 2010 The MITRE Corporation. All rights reserved.
5.1.3.1 C++ Serial Results
The initial C++ implementation was performed on a single computer. Table 5-1 compares the performance of the NetLogo graphical user interface (GUI) version and the headless version of the simple Rebellion model with the C++ implementation of that model.
Table 5-1. Comparison of the Performances of the NetLogo and C++ Versions of the NetLogo Rebellion Model
Rebellion Model
Hardware Time Elapsed (s)
Number of Time Steps
Performance (Ticks / s)
NetLogo GUI Version
2.2GHz dual core Intel
2175 10000 4.6
NetLogo Headless Version
2.16 GHz quad core AMD
2327 10000 4.29
C++ 2.16 GHz quad core AMD
80.64 10000 80.64
Model execution occurred for a 20x20, 40x40, 100x100, 200x200, 400x400, 800x800, 1200x1200, and 1500x1500 grid with 70% initial civilian density and 4% initial cop density. Executing with 1.065 million agents consumed 3.0 gigabytes of random access memory (RAM) and 1.665 million agents consumed 4.7 gigabytes of RAM on drone1 of our high-performance computing cluster.
Figure5-14 highlights the linear relationship between the number of agents and the runtime and Figure 5-15 shows the runtime versus grid size.

5-13
© 2010 The MITRE Corporation. All rights reserved.
Figure 5-14. Number of Agents vs. Runtime for the C++ Prototype
Figure 5-15. Grid Size vs. Runtime for the C++ Prototype

5-14
© 2010 The MITRE Corporation. All rights reserved.
Figure 5-16 displays the number of civilians that have been jailed, are actively rebelling, and that are inactive for various grid sizes. The x-axis of each of the charts depicted in Figure 5-16 is the number of time steps and the y-axis is the number of civilians that are inactive (green line), jailed (blue line) or actively rebelling (red line). It is interesting to note that as the grid size increases and the number of civilians therefore increases, the “burstiness” behavior of the active rebellions is dampened.
Figure 5-16. Charts Depicted the Rebellious Behavior for the Serial C++ Implementation of the Rebellion Model for Various Grid Sizes
5.1.3.2 Parallel C++ Implementation and Results
Having completed the serial version of the C++ implementation of the simple Rebellion model, a scalable Rebellion model implementation was generated as a proof of concept. Scalable in the sense that more computer resources could be thrown at the problem to either solve a bigger problem or to solve the problem faster (to a point). The desire was to avoid the obvious limitation of storing global agent space on a single machine, which limits the number of agents, etc. that could be simulated.
For the parallel implementation, the serial C++ version was used as the code baseline, along with Local Area Machine/Message Passing Interface (LAM/MPI). Each LAM instance (typically

5-15
© 2010 The MITRE Corporation. All rights reserved.
a processing core) has independent memory space and message passing occurs between the instances to provide communication. Thus, the parallel implementation would not be limited to the number of cores or amount of memory on a shared memory machine. The basic LAM constructs are depicted in Figure 5-17.
Figure 5-17. Basic LAM/MPI Constructs
For the C++ Rebellion model parallelization construct, we chose to partition the global grid. A sub-grid is only stored locally on the node (i.e., no single machine stores all of the global agent space). Additionally, a sub-grid is responsible for all of the time step behavior of agents residing in the context. This was done by basing the agent step behavior (movement, updating attributes, and enforcement) entirely on a local neighborhood. Each sub-grid stores all relevant neighborhood information and the agent step behavior is based on the previous step state. Figure 5-18 illustrates the sub-grid notion.
Basic LAM/MPI Constructs
■ LAM assigns a unique identification number to each node (0 through m)– Designate 0 as the master node– Designate 1,…,m as the slave node
■ MPI_Send & MPI_Receive– Provides point to point communication between nodes– Able to send integers, floats, and characters
■ MPI_Bcast– Provides point to multi-point communication, in this instance
from one node to all other nodes– Need to investigate method to avoid at compile time setting the
length of the array to pass between nodes, inefficient

5-16
© 2010 The MITRE Corporation. All rights reserved.
Figure 5-18. Illustration of the Sub-Grids
Note that all state updates occur at the end of a step. A master/slave paradigm was used to keep track of the simulation run, meaning that a master node partitions the state space and directs work to the slaves and then the master node aggregates the statistics from the slaves.
To develop the process flow for the C++ Parallel Rebellion model, the states needed by other contexts had to be initialized and broadcast to those other contexts. In doing this, we wanted to avoid broadcasting information not needed by other contexts and aggregate as much of the data as possible. Thus, during each time step the following needed to be accomplished:
Initiate and complete step behavior within each context, Broadcast relevant neighborhood information to all contexts, Transfer contexts for certain agents near the boundary (i.e., the “pad, but these agents
only may be moved by the current context, Clear and update the pad, and Perform statistic aggregation on master node, such as the counts of the total number of
civilians actively rebelling, jailed, or quiet.
Figure 5-19 provides a graphical depiction of the process.
Illustration
5
1
3
2
4
1
3
2
4
Sub-grids (1,2,3,…) may only update the state of agents within their own context and they can only read information from other contexts.
Rebellion vision (pad)

5-17
© 2010 The MITRE Corporation. All rights reserved.
Figure 5-19. Illustration of the Parallel C++ Process
An experiment was conducted on the Parallel C++ Rebellion model on our high-performance computer cluster to demonstrate the performance of a ‘large-scale’ run (i.e., one with 166.5 million agents). The large scale run had a total wall clock time of 4.7 hours and used 36 slaves and 1 master. Information about 70,718,876 civilian agents and 4,377,625 cops was broadcast over the course of the simulation run. There appeared to be no obvious limitation beyond memory and the number of nodes on our cluster, thus the parallel C++ version could handle an even larger number of agents. Figure 5-20 depicts the results of the parallel run.
Initialization
1
3
2
4
Master
Broadcast
1
3
2
4
Master
Agent may be captured in multiple contexts but only can be controlled by the parent context
Move
1
3
2
4
MasterRegion of neighborhood influence
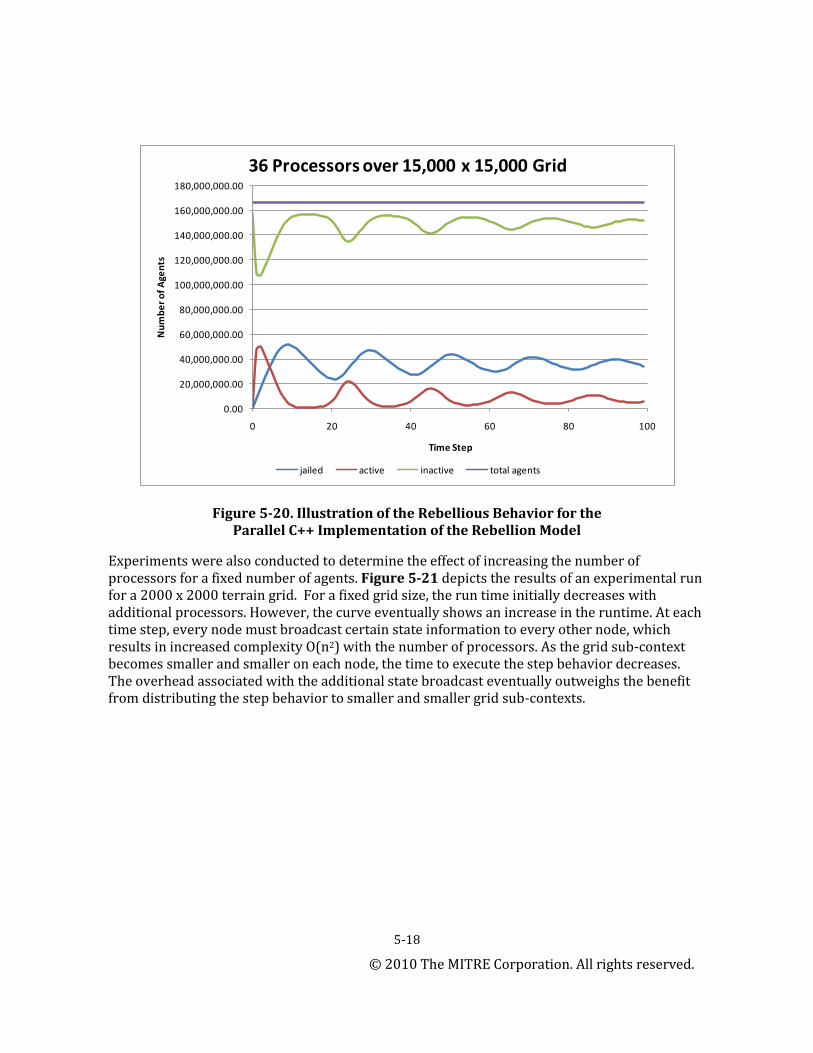
5-18
© 2010 The MITRE Corporation. All rights reserved.
Figure 5-20. Illustration of the Rebellious Behavior for the Parallel C++ Implementation of the Rebellion Model
Experiments were also conducted to determine the effect of increasing the number of processors for a fixed number of agents. Figure 5-21 depicts the results of an experimental run for a 2000 x 2000 terrain grid. For a fixed grid size, the run time initially decreases with additional processors. However, the curve eventually shows an increase in the runtime. At each time step, every node must broadcast certain state information to every other node, which results in increased complexity O(n2) with the number of processors. As the grid sub-context becomes smaller and smaller on each node, the time to execute the step behavior decreases. The overhead associated with the additional state broadcast eventually outweighs the benefit from distributing the step behavior to smaller and smaller grid sub-contexts.
0.00
20,000,000.00
40,000,000.00
60,000,000.00
80,000,000.00
100,000,000.00
120,000,000.00
140,000,000.00
160,000,000.00
180,000,000.00
0 20 40 60 80 100
Nu
mb
er
of
Age
nts
Time Step
36 Processors over 15,000 x 15,000 Grid
jailed active inactive total agents

5-19
© 2010 The MITRE Corporation. All rights reserved.
Figure 5-21. Number of Processors vs. Runtime for a 2000 x 2000 Grid in the Parallel C++ Version
The run time of the parallel C++ run increased linearly and was significantly better than the serial C++ version as indicated in Figure 5-22. Improvement over the serial version is obtained by not just having additional processors, but also by distributing the state space in memory to avoid swap file hits.
Developing the parallelized version of the C++ simple Rebellion model was more complicated than developing the serial version: the parallel version took five times as long to implement as the serial version and required two times the amount of source lines of code (SLOC). Note that in developing the parallel C++ version of the simple Rebellion model, no effort was made to formally validate the parallel C++ behavior against the original NetLogo implementation.

5-20
© 2010 The MITRE Corporation. All rights reserved.
Figure 5-22. Comparison of the Processing Time for the Parallel and Serial C++ Versions as a Function of the Number of Agents
5.2 Parallel Simulations for Computational Experimentation
5.2.1 The Infrastructure for Complex Systems Engineering (ICE)
In order to take full advantage of the power of agent-based models, we developed the Infrastructure for Complex-systems Engineering (ICE). The ICE is a collection of software tools, computational hardware, and methodologies that allow one to move from abstract thought experiments to “operational” testing and optimization of the system to be fielded. See Figure 5-23 for a depiction of the ICE.

5-21
© 2010 The MITRE Corporation. All rights reserved.
Figure 5-23. Infrastructure of Complex Systems Engineering (ICE) Diagram
As with most simulations, ICE starts with an assessment of what information about the system in question is currently known; this includes subject matter expert (SME) understanding of the components of the system and how they are interconnected, Measures of Performance (MOP) level data on the performance of the individual components (usually in isolation), etc. Once enough information is amassed about the system one moves to the prototyping stage. What constitutes an adequate prototype will be driven largely by what the system is and the questions to be asked about it. For example, if the prototype does not need to be overly large in scale (less than 10,000 entities) we have found NetLogo54 to be adequate in many cases. However, there are times when even the prototype must be very large scale. In those cases, we move to Repast55. Eventually as the prototype stabilizes, we typically port the NetLogo simulation to Repast for deployment on a high-performance cluster computer. Though Repast
54 (Wilensky)
55 North, M., et al. (2007). ROAD Map: Transforming and Extending Repast with Groovy.
Proceedings of the Agent 2007: Complex Interaction and Social Emergence Conference. North and Macal eds., Argonne National Lab, Chicago, IL.

5-22
© 2010 The MITRE Corporation. All rights reserved.
is more tightly integrated with our cluster computer, NetLogo also can be run on it and therefore if scale or high-performance is not a driving concern we may stay with a NetLogo-level prototype and not move to a Repast prototype. Thus, our approach uses NetLogo and/or Repast to handle the representation of the system as a whole.
Usually, however, there are components of the system that are of particular importance for producing an adequate formulation and simulation of said system. Often these high importance components are modeled separately at the highest resolution possible. These family of simulations can then be run together to represent the overall system. Consequently, our methodology employs detailed physical models and vetted behavioral models where possible. We also seek to provide realistic physical models of the geometry where that level of detail is important. In the case at hand, the COIN Model has separate modules dealing with line-of-sight calculation, dynamic path planning and random number generation.
Use of a cluster computing system allows us to scale very large and run many replicates of the simulation to perform Monte Carlo analysis of the model. Intelligent design of experiments is very important also, as the parameter space associated with these models can be nearly infinite. As part of the cluster computing system we have an automated genetic optimization framework (see Section 5.4.2.2). Optimization over a complex space requires a reasonable degree of verisimilitude.
5.2.2 Parallelization within the ICE
As part of our works towards parallelization of ABMs within the ICE, we have been looking into utilizing Terracotta (TC). TC is a Java library that enables the development of parallel applications spanning multiple distributed-memory nodes in a computing cluster. This is achieved at the byte code level, and enables multiple Java Virtual Machines (JVMs) spanning multiple machines to interoperate via a global heap. We were able to run TC programs on our high-performance computing cluster, but only as native TC applications; i.e., they are not integrated with any Repast simulations.
One of the confounding issues with integrating TC with Repast is the lack of control over the Java main program. This is, however, easily overcome via using the Eclipse TC plugin to configure a Repast application for execution as a TC application. The primary challenge with using TC is that the version of TC, which was current at the time of release of RepastS 1.1, was not well-suited to distributed programming in an ABM environment. This is due to the active-passive roots of Terracotta. The original target usage of TC was “active server/passive clients” in a web-server configuration. The newest version of TC has active-active support, in which nodes in a computation can be configured as peers in that computation. This mode is typical of other parallel programming libraries such as MPI. (MPI is the standard API for high-performance parallel scientific programming.)
During our early assessment of TC, we worked closely with Mark Altawee, the technical lead at Argonne National Laboratory (ANL) for integrating Repast. Currently, ANL is using the MITRE team’s Repast implementation of the Rebellion model as a target for deploying a clustered parallel instance of a single Repast model. While not nearly as complex as the COIN Model, the core structure of the Rebellion model serves as a good straw man for demonstrating a parallel

5-23
© 2010 The MITRE Corporation. All rights reserved.
TC model. When ANL releases this exemplar, it should be a straight forward process to re-factor the COIN Model for parallel execution. In the mean time, we have concluded that in the short term, we should suspend using TC until the new active-active instance of TC is integrated with Repast.
We are currently looking at alternatives to TC, which include potentially using a Java remote method invocation (RMI) or Java MPI bindings for parallel execution.
5.3 High Performance Applications for Computational Efficiency As stated above the ICE makes use of many high-performance applications as necessary. For the COIN Model we have made use of three external applications thus far. These applications include a random number generator, a line-of-sight (LOS) calculator, and an intelligent high-speed path planner. Each of these applications is described in greater detail below.
5.3.1 Biased Random Number Generator
For the COIN Model, we developed a pseudo-random number generator (PRNG) that can be biased toward specific values. Our Biased PRNG is a simple Java wrapper around the Mersenne Twister algorithm that allows the user to specify aspects of the probability density function (PDF) at invocation. (Note that the Mersenne Twister algorithm is a more random and faster PRNG than the default Java PRNG.)
For the Biased PRNG, the PDF is defined as a triangle of height equal to 2 and width equal to 1, as shown in Figure 5-24.
Figure 5-24. Shape of the Biased PRNG Probability Density Function
The Bias point is a value defined at invocation that defines the tip of the triangular shape, and the most probable value that a call to Biased PRNG should return. The translation of the uniform-random number p returned by the Mersenne Twister to a value x obeying the “saw-tooth” PDF S defined at invocation is a straightforward integral:

5-24
© 2010 The MITRE Corporation. All rights reserved.
Since the left half of the triangle has an area equal to Bias, if p is less than Bias we can say that x is also less than Bias. Under this condition the translation is simple:
If p is greater than Bias, then the solution involves a quadratic of the form,
The Biased PRNG also includes a NetLogo interface. Validation of the Biased PRNG was performed by compiling a histogram over 10,000 calls with a particular bias value, as shown in Figure 5-25.
Figure 5-25. Histograms of Over 10,000 Calls to Two Different Bias Values of the Biased PRNG
5.3.2 Line-of-Sight (LOS) Engine
The Line-Of-Sight (LOS) Engine is a stand-alone utility meant to quickly provide Boolean answers about the existence of LOS between points in a “two and a half dimensional” space. While the virtual space that the LOS engine analyzes has height, width, and depth, all obstacles
x
Sp0
B i a spx
B i a syyB i a sp
112 2
B i a sxy
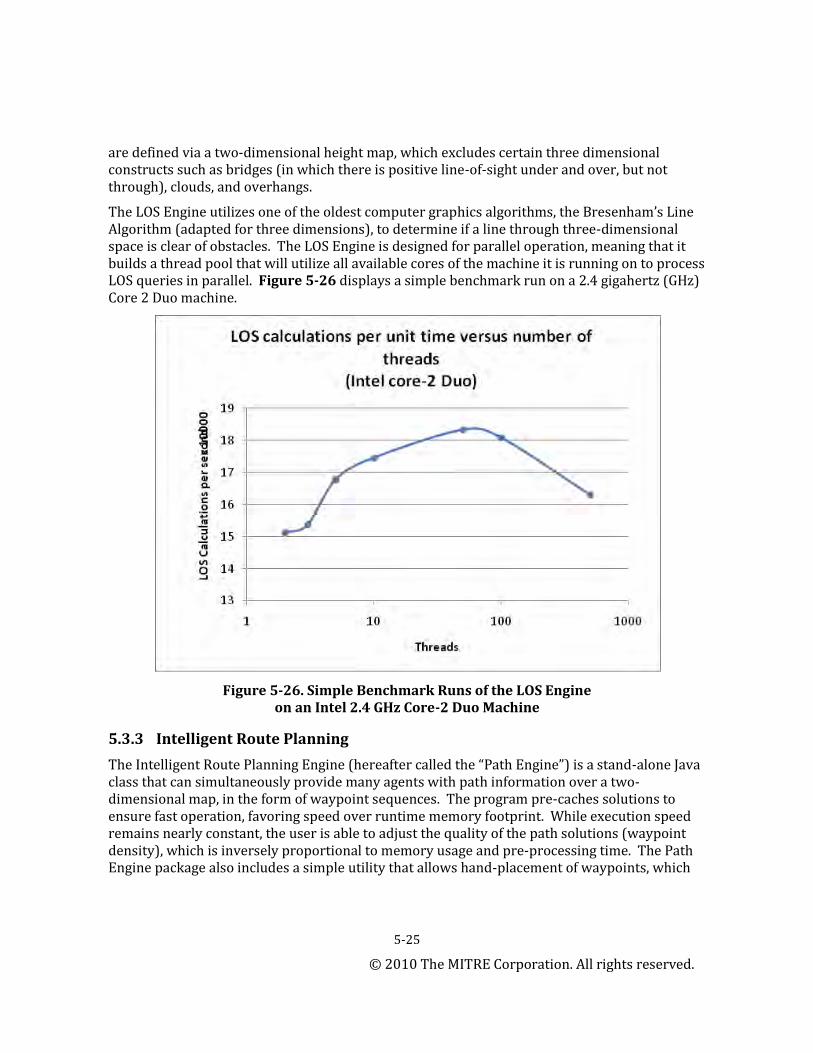
5-25
© 2010 The MITRE Corporation. All rights reserved.
are defined via a two-dimensional height map, which excludes certain three dimensional constructs such as bridges (in which there is positive line-of-sight under and over, but not through), clouds, and overhangs.
The LOS Engine utilizes one of the oldest computer graphics algorithms, the Bresenham’s Line Algorithm (adapted for three dimensions), to determine if a line through three-dimensional space is clear of obstacles. The LOS Engine is designed for parallel operation, meaning that it builds a thread pool that will utilize all available cores of the machine it is running on to process LOS queries in parallel. Figure 5-26 displays a simple benchmark run on a 2.4 gigahertz (GHz) Core 2 Duo machine.
Figure 5-26. Simple Benchmark Runs of the LOS Engine on an Intel 2.4 GHz Core-2 Duo Machine
5.3.3 Intelligent Route Planning
The Intelligent Route Planning Engine (hereafter called the “Path Engine”) is a stand-alone Java class that can simultaneously provide many agents with path information over a two-dimensional map, in the form of waypoint sequences. The program pre-caches solutions to ensure fast operation, favoring speed over runtime memory footprint. While execution speed remains nearly constant, the user is able to adjust the quality of the path solutions (waypoint density), which is inversely proportional to memory usage and pre-processing time. The Path Engine package also includes a simple utility that allows hand-placement of waypoints, which

5-26
© 2010 The MITRE Corporation. All rights reserved.
in some cases (such as urban areas consisting mainly of roads) can be utilized to achieve efficient path planning without large memory requirements.
The Path Engine operates in two stages: pre-processing and runtime. The pre-processing stage builds a data structure that can efficiently return a sequence of waypoints that approximate an optimal path between any two points on a two-dimensional map. To do this, it requires information on the nature of the terrain within the map and information about where the waypoints are located. The user provides terrain information in the form of bitmap images. The index of each pixel in an image corresponds to a unitless quanta of terrain (a “grid-square”), while the value of that pixel is a relative measure of the difficulty an agent will incur in traversing that terrain (the “cost”). The final cost of a grid-square is computed as a weighted sum of these values, with the weights provided by the user. In this fashion, different aspects of terrain can be easily adjusted and edited. For instance, permanent obstacles like rivers and buildings can remain constant while overlays corresponding to weather patterns may change between simulations. For example, a worsening thunderstorm or receding flood plain can be approximated by changing a single weight value. Also, common information can be contextualized between different agent classes (e.g., a Red team might see the right half of an obstacle field as exclusively traversable, while a Blue team might see the left half of the same obstacle field as exclusively traversable).
The continuous nature of the final cost map makes purely geometric analysis of impassable obstacles (such as Voronoi analysis) impractical, and necessitates evaluation of cost via path integrals. The pre-processing stage uses an A* algorithm to find the lowest-cost path from any grid-square to the nearest grid-square marked as a waypoint (the “Nearest Neighbor Map” as visualized in Figure 5-27) and also to find the minimum cost between any two waypoints that share a border among nearest-neighbor regions.

5-27
© 2010 The MITRE Corporation. All rights reserved.
Figure 5-27, Nearest Neighbor Regions on a Simple Map (Black dots indicate waypoint positions)
The minimum cost information is used to compute optimal waypoint sequences via Dijkstra’s algorithm. As the number of waypoints approaches the number of grid-squares, the paths approach optimality. However, given that an agent has simple seeking behavior over a small number of grid-squares, waypoints, which are scattered over several grid-squares or placed at strategic locations such as road intersections, will be nearly indistinguishable from optimal, as shown in Figure 5-28. A simple graphical utility for hand-placement of waypoints is included in the Path Engine package for this purpose.

5-28
© 2010 The MITRE Corporation. All rights reserved.
Figure 5-28. Path Derived From Hand-Placed Waypoints on an Urban Map (Yellow lines indicate the path and the red dots indicate the waypoint)
The runtime component of the Path Engine queries the shortest path tree produced during the pre-caching stage. The Nearest Neighbor Map is used to find the closest waypoint to both the start and destination requested by the agent, which reference a cached sequence within the shortest path tree. The Path Engine includes interfaces for integration into NetLogo code.
5.4 Data Analysis MITRE has developed a useful set of output analysis tools to allow analysts to produce responsive, intelligible results. These tools include agent interaction tables, genetic algorithm optimizations, complex time series analysis, and delayed outcome reinforcement plots. These tools are described in the following sections.
5.4.1 Agent Interaction Tables
One of the visualization tools we have developed is an “agent interaction table,” which displays mean and distributional data for interactions that took place between any two categories of agent type over a series of simulation runs. For example, Figure 5-29 shows a killer-victim interaction table. On the left side of Figure 5-29, mean values of the simulation runs are displayed; on the right, the distribution of the values over the simulation runs are shown, with changes in the background color highlighting the cells with the largest values.

5-29
© 2010 The MITRE Corporation. All rights reserved.
Figure 5-29. Agent Interaction Table
In addition to Agent Interaction Tables, we have also developed a tool called the Density Playback Tool to help meaningfully visualize large numbers of runs. This tool allows an analyst to look at a large number of user-defined simulation runs all at once, by layering them on top of each other and making each slightly transparent. In this way, an analyst can see the average behavior of the agents as well as outlier behavior. Figure 5-30 depicts an example density playback – the left side of the graphic includes terrain, while the right side does not.
Figure 5-30. Density Playback Example

5-30
© 2010 The MITRE Corporation. All rights reserved.
We also have begun to explore some very sophisticated data mining techniques to categorize the state space of the simulation runs into a chain of meaningful events. This will allow us to create analyses that are of more immediate utility to decision makers and subject matter experts –for example, being able to explicitly say, “Blue does better when squad 10 is able to provide covering fire for squad 6.”
5.4.2 Genetic Algorithms
5.4.2.1 Background on Genetic Algorithms
Since their formal introduction in 1975, and even before by Holland56, genetic algorithms have been applied to a variety of fields (from medicine and engineering to business) in order to optimize functions which do not lend themselves to optimization by traditional methods.57 58 59 60 More recently, the study and practical development of the Genetic Algorithm (GA) by Goldberg61 and DeJong62 has resulted in great growth in the application of GAs to optimization problems. As succinctly stated by Goldberg, GAs are “search procedures based on the mechanics of natural selection and natural genetics.”
GAs apply random choice as a tool to guide a global search in the space of potential solutions. GAs differ from traditional optimization and search methods in several respects. Rather than focusing on a single candidate solution (a point in design space), genetic algorithms operate on populations of candidate solutions, and the search process favors the reproduction of individuals with better fitness values (i.e., more optimal individuals) than those of previous generations. Whereas calculus based and gradient (hill-climbing) methods of solution are local in the scope of their search and depend on well-defined gradients in the search space, GAs are useful for dealing with many practical problems containing noisy or discontinuous fitness values. Enumerative searches are also inappropriate for many practical problems as they exhaustively examine the entire search space for solutions; they are only efficient for small search spaces, while the global scope of the GA makes it suitable for problems with large search spaces. Thus, GAs not only differ in approach from traditional optimization methods but also offer an alternative method for cases in which traditional algorithms are inappropriate.
56 Holland, J.H. (1976).Adaptation in Natural and Artificial Systems, The University of Michigan Press:
Ann Arbor, MI. 57
Bremermann, J.M. (1958). Optimization through evolution and recombination, SelfOrganizing Systems, 7, p. 282--287.
58 Friedberg,R.M.(1958). A learning machine: Part I, IBM Journal of Research and Development, 1, p.
2—13. 59
Friedberg, R.M. (1959). A learning machine: Part II, IBM Journal of Research and Development, 7, p.282—287.
60 Bäck, T. (1996). Evolutionary Algorithms in Theory and Practice. Oxford University Press: NY.
61 Goldberg, D. E. (1989). Genetic Algorithms in Search, Optimization, and Machine Learning.
AddisonWesley: Reading, MA. 62
DeJong, K. A. (1975). An analysis of the behavior of a class of genetic adaptive systems, PhD. Dissertation. Univ. of Michigan, Ann Arbor, MI.

5-31
© 2010 The MITRE Corporation. All rights reserved.
The genetic algorithm as a discrete optimization process is distinct from more conventional optimization techniques in four ways:
1) GAs encode designs (feasible points) in a string and it is this encoding that the GA works with: each individual in a population is an encoding of a possible solution to the discrete optimization problem being analyzed.
2) GAs work simultaneously with a population of designs, instead of with a single design or candidate solution.
3) GAs use only an objective function to evaluate candidate solutions, rather than using derivatives or other auxiliary information.
4) GAs use random change in their search, not solely deterministic rules.
The process used by genetic algorithms to evolve solutions to optimization problems is analogous to the natural process of evolution by natural selection. Evolution as a natural process allows complex, highly adapted organisms to develop and thrive in an environment through the processes of genetic change and natural selection. Sexual reproduction (sexual in the sense of occurring between two parent individuals as opposed to one) provides for the preservation of existing genetic information and the creation of new genetic information, and individuals in a population survive based on their fitness in their environment. The genetic information carried by more fit individuals is more likely to be passed on to ensuing generations simply because more fit individuals are more likely to survive to reproduce. GAs apply the natural evolutionary processes of evaluation and selection to string representations of the arguments of the function being optimized. Structures (individuals in natural systems) are encoded into one or more strings (chromosomes). These individuals reproduce, and fit individuals persist from generation to generation, yielding improved designs. The structure is analogous to the phenotype in natural systems and corresponds to a candidate solution to the optimization problem or a point in the design space, while the string encoding of the arguments to the function being optimized is analogous to the genotype.
5.4.2.2 MITRE GA Work That Will Be Leveraged for the COIN Model
The work described here is concerned with the application of GAs as optimization tools for the combinatorial optimization of the arrangement of sensors in a geographical space. In this domain, each sensor is characterized by a Cartesian location (x, y) and an orientation. For a typical candidate solution, comprising five such {x, y, orientation} triplets, and typical integer ranges for each of these parameters, there are well over 10015 = 1030 potential solutions. At 10 minutes per solution, this clearly becomes an intractable problem to solve with an exhaustive search (even 1 second per solution would require 1020 years to solve). At the same time, the search space contains discontinuities (due to absurd orientations), and a strong stochastic component due to the randomized simulation. In light of the properties described in Section 5.4.2.1, a GA is ideal for this application: the population aspect allows distributed exploration of different solutions, while the directed-search aspect ensures that the solutions will successively improve. Additional benefits of using a GA include investigation of potentially multiple global optima, through the mechanism of elitist selection.

5-32
© 2010 The MITRE Corporation. All rights reserved.
We have implemented this capability as a genetic algorithm with the following characteristics:
Individual parameterized solutions (the sets of {x, y, orientation} values) are encoded as integers.
Elitist selection is introduced enabling the retention of the current M best solutions in a population of N individuals, driving convergence and preserving multiple potential optima.
Parallel execution is achieved on a 128-processor Linux cluster, by using a customized version of the Unified Search Framework.
An Evolutionary Algorithm (EA) capability, modeled after Barry63, enables normally-distributed changes in parameters, versus the uniformly-distributed random changes characteristic of GAs.
The EA capability is important in that it enables continuous-valued optimization in the context of a discrete GA.
The algorithm itself is expressed with pseudo-code as follows:
gen = 0 initialize Population do while not terminated:
apply crossover to Population(gen) giving Children(gen) apply mutation operators to Children(gen) decode and evaluate Children(gen)
Population(gen+1) = select from(Children(gen) Population(gen))
gen = gen + 1
Crossover and mutation are applied uniformly, and termination is forced after a fixed number of generations. The “decode and evaluate” step is executed in parallel, where each individual solution in the new Child population is evaluated simultaneously.
The utility framework described above creates a fitness function that can be used within our GA toolkit. A key assumption for our approach is that the solution can be parameterized as a function of a number of input variables. We further assume that within the constraints of the solution space these variables describe a multidimensional space. Within this multidimensional space we assert that there are areas of stability and areas of optimality; often these areas are not the same. However, we believe that for a reasonable number of parameterized input variables we can search the space and find these interesting areas.
63 Barry, Philip, Matthew Koehler, and Adam Forsyth. (2004). The Bigger Hammer Approach: Using
Massively Parallel Computation to Address Low Base Rate Problems. Proceedings of the NAACSOS Conference 2004. Pittsburgh, PA.

5-33
© 2010 The MITRE Corporation. All rights reserved.
Once the individual preference curves have been derived, these can be captured by our utility function tool shown in Figure 5-31. For each MOP, the user can specify the type of curve (and tweak its shape via sliders) as well as the weighting constant. Each of these is aggregated into an MOE. These solutions are then translated into binary and encoded in a string that represents a solution. A population of possible solutions is then developed.
Figure 5-31. Utility Function Tool
Each of the solutions is then translated to an initialization file for a simulation of the phenomena of interest. As the simulation often has a number of stochastic elements, it is run a number of times. MOPs are gathered from the simulation both during and at the completion of each run and using an equation developed as described above the candidate solution is scored. The best combination of parameters is used to develop new simulations using standard genetic algorithm operators such as replication, crossover and mutation. This process is continued until a stable population is obtained or it becomes apparent that there is too much noise in the system and a stable region in solution space is not likely to be found.
We have found a number of benefits to this approach. Assuming we can parameterize the behaviors, we can now examine the effects of introducing differing behaviors with technology combinations. For example, we can determine the optimal placement of explosive sensors in a venue when combined with security guard behavior. Modeling the goodness of a combination of sensors and behavior would be very hard to determine analytically, particularly due to the large number of stochastic elements. However, the simulation provides a straightforward evaluation function and the genetic algorithm codifies a heuristic search. Further, the utility framework provides a rich way to quantify the “goodness” of any solution.

5-34
© 2010 The MITRE Corporation. All rights reserved.
5.4.3 Complex Time Series Analysis
5.4.3.1 Jittered Time Series Plots
Our analyses often require looking at time series data. One way of looking at this data is through Jittered Time Series Plots. In most cases, our analyses have focused on casualties suffered by Red and Blue, categorizations of casualties suffered, and shots fired. For example, Figure 5-32 shows a time series of casualties suffered by Blue (US Army) forces in a set of simulation runs. The figure contains a large amount of information: lines show the minimum, maximum, and mean value of casualties over time, and a jittered scatter plot indicates the number of casualties suffered at each time step in every run. Showing the casualty values along with the minimum, maximum, and mean provides a much more meaningful picture of the actual distribution of casualties, in a way that summary statistics cannot.
Figure 5-32. Jittered Casualties Over Time
5.4.3.2 Comparison of Time Series Data
It would be very useful to be able to compare time series data and determine whether one time series is different from another time series. This would then allow one to determine if two series modeling emergent behavior from an agent-based simulation have ‘similar’ behavior and it could be useful for model validation and making parametric comparisons. The challenge in comparing time series is that most statistical inferences assume independent sampling from an underlying stochastic process, but time series data is highly correlated.
There are various methods that could be used for comparing time series data:
Visual comparison
Assessment of basic time series characteristics using auto-correlation functions (ACF), the cross-correlation between two functions, periodograms (e.g., spectral density) or an auto-regressive moving average (ARIMA)

5-35
© 2010 The MITRE Corporation. All rights reserved.
Feature extraction which can capture the emergent behavior of interest (this provides independent observations, and can use Kolmogorov-Smirnov tests determine if observations came from the same density (distribution free).
Visual comparison is problematic in that it may be difficult to distinguish any underlying cyclic behavior and/or random noise and it does not provide any measure of statistical confidence. An ACF allows one to capture any correlation between observations and one can gain a sense of the periodic nature of the time series. One can also compare the cross-correlation between two time series at various lags (phase shifts) between the series. Periodograms break time series data into their underlying frequency components via Fourier Transforms and plot the relative strength of these components. ARIMA uses auto-regressive terms to account for time lagged correlation of residuals. With respect to using feature extraction, a statistic of interest should be created to capture a specific time series feature and then one could use a Kolmogorov-Smirnov test (distribution free) to determine if the features came from the same distribution.
We have decided that using a combination of these methods is best. First a visualization of the raw time series data should be conducted, followed by a visualization of the time series statistics (ACF, spectral density, etc.) and, if possible, ARIMA models should be fit to the time series data. Finally, statistics of interest should be extracted from the time series and the distribution of these statistics could be compared visually and statistically with Kolmogorov-Smirnov boot-strapping.
5.4.4 Delayed Outcome Reinforcement Plot (DORP)
We have been exploring methods for displaying the correlative structures among agent movement, success or failure, and spatial relationships. Our current capability, called delayed outcome reinforcement plotting, combines machine learning with density playback. Essentially, the paths of successful agents are positively reinforced, while the paths of failing agents are negatively reinforced. The values are then assigned a color and displayed as a movie, showing agent flows around terrain colored by their success or failure.
A Delayed Outcome Reinforcement Plot (DORP) provides insight into the locations and trajectories of high-success and high-failure events and behaviors. Figures 5-33 and 5-34 provide examples from a force-on-force simulation. For these examples, the DORP tool applies a weighting to agent paths in terrain space that lead to success (a kill) or failure (the agent’s death).
These two figures are based on the assumption that an event that affects an agent is correlated with the path traversed by the agent preceding the event. It is also assumed that an estimate of correlation is a function of ∆L,a,e = (te,a − tL,a), tL,a ≤ te,a where te,a is the time that an agent a underwent an event e, and tL,a is the time that a occupied location L. In this case, the correlation estimate C (L, a, e) of a single event to location L is chosen as a simple decay, such that C (L, a, e) = ke(N∆L,a,e), 0 < N ≤ 1 where ke is a constant associated with a class of event. C (L, a, e) is defined only for the path traversed by agent a path prior to any event e that affected a, and can be visualized as a fading trail which is strongest at the location of e.
Figure 5-33 is the summation of all such trails generated over 200 simulations of the force-on-force simulation. Individual pixels representing location are mapped to color in log scale, after
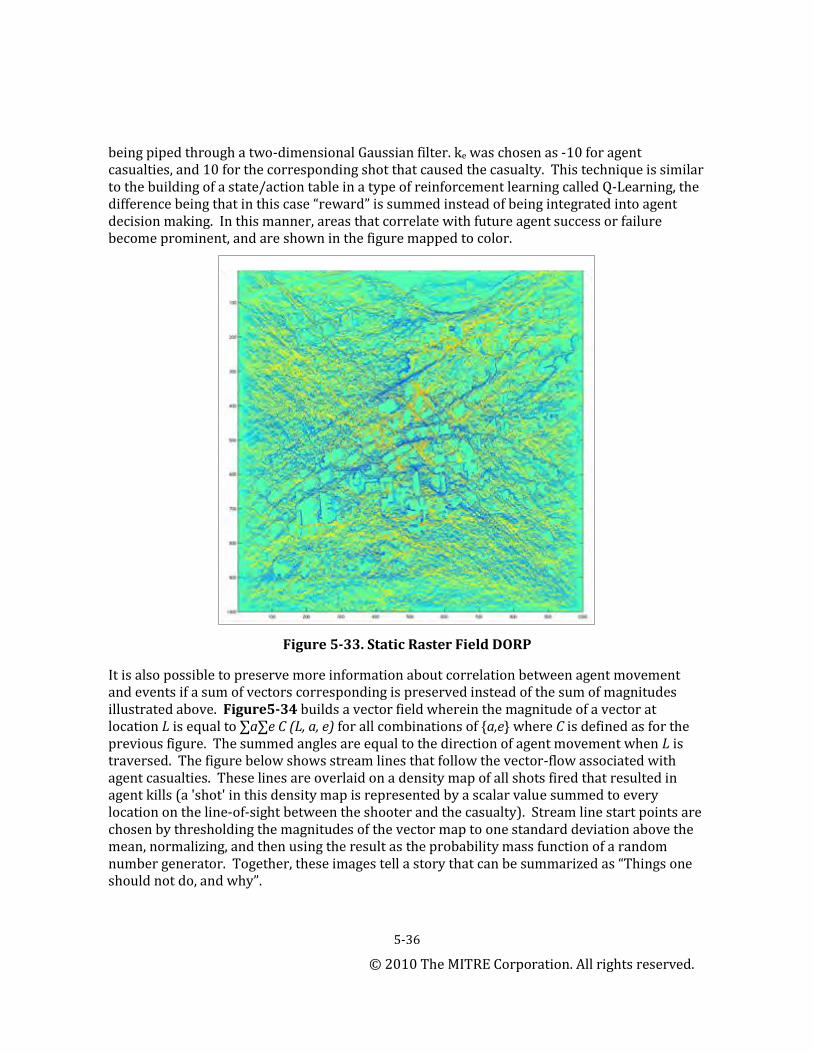
5-36
© 2010 The MITRE Corporation. All rights reserved.
being piped through a two-dimensional Gaussian filter. ke was chosen as -10 for agent casualties, and 10 for the corresponding shot that caused the casualty. This technique is similar to the building of a state/action table in a type of reinforcement learning called Q-Learning, the difference being that in this case “reward” is summed instead of being integrated into agent decision making. In this manner, areas that correlate with future agent success or failure become prominent, and are shown in the figure mapped to color.
Figure 5-33. Static Raster Field DORP
It is also possible to preserve more information about correlation between agent movement and events if a sum of vectors corresponding is preserved instead of the sum of magnitudes illustrated above. Figure5-34 builds a vector field wherein the magnitude of a vector at location L is equal to ∑a∑e C (L, a, e) for all combinations of {a,e} where C is defined as for the previous figure. The summed angles are equal to the direction of agent movement when L is traversed. The figure below shows stream lines that follow the vector-flow associated with agent casualties. These lines are overlaid on a density map of all shots fired that resulted in agent kills (a 'shot' in this density map is represented by a scalar value summed to every location on the line-of-sight between the shooter and the casualty). Stream line start points are chosen by thresholding the magnitudes of the vector map to one standard deviation above the mean, normalizing, and then using the result as the probability mass function of a random number generator. Together, these images tell a story that can be summarized as “Things one should not do, and why”.

5-37
© 2010 The MITRE Corporation. All rights reserved.
Figure 5-34. Static Vector Field DORP
Finally, the DORP can be displayed as an animation showing flows from events to agent origin (see Figure 5-35).
Figure 5-35. Animated Time Series DORP

A-1
© 2011 The MITRE Corporation. All rights reserved.
Appendix A Acronyms
A Active Agents (Number of)
ABM Agent Based Modeling
ACF Auto-Correlation Function
ANL Argonne National Laboratory
AntiAV Anti-Institution Activation Value
AOI Area of Interest
API Application Programming Interface
AQI Al-Quada in Iraq
ARIMA Auto-Regressive Moving Average
AV Activation Value
AvgAV Average Activation Value
BFT Blue Force Tracker
C Cops (Number of)
C-IED Counter-Improvised Explosive Device
CLC Concerned Local Citizens
COIN Counterinsurgency
CY08 Calendar Year 2008
DoD Department of Defense
EA Evolutionary Algorithm
FY08 Fiscal Year 2008
FY09 Fiscal Year 2009
G Grievance
GA Genetic Algorithm
GMTI Ground Moving Target Indicator
GUI Graphical User Interface
H Hardship
HD Hamming Distance
HighAV Highest Activation Value
HMMWV High-Mobility Multi-Wheeled Vehicle
HUMINT Human Intelligence

A-2
© 2011 The MITRE Corporation. All rights reserved.
IA Iraqi Army
ICE Infrastructure for Complex-systems Engineering
ID Identity
IED Improvised Explosive Device
ILG Iraqi Local Government Official
IP Iraqi Police
IW Irregular Warfare
J_Max (Maximum) Jail Term
JIEDDO Joint IED Defeat Organization
JOC Joint Operating Concept
JVM Java Virtual Machine
L Legitimacy
LAM Local Area Machine
LOS Line-of-Sight
LowAV Lowest Activation Value
MOP Measure of Performance
MPI Message Passing Interface
MRAP Mine Resistant Ambush Protected
N Net Risk
OODA Observe, Orient, Decide, Act
OPTEMPO Operational Tempo
ORSA Operations Research and Systems Analysis
P Probability of Arrest
PDF Probability Density Function
PRNG Pseudo-Random Number Generator
ProAV Pro-Institution Activation Value
R Risk Aversion
RAM Random-Access Memory
RNG Random Number Generator
SG Social Group
SLOC Source Lines of Code
SME Subject Matter Expert

A-3
© 2011 The MITRE Corporation. All rights reserved.
SOI Sons of Iraq
T Threshold Value
TC Terracotta
U Uniform Distribution
v (Agent) Vision
v* (Cop) Vision
2D Two-Dimensional

B-1
© 2011 The MITRE Corporation. All rights reserved.
Appendix B Bibliography
References Cited in Report:
Advocacy. (2008). Retrieved August 2008, from Merriam-Webster Online Dictionary: http://www.merriam-webster.com/dictionary/advocacy
Albert, R., & Barabasi, A. (2002). Statistical mechanics of complex networks. Reviews of Modern Physics , 74, 47-97.
Axtell, R. (June 1999). The Emergence of Firms in a Population of Agents: Local Increasing Returns, Unstable Nash Equilibria, and Power Law Size Distributions. The Brookings Institution, Center on Social and Economic Dynamics. The Brookings Institution.
Bäck, T. (1996). Evolutionary Algorithms in Theory and Practice. NY: Oxford University Press.
Barry, P., Koehler, M., & Forsyth, A. (2004). the Bigger Hammer Approach: Using Massively Parallel Computation to Address Low Base Rate Problems. Proceedings of the NAACSOS Conference 2004. Pittsburgh, PA.
Bremermann, J. Optimization through eveolution and recombination. Self-Organizing systems , 7, 282-287.
Buss, S. e. (1991). On the Predictability of Coupled Automata: An Allegory about Chaos. Complex Systems , 5, 525-539.
Carley, K. (1991). A Theory of Group Stability. American Sociological Review , 56 (3), 331-354.
DeJong, K. (1975). An analysis of the behavior of a class of genetic adaptive systems. Ann Arbor, MI: University of Michigan.
Department of Defense. (2007). Irregular Warfare (IW) Joint Operating concept (JOC) Version 1. Department of Defense.
Eldridge, N., & Gould, S. J. (1972). Punctuated Equilibria: An Alternative to Phyletic Gradualism. In T. Schopf (Ed.), Models in Paleobiology (pp. 82-115). San Francisco, CA: Freeman, Cooper and Co.
Epstein, J. M. (2002). Modeling civil violence: an agent-based computational approach. PNAS , 99, 7243-7250.
Friedberg, R. (1959). A learning machine: Part II. IBM Journal of Research and Development , 7, 282-287.
Friedberg, R. M. A learning machine: Part I. IBM Journal of Research and Development , 1, 2-13.
B-2
© 2011 The MITRE Corporation. All rights reserved.
Goldberg, D. (1989). Genetic Algorithms in Search, Optimization, and Machine Learning. Reading, MA: Addison-Wesley.
Granbert, D., & Brown, T. (1992). The Perception of Ideological Distance. The Western Political Quarterly , 45 (3), 727-750.
Gurr, T. R. (1970). Why Men Rebel. Princeton, NJ: Princeton University Press.
Hamming, R. W. (1950). Error Detecting and Error Correcting Codes. Bell System Technical Journal , 26 (2), 147/160.
Headquarters Department of the Army. (2006). FM 3-24 Counterinsurgency. Washington DC: Headquarters Department of the Army.
Hegtvedt, K. A., & Johnson, C. (2000). Justice beyond the individual: a future with legitimation. Social Psychology Quarterly , 63, 343-366.
Hogg, M.A., Terry, D.T., & White, K.M. (1995). A Tale of Two Theories: A Critical Comparison of Identity Theory with Social Identity Theory. Social Psychology Quarterly. 58 (4) 255-269.
Holland, J. (1976). Adaptation in Natural and Artificial Systems. Ann Arbor, MI: The University of Michigan Press.
Merton, R. K. (1938). Social Structure and Anomie. American Sociological Review , 3, 672-682.
Milgram, S. (1967). The Small World Problem. Physiology Today , 2, 60-67.
North, M. e. (2007). ROAD Map: Transforming and Extending Repast with Groovy. In N. a. Macal (Ed.), Proceedings of the Agent 2007: Complex Interaction and Social Emergence Conference. Chicago, Il: Argonne National Lab.
Parsons, T. (1937, 1961). The Structure of Social Action. New York, NY: The Free Press.
Payne, J. W., Bettman, J. R., & Johnson, E. J. (1992). Behavioral Decision Research: A Constructive Processing Perspective. Annual Review of Psychology , 43, 87-131.
Runciman, W. G. (1966). Relative deprivation and social justice: a study of attitudes to social inequality in twentieth-century England. Berkeley, CA: University of California Press.
Stryker, S. (1968). Identity Salience and Role Performance. Journal of Marriage and the Family. 4, 558-564.
Tivnan, B. (2008). Counterinsurgency (COIN) Sandbox for Decision Support (CISADS). Retrieved October 6, 2008, from 2008 MITRE Technical Innovation Exchange: http://www.mitre.org/news/events/exchange08/24.html#3753
Turnley, J. (July 2008). Attitudes, Persuasion, and Influence.
Turnley, J. (January 2004). Emotional and attitudinal convergence.

B-3
© 2011 The MITRE Corporation. All rights reserved.
Turnley, J. (August 2008, August). Legitimacy and Power.
Turnley, J. (June 2008). Measuring Risk Attitudes.
Van Valen, L. (1973). A New Evolutionary Law. Evolutionary Theory , 1, 1-30.
Von Neuman, J., & Morgenstem, O. (1947). Theory of games and economic behavior (2nd ed.). Princeton, NJ: Princeton University Text.
Watts, D., & Dodds, P. (2007). Influentials, Networks, and Public Opinion Formulation. Journal of Consumer Research .
Wilensky, U. (n.d.). NetLogo Rebellion Model. Retrieved May 01, 2008, from Center for Connected Learning and Computer-Based Modeling, Northwestern University, Evanston, IL: http://ccl.northwestern.edu/netlogo/models/Rebellion
Zajonc, R. B. (1984). On the Primacy of Affect. American Psychologist , 39, 117-123.
Other References Consulted for COIN MOIE Research and for Agent-Based Modeling Support to the C-IED:
Axtell, R. (2005). Three distinct kinds of empirically-relevant agent-based models. The Brookings Institution, Center on Social and Economic Dynamics. The Brookings Institution.
Axtell, R. (November 2000). Why Agents? On the Varied Motivations for Agent Computing in the SocialSciences. The Brookings Institution, Center on Social and Economic Dynamics. The Brookings Institution.
Bak, P., Flyvbjerg, H. and Lautrup, B.(1992). Coevoultion on Rugged Fitness Landscapes. Physical Review A, 46(10), p. 6424-6730.
Bak, P. and Paczuski, M. (1995). Complexity Contingency and Criticality. Proceedings of the National Academy of Sciences of the United States of America, 92(15), pp.6689-6696.
Bak, P, Tang C. and Weisenfeld, K. (1988). Self Organized Criticality. Physical Review A, 38 (1), p.364-375.
Bak, P, Tang C. and Weisenfeld, K. (1988). Self-Organized Criticality: Explanation of 1/f Noise. Physical Review Letters, 59(4), p.381-384.
Broemmel, J., Nielson, S. and Clark, T. (2006). An Analysis of Counterinsurency in Iraq: Mosul, Ramadi, and Samarra from 2003-2005, Naval Postgraduate School Thesis.Naval Postgraduate School, Monterrey, CA.
Celeski, Joseph D. (2005).Operationalizing COIN. JSOU Report #05-02. Joint Special Operations University, Hurlburt Field, FL.
B-4
© 2011 The MITRE Corporation. All rights reserved.
Dodds, P. and Watts, D. (2005). A generalized model of social and biological contagion. Journal of Theoretical Bioloy, 232, pp.587-604.
Dodds, P. and Watts, D. (2004). Universal Behavior in General Model of Contagion. Physical Review Letters, 92 (21), p.218071-1-218071-4.
Epstein, J.M. (1999). Agent-based computational models and generative social science. Complexity, 4 (5).pp.41-60.
Felter, J. and Fishman, B. (2007). Al-Qaida's Foreign Fighters in Iraq: A First Look at the Sinjar Records. Combating Terrorism Center (Harmony Project), Department of Social Studies, USMA, West Point, NY.
Galula, David . (1963, 2006). Pacification in Algeria 1956 – 1958. (foreward by Bruce Hoffman) RAND Monograph.
Headquarters Department of the Army. (1986). FM 90-8 Counterguerilla Operations. Washington DC: Headquarters Department of the Army.
Joint Forces Command. (December 2007). Joint Operating Environment Trends and Challenges for the Future Joint Force through 2030. USJFCOM . Norfolk, VA.
Sneppen, K, Bak,P., Flyvbjerg, H. and Jenses, M. (1995). Evolution as a Self-Organized Critical Phenomenon. Proceedings of the National Academy of Sciences of the United States of America, 92(11), pp.5209-5213.
Stauffer, D. and Sahimi, M. (2006). Discrete simulation of the dynamics of spread of extreme opinions in a society. Physica A, 364, pp. 537-543.
Strategic Studies Institute of the Army War College. (December 2007).The Interagency and Counterinsurgency Warfare Stability Security Transition and Reconstruction Roles. Cerami, Joseph R. and Bogg, Jay W. (Eds.)
Sumour M. and Shabat M. (2004). Monte Carlo simulation of Isling model on directed Barabasi-Albert network. (arXiv:cond-mat/0411055 v2 21 Dec 2004)
Vasquez, Michael. (January 2008). Tribalism under Fire. Marine Corps Gazette, 9 (1). p. 62.
Wipfli, R. and Metz, S. (January 2008). COIN of the Realm: U.S. Counterinsurgency Strategy Coloquium Brief. US Army War College Strategic Studies Institute.

C-1
© 2011 The MITRE Corporation. All rights reserved.
Appendix C End Notes for COIN Model Formulation for JIEDDO
C.1 End Note on the Initial Distribution There has been much discussion as to how the initial distribution of civilians amongst the “job” categories should occur. One suggestion (Suggestion A) was to have the civilians first determine their activation values for each of the institutions, and then the initial distribution of the number of IA, IP, and Sahwas would be determined as follows. Those civilians that are high on the actively-pro IA scale would be given a “job” as an IA, those that are high on the actively-pro IP scale would be given a “job” as an IP, and similarly those civilians that are high on the actively-pro Sahwas scale would be given a “job” as a Sahwa.1 An “issue” seen with this approach is that at the very beginning of the model, none of the IA or IP would act as “a wolf in sheep’s clothing”.
Another suggestion (Suggestion B) was to have the initial distribution of the “jobs” be based on some arbitrary assignment related to a “snapshot” in time for the given area of interest. Thus if during this snapshot in time, 10% of the population are IP, 20% are IA, and 5% are Sahwas – the model would randomly assign 10% of the civilians a job of IP, 20% a job of IA, 5% a job of Sahwa and the remainder would be assigned a “general citizen” job. This approach would allow a “wolf in sheep’s clothing” to occur at the beginning of a run, unlike Suggestion A. However, it was discussed that those civilians that are in the IA or IP really should behave like IA and IP at least for some given amount of time before changing their behavior. So, how should the civilian “jobs” actually should change in the model? A model created by Robert Axtell on the emergence of firms2 and how individuals apply utility functions to decide whether to switch between firms has been suggested as a possible way to implement the changing of jobs for the civilians. This will be looked at more.
Note that there also was a third suggestion (Suggestion C). Suggestion C would also base the initial distribution of jobs based on a snapshot of time, but that initial distribution of jobs would determine the makeup of the civilian traits based on those jobs. Suggestion C differs from Suggestion B because Suggestion B assumes that the traits/attributes have been assigned prior to the job determination.
It was decided that since Phase I does not necessarily include having “a wolf in sheep’s clothing”, that the current version of the COIN Model would have primarily static jobs and the civilians will only behave in a manner consistent with their jobs. Thus, in the current version,
1 Note that in this paragraph and the following three paragraphs the distribution is discussed only in
terms of the IA, IP, and Sahwas since those were the only three jobs we initially had in the model. 2 Axtell, Robert. (June 1999). The Emergence of Firms in a Population of Agents: Local Increasing
Returns, Unstable Nash Equilibria, and Power Law Size Distributions. The Brookings Institution. Center on Social and Economic Dynamics. Working Paper No. 3.

C-2
© 2011 The MITRE Corporation. All rights reserved.
only one activation value will determine a civilian’s behavior within their job at any given time. For example, civilians that have an IA job will only be concerned with their IA activation value: if they are activated to be pro-IA, they will be active in their IA job and will look for foreign fighters and insurgents to arrest; otherwise, they are considered to be inactive in their job. We still allow all of the activation values to vary over the course of a run in the current version of the model, and the civilians can rebel against any of the institutions for which their activation values are actively-anti.
C.2 End Note on Persuasion We are currently researching literature on persuasion and are working towards determining a good representation of persuasion for inclusion in the COIN Model. According to literature, there is both an affective (i.e., emotional) component and a cognitive component to persuasion3. We currently do not understand the interdependence of affect and cognition. We believe that the affect component has been addressed in a non-trivial manner, although perhaps not completely accurately, within the model through the “gruntlement” component of civilian-to-civilian interactions (see Appendix D Section D.2.1.5). There is however no depiction of cognition in the current COIN Model. We believe that the interaction between affect and cognition may be important and may still need to be addressed within the COIN Model. Perhaps, education level could be added as a civilian attribute and we could use education as a means of determining the cognitive component of persuasion. We are conducting additional research on the cognitive piece and on the relationship between affect and cognition. What we have been able to determine is that the affective component is more dominant and it always plays a role in persuasion – thus, the affective component will never go to zero and the cognitive component will never be the sole driver of persuasion.
C.3 End Note on Events As discussed earlier, events will occur that may adjust the civilians’ perceived hardships. Additionally, these events may affect the civilians’ perceptions of the legitimacy of the five institutions. In the current version of the model, events are not “played”, and the events need to be fleshed out more to determine what will be included. However, the current idea is that events will have five items associated with them: location, perpetrator of event, target of event, magnitude of event, and goodness/badness of event. A civilian’s perceived hardship will be affected by the location of the event and how close that event was to itself or to an individual within the civilian’s social group. The perceived hardship will also be affected by the magnitude and goodness/badness of the event, but will be agnostic to the perpetrator and the target of the event. Once a civilian determines that its social group was affected by the event, the civilian will adjust its own perceived hardship and then ask its social group to do the same. Thus, there will be a bit of recursion in the event effects. Specifics on how perceived hardship will be adjusted by events has yet to be determined but likely will be based upon distance from the event
3 Turnley, Jessica. (July 2008) Attitudes, Persuasion, and Influence. [See Appendix F for this white
paper.]

C-3
© 2011 The MITRE Corporation. All rights reserved.
location. For example: if agent 1 is very close to a building collapsing then that event will have a significant impact on that agent. However, if agent 2 is very far away from that same building collapse, it will be less affected by the collapse - unless a member of its social group was close to the building that collapsed. In that case, agent 2 will use the distance from the event that is associated with its social group member to calculate the effect, rather than agent 2’s actual distance. One potential way to do this is have the magnitude decrease with the square of the distance like a radio wave (1/r2).
A civilian’s perception of the legitimacy of a given institution will be agnostic to the location of the event, but will be affected by the perpetrator and the target of the event in addition to the magnitude and goodness/badness of the event. We still need to think through the specifics on how events will adjust the civilian’s perceived legitimacy of an institution based on an event.
Different types of events could occur as well. There are the generic events that could go off in the background – these could be local, regional, or global events. A general event creator will take a list of the generic events and set them off during the course of the scenario. Then there are the events that could occur due to civilians reaching a specific activation value and setting up an event to occur in the future – the civilians will essentially send their event to the general event creator to set off the event at the specified time. Furthermore, Foreign Fighters and Coalition agents could create events as they interact with each other and with the civilians.

C-4
© 2011 The MITRE Corporation. All rights reserved.

D-1
© 2011 The MITRE Corporation. All rights reserved.
Appendix D Key COIN Model Parameters
This section describes the key model parameters for the COIN Model to include both environment and agent parameters. Two important parameters related to the overall simulation environment are the length of a time step and the size of a terrain grid-square. The COIN Model uses a time step of 1 minute and a terrain grid-square that is 10 square meters in size.
D.1 Environment Parameters The model uses relevant terrain, meaning it has a real-scale and contains features that impact the agent states. In the current model these features include water, urban land, open land, railroads, primary roads, secondary roads, road edges, points of interest (e.g., religious shrines), and patrol bases.
The model is designed to easily ingest new terrain sets. The model expects the input terrain to be a bitmap file and that is the only true constraint. For the model to behave as currently designed, however, there are additional steps that need to be taken. The terrain image to prototype terrain mapping should have a one-to-one correspondence between image pixels and prototype grid-squares. Furthermore, the terrain image must have the specific color palate that describes the current terrain image. Colors existing outside the current color palate are ignored.
In addition to the terrain features mentioned above, the COIN Model divides the terrain into geographical neighborhoods. These geographical neighborhoods have a specific tribal affiliation, which allows the civilians to be instantiated in a specific neighborhood whose tribal affiliation matches the civilian’s tribe. (A list of the tribes used in the current COIN Model can be found in Section D.2.1.2.)
D.2 Agent Parameters There are three different types of agents in the COIN Model: civilians, Coalition forces, and foreign fighters. The civilian agents have more complex attributes than the other two types and these attributes are discussed first. Then additional model details are provided for setting up the civilian’s social group, as well as on the civilian-to-civilian interactions. Finally, there is a discussion on the Coalition forces and foreign fighters.
D.2.1 Civilian Parameters
D.2.1.1. Civilian Jobs
Each civilian is assigned a “job” parameter when it is created. The current data set contains nine job categories: “general citizens”, Iraqi Army (IA), Iraqi Police (IP), Iraqi Local Government Official (ILG), Sahwas, Blue HUMINT, Red HUMINT, “Trouble Maker” and Insurgent. These jobs are assigned to the civilians based on a population distribution of the percent of the civilian population in the city of interest that would have each of these eight jobs. Note that the jobs were selected based on the Agent Schematic presented to JIEDDO and shown below in Figure

D-2
© 2011 The MITRE Corporation. All rights reserved.
D-1. The “Sahwa” job category is being used currently to represent the “Concerned Local Citizens/Sons of Iraq (CLC/SOI)” box in the schematic and the term “Trouble Maker” is being used to represent the “Criminal/Anti-Stability” box in the schematic.
Figure D-1. Agent Schematic
D2.1.2 Civilian Attributes
The civilian agents also have six attributes: tribe, ethnicity, religion, gender, marriage status and wealth. These attributes are assigned to the civilian agents at time zero of a model run and they do not change during a model run.
Note that as a starting point for the COIN Model and for purposes of running the model in an unclassified environment, the civilian attributes are based on open source data on the entire country of Iraq. It is understood that this data likely does not reflect the demographics of the Iraqi city of interest, but the data does provide a starting point for developing the model.
Currently, the tribe attribute is assigned first and is based on a probability distribution estimated from open source data on the demographic of Iraq. The initial data set of tribes, which is being used to develop an unclassified version of the model, contains ten tribes. These ten tribes are composed of a variety of ethnic groups and religions from various locations in Iraq. Since each of these tribes has a corresponding ethnicity and religion, the ethnicity and religion attributes are assigned to each civilian agent in the model according to the demographics of their tribe. There are three ethnic groups used in this data set (Arabs, Kurds and Turks) and there are three religions used in this data set (Shia, Sunni and non-Muslim).
Agent
CoalitionForeign
Fighters
Insurgent PatrolRoute
Clearance
Civilian
Anti-Iraqi/
InsurgentPro-
IraqiNeutral
Other/
Red
HUMINT
Insurgent
Iraqi
Army
Other/
Blue
HUMINTPolice
CLC/
SoI
Other
Criminal
Anti-
stabilityIraqi Local
Gov’t Rep

D-3
© 2011 The MITRE Corporation. All rights reserved.
The ten tribes, their ethnicity and religions are:
1) Shammar –Sunni Arabs
2) Jibur – Both Sunni Arabs and Shia Arabs
3) Dulaym – Sunni Arabs
4) Khaza’l – Shia Arab
5) Kindi – A mix of Shia and Sunni Arabs
6) Oaraghoub – A mix of Shia and Sunni Arabs
7) Ubayd – Shia Arabs
8) Surchi – Kurds, mix of Shia and Sunni religions
9) Zangana - Kurds, mix of Shia and Sunni religions
10) Various Small Turk Tribes – Turk tribes, Sunni religion
In order to have a rough estimate of distribution of these ten tribes throughout the model for an initial data set, the tribe distribution is based on the distribution of Arab Sunnis (20%), Arab Shias (60%), Kurd Sunnis (17%) and other ethnic groups (3%) in Iraq. This initial distribution of the civilian population in each of the ten tribes listed above is Shammar 9%, Jibur 12%, Dulaym 8%, Khaza’l 15%, Kindi 11%, Oaraghoub 15%, Ubayd 13%, Surchi 7%, Zangana 7 % and Various Small Turk Tribes 3%. Note that there was no open source data found on the population of each of these tribes. This data is simply a test data set for the unclassified development of the COIN Model. More accurate data will be used in the classified version.
The process of assigning attributes to the civilian agents in the model is performed through several reporters. Each reporter reads a probability distribution list for its associated attribute and assigns an attribute index value to the agent. These index values correspond to a list of strings which contain the actual name of the attribute type. Several attribute assignments depend upon the civilian agent’s value for another attribute. Therefore, these attribute probability distributions are contained in a matrix. This is true for ethnicity, religion, marriage status and wealth. The reporters for these four attributes search the corresponding matrix for the row of the dependant attribute already assigned to the agent and then assign the attribute index value based on the probability distribution in that row of the matrix.
The matrix in the COIN Model that assigns each civilian agent an ethnic group is displayed below. The ethnic group attribute is dependent on the tribe attribute. It can be seen that there is a row for each tribe attribute listing the probability distribution of the corresponding ethnic groups.

D-4
© 2011 The MITRE Corporation. All rights reserved.
Arab Kurd Turk
100 0 0 Shammar
100 0 0 Jibur
100 0 0 Dulaym
100 0 0 Khaza'l
100 0 0 Kindi
100 0 0 Oaraghoub
100 0 0 Ubayd
0 100 0 Surchi
0 100 0 Zangana
0 0 100 Various Turk Tribes
Similarly, the matrix which assigns each civilian agent a religion is displayed below. The religion attribute is dependent on the tribe attribute. It can be seen that there is a row for each tribe attribute listing the probability distribution for the corresponding religion.
Shia Sunni Non-Muslim
0 100 0 Shammar
80 20 0 Jibur
0 100 0 Dulaym
100 0 0 Khaza’l
80 20 0 Kindi
80 20 0 Oaraghoub
100 0 0 Ubayd
10 90 0 Surchi
10 90 0 Zangana
0 99 1 Various Turk Tribes
Each civilian agent is assigned an identity parameter associated directly with its tribe, ethnic group and religion attributes values. There are a total of 15 different identities. The gender attribute is assigned to each civilian agent according to the demographic information found, 51% male and 49% female.
Marriage status is assigned to the civilian agents according to each civilian agent’s gender. The model assigns 80% of all males a status of married and 20% a status of single. Similarly the model assigns 95% of all the female in the model a status of married and 5% a status of single.

D-5
© 2011 The MITRE Corporation. All rights reserved.
A civilian agent’s wealth attribute is either poor, mid or rich. The wealth attribute is currently dependent on the ethnic group attribute, but is subject to change as more information and data is provided to the modeling team. Among the Arab agents, 10% are poor, 30% are “mid” (implying that their wealth lies in a middle area) and 60% are rich. Among the Kurdish agents, 60% are poor, 30% are “mid” and 10% are rich. Among the Turkish agents, 60% are poor, 30% are “mid” and 10% are rich.
D.2.1.3 Civilian Impressionability
In addition to these six attributes each civilian is given a level of impressionability parameter. This number is assigned based on a random normal distribution with a mean of 0 and a standard deviation of 1. This level of impressionability does not change during the model run.
D.2.1.4 Civilian Legitimacy Parameters
Each civilian agent has five initial perceptions of legitimacy parameters:
1. Legitimacy of the Coalition, 2. Legitimacy of the foreign fighters, 3. Legitimacy of the Iraqi Army, 4. Legitimacy of the Iraqi police, and 5. Legitimacy of the Sahwas.
For those legitimacy parameters that are not tied to the civilian’s job, the legitimacy perceptions are initially assigned to the civilian agents by a random uniform distribution between 0.0 and 1.0. The legitimacy parameter that is tied to the civilian’s job is actually “rigged” at instantiation to be legitimate such that the majority of the civilians would be active within their assigned jobs at instantiation. This was done to “seed” the model such that the civilians are activated in the “correct” manner towards the institution that their job falls within (e.g., an insurgent job would fall under the foreign fighter institution). By rigging the civilian’s legitimacy for the institution related to the civilian’s job, the civilian will tend to remain in their job unless something/someone affects them enough to change their attitude toward that institution. The next section (Section D.2.1.4.1) describes how we determined how to rig the legitimacy values. Note that the since the civilians with a “general citizen” job do not have any institution tied to their job, all of their legitimacies are assigned from the random uniform distribution between 0.0 and 1.0. Also, as mentioned in Chapter 3, the civilians with the trouble maker jobs are fixed for a given run – they are not allowed to change jobs and no other civilians are allowed to become a trouble maker. Thus, their legitimacy vectors also are all drawn from the random uniform distribution between 0.0 and 1.0.

D-6
© 2011 The MITRE Corporation. All rights reserved.
D.2.1.4.1 Rigged Legitimacy
As mentioned in Chapter 3, we allowed the activation values to be both positive (i.e., pro- a given institution) and negative (i.e., anti- a given institution) and the activation value (AV) is calculated by:
AV = -1 * (G-N), where G = Grievance and N = Net Risk
In order for an AV to be considered actively-pro an institution, the following must hold true:
AV > upperThreshold,
where upperThreshold is the civilian’s “upper threshold value”. As mentioned in Chapter 3, the upper threshold value is the threshold value associated with the positive side of the activation vector1. If one assumes that the net risk is zero then the above equation becomes:
-G > upperThreshold, or equivalently: -H(1-L) > upperThreshold.
Thus it follows that in order for this equation to hold true, the legitimacy must be defined as:
L > 1 + (upperThreshold/H).
We used this logic to rig the legitimacy associated with the civilian’s job. The rigging of the legitimacy is performed in two pieces. In the first piece, the perception of legitimacy is assigned a value that will ensure that the activation value for the given institution is both active and pro- the institution (meaning above the civilian’s upper threshold value):
riggedLegitimacy = 1 + (upper threshold *1.01)/hardship
The second part “jitters” the legitimacy value around the riggedLegitimacy, by using a random distribution whose mean is the riggedLegtimacy and whose standard deviation is the jitter value. The jitter value is a parameter whose default value is assigned as 0.01.
The model provides a choice of random distributions to be used for the rigged legitimacy: normal, exponential gamma, or Poisson. For purposes of our study, we have chosen to use the gamma distribution because this allows us to have around 90% of the civilians remaining in their run-time assigned jobs and 10% of the civilians having either more or less of a desire to remain in their jobs. Note that as a result of rigging the legitimacies, the legitimacy values for the COIN Model can now be greater than 1.0.
D.2.1.5 Civilian Activation Parameters
The civilian agents also have a level of activation parameter for each of the five vectors: Coalition, foreign fighters, Iraqi Army, Iraqi police and Sahwas. These activation values are
1 As mentioned in Chapter 3, the activation vector was allowed to be both positive (i.e., pro- a given
institution) and negative (anti- a given institution). A civilian’s “upper threshold value” is the threshold value associated with the positive side of the activation vector and the “lower threshold value” is a mirror opposite of the upper threshold value and is applied to the negative side of the activation vector. The upper threshold value is pulled from a random uniform distribution between 0.05 and 0.15. The negative threshold value is assigned a value of -1 * upper threshold value.

D-7
© 2011 The MITRE Corporation. All rights reserved.
based on a calculation that uses grievance, risk aversion and the estimated arrest probability (as described in Chapter 3). These five activation values are dynamic and will vary between -1 and 1.
D.2.1.6 Civilian Initial Location
In the current model, civilians are instantiated in a geographic neighborhood that has the same tribal affiliation as their own. As mentioned in Section D.1, the terrain is divided into geographical neighborhoods which have a tribal affiliation that matches one of the ten tribes. After the civilians are created and have their attributes assigned, they position themselves on the terrain by randomly selecting a position on a terrain grid-square that is designated as having their tribal affiliation. This results in geographic neighborhoods that are biased by tribes, which is reflective of the AOI.
D.2.1.7 Identity Group
In the COIN Model, an identity group is formed from those civilian agents that have the same identity – meaning the same tribe, ethnicity, religion, gender, marital status, and wealth. This identity group is used in assessing a civilian’s relative hardship as discussed in Chapter 4: Additional Functionality.
D.2.1.8 Social Group Set Up for the Civilians
As mentioned in the main body of this document, in the current model a civilian’s social group is based on its familial ties and is therefore tied to tribal affiliations and the geographical location of the civilian. Also, as mentioned in the main body of this document, all civilians except those with the Trouble Maker job are allowed to interact with their social group. Recall that since the Trouble Makers are those civilians that are fomenters of criminal activity/ instability but the trouble that they create is not related to an insurgency, the current COIN Model does not allow them to affect others’ perceived levels of hardship; nor do other civilians affect the Trouble Maker’s perceived level of hardship. As a result civilians with a trouble maker job do not even set up a social group for themselves. For all other civilians, the social group for each civilian has two components:
1) A group of civilians that live in the civilian’s neighborhood (and therefore will have the same tribal affiliation as the civilian) and,
2) A scale-free network of civilians who may be selected from anywhere in the AOI.
A scale-free network is one where the number of links a node may have and the number of nodes with that number of links forms a Power law. Networks with these characteristics have proven to be useful in describing a number of natural patterns. In a scale-free network some nodes act as "highly connected hubs", while most other nodes have few connections. A scale-free network's structure and dynamics are independent of the number of nodes that the system possesses. Thus a network that is scale-free will have the same properties no matter how many nodes it has. For these networks the distribution of the number of nodes follows the Yule-Simon distribution — a power law relationship that is defined by:
P (k) ~ k-γ,

D-8
© 2011 The MITRE Corporation. All rights reserved.
where the probability P(k) that a node in the network connects with k other nodes is roughly proportional to k-γ, and this function provides a roughly good fit to the observed data. The coefficient γ may vary approximately from 2 to 3 for most real networks2. Currently the COIN Model employs a γ of 2.1.
To set up a social group for a given civilian, the COIN Model first selects all civilians who do not have a trouble maker job and are located in the same neighborhood as the given civilian. Then if this group from the neighborhood is larger than 20 civilians, the civilian will randomly select 20 from the group to be part of its social group. Twenty was chosen as a reasonable assumption since it is known that civilians in the AOI have strong familial/tribal ties and likely have larger social groups than civilians from a more Western/European environment.
After the neighborhood part of the social group is selected, the COIN Model determines the number of civilians that are part of the given civilian’s social group from anywhere in the AOI. To do this the power law relationship above is used to form a list of the number of links that each node in a 100-node scale-free network might have. Then the civilians first randomly select a number from the list of the number of links and second randomly select that many other civilians (who are not trouble makers) to be part of their social group. This sets up the scale-free network portion of the civilian’s social group. Note that in the rare instance that the scale-free network portion of the social group would create greater than 55 links, the number of links is reduced to be exactly 55. This limit on the number of links was put in place since we believed that the social group should consist of no more than 75 civilians. (As mentioned in the paragraph above, the homophilic-biased portion of the social group will consist of 20 civilians at most.)
The two groups are then merged to form a single social group for the civilian. Note that in its current implementation, the scale-free network portion of the social group may include a member from the neighborhood portion of the social group. By merging the two groups, the “duplicate” member is removed.
As increased information about the AOI is gathered we may implement a different social group generating algorithm for biasing the social group via different homophilic dynamics.
D.2.1.9 Implementation of Carley’s Equation for Relative Similarity within the COIN Model
As discussed in Chapter 4, the determination of whether two civilians will actually interact “on the street” during their daily activities is based on Carley’s equation for relative similarity3. Carley’s relative similarity approach is based on similarity in Euclidean space and the probability of interaction between two individuals is predicted in terms of relative similarity.
2 Albert R. and Barabási A. (2002). Statistical mechanics of complex networks. Reviews of Modern
Physics, 74, pp. 47–97. 3 Carley, Kathleen . (1991) . A Theory of Group Stability. American Sociological Review, 56 (3), pp 331-
354.

D-9
© 2011 The MITRE Corporation. All rights reserved.
To implement Carley’s equation for relative similarity within the COIN Model, we started with the Carley-ian construct of homophily to determine whether two civilians actually engage with each other or not. Thus, we defined the the probability that civilian i will interact with civilian j as being a function of how many attributes i and j share relative to the number of attributes that i shares with each member of the entire civilian population. The attributes that we were using for comparison were the six attributes of tribe, ethnicity, religion, wealth, gender, and marital status
Using Carley’s canonical implementation of the calculation of relative similarity, we found that with a “large” size (greater than 5,000) for the civilian populace the probabilities of two individuals interacting were vanishingly small. Carley’s implementation is aspatial and takes into account not only the entire “population” but also all possible attributes of which an agent may care about similarity. These two characteristics appear to be the cause of the extremely small probabilities of interaction that we encountered.
To create probabilities that would enable agents to interact, we took into account spatial relationships and reduced the overall number of comparative traits being taken into consideration. Instead of including all six civilian attributes (tribe, ethnicity, religion, wealth, gender, and marital status), we chose to look at a subset of attributes (up to three, regardless of what those attributes were). We also limited the definition of “population” to be the “local civilian population”, meaning those civilians that are within civilian i’s vision.
D.2.1.10 Civilian Interactions With Other Neighboring Civilians (via Gruntlement)
As mentioned in Chapter 4, when two civilian agents interact “on the street”, the civilians’ attitude towards the different institutions is subject to change. In particular the civilian’s levels of activation towards or against each of the five institutions may be adjusted in either the positive or negative direction depending on who they interact with. This adjustment of a civilian’s activation values (AV1, AV2, AV3, AV4, and AV5) is based on a “gruntlement”4 scale.
As discussed in Chapter 4 and Section D.2.1.9, Carley’s equation will determine whether two civilians will actually interact on the street during their daily activities based on their similarities. Once it is determined that two civilians will interact with each other, the civilians will compare their activation values (AVs) for each of the five institutions (AV1, AV2, AV3, AV4, and AV5). If the two activation values for a specific institution are within a 0.4 range of one another, then the gruntlement adjustments are applied, otherwise neither of the civilians’ AVs for that particular institution is changed.
The first step in applying the gruntlement adjustment is to determine if the two civilians have AVs for a specific institution with the same sign. If both of the civilians’ AVs for the same institution are positive, a weighted average in favor of the highest AV is calculated:
AvgAV = (0.75 * HighAV) + ( 0.25 * LowAV)
4 Turnley, Jessica (January 2004) Emotional and attitudinal convergence. [This white paper is
included in Appendix C.]

D-10
© 2011 The MITRE Corporation. All rights reserved.
If both civilians’ AVs for the same institution are negative, a weighted average in favor of the lowest AV is calculated:
AvgAV = (0.75 * LowAV) + ( 0.25 * HighAV)
The 75 percent weight towards the more extreme agent is based on Turnley’s assumption that both agents will end up “3/4 of the initial distance between them in favor of the more extreme agent.”5 Note that we have not yet found support for this assumption in literature. In the event that we cannot find empirical support, our mitigating strategy will be to conduct sensitivity analyses to explore the effect of the weight value.
The two civilians’ AVs thus converge on the same value and are equal to the average AV calculated by the weighted average. Therefore, if two civilians interact and both have positive AVs, both civilians are actively-pro institution and they will become more like each other in their attitude towards the institution. Similarly, if two civilians interact and both have negative AVs, both civilians are actively-anti institution and they will become more like each other in their attitude against the institution. When two civilians interact with the same sign AV, their new AV values move them more towards the tails of the gruntlement scale and away from the midpoint.
However, if the two civilians interacting both have an AV at the extreme end of the scale (i.e., towards the end of the scale) and the AVs have the same sign, meaning they are both highly anti- or both highly pro- institution, they will still converge to one activation value but in a slightly different manner. These two civilians will first “radicalize” each other by both increasing/ decreasing their AV towards the end of the scale to which they are the closest. After this initial radicalization, they will influence each other just as the other civilians influence each other through a weighted average approach. Thus, if both civilians are highly anti-institution and their AVs are between -0.8 and -1.0, the AVs of both civilians will decrease by 0.075 without going below -1.0. Similarly, if both civilians are highly pro-institution and their AVs are both between 1.0 and 0.8, both civilians’ AVs towards the institution will increase by 0.075 without going above 1.0. Once this initial increase (or decrease) in AV values is made, the appropriate weighted average calculation described above is performed in favor of the AV which is the closest to the end of the scale6.
5 Ibid.
6 Note that once the idea of status and value homophily is integrated within the model, we may tie the radicalization on the same side of the scale to be more homophilic-based. For example, those individuals who are on the same side of the scale and who have extreme activation values might radicalize each other only if they have a high level of value homophily with each other. Thus, there would be a slight chance that people in this situation would become much more alike and extreme in their activations, while the majority would retain their own activation value.

D-11
© 2011 The MITRE Corporation. All rights reserved.
Figure D-2 depicts the AV adjustment for two civilians that are on the same side of the scale.
Figure D-2. Attitude Adjustments Based on Two Civilians Interacting
If one of the two civilians interacting is agnostic toward the institution (AV = 0), it is less likely it will be influenced in either the anti-institution or the pro-institution direction of the scale. However, there is a possibility that the agnostic civilian can be pulled from its agnostic position towards the anti-institution side or the pro-institution side. In order for this to occur the civilian’s partner must have a value of 0.4 or -0.4. The civilian’s AV will be adjusted to 0.1 if its partner’s AV is 0.4 and the civilian’s AV will be adjusted to -0.1 of its partner’s AV is -0.4. The partner’s AV will also be affected by the civilian’s agnostic institution attitude. The partner’s AV will be adjusted to 0.3 if it was originally 0.4, or it will be adjusted to -0.3 if it was originally -0.4.
Often when two civilians interact they will have AVs towards the same institution that have opposite signs. One civilian may be actively-anti institution while the other is actively-pro institution. Most likely these two civilians will have no effect on one another’s AV for the institution. According to Turnley 2004, there is a small chance (estimated at 20 percent7) that these two civilians would form a relationship and influence each other’s attitudes towards or against an institution. In general, in the COIN Model if the two civilians’ AVs are within a 0.2 range of one another, these two civilians have the ability to influence each other’s AVs. In this case the civilian who is actively engaged against the institution will pull the other civilian’s AV towards its value. The two civilians’ AVs will converge to one value calculated by a weighted
7 We have not yet been able to support this estimation of 20 percent through empirical evidence in
literature. In the event we are unable to support this estimate, our mitigating strategy will be to conduct sensitivity analyses on the value of this estimate.

D-12
© 2011 The MITRE Corporation. All rights reserved.
average which is extremely biased towards the anti- institution civilian’s AV (a positive sign AV):
AvgAV = (0.90 * antiAV) + (0.10 * ProAV)
D.2.1.11 Civilians Assessment of Their Hardship Relative to Members of Their Social Group (via Gruntlement)
When a civilian interacts with a member of their social group and assessed their hardship relative to that social group member’s hardship, the interaction is much more passive than the interaction “on the street” where the civilians are exchanging ideas and adjusting their attitudes and behaviors. The civilian is in a sense just assessing his environment and his situation compared to another’s. The hardship is thus self-generated. This has implications in the way gruntlement is used8.
Unlike the activation values which have both positive and negative values, the hardship values range from zero to 1.0. Thus the midpoint of the hardship range is 0.5 and the “negative” side of the gruntlement scale is the range 0.0 to 0.5 (exclusive) and the “positive” side of the gruntlement range are the values greater than 0.5. Since the hardship scale is roughly half the size of the activation value scale, if the two hardship values are within a 0.2 range of one another, then the gruntlement adjustments are applied, otherwise neither of the civilians’ hardships are changed.
In applying gruntlement to the hardship values, if both of the civilians’ hardship values are on the same side of the scale (i.e., both are greater than 0.5 or both are less than 0.5) and are within 0.2 range of each other, a weighted average in favor of the greatest hardship value is calculated:
AvgHardship = (0.75 * HighHardship) + ( 0.25 * LowHardship)
Since hardship itself connotes a negative relationship, the civilians converge towards the more negative value.
If the two civilians interacting both have a hardship at the extreme end of the scale (i.e., towards the end of the scale) and on the same side of the scale, they will still converge to one activation value but in a slightly different manner. These two civilians will first “radicalize” each other by both increasing/ decreasing their hardship towards the end of the scale to which they are the closest. After this initial radicalization, they will influence each other just as the other civilians influence each other through a weighted average approach. Thus, if both civilians have extremely high hardships (i.e., between 0.9 and 1.0), the hardships of both civilians will increase by 0.075 without going above 1.0. Similarly, if both civilians have extremely low hardships (i.e., between 0.0 and 0.1), both civilians’ hardships will decrease by
8 In particular, in the future when status and value homophily is incorporated within the model: while
we would likely use value homophily to determine whether the extreme activation values would radicalize each other; we would not do so for the extreme hardship values.

D-13
© 2011 The MITRE Corporation. All rights reserved.
0.075 without going below 0.0. Once this initial increase (or decrease) in hardship values is made, the appropriate weighted average calculation described above is performed in favor of the larger hardship value.
If one of the two civilians interacting has a hardship at the center of the scale (hardship = 0.5), it is not likely it will be influenced toward either the lower or the higher direction of the scale. However, if the civilian’s partner has a value of 0.3 or 0.7, the civilian at the center of the scale will adjust its hardship as follows: the hardship will be adjusted to 0.55 if its partner’s hardship is 0.7 and the civilian’s hardship will be adjusted to 0.45 if its partner’s hardship is 0.3. The partner’s hardship will also be affected by the civilian’s middle of the road hardship value. The partner’s hardship will be adjusted to 0.35 if it was originally 0.3, or it will be adjusted to 0.65 if it was originally 0.7.
If the two civilians interact have hardships that are on opposite sides of the scale (i.e., one civilians’s hardship is greater than 0.5 and one is less than 0.5), they will adjust their hardships if they are within 0.2 range of each other. In this case the civilian who has the higher hardship value will pull the other civilian’s hardship towards its value. The two civilians’ hardships will converge to one value calculated by a weighted average which is extremely biased towards the larger hardship:
AvgHardship = (0.90 * HighHardship) + (0.10 * LowHardship)
D.2.1.12 Civilian Interactions With Coalition and Foreign Fighter Forces
In addition to civilians interacting directly with other civilians on the street, the civilians may also interact directly with the Coalition forces or foreign fighters.
D.2.1.12.1 Capture/Kill Behaviors
As an initial implementation, foreign fighters and Coalition, as well as active civilians, will create symmetrical actions (e.g., capture or kill). In an attempt to stay as true to the original Epstein model as possible, the COIN Model has a kidnap/capture action that the civilians, Coalition forces and foreign fighters can perform. This kidnap/capture action corresponds to Epstein’s “jailing” of civilians.
A decision was made to have these interactions occur based on the relative professionalism of each of the individuals and their corresponding observe, orient, decide, and act (OODA) loop. Thus, the following logic is applied in the model:
Coalition forces have an arrest OODA loop of 6 hours based on their higher operational tempo (OPTEMO).
The civilians with IA jobs will have an arrest OODA loop of 12 hours since they are less professional than the Coalition forces
The civilians with IP jobs will have an arrest OODA loop of one day since they are less professional than both the Coalition forces and the Iraqi army.

D-14
© 2011 The MITRE Corporation. All rights reserved.
The civilians with Sahwa jobs will have a capture OODA loop of one day, also due to their being less professional than the Coalition forces and the IA. Note though that their OODA loop only will result in them occasionally killing someone. This is based on data from the AOI that indicates that although the Sahwas are armed, they do not “arrest” other civilians, but do occasionally kill other civilians.
Foreign fighters could have a kidnap OODA loop of 6 hours or less. Since they are not as constrained by rules of engagement as the Coalition forces the foreign fighters could have an OODA loop of less than 6 hours; however, the current version of the model implements 6 hours for symmetry with the Coalition forces.
The civilians with Insurgent jobs will have a kidnap OODA loop of 12 hours since they are not as organized as the foreign fighters.
The civilians with the Trouble Maker jobs will have a kidnap OODA loop on one day since they also are a loosely organized group and are not as organized as either the foreign fighters or the insurgents.
Applying the above logic for the OODA loops for these entities results in the Coalition forces being able to arrest civilians with an expected value of once every 6 hours (or 360 time steps), the IAs being able to arrest with an expected value of once every 12 hours (or 780 time steps), the IPs being able to arrest with an expected value of once every day (or 1440 time steps) and the Sahwas having the chance of killing someone with an expected value of once every day (or 1440 time steps). Similarly the foreign fighters, insurgents, and trouble makers are able to kidnap other individuals with an expected value of once every 6 hours, once every 12 hours, and once every day, respectively.
If the agents do go through their arrest/kidnap process, they will compare their activations and then act accordingly. (Note that the Coalition forces and the foreign fighters will always be activated.) The interaction thus may be something akin to an active agent will first look for other active agents within its vision with whom to interact. If other active agents are found agents will compare their activations. To implement this approach, we chose to multiply the activations, resulting in a capture/kill value. This capture/kill value will have a positive value for agents with similar activations and a negative value for those agents with different activations. The capture/kill value would then range from -1 to 1. This construct has intuitive appeal because when an agent that is not too activated (an Iraqi cop) runs across a very active red agent, that agent could be driven to kill the red agent even though that is not what they would normally do. Conversely a highly active agent (like the Coalition) might move to capture an agent rather than kill them if they find a red agent that is only slightly activated.
The actual decision on whether to engage in capture or kill actions also is based on the relative professionalism/organization of the various jobs. An agent’s relative professionalism is used to determine the capture/kill value at which an interaction will result in a capture or a kill. Those agents who are more professional or more organized will have lower capture and kill thresholds, and those agents who are less professional/less organized will have higher capture and kill thresholds. Thus, agents who are more professional will only capture and kill other agents who are extremely active and anti- the institution represented by the capturing agent .

D-15
© 2011 The MITRE Corporation. All rights reserved.
The unclassified capture and kill thresholds that are currently used in the model are displayed in Table D-1 below. Note that since there is symmetry in the OODA loops for the different professions, this symmetry is displayed in Table D-1. By symmetry we are referring to the fact that the Coalition forces and foreign fighters currently have the same OODA loop duration of 6 hours, IAs and insurgents have OODA loop durations of 12 hours, and the IPs, Sahwas, and Trouble Makers have an OODA loop duration of once per day.
Table D-1. Capture and Kill Thresholds
Capture Threshold
Kill Threshold
Coalition Forces & Foreign Fighters
-0.5 -0.8
IAs & Insurgents -0.45 -0.75
IPs, Trouble Makers & Sahwas* -0.35 -0.65
*Sahwas only have the ability to kill other civilians, not capture, thus the above Capture Threshold does not apply to them.
It is also possible for an agent to be misidentified as either a target for capture or misidentified as a target for being killed. Thus, the model includes the possibility that an agent, who has arrest/kidnap as a behavior, may misidentify a civilian as a target for either capturing or for killing. The probability an agent will misidentify a civilian as a target is also based on the capturing agent’s relative professionalism. Those agents who are more professional are less likely to misidentify a civilian as a capture/kill target, while those who are less professional are more likely to misidentify a civilian as target. The mis-identification capture and kill probabilities for the different levels of professionalism are listed in Table D-2 below. Note that in the current model formulation, the civilians with the Sahwa job do not have the ability to mistakenly capture and kill. Further note that the Foreign Fighters and the Insurgents will target the ILG job solely with no opportunity of misidentifying the target; then if and only if there are no ILG in the area will the Foreign Fighters and the insurgents target other actively anti-FF agents and also have the possibility of misidentifying actively anti-FF civilians.

D-16
© 2011 The MITRE Corporation. All rights reserved.
Table D-2. Probability of Misidentifying Targets
Probability of Misidentifying a Target for Capture
Probability of Misidentifying a Target for Killing
Coalition Forces & Foreign Fighters
0.01 0.005
IAs & Insurgents 0.017 0.008
IPs & Trouble Makers
0.033 0.017
Note that in the current model, the interaction dynamics between the Coalition forces and the civilians are not particularly meaningful. For example, house-to-house visits are being conducted in the AOI, but they are not directly modeled in the current version. Additionally, male Coalition forces and female civilians do not interact directly in the AOI and the current version of the COIN Model does not take that into account. This is a known deficiency in the model and one that we intend to resolve in the future. One implementation may be to compare certain attributes (such as gender and age) of the Coalition forces and the civilians to determine whether they would interact or not.
D.2.1.12.2 Providing Blue HUMINT
In addition to the symmetrical capture/kill actions, those civilians that are activated in their Blue HUMINT job will look around for caches. They look around for caches during their movement action. If they are active in their job and they see a cache, they add that cache’s location to their own internal list of cache locations. This internal list of cache locations has a “memory” associated with it such that its maximum size is randomly assigned as 7 +/- 2 items. When the internal list of caches reaches its maximum size, before a civilian can add a new piece of information to the list, the civilian will randomly remove one of the older items on the list.
Once a day, if their internal list of cache locations is not empty, they will report a cache location to the Coalition Force’s Forward Operating Base (FOB). To do this, they just choose at random one of the locations on their internal list of cache locations. This location is then placed on the FOB’s global list of cache locations.
D.2.1.12.3 Providing Red HUMINT
Similar to the Blue HUMINT, those civilians that are activated in their Red HUMINT job look around for Coalition patrols and convoys. If they are active in their job and they see a patrol or convoy, they add the location where that convoy or patrol was seen to their own internal list of Coalition locations. This internal list also is limited in size and is assigned a maximum size of 7 +/- 2 items. When the internal list of caches reaches its maximum size, before a civilian can add

D-17
© 2011 The MITRE Corporation. All rights reserved.
a new piece of information to the list, the civilian will randomly remove one of the older items on the list.
Once a day, if their internal list of Coalition locations is not empty, they will report a Coalition location to a bomber. They will first check their social group to determine if someone in their social group is an Insurgent bomber. If so, they will randomly chose one of the locations on their internal list of Coalition locations and provide it to the Insurgent bomber. If they do not have an Insurgent bomber within their social group, they will report the Coalition location to the nearest geo-spatially located Foreign Fighter bomber. In either case, the bomber adds that location to their “good locations” for placing bombs.
D.2.1.12.4 Insurgent Behaviors
The general behavior for a civilian with an insurgent job is to conduct kidnapping (i.e., doing an action similar to “enforce” in the Epstein Rebellion model) and occasionally killing. The insurgents would mostly kidnap unless they came across someone whose activation values were so opposite theirs on the foreign fighter activation scale that they would instead kill the target instead of killing them. Thus, a higher level of violence (killing) will occur only if the insurgent kidnapper is fairly extreme (i.e. “radical”).
D.2.1.12.4.1 Insurgent Bomber Behavior
If the civilians with the Insurgent job are highly activated, meaning that they are very radical, they will become Insurgent bombers and will behave just like the Foreign Fighter bombers (see Section D.2.2.4.2) and will emplace and explode IEDs along the roads. These civilians can return to being regular Insurgents (i.e., conducting capture/kill activities) if their activation value along the Foreign Fighter vector falls below a certain threshold value.
We are currently conducting research into the question about whether a high degree of radicalization would mean that one would be more partial to inflicting direct personal violence (i.e., kidnapping and killing as it is currently represented within the model) instead of “indirect” violence (i.e., placing and exploding IEDs as represented within the model). We are also exploring whether this is culturally dependent or not.
If indeed it makes more sense that less radicalized individuals would become bombers and more radicalized individuals would conduct the direct personal violence, we will change the model accordingly. If, however, we determine that the pool of bombers and kidnappers do not necessarily have to be radicalized in a certain way, we will change the model such a probability draw is performed on the pool of civilian insurgents to distinguish between the insurgent bombers and the insurgent kidnappers.
D.2.2 Coalition and Foreign Fighter Parameters
D.2.2.1 Coalition and Foreign Fighter Attributes
The Coalition forces and the foreign fighter’s breeds do not have most of the attributes and parameters discussed above for the civilian breed. However, these two breeds do have activation parameters similar to the civilians. Unlike the civilians, these activation values are not dynamic. The Coalition forces agents have a value of 1 for their Coalition level of activation,

D-18
© 2011 The MITRE Corporation. All rights reserved.
-1 for their foreign fighter level of activation, and a 1 level of activation for the other three levels of activations (i.e., for the Iraqi Army, Iraqi Police and Sahwas). The foreign fighter agents have a value of 1 for their foreign fighter level of activation and a -1 level of activation for the other four levels of activation (Coalition, Iraqi Army, Iraqi Police, and Sahwas). As discussed in Section 3, a negative activation value indicates that the agent is actively-anti an institution, while a positive activation value indicates that the agent is actively-pro an institution.
D.2.2.2 Coalition Patrol Behavior
There are two types of patrols – those that go on a “regular” patrol of an area and those that go on “named operations”. The majority of the patrols go out on “regular” patrol; however, 10% of the time (this is a parameter that can be varied), the patrols will go out on “named operations”. For the current COIN Model a “named operation” is one where the patrol goes out to secure and destroy an IED cache if the Forward Operating Base (FOB) has received information about a cache location.
If the FOB’s list of cache locations is not empty and a random draw is less than 0.1, the patrol is designated to go out on a “named operation” and it will randomly pick a cache location from the FOB’s list of caches. The patrol will then take the shortest path (not necessarily staying on roads) to locate, secure, and destroy the cache. After securing the cache, the patrol will return to the FOB.
If the global cache list is empty or the random draw is greater than or equal to 0.1, the patrol is designated as a “regular” patrol. For these patrols, the patrol agent picks two points of interest as specified by the input bmp file. The patrol then follows a minimum path along roads to the first point of interest. Once they reach the first point of interest they follow a minimum path along roads to the second point of interest. Once the second point of interest is reached they will follow a minimum path back to their base, still staying on the roads. While they are on patrol they look for bombers placing IEDs and emplaced IEDs. If they come upon a bomber placing a bomb within their visual range they “kill” the bomber. If they are attacked while on patrol they head back to base immediately via a minimum path.
D.2.2.3 Coalition Convoy Behavior
Currently in the model up to two convoys per day can be activated. The convoys vary in size from 2 to 10 vehicles. The convoys will randomly choose one of two convoy routes and travel along the chosen route. The convoy’s only behavior is to stay on the roads as they traverse their convoy route. Their travel can be observed by the foreign fighters and the civilians in the Red HUMINT job and the convoys can be targets of the emplaced IEDs.
D.2.2.4Foreign Fighter Bomber, Bomb Maker, and Cache Behaviors
D.2.2.4.1 Cache & Bomb Maker Behavior
Caches have a location and “store” bomb making materials for use by bomb makers. The bomb makers can only make bombs if they are collocated with a cache. The current COIN Model has n caches and n/2 bomb makers, where n can vary from 0 to 50. The caches and bomb makers are

D-19
© 2011 The MITRE Corporation. All rights reserved.
randomly instantiated in the more urban areas of the terrain environment. Bomb makers will then randomly choose a cache to be their cache for purposes of producing bombs and if they are not collocated with the cache they will move towards the cache.
Once the bomb makers are collocated with their cache, they will produce bombs at a given probabilistic rate. On average, bomb makers will make a bomb in about 16 hours. Each bomb maker has a certain set of characteristics that describe their bomb-making ability. This set of characteristics is defined in a bit string (see Section D.2.2.4.4 on the bit utility). On average a bomb maker will try something new (a different design feature or a different combination of a design feature) one quarter of the time. When a bomb is produced it is given a set of defining characteristics described by its bit string (such as blast radius and fragmentation type) and then it is added to the list of bombs that are available at the cache for bombers to pick up for use.
D.2.2.4.2 Bomber Behaviors
The current COIN Model randomly instantiates bombers in the more urban areas of the terrain environment. The number of bombers instantiated for a given run can vary from 0 to 100. Upon instantiation a bomber does not have a bomb, so the bomber will select a cache to move towards to obtain a bomb. If that cache currently has a bomb available for pick up, the bomber moves towards the cache fairly slowly (half a pixel per time step). Once the bomber has made it to the cache, the bomber obtains a bomb. The bomber now takes the bomb to a randomly-selected “good place” (i.e., a road edge as defined in the imported bmp file that has its good-area? parameter set to “true”). “Good Places” are road edges in a neighborhoods whose civilians’ mean Coalition attitude is anti-Coalition (i.e., the mean attitude towards the Coalition is less than the threshold value of -0.1).
Once at the emplacement spot the bomber will “place” the bomb. Placement takes a random uniform period of time from 0 to 99 time steps. After placement is completed the bomber waits for a good time to explode the bomb. The amount of time a bomber is willing to wait is a random number drawn from a random uniform distribution of 250 to 499 time steps. During the waiting period the bomber is able to blow the bomb up if the number of patrols within the bomb’s radius is greater than zero. If the bomber does not see a patrol within the bomb’s radius by the time the wait time reaches the maximum wait time, the bomber essentially abandons the bomb and begins the cycle again by returning to the cache and obtaining a new bomb.
D.2.2.4.3 Effect of the Bomb (Target Utility)
Given the characteristics of the bomb, when the bomb explodes it will have a certain blast radius ranging from approximately 10 to 170 meters. All agents (except the bomber) that are within the blast radius are asked to determine the effect that the bomb’s blast had on them9.
9 In the current COIN Model, the bomber does not get affected by the bomb even if the bomber is
within the bomb’s blast radius. We realize that this is a current limitation in the model and it is due to a modeling artifact in that if the bomber dies, in some rare cases we found that the model would crash. This is due to implementation and we are looking into ways to remedy this.

D-20
© 2011 The MITRE Corporation. All rights reserved.
When agents determine the blast effect they compare a set of the bomb characteristics with a set of their characteristics. For example, the agents compare the type of fragmentation coming from the bomb to the protective gear (if any) that they have. After the comparison is made a random draw occurs to determine if the agent was killed or not. The more dissimilar the characteristics the less likely the agent is to being killed.
Once the bomb has exploded and the appropriate agents have been affected by the bomb, the bomber conducts a battle damage assessment to determine the effectiveness of the bomb against Coalition forces. This assessment is made available to all bomb makers. When successful bombs have been highlighted there is a very heavy bias for all bomb makers to adopt one of the successful designs. If a design previously deemed successful is used in an unsuccessful attack that design is immediately removed from the successful list.
D.2.2.4.4 Bit Utility
The physical characteristics of agents are encoded in a bit string. A bit string is a series of 0s and 1s that have a specific interpretation within the system. The bit string can be thought of as the genetic code of the agent. The bit string itself is an agent’s genotype and how it is used becomes the agent’s phenotype. Different agents have different bit strings giving them unique sets of characteristics. This is a very common way to encode agent characteristics. Moreover, using bit strings allows us to add in evolutionary and learning dynamics into the model. (The coevolutionary dynamics included in the current model are discussed in more detail in Section D.2.2.4.5 below.)
The ability to compare bit strings is very important, especially as bit strings will encode such features as vehicle protection and bomb blast size. One standard way to measure the difference between two bit strings is called the Hamming Distance (HD)10. Essentially HD is a way of measuring the distance between two bit strings based upon their differences. For example, if bit string A is (0 0 0 0) and bit string B is (1 0 0 0), the HD between A and B is 1.
In the current model, every agent (including the civilians) has its own bit string that contains 12 individual pieces of information. To provide an example of how the bit string is used in the COIN Model, note that the first four bits are used for a comparison of IED bomb types and degrees of armor protections. For example, a Mine Resistant Ambush Protected vehicle (MRAP) might have the first four bits of information stored as (1 1 1 1) indicating it has an extremely high degree of protection from bombs, while an up-armored High-Mobility Multi-Wheeled Vehicle (HMMWV) might have (1 1 0 0) for its first four bits of information. Additionally, say there are two IED bombs that have different levels of effectiveness: IED A has (0 0 0 0) as its first four bits of information indicating that it is a very small, poorly placed IED; and IED B has (1 1 0 0) as its first four bits of information indicating that it a relatively complex, well-
10 Hamming, Richard W. (1950). Error Detecting and Error Correcting Codes. Bell System Technical
Journal, 26 (2), pp. 147-160.

D-21
© 2011 The MITRE Corporation. All rights reserved.
positioned bomb with a relatively large effective burst radius. If IED A detonates near the MRAP, no damage will be done to the MRAP since there are no bits that match. However, if IED B is detonated near the HMMWV, since the four bits match completely, the HMMWV will be destroyed.
D.2.2.4.5 Co-Evolution
Co-evolution is a concept from evolutionary biology. It is used to describe a situation where the fitness of one species is affected by the fitness of another; therefore, changes to one species will prompt changes in the other, coupled species. This creates the “red queen” effect11: a species must continually adapt just to maintain its current level of fitness. In the current context the Coalition and the Foreign Fighters have coupled fitness. As one becomes more successful the other becomes less successful. For example, when the bombers discover a more effective bomb to use against Coalition forces the fitness of the Coalition will go down. For the Coalition to maintain (or return to) its previous level of fitness it must adapt to the new bomb being made by the Foreign Fighters.
Returning to the concept of Hamming Distance, one can measure the coadaptation between the two groups by measuring the HD between the two groups through time. Figure D-3 below shows the HD between Coalition vehicle armament and IED blast “effectiveness” for two runs of the model. In these two runs, the Coalition forces are using a fixed homogeneous type of vehicle protection scheme. The top graph of Figure D-3 shows that the Foreign Fighters have a very hard time finding a bomb design that works consistently against Coalition forces. Recall that if a bomb design is successful that information is broadcast to all bomb makers and if the design is ever unsuccessfully employed the design is then “removed” from favor. That dynamic, coupled with the fact that the bombers are receiving good/bad feedback from a biased stochastic process, means that bomb makers receive very poor information about the effectiveness of their bombs. Note too that this is further exacerbated by a small sample size of bombs exploding. However, if bomb makers do happen upon one optimal bomb design, there is virtually complete lock-in on that bomb design. This is shown in the bottom HD chart of Figure D-3 where the HD goes to zero.
11 Van Valen L. (1973). A New Evolutionary Law. Evolutionary Theory, 1, p. 1-30.

D-22
© 2011 The MITRE Corporation. All rights reserved.
Figure D-3. Hamming Distance Examples of Non-Optimal Bomb Designs (top graph) and Optimal Bomb Design (bottom graph)

E-1
© 2011 The MITRE Corporation. All rights reserved.
Appendix E Emotional and Attitudinal Convergence

Consulting
Group
Inc.
2403 San Mateo Blvd. NE Suite W-12 Albuquerque, NM 87110
Voice 505.889.3927 Fax 505.889.3929 www.galisteoconsulting.com
Emotional and attitudinal convergence Jessica Glicken Turnley, Ph.D.
January 2004
This construct in the SELDON model is based upon affect, which includes both emotions (short
and mood) and attitude. Affect itself is composed of both moods, which are of low intensity,
generally diffuse, enduring, and have an unclear immediate cause and little cognitive component,
and emotions, which are high intensity, short-lived, have a definite, identifiable cause, and clear
cognitive content (Forgas 1995:41). It assumes that two agents (either two individuals or an
individual and an abstract agent) come together, have some level of attractiveness for each
other (represented as „stickiness‟ in the case of the mosque abstract agent), and then exchange
„affect‟ according to some formula. This exchange causes the individual agents to move in one
direction or the other on a „gruntlement‟ scale.
If we begin with the basis for attraction, the literature strongly supports the notion of
homophily, that is, like will seek like (Byrne 1971; Deutsch and Mackesy 1985; Fargas 1995;
Kenny and Kashy 1994; Locke and Horowitz 1990). Locke (2003) notes that “numerous studies
found that shared attitudes typically invoke positive feelings and facilitate interpersonal
attraction…people find it more comforting to share experiences with others who are
experiencing similar apprehensions (Schachter 1959), moods (Locke and Horowitz 1990), or
problems (Hegelson and Taylor 1993)” (Locke 2003:620). Contrasting attitudes produce the
opposite effect, that is, individuals with contrasting moods will repel each other rather than
exhibit a neutral force (Locke 2003; Locke and Horowitz 1990).
There is much less available on emotional and attitudinal convergence. Locke (2003) notes that
similarity in historic relationship studies has been used to predict preferences, not as a focus
of comparison itself (Locke 2003:620). However, Anderson et al‟s very recent study (2003) of
emotional convergence notes that “…the emotions of individuals in relationships will become
increasingly similar over time… emotional similarity, it is believed, promotes coordinated
thoughts and actions, mutual understanding, and interpersonal cohesion and attraction”
(Anderson et al 2003:1054). The authors also note that individuals are “quite susceptible to the
social transmission of emotion,” or what they call “emotional contagion” (Anderson et al
2003:1055). Strack and Coyne (1983) found that happy people working with depressed or sad
people tended to become sad very quickly. Gotlieb and Robinson (1982) had similar results.
If we rephrase this in constructs that can be accommodated by computational models, we find
the following.

Consulting
Group
Inc.
Emotional and attitudinal convergence ….2 January 2004
Each individual agent should be assigned an initial 'gruntlement' level according to a
normal distribution. For clarity, let's say that anything to the 'right' of the midpoint
has a positive sign, and anything to the 'left' has a negative sign.
When two agents with the SAME SIGN come together, the following happens (it doesn't
matter if the sign is negative or positive)...
o A relationship will be established. Like does bond with like
o Over time, both agents will move in the direction of their sign (i.e. away from
the midpoint) AND will converge in their value. That is, they will become more
like each other in their attitudes and those attitudes will be reinforced, i.e. will
become stronger. It is unclear from the literature if they will converge to an
average, or a point closer to one of the other agent‟s original „gruntlement‟
value. We assume they will converge to the average plus some value in favor of
the more extreme agent, i.e. both agents will end up about 3/4 of the initial
distance between them in favor of the more extreme agent. They will
simultaneously move in the direction of the endpoint of the axis.
If the agents' SIGNS ARE DIFFERENT, that is, if one is plus and the other minus, the
following will happen.
o The most likely scenario is that THERE WILL BE NO RELATIONSHIP. The
probability of a relationship forming decreases as the value between the
gruntlement levels of the two agents increases. The closer their original
gruntlement values (i.e. the closer to the midpoint), the more likely the two
agents are to form a relationship. However, even with the smallest difference
in value, the difference in SIGN means that the probability of their forming a
relationship is small (estimated at 20%).
o If the two agents do form a relationship, over time (relatively quickly) the
positive sign will become negative, and the gruntlement values of the two agents
will begin to converge, again in favor of the agent with the greatest NEGATIVE
gruntlement value (highest level of disgruntlement).

Consulting
Group
Inc.
Emotional and attitudinal convergence ….3 January 2004
References
Byrne, D 1971 The Attraction Paradigm Academic Press (New York, NY)
Deutsch, FM and Mackesy, ME 1985 “friendship and the development of self-schemas: the
effects of talking about others” Personality and Social Psychology Bulletin 11:399-408
Forgas, JP 1995 “Mood and judgment—the affect infusion model (AIM)” Psychological Bulletin
1995:117(1):39-66
Gotlieb, IH and Robinson, LA 1982 “Responses to depressed individuals: discrepancies
between self-report and observer-related behavior” Journal of Abnormal Psychology 91:231-
240
Hegelson and Taylor 1993
Kenny, DA and Kashy, DA 1994 “Enhanced co-orientation in the perception of friends: a social
relations analysis” Journal of Personality and Social Psychology 1994:67:1024-1033
Locke, KD 2003 “Status and solidarity in social comparison: agentic and communal values and
vertical and horizontal directions” Journal of Personality and Social Psychology 2003:84
(3):619-631
Locke, KD and Horowitz, LM 1990 “Satisfaction in interpersonal interactions as a function of
similarity in level of dysphoria” Journal of Personality and Social Psychology 1990:58(5):823-
831
Schachter, S 1959 The psychology of affliction Stanford University Press (Stanford, CA)
Strack, S and Coyne, JC 1983 “Social confirmation of dysphoria: shared and private reactions
to depression” Journal of Personality and Social Psychology 44:798-806
Anderson, C, Keltner, D, John, OP 2003 “Emotional convergence between people over time”
Journal of Personality and Social Psychology 2003:84(5):1054-1068

F-1
Appendix F White Papers Developed for the COIN Model by Galisteo Consulting Group, Inc.

Consulting Group Inc
2403 San Mateo Blvd. NE Suite W-12 Albuquerque, NM 87110
Voice 505.889.3927 Fax 505.889.3929 www.galisteoconsulting.com
Relative Deprivation Jessica Glicken Turnley, Ph.D.
American sociologist Robert K. Merton was among the first (if not the first) to use the
concept of relative deprivation in order to understand social deviance, using French
sociologist Emile Durkheim's concept of anomie as a starting point.1 Merton may have
given one of the earliest formal treatments of relative deprivation in his exegesis of a
War Department study, The American Soldier.2 Merton’s treatment focuses on the
contributions of relative deprivation to reference group theory (the selection and use of
certain social groups by an individual in the process of identity formation), but there is
much there that is of interest to a general discussion of the term.
Merton defines relative deprivation by giving examples from The American Soldier of
the ways in which the term is used. He points out three general frames of reference for
the soldiers that they use for self-definition (i.e. three different types of reference
groups): those with whom they were in actual contact or association, those of the same
status or the same social category, and those of a different status or social category.3
He later gives a definition-in-use for relative deprivation: “the concept was primarily
utilized to help account for feelings of dissatisfaction, particularly in cases where the
objective situation would at first glance not seem likely to provoke such feelings.”4
1 Robert K. Merton. 1938. "Social Structure and Anomie". American Sociological Review 3: 672-82
2 Social Psychology in World War II. Four volumes. Princeton University Press. Princeton, NJ 1949-1950. Volume I: The American Soldier: Adjustment During Army Life by Samuel A. Stouffer, Edward A. Suchman, Leland C. DeVinney, Shirley A. Star, and Robin M. Williams, Jr.; Volume II: The American Soldier: Combat and Its Aftermath by Samuel A. Stouffer, Arthur A. Lumsdaine, Marion Harper Lumsdaine, Robin M. Williams, Jr., M. Brewster Smith, Irving L. Janis, Shirley A. Star, and Leonard S. Cottrell, Jr.
3 Robert Merton. 1957. Social Theory and Social Structure (Revised and enlarged edition). The Free Press. New York, NY. P.225
4 Ibid. p.235

Consulting Group Inc.
Relative Deprivation ….2
Walter Runciman uses the same categories as Merton but calls them egoistic (when referring to the group of which the target is a member) and fraternalistic (when referring to groups of which the target is not a member). He goes further and suggests that efforts to correct egoistic instances of relative deprivation are likely only to affect the target, whereas efforts to correct fraternalistic deprivation are likely to lead to social strife or to stimulate the rise of large social movements.5,6,7 Merton’s interests were sociological not psychological. As mentioned earlier, he saw
relative deprivation primarily in the context of reference group theory which is clearly a
sociological concept. However, the notion that satisfaction depends upon relative not
absolute position also has credence in the psychological literature.8 That said, most of
the literature on relative deprivation comes from the social rather than the behavioral
sciences.
About ten years later, we see one of the first formal definitions of relative deprivation.
Walter Runciman identified four preconditions of relative deprivation, when speaking of
person A and object X:
A does not have X
A knows of other persons that have X
A wants to have X
A believes obtaining X is realistic9
Most definitions have these parameters:
a person A;
person A’s reference group;
5 Walter Garrison Runciman 1966. Relative deprivation and social justice : a study of attitudes to social inequality in twentieth-century England, University of California Press. Berkeley, CA.
6 Merton. 1938. op. cit.
7 Ted Robert Gurr. 1970. Why Men Rebel. Princeton University Press. Princeton, NJ.
8 Martin Ravallion and Michael Lokshin. 2005. “Who Cares about Relative Deprivation?”, World Bank Policy Research Working Paper 3782, December 2005 p.1836
9 Runciman. 1966. op.cit

Consulting Group Inc.
Relative Deprivation ….3
X, the ‘thing’ in question which A and the reference group either have or
don’t have; and
the belief on the part of A that obtaining X is realistic or at least possible. 10,11
The analyst must also define the reference group to be either egotistic or fraternalistic. Note that relative deprivation can have a positive value. Person A can perceive himself as better off than his reference group if he has X and the reference group does not. There are some interesting implications that stem from these definitions for social
programs that target improvements in quality of life. Programs that exhibit equity in
application, i.e. that target all segments of the population equally, are likely to fail to
raise satisfaction or happiness in any segment. 12
[the] striking finding in regressions for self-assessed happiness in the U.S. that
the coefficients on log income and log mean ‘neighbors’ income add up to
roughly zero. This implies that an equal proportionate increase in all incomes
(leaving relative inequality unchanged) would have no impact on average
happiness.13
Relative deprivation has also been known to occur when expectations have not been
met or have been only partially met, even if the targeted individuals are objectively
better off than they were had the program not been implemented at all.
Relative deprivation may also be temporal; that is, a group that experiences
economic growth or an expansion of rights, followed by stagnation or recession
of those processes may experience 'relative deprivation.' Such phenomena are
also known as unfulfilled rising expectations.14
10 Kurt Bayertz. 1999, Solidarity, Springer.
11 Richard T. Schaefer. 2008. Racial and Ethnic Groups, 11th Ed. Pearson Education
12 Ravallion and Lokshin. 2005. op.cit.
13 Ibid.
14 Diana Kendall. 2005. Sociology In Our Times,. Thomson Wadsworth.

Consulting Group Inc.
Relative Deprivation ….4
It is this temporal social deprivation that has most often been cited by social scientists
as the stimulus for violent social movements such as insurgencies or civil war, or for
socially deviant behavior such as crime. 15,16
There are clear implications here for the U.S. and its strategic communication programs
and objectives in nation-building activities. Promulgating objectives or setting targets
that later are not met might be more destructive than setting initial lower goals which,
in fact, can be achieved. Also, security in the social arena might be more effectively
achieved through inequitable implementation of social development programs.
15 Merton. 1938. op. cit.
16 Gurr. 1970. op.cit.

Consulting
Group
Inc.
2403 San Mateo Blvd. NE
Suite W-12
Albuquerque, NM 87110
Voice 505.889.3927
Fax 505.889.3929
www.galisteoconsulting.com
Measuring Risk Attitudes Jessica Glicken Turnley, Ph.D.
[email protected] June 2008
‗Risk aversion‘ is a dimension of a construct addressed in the literature as ‗risk attitude.‘1 Risk attitude describes decision making over quantifiable alternatives under conditions of uncertainty. This short white paper will give a very brief overview of a huge volume of literature, both theoretical and empirical, that has addressed various aspects of risk attitude and decision making under uncertainty. As these conditions are pertinent in environments where decisions can have significant consequences, such as medicine and economics, these types of decisions have received tremendous theoretical and experimental attention. We will not attempt to cover the field in detail here, but will give enough background and context to understand and defend the assignment of a risk attitude value to our agents. The classic approach to risk attitude evaluates the behavior of an individual when faced with choices between quantified outcomes expressed in terms of probabilities.
[I]ndividuals who prefer a guaranteed outcome to a gamble when the expected value of the gamble is equal to the guaranteed outcome are said to be risk averse. Individuals who prefer a gamble to the guaranteed outcome when the expected value of the gamble is equal to the guaranteed outcome are said to be risk averse. Individuals who prefer a gamble to the guaranteed outcome when the expected value of the gamble is equal to the value of the guaranteed outcome are said to be risk seeking. Finally, if an individual is indifferent between a guaranteed outcome and a gamble with the same expected value, he or she is expected to be risk neutral.2
1 Barry O’Neill. 1998. Risk Aversion in International Relations Theory. Projektbereich B:
Discussion Paper No. B-445. Dec. 1998. 2 Allison B. Rosen, MD, MPH, Jerry S. Tsai, MS, Stephen M. Downs, MD, MS. 2003. Variations in
Risk Attitude Across Race, Gender, and Education. Medical Decision Making (Nov-Dec 2003). Pp.511-517. P.511.

Consulting
Group
Inc.
Measuring Risk Attitudes ….2 June 2008
Until recently, expected utility theory3 was the theoretical base for almost all studies of decision making. ―Implicit in this theory is the assumption that individuals have stable and coherent preferences; they know what they want and their preference for a particular option does not depend on the context.‖
4 Here, ―risk attitude is nothing more than a descriptive label for the shape of the utility function presumed to underlie a person‘s choices.‖
5 Evidence now seems to show that most individuals show a concave risk function,6 that is, they are risk seeking over small stakes and risk avoiding over large.7
Expected utility theory is a cognitively based approach to decision making. Affect or feeling enter (if they do at all) only as part of the decision maker‟s calculation about how he would „feel‟ about a given outcome. These anticipated emotions thus are incorporated into the determination of value of that outcome.8 Under to expected utility theory, determination of an individual‟s risk attitude as risk seeking, risk avoidant, or risk neutral assumes some abstract, objective point of risk neutrality against which such a position can be measured. In 1979, Daniel Kahneman and Amos Tversky introduced a variant on this approach which they called prospect theory. 9 Under prospect theory (which has since received a great deal of theoretical and experimental attention), each decision requires that the decision maker establish a specific point against which gains or losses are measured For example, the decision maker‟s monthly net pay might be that established point. Any additional withholding from his paycheck is seen as a loss, rather than as a smaller gain over no paycheck. However, aside from this
3 See J. von Neuman and O. Morgenstern 1947 Theory of games and economic behavior, 2nd ed.
Princeton, NJ: Princeton University Press 4
Ted Martin Hedesström. 2006. The psychology of diversification: Novice investors’ ability to spread risks. Department of Psychology, Göteborg University, Gothenburg, Sweden P.2
5 Elke U. Weber, Ann-Renee Blais, and Nancy E. Betz. 2002. A Domain-specific Risk-attitude Scale:
Measuring Risk Perceptions and Risk Behaviors. Journal of Behavioral Decision Making vol.15. Pp.263-290. P.264.
6 O’Neill. Op.cit. P.4
7 Helga Fehr-Duda, Adrian Bruhin, Thomas F. Epper, and Renate Schubert. 2008. Rationality on
the Rise: Why Relative Risk Aversion Increases with Stake Size. Socioeconomic Institute, University o f Zurich. Working Paper No. 0708, February 2008, revised edition.
8 George F. Loewenstein, Christopher K. Hsee, Elke U. Weber, and Ned Welch. 2001. Risk as
Feelings. Psychological Bulletin. Vol.127 No.2. Pp.267-286. 9 Daniel Kahneman and Amos Tversky. 1979. Prospect Theory: An analysis of decision under risk.
Econometrica. Vo. 47 No.2:263-291

Consulting
Group
Inc.
Measuring Risk Attitudes ….3 June 2008
requirement, prospect theory appears to proceed with the decision calculation much in the same way as expected utility theory. The difference is that a risk avoidant or risk seeking stance must be determined relative to a decision maker-defined endpoint.
The present analysis of preference between risky options has developed two themes. The first theme concerns editing operations that determine how prospects are perceived. The second theme involves the judgmental principles that govern the evaluation of gains and losses and the weighting of uncertain outcomes.10
The most radical breaks with expected utility theory have come recently in two areas. The first has to do with challenges to the purely cognitive processes that are presumed to drive calculations of expected value (true under prospect theory as well). The second is a more global challenge to the nature of the decision itself. Recent advances in the emerging field of cognitive neuroscience have led to a new subdiscipline called neuroeconomics. Neuroeconomics uses the techniques and tools of cognitive neuroscience (using fMRI‟s to map the brain‟s activity during decision making) to better understand how we actually make decisions. 11 Although the field is still in its infancy, evidence is beginning to show that there is a significant affective component to what had historically been considered a purely cognitive process. Lowenstein et. al. called this „anticipatory emotion‟ to distinguish the emotions felt at the time of decision making from the emotions the decision maker projected onto the future state and included in his calculations of value (anticipated emotion). The same paper also provides a review of more traditionally conducted economic experiments to support the influence of anticipatory emotion on decision making under uncertainty.12 The second departure from expected utility theory may have relevance for our model. In this case, the challenge is to the definition of the decision. In almost all experiments using expected utility theory, the decision itself – the way it was
10 Ibid., P.289
11 Camerer, Colin F., Loewenstein, George F. and Prelec, Drazen, Neuroeconomics: How
Neuroscience Can Inform Economics. Journal of Economic Literature, Forthcoming Available at SSRN: http://ssrn.com/abstract=590965 accesses 6/27/08
12 Loewenstein et al. op. cit.

Consulting
Group
Inc.
Measuring Risk Attitudes ….4 June 2008
framed and presented to subjects – was treated as an independent variable. The dependent variable was the response, and that response was calibrated as a measurement of risk attitude. Behavioral decision research suggested that different responses to the same decision are a function of far more complex factors than just risk attitude. Behavioral decision research is driven by an interest in exploring “the perceptual, cognitive, and learning factors that cause human decision behavior to deviate from that predicted by the normative „economic man‟ model.”13 The result is a construct that argues that decisions are constructed based on the decision maker‟s assessment of the decision-in-context. Risk attitude thus will become highly time, space, and person-specific. The following rather lengthy quote sums up the findings of a review of literature in the field:
First, decisions often involve conflicting values, where we must decide how much we value one attribute relative to another. In trying to deal with such conflicts, individuals often adopt different strategies in different situations, potentially leading to variance in preferences. Second, decisions are often complex, containing many attributes or alternatives. Since these problems are simplified by decision-makers in different ways, failures of invariance [across decision makers or across decisions by the same decision maker] might be related to task complexity. Finally, although we may know what we get when we choose an option, we may not know how we feel about it. A prestigious Ivy League school may offer a competitive and high-pressure graduate program, but we might be uncertain about how we would like that environment. Hence, invariance may fail because of uncertainty in values, even when we know what we will receive.14
There has been a great deal of research in different aspects of this area. Paul Slovick‘s extensive work on risk perception has made a significant contribution.15 Other work has experimented with the impact of specific variables on decisions in particular domains
13 John W. Payne, James R. Bettman and Eric J. Johnson. Behavioral Decision Research: A Constructive Processing Perspective. Annual Review of Psychology. Vol.43 Pp.87-131. Pp.88
14 Ibid., P.91
15 Slovic’s work is extensive and has been extremely influential. A bibliography can be found on his
web site at http://www.decisionresearch.org/people/slovic/

Consulting
Group
Inc.
Measuring Risk Attitudes ….5 June 2008
such as the impact of race, gender, and education on decision making in medicine16 or on the influence of different content domains on the decisions of the same individual.17 In the later case, for example, differences in decisions ―stem[med] from differences in the definition of what constitutes or contributes to risk in different types of situations, rather than from differences in true attitude toward risk.‖
18 Summary and implications for the model
Expected utility theory (which includes prospect theory) assumes that all actors will use the same formula to calculate the riskiness of a given decision, and that a given actor‘s risk attitude is not decision-dependent. Therefore, it will remain constant from one decision to the next. Individuals, however, do vary in their risk attitude from one another, with the distribution favoring the risk avoidant end of an objectively determined scale. Risk attitude curves for an individual will be concave. Prospect theory differs from classic expected utility theory in that it requires that the decision maker determine the mid- or risk neutral point of the risk attitude scale. This also allows for variance from individual to individual, but assumes that such a point is determinable and that, once determined, the decision maker will use the same calculus regarding the actual decision as he would under expected utility theory to determine expected value of a given decision. Risk attitudes still remain constant for an individual over time. Arguably, introducing emotion into the decision calculus (anticipatory emotion, that is, emotion that is experienced at the time of decision making and which subsequently affects the decision) could be handled at this point by introducing some element of randomness into the decision calculus. Addressing constructivist arguments may not be so easy in a global sense, however. Here each decision is a factor of individual variables such as age, gender, culture and personality, as well as situational variables that include how the decision maker is presented with the decision, any ancillary or related information he may have, the difference in content domains among decisions he will have to make, and the like. However, our model is constrained in many of these dimensions. Our agents are making only one decision for which they must be assigned a value for risk attitude. Epstein defines this solely as a function of the probability of arrest, co the content domain is invariant across decision makers and through time. We could make the assumption that all agents of particular group have the same culture and assert that age is not relevant. We could then mark gender so we could distinguish between males and females. They could arguably perceive the costs of being arrested differently, with
16 Rosen et al, op.cit.
17 Weber et. al. op. cit.
18 Ibid., P. 267

Consulting
Group
Inc.
Measuring Risk Attitudes ….6 June 2008
caregivers (women) concerned for abandoned children and family if they are arrested while men may not have the same concerns. Women thus would be more risk avoidant than men in this situation. The only other situational variable we might need to introduce would be the number of arrests already experienced by a particular agent. As that number goes up, the agent may become more risk avoidant.

Consulting
Group
Inc.
2403 San Mateo Blvd. NE
Suite W-12
Albuquerque, NM 87110
Voice 505.889.3927
Fax 505.889.3929
www.galisteoconsulting.com
Legitimacy and Power Jessica Glicken Turnley, Ph.D.
[email protected] August 2008
“Success [for the counterinsurgents] requires the government to be accepted as legitimate by most of that uncommitted middle,
which also includes passive supporters of both sides.”1 Legitimacy has often been claimed as the ‗prize‘ in a counterinsurgency action. However, most treatments of legitimacy are not clear on how it is operationalized nor what its measures of effectivenss should be (i.e. how we would know if we ‗won‘ and legitimacy was established). Furthermore, legitimacy is often confused with power and/or authority. Power is the ability to shape the behavior of others. This is accomplished either by threatening or actually using coercion to deter undesired behavior and/or by promising rewards to promote desired behavior.2 There often is an assumption that a high level or strong threat of coercion would generate a high level of fear, although this is not fully supported by research.3 This is an instrumental or conditional means of social control (‗if I do this, then you will do that‘)4 which fits quite well with a rational choice theory of human behavior. The power of an agent (i.e., its ability to cause other agents to do something) is thus a function of the fear and satisfaction it engenders in a particular target agent. The precise
1 Counterinsurgency Field Manual 1-108
2 Tom. R. Tyler. 2006. Psychological Perspectives on Legitimacy and Legitimation. Annual Review
of Psychology. Vol.57. Pp.375-400 p.376 3 There is research that shows that this correlation is not linear. As the intensity of the ‘fear appeal’
increases, the level of fear may actually decrease. Punam Anand Keller and Lauren Goldberg Block. 1996. Increasing the Persuasiveness of Fear Appeals. The Effect of Arousal and Elaboration. The Journal of Consumer Research. Vol.22 No.4:Pp.448-459
4 Michael Bratton and Robert Mattes. Support for Democracy in Africa: Intrinsic or Instrumental?
British Journal of Political Science Vol.31, no.3:Pp.447-474. P.448.

Consulting
Group
Inc.
Legitimacy and Power ….2 August 2008
relationship of fear and satisfaction is not addressed in the literature. Most of the literature we have seen that deals with this question addresses only one of the variables, so we do not know if their relationship is additive, multiplicative, in direct inverse proportion….Figure 36.illustrates this relationship. We have shown the indifference curve as a space with fuzzy edges to illustrate the imprecise nature of the relationship.
Figure 36: The elements of power
This type of power (the authority resulting from the combined exercise of coercion and reward) can generate support for particular authorities (people) or for particular actions.5 It is particularistic in that regard as it is support not for an institution or a system of government but for a specific action or a specific person. It can be behaviorally measured as the level of congruity between the action required or requested by an agent and the actual action taken by the target agent. A set of actions in a given time period with high congruence with requirements could be aggregated and used as an expression of political support. Instrumental power of the type we just described is a very expensive means of social control because of the element of coercion.6 Coercion is socially expensive. Achieving legitimacy is another way in which regimes can exercise authority, in this case without the threat of coercion or the promise of rewards.7
5 M. Stephen Weatherford. 1987. How Does Government Performance Influence Political
Support? Political Behavior. Vol.9, no.1. Pp.5-28. p.12 6 Tyler. op.cit. p.376
7 R. Ford and C. Johnson. 1998. The perception of power: dependence and legitimacy in conflict.
Social Psychology Quarterly. Vol.61. Pp.16-32; JRP French Jr. and BH Raven. 1959. The bases of

Consulting
Group
Inc.
Legitimacy and Power ….3 August 2008
There is fairly extensive literature defining legitimacy as a function of procedures that are perceived to be fair, where fair is defined by the target population. Legitimacy thus must be established over time as the population must see repeated instances of fair procedures for the regime to establish process credibility. Unlike power, legitimacy is not event-based but process-based. If a regime is perceived as operating according to local definitions of fairness, the population will invest that regime with legitimacy,8 i.e. will perceive it as ‗good.‘ Submission to the regime‘s authority is based on this perceived goodness and not conditional upon promise of harm or reward. (One follows the law because it is the ‗right‘ thing to do.) It involves notions of obligation, i.e. the moral necessity to obey. Control by others is thus replaced by self-control,9 socially a much cheaper way to ensure social order. Furthermore, if an individual perceives a government as legitimate, he will imbue it with moral authority, that is, he will authorize it to make judgments for him (who it is appropriate to incarcerate/kill, for example). This is particularly important in times of crisis or at times when it is difficult to appeal to people strictly on the basis of immediate self- interest. In a society ruled by a legitimate government, people will accept decisions made by institutions of that government, although those decisions may appear to be counter to their own self-interest.10 This is truly winning the battle for ‗hearts and minds.‘ Institutions, not individuals, are vested with legitimacy unlike the notion of power where it is individuals that have power. In a legitimate regime, individuals derive their legitimacy from their institutional locations. This can have negative as well as positive consequences. The well-known Milgram experiments where subjects were asked by an authority figure to administer what they thought were damaging electrical shocks to other individuals—and did —are a prime example of the negative consequences of this type of
social power. In Studies in Social Power. D. Cartwright, ed. University of Michigan Institute of Social Research. Ann Arbor, MI. Pp.150-167.
8 See Tyler op.cit. for a review of this literature.
9 Erich Weede. 1996. Legitimacy, Democracy and Comparative Economic Growth Reconsidered.
European Sociological Review. Vol.12, no.3. Pp. 217-225 Pp.217-218; also, Tyler, op.cit. P.378 10
There has been some interesting work done here on courts of law and unpopular decisions, including work in emerging democracies (S. Machura. 2003. Fairness, justice, and legitimacy: experiences of people’s judges in South Russia. Law and Politics vol.25. Pp.123-150) and the Bush v. Gore US Supreme Court decision of 2000 (JL Gibson, GA Caldiera and LK Spence. 2003. The Supreme Court and the US Presidential election of 2000: wounds, self-inflicted or otherwise? British Journal of Political Science. Vol.33. Pp.535-556.).
Consulting
Group
Inc.
Legitimacy and Power ….4 August 2008
moral displacement.11 The accepted legitimacy of institutions also allows subordinates to tolerate certain levels of short-term procedural injustice on the part of individuals without calling the entire system into question.12 Thus we can tolerate some level of renegade officials so long as we perceive the system itself to be legitimate, for we believe that, over time, the system will punish or otherwise deal with them. Legitimacy is a value orientation on the part of the individual, not an inherent property of the system. Legitimacy is a function of the viewer, not of the regime itself. The more accepted notions of legitimacy suggest that the basis of legitimacy will vary by population, as each population has different notions of fairness. Since legitimacy is a procedural function, it can only develop over time as populations view and evaluate multiple events for their fairness and conformity to (local) standards of procedural justice. Attempts to measure formal system properties and assign a legitimacy ‗value‘ to a particular system have been called ‗macroevaluations‘ of legitimacy, and are outside mainstream thinking on the subject. ―…this line of research [macroevaluations] takes for granted the epistemic assumption that an outside observer relying on fairly gross aggregate evidence, can measure the legitimacy of a political system and rank it in comparison with other systems.‖
13 In this view, legitimacy is a property of the system itself, not of those who engage with it. However, the level of security and economic services provided by a government (two criteria often measured in this type of exercise) are not measures of legitimacy14 but rather evidence of power. Both are ‗rewards‘ the government can provide. A macroevaluative approach says nothing about ‗hearts and minds‘ (perceptions of those governed) and does not conform to the mainstream definitions of legitimacy. Two examples might help make the distinction between power and legitimacy clearer. An individual is driving down the road and sees a policeman with flashing lights behind him. He pulls over. This action is taken in response to both power and legitimacy. If the individual believes the state is legitimate, he believes the state has the right to authorize policemen to enforce the law and to use force in this enforcement if necessary. In this instance, the policeman is acting in the name of the state. However, there also is the possibility that the policeman, as an individual, might use force inappropriately. We pull
11 HC Kelman and VL Hamilton. 1989. Crimes of Obedience. Yale University Press. New Haven,
CT.; S. Milgram. 1975. Obedience to Authority. Harper. New York, NY. 12
KA Hegtvedt and C Johnson. 2000. Justice beyond the individual: a future with legitimation. Social Psychology Quarterly. Vol.63. Pp.343-366. p.306
13 M. Stephen Weatherford. 1992. Measuring Political Legitimacy. The American Political
Science Review. Vo.86, no.1. Pp.149-166. p.150 14
“the delivery of a basket of economic goods was not a universal requirement for satisfaction with democracy.” Bratton and Mattes. op.cit. p.467

Consulting
Group
Inc.
Legitimacy and Power ….5 August 2008
over to the side of the road both because we submit to the policeman‘s power (his threat, as an individual, to use force which induces fear in us) and because we believe that he has the right to tell us what to do (legitimacy, and the coercive power given to him as an agent of the state). If we stop at a stop sign in the middle of the night with no police present and no other cars in sight, we are acknowledging the ‗rightness‘ of the law. The threat of punishment or promise of reward is very low. It is the moral authority of the state as embodied in the stop sign that causes us to stop. It would be ‗wrong‘ to run through the intersection. This is a recognition of legitimacy. Rule of law is but one way to institute procedural fairness. Recall that most discussions of legitimacy invoke local notions of fairness. Max Weber identified two other types of political systems (the traditional, where authority is derived from custom rather than codified law, and the charismatic where authority is derived from the actions or character of an individual15). Tyler pointed out the importance of ―lay principles of procedural justice,‖ referring to local standards.16 Corruption, for example, is not a moral absolute. Different societies are willing to tolerate different levels of corruption, which they incorporate into their perceptions of procedural fairness. We often hear claims that legitimacy is a function of stability – a stabile state, achieved through the exercise of power, will be a legitimate state. However, most of the literature defines stability as a function of legitimacy, not vice versa. If legitimacy is a consequence of fair procedures (where fairness is locally defined), delivery of additional social goods (i.e. the exercise of power through the bestowing of ‗rewards‘) through unfair procedures will not confer legitimacy and therefore will not contribute to stability. In an interesting look at policing, we find that although
the police have made dramatic improvements in the objective quality of their performance in recent decades, …that has not led to increases in public support for the police….research suggests the public primarily views the police as legitimate, and cooperates with the police, when they experience the police as exercising their authority fairly…for the police to gain cooperation, they need to focus on the fairness of police procedures, since fairer procedures would increase police legitimacy.17
15 Max Weber. 1947 (c.1900). The Theory of Social and Economic Organization. A.M. Henderson
and Talcott Parsons, trans. Talcott Parsons, ed. The Free Press. New York, NY. Pp.328ff 16
Tyler. op. cit. P.392. 17
. Tyler. op.cit. P.393.

Consulting
Group
Inc.
Legitimacy and Power ….6 August 2008
There are two notions at play here: power and legitimacy. Power is event-driven and is a function of the person activating it. It must be renewed at each event, and if the individual exercising it changes, the nature of the power relationship changes. It is instrumental and conditional, using a combination of threat/coercion (fear) and reward (satisfaction) to exact obedience. The aggregate of all the obedience events in any given time step can be termed political support. Legitimacy is a function of the perceived fairness of procedures, not of individuals. It thus is process- not event-based and so requires a temporal dimension to be established (multiple time steps). It is an attribute of the perceiver (the target agent, in this case) not of the system itself. If an agent believes a system is legitimate, his obedience level approaches 1 and the regime becomes stabile. Unlike power, legitimacy will endure even when individuals do not satisfy their own self-interest (receive rewards and/or avoid coercion). Thus political support (which is a function of power) will erode win an economic downturn or a time personal insecurity, while a legitimate regime can weather those types of near-term storms. The particular political actors may change as support erodes, but the institutions will endure.

Consulting
Group
Inc.
2403 San Mateo Blvd. NE
Suite W-12
Albuquerque, NM 87110
Voice 505.889.3927
Fax 505.889.3929
www.galisteoconsulting.com
Attitudes, Persuasion and Influence Jessica Glicken Turnley, Ph.D.
[email protected] August 2008
Introduction
Persuasion refers to ―any procedure with the potential to change someone‘s mind.‖1
Persuasion research does not seem to analytically distinguish between changes in attitudes or beliefs. Most research speaks of attitudes which (to summarize decades of definitional debate) are defined as ―an evaluative integration of cognitions and affects experienced in relation to an object.‖2 That is, an attitude is a value judgment about something (which can be tangible or intangible) with the judgment informed by some intersection of thought and emotion.
There are three basic elements to the persuasion process. These are the message, the persuader (often called the source) and the receiver. Of the three, the receiver – the locus of change - has received the most research attention, while the message has received the least. We will briefly examine each of these three elements. The summary section will re-integrate the elements into a single process, and the section on implications will deal with the impact of our findings on the model.
Message
The nature or content of the message appears to be almost incidental to the persuasion process from an analytic point of view. Messages are not existentially good or bad, that is, one message is not inherently more or less likely to be accepted by the receiver than another. The likelihood of message acceptance (i.e. the decision to change one‘s mind or of a persuasive act taking place) is determined elsewhere.
1 Petty, R.E. (2007) Persuasion: From Single to Multiple to Meta-Cognitive Processes Perspectives on Psychological Science (Ohio State University: Columbus Ohio, 2007), p3
2 Crano, W. D. and Prislin, R. (2006). Attitudes and Persuasion. Annual Review of Psychology, 2006, vol57:345-374; p.347

Consulting
Group
Inc.
Attitudes, Persuasion and Influence ….2
Receiver
The receiver is the subject of most of the persuasion literature, for he is the locus of the ‗persuasion event‘ and is the element which is most active in the process of persuasion. Until the late 1950‘s, the primary analytic approach was a ‗single process‘ model which collapsed the source and the message, and analyzed the receiver‘s response to a unitary persuasive ‗event.‘ This single-process model has been replaced almost completely by a dual-process model in which the receiver subjects the source and the message to separate analytic processes.3
Kelman ran one of the earliest studies which led to the development of the dual process model. In 1958, he used a study of Negro (sic) college freshmen to introduce a process distinction between two methods of persuasion: internalization and identification.4 He also discussed compliance, in which one is not persuaded to change but ―go[es] along with the accepted norms in order to avoid social ostracism or perhaps even persecution.‖5 Although we are not addressing compliance directly in this discussion as we are focusing on the process of change, it is worth noting that the pressure towards social conformity is strong and that the need for identity and other social factors can influence attitude formation.6 In identification, an individual changes his position because he wants acceptance from the sender, a driver that can also lead to compliance if the sender is ‗like‘ the receiver. Three characteristics of the sender are of importance, according to Kelman: authority, credibility and social attractiveness. In internalization, the individual changes his position because he believes the idea itself has merit or, as Kelman puts it, ―is congruent with his value system.‖7 This separated consideration of the message from response to the sender and allowed consideration of each to incorporate different analytical approaches.
It is also worth noting that Kelman believed that the changes that arose from internalization would be mor lasting than changes resulting from identification. If change in attitude results from identification with the message source, close proximity to or frequent reminders of the
3 Crano, W. D. and Prislin, R. (2006). Attitudes and Persuasion. Annual Review of Psychology, 2006, vol57:345-374; p.348
4 Kelman, H. C. (1958). Compliance, identification, and internalization: Three processes of attitude change. Journal of Conflict Resolution vol 2, no,1:51-60
5 Ibid., p.59
6 Wood, W. (2000). Attitude Change: Persuasion and Social Influence. . Annual Review of
Psychology vol51:539-570 7 Kelman, H.C. (1958). op. cit. p.53

Consulting
Group
Inc.
Attitudes, Persuasion and Influence ….3
source would be necessary to maintain the new attitude. If the attitude change is based primarily on consideration of aspects of the message, the change will persist in absence of the source.
By the 1980‘s, the dual-process model had developed into two similar schools of thought, the elaboration likelihood model (ELM)8 and the heuristic-systematic model (HSM).9 Both schools reflect the duality between controlled judgments (Aristotelian reason) that are made deliberatively with high cognitive involvement, and judgments or decisions (speaking here of a ‗decision‘ to change one‘s mind or to be persuaded) that are made with little cognition but through heuristics and/or with high affective involvement (Aristotelian passion). The latter types of decisions have variously been called emotional,10 impulsive,11 intuitive,12 implicit,13 slow learning,14 System I 15 or System X,16 while the former are often called cognitive, reflective, rational, explicit, fast learning, Systems II and Y.
The ELM model posits two basic persuasive processes. The first is based on affective associations with cues in the persuasion environment. This is called the ‗peripheral route.‘
8 Petty, R. E., Cacioppo, J. T., & Goldman, R. (1981). Personal involvement as a determinant of argument-based persuasion. Journal of Personality and Social Psychology, 41, 847-855.
9 Chaiken, S., Liberman, A., & Eagly, A. H. (1989). Heuristic and systematic processing within and beyond the persuasion context. In J. S. Uleman & J. A. Bargh (Eds.), Unintended Thought . New York: Guilford Press. Pp. 212-252
10 Zajonc, R. B., & Markus, H. (1982). Affective and cognitive factors in preferences, Journal of Consumer Research, 9, 123-131.
11 Strack, F., & Deutsch, R. (2004). Reflective and impulsive determinants of social behavior. Personality
and Social Psychology Review, 8, 220-247.
12 Epstein, S. (2003). “Cognitive-Experiential self-theory of personality,” in Handbook of psychology, T. Millon & M. J. Lerner (eds), Vol. 5, (Hoboken, NJ: John Wiley & Sons, 2003). pp. 159-184: p. 3.
13 Greenwald, A. G., & Banaji, M. (1995). Implicit social cognition: Attitudes, self-esteem, and stereotypes. Psychological Review, 102, 4-27.
14 Smith, E. R., & DeCoster, J. (2000). Dual process models in social and cognitive psychology: Conceptual integration and links to underlying memory systems. Personality and Social Psychology Review, 4, 108-131.
15 Kahneman, D. (2003). A perspective on judgment and choice: Mapping bounded rationality. American
Psychologist, 58, 697-720.: p.710.
16 Lieberman, M. D. (2000). Intuition: A social cognitive neuroscience approach. Psychological Bulletin, 126, 109-137.

Consulting
Group
Inc.
Attitudes, Persuasion and Influence ….4
The second involves a continuum of effort that the receiver expends on cognitively processing the message.17 This is the ‗central route.‘ We have reproduced here Petty and Cacioppo‘s graphic of these two ‗routes.‘18
17 Petty, R.E. and Cacioppo, J. (1986) The Elaboration Likelihood Model of Persuasion. Advances in Experimental Psychology Vol. 19:124-205
18 Ibid. p. 128.

Consulting
Group
Inc.
Attitudes, Persuasion and Influence ….5

Consulting
Group
Inc.
Attitudes, Persuasion and Influence ….6
Although for our purposes it is not necessary to go into the details of the cognitive continuum, we point out that it ranges from low cognition approaches to thoughts about the thinking itself – meta-cognition, as it were.19 Furthermore, if an individual is cognitively neutral with respect to a message, ELM holds that he will default to affective cues in making his decision.20
ELM holds that an environmental or content variable or cue can serve as an input to either process. Cues or variables include things as varied as head nodding, arm flexion, and ―source variables such as expertise‖21, ―message variables such as number‖22 or the length of arguments included in a message, and recipient variables such as ―induced emotional states‖23. ―[W]hen motivation and ability to think are high these variables can impact the level of persuasion either way: an attractive source, who when taken as a simple cue under low thinking conditions is positive, would be analyzed for its relevance and cogency, under high thinking conditions.‖24 , 25 Orators (such as politicians), for example, receive a great deal of cognitive scrutiny for their performance as well as for their message.
[P]eople can use any content input (one‘s attitude, one‘s emotions, a credible source, and so forth) in an intuitive/impulsive way (e.g., liking a message in a relatively effortless way if the position agrees with your attitude, if you feel happy, or if the source is credible), or the same variable can serve as input to a more deliberative/reflective process (e.g., having more confidence in and therefore using
19 Petty, R.E., Briñol,P., Tormala,Z.L. and Wegener,D.T. (2007). The role of metacognition in social judgment. in Social psychology: A handbook of basic principles Arie W. Kruglanski, E. Tory Higgins, (eds) (New York: Guilford Press 2nd ed.).
20 Petty and Cacioppo (1986) op.cit.
21 Petty, R.E., Cacioppo, J and Goldman, R. (1981). Personal involvement as a determinant of argument-based persuasion. Journal of Personality and Social Psychology. 41. p. 847-855.
22 Petty, R.E. and Cacioppo, J. (1984). The effects of involvement on responses to argument quantity and quality: Central and peripheral routes to persuasion. Journal of Personality and Social Psychology 46. p. 69-81.
23 Petty, R.E., Schumann, D.W., Richman, S.A. and Strathman,A.J. (1993) Positive mood and persuasion: different roles for affect under high and low elaboration conditions. Journal of Personality and Social Psychology. 64. p. 5-20.
24 Vartabedian, R.A. (1994). Self-Disclosure and Decreased Persuasiveness, (paper presented at the annual meeting of speech communication association, New Orleans, Nov 19–22, 1994).
25 Petty and Cacioppo (1986) op.cit. p.191. See figure 8 in the article for the results of empirical research in this area.

Consulting
Group
Inc.
Attitudes, Persuasion and Influence ….7
your generated thoughts if they agree with your attitude, if you are happy, or if the source is credible).26
Thus the process in which the receiver engages depends not on environmental cues but on other variables internal to the receiver such as motivation and his ability to examine an argument.
The dual process model thus separates consideration of the message content from consideration of the sender. Consideration of content is a cognitive process, and can use either simple or complex cognitive approaches. Consideration of the sender is an affective process and depends upon some level of identification with the sender.
Sender
There is not much research emphasis on the sender. However, it is here that charisma would come into play. The literature on charisma generally focuses on leadership and the personality and effectiveness of leaders. Since the 1980‘s there has been a resurgence of interest in this topic, spawning a new genre of theory called ‘charismatic leadership theory.‘27 These studies of charisma and leadership ―focus on the emotional attachment of followers to the leader; the emotional and motivational arousal of followers; identification with the mission articulated by the leader; followers' self-esteem, trust, and confidence in the leader, values that are of major importance to followers; and followers' intrinsic motivation.‖28
It is important to note that charisma is defined as a characteristic of a relationship, not of an individual. Charisma only exists if followers behave in certain ways. Leaders who are capable of establishing a charismatic relationships score high on certain personality characteristics such as the need for power and low on the need for affiliation. (High need for affiliation means that the individual tends to be concerned with establishing personal and emotional relationships with others.) If we are interested in persuasion through identification, we would be interested in receivers who have high needs for affiliation, and in senders who are able to establish common bonds with receivers by identifying characteristics
26 Petty, R. E. (2007). op.cit.
27 see House, R.J. (1991) Personality and charisma in the U.S. presidency: a psychological theory of leader effectiveness. Administrative Science Quarterly (Sep 91) for references to over 20 empirical studies supporting the existence or presence of charisma in leaders.
28 ibid.

Consulting
Group
Inc.
Attitudes, Persuasion and Influence ….8
the sender has in common with the receiver, adopting similar mannerisms or speaking styles, or the like.
Summary
If we are to sum up our findings, they would be as follows. A persuasive act involves a persuader or a source, a message, and a receiver. Messages are not inherently more or less persuasive. They are neutral in that regard. The effectiveness of the persuasive act depends upon either identification of the receiver with the source, and/or a cognitive analysis of the message by the source. The more complex the cognitive analysis, the more likely it is that the change in attitude will persist over time (i.e. will move towards a change in belief). Persuasion that is accomplished through identification degrades as a function of time after contact with the persuader or source.
There are three possibilities for a permanent, persuader-driven change in attitude, although in all cases the persuader‗s influence will taper off as the receiver gains the motivation and/or the capability to examine the message as an argument. First, there may be receivers who lack the motivation or the capability to examine the message as an argument (persistent constrained low thinkers). Second, the persuader may remain within ―persuading vicinity‖ of the subject indefinitely, constantly re-setting the identification clock. Finally, there may be a persuader who is able to cause the receiver to identify so closely for so long that the attitude change becomes permanent, i.e. becomes a change in belief. In all cases however, the persuader‘s influence will end if and when the subject‘s thinking reaches a high enough level to examine the idea as an argument.
The persuader may have certain personality characteristics (such as a high need for affiliation) that will drive him to try to establish relationships with others, thus increasing the likelihood of persuasion by identification. Charisma is not one of these characteristics. In fact, charisma (like leader) is a term that describes a relationship. Just as there must be followers to be leaders, so must there be those who enthusiastically embrace an individual and his ideas for there to be charisma.
Implications
This suggests that charisma may be an inappropriate term for the attribute we are modeling. We may want to replace it with a term such as ‗influence.‘ There is a great deal of literature on influence, some of which addresses the influence of individuals and groups on an individual (and the differences in those types of influence), and some of which distinguishes

Consulting
Group
Inc.
Attitudes, Persuasion and Influence ….9
between normative (which approximates the ‗affective‘ in persuasion literature) and cognitive influence.
Influence can be achieved through some combination of structural factors (see the recent plethora of studies on social networks of various types), social characteristics such as ethnicity, gender, age and the like, and aspects of personality (such as the high need for affiliation described earlier). For our purposes, we could work on a simple principle of homophily, which would take the social factors into account and, if the model is sophisticated enough, could identify individuals who occupy structural positions which give them high influence – individuals with high betweeness in networks, for example, or who are in positions of power in a ‗job‘ environment like the IA or IP. Influence also has the benefit of valence - one can have positive or negative influence, that is one can convince one to change one‘s mind or one can establish one more firmly in an existing position. This eliminates our need for a ‗creepiness‘ variable.
We thus suggest the following:
Replace charisma and creepiness with influence. Influence is activated only upon contact. It is directional.
1) Influence can be assigned a positive or negative value, with that value being situationally defined as a function of the level of homophily between the persuader and the receiver.
2) A small number of individuals can be given a hard influence value, either positive or negative, to reflect the distribution of certain personality traits in the population that could lead to high persuasive (repellent) characters
a) If the model can accommodate this, individuals with high betweeness or in positions of power in institutions are hard coded to have high positive influence.
3) Influence is high upon contact and degrades as a function of time.
4) Reflect social conservatism (social or peer pressure) by allowing only some small percent of individuals to actually change. These would be agents with the least number of characteristics in common with other agents (low homophily).
5) There could be some kind of distribution reflecting a varying level of cognitive analysis of messages. Most individuals will not perform cognitive analyses, some will perform some, and a few will perform a lot. Those who perform a lot will have less likelihood of

Consulting
Group
Inc.
Attitudes, Persuasion and Influence ….10
an attitude change after contact, and if the attitude does change, will see slower degradation rates in their attitude change after contact.

G-1
© 2010 The MITRE Corporation. All rights reserved.
Appendix G Random Number Generator (RNG) Synchronization Between NetLogo and Repast Models
Given a model implemented in NetLogo and its counterpart implemented in Repast-J, and given that they produce numerical results in some form, it is possible to obtain numerical identity between the two models – and without modifying the original NetLogo model.
Porting NetLogo script to Java is relatively straightforward. There are many NetLogo primitives (e.g. ask, one-of, in-radius) which do not have a direct Java equivalent, but suitable replacements can be found. The programmatic flow of the Repast-J model can mimic the NetLogo model without too much difficulty.
But the key to achieving numerical identity is by synchronized usage of a common random number generator (RNG). The NetLogo Java API contains a special implementation of the Merseinne Twister (org.nlogo.util.MersenneTwisterFast) that can be used by a Repast-J application. Both models must use the same RNG seed, of course. From there, the Repast-J model must make the same queries in the same order as in the NetLogo model. This is not straightforward, and the rules governing the use of the RNG must be examined on a primitive-by-primitive basis.
Below are notes taken from the exercise of porting the Rebellion model (which is part of the NetLogo model library) to Repast-J. These cite the discovered uses – both explicit and implicit - of the RNG in the NetLogo script.
Caveats:
This is not a comprehensive list of all NetLogo primitives that use the RNG. This only touches upon those primitives used in the Rebellion model.
These are the random number sequences for NetLogo version 4.0.3. Future implementations may change these sequences.
G.1 Explicit Uses These primitives have a straightforward use of the RNG. Each primitive is mapped to the corresponding method of MersenneTwisterFast used by that primitive’s implementation. In other words, the Repast-J model should use the listed method when the corresponding NetLogo primitive is encountered during the porting process.
NetLogo Primitive MersenneTwisterFast Method
random-seed seed MersenneTwisterFast(seed) random n nextLong(n) random-float n n*nextDouble() random-normal mean stddev mean + stddev*nextGaussian()

G-2
© 2010 The MITRE Corporation. All rights reserved.
G.2 Implicit Uses The following primitives make use of the RNG in a non-obvious way. Their exact usage was discovered through a combination of experimentation and help from their developers.
G.3 Agent Sets Not exactly a primitive, these are collections of NetLogo patches and turtles that are formed on an ad-hoc basis in the NetLogo script. As of version 3.1, NetLogo added a “shufflerator” capability to these sets, meaning that certain primitives will randomly traverse the members of the sets. Note that the contents of the agent set are ordered; in other words, it preserves the original order of the agents back when the agent set was formed. Only its use by a primitive will shuffle the order – and not all primitives do this.
The “shufflerator” is a special iterator over the agent set that randomizes the traversal order, which is created upon demand by the primitive. When created, the shufflerator will make a copy of the agent set and then will randomly choose the first member by invoking nextInt(n), where n is the size of the agent set. It maintains an index which tracks the number of selected members. Each use of the shufflerator’s next() accessor will return the previously selected member and will randomly choose a new member by invoking nextInt(n-index). Each time that a member is selected from the shufflerator’s copy of the agent set, its slot is filled by a member that has not been picked yet. The full algorithm for this selection method is shown below.
It is recommended that the Repast-J model contain a Java implementation of an agent set with a shufflerator class that performs this selection upon instantiation and subsequent calls to its next() method.
G.3.1 Create Breed n
This will create n turtles of the specified breed. The IDs of each turtle are sequential, with the first ID equal to the current number of turtles in existence; e.g. the first turtle has an ID of 0. For
Let N be the number of members in the set
If the index is greater than or equal to N
Set the next member to null
Otherwise
If the index is at least two less than N
Let r be nextInt(N – index)
Set the next member to the (r + i)th member
Set the (r + i)th member to the i
th member
Otherwise
Set the next member to the ith member
Increment the index by 1
If the next member is null
Call this routine recursively to choose another member

G-3
© 2010 The MITRE Corporation. All rights reserved.
each turtle created, this primitive will determine a random color and initial heading. This translates to n calls of nextInt(14) and nextInt(360), respectively.
Optionally, this primitive can be followed by a command block which is executed for each turtle created. The new turtles are traversed in a random order using the shufflerator.
G.3.2 One-of AgentSet
The intent of this primitive is to select a random member of the given agent set. However, its behavior changes when coupled with a “with” phrase. So, here are the two uses of the RNG for each case:
The intent of this primitive is to select a random member of the given agent set. However, its behavior changes when coupled with a “with” phrase. So, here are the two users of the RNG for each case.
No “with” phrase present: select the member at index nextInt(n). where n is the size of the agent set.
“With” phrase present: Iterate through the set using the shufflerator and test each member against the “with” phrase’s Boolean test. The first member to pass the test is the one to select.
G.3.3 Ask AgentSet
This primitive uses the agent set’s Shufflerator to iterate through the agents, executing the specified command block to that agent. Each use of the ask primitive in NetLogo must be matched by a similar random traversal in the Repast code.

G-4
© 2010 The MITRE Corporation. All rights reserved.