Embed Size (px)
Citation preview
Page 1 of 16
2010. S28
Write your Examination Number here:
Coimisiún na Scrúduithe Stáit State Examinations Commission
JUNIOR CERTIFICATE EXAMINATION, 2010
______________________
GEOGRAPHY – HIGHER LEVEL
SECTION 1 – FOLDER
______________
FRIDAY, 11 JUNE - MORNING, 9.30 TO 11.30
SECTION 1 (60 MARKS) ALL questions to be answered. You have an either / or choice within 3 questions. Be sure to return this folder with your answer book. Otherwise, marks will be lost.
Folder Marking Grid
Questions Mark Examiner Advising Examiner
@ 3
@ 2
@ 1
@ 0
Total
WARNING
You must return this paper with your answer book, otherwise marks will be lost.
Page 2 of 16
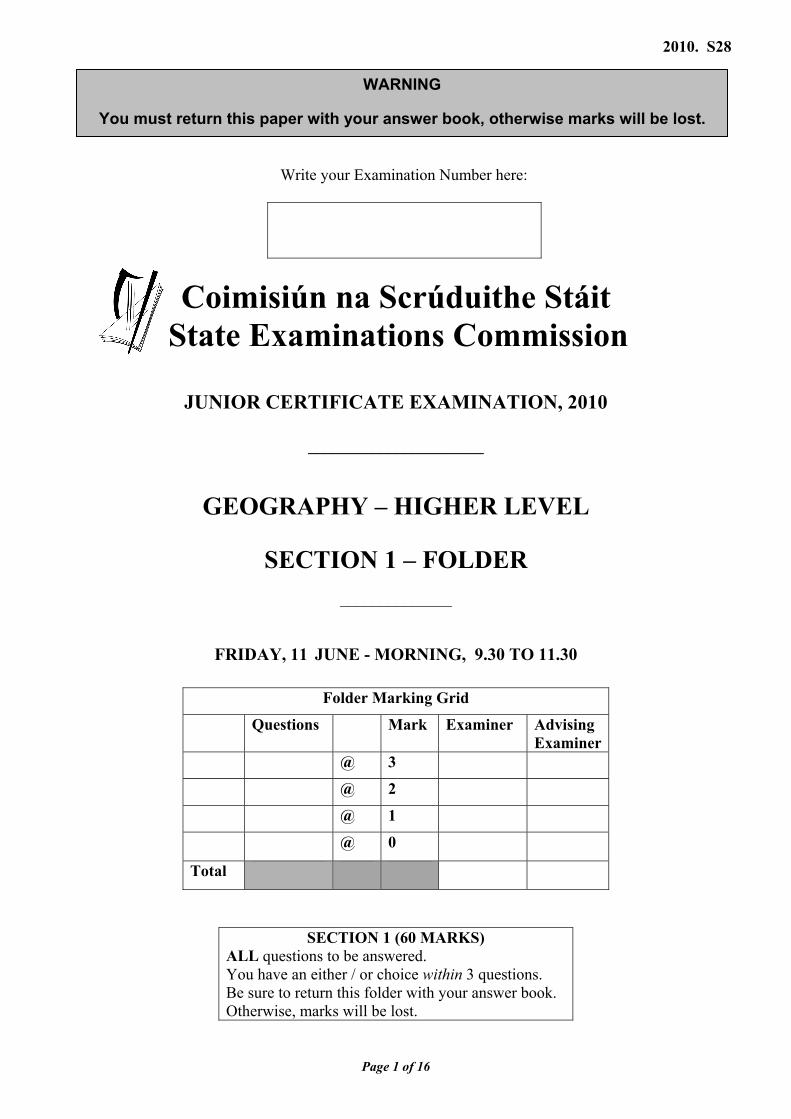
1. THE EARTH’S CRUST
The map shows some of the earth’s crustal plate boundaries.
Circle the correct option in each of the statements below.
(i) The area at A is a major earthquake zone. True / False (ii) The area at B is known as the Mid-Atlantic Ridge. True / False (iii) The area at C is known as the Rocky Mountain Fault. True / False
Page 3 of 16
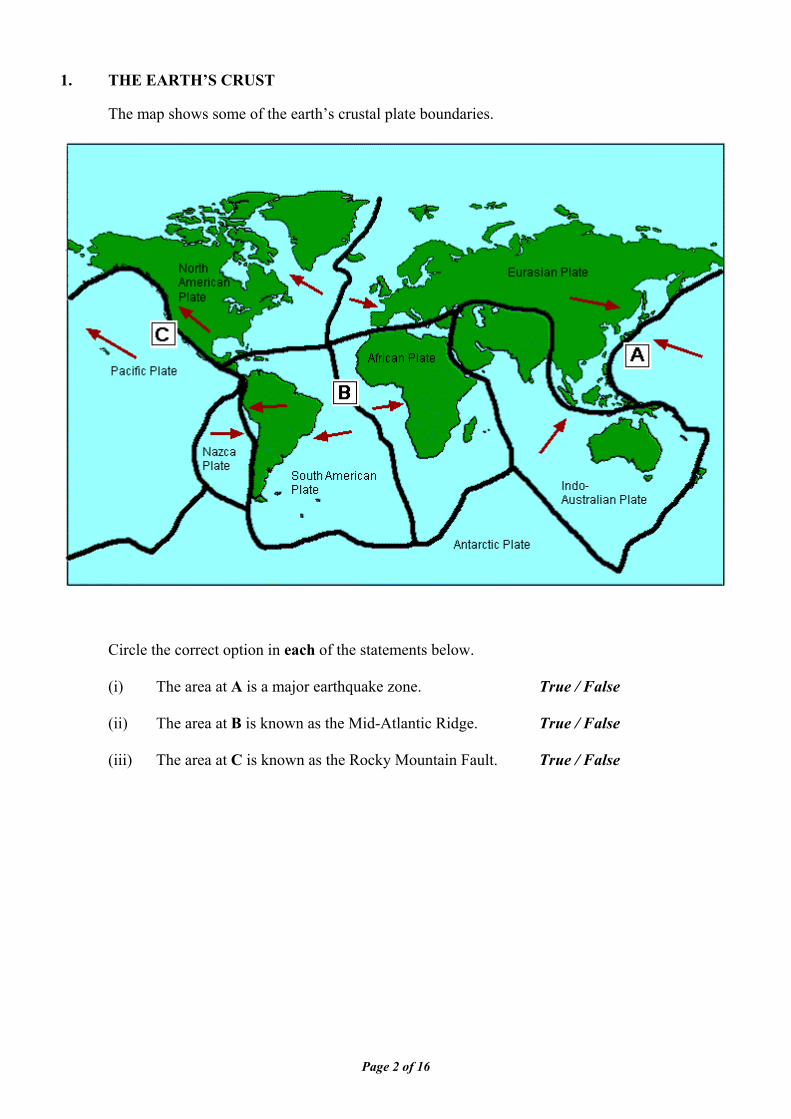
2. SOILS
Source: Enchanted Learning
3. RAINFALL
Source: wikipedia.org
The type of rainfall shown in the diagram above is: Tick () the correct box.
Convectional rainfall
Relief rainfall
Frontal / cyclonic rainfall
The diagram shows a typical soil profile. Water, washing nutrients down through the soil, out of the reach of plant roots, is known as:
Humification
Hard pan
Leaching
Peaty soil
Tick () the correct box.
Page 4 of 16
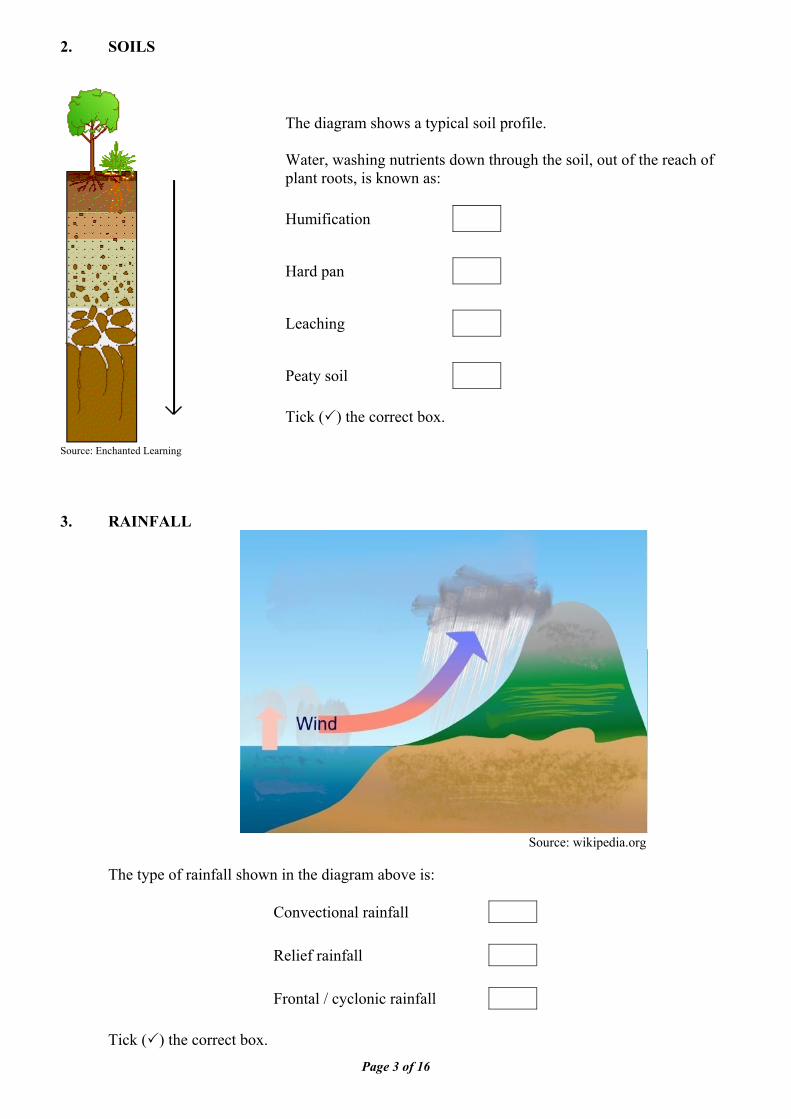
4. THE EARTH AND ROCKS The picture shows an erupting volcano.
Source: minyanville.com Circle the correct option in each of the statements below. (i) The volcano shown is dormant / active. (ii) The rock group formed here is igneous / sedimentary.
(iii) The rock type formed is basalt / sandstone.
Page 5 of 16
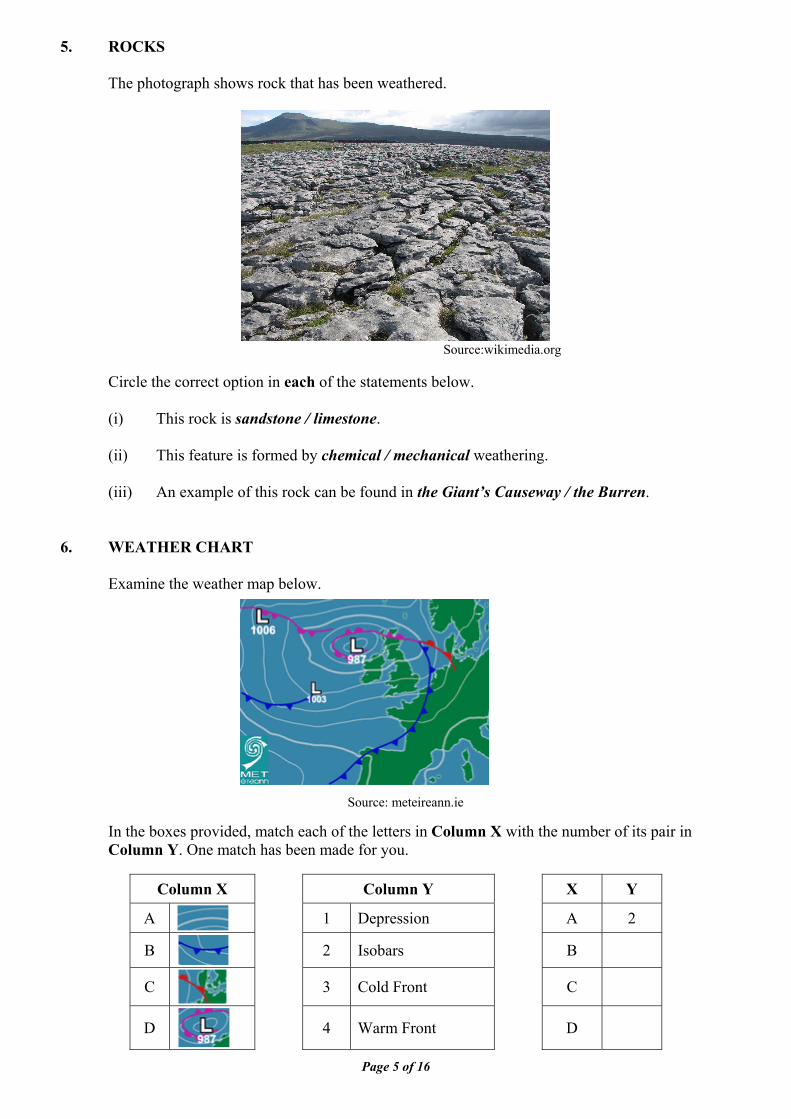
5. ROCKS The photograph shows rock that has been weathered.
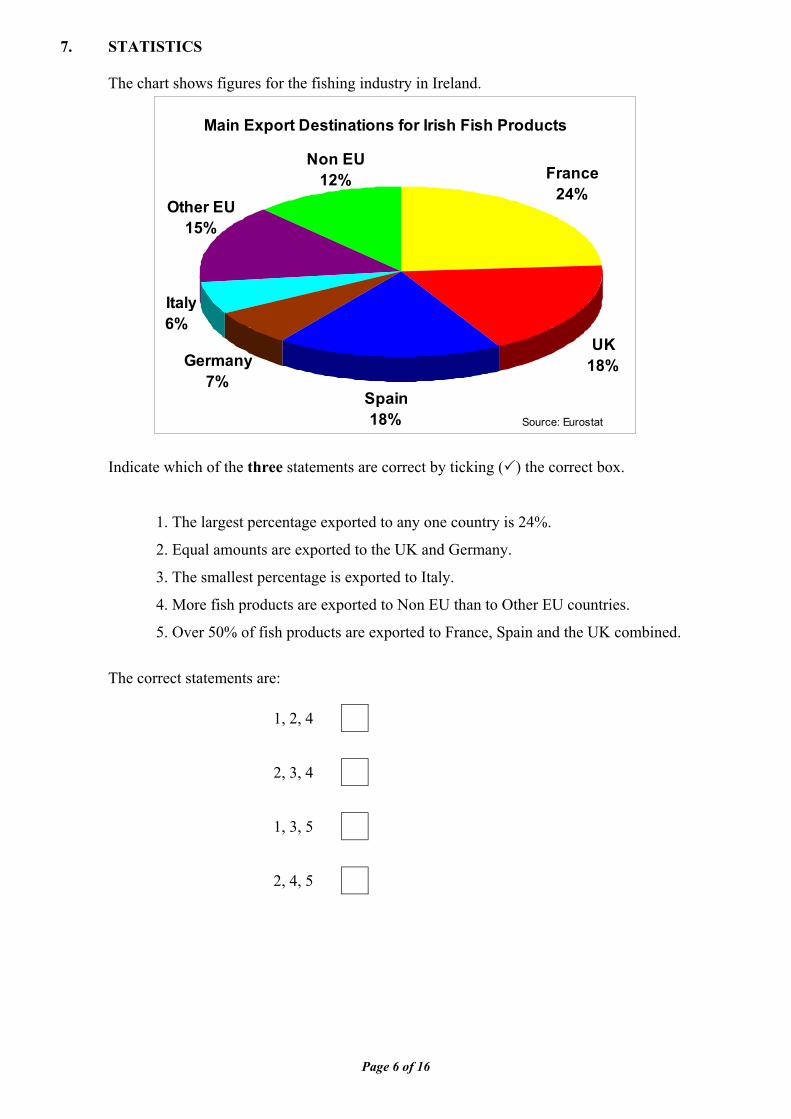
Source:wikimedia.org Circle the correct option in each of the statements below. (i) This rock is sandstone / limestone. (ii) This feature is formed by chemical / mechanical weathering. (iii) An example of this rock can be found in the Giant’s Causeway / the Burren. 6. WEATHER CHART Examine the weather map below. Source: meteireann.ie
In the boxes provided, match each of the letters in Column X with the number of its pair in Column Y. One match has been made for you.
Column X Column Y X Y
A
1 Depression A 2
B
2 Isobars B
C
3 Cold Front C
D
4 Warm Front D
Page 6 of 16
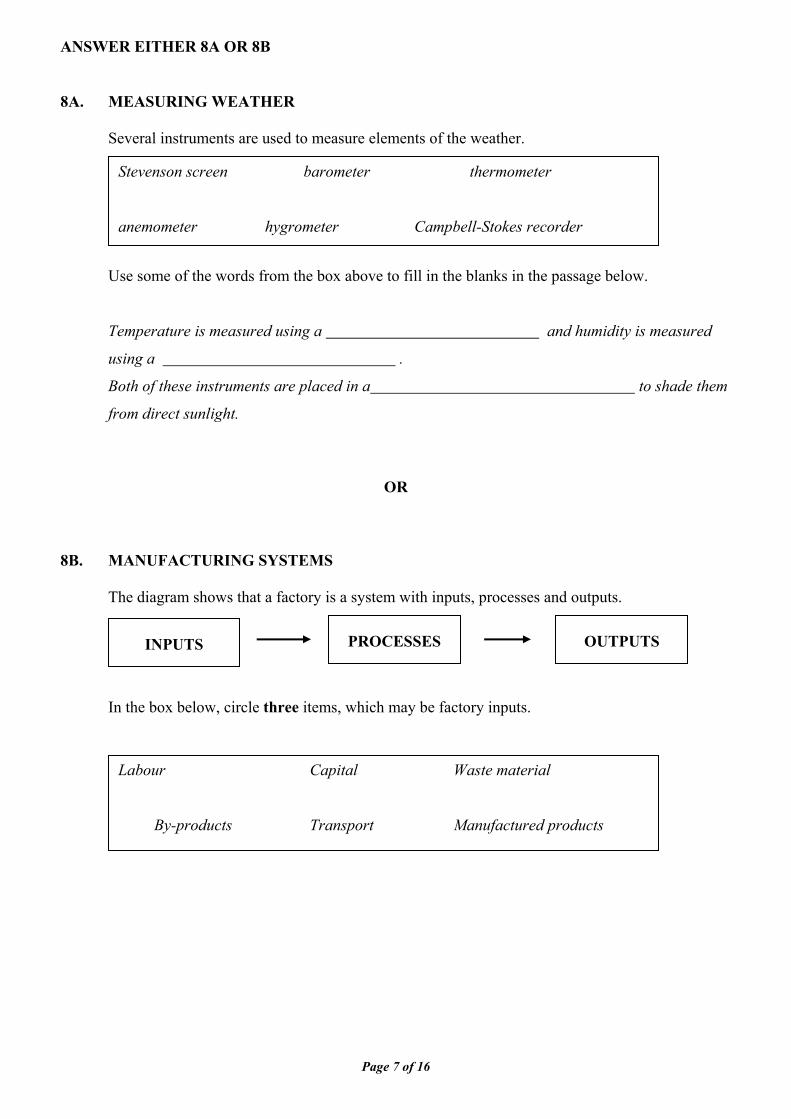
7. STATISTICS The chart shows figures for the fishing industry in Ireland.
Main Export Destinations for Irish Fish Products
France24%
Spain18%
UK18%
Other EU15%
Non EU12%
Germany7%
Italy6%
Source: Eurostat
Indicate which of the three statements are correct by ticking () the correct box. 1. The largest percentage exported to any one country is 24%.
2. Equal amounts are exported to the UK and Germany.
3. The smallest percentage is exported to Italy.
4. More fish products are exported to Non EU than to Other EU countries.
5. Over 50% of fish products are exported to France, Spain and the UK combined.
The correct statements are:
1, 2, 4
2, 3, 4
1, 3, 5
2, 4, 5
Page 7 of 16
ANSWER EITHER 8A OR 8B 8A. MEASURING WEATHER Several instruments are used to measure elements of the weather.
Use some of the words from the box above to fill in the blanks in the passage below.
Temperature is measured using a and humidity is measured
using a .
Both of these instruments are placed in a to shade them
from direct sunlight.
OR
8B. MANUFACTURING SYSTEMS The diagram shows that a factory is a system with inputs, processes and outputs. In the box below, circle three items, which may be factory inputs.
INPUTS
PROCESSES
OUTPUTS
Stevenson screen barometer thermometer anemometer hygrometer Campbell-Stokes recorder
Labour Capital Waste material By-products Transport Manufactured products
Page 8 of 16
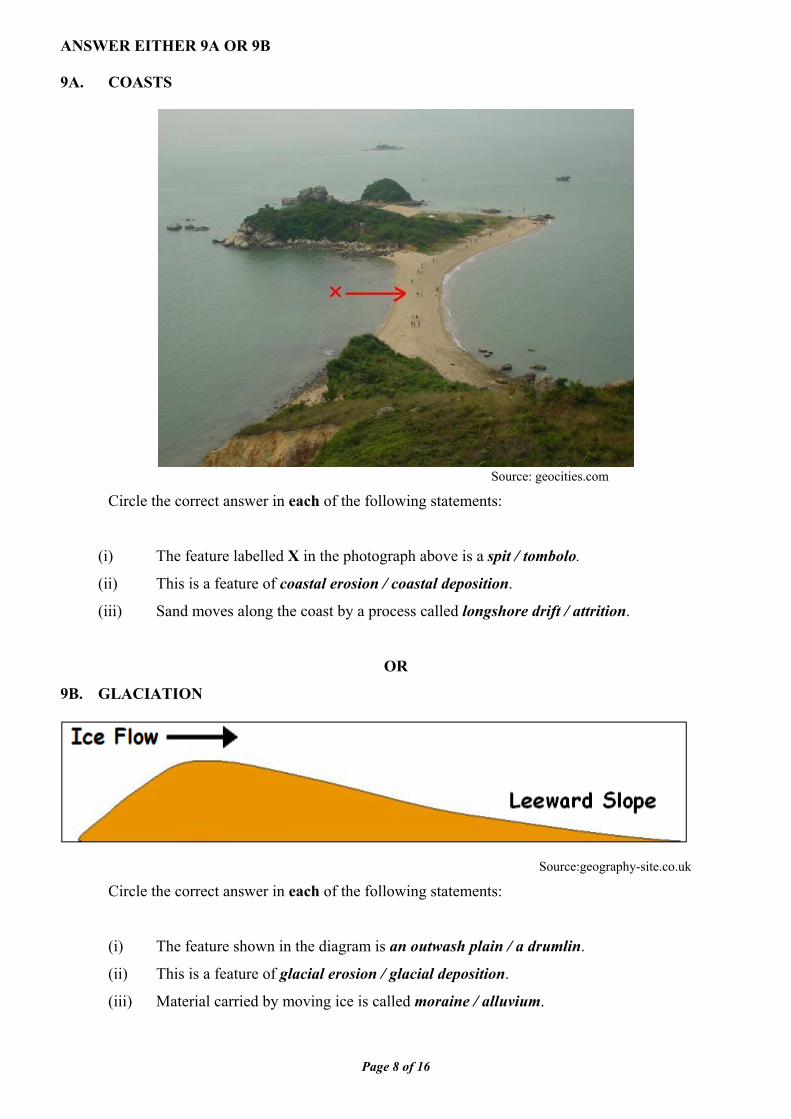
ANSWER EITHER 9A OR 9B 9A. COASTS
Source: geocities.com
Circle the correct answer in each of the following statements:
(i) The feature labelled X in the photograph above is a spit / tombolo.
(ii) This is a feature of coastal erosion / coastal deposition.
(iii) Sand moves along the coast by a process called longshore drift / attrition.
OR
9B. GLACIATION
Source:geography-site.co.uk
Circle the correct answer in each of the following statements:
(i) The feature shown in the diagram is an outwash plain / a drumlin.
(ii) This is a feature of glacial erosion / glacial deposition.
(iii) Material carried by moving ice is called moraine / alluvium.
Page 9 of 16
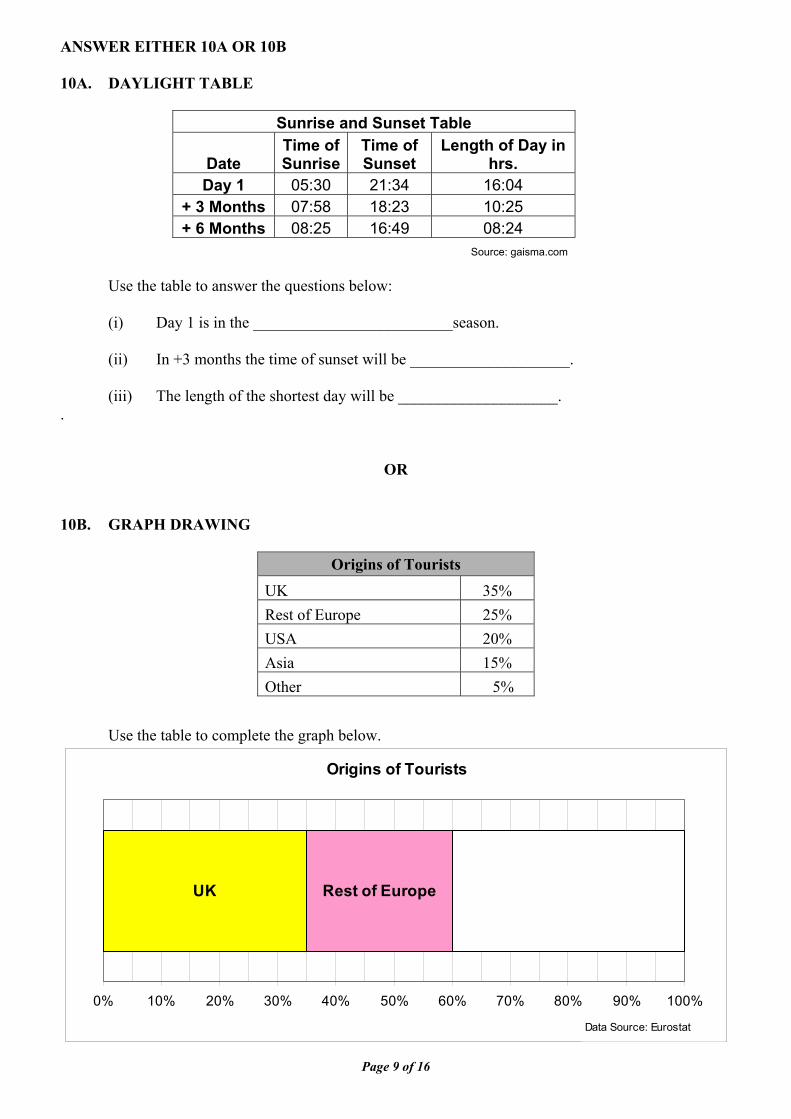
ANSWER EITHER 10A OR 10B 10A. DAYLIGHT TABLE
Sunrise and Sunset Table
Date Time of Sunrise
Time of Sunset
Length of Day in hrs.
Day 1 05:30 21:34 16:04 + 3 Months 07:58 18:23 10:25 + 6 Months 08:25 16:49 08:24 Source: gaisma.com
Use the table to answer the questions below: (i) Day 1 is in the _________________________season. (ii) In +3 months the time of sunset will be ____________________. (iii) The length of the shortest day will be ____________________. .
OR
10B. GRAPH DRAWING
Use the table to complete the graph below.
Origins of Tourists
UK Rest of Europe
0% 10% 20% 30% 40% 50% 60% 70% 80% 90% 100%
Data Source: Eurostat
Origins of Tourists
UK 35%
Rest of Europe 25%
USA 20%
Asia 15%
Other 5%
Page 10 of 16
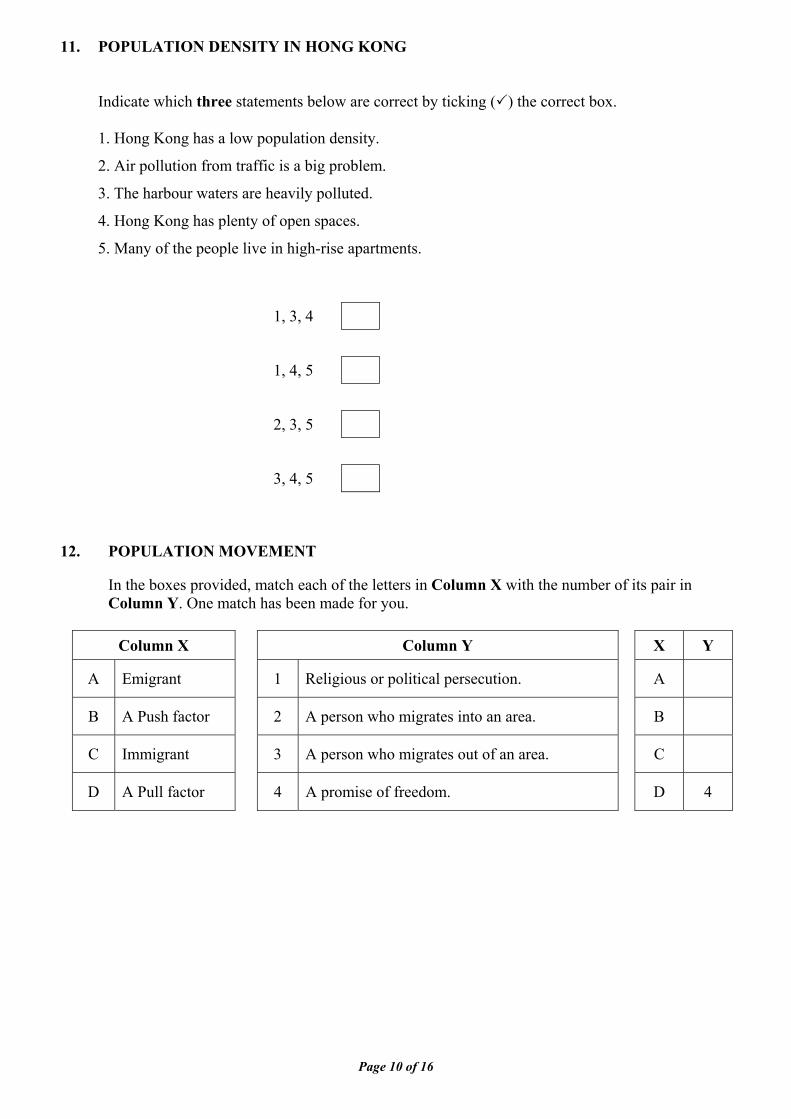
11. POPULATION DENSITY IN HONG KONG Indicate which three statements below are correct by ticking () the correct box. 1. Hong Kong has a low population density.
2. Air pollution from traffic is a big problem.
3. The harbour waters are heavily polluted.
4. Hong Kong has plenty of open spaces.
5. Many of the people live in high-rise apartments.
12. POPULATION MOVEMENT In the boxes provided, match each of the letters in Column X with the number of its pair in Column Y. One match has been made for you.
Column X Column Y X Y
A Emigrant 1 Religious or political persecution. A
B A Push factor 2 A person who migrates into an area. B
C Immigrant 3 A person who migrates out of an area. C
D A Pull factor 4 A promise of freedom. D 4
1, 3, 4
1, 4, 5
2, 3, 5
3, 4, 5
Page 11 of 16
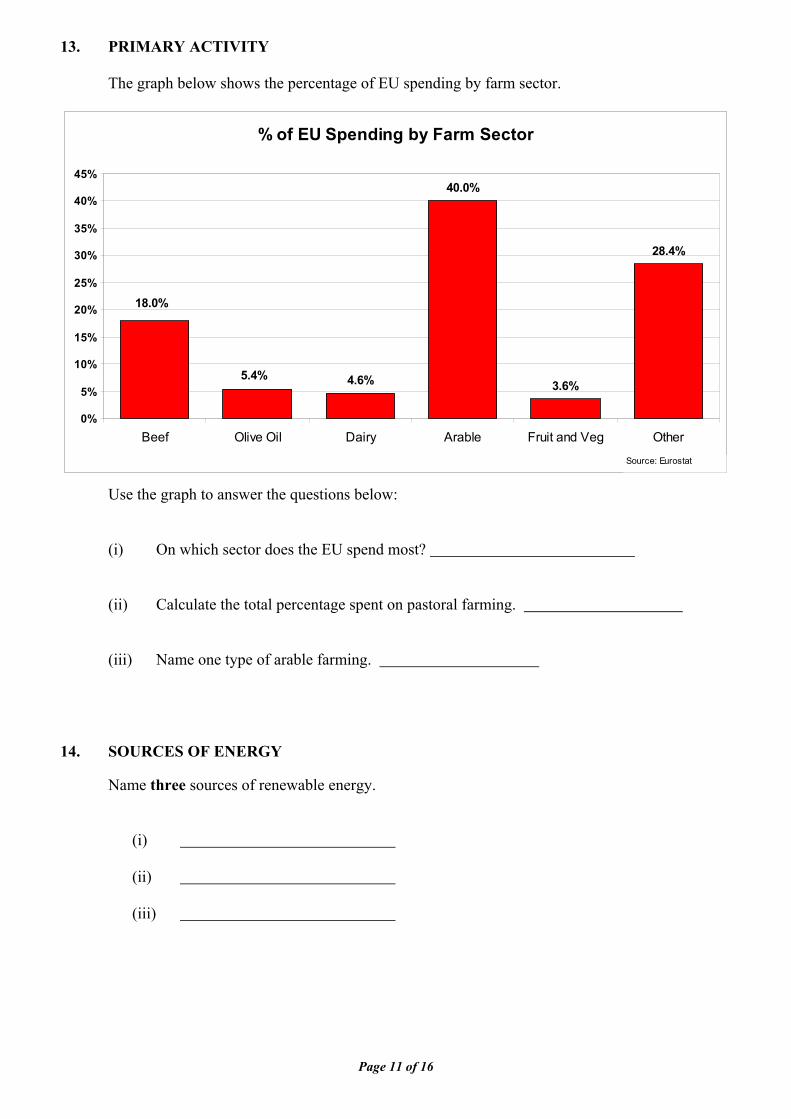
13. PRIMARY ACTIVITY The graph below shows the percentage of EU spending by farm sector.
% of EU Spending by Farm Sector
4.6%
40.0%
3.6%
28.4%
5.4%
18.0%
0%
5%
10%
15%
20%
25%
30%
35%
40%
45%
Beef Olive Oil Dairy Arable Fruit and Veg Other
Source: Eurostat
Use the graph to answer the questions below:
(i) On which sector does the EU spend most?
(ii) Calculate the total percentage spent on pastoral farming. (iii) Name one type of arable farming. 14. SOURCES OF ENERGY Name three sources of renewable energy.
(i)
(ii)
(iii)
Page 12 of 16
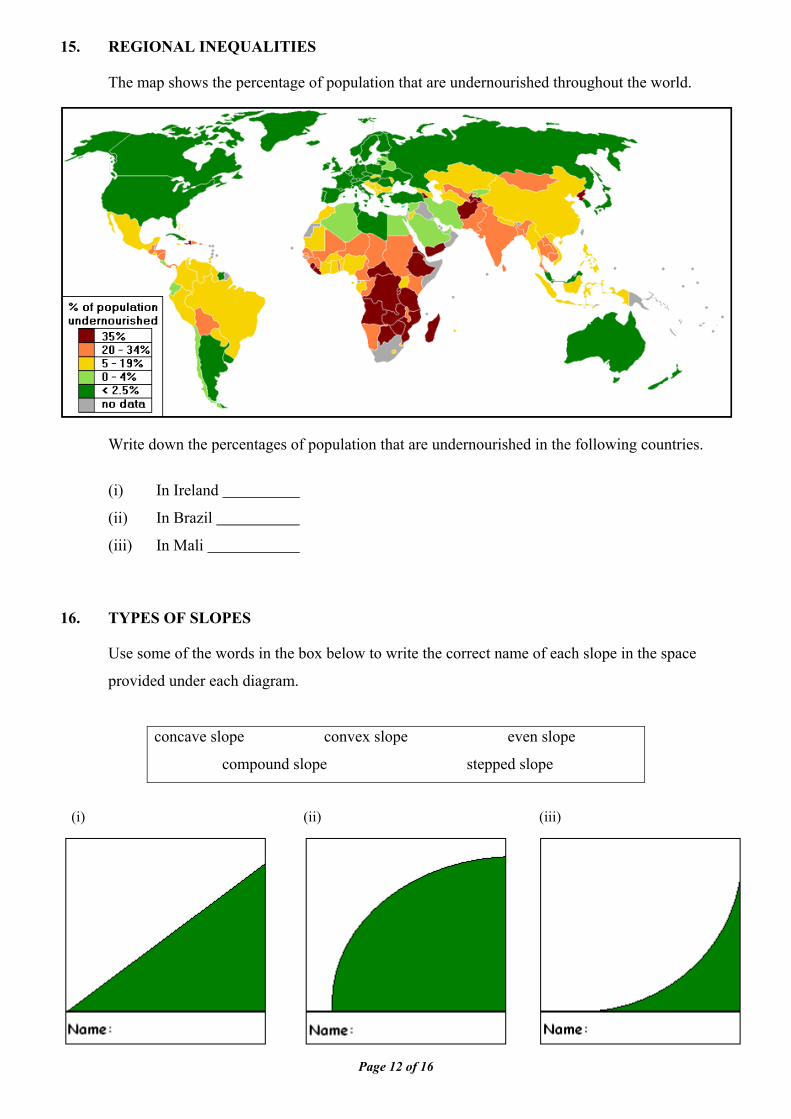
15. REGIONAL INEQUALITIES The map shows the percentage of population that are undernourished throughout the world.
Write down the percentages of population that are undernourished in the following countries.
(i) In Ireland
(ii) In Brazil
(iii) In Mali
16. TYPES OF SLOPES
Use some of the words in the box below to write the correct name of each slope in the space
provided under each diagram.
concave slope convex slope even slope
compound slope stepped slope
(i) (ii) (iii)
Page 13 of 16
17. ORDNANCE SURVEY MAP
Study the Ordnance Survey map supplied. In the boxes provided, match each of the grid references in Column X with the number of its pair in Column Y. One match has been made for you.
Column X Column Y X Y
A S 403 204 1 Railway Station A 4
B S 430 283 2 Castle B
C S 407 220 3 Megalithic Tomb C
D S 367 257 4 Golf Course D
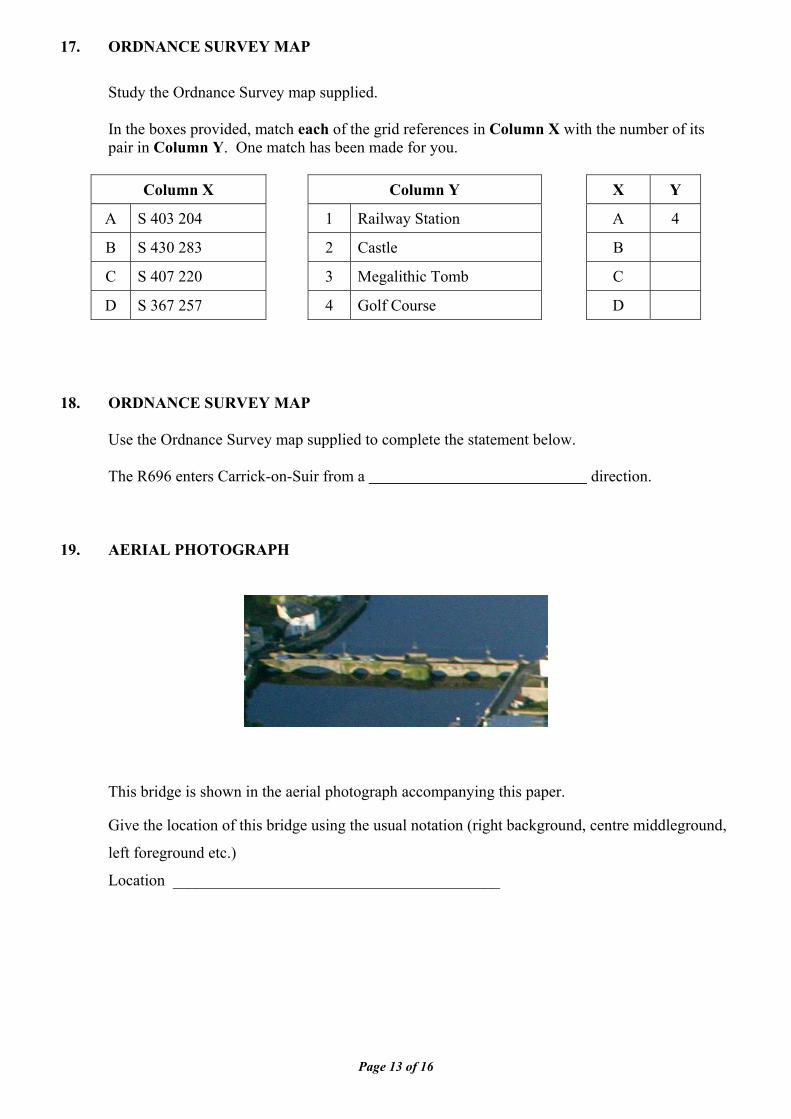
18. ORDNANCE SURVEY MAP Use the Ordnance Survey map supplied to complete the statement below. The R696 enters Carrick-on-Suir from a direction. 19. AERIAL PHOTOGRAPH
This bridge is shown in the aerial photograph accompanying this paper. Give the location of this bridge using the usual notation (right background, centre middleground,
left foreground etc.)
Location _________________________________________
Page 14 of 16
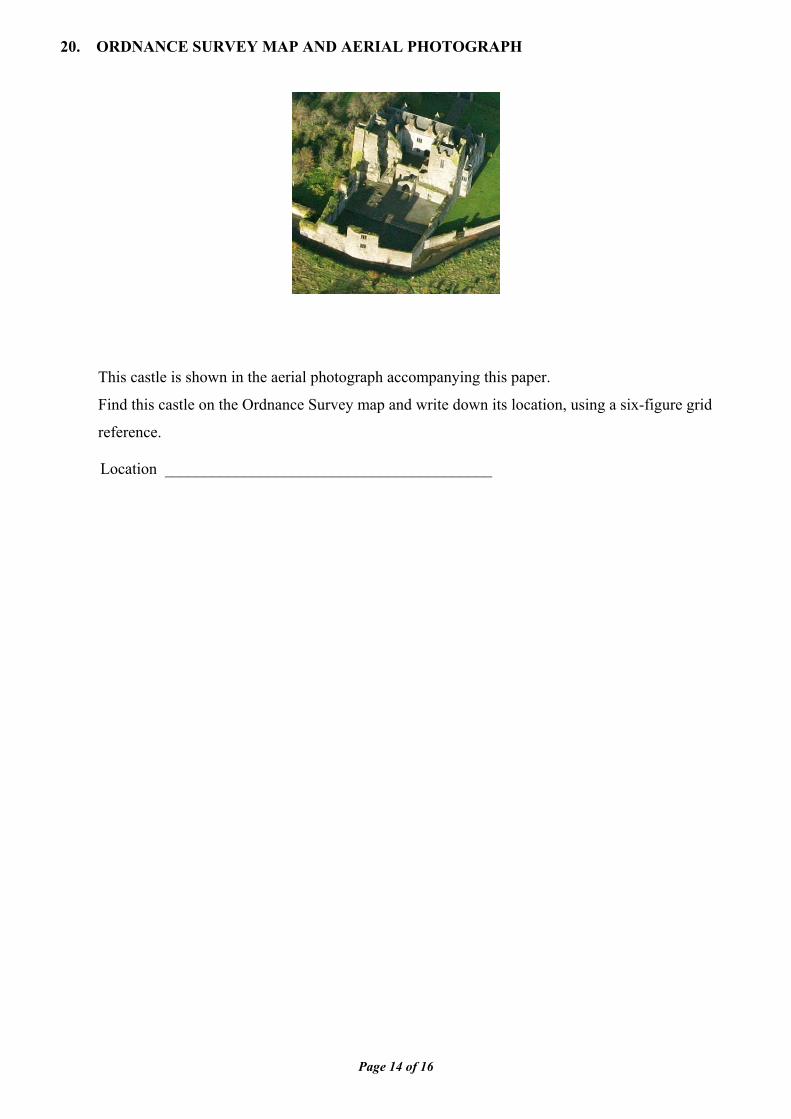
20. ORDNANCE SURVEY MAP AND AERIAL PHOTOGRAPH
This castle is shown in the aerial photograph accompanying this paper.
Find this castle on the Ordnance Survey map and write down its location, using a six-figure grid
reference.
Location _________________________________________
Page 15 of 16
BLANK PAGE
Page 16 of 16
BLANK PAGE
Page 1 of 8
2010. S28
Coimisiún na Scrúduithe Stáit
State Examinations Commission
JUNIOR CERTIFICATE EXAMINATION, 2010
______________________
GEOGRAPHY - HIGHER LEVEL
______________________
FRIDAY, 11 JUNE - MORNING, 9.30 TO 11.30
SECTION 2 (90 MARKS)
Answer any THREE questions.
SECTION 1 of this paper is on a separate folder, where spaces are provided for your answers. Please remember to return your completed Section 1 folder with your answer book.
Page 2 of 8
1. THE EARTH’S SURFACE A. Mass Movement
(i) Name one type of mass movement.
(2)
(ii) Explain how this type of mass movement occurs.
(8)
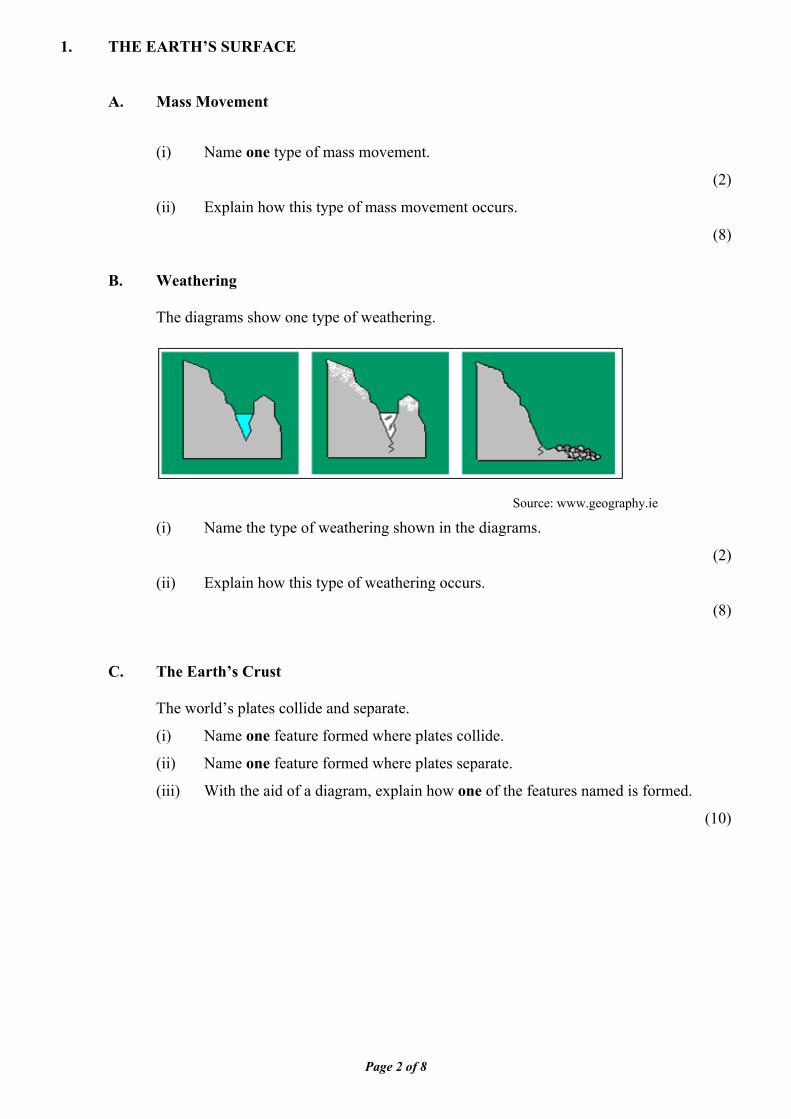
B. Weathering The diagrams show one type of weathering.
Source: www.geography.ie
(i) Name the type of weathering shown in the diagrams.
(2)
(ii) Explain how this type of weathering occurs.
(8)
C. The Earth’s Crust The world’s plates collide and separate.
(i) Name one feature formed where plates collide.
(ii) Name one feature formed where plates separate.
(iii) With the aid of a diagram, explain how one of the features named is formed.
(10)
Page 3 of 8
2. CLIMATE A. (i) Name one hot climate. (ii) Name one temperate climate. (iii) Name one cold climate.
(6) B. Select one climate and describe it in detail referring to temperatures and precipitation.
(12) C. Factors affecting climate include:
Latitude Distance from the seas and oceans Prevailing winds Altitude Relief Aspect.
Select any three of these factors and explain how each one affects climate.
(12) 3. ECONOMIC ACTIVITIES A. Fishing The table shows fish catches (tonnes) in the Celtic Sea.
Plaice Cod Herring 1997 1,212 12,035 18,800 2002 646 9,356 10,550 2007 406 4,287 8,268
(i) Describe the trend indicated by the figures in the table. (ii) Explain the term ‘overfishing’. (iii) Explain two reasons why overfishing occurs in Irish waters.
(10) B. Secondary Industry (i) Name one manufacturing industry you have studied. (ii) Describe this industry referring to its inputs, processes and outputs.
(10) C. Ordnance Survey Map and Tourism Using the ORDNANCE SURVEY MAP provided, explain two reasons why tourists might go to Carrick-on-Suir on their holidays.
(10)
Page 4 of 8
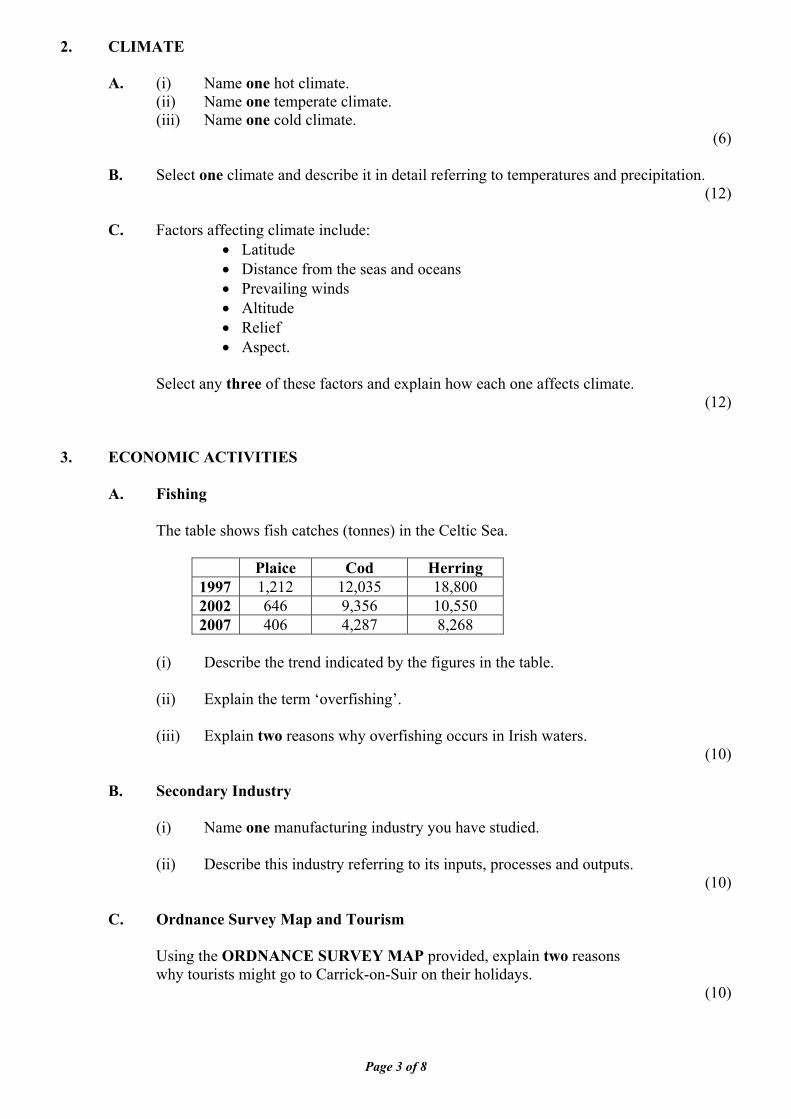
4. GEOGRAPHICAL MIX Answer any three of the following questions 4A, 4B, 4C, 4D. 4A. An Unequal World Examine the map of the world.
Source: wikimedia.org
(i) Which area is more developed, the North or the South? (2)
(ii) Briefly explain why child mortality is higher in the South. (4)
(iii) Explain one reason why people might migrate from the South to the North. (4)
4B. Functional Zones in Cities Cities have different functional zones including:
The Central Business District (CBD) Shopping areas Industrial areas Residential (housing) areas Open spaces.
Explain the location of any two functional zones in a city you have studied.
(10)
Page 5 of 8
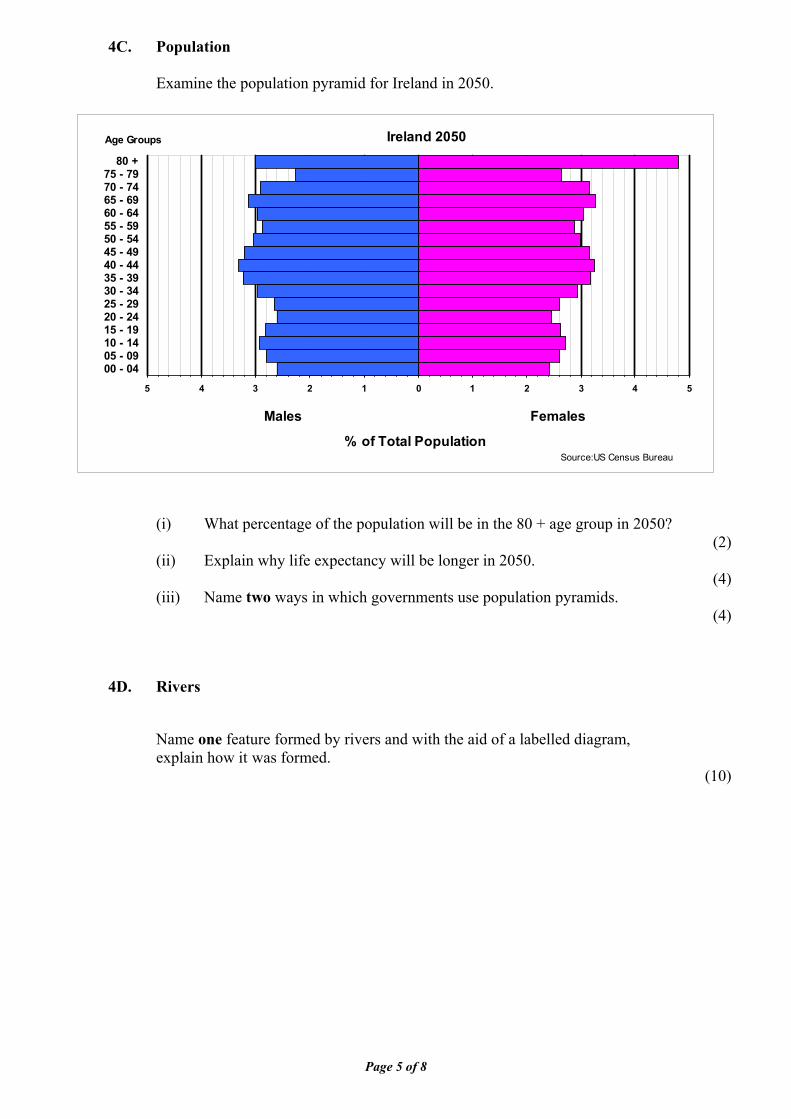
4C. Population Examine the population pyramid for Ireland in 2050.
Ireland 2050
5 4 3 2 1 0 1 2 3 4 5
00 - 0405 - 0910 - 1415 - 1920 - 2425 - 2930 - 3435 - 3940 - 4445 - 4950 - 5455 - 5960 - 6465 - 6970 - 7475 - 79
80 +
Age Groups
% of Total Population
Males Females
Source:US Census Bureau
(i) What percentage of the population will be in the 80 + age group in 2050? (2)
(ii) Explain why life expectancy will be longer in 2050. (4)
(iii) Name two ways in which governments use population pyramids. (4)
4D. Rivers
Name one feature formed by rivers and with the aid of a labelled diagram, explain how it was formed.
(10)
Page 6 of 8
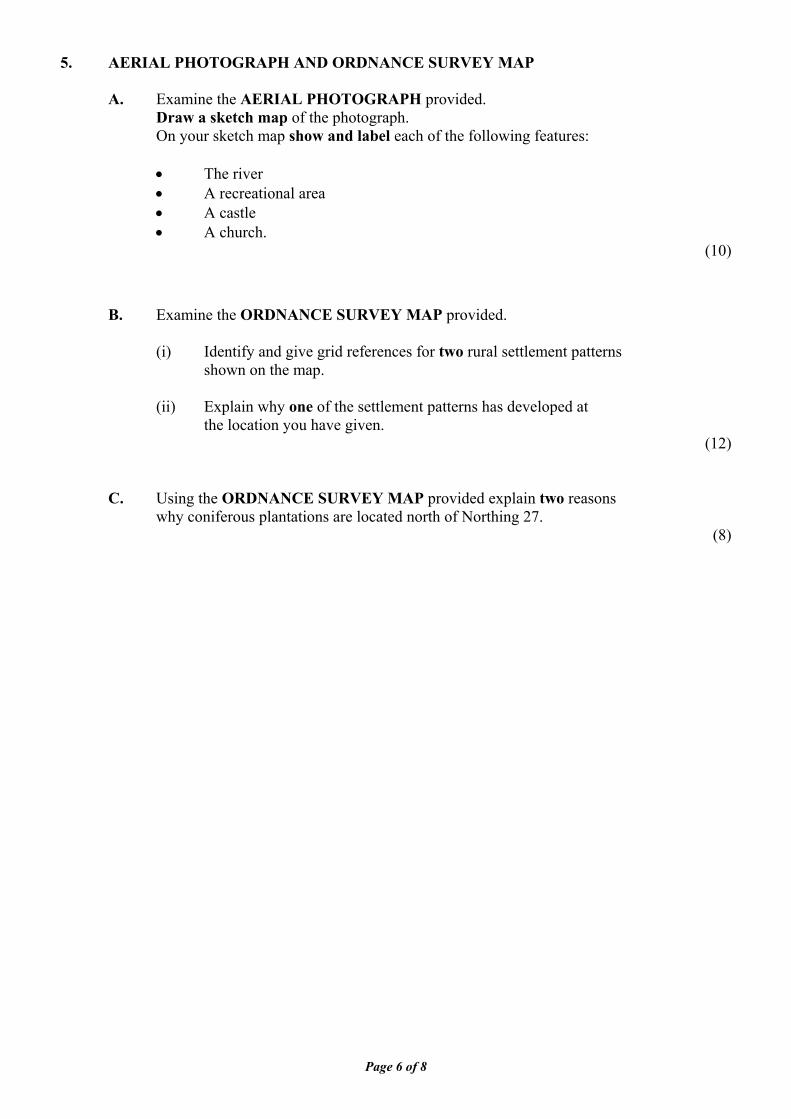
5. AERIAL PHOTOGRAPH AND ORDNANCE SURVEY MAP
A. Examine the AERIAL PHOTOGRAPH provided. Draw a sketch map of the photograph.
On your sketch map show and label each of the following features:
The river A recreational area A castle A church.
(10)
B. Examine the ORDNANCE SURVEY MAP provided. (i) Identify and give grid references for two rural settlement patterns shown on the map. (ii) Explain why one of the settlement patterns has developed at the location you have given.
(12) C. Using the ORDNANCE SURVEY MAP provided explain two reasons why coniferous plantations are located north of Northing 27.
(8)
Page 7 of 8
BLANK PAGE
Page 8 of 8
BLANK PAGE


![Coimisiún na Scrúduithe Stáit State Examinations Commission · 2017-09-27 · [3] 2013. M327 Coimisiún na Scrúduithe Stáit State Examinations Commission Leaving Certificate](https://img.pdfslide.us/doc/110x75/5e94ed7809da3a419f4883e9/coimisin-na-scrduithe-stit-state-examinations-2017-09-27-3-2013-m327.jpg)