Embed Size (px)
Citation preview
Special Report Cohesion policy funds support to renewable energy generation — has it achieved good results?
EN 2014 NO 06
EUROPEANCOURTOF AUDITORS

EUROPEAN COURT OF AUDITORS 12, rue Alcide De Gasperi 1615 Luxembourg LUXEMBOURG
Tel. +352 4398-1
E-mail: [email protected] Internet: http://eca.europa.eu
Twitter: @EUAuditorsECA YouTube: EUAuditorsECA
More information on the European Union is available on the Internet (http://europa.eu).
Luxembourg: Publications Office of the European Union, 2014
ISBN 978-92-872-0396-0doi:10.2865/83183
© European Union, 2014Reproduction is authorised provided the source is acknowledged.
Printed in Luxembourg
EN 2014 NO 06Special Report Cohesion policy funds
support to renewable energy generation — has it achieved good results?
(pursuant to Article 287(4), second subparagraph, TFEU)
02Contents
Paragraph
Glossary and abbreviations
I–VIII Executive summary
1–11 Introduction
1–3 Renewable energy
4–6 EU policy objectives — the 2020 renewable energy target
7 Barriers to renewable energy
8 Financial support for renewable energy by the cohesion policy
9–11 Shared management
12–13 Audit scope and approach
14–47 Observations
14–16 Audited projects delivering outputs as planned …
14–16 The overall picture is one of well-planned projects delivering according to plan
17–21 … but encountering some difficulties in implementation
17–21 There is scope for further improvement at all project stages — from procurement through operations to monitoring and evaluation
22–25 … and results not properly measured or projects not attaining their energy generation targets in the majority of cases
22–23 RES data collection and reporting can be improved
24–25 Project results not always achieved
26–31 The principle of cost-effectiveness is not fully considered in planning the RES projects
26–27 Cost-effectiveness — an important objective in EU spending
28–31 There is scope for an emphasis on cost-effectiveness at an early stage
03Contents
32–40 … and there is also scope for more cost-effective RES generation projects
41–47 Cohesion policy funds having limited EU added value — the RES projects did not make their full contribution to the EU’s energy objectives
48–54 Conclusions and recommendations
Annex I — Overview of Member States’ progress towards the 2020 RES target
Annex II — Cohesion policy (ERDF and CF 2007–13) funds allocation to RES and selected projects 2007–12
Annex III — List of audited RES generation projects
Annex IV — Summary evaluation of RES project results
Reply of the Commission
Source: European Court of Auditors.
04Glossary and abbreviations
CF: Cohesion Fund
Concept of cost-effectiveness: It concerns the ability or potential of an audited entity, activity, programme or operation to achieve certain outcomes at a reasonable cost. Cost-effectiveness analyses are studies of the relationship between project cost and outcomes, expressed as cost per unit of outcome achieved1. The concept is also emphasised in the EU’s financial rules (see paragraph 6).
CO2: Carbon dioxide
Deadweight: Deadweight occurs where funding is provided to support a beneficiary who would have made the same choice in the absence of aid. In such cases, the outcome cannot be attributed to the policy, and the aid paid to the beneficiary has had no direct impact.
EIA: Environmental impact assessment
ERDF: European Regional Development Fund
EU added value: On a general level, EU added value is the value resulting from an EU intervention which is additional to the value that would have been otherwise created by Member State action alone.
Feed-in tariff (FIT): A policy mechanism designed to accelerate investment in renewable energy technologies by offering long-term contracts to renewable energy producers, typically based on the cost of generation of each technology.
MS: Member State
PV: Photovoltaic
RES: Renewable energy sources — energy from renewable non-fossil sources, namely wind, solar, aerothermal, geothermal, hydrothermal and ocean energy, hydropower, biomass, landfill gas, sewage treatment plant gas and biogases:
ο Geothermal energy means energy stored in the form of heat beneath the surface of solid earth.
ο Biomass means the biodegradable fraction of products, waste and residues from biological origin from agriculture (including vegetable and animal substances), forestry and related industries including fisheries and aquaculture, as well as the biodegradable fraction of industrial and municipal waste.
ο Solar energy means radiant light and heat from the sun harnessed using a range of technologies such as solar heating, solar photovoltaic and solar thermal electricity.
ο Wind power means the conversion of wind energy into a useful form of energy, such as using wind turbines to make electrical power.
ο Hydro energy is the conversion of kinetic energy derived from falling and running water into electrical energy.
1 ISSAI 3000: Standards and guidelines for performance auditing based on Intosai’s Auditing Standards and practical experience.
05Glossary and abbreviations
RES directive: Directive 2009/28/EC of 23 April 2009 on the promotion of energy from renewable sources and amending and subsequently repealing Directives 2001/77/EC and 2003/30/EC.
RES 2020 targets: Directive 2009/28/EC on renewable energy, to be implemented by Member States by December 2010, set mandatory national targets for all Member States so that by 2020 the EU will achieve a share of 20 % of energy from renewable sources in general and of 10 % in the transport sector particularly.
Measurement of energy units:
ο GW, MW, kW — Giga/Mega/Kilo watt ο GWh, MWh, kWh — Giga/Mega/Kilo watt hour ο kWp — kilowatts-peak — nominal power of the PV module
06Executive summary
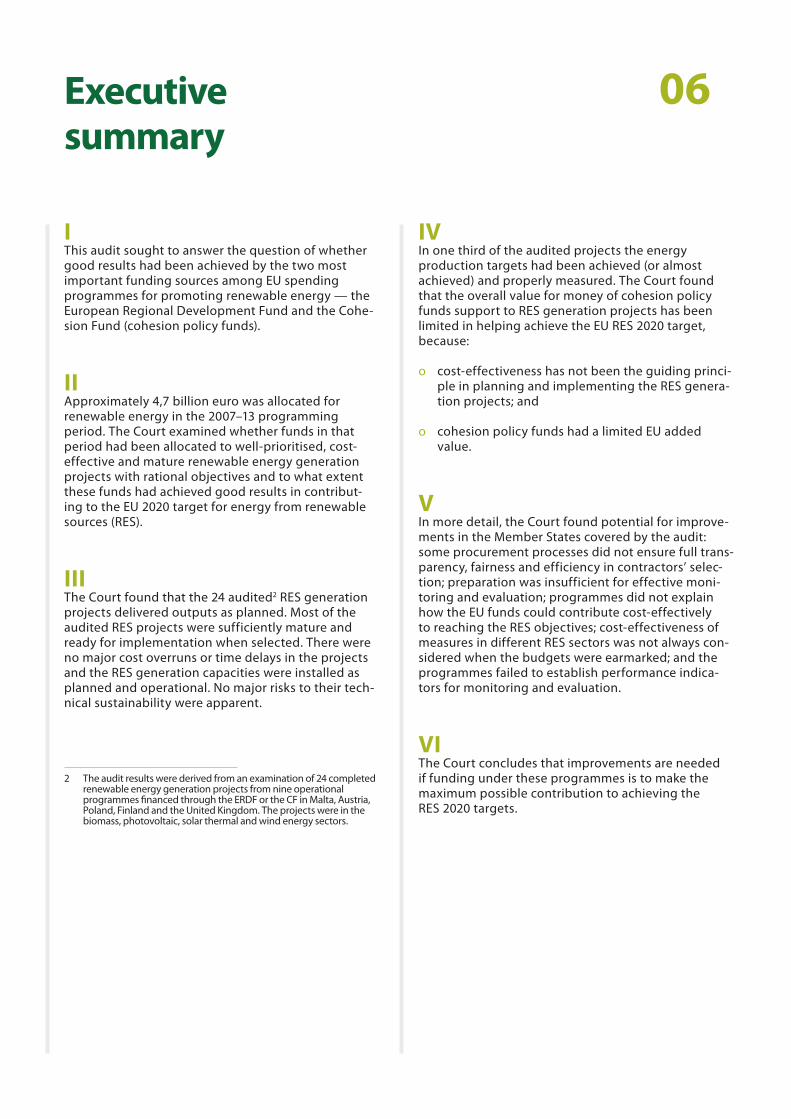
IThis audit sought to answer the question of whether good results had been achieved by the two most important funding sources among EU spending programmes for promoting renewable energy — the European Regional Development Fund and the Cohe-sion Fund (cohesion policy funds).
IIApproximately 4,7 billion euro was allocated for renewable energy in the 2007–13 programming period. The Court examined whether funds in that period had been allocated to well-prioritised, cost-effective and mature renewable energy generation projects with rational objectives and to what extent these funds had achieved good results in contribut-ing to the EU 2020 target for energy from renewable sources (RES).
IIIThe Court found that the 24 audited2 RES generation projects delivered outputs as planned. Most of the audited RES projects were sufficiently mature and ready for implementation when selected. There were no major cost overruns or time delays in the projects and the RES generation capacities were installed as planned and operational. No major risks to their tech-nical sustainability were apparent.
2 The audit results were derived from an examination of 24 completed renewable energy generation projects from nine operational programmes financed through the ERDF or the CF in Malta, Austria, Poland, Finland and the United Kingdom. The projects were in the biomass, photovoltaic, solar thermal and wind energy sectors.
IVIn one third of the audited projects the energy production targets had been achieved (or almost achieved) and properly measured. The Court found that the overall value for money of cohesion policy funds support to RES generation projects has been limited in helping achieve the EU RES 2020 target, because:
ο cost-effectiveness has not been the guiding princi-ple in planning and implementing the RES genera-tion projects; and
ο cohesion policy funds had a limited EU added value.
VIn more detail, the Court found potential for improve-ments in the Member States covered by the audit: some procurement processes did not ensure full trans-parency, fairness and efficiency in contractors’ selec-tion; preparation was insufficient for effective moni-toring and evaluation; programmes did not explain how the EU funds could contribute cost-effectively to reaching the RES objectives; cost-effectiveness of measures in different RES sectors was not always con-sidered when the budgets were earmarked; and the programmes failed to establish performance indica-tors for monitoring and evaluation.
VIThe Court concludes that improvements are needed if funding under these programmes is to make the maximum possible contribution to achieving the RES 2020 targets.
Executive summary 07
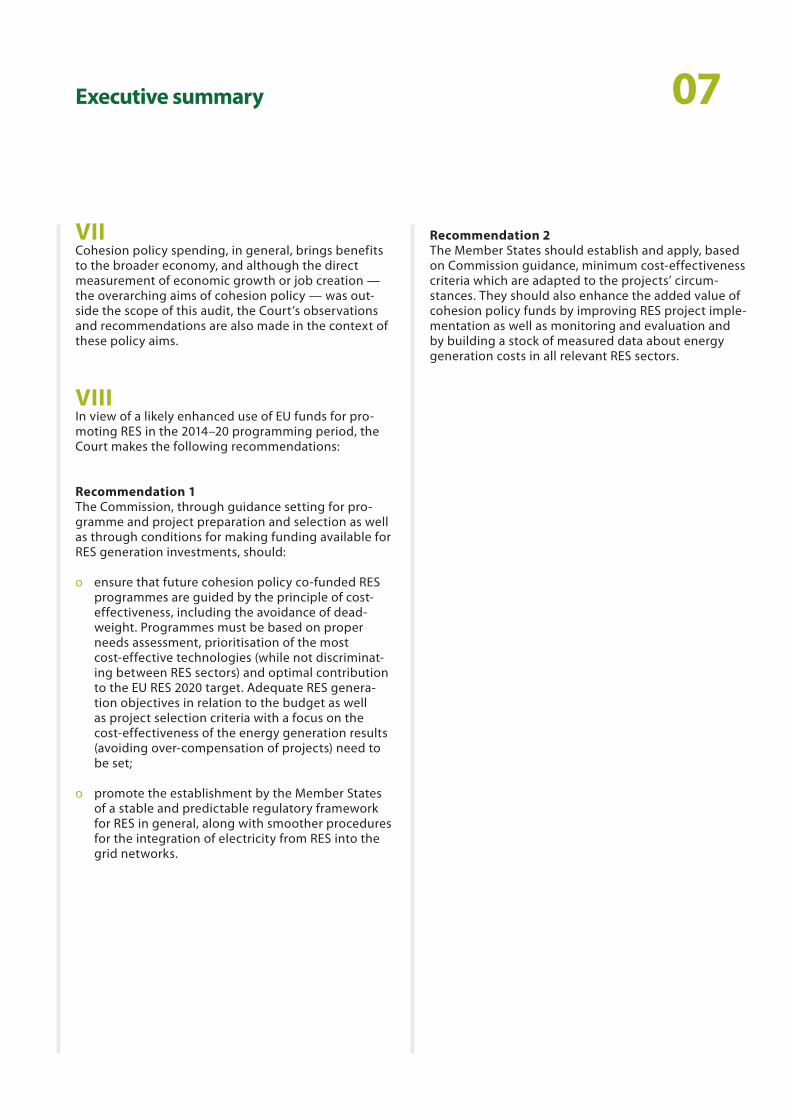
VIICohesion policy spending, in general, brings benefits to the broader economy, and although the direct measurement of economic growth or job creation — the overarching aims of cohesion policy — was out-side the scope of this audit, the Court’s observations and recommendations are also made in the context of these policy aims.
VIIIIn view of a likely enhanced use of EU funds for pro-moting RES in the 2014–20 programming period, the Court makes the following recommendations:
Recommendation 1The Commission, through guidance setting for pro-gramme and project preparation and selection as well as through conditions for making funding available for RES generation investments, should:
ο ensure that future cohesion policy co-funded RES programmes are guided by the principle of cost-effectiveness, including the avoidance of dead-weight. Programmes must be based on proper needs assessment, prioritisation of the most cost-effective technologies (while not discriminat-ing between RES sectors) and optimal contribution to the EU RES 2020 target. Adequate RES genera-tion objectives in relation to the budget as well as project selection criteria with a focus on the cost-effectiveness of the energy generation results (avoiding over-compensation of projects) need to be set;
ο promote the establishment by the Member States of a stable and predictable regulatory framework for RES in general, along with smoother procedures for the integration of electricity from RES into the grid networks.
Recommendation 2The Member States should establish and apply, based on Commission guidance, minimum cost-effectiveness criteria which are adapted to the projects’ circum-stances. They should also enhance the added value of cohesion policy funds by improving RES project imple-mentation as well as monitoring and evaluation and by building a stock of measured data about energy generation costs in all relevant RES sectors.
08Introduction
Renewable energy
01 Energy from renewable sources (RES) is important for improving the secu-rity of energy supply in the EU and for reducing the EU’s dependence on con-ventional (fossil) fuels and imported energy, and for reducing greenhouse gas emissions. Electricity and heat can be generated from a range of resourc-es, from the sun (concentrated solar power or photovoltaic power), wind (onshore or offshore), water (large, small or micro hydro), earth (geother-mal for electricity or heat) and biomass (solid, liquid, landfill gas and biode-gradable fraction of industrial and municipal waste, and liquid biofuels).
02 RES also have an important role to play in reducing carbon dioxide (CO2) emis-sions and enhancing environmental sustainability. Moreover, the develop-ment of RES technologies has a poten-tial to boost Europe’s economy, indus-trial competitiveness and employment. RES are expected to be economically competitive with conventional energy sources in the medium to long term3.
03 The development of renewable energy is laid out in the Article 194(1) of the Treaty on the Functioning of the European Union in the context of the establishment and functioning of the internal market and the need to pre-serve and improve the environment.
EU policy objectives — the 2020 renewable energy target
04 Already in 1997, the EU had declared a 12 % RES target by 2010. The Council of the European Union (the Council) set a binding EU target of 20 % in RES in gross final energy consumption by 2020, based on the Commission’s Renewable Energy Roadmap which lays down a pathway for mainstream-ing RES into EU energy policies and markets (see Annex I concerning the national 2020 RES targets)4. The renewable energy directive adopted in 2009 constitutes a legally binding framework for the promotion of RES until 20205:
ο Apart from setting the over-all 20 % binding target for the EU and binding national targets of between 10 and 49 % by 2020 it im-proves the framework for promot-ing RES electricity (e.g. by introduc-ing requirements for the Member States concerning access to the electricity grid and simplification of administrative procedures).
ο It required the Member States to develop national action plans that establish roadmaps for the devel-opment of RES and created coop-eration mechanisms between the Member States to help achieve the RES target cost-effectively.
3 COM(2010) 639 final of 10 November 2010 ‘Energy 2020: A strategy for competitive, sustainable and secure energy’.
4 COM(2006) 848 final of 10 January 2007 ‘Renewable Energy Roadmap — Renewable energies in the 21st century: building a more sustainable future’.
5 Directive 2009/28/EC of the European Parliament and of the Council of 23 April 2009 on the promotion of the use of energy from renewable sources and amending and subsequently repealing Directives 2001/77/EC and 2003/30/EC (‘RES Directive’) (OJ L 140, 5.6.2009, p. 16).
09Introduction
05 The Member States are required to ensure that their share of RES equals or exceeds indicative trajectories to reach the RES 2020 target. They must report every 2 years to the Commission on implementation of the directive and progress towards their individual targets. RES measures are to be intro-duced in a cost-effective way6. The Commission must produce, by 31 De-cember 2014, a progress report on the implementation of the RES directive7.
06 In addition, the EU’s financial rules stipulate that the cost-effectiveness principle must be an important deter-minant of public spending decisions8. Moreover, the European Parliament noted the need to identify the most cost-effective RES and cost-optimal policies for realising the potential of RES9. According to the Commis-sion’s latest progress report10 the EU’s RES 2020 target will likely be exceeded as a whole, whereas not all Member States were on track in 2012 to reach their binding national targets, see Annex I. Following its Green Paper in 2013, the Commission laid out initial considerations for the Union’s climate and energy policy for the period from 2020 to 2030, proposing a bind-ing EU target of 27 % for RES11.
Barriers to renewable energy
07 Apart from exogenous factors (such as evolution of energy prices or ac-cess to loans) multiple sector-specific obstacles hamper investments in RES throughout the Union and have not yet been eliminated by the Member States and the Commission12:
ο Institutional and legal barriers, e.g. the priority given at EU level to energy issues is not always reflect-ed at local, regional and national level whereby a lack of clear imple-mentation strategies and flexibility in the relevant administrations or the national legal regimes as well as unclear legislative and contractual frameworks standing in the way of promoting RES; complex authorisa-tion and permitting procedures for planning, building and operating RES installations together with en-vironmental requirements discour-aging project promoters to come up with feasible project proposals (lack of an effective administrative system)
ο Difficulties in integrating RES elec-tricity in the transmission or distri-bution grids (technical problems, insufficient infrastructure, discrimi-natory practices preventing grid access, distribution of costs among the grid operators, government and project promoters and a lack of measuring of energy generation)
ο Non-stable or non-predictable promotion and incentive regimes and a lack of information for sup-pliers, customers and installers hampering the use of cost-effective technologies.
6 Preamble (9) and (41) to the RES directive.
7 Article 23(8)(c) of the RES directive.
8 Article 18(1)(h) of Commission Delegated Regulation (EU) No 1268/2012 of 29 October 2012 on the rules of application of Regulation (EU, Euratom) No 966/2012 of the European Parliament and the Council on the financial rules applicable to the general budget of the Union (OJ L 362, 31.12.2012, p. 1).
9 European Parliament Resolution of 21 May 2013: Current challenges and opportunities for renewable energy in the European internal energy market (2012/2259(INI)).
10 COM(2013) 175 final of 27 March 2013 ‘Renewable energy progress report’.
11 COM(2013) 169 final of 27 March 2013, Green Paper ‘A 2030 framework for climate and energy policies’. COM(2014) 15 final of 22 January 2014 ‘A policy framework for climate and energy in the period from 2020 to 2030’.
12 See, for instance, COM(2012) 271 final of 6 June 2012 ‘Renewable Energy: a major player in the European energy market’, and its 2010 and 2012 biannual progress reports, COM(2011) 31 final of 31 January 2011 and COM(2013) 175 final of 27 March 2013. See also reports by European RES industry associations (European Renewable Energy Council (EREC) and its member organisations), particularly ‘Analysis of deviation and barriers, 2013 report’, by EREC, www.keepontrack.eu/publications.
10Introduction
Financial support for renewable energy by the cohesion policy
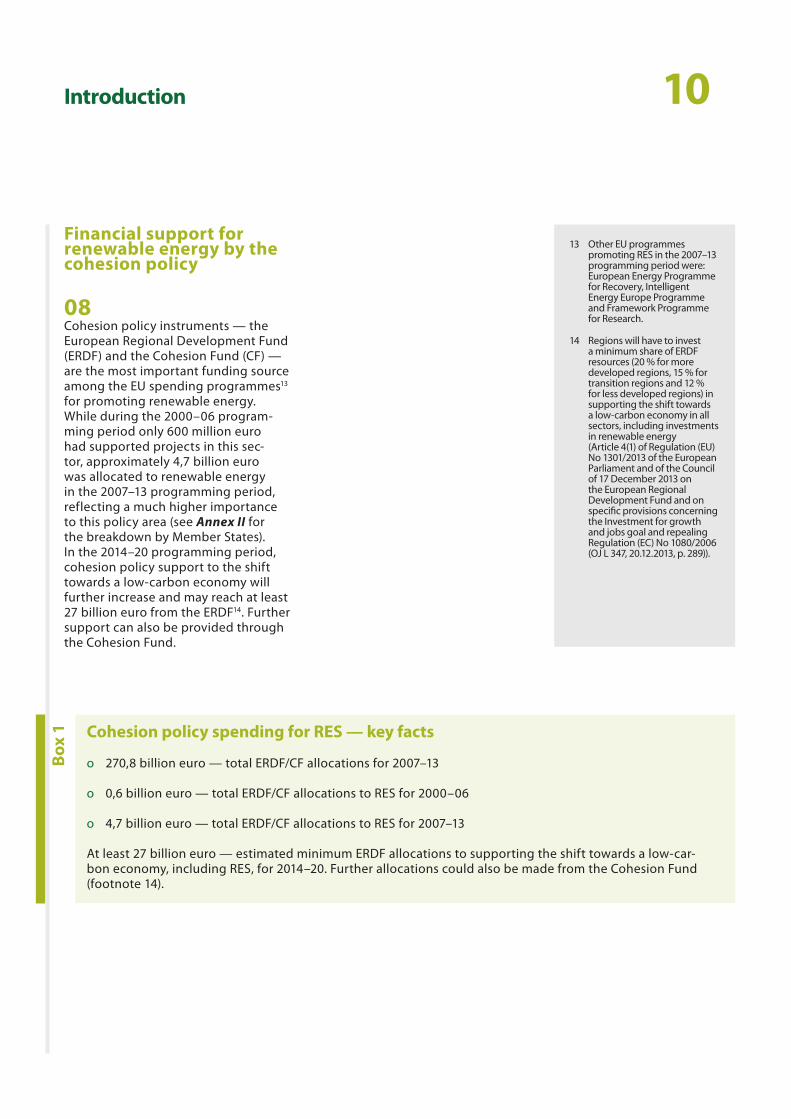
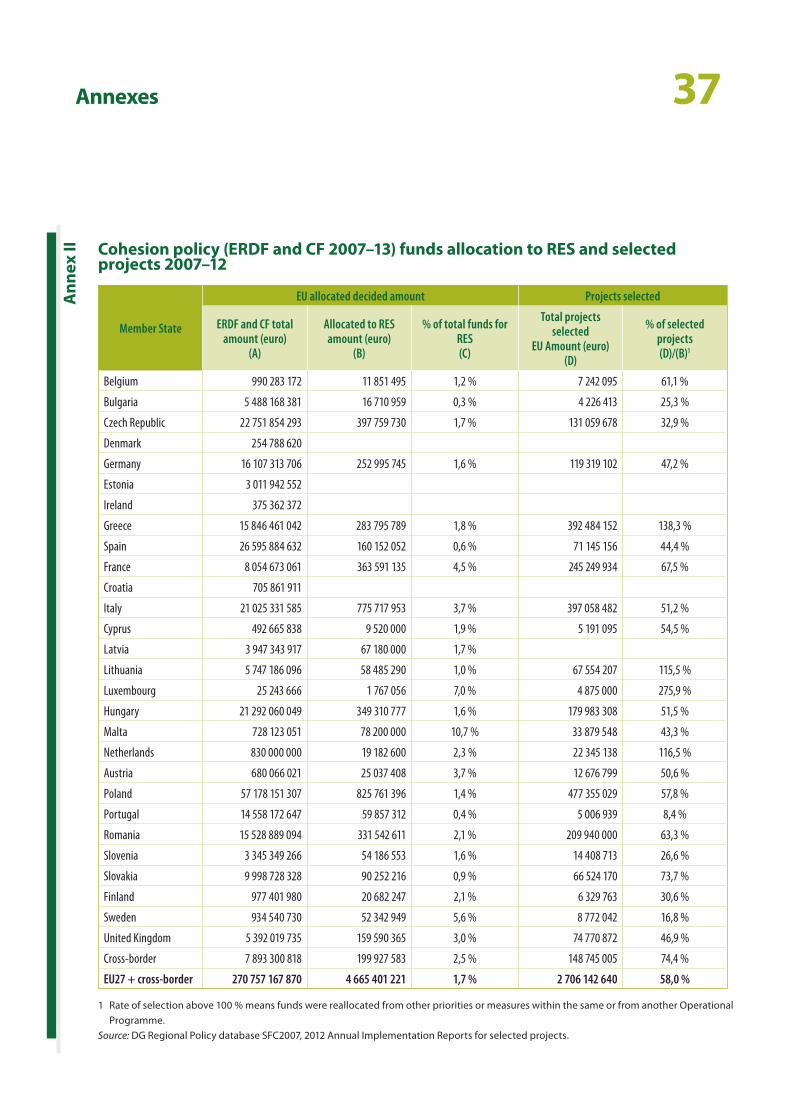
08 Cohesion policy instruments — the European Regional Development Fund (ERDF) and the Cohesion Fund (CF) — are the most important funding source among the EU spending programmes13 for promoting renewable energy. While during the 2000–06 program-ming period only 600 million euro had supported projects in this sec-tor, approximately 4,7 billion euro was allocated to renewable energy in the 2007–13 programming period, reflecting a much higher importance to this policy area (see Annex II for the breakdown by Member States). In the 2014–20 programming period, cohesion policy support to the shift towards a low-carbon economy will further increase and may reach at least 27 billion euro from the ERDF14. Further support can also be provided through the Cohesion Fund.
13 Other EU programmes promoting RES in the 2007–13 programming period were: European Energy Programme for Recovery, Intelligent Energy Europe Programme and Framework Programme for Research.
14 Regions will have to invest a minimum share of ERDF resources (20 % for more developed regions, 15 % for transition regions and 12 % for less developed regions) in supporting the shift towards a low-carbon economy in all sectors, including investments in renewable energy (Article 4(1) of Regulation (EU) No 1301/2013 of the European Parliament and of the Council of 17 December 2013 on the European Regional Development Fund and on specific provisions concerning the Investment for growth and jobs goal and repealing Regulation (EC) No 1080/2006 (OJ L 347, 20.12.2013, p. 289)).
Cohesion policy spending for RES — key facts
ο 270,8 billion euro — total ERDF/CF allocations for 2007–13
ο 0,6 billion euro — total ERDF/CF allocations to RES for 2000–06
ο 4,7 billion euro — total ERDF/CF allocations to RES for 2007–13
At least 27 billion euro — estimated minimum ERDF allocations to supporting the shift towards a low-car-bon economy, including RES, for 2014–20. Further allocations could also be made from the Cohesion Fund (footnote 14).
Box
1
11Introduction
Shared management
09 In the framework of cohesion policy the Member States draft the individual operational programmes, set up and operate their management and control systems and issue annual implemen-tation reports to the Commission. Moreover, as part of the day-to-day management, national or regional bodies select the projects and are responsible for their implementation and evaluation.
10 Managing authorities, intermediate bodies and certifying authorities are in charge of managing the implementa-tion of the operational programmes15. Project funding is subject to rules and conditions laid down partly at EU16 and partly at Member State level (pro-ject selection; project cost, benefit and earnings assessments; and also economic, social and environmental impact assessments are responsibili-ties of the Member States’ authorities).
11 The Commission issues guidelines for drawing up operational programmes, approves the operational programmes and supervises the setting up and the operation of systems in the Member States. In particular, it monitors the implementation of the operational programmes essentially through the implementation reports received and through participation in monitoring committees. In addition to annual implementation reports, the Commis-sion may request specific programme information and ‘project selection’ data from the managing authorities.
15 A summary of the rules for the application of the European Regional Development Fund, the European Social Fund and the Cohesion Fund 2007–13, including on management and control systems, is available on: http://europa.eu/legislation_summaries/regional_policy/management/g24241_en.htm
16 Council Regulation (EC) No 1083/2006 of 11 July 2006 laying down general provisions on the European Regional Development Fund, the European Social Fund and the Cohesion Fund and repealing Regulation (EC) No 1260/1999 (OJ L 210, 31.7.2006, p. 25).
12Audit scope and approach
12 The audit sought to answer the ques-tion whether the ERDF and CF projects investing in renewable energy gen-eration had achieved good results. In this regard, multiple audit criteria were developed (see Annex IV) which were based on different sources and studies, including such by the Com-mission’s services. The Court examined whether the audited projects were implemented and delivered outputs as planned and whether they attained their energy generation targets. The audit analysed in particular whether the funds in the operational pro-grammes in the 2007–13 programming period had been allocated to well prioritised, cost-effective and mature renewable energy generation projects with rational objectives and the extent of the projects’ contribution in achiev-ing the 2020 RES target.
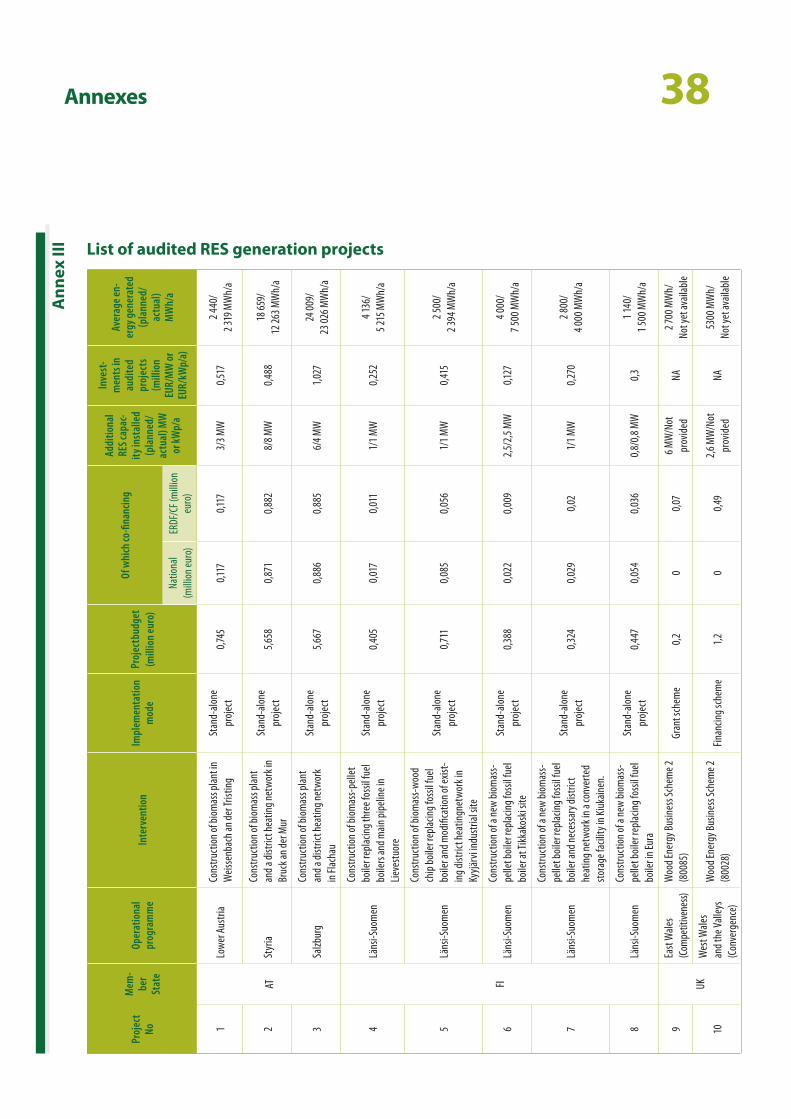
13 The audit results were derived from an examination of 24 completed renewable energy generation projects from nine operational programmes financed through the ERDF or the CF in Austria, Finland, Malta, Poland and the United Kingdom17. The projects were in the biomass, photovoltaic (PV), solar thermal and wind energy sectors18. Annex III presents a list of the audited RES projects.
17 Based on the allocation of funds to RES in the operational programmes the following were selected:
OP I — Investing in Competitiveness for a Better Quality of Life — 2007MT161PO001
OP Niederösterreich 2007–13: Ziel Regionale Wettbewerbsfähigkeit & Beschäftigung/EFRE — 2007AT162PO001
OP Salzburg 2007–13: Ziel Regionale Wettbewerbsfähigkeit & Beschäftigung/EFRE - 2007AT162PO006
OP Steiermark 2007–13: Ziel Regionale Wettbewerbsfähigkeit & Beschäftigung/EFRE — 2007AT162PO007
OP Program Operacyjny Infrastruktura i Środowisko — 2007PL161PO002
OP Regionalny Program Operacyjny Województwa Lubelskiego — 2007PL161PO007
OP Alueellinen Kilpailukyky-ja työllisyystavoite; Länsi-Suomen EAKR-Toimenpideohjelma 2007–13 — CCI2007FI162PO003
OP West Wales and the Valleys ERDF Convergence programme — 2007UK161PO002
OP East Wales ERDF Regional competitiveness and Employment programme — 2007UK162PO012
18 Of the 24 audited projects, 9 were for electricity production from full-scale or micro-wind turbines or photovoltaic panels, 15 projects related to heat generation from biomass or hot water production from solar collectors. The size of the projects varied from household-scale single solar panel projects to a wind farm with 16 turbines.

13Observations
Audited projects delivering outputs as planned …
The overall picture is one of well-planned projects delivering according to plan
14 The audited RES projects were suf-ficiently mature and ready for imple-mentation when selected. In spite of relatively long preparatory phases in some of the biomass and wind energy projects critical permits, licences and technical plans had usually been ob-tained prior to project approval. Where applicable, it was also ensured that the installations were connected to the transmission or distribution networks or that contracts were concluded with a sufficient number of consumers19.
15 There have been no significant cost overruns or time delays in the projects. Overall, the audited RES projects were implemented within the planned time
schedules or with only relatively small time slippages (implementation was delayed by more than 6 months only in two projects of which one was due to repair downtime of a small combined heat and power plant). No significant cost overruns occurred during imple-mentation. Box 2 shows examples of audited RES projects.
16 With the exception of one biomass facility20, the RES generation capaci-ties were installed and operational as planned. No major risks to their technical sustainability were apparent. Few deviations from initial planning and approved project proposals were found. The projects’ installed energy generation capacities were generally in line with the co-financing decisions. The facilities have been in opera-tion without major technical or other problems since their commissioning. Only a few generation units from the audited projects were not in operation mode. Operators had in place suffi-cient expertise and resources to ensure a smooth running and regular mainte-nance of their installations.
19 For instance, the approval of the audited biomass projects in Austria was conditional on a sufficient number of consumers of the produced heat energy.
20 One biomass power plant in Austria deviated from the original plan in that it utilised EU funds for heat network extension instead of installing a second boiler as per the original plan. This deviation was in anticipation of an extension of heating capacity to serve additional heat consumers and is therefore not a shortcoming from a sound financial management point of view.
Pict
ure
1 Interior view of the biomass power plant in Bruck an der Mur, Austria (project installed and operational as planned)
Source: European Court of Auditors.
14Observations
Pict
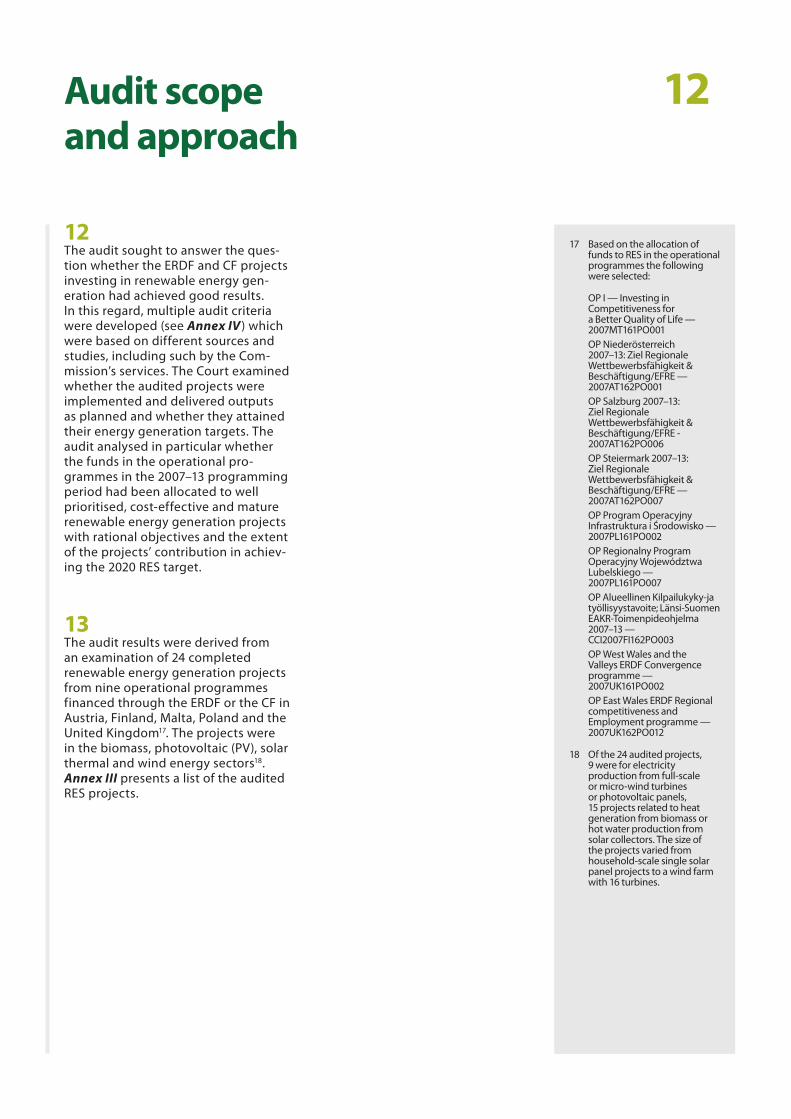
ure
2 Wood chips in a storage hopper in the biomass power plant in Bruck an der Mur, Austria
Source: European Court of Auditors.
Examples of audited RES projects co-financed by the cohesion policy funds — outputs
For more details concerning project outputs see Annex III.
BiomassThree audited biomass heating plants (capacity from 3 MW to 8 MW) with district heating network lines (of 0,6 to 11 km) were constructed in Austria. The plants supplied heat and hot water for a total of 266 con-sumers (private individuals or industrial companies).
Three audited projects in Finland related to the construction of new biomass-pellet or wood chips boilers (ca-pacity from 0,8 MW to 2,5 MW). They replaced old fossil fuel (heavy oil) boilers. Two of these projects included also construction of the required district heating network (0,6 and 3 km).
Wind powerFive wind farms with power capacities ranging from 3,2 to 38 MW were constructed in Poland. The facilities include all necessary infrastructures (high/medium voltage substations, connections to electricity grid and service roads).
Solar power (PV and solar collectors)Two projects installed PV electricity systems with associated hardware and monitoring systems on public buildings in Malta. One project was complemented by a small wind turbine.
Five similar projects in Poland installed individual sets of flat plate solar collectors for households and public buildings in five municipalities to supply residents with hot water. In total, over 3 000 public and private ben-eficiaries installed solar collectors. One project included street lighting and PV.
Box
2
15Observations
… but encountering some difficulties in implementation
There is scope for further improvement at all project stages — from procurement through operations to moni-toring and evaluation
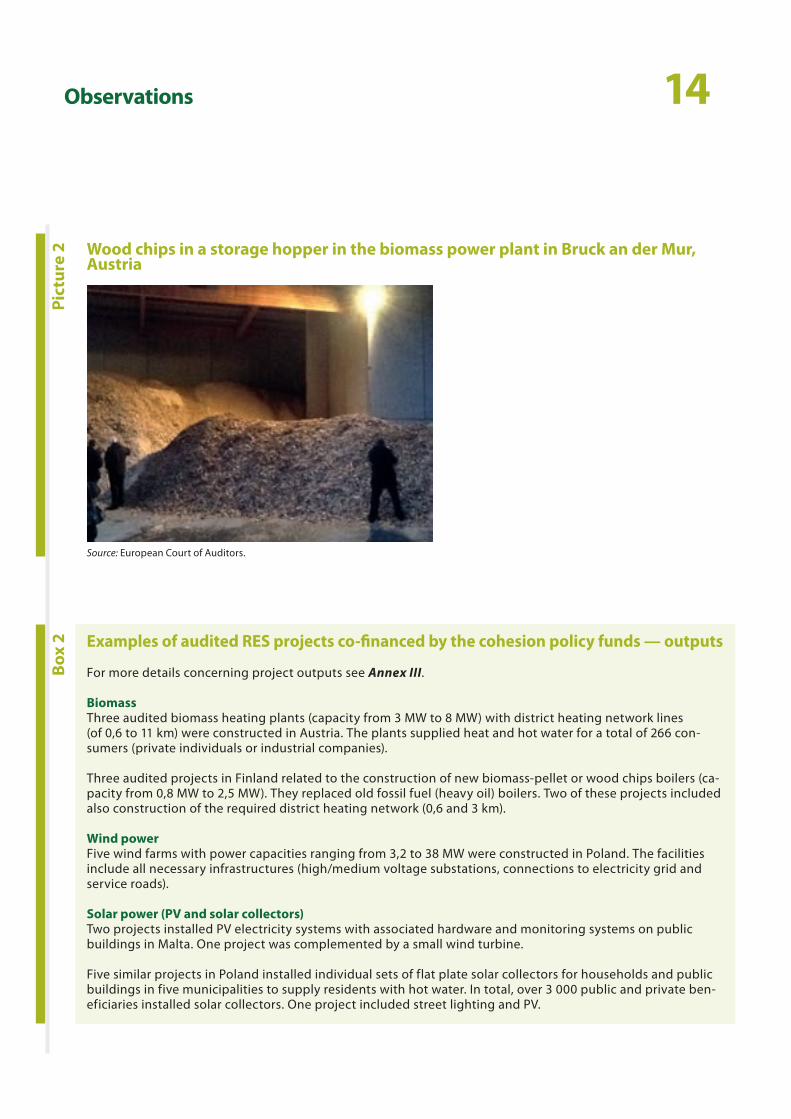
17 Difficulties with RES electricity inte-gration into the grid have hampered exploitation of RES. Throughout the EU the development of the grid has been identified as one of the key barriers to the large-scale integration of RES elec-tricity into the transmission and distri-bution grids21. Accordingly, the Union and its Member States need to invest
in both national networks and cross-border links as part of building the internal energy market. The owners of the projects audited emphasised that spare capacity in the grids was insuffi-cient22, the grids have to be expanded and modernised and greater transpar-ency about the distribution of costs among the grid operators, government and project promoters could improve system-wide efficiency. While only few of the audited projects encountered grid connection problems, the deploy-ment of RES generation is, nonethe-less, not accompanied by improved grids in the Member States. Technical and cost issues were frequently cited by national authorities and RES opera-tors as impediments to an effective RES integration to the grids. Box 3 il-lustrates problems in connection with RES electricity in the grids.
21 COM(2013) 175 final.
22 See also Directive 2005/89/EC of the European Parliament and of the Council of 18 January 2006 concerning measures to safeguard security of electricity supply and infrastructure investment (OJ L 33, 4.2.2006, p. 22). Article 3(2)(f) stipulates that Member States in implementing measures aimed at safeguarding security of electricity supply shall take account of the need to ensure sufficient transmission and generation reserve capacity for stable operation.
Pict
ure
3 Windfarm in Golice, Poland
Source: European Court of Auditors.
16Observations
18 The Commission in its analysis of Mem-ber States’ 2011 renewable energy pro-gress reports indicated that progress removing the administrative barriers was still slow, with complex and dis-couraging authorisation and permit-ting procedures24. There is potential for improvements in the Member States where the audit took place. The audit found, for example, that Malta had embarked on RES development only during the 2007–13 period whereby
a market for RES has not yet developed to maturity. An effective administra-tive system has not developed in full yet. Moreover, in Poland and in the United Kingdom national or regional harmonised approaches to coordinate the work of the authorities were par-tially lacking. Notably measuring and reporting of projects’ energy results were poor and hence data was not used for comparing projects and dif-ferent RES sectors as a useful informa-tion in designing future measures.
24 SWD(2013) 102 final of 27 March 2013 ‘Renewable energy progress report’.
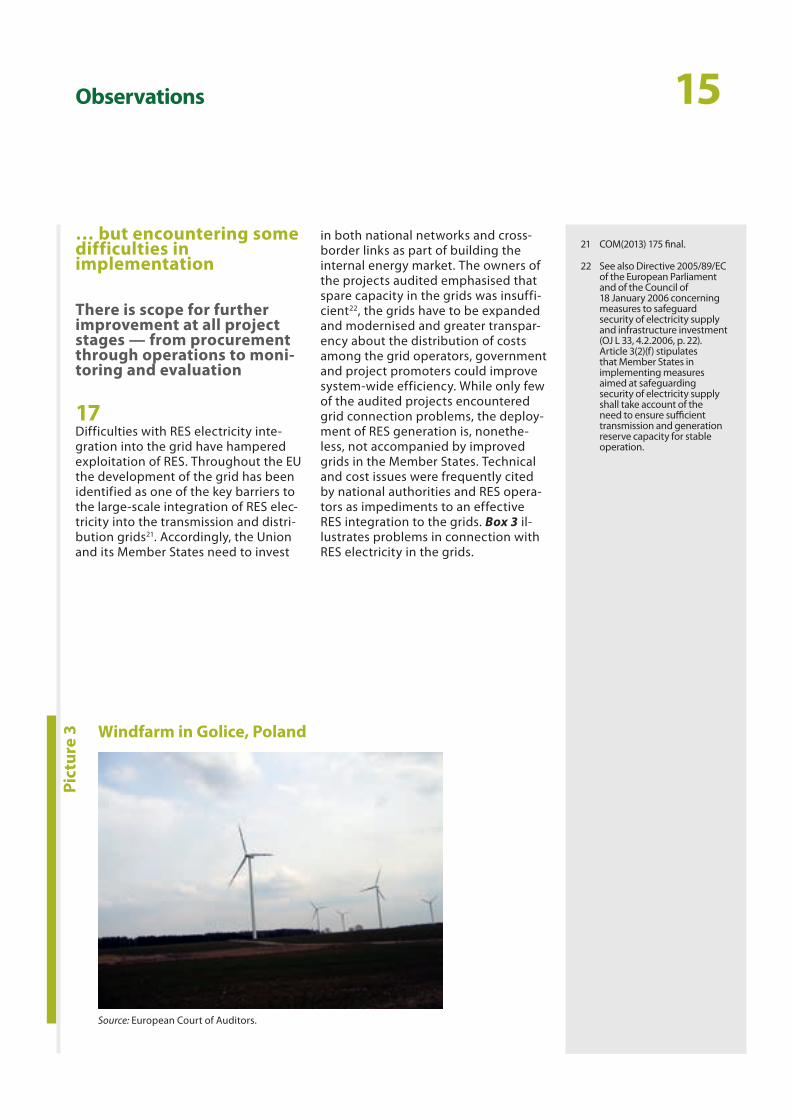
Access to the grid of RES electricity in Poland, integration of electricity from photovoltaic into the grid in Malta
The poor state and lack of spare capacity of the transmission and distribution grids have been key barriers to the further integration of electricity from PV and wind energy in Poland. Apart from the need for expansion and modernisation of grid infrastructure, complications with obtaining the necessary permits for grid con-nection (legal and technical problems as well as grid connection fees) hampered RES development23. In the audited wind energy projects, the lead times to construction of the facilities, including for the required grid connection permits, have been 4 to 5 years.
Clear guidelines about planning permission and permits, where required, were available concerning solar and PV installations in Malta. However, in 2010 and 2011 when multiple EU co-funded projects were commissioned these frequently encountered difficulties with feeding-in of their generated electricity — usually the electric-ity in excess of producers’ own consumption. Since meters had not been installed by the grid operator the producers were not compensated for their electricity by the feed-in tariff for periods of up to 4 months.
23 Integration of electricity from renewables to the electricity grid and to the electricity market — RES-Integration. National report: Poland. Eclareon, Oeko-Institut e.V., 20.12.2011.
Box
3
17Observations
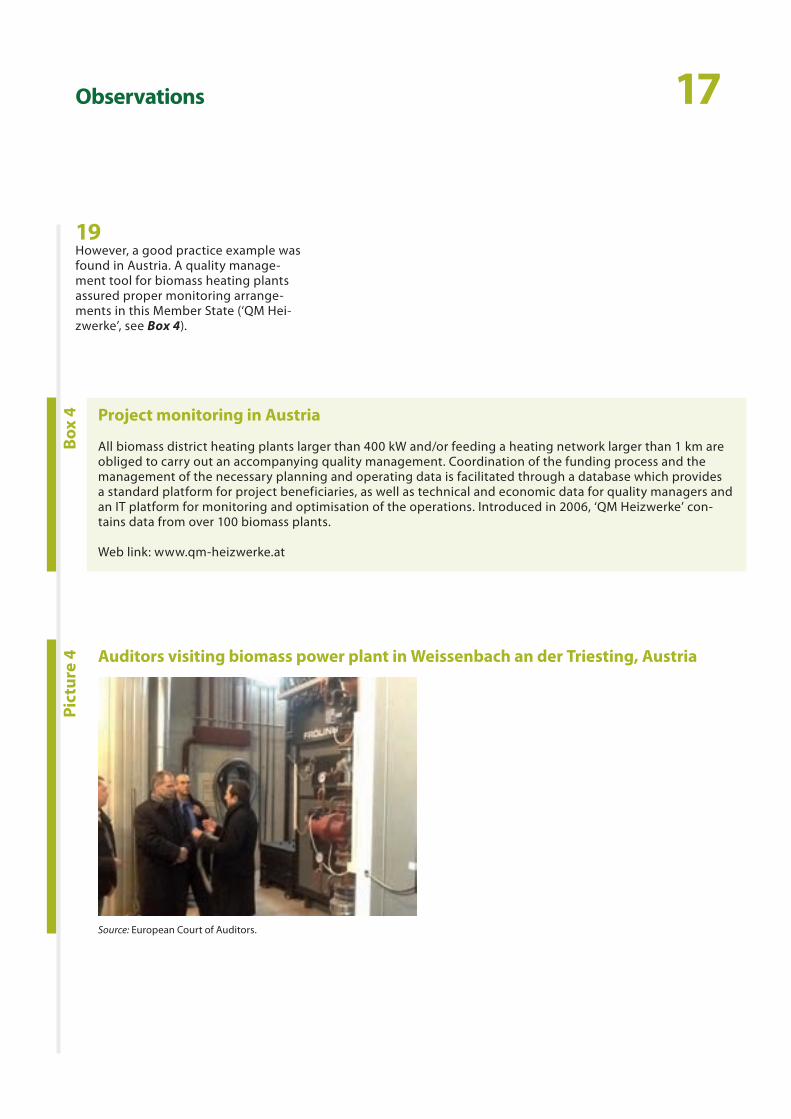
19 However, a good practice example was found in Austria. A quality manage-ment tool for biomass heating plants assured proper monitoring arrange-ments in this Member State (‘QM Hei-zwerke’, see Box 4).
Project monitoring in Austria
All biomass district heating plants larger than 400 kW and/or feeding a heating network larger than 1 km are obliged to carry out an accompanying quality management. Coordination of the funding process and the management of the necessary planning and operating data is facilitated through a database which provides a standard platform for project beneficiaries, as well as technical and economic data for quality managers and an IT platform for monitoring and optimisation of the operations. Introduced in 2006, ‘QM Heizwerke’ con-tains data from over 100 biomass plants.
Web link: www.qm-heizwerke.at
Box
4Pi
ctur
e 4 Auditors visiting biomass power plant in Weissenbach an der Triesting, Austria
Source: European Court of Auditors.
18Observations
20 The procurement processes did not ensure full transparency, fairness or ef-ficiency in contractors’ selection:
ο The tenders had to be cancelled in two audited PV projects in Malta because all bids had been technically or administratively non-compliant. This was due to either unnecessarily high technical requirements or overly complex procedures and requirements. In both cases some delay occurred and competition among bidders was hampered.
ο In two projects in Poland, the wind turbine models were speci-fied unnecessarily in construction plans or construction permits. This prevented tender specifications which could ensure competitive procurement and best price/quality ratios. In another project, likewise, a specific solar collector type had been pre-determined. In each
of those tenders only one bid of those submitted met the technical specifications.
ο Implementing bodies and project beneficiaries lacked sufficient ex-pertise on RES technologies, their markets and procurement frame-works. Multiple RES equipment and installation works have been of a similar, sometimes identical, na-ture and small in size, especially the operations under grant schemes. Therefore, conditions were there for a coordinated procurement managed by a specialised unit of experts at national/regional level to obtain better price/quality ratios, economies of scale and also shorter procurement periods. Examples are roof top water heating systems, PV panels and small biomass in Malta and Poland. There were temporary suspensions of projects in Malta, partly as a result of non-efficient organisation of procurement.
Pict
ure
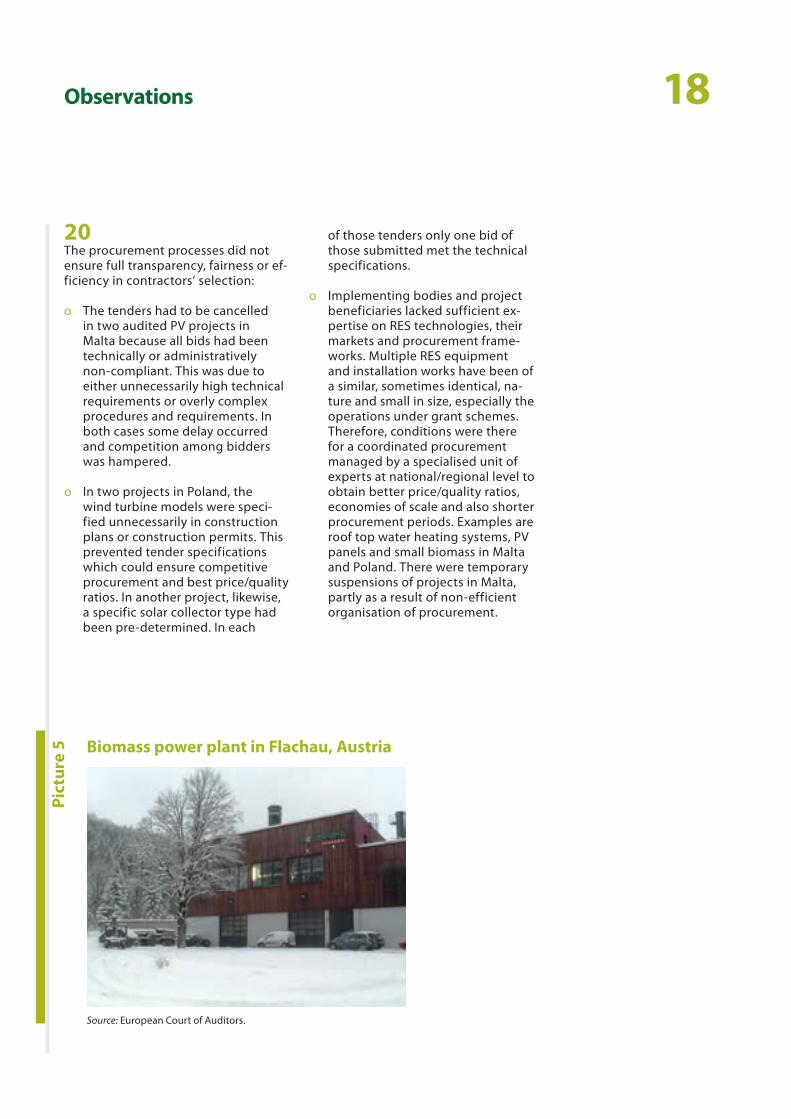
5 Biomass power plant in Flachau, Austria
Source: European Court of Auditors.
19Observations
21 The preparation of the RES projects has been insufficient for effective monitoring and evaluation. The objec-tives and performance indicators set in all operational programmes audited were imprecise and not based on reli-able baseline data. Thus, the projects in the same or different RES sectors could not be compared; nor could the contribution of the EU funds to the EU and national RES targets be verified by the competent authorities (see also paragraph 30).
… and results not prop-erly measured or projects not attaining their energy generation targets in the majority of cases
RES data collection and reporting can be improved
22 No accurate, validated data about actual RES project results is available in the Member States. The RES sector was characterised by enormous volatility in terms of the costs of the technologies (most technologies saw massive price reductions) and increasing energy prices. It is important to analyse up-to-date information about RES technol-ogy costs in order to establish which technologies render the most favour-able yields in the specific local circum-stances and the appropriate levels of support.
23 However, while data is available about the projects’ installed generation capacities, no or non-reliable data was available on the actual generated en-ergy in 11 out of 24 audited projects.
Actual measurement and reporting not having been conditions for public co-financing, project final reports pro-vided only estimated, non-measured results — usually based on technical parameters of the RES technologies as supplied by the manufacturers and the specific local situations. Multiple RES producers did not measure their energy yields. Thus, in 11 of 24 au-dited projects (five in Poland — solar projects in the Lublin region, four in Malta and two in the United Kingdom) the energy results were not based on measured/validated data but on assumed values taken from literature or professional estimates made by engineers.
Project results not always achieved
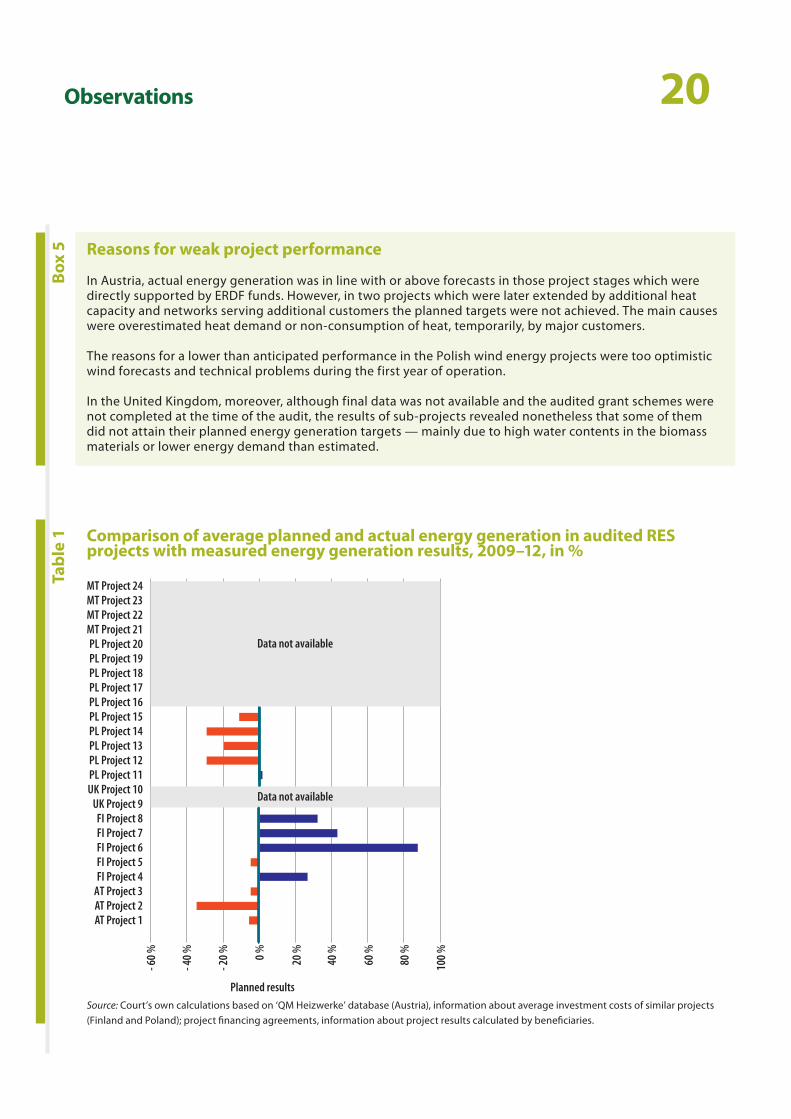
24 Of 13 out of the 24 audited projects, in which energy generation results were actually measured, the targets were attained in only 5 projects, and almost attained in 3 further projects. The remaining projects did not reach or only partly reached their production targets. While in several cases this was due to insufficiently precise forecasts some projects had also encountered technical problems in their initial stages. Table 1 compares the RES projects’ planned with actual energy generation.
25 In summary, the evaluation of the 24 audited projects’ cost-effec-tiveness, implementation and achieve-ment of objectives has resulted in a mixed bag of good, satisfactory and poor projects, as is laid out in Annex IV. Box 5 indicates reasons for weak performance in some RES projects.
20Observations
Reasons for weak project performance
In Austria, actual energy generation was in line with or above forecasts in those project stages which were directly supported by ERDF funds. However, in two projects which were later extended by additional heat capacity and networks serving additional customers the planned targets were not achieved. The main causes were overestimated heat demand or non-consumption of heat, temporarily, by major customers.
The reasons for a lower than anticipated performance in the Polish wind energy projects were too optimistic wind forecasts and technical problems during the first year of operation.
In the United Kingdom, moreover, although final data was not available and the audited grant schemes were not completed at the time of the audit, the results of sub-projects revealed nonetheless that some of them did not attain their planned energy generation targets — mainly due to high water contents in the biomass materials or lower energy demand than estimated.
Box
5Ta
ble
1 Comparison of average planned and actual energy generation in audited RES projects with measured energy generation results, 2009–12, in %
Source: Court’s own calculations based on ‘QM Heizwerke’ database (Austria), information about average investment costs of similar projects (Finland and Poland); project financing agreements, information about project results calculated by beneficiaries.
PL Project 20
MT Project 22MT Project 21
MT Project 24MT Project 23
- 20
%
20 %0 %
40 %
60 %
80 %
100
%
AT Project 1AT Project 2
FI Project 4FI Project 5
FI Project 7FI Project 8
UK Project 9UK Project 10PL Project 11PL Project 12PL Project 13PL Project 14
PL Project 16PL Project 17
Data not available
PL Project 19PL Project 18
PL Project 15
FI Project 6
AT Project 3
- 60
%
- 40
%
Planned results
Data not available
21Observations
The principle of cost- effectiveness is not fully considered in planning the RES projects
Cost-effectiveness — an important objective in EU spending
26 Cost-effectiveness concerns the abil-ity or potential of an audited entity, activity, programme or operation to achieve certain outcomes at a reason-able cost. Cost-effectiveness analyses are studies of the relationship between project cost and outcomes, expressed as cost per unit of outcome achieved25.
27 Optimal (or cost-effective) RES energy generation is important for economic performance. Cohesion policy funds constitute a significant part of sup-port for RES activities and could be an important driver of both RES policy as well as regional economic development.
25 ISSAI 3000: Standards and guidelines for performance auditing based on Intosai’s Auditing Standards and practical experience.
Pict
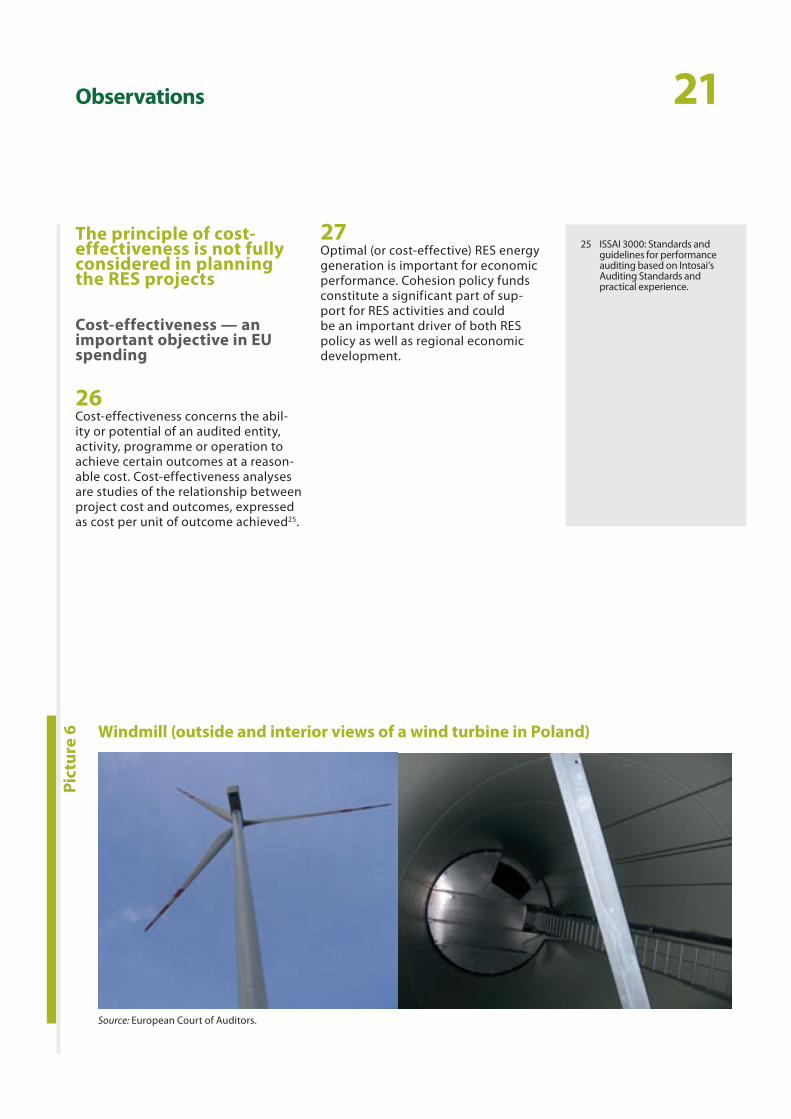
ure
6 Windmill (outside and interior views of a wind turbine in Poland)
Source: European Court of Auditors.
22Observations
There is scope for an emphasis on cost-effectiveness at an early stage
28 In connection with the preparation of the operational programmes, the national authorities did not conduct proper needs assessments to identify which technologies could contribute to attaining the RES targets in the most cost-effective way and how they could be complemented by other financial instruments or national sup-port schemes. As a result, the opera-tional programmes did not contain explanations as to how the EU funds could contribute cost-effectively to attaining the RES objectives.
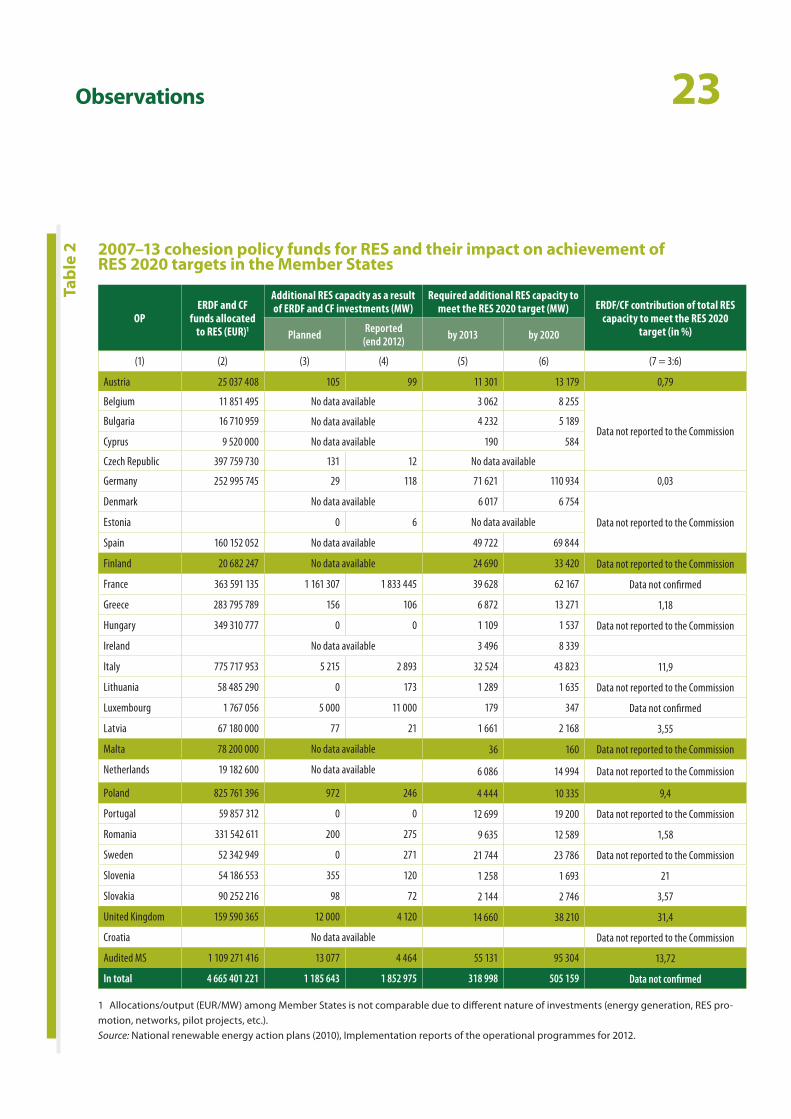
29 Moreover, the Commission and the national authorities did not plan the cohesion policy (or national) funds’ contributions in attaining the RES targets. From the audited operational programmes, those in Austria and in Finland did not lay out the planned and actual RES energy generated from the ERDF- and CF-supported measures. The installed capacity from RES in the five audited countries to meet the RES target in 2020 is 95 304 MW (see Table 2). The implementation reports submitted by the managing authori-ties to the Commission reveal that, by 2012, 4 464 MW or 4,7 % of the required capacity as per the 2020 target (or 8,1 % in relation to the 2013 trajectory target in the audited Member States) was con-tributed through the cohesion policy projects in these countries.
The cohesion policy funds’ use for RES has been variable among the Mem-ber States. As can also be seen from Table 2, for multiple Member States no adequate data is available for compar-ing the achievement of the cohesion policy projects in relation to the RES targets. This lack of data inhibits estab-lishing baseline economic and energy data in different RES sectors and for different RES technologies.
23ObservationsTa
ble
2 2007–13 cohesion policy funds for RES and their impact on achievement of RES 2020 targets in the Member States
1 Allocations/output (EUR/MW) among Member States is not comparable due to different nature of investments (energy generation, RES pro-motion, networks, pilot projects, etc.).Source: National renewable energy action plans (2010), Implementation reports of the operational programmes for 2012.
OPERDF and CF
funds allocated to RES (EUR)1
Additional RES capacity as a result of ERDF and CF investments (MW)
Required additional RES capacity to meet the RES 2020 target (MW) ERDF/CF contribution of total RES
capacity to meet the RES 2020 target (in %)Planned Reported
(end 2012) by 2013 by 2020
(1) (2) (3) (4) (5) (6) (7 = 3:6)
Austria 25 037 408 105 99 11 301 13 179 0,79
Belgium 11 851 495 No data available 3 062 8 255
Data not reported to the CommissionBulgaria 16 710 959 No data available 4 232 5 189
Cyprus 9 520 000 No data available 190 584
Czech Republic 397 759 730 131 12 No data available
Germany 252 995 745 29 118 71 621 110 934 0,03
Denmark No data available 6 017 6 754
Data not reported to the CommissionEstonia 0 6 No data available
Spain 160 152 052 No data available 49 722 69 844
Finland 20 682 247 No data available 24 690 33 420 Data not reported to the Commission
France 363 591 135 1 161 307 1 833 445 39 628 62 167 Data not confirmed
Greece 283 795 789 156 106 6 872 13 271 1,18
Hungary 349 310 777 0 0 1 109 1 537 Data not reported to the Commission
Ireland No data available 3 496 8 339
Italy 775 717 953 5 215 2 893 32 524 43 823 11,9
Lithuania 58 485 290 0 173 1 289 1 635 Data not reported to the Commission
Luxembourg 1 767 056 5 000 11 000 179 347 Data not confirmed
Latvia 67 180 000 77 21 1 661 2 168 3,55
Malta 78 200 000 No data available 36 160 Data not reported to the Commission
Netherlands 19 182 600 No data available 6 086 14 994 Data not reported to the Commission
Poland 825 761 396 972 246 4 444 10 335 9,4
Portugal 59 857 312 0 0 12 699 19 200 Data not reported to the Commission
Romania 331 542 611 200 275 9 635 12 589 1,58
Sweden 52 342 949 0 271 21 744 23 786 Data not reported to the Commission
Slovenia 54 186 553 355 120 1 258 1 693 21
Slovakia 90 252 216 98 72 2 144 2 746 3,57
United Kingdom 159 590 365 12 000 4 120 14 660 38 210 31,4
Croatia No data available Data not reported to the Commission
Audited MS 1 109 271 416 13 077 4 464 55 131 95 304 13,72
In total 4 665 401 221 1 185 643 1 852 975 318 998 505 159 Data not confirmed
24Observations
30 The cost-effectiveness of measures in different RES sectors was not ex-amined and did not determine the budgets earmarked to RES under the audited operational programmes while proper needs assessment and mid-term evaluations were lacking:
ο When operational programmes were designed in 2007 there had been a lack of detailed situation analysis (including needs assess-ment in different RES sectors in the regions); in particular, the costs per unit of energy capacity installed or the costs of energy generation per unit had not been estimated by national authorities thus neglecting the cost-benefit/cost-effectiveness of the measures planned to be financed through public means;
ο Also, the operational programmes did not take advantage of the results of or lessons learnt from previous RES programmes financed by national or EU resources;
ο No adequate justification for allo-cating public funds to RES genera-tion interventions was provided. Fund allocations were, in general, based on rough estimation of the regional potential and fund absorption capacities rather than systematic analysis of the regional situation and comparison between potential alternatives in terms of types of RES or RES technologies;
ο Although the authorities in Fin-land and in the United Kingdom inserted some adaptations in their programmes along the way with-out formal assessments, in general however no mid-term evaluations or similar assessments of the 2007–13 measures were conducted which could have helped redirect the RES programmes.
31 Furthermore, the operational pro-grammes failed to establish per-formance indicators for proper monitoring and evaluation of cost-effectiveness of RES measures which could also have facilitated assessing the contribution of the EU funds to the committed RES targets (Table 2). While the operational programmes in Austria, Poland and Malta had indicators referring to additional RES capacity, the set of result indicators in Finland did not include indicators for creation of generation capacity, pro-duced energy or reduction/avoidance of CO2 emissions, and in the United Kingdom a result indicator in respect of RES capacity creation was also lack-ing. This means that, in these cases, the managing authorities and the Commission were not in a position to conduct adequate monitoring and ex post evaluation of the cohesion policy funds’ investments in RES26.
26 The annual implementation reports by Finland and the United Kingdom did not provide explanations about actual results and their measurement and no assessment of the barriers, the potential and the needs in the different RES sectors in the regions covered by the audited OPs had been conducted.
25Observations
… and there is also scope for more cost-effective RES generation projects
32 Removing inefficiencies in the plan-ning and implementation of RES pro-jects will make a direct contribution to achieving the 2020 EU and national RES targets. But it can also benefit the energy consumers and boost the broader economy as well.
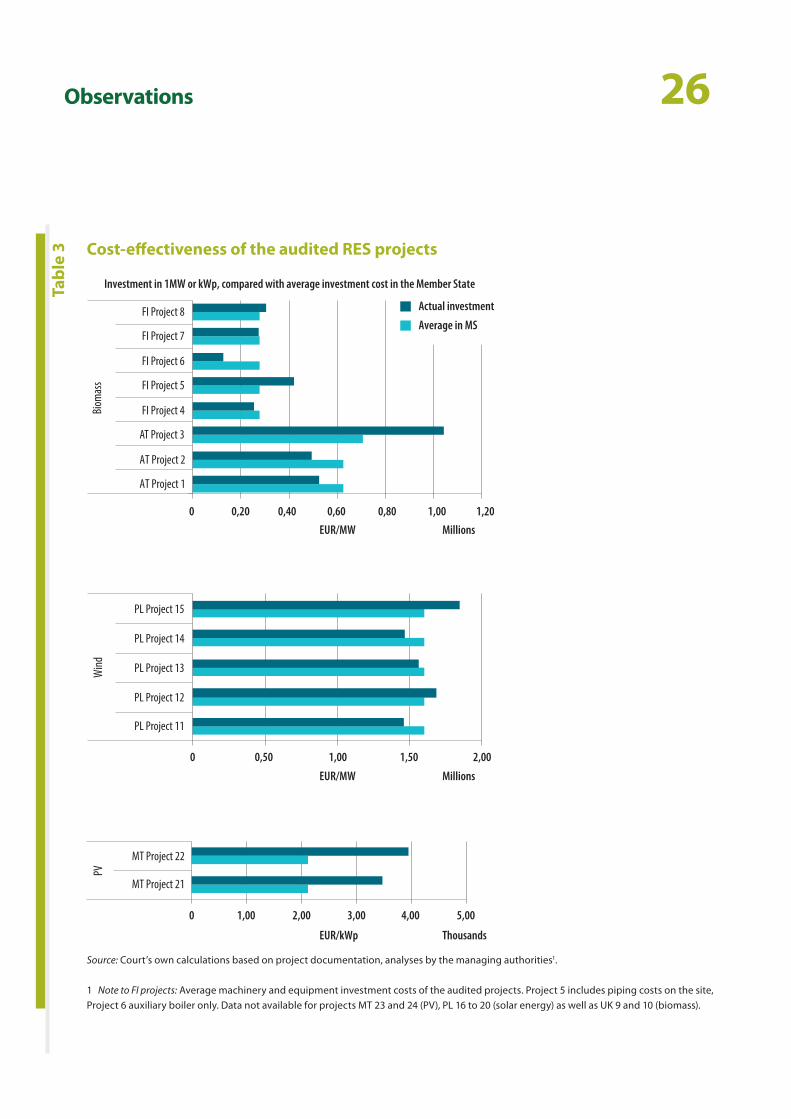
33 The results of the EU-supported projects varied in terms of their cost-effectiveness. The investment costs of RES technologies range widely and are site specific. There is no single most cost-effective RES generation
technology in the EU. Therefore the audit compared only costs within a particular RES sector in the same Member State. Four audited projects were significantly more expensive than similar projects in the same Mem-ber State (biomass and PV projects, see Table 3). The calculated average costs for installed capacity varied from 0,16 million EUR/MW to 1,8 mil-lion EUR/ MW in the audited projects. As calculated by the national authori-ties in one of the Member States where the audit took place, the payback periods varied from 2 to 537 years in the audited projects. Capital-intensive investments with payback periods of more than 100 years will not achieve an economically reasonable break-even point. This indicates that public support was not always allocated to the most cost-effective projects.
Pict
ure
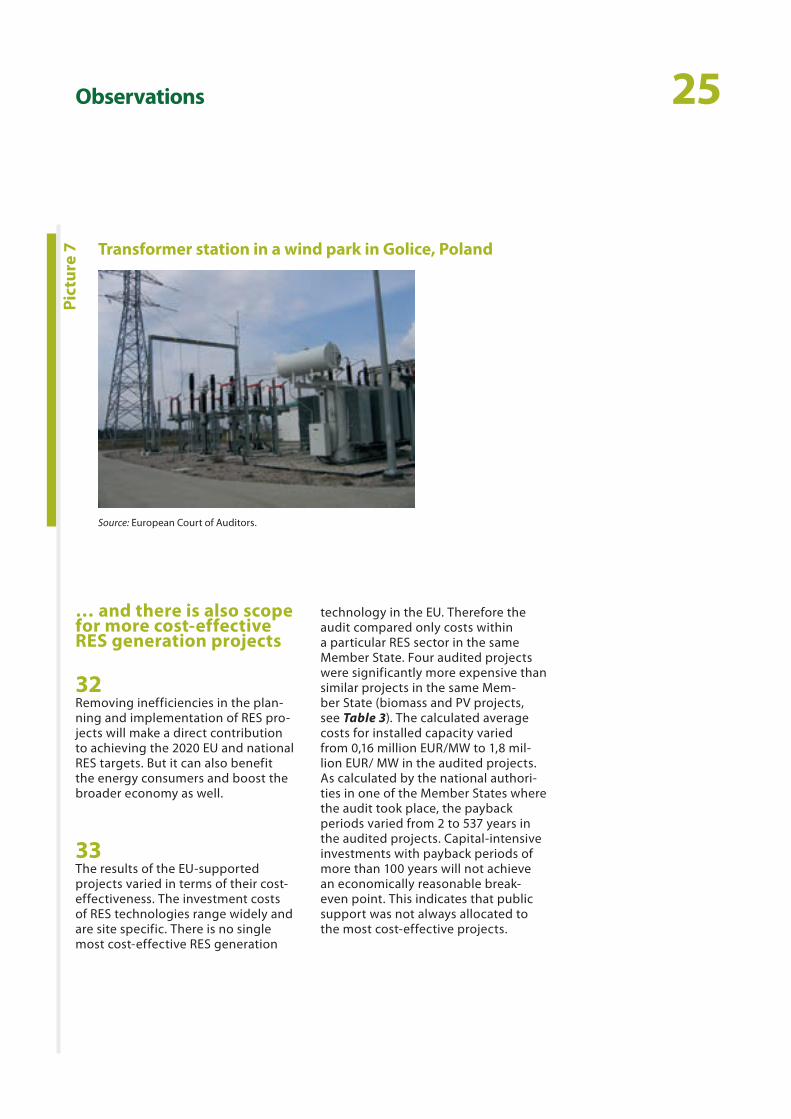
7 Transformer station in a wind park in Golice, Poland
Source: European Court of Auditors.
26Observations
Tabl
e 3 Cost-effectiveness of the audited RES projects
Source: Court’s own calculations based on project documentation, analyses by the managing authorities1.
1 Note to FI projects: Average machinery and equipment investment costs of the audited projects. Project 5 includes piping costs on the site, Project 6 auxiliary boiler only. Data not available for projects MT 23 and 24 (PV), PL 16 to 20 (solar energy) as well as UK 9 and 10 (biomass).
EUR/MW Millions
EUR/MW Millions
EUR/kWp Thousands
Actual investment
Investment in 1MW or kWp, compared with average investment cost in the Member State
Average in MS
0 0,20 0,40 0,60 0,80 1,00 1,20
1,00 1,50 2,000,500
0 1,00 2,00 3,00 4,00 5,00
Biom
ass
Wind
PV
PL Project 15
PL Project 14
PL Project 13
PL Project 12
PL Project 11
MT Project 22
MT Project 21
FI Project 8
FI Project 7
FI Project 6
FI Project 5
FI Project 4
AT Project 3
AT Project 2
AT Project 1
27Observations
34 Rational energy objectives were only partly set for the RES projects. The projects were in line with national strategic RES objectives. Fuel supply concepts existed where necessary (biomass projects in Austria, Finland and in the United Kingdom). Some pro-jects were preceded by limited stud-ies showing their economic viability and profitability but no analyses were made concerning the best and most cost-effective RES types and best technological solutions. Evaluations of previous similar interventions were not referred and thus no ‘lessons learnt’ were used in preparing the audited RES projects.
35 Only about half of the audited projects (13 of 24) had data through which the achievement of the indicators in terms of actually achieved energy generation could be verified (Table 1 and An-nex III), see also paragraph 24. Further-more, frequently baseline data about the costs of energy production, the quantities of conventional fuels used by consumers was not available before objective-setting and designing the projects (e.g. operational programme of the Lublin region in Poland). Conse-quently, in such cases, it is not possible to assess whether the funded projects actually generated the expected economic or financial results (e.g. for calculating payback periods).
36 The selection procedures did not guarantee cost-effective projects. In general, the project selection criteria, approved by the monitoring commit-tees established for each operational programme, were not enabling the implementing authorities to identify the most cost-effective RES projects. The creation of energy capacity, actual energy generation and the relevant necessary investments were in many cases not weighted as selection or award criteria. In a few cases, no spe-cific selection criteria in relation to RES generation had been developed but instead selection criteria universally applicable to multiple sectors covered by the operational programme were used27.
37 There has been insufficient competi-tion among project applications in some cases. Where the projects were identified through calls for proposals maximum cost-effectiveness of ap-plications (payback period, investment to energy generation ratio) was not considered. Whereas usually project applications had to fulfil minimum cri-teria, the processes could not prevent subsidising relatively low quality pro-jects in terms of their energy genera-tion results. A determined minimum investment size risked that applica-tions for smaller projects — possibly having better economic parameters — were discarded.
27 For instance:
– the selection of RES projects under the operational programme ‘Infrastructure and Environment’ in Poland was based on the same criteria applied in different sectors, i.e. for non-comparable types of RES projects;
– in Finland, the project applications were not prioritised and only estimated payback periods were used as cost-effectiveness and eligibility criteria;
– in Malta, the selection criteria applied to multiple sectors covered by the operational programme but not specifically to the RES sector. Though one criterion provided scores in relation to the projects’ ‘contribution towards indicators beyond minimum required’, the selection criteria did not include any cost-effectiveness or cost-benefit criteria for RES generation;
– in Austria, a maximum cost-effectiveness of applications (payback period, investment to energy generation ratio) was not considered in the audited operational programmes.
28Observations
38 On the other hand, Austria, the United Kingdom and to some extent Finland had technical and economic criteria in the financing rules geared towards preventing wasteful biomass projects to be selected. There was therefore less risk of selecting non-effective applications. Also, project profitability was taken into account whereby more profitable projects received less sub-sidies (Box 6). Such adaptation of the level of project co-financing was not ensured by the competent authorities in the other Member States where the audit took place.
39 The EU co-financing rates varied be-tween 2 % and 85 % in the operational programmes, without this being justi-fied in the relevant documents. The co-financing principle holds that part of the investment costs of a project is borne by the final recipient of a public grant whereby the revenue or profit-ability in the project are to be taken into account. The purpose of the grant should, furthermore, be to support an action which could not otherwise take off due to a financing gap or a lack of an economic incentive. There is an opportunity cost; high co-financing rates reduced the size or number of other RES projects which could have been supported through public funds. No links were made between rate of support and profitability or need for incentivising investors to carry out RES generation projects. Non-justified very high co-financing rates (public finan-cial support to an amount higher than necessary for a project to be economi-cally or financially viable) increased the risk of deadweight — i.e. replacing pri-vate funds, but also national funds — and reduced the number of supported RES generation projects. Box 7 illus-trates cases of high co-financing.
Project selection — cases in Austria, Finland and the United Kingdom
In Austria, when applying for co-funding, certain technical and economic criteria have to be met (heat den-sity per running meter of the district heating pipe, district heating and boiler’s efficiency). As a result, there is much less risk that non-effective projects are supported.
In Finland, the eligibility criteria and possibility to have consultation with energy consultant/advisor intend to eliminate non-commercially viable projects: the project applicants were required to provide information about the payback-period of the applied project, which should not be less than 3 years (commercially profit-able) nor longer than 12 years (uneconomic), without the public aid.
In the United Kingdom, the proposed project costs were compared with target costs based on past similar biomass projects.
Box
6
29Observations
40 Profitability calculations were not made for different RES sectors or technolo-gies. When planning the programmes the co-financing rates did not distin-guish between the RES sectors, size and types of investments, other promotion/ support regimes in the Member States (feed-in tariffs, premiums), likely profit-ability of the investments and the type of RES technologies used.
High public co-financing — cases in Poland and Malta
In Poland, the schemes for small PV and solar were allocated 85 % from EU funds, whereby individual project owners (households) could receive up to 100 % subsidy. Most large wind farms received maximum public sup-port — either close to 70 % of total eligible investment costs or 10 million euro (4 of the 5 audited projects). While the maximum co-financing rates were applied in most cases they were, however, not modulated or justified based on cost-effectiveness considerations in any programming document. Four of five wind power project beneficiaries recognised that they could have implemented the projects without or with reduced grants and intended to use the EU grants for early repayment of loans.
Malta devoted a large part of available EU funding for supporting RES installations of public institutions thereby not sufficiently leveraging private funding sources. As a rule, the EU financed as much as 85 % of investment costs in those projects. Two large grant schemes, furthermore, for private households and enter-prises financed RES installations by 50 % or 60 % respectively.
Box
7Pi
ctur
e 8 Solar collectors mounted on the roof of a family house in Poland
Source: European Court of Auditors.
30Observations
Cohesion policy funds having limited EU added value — the RES projects did not make their full contribution to the EU’s energy objectives
41 In only a few cases was significant EU added value demonstrated. In those projects the ERDF/CF co-financing facilitated the cap-funding, the co-financing has been a welcome addi-tional source of investment and thus contributed to the implementation of the projects. For the (larger) wind farms it was also regarded as a qual-ity stamp for third-party financing institutions. It is clear that in countries with low RES penetration, which had few RES programmes and less admin-istrative experience in this sector, the EU funds have had more value added in that they have helped to develop additional economic development, in-crease the quality of the relevant pro-jects and also, to some extent, through acting as a catalyst and for leveraging other funds. Moreover, there has been an ‘operational value added’ to some extent as the EU projects imposed certain obligations on the imple-menting bodies through which some learning effects were assured for the organisations involved. Those effects were emphasised notably by organisa-tions in Malta, Poland and the United Kingdom.
42 The Court also found that the RES allocations within the operational pro-grammes in Austria and Finland were prone to a risk of replacing national funds. Indeed, in both these coun-tries the ERDF merely complemented existing national/regional funding mechanisms and in Austria the EU sup-port was virtually integrated, without changing anything else, into an exist-ing subsidy scheme for biomass plants. Austria and Finland have a long-lasting tradition of RES (especially in the hydro energy and biomass areas) and it is dif-ficult to assess whether the EU funds contributed to additional value added, particularly in regard to innovation.
31Observations
43 In 2012, the Commission stressed that Member States and regions need to ensure that funding for RES comple-ments private investment, leverag-ing it, and not crowding it out28. The Court found that some RES projects could have been implemented with-out public support. It was evident that multiple project applicants could have set up the RES installations without or with smaller public grants thus freeing up money for additional RES meas-ures. However, the grant decisions were nonetheless important in view of bankable project financing:
ο The Austrian projects in question were all endorsed after completion of the construction works signalling that the subsidy was not a condi-tion for investment.
ο Four of the five audited projects in Finland could have been realised without subsidies (only one project would not have been implemented without support by public funds).
ο Several wind energy project own-ers said they would have carried out their projects without public subsidies as the economic incen-tive through the wind yields and the ‘green certificates’ had been sufficient. Indeed, multiple existing similar wind farms had been con-structed without being subsidised.
44 The RES investments had only a lim-ited effect on building managerial capacities. One of the intended effects of EU added value is improved ad-ministrative or managerial capacities in the Member States. Albeit various stakeholders in Malta, Poland and the United Kingdom claimed there had been invaluable learning effects from the EU projects, in general no far-reaching contributions to improv-ing project planning, implementation and operation could be demonstrated. The RES grant schemes and individual projects were generally managed with a focus on regularity issues without addressing value for money require-ments. In Austria and Finland, the EU co-financing was merely made part of the national support mechanisms without particular innovation aspects (see as well paragraph 42). The experi-ence gained during the implementa-tion of the projects was not dissemi-nated in these two Member States or neighbouring regions.
45 The RES projects were often operat-ing in fragile regulatory environments. Although the EU funds devoted to RES generation were indeed not aimed at reforming regulatory frameworks, they could nevertheless have trig-gered improvements to those. The RES legal frameworks in many Member States have suffered multiple revi-sions, including retroactive changes in the subsidy and promotion regimes. Permitting procedures are often com-plex and discouraging or not applied consistently and, together with market uncertainty and volatility in energy prices, jeopardise investor confidence in the sector.
28 COM(2012) 663 final of 15 November 2012 ‘Making the internal energy market work’.
32Observations
46 There has been variable but overall low use of Cohesion Funds for RES in the Member States. Although the EU funds allocated to RES increased from 0,6 in the 2000–06 program-ming period to 4,7 billion euro in the 2007–13 programming period, this represents only 1,7 % of total ERDF and CF spending. In relation to the enormous investment needs in the sector for reaching the EU 2020 RES target the allocation of EU funds by the national and regional authorities was low29. The Member States allo-cated between 0 % (the lowest value) and 10,7 % (the highest value) of total ERDF and CF funds. Even the 10 % al-located by Malta for RES is not signifi-cant to reaching its national RES target of 10 % by 2020 when considering that the country had practically no RES in 2007 and attained less than 2 % of RES in final energy consumption by 2012 (see Annex I). Of the Member States covered by the audit, Malta had failed to reach the first mid-term objective and Austria, Finland and Poland had not transposed the RES directive in national legislation by the end of October 2013 (the deadline was 5 December 2010).
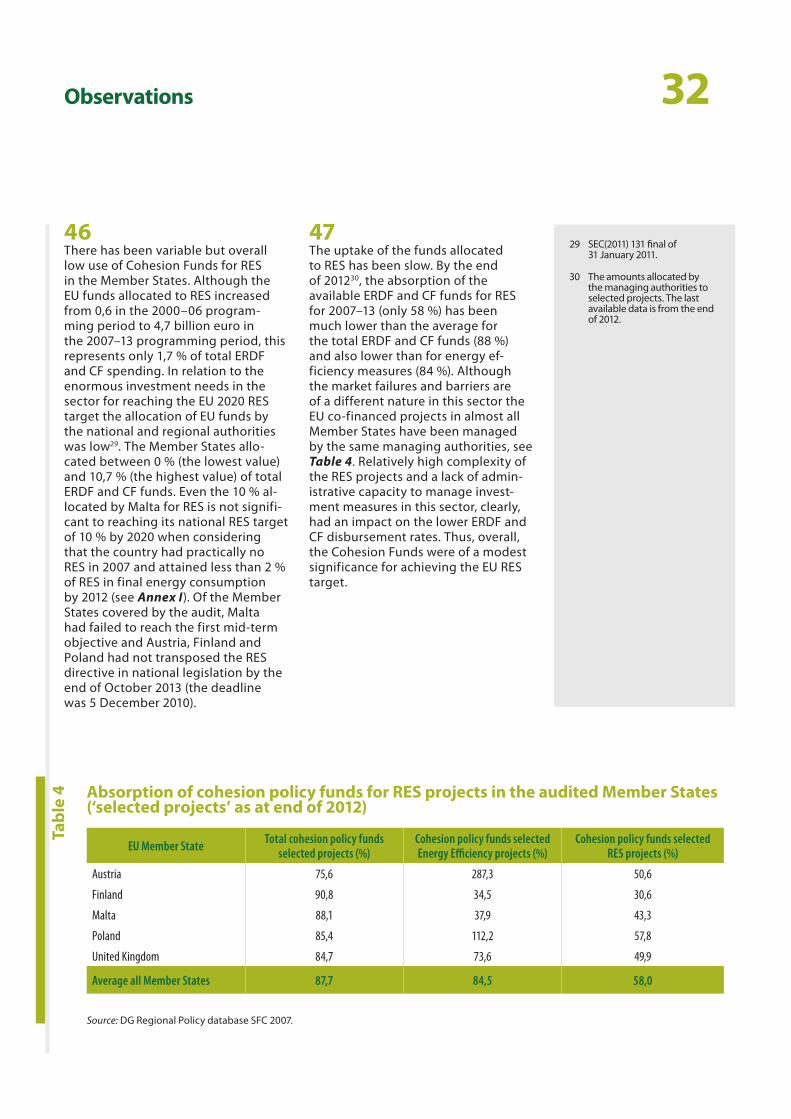
47 The uptake of the funds allocated to RES has been slow. By the end of 201230, the absorption of the available ERDF and CF funds for RES for 2007–13 (only 58 %) has been much lower than the average for the total ERDF and CF funds (88 %) and also lower than for energy ef-ficiency measures (84 %). Although the market failures and barriers are of a different nature in this sector the EU co-financed projects in almost all Member States have been managed by the same managing authorities, see Table 4. Relatively high complexity of the RES projects and a lack of admin-istrative capacity to manage invest-ment measures in this sector, clearly, had an impact on the lower ERDF and CF disbursement rates. Thus, overall, the Cohesion Funds were of a modest significance for achieving the EU RES target.
29 SEC(2011) 131 final of 31 January 2011.
30 The amounts allocated by the managing authorities to selected projects. The last available data is from the end of 2012.
Tabl
e 4 Absorption of cohesion policy funds for RES projects in the audited Member States
(‘selected projects’ as at end of 2012)
Source: DG Regional Policy database SFC 2007.
EU Member State Total cohesion policy funds selected projects (%)
Cohesion policy funds selected Energy Efficiency projects (%)
Cohesion policy funds selected RES projects (%)
Austria 75,6 287,3 50,6
Finland 90,8 34,5 30,6
Malta 88,1 37,9 43,3
Poland 85,4 112,2 57,8
United Kingdom 84,7 73,6 49,9
Average all Member States 87,7 84,5 58,0
33Conclusions and recommendations
48 Overall, the Court concludes that value for money of cohesion policy funds support to RES generation projects has been limited in helping achieve the EU RES 2020 target.
49 The audited projects delivered out-puts as planned: Most of the audited RES projects were sufficiently mature and ready for implementation when selected, there have been no ma-jor cost overruns and time delays in the projects and the RES generation capacities, generally, were installed as planned (paragraphs 14 to 16).
50 However, the Court found also that there were weaknesses in imple-mentation: In particular concerning performance indicators, measuring and reporting of project results as well as procurement procedures and outcomes. In general, difficulties of integrating RES electricity into the grids have been identified as a major impediment to the development of RES in the EU (paragraphs 17 to 21).
51 Moreover, the energy generation tar-gets were not achieved or the results not properly measured in around two thirds of the audited RES projects. In most of these cases, insufficient or non-measured data about actual generated energy was available. The non-achievement of planned results was mostly due to imprecise forecasts or technical problems. Overall, the project outcomes have been mixed (paragraphs 22 to 25).
52 Furthermore, cost-effectiveness has not been the guiding principle in plan-ning the projects. The underlying op-erational programmes were designed without prioritisation of the RES sec-tors and without assessments of the funds’ contributions to the RES objec-tives. Fund allocations were, in gen-eral, based on rough estimation of the regional potential and fund absorption capacities rather than systematic ana- lysis of the regional situation and com-parison between potential alternatives in terms of types of RES or RES tech-nologies. The cost-effectiveness of the measures was neglected when they were allocated the budgets. Rational energy objectives and performance indicators for energy generation had not been set well in all projects. The selection criteria and procedures were frequently not conducive to selecting the most cost-effective RES projects. Project results were mixed in regard to cost-effectiveness whereby in some Member States the high co-financing rates were not justified in the docu-ments in relation to the projects’ prof-itability (paragraphs 26 to 40).
53 The audit also found that the cohesion policy funds for RES had a limited EU added value. There has been a risk of public funding replacement in those Member States which simply used the EU funds to complement their national grants for RES as well as a risk of dead-weight. While the EU co-financing had some ‘operational value added’ the in-vestment projects have not, however, helped build up managerial capacities in a significant way. Overall the use of ERDF and CF for RES has been modest in relation to the need for increased efforts to reach the EU objectives (paragraphs 41 to 47).
34Conclusions and recommendations
54 The Court emphasises the need for improvements if cohesion policy fund-ing is to make the maximum possible contribution to achieving the energy targets31. Furthermore, cohesion policy spending, in general, brings benefits to the broader economy, including economic growth and job creation which are overarching aims of cohesion policy. In view of a likely enhanced use of EU funds for promot-ing RES in the 2014–20 programming period, the Court makes the following recommendations:
Recommendation 1
The Commission, through guidance setting for programme and project preparation and selection as well as through conditions for making funding available for RES generation invest-ments, should:
ο ensure that future cohesion policy co-funded RES programmes are guided by the principle of cost-effectiveness, including EU fund-ing support to cost-effective programmes that would not otherwise take place, so as to avoid deadweight. Programmes must be based on proper needs assess-ment, prioritisation of the most cost-effective technologies (while not discriminating between RES sectors) and optimal contribution to the EU 2020 target. Adequate RES generation objectives in rela-tion to the budget as well as pro-ject selection criteria with a focus on the cost-effectiveness of the energy generation results (avoid-ing over-compensation of projects) need to be set;
ο promote the establishment by the Member States of a stable and pre-dictable regulatory framework for RES in general, along with smooth-er procedures for the integration of electricity from RES into the grid networks.
Recommendation 2
The Member States should establish and apply, based on Commission guidance, minimum cost-effectiveness criteria which are adapted to the pro-jects’ circumstances. They should also enhance the added value of cohesion policy funds by improving RES project implementation as well as monitor-ing and evaluation and by building a stock of measured data about energy generation costs in all relevant RES sectors.
31 Within this policy area, the Court published a report on the energy efficiency measures co-financed by the ERDF and the CF (Special Report No 21/2012 ‘Cost-effectiveness of Cohesion Policy Investments in Energy Efficiency’ (https://eca.europa.eu)). The audit analysed the cost-effectiveness of cohesion policy investments in energy efficiency, with a specific focus on the Commission’s management role in relation to its approval of operational programmes and the monitoring of programme execution in the regions.
35Conclusions and recommendations
This Report was adopted by Chamber II, headed by Mr Henri GRETHEN, Member of the Court of Auditors, in Luxembourg at its meeting of 9 April 2014.
For the Court of Auditors
Vítor Manuel da SILVA CALDEIRAPresident
36Annexes
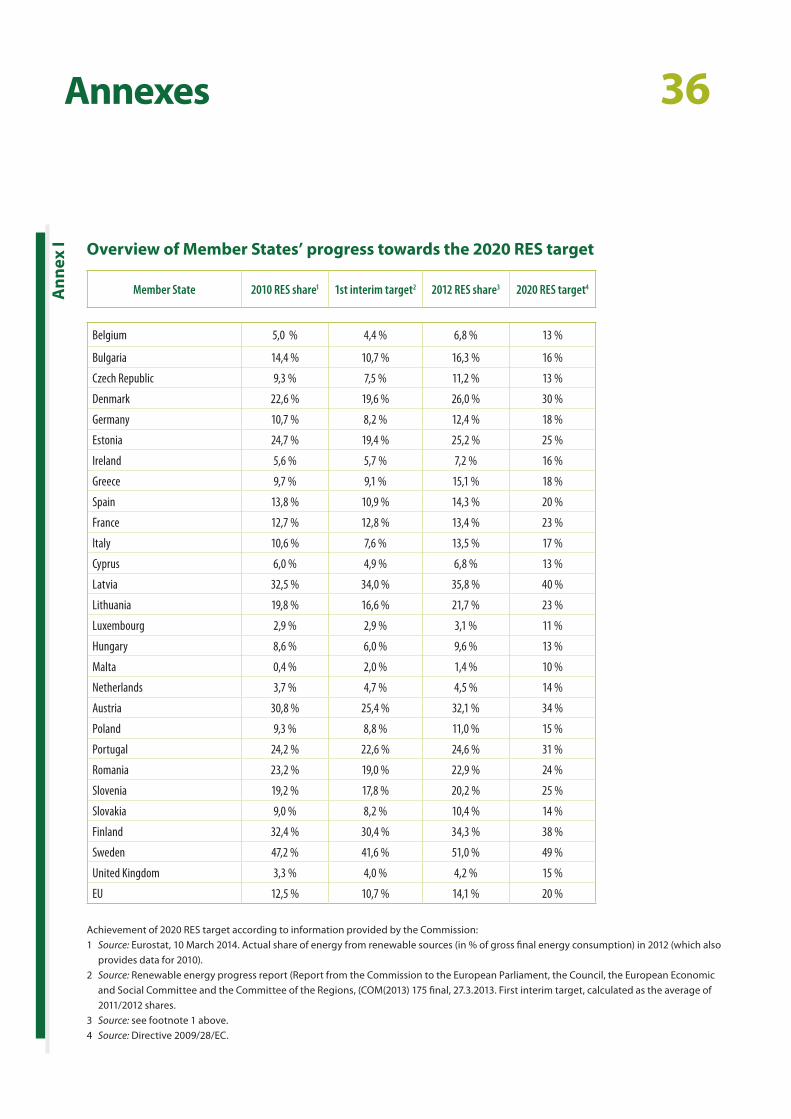
Overview of Member States’ progress towards the 2020 RES target
Ann
ex I
Achievement of 2020 RES target according to information provided by the Commission: 1 Source: Eurostat, 10 March 2014. Actual share of energy from renewable sources (in % of gross final energy consumption) in 2012 (which also
provides data for 2010). 2 Source: Renewable energy progress report (Report from the Commission to the European Parliament, the Council, the European Economic
and Social Committee and the Committee of the Regions, (COM(2013) 175 final, 27.3.2013. First interim target, calculated as the average of 2011/2012 shares.
3 Source: see footnote 1 above.4 Source: Directive 2009/28/EC.
Member State 2010 RES share1 1st interim target2 2012 RES share3 2020 RES target4
Belgium 5,0 % 4,4 % 6,8 % 13 %
Bulgaria 14,4 % 10,7 % 16,3 % 16 %
Czech Republic 9,3 % 7,5 % 11,2 % 13 %
Denmark 22,6 % 19,6 % 26,0 % 30 %
Germany 10,7 % 8,2 % 12,4 % 18 %
Estonia 24,7 % 19,4 % 25,2 % 25 %
Ireland 5,6 % 5,7 % 7,2 % 16 %
Greece 9,7 % 9,1 % 15,1 % 18 %
Spain 13,8 % 10,9 % 14,3 % 20 %
France 12,7 % 12,8 % 13,4 % 23 %
Italy 10,6 % 7,6 % 13,5 % 17 %
Cyprus 6,0 % 4,9 % 6,8 % 13 %
Latvia 32,5 % 34,0 % 35,8 % 40 %
Lithuania 19,8 % 16,6 % 21,7 % 23 %
Luxembourg 2,9 % 2,9 % 3,1 % 11 %
Hungary 8,6 % 6,0 % 9,6 % 13 %
Malta 0,4 % 2,0 % 1,4 % 10 %
Netherlands 3,7 % 4,7 % 4,5 % 14 %
Austria 30,8 % 25,4 % 32,1 % 34 %
Poland 9,3 % 8,8 % 11,0 % 15 %
Portugal 24,2 % 22,6 % 24,6 % 31 %
Romania 23,2 % 19,0 % 22,9 % 24 %
Slovenia 19,2 % 17,8 % 20,2 % 25 %
Slovakia 9,0 % 8,2 % 10,4 % 14 %
Finland 32,4 % 30,4 % 34,3 % 38 %
Sweden 47,2 % 41,6 % 51,0 % 49 %
United Kingdom 3,3 % 4,0 % 4,2 % 15 %
EU 12,5 % 10,7 % 14,1 % 20 %
37Annexes
Cohesion policy (ERDF and CF 2007–13) funds allocation to RES and selected projects 2007–12
Ann
ex II
1 Rate of selection above 100 % means funds were reallocated from other priorities or measures within the same or from another Operational Programme.
Source: DG Regional Policy database SFC2007, 2012 Annual Implementation Reports for selected projects.
Member State
EU allocated decided amount Projects selected
ERDF and CF total amount (euro)
(A)
Allocated to RES amount (euro)
(B)
% of total funds for RES(C)
Total projects selected
EU Amount (euro)(D)
% of selected projects(D)/(B)1
Belgium 990 283 172 11 851 495 1,2 % 7 242 095 61,1 %
Bulgaria 5 488 168 381 16 710 959 0,3 % 4 226 413 25,3 %
Czech Republic 22 751 854 293 397 759 730 1,7 % 131 059 678 32,9 %
Denmark 254 788 620
Germany 16 107 313 706 252 995 745 1,6 % 119 319 102 47,2 %
Estonia 3 011 942 552
Ireland 375 362 372
Greece 15 846 461 042 283 795 789 1,8 % 392 484 152 138,3 %
Spain 26 595 884 632 160 152 052 0,6 % 71 145 156 44,4 %
France 8 054 673 061 363 591 135 4,5 % 245 249 934 67,5 %
Croatia 705 861 911
Italy 21 025 331 585 775 717 953 3,7 % 397 058 482 51,2 %
Cyprus 492 665 838 9 520 000 1,9 % 5 191 095 54,5 %
Latvia 3 947 343 917 67 180 000 1,7 %
Lithuania 5 747 186 096 58 485 290 1,0 % 67 554 207 115,5 %
Luxembourg 25 243 666 1 767 056 7,0 % 4 875 000 275,9 %
Hungary 21 292 060 049 349 310 777 1,6 % 179 983 308 51,5 %
Malta 728 123 051 78 200 000 10,7 % 33 879 548 43,3 %
Netherlands 830 000 000 19 182 600 2,3 % 22 345 138 116,5 %
Austria 680 066 021 25 037 408 3,7 % 12 676 799 50,6 %
Poland 57 178 151 307 825 761 396 1,4 % 477 355 029 57,8 %
Portugal 14 558 172 647 59 857 312 0,4 % 5 006 939 8,4 %
Romania 15 528 889 094 331 542 611 2,1 % 209 940 000 63,3 %
Slovenia 3 345 349 266 54 186 553 1,6 % 14 408 713 26,6 %
Slovakia 9 998 728 328 90 252 216 0,9 % 66 524 170 73,7 %
Finland 977 401 980 20 682 247 2,1 % 6 329 763 30,6 %
Sweden 934 540 730 52 342 949 5,6 % 8 772 042 16,8 %
United Kingdom 5 392 019 735 159 590 365 3,0 % 74 770 872 46,9 %
Cross-border 7 893 300 818 199 927 583 2,5 % 148 745 005 74,4 %
EU27 + cross-border 270 757 167 870 4 665 401 221 1,7 % 2 706 142 640 58,0 %
38Annexes
List of audited RES generation projects
Ann
ex II
I
Proj
ect
No
Mem
-be
r St
ate
Oper
atio
nal
prog
ram
me
Inte
rven
tion
Impl
emen
tatio
n m
ode
Proj
ect b
udge
t(m
illio
n eu
ro)
Of w
hich
co-fi
nanc
ing
Addi
tiona
l RE
S cap
ac-
ity in
stal
led
(pla
nned
/ac
tual
) MW
or
kWp/
a
Inve
st-
men
ts in
au
dite
d pr
ojec
ts(m
illio
n EU
R/M
W o
r EU
R/kW
p/a)
Aver
age e
n-er
gy g
ener
ated
(p
lann
ed/
actu
al)
MW
h/a
Natio
nal
(mill
ion
euro
)ER
DF/C
F (m
illio
n eu
ro)
1
AT
Low
er A
ustri
aCo
nstru
ctio
n of
bio
mas
s pla
nt in
W
eisse
nbac
h an
der
Trist
ing
Stan
d-al
one
proj
ect
0,74
50,1
170,1
173/
3 MW
0,51
72 4
40/
2 319
MW
h/a
2St
yria
Cons
truct
ion
of b
iom
ass p
lant
an
d a d
istric
t hea
ting n
etw
ork i
n Br
uck a
n de
r Mur
Stan
d-al
one
proj
ect
5,65
80,
871
0,88
28/
8 MW
0,48
818
659/
12
263 M
Wh/
a
3Sa
lzbur
gCo
nstru
ctio
n of
bio
mas
s pla
nt
and a
dist
rict h
eatin
g net
wor
k in
Flac
hau
Stan
d-al
one
proj
ect
5,66
70,
886
0,88
56/
4 MW
1,027
24 00
9/
23 02
6 MW
h/a
4
FI
Läns
i-Suo
men
Cons
truct
ion
of b
iom
ass-
pelle
t bo
iler r
epla
cing t
hree
foss
il fue
l bo
ilers
and m
ain p
ipel
ine i
n Lie
vest
uore
Stan
d-al
one
proj
ect
0,40
50,
017
0,01
11/
1 MW
0,25
24 1
36/
5 215
MW
h/a
5Lä
nsi-S
uom
en
Cons
truct
ion
of b
iom
ass-
woo
d ch
ip b
oile
r rep
lacin
g fos
sil fu
el
boile
r and
mod
ifica
tion
of ex
ist-
ing d
istric
t hea
tingn
etw
ork i
n Ky
yjärv
i indu
stria
l site
Stan
d-al
one
proj
ect
0,71
10,
085
0,05
61/
1 MW
0,41
52 5
00/
2 394
MW
h/a
6Lä
nsi-S
uom
enCo
nstru
ctio
n of
a ne
w b
iom
ass-
pelle
t boi
ler r
epla
cing f
ossil
fuel
bo
iler a
t Tikk
akos
ki sit
e
Stan
d-al
one
proj
ect
0,38
80,
022
0,00
92,
5/2,
5 MW
0,127
4 000
/ 7 5
00 M
Wh/
a
7Lä
nsi-S
uom
en
Cons
truct
ion
of a
new
bio
mas
s-pe
llet b
oile
r rep
lacin
g fos
sil fu
el
boile
r and
nec
essa
ry d
istric
t he
atin
g net
wor
k in
a con
verte
d st
orag
e fac
ility
in K
iuka
inen
.
Stan
d-al
one
proj
ect
0,32
40,
029
0,02
1/1 M
W0,
270
2 800
/ 4 0
00 M
Wh/
a
8Lä
nsi-S
uom
enCo
nstru
ctio
n of
a ne
w b
iom
ass-
pelle
t boi
ler r
epla
cing f
ossil
fuel
bo
iler i
n Eu
ra
Stan
d-al
one
proj
ect
0,44
70,
054
0,03
60,
8/0,
8 MW
0,3
1 140
/ 1 5
00 M
Wh/
a
9
UK
East
Wal
es
(Com
petit
ivene
ss)
Woo
d Ene
rgy B
usin
ess S
chem
e 2
(800
85)
Gran
t sch
eme
0,2
00,
076 M
W/N
ot
prov
ided
NA2 7
00 M
Wh/
No
t yet
avail
able
10W
est W
ales
an
d the
Val
leys
(C
onve
rgen
ce)
Woo
d Ene
rgy B
usin
ess S
chem
e 2
(800
28)
Finan
cing s
chem
e1,
20
0,49
2,6 M
W/N
ot
prov
ided
NA53
00 M
Wh/
No
t yet
avail
able
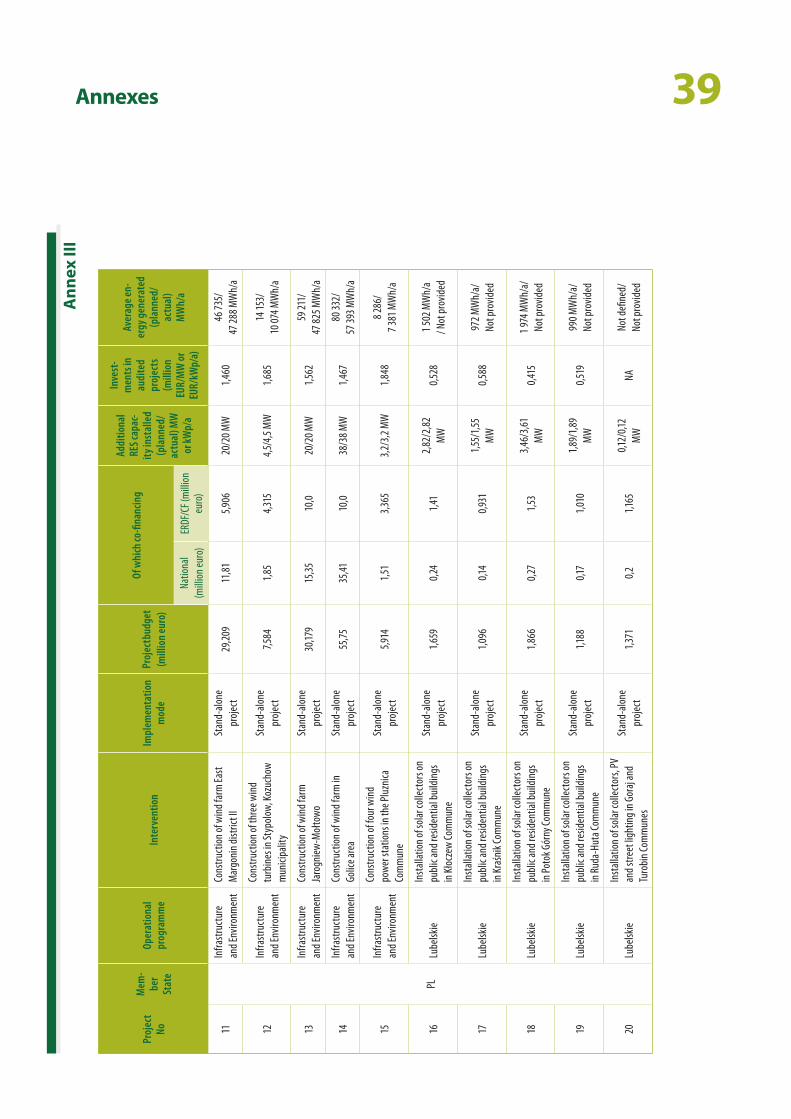
39AnnexesA
nnex
III
Proj
ect
No
Mem
-be
r St
ate
Oper
atio
nal
prog
ram
me
Inte
rven
tion
Impl
emen
tatio
n m
ode
Proj
ect b
udge
t(m
illio
n eu
ro)
Of w
hich
co-fi
nanc
ing
Addi
tiona
l RE
S cap
ac-
ity in
stal
led
(pla
nned
/ac
tual
) MW
or
kWp/
a
Inve
st-
men
ts in
au
dite
d pr
ojec
ts(m
illio
n EU
R/M
W o
r EU
R/kW
p/a)
Aver
age e
n-er
gy g
ener
ated
(p
lann
ed/
actu
al)
MW
h/a
Natio
nal
(mill
ion
euro
)ER
DF/C
F (m
illio
n eu
ro)
11
PL
Infra
stru
ctur
e an
d Env
ironm
ent
Cons
truct
ion
of w
ind f
arm
East
M
argo
nin
dist
rict I
ISt
and-
alon
e pr
ojec
t29
,209
11,8
15,9
0620
/20 M
W1,4
6046
735/
47
288 M
Wh/
a
12In
frast
ruct
ure
and E
nviro
nmen
t
Cons
truct
ion
of th
ree w
ind
turb
ines
in St
ypol
ow, K
ozuc
how
m
unici
palit
y
Stan
d-al
one
proj
ect
7,584
1,85
4,31
54,
5/4,
5 MW
1,685
14 15
3/
10 07
4 MW
h/a
13In
frast
ruct
ure
and E
nviro
nmen
tCo
nstru
ctio
n of
win
d far
m
Jaro
gnie
w-M
ołto
wo
Stan
d-al
one
proj
ect
30,17
915
,35
10,0
20/2
0 MW
1,562
59 21
1/
47 82
5 MW
h/a
14In
frast
ruct
ure
and E
nviro
nmen
tCo
nstru
ctio
n of
win
d far
m in
Go
lice a
rea
Stan
d-al
one
proj
ect
55,75
35,41
10,0
38/3
8 MW
1,467
80 33
2/
57 39
3 MW
h/a
15In
frast
ruct
ure
and E
nviro
nmen
t
Cons
truct
ion
of fo
ur w
ind
pow
er st
atio
ns in
the P
luzn
ica
Com
mun
e
Stan
d-al
one
proj
ect
5,914
1,51
3,36
53,
2/3,
2 MW
1,84
88 2
86/
7 381
MW
h/a
16Lu
belsk
ieIn
stal
latio
n of
sola
r col
lect
ors o
n pu
blic
and r
esid
entia
l bui
ldin
gs
in K
łocz
ew Co
mm
une
Stan
d-al
one
proj
ect
1,659
0,24
1,41
2,82
/2,8
2 M
W0,
528
1 502
MW
h/a
/ Not
pro
vided
17Lu
belsk
ieIn
stal
latio
n of
sola
r col
lect
ors o
n pu
blic
and r
esid
entia
l bui
ldin
gs
in K
raśn
ik Co
mm
une
Stan
d-al
one
proj
ect
1,096
0,14
0,931
1,55/
1,55
MW
0,58
897
2 MW
h/a/
No
t pro
vided
18Lu
belsk
ieIn
stal
latio
n of
sola
r col
lect
ors o
n pu
blic
and r
esid
entia
l bui
ldin
gs
in Po
tok G
órny
Com
mun
e
Stan
d-al
one
proj
ect
1,86
60,
271,5
33,
46/3
,61
MW
0,41
51 9
74 M
Wh/
a/
Not p
rovid
ed
19Lu
belsk
ieIn
stal
latio
n of
sola
r col
lect
ors o
n pu
blic
and r
esid
entia
l bui
ldin
gs
in R
uda-
Huta
Com
mun
e
Stan
d-al
one
proj
ect
1,188
0,17
1,010
1,89
/1,8
9 M
W0,
519
990 M
Wh/
a/
Not p
rovid
ed
20Lu
belsk
ieIn
stal
latio
n of
sola
r col
lect
ors,
PV
and s
treet
light
ing i
n Go
raj a
nd
Turo
bin
Com
mun
es
Stan
d-al
one
proj
ect
1,371
0,2
1,165
0,12/
0,12
MW
NANo
t defi
ned/
No
t pro
vided
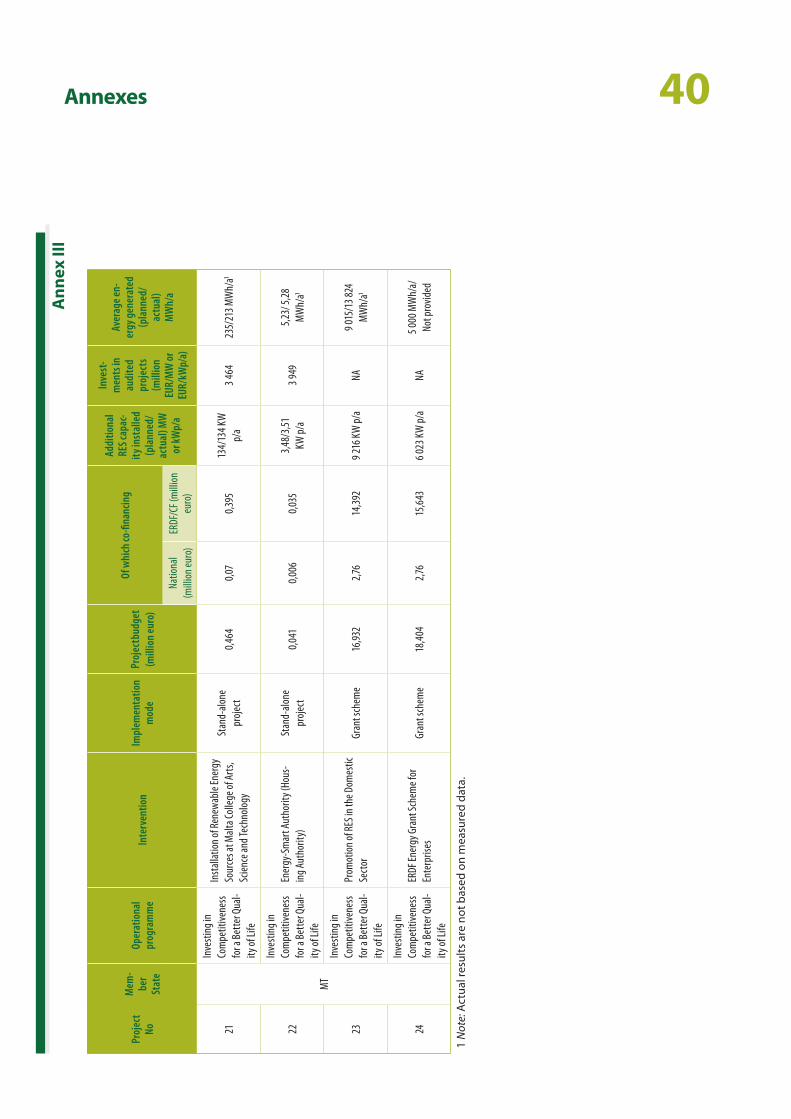
40Annexes
Ann
ex II
I
Proj
ect
No
Mem
-be
r St
ate
Oper
atio
nal
prog
ram
me
Inte
rven
tion
Impl
emen
tatio
n m
ode
Proj
ect b
udge
t(m
illio
n eu
ro)
Of w
hich
co-fi
nanc
ing
Addi
tiona
l RE
S cap
ac-
ity in
stal
led
(pla
nned
/ac
tual
) MW
or
kWp/
a
Inve
st-
men
ts in
au
dite
d pr
ojec
ts(m
illio
n EU
R/M
W o
r EU
R/kW
p/a)
Aver
age e
n-er
gy g
ener
ated
(p
lann
ed/
actu
al)
MW
h/a
Natio
nal
(mill
ion
euro
)ER
DF/C
F (m
illio
n eu
ro)
21
MT
Inve
stin
g in
Com
petit
ivene
ss
for a
Bet
ter Q
ual-
ity of
Life
Inst
alla
tion
of R
enew
able
Ener
gy
Sour
ces a
t Mal
ta Co
llege
of A
rts,
Scie
nce a
nd Te
chno
logy
Stan
d-al
one
proj
ect
0,46
40,
070,
395
134/
134 K
W
p/a
3 464
235/
213 M
Wh/
a1
22
Inve
stin
g in
Com
petit
ivene
ss
for a
Bet
ter Q
ual-
ity of
Life
Ener
gy-S
mar
t Aut
horit
y (Ho
us-
ing A
utho
rity)
Stan
d-al
one
proj
ect
0,04
10,
006
0,03
53,
48/3
,51
KW p/
a3 9
495,
23/ 5
,28
MW
h/a1
23
Inve
stin
g in
Com
petit
ivene
ss
for a
Bet
ter Q
ual-
ity of
Life
Prom
otio
n of R
ES in
the D
omes
tic
Sect
orGr
ant s
chem
e16
,932
2,76
14,3
929 2
16 K
W p/
aNA
9 015
/13 8
24
MW
h/a1
24
Inve
stin
g in
Com
petit
ivene
ss
for a
Bet
ter Q
ual-
ity of
Life
ERDF
Ener
gy G
rant
Sche
me f
or
Ente
rpris
esGr
ant s
chem
e18
,404
2,76
15,6
436 0
23 K
W p/
aNA
5 000
MW
h/a/
No
t pro
vided
1 N
ote:
Act
ual r
esul
ts a
re n
ot b
ased
on
mea
sure
d da
ta.
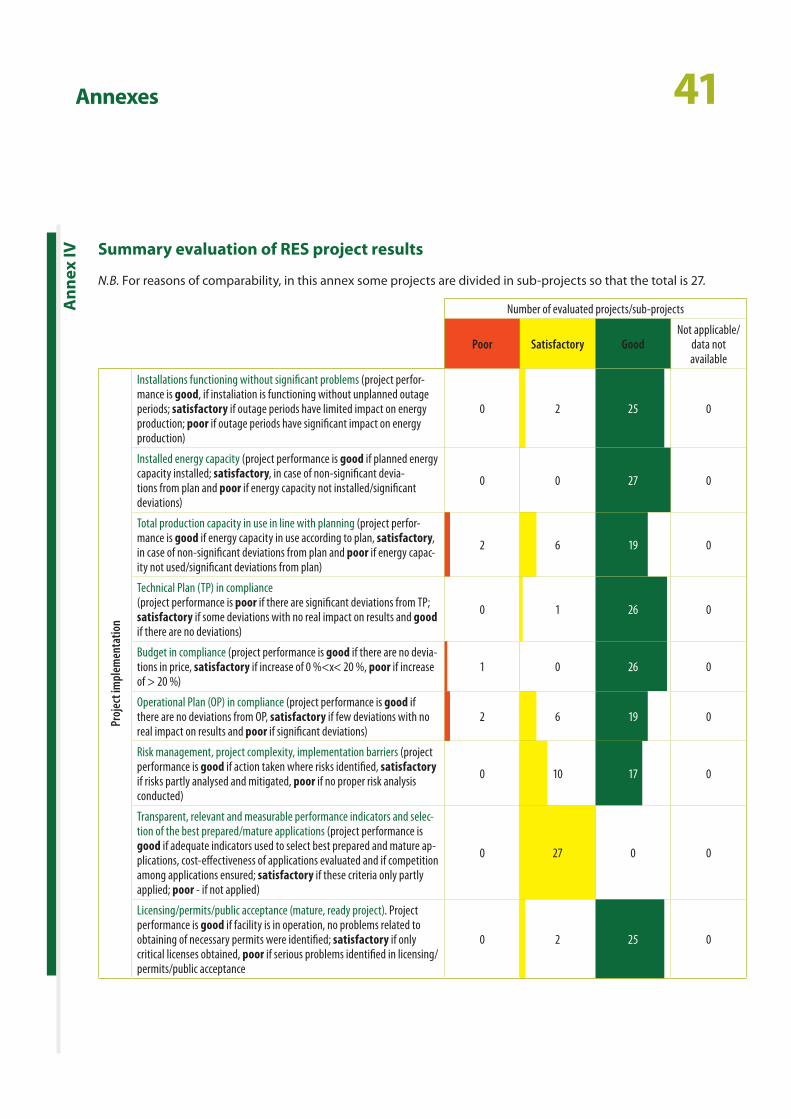
41Annexes
Summary evaluation of RES project results
Ann
ex IV
N.B. For reasons of comparability, in this annex some projects are divided in sub-projects so that the total is 27.
Number of evaluated projects/sub-projects
Poor Satisfactory GoodNot applicable/
data not available
Proj
ect i
mpl
emen
tatio
n
Installations functioning without significant problems (project perfor-mance is good, if instaliation is functioning without unplanned outage periods; satisfactory if outage periods have limited impact on energy production; poor if outage periods have significant impact on energy production)
0 2 25 0
Installed energy capacity (project performance is good if planned energy capacity installed; satisfactory, in case of non-significant devia-tions from plan and poor if energy capacity not installed/significant deviations)
0 0 27 0
Total production capacity in use in line with planning (project perfor-mance is good if energy capacity in use according to plan, satisfactory, in case of non-significant deviations from plan and poor if energy capac-ity not used/significant deviations from plan)
2 6 19 0
Technical Plan (TP) in compliance(project performance is poor if there are significant deviations from TP; satisfactory if some deviations with no real impact on results and good if there are no deviations)
0 1 26 0
Budget in compliance (project performance is good if there are no devia-tions in price, satisfactory if increase of 0 %<x< 20 %, poor if increase of > 20 %)
1 0 26 0
Operational Plan (OP) in compliance (project performance is good if there are no deviations from OP, satisfactory if few deviations with no real impact on results and poor if significant deviations)
2 6 19 0
Risk management, project complexity, implementation barriers (project performance is good if action taken where risks identified, satisfactory if risks partly analysed and mitigated, poor if no proper risk analysis conducted)
0 10 17 0
Transparent, relevant and measurable performance indicators and selec-tion of the best prepared/mature applications (project performance is good if adequate indicators used to select best prepared and mature ap-plications, cost-effectiveness of applications evaluated and if competition among applications ensured; satisfactory if these criteria only partly applied; poor - if not applied)
0 27 0 0
Licensing/permits/public acceptance (mature, ready project). Project performance is good if facility is in operation, no problems related to obtaining of necessary permits were identified; satisfactory if only critical licenses obtained, poor if serious problems identified in licensing/permits/public acceptance
0 2 25 0
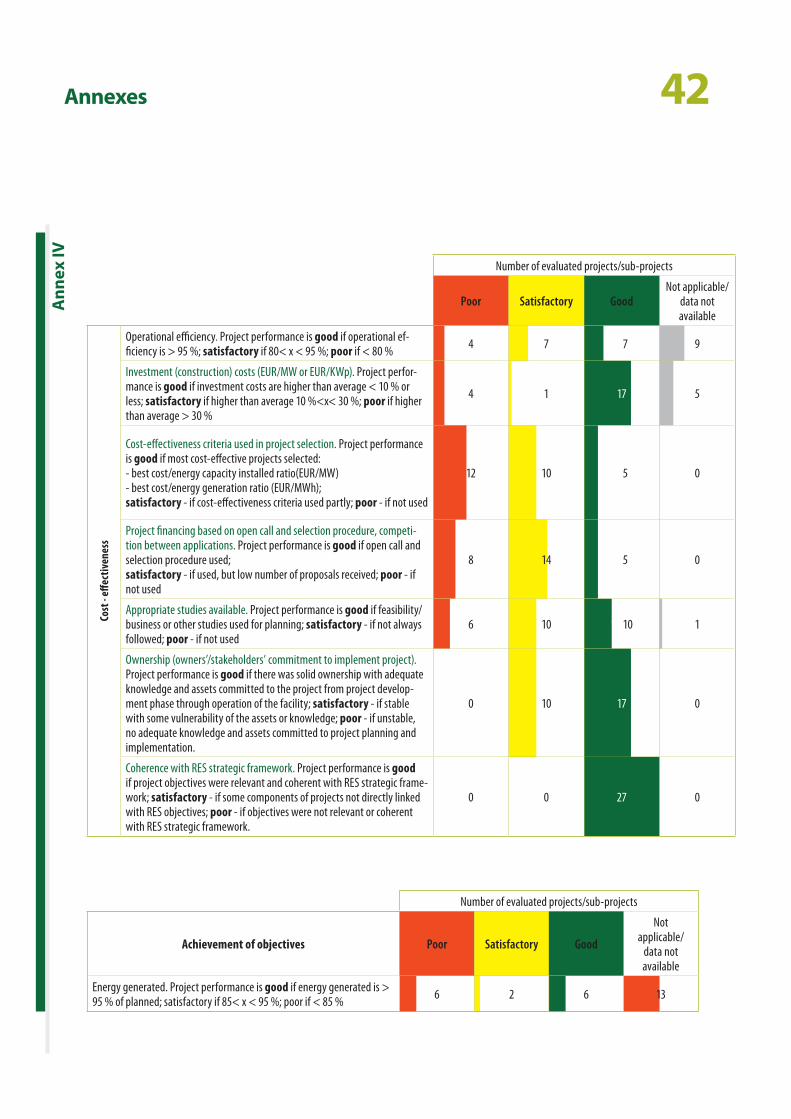
42Annexes
Ann
ex IV
Number of evaluated projects/sub-projects
Poor Satisfactory GoodNot applicable/
data not available
Cost
- eff
ectiv
enes
s
Operational efficiency. Project performance is good if operational ef-ficiency is > 95 %; satisfactory if 80< x < 95 %; poor if < 80 % 4 7 7 7 9
Investment (construction) costs (EUR/MW or EUR/KWp). Project perfor-mance is good if investment costs are higher than average < 10 % or less; satisfactory if higher than average 10 %<x< 30 %; poor if higher than average > 30 %
4 1 17 5
Cost-effectiveness criteria used in project selection. Project performance is good if most cost-effective projects selected:- best cost/energy capacity installed ratio(EUR/MW)- best cost/energy generation ratio (EUR/MWh); satisfactory - if cost-effectiveness criteria used partly; poor - if not used
12 10 5 5 0
Project financing based on open call and selection procedure, competi-tion between applications. Project performance is good if open call and selection procedure used; satisfactory - if used, but low number of proposals received; poor - if not used
8 14 5 5 0
Appropriate studies available. Project performance is good if feasibility/business or other studies used for planning; satisfactory - if not always followed; poor - if not used
6 10 10 10 1
Ownership (owners’/stakeholders’ commitment to implement project). Project performance is good if there was solid ownership with adequate knowledge and assets committed to the project from project develop-ment phase through operation of the facility; satisfactory - if stable with some vulnerability of the assets or knowledge; poor - if unstable, no adequate knowledge and assets committed to project planning and implementation.
0 10 17 0
Coherence with RES strategic framework. Project performance is good if project objectives were relevant and coherent with RES strategic frame-work; satisfactory - if some components of projects not directly linked with RES objectives; poor - if objectives were not relevant or coherent with RES strategic framework.
0 0 27 0
Number of evaluated projects/sub-projects
Achievement of objectives Poor Satisfactory Good
Not applicable/
data not available
Energy generated. Project performance is good if energy generated is > 95 % of planned; satisfactory if 85< x < 95 %; poor if < 85 % 6 2 6 13
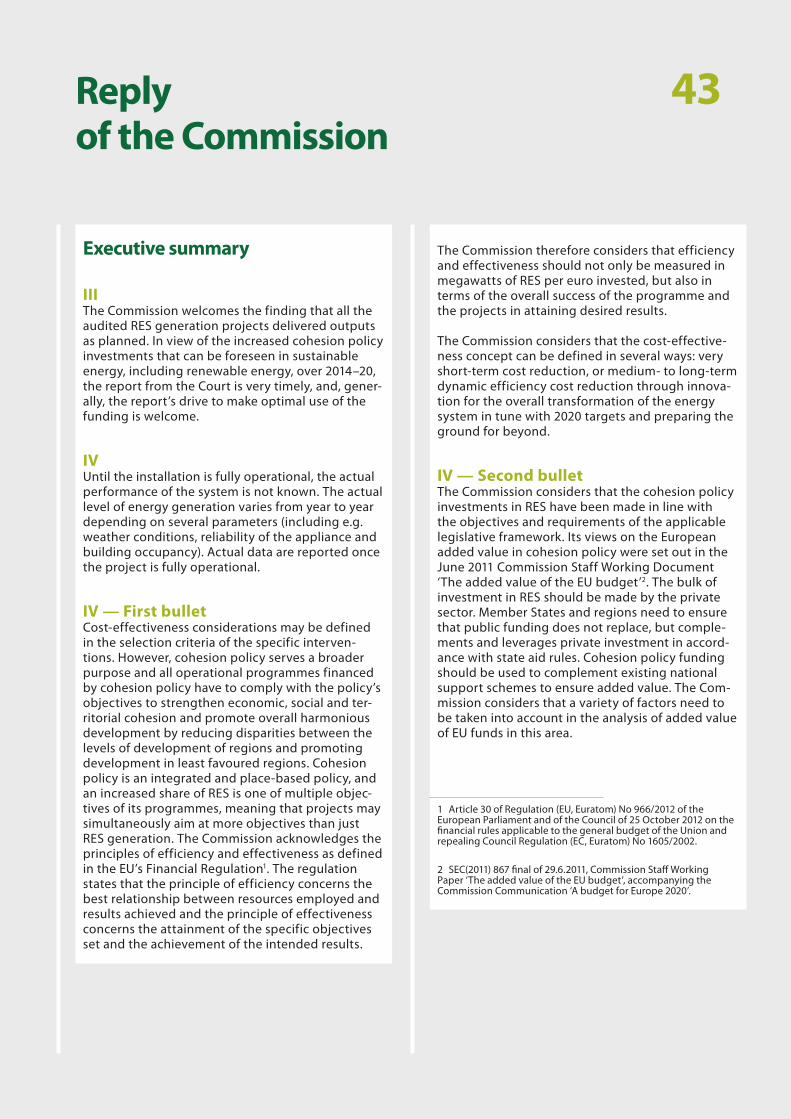
43
The Commission therefore considers that efficiency and effectiveness should not only be measured in megawatts of RES per euro invested, but also in terms of the overall success of the programme and the projects in attaining desired results.
The Commission considers that the cost-effective-ness concept can be defined in several ways: very short-term cost reduction, or medium- to long-term dynamic efficiency cost reduction through innova-tion for the overall transformation of the energy system in tune with 2020 targets and preparing the ground for beyond.
IV — Second bulletThe Commission considers that the cohesion policy investments in RES have been made in line with the objectives and requirements of the applicable legislative framework. Its views on the European added value in cohesion policy were set out in the June 2011 Commission Staff Working Document ‘The added value of the EU budget’2. The bulk of investment in RES should be made by the private sector. Member States and regions need to ensure that public funding does not replace, but comple-ments and leverages private investment in accord-ance with state aid rules. Cohesion policy funding should be used to complement existing national support schemes to ensure added value. The Com-mission considers that a variety of factors need to be taken into account in the analysis of added value of EU funds in this area.
1 Article 30 of Regulation (EU, Euratom) No 966/2012 of the European Parliament and of the Council of 25 October 2012 on the financial rules applicable to the general budget of the Union and repealing Council Regulation (EC, Euratom) No 1605/2002.
2 SEC(2011) 867 final of 29.6.2011, Commission Staff Working Paper ‘The added value of the EU budget’, accompanying the Commission Communication ‘A budget for Europe 2020’.
Executive summary
IIIThe Commission welcomes the finding that all the audited RES generation projects delivered outputs as planned. In view of the increased cohesion policy investments that can be foreseen in sustainable energy, including renewable energy, over 2014–20, the report from the Court is very timely, and, gener-ally, the report’s drive to make optimal use of the funding is welcome.
IVUntil the installation is fully operational, the actual performance of the system is not known. The actual level of energy generation varies from year to year depending on several parameters (including e.g. weather conditions, reliability of the appliance and building occupancy). Actual data are reported once the project is fully operational.
IV — First bulletCost-effectiveness considerations may be defined in the selection criteria of the specific interven-tions. However, cohesion policy serves a broader purpose and all operational programmes financed by cohesion policy have to comply with the policy’s objectives to strengthen economic, social and ter-ritorial cohesion and promote overall harmonious development by reducing disparities between the levels of development of regions and promoting development in least favoured regions. Cohesion policy is an integrated and place-based policy, and an increased share of RES is one of multiple objec-tives of its programmes, meaning that projects may simultaneously aim at more objectives than just RES generation. The Commission acknowledges the principles of efficiency and effectiveness as defined in the EU’s Financial Regulation1. The regulation states that the principle of efficiency concerns the best relationship between resources employed and results achieved and the principle of effectiveness concerns the attainment of the specific objectives set and the achievement of the intended results.
Reply of the Commission
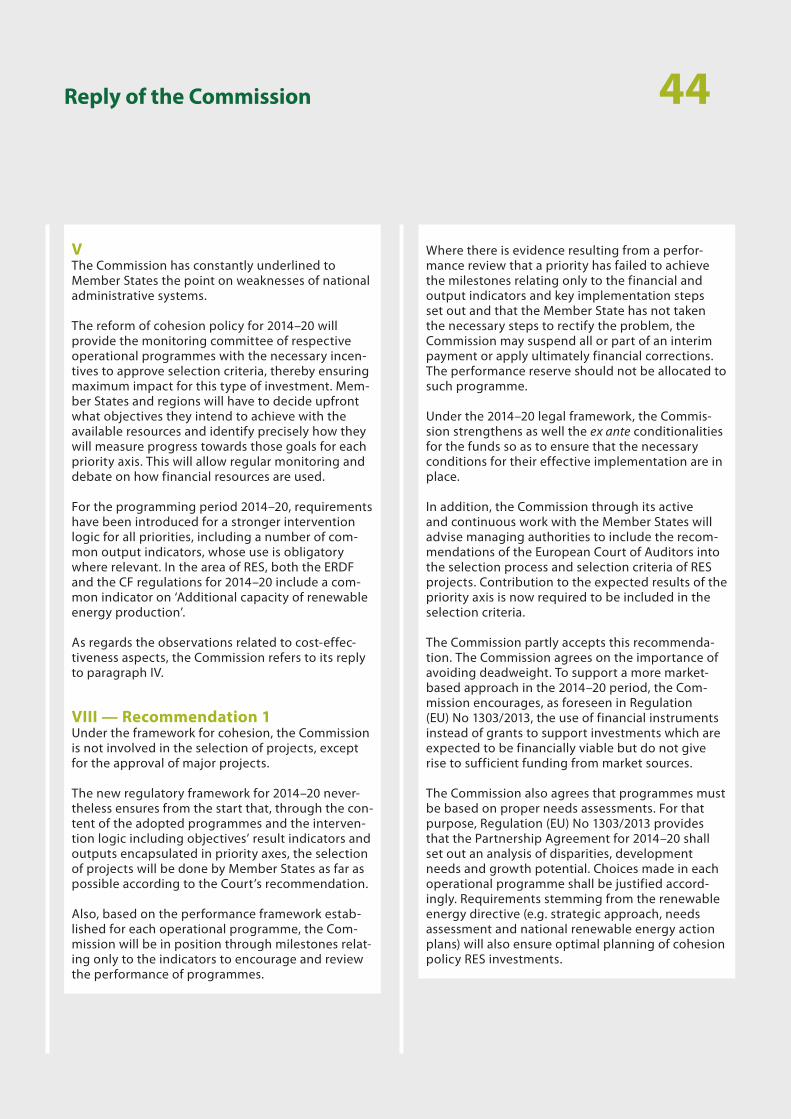
Reply of the Commission 44
Where there is evidence resulting from a perfor-mance review that a priority has failed to achieve the milestones relating only to the financial and output indicators and key implementation steps set out and that the Member State has not taken the necessary steps to rectify the problem, the Commission may suspend all or part of an interim payment or apply ultimately financial corrections. The performance reserve should not be allocated to such programme.
Under the 2014–20 legal framework, the Commis-sion strengthens as well the ex ante conditionalities for the funds so as to ensure that the necessary conditions for their effective implementation are in place.
In addition, the Commission through its active and continuous work with the Member States will advise managing authorities to include the recom-mendations of the European Court of Auditors into the selection process and selection criteria of RES projects. Contribution to the expected results of the priority axis is now required to be included in the selection criteria.
The Commission partly accepts this recommenda-tion. The Commission agrees on the importance of avoiding deadweight. To support a more market-based approach in the 2014–20 period, the Com-mission encourages, as foreseen in Regulation (EU) No 1303/2013, the use of financial instruments instead of grants to support investments which are expected to be financially viable but do not give rise to sufficient funding from market sources.
The Commission also agrees that programmes must be based on proper needs assessments. For that purpose, Regulation (EU) No 1303/2013 provides that the Partnership Agreement for 2014–20 shall set out an analysis of disparities, development needs and growth potential. Choices made in each operational programme shall be justified accord-ingly. Requirements stemming from the renewable energy directive (e.g. strategic approach, needs assessment and national renewable energy action plans) will also ensure optimal planning of cohesion policy RES investments.
VThe Commission has constantly underlined to Member States the point on weaknesses of national administrative systems.
The reform of cohesion policy for 2014–20 will provide the monitoring committee of respective operational programmes with the necessary incen-tives to approve selection criteria, thereby ensuring maximum impact for this type of investment. Mem-ber States and regions will have to decide upfront what objectives they intend to achieve with the available resources and identify precisely how they will measure progress towards those goals for each priority axis. This will allow regular monitoring and debate on how financial resources are used.
For the programming period 2014–20, requirements have been introduced for a stronger intervention logic for all priorities, including a number of com-mon output indicators, whose use is obligatory where relevant. In the area of RES, both the ERDF and the CF regulations for 2014–20 include a com-mon indicator on ‘Additional capacity of renewable energy production’.
As regards the observations related to cost-effec-tiveness aspects, the Commission refers to its reply to paragraph IV.
VIII — Recommendation 1Under the framework for cohesion, the Commission is not involved in the selection of projects, except for the approval of major projects.
The new regulatory framework for 2014–20 never-theless ensures from the start that, through the con-tent of the adopted programmes and the interven-tion logic including objectives’ result indicators and outputs encapsulated in priority axes, the selection of projects will be done by Member States as far as possible according to the Court’s recommendation.
Also, based on the performance framework estab-lished for each operational programme, the Com-mission will be in position through milestones relat-ing only to the indicators to encourage and review the performance of programmes.
Reply of the Commission 45
VIII — Recommendation 2The Commission accepts this recommendation and considers it for its part, implemented. The Commis-sion’s November 2013 guidance for the design of renewables support schemes should be taken into consideration by Member States. The forthcoming energy and environmental aid guidelines will also contribute to increasing the cost-effectiveness of Member States support schemes for renewable energy.
Introduction
07The Commission notes that the responsibility for removing sector-specific obstacles that hamper investments in RES lies with the Member States.
The Commission has addressed these obstacles in its regular reports making recommendations to Member States. Support schemes were not always well designed, leading either to unfavourable conditions or overcompensation. The Commission’s guidance for the design of renewables support schemes, issued in November 2013, as well as the guidance on the use of renewable energy coop-eration mechanisms underline the principles that should be followed to address this situation4.
4 C(2013) 7243 final of 5.11.2013, Commission communication ‘Delivering the internal electricity market and making the most of public intervention’ and accompanying Commission staff working papers SWD(2013) 439 final ‘European Commission guidance for the design of renewables support schemes’ and SWD(2013) 440 final ‘Guidance on the use of renewable energy cooperation mechanisms’.
Nevertheless, cohesion policy is an integrated and place-based policy, and an increased share of RES is only one of its multiple objectives. In particu-lar other cohesion policy objectives, such as the promotion of innovation may justify the choice of technologies which are not the most cost-effective. Regulation (EU) No 1303/2013 provides that selec-tion procedures and criteria need to ensure the contribution of operations to the achievement of the specific objectives and results of the relevant priority of the operational programme, which may aim at more objectives than RES generation.
As regards major projects, in the 2014–20 pro-gramming period the Commission will continue to require carrying out a cost-benefit analysis, includ-ing an economic and a financial analysis. As part of cost-benefit analysis, an option analysis is required, which, among other aspects, takes into account economic and financial considerations, such as con-struction costs, in order to choose the best option, while trying to maximise the project’s benefits for society.
The Commission accepts the recommendation in the second indent. It has consistently reminded Member States of the need to ensure stability in the regulatory framework and has also constantly criti-cised frequent and retroactive modifications in the Member States’ regulatory frameworks. The Novem-ber 2013 Commission communication on ‘Delivering the internal electricity market and making the most of public intervention’ and the Commission’s guid-ance for the design of renewables support schemes as well as the guidance on the use of renewable energy cooperation mechanisms address these issues3.
3 C(2013) 7243 final of 5.11.2013, Commission communication ‘Delivering the internal electricity market and making the most of public intervention’ and accompanying Commission staff working papers SWD(2013) 439 final ‘European Commission guidance for the design of renewables support schemes’ and SWD(2013) 440 final ‘Guidance on the use of renewable energy cooperation mechanisms’.
Reply of the Commission 46
Observations
17While the Commission acknowledges that difficul-ties with RES electricity integration into the grid have hampered exploitation of RES, this is not directly dependent on project management. The requirement to improve RES electricity access to grids is a legal requirement under the renewable energy directive.
18The Commission indeed considers that progress by the Member States in removing the administrative barriers in this area is slow.
As to the reference to the United Kingdom, the Commission considers that the formulation should take into account the constitutional arrangements and devolution process prevailing in this Mem-ber State. The various operational programme documents and programme monitoring commit-tees within the United Kingdom are stand-alone and independent, and harmonisation is achieved through the use of cross-cutting themes embedded into all programmes in the country.
20 — First indentThe contracting authority recognised these issues and it was precisely to ensure transpar-ency and more competition that the tenders were relaunched.
20 — Second indentWith regard to the wind projects in Poland, there were no obstacles (if as a result of the award proce-dure the offer of another supplier would have been selected) for the beneficiary to apply for a change to building permits issued and specify another model of turbines.
With regard to the solar collector project in Poland, the scope of the tender was described properly and in accordance with the applicable legislation.
In the description of the tender, it was determined that the proceeding concerned the given solar col-lector type or another type with the same parame-ters. The project in question was also subject to two controls carried out by national authorities which did not question the compliance of the project with the public procurement law.
21For the programming period 2014–20, requirements have been introduced for a stronger intervention logic for all priorities, including a number of com-mon output indicators, whose use is obligatory where relevant. In the area of renewables, both the ERDF and the CF Regulations for 2014–20 include a common indicator on ‘Additional capacity of renewable energy production’. However, evaluation will always be required to disentangle the contri-bution of the operations co-financed by the cohe-sion policy funds to changes in renewable energy production and consumption patterns from the influence of other external factors.
23Until the installation is complete and fully opera-tional, the actual performance of the system is not known. The actual level of energy generation varies from year to year depending on several parameters (including e.g. weather conditions, reliability of the appliance and building occupancy). Actual data are reported once the project is fully operational.
24As regards the wind projects in Poland, of which 4 out of 5 did not attain the targets according to Table 1, the Commission considers that the results should be assessed during the full operational period of a wind farm, which was not the case for one of the projects. Better territorial planning of RES investments is advisable, taking into account the specific conditions for the RES type concerned in the particular location. The fact that RES projects sometimes do not reach or only partly reach their planned production targets confirms the high risk profile of such investments and thus, the need for public funding in order to get bankable projects and thus leverage private funding.
Reply of the Commission 47
Box 5 — Second paragraphThe Commission has suggested to the Polish authorities and the ‘Joint Assistance to Support Projects in European Regions (JASPERS)’ partner-ship to assess results and the financial rate of return (FRR) of the wind farm projects on the basis of more realistic estimates. The result indicators would then better reflect the working time of wind farms.
Box 5 — Third paragraphIn the United Kingdom, two of the five sites audited have delivered lower outputs than expected due to lower demand on the systems than forecast. The data collection exercise planned by the manag-ing authority for the end of the operations intends to collect site-specific data which should provide further clarity on why demand was lower than envisaged.
26The Commission acknowledges the principles of efficiency and effectiveness as defined in the EU’s Financial Regulation. The regulation states that the principle of efficiency concerns the best relation-ship between resources employed and results achieved and the principle of effectiveness con-cerns the attainment of the specific objectives set and the achievement of the intended results. The Commission therefore considers that efficiency and effectiveness should not only be measured in megawatts of RES per euro invested, but also in terms of the overall success of the programme and the projects in attaining desired results.
27Cost-effectiveness considerations may be defined in the selection criteria of the specific interventions. However, cohesion policy serves a broader purpose and all operational programmes financed by cohe-sion policy have to comply with the policy’s objec-tives to strengthen economic, social and territorial cohesion and promote overall harmonious develop-ment by reducing disparities between the levels of development of regions and promoting develop-ment in least favoured regions.
Cohesion policy is an integrated and place-based policy, and an increased share of RES is one of mul-tiple objectives of its programmes, meaning that projects may simultaneously aim at more objec-tives than just RES generation. Moreover, as regards investments in RES specifically, the Commission considers that the cost-effectiveness concept can be defined in several ways: very short-term cost-reduction, or medium to long-term dynamic efficiency cost-reduction through innovation for the overall transformation of our energy system in tune with 2020 targets and preparing the ground for beyond.
28While Regulation 1083/2006 did not require ‘needs assessments’, the Commisison agrees that a needs assessment can be useful. As a general require-ment for all operational programmes funded under cohesion policy in the 2007–13 period, programmes contain ‘an analysis of the situation of the eligible area or sector in terms of strengths and weaknesses and the strategy chosen in response’.
In 2014–20, the priority axes will select one or more investment priorities according to the specific needs and context of the Member States. The spe-cific objectives and the corresponding result indica-tors will then express what each priority axis aims to achieve — related to the analysis of the situation and the policy needs identified.
29In the 2007–13 period, relative shares allocated to RES investments differed between Member States, to be seen in the light of total volume of funds available, national needs and priorities set by each Member State. The cohesion policy operational pro-grammes for 2007–13 were planned and adopted before the adoption of the 2020 climate and energy targets and the respective EU legislation. Considera-tion of contribution towards 2020 RES targets was subsequently taken into account, if and when Mem-ber States notified revisions in their operational programmes.
Reply of the Commission 48
36As for the specific projects, Member States them-selves are in charge of the selection. As regards considerations in relation to cost-effectiveness and the broader objectives of cohesion policy, the Com-mission refers to its replies to paragraphs 26 and 27.
37The Commission refers to its replies to para-graphs 26 and 27.
39The Commission agrees on the importance of avoid-ing deadweight. As regards the co-financing rates, the provisions are set out in Article 53 of Regulation (EC) No 1083/2006. This does not mean in itself that part of the investment costs of a project is borne by the final recipient of a public subsidy. There are also provisions as regards revenue-generating projects in Article 55 of the same regulation. In order to comply with the binding RES targets, Member States need to encourage investments in RES projects, which may not be bankable on their own, considering a higher risk profile of such investments. Co-financing rates of RES state aid projects are established by state aid decisions, in which case the funding gap methodology does not apply. Nevertheless, calculation of the funding gap is still encouraged as it helps to set the amount (or intensity) of aid and limit the state aid below the maximum level, as appropriate.
To support a more market-based approach in the 2014–20 period, the Commission encourages and Regulation (EU) No 1303/2013 provides for the use of financial instruments instead of grants to be implemented to support investments which are expected to be financially viable, but do not give rise to sufficient funding from market sources. Support via financial instruments shall be based on a detailed ex ante assessment in accordance with Article 37(2) of the above regulation which has, inter alia, established evidence of market failures or sub-optimal investment situations, and the estimated level and scope of public investment needs, includ-ing types of financial instruments to be supported.
However, it is important to note that the bulk of investment in this area should be made by the private sector. Member States and regions need to ensure that public funding does not replace but complements and leverages private investment in accordance with state aid rules. Cohesion policy funding should be used to complement existing national support schemes to ensure added value.
30Since the adoption of the renewable energy direc-tive in 2009 and the legal requirement to adopt national renewable energy action plans (NREAPs), Member States were in fact required to conduct proper needs assessment for RES investments, and NREAPs were based on such needs analysis. They also constitute a serious and well-reflected basis for RES-related investments in Member States. In addition, the fact that such plans were adopted in a transparent manner and made publicly available did contribute to better planning and transparency, allowing for the first time all actors, including inves-tors and neighbouring Member States, to coordi-nate such investments and thus to increased added value and cost-effectiveness. Nevertheless, all 2007–13 cohesion policy operational programmes had been negotiated and approved before the NREAPs were due (June 2010).
30 — Fourth indentA mid-term evaluation of operational programmes was not compulsory unless specific circumstances warranted it, according to Article 48 of Regulation (EC) No 1083/2006.
Nonetheless, all projects in Wales are, from 2014, subject to evaluation. In the course of 2014, the Welsh Managing Authority will commission a syn-thesis of all operation evaluations to draw out pro-gramme level findings, including those of energy operations.
32The Commission agrees with the general statement but notes that no major inefficiencies in the plan-ning and implementation of the audited projects have been identified.
Reply of the Commission 49
Conclusions and recommendations
Common reply to paragraphs 48 and 52The reform of cohesion policy for 2014–20 will provide the monitoring committee of respective operational programmes with the necessary incen-tives to approve selection criteria ensuring maxi-mum impact for this type of investments. Member States and regions will have to decide upfront what objectives they intend to achieve with the available resources and identify precisely how they will meas-ure progress towards those goals for each priority axis. This will allow regular monitoring and debate on how financial resources are used.
For the 2014–20 period, Regulation (EU) No 1303/2013 provides that selection procedures and criteria need to ensure the contribution of operations to the achievement of the specific objectives and results of the relevant priority of the operational programme, which may aim at more objectives than RES generation. As regards major projects, the Commission requires Member States/Managing Authorities to carry out a cost-benefit analysis, including an economic and a financial analysis, for each major project, in order to dem-onstrate that the project is desirable from an economic point of view (i.e. society is better off with the project) and that the contribution of the cohesion policy funds is needed for the project to be financially viable and, in some cases, bankable, taking into account its risk profile. As part of the cost-benefit analysis, an option analysis is required, which, among other aspects, takes into account economic and financial considerations, such as keeping construction costs as low as possible, in order to choose the best option, while trying to maximise the project’s benefits for society.
The Commission also refers to its replies to para-graphs 25 to 26, 28 to 32, 36 to 37 and 39.
Box 7The wind farm projects in Poland received between 22 % and 70 % of total eligible investment costs, up to a maximum of 10 million euro. It can be noted that the EU co-financing level of wind farm major projects, i.e. projects under Commission assess-ment, is 22–25 %.
42As regards national public funding mechanisms, indeed cohesion policy funding was required to complement these in accordance with Article 9 of Regulation (EC) No 1083/2006. The ERDF comple-menting existing funding mechanisms have a finan-cial added value in that more could be done than would be the case in the absence of the cohesion policy funds. For added value, the nature of the policy does not need to be changed.
44The Commission points out that the EU added value in improving administrative capacities is one which takes time. RES investments are a relatively new area for cohesion policy and it will take some time for such learning effects to take place.
45The Commission refers to its reply to paragraph 7.
46The Commission refers to its reply to paragraph 29.
Reply of the Commission 50
— Contribution of support to development of renewable energy markets in the MS and in the EU;
— Contribution of EU funds for reaching the RES targets in a cost- and energy-efficient way while promoting innovation and technology develop-ment (objectives of EU integrated energy and climate change policy).
The Commission also refers to its replies to para-graphs 42, 46 and 47.
Recommendation 1Under the framework for cohesion, the Commission is not involved in the selection of projects, except for the approval of major projects.
The new regulatory framework for 2014–20 never-theless ensures from the start that, through the con-tent of the adopted programmes and the interven-tion logic including objectives’ result indicators and outputs encapsulated in priority axes, the selection of projects will be done by Member States as far as possible according to the Court’s recommendation.
Also, based on the performance framework estab-lished for each operational programme, the Com-mission will be in position through milestones relat-ing only to the indicators to encourage and review the performance of programmes. Where there is evidence resulting from a performance review that a priority has failed to achieve the milestones relating only to the financial and output indicators and key implementation steps set out and that the Member State has not taken the necessary steps to rectify the problem, the Commission may suspend all or part of an interim payment or apply ultimately financial corrections. The performance reserve should not be allocated to such programme.
50The Commission has constantly underlined to Member States the point on weaknesses of national administrative systems. This is also a legal require-ment addressed by Article 13 of the renewable energy directive. This is monitored and analysed in the Commission’s biennial renewable energy progress reports.
The Commission also refers to its replies to para-graphs 17 to 21.
51The Commission refers to its replies to para-graphs 23 to 25.
53The Commission considers that the cohesion policy investments in RES have been made in line with the objectives and requirements of the applicable legislative framework. Its views on the European added value in cohesion policy were set out in the June 2011 Commission Staff Working Document ‘The added value of the EU budget’. The Commis-sion considers that the following factors would need to be taken into account in the analysis of added value of EU funds in this area:
— Contribution of supported technologies and projects to reaching the EU RES objectives, including promotion of technological devel-opment and innovation, and contribution to providing opportunities for employment and regional development, especially in rural and isolated areas;
— Contribution of supported projects for reaching of RES targets and progress of implementa-tion of national renewable energy action plans (including by taking into account contribu-tion to promotion of RES in different sectors (RES-Electricity, RES-Heating and Cooling and RES-Transport);
Reply of the Commission 51
Nevertheless, cohesion policy is an integrated and place-based policy, and an increased share of RES is only one of its multiple objectives. In particu-lar other cohesion policy objectives, such as the promotion of innovation may justify the choice of technologies which are not the most cost-effective. Regulation (EU) No 1303/2013 provides that selec-tion procedures and criteria need to ensure the contribution of operations to the achievement of the specific objectives and results of the relevant priority of the operational programme, which may aim at more objectives than RES generation.
As regards major projects, in the 2014–20 pro-gramming period the Commission will continue to require carrying out a cost-benefit analysis, includ-ing an economic and a financial analysis. As part of cost-benefit analysis, an option analysis is required, which, among other aspects, takes into account economic and financial considerations, such as con-struction costs, in order to choose the best option, while trying to maximise the project’s benefits for society.
Recommendation 1 — Second bulletThe Commission accepts this recommendation. It has consistently reminded Member States of the need to ensure stability in the regulatory frame-work and has also constantly criticised frequent and retroactive modifications in the Member States’ regulatory frameworks. The November 2013 Com-mission communication on ‘Delivering the internal electricity market and making the most of public intervention’ and the Commission’s guidance for the design of renewables support schemes as well as the guidance on the use of renewable energy cooperation mechanisms address these issues5.
5 C(2013) 7243 final of 5.11.2013, Commission communication ‘Delivering the internal electricity market and making the most of public intervention’ and accompanying Commission staff working papers SWD(2013) 439 final ‘European Commission guidance for the design of renewables support schemes’ and SWD(2013) 440 final ‘Guidance on the use of renewable energy cooperation mechanisms’.
Under the 2014–20 legal framework, the Commis-sion strengthens as well the ex ante conditionalities for the funds so as to ensure that the necessary conditions for their effective implementation are in place.
In addition, the Commission through its active and continuous work with the Member States will advise managing authorities to include the recom-mendations of the European Court of Auditors into the selection process and selection criteria of RES projects. Contribution to the expected results of the priority axis is now required to be included in the selection criteria.
Recommendation 1 — First bulletThe Commission partly accepts this recommenda-tion. The Commission agrees on the importance of avoiding deadweight. To support a more market-based approach in the 2014–20 period, the Com-mission encourages, as foreseen in Regulation (EU) No 1303/2013, the use of financial instruments instead of grants to support investments which are expected to be financially viable but do not give rise to sufficient funding from market sources. Support via financial instruments shall be based on a detailed ex ante assessment in accordance with Article 37(2) of the above regulation which has, inter alia, established evidence of market failures or sub-optimal investment situations, and the estimated level and scope of public investment needs, includ-ing types of financial instruments to be supported.
The Commission also agrees that programmes must be based on proper needs assessments. For that purpose, Regulation (EU) No 1303/2013 provides that the Partnership Agreement for 2014–20 shall set out an analysis of disparities, development needs and growth potential. Choices made in each operational programme shall be justified accord-ingly. Requirements stemming from the renewable energy directive (e.g. strategic approach, needs assessment and national renewable energy action plans) will also ensure optimal planning of cohesion policy RES investments.

Reply of the Commission 52
Recommendation 2The Commission accepts this recommendation and considers it for its part, implemented. The Commis-sion’s November 2013 guidance for the design of renewables support schemes should be taken into consideration by Member States. The forthcoming Energy and Environmental Aid guidelines will also contribute to increasing the cost-effectiveness of Member States support schemes for renewable energy.

HOW TO OBTAIN EU PUBLICATIONS
Free publications:
• one copy: via EU Bookshop (http://bookshop.europa.eu);
• more than one copy or posters/maps: from the European Union’s representations (http://ec.europa.eu/represent_en.htm); from the delegations in non-EU countries (http://eeas.europa.eu/delegations/index_en.htm); by contacting the Europe Direct service (http://europa.eu/europedirect/index_en.htm) or calling 00 800 6 7 8 9 10 11 (freephone number from anywhere in the EU) (*).(*) The information given is free, as are most calls (though some operators, phone boxes or hotels may charge you).
Priced publications:
• via EU Bookshop (http://bookshop.europa.eu).
Priced subscriptions:
• via one of the sales agents of the Publications Office of the European Union (http://publications.europa.eu/others/agents/index_en.htm).nts/index_en.htm).
QJ-A
B-14-006-EN-C
ISSN 1831-0834
The ECA assessed the results of renewable energy generation projects co-financed by cohesion policy funds contributing to the relevant EU 2020 target. It concludes that, while they delivered outputs as planned, multiple investment projects were not guided by the principle of cost-effectiveness or lacked a real EU added value. The ECA recommends that the Commission promotes the principle of cost-effectiveness in EU co-financed support programmes and that the Member States establish a stable and predictable renewable energy regulatory framework. Moreover, the Member States should apply minimum cost-effectiveness criteria, applied to projects’ circumstances, and enhance EU added value through improved project implementation, monitoring and evaluation.
EUROPEANCOURTOF AUDITORS