Embed Size (px)
Citation preview

Preferred Securities Third Quarter 2018
This brochure must be accompanied by the most recent Cohen & Steers Preferred Securities and Income Fund factsheet and summary prospectus.
cohenandsteers.com 800 330 7348
Cohen & Steers Preferred Securities and Income FundNASDAQ Symbols: This Fund offers investors the potential for:
Class A: CPXAX Class C: CPXCX Class F: CPXFX Class I: CPXIXClass R: CPRRX Class Z: CPXZX
• High tax-advantaged monthly income
• Value-driven opportunities through investment grade rated securities and other income securities
• Enhanced total return from a global institutional investment universe
• Active management of long-term credit and interest rate risks
Bridge the Income Gap
Preferred securities, which are issued by companies around the globe, have attributes of both stocks and bonds. From an issuer’s standpoint, they are quite different from bonds, as they are forms of capital with regulatory and
ratings-agency benefits that bonds do not offer. Yet from an investor’s standpoint, preferred securities are much more like bonds, typically paying a fixed or floating rate of income.
Please see additional disclosures on the back page.
2018

22
Historical Perspective on Interest RatesAfter a 35-year bull market in bonds amid declining Treasury yields, investors must now contend with two challenges: how to earn INCOME with yields near record lows, and how to protect against RISING INTEREST RATES as the Federal Reserve gradually unwinds years of easy monetary policy.
The Cohen & Steers Preferred Securities and Income Fund offers a unique solution to both of these questions.
At September 30, 2018. Source: Bloomberg.
Data quoted represents past performance, which is no guarantee of future results. Please see back page and below for additional disclosures.
10-Year Treasury Yield Since 1970
6-Column Width
“NO-FILL”for bottomnumber
1997 1999 2001 2003 2005 2009 2011 20132007
3%
6%
9%
12%
15%
18% Highest Yield on 9/30/8115.84%
Long-term Average6.41%
Lowest Yield on 7/8/161.37%
Yields of the 10-year Treasury note are near historically low levels and well below the
long-term average yield.
Yield as of 9/30/183.06%
6-Column Width
“NO-FILL”for bottomnumber
1997 1999 2001 2003 2005 2009 2011 20132007
74 78 82 86 90 94 98 02 1470 72 76 80 84 88 96 00 04 06 08 10 12 16 1892
Risks of Investing in Preferred Securities
Investing in any market exposes investors to risks. In general, the risks of investing in preferred securities are similar to those of investing in bonds, including credit risk and interest-rate risk. As nearly all preferred securities have issuer call options, call risk and reinvestment risk are also important considerations. In addition, investors face equity-like risks, such as deferral or omission of distributions, subordination to bonds and other more senior debt, and higher corporate governance risks with limited voting rights.
Risks associated with preferred securities differ from risks inherent with other investments. In particular, in the event of bankruptcy, a company’s preferred securities are senior to common stock but subordinated to all other types of corporate debt. Throughout this commentary we will make comparisons of preferred securities to corporate bonds, municipal bonds and 10-Year Treasury bonds. It is important to note that corporate bonds sit higher in the capital structure than preferred securities, and therefore in the event of bankruptcy will be senior to the preferred securities. Municipal bonds are issued and backed by state and local governments and their agencies, and the interest from municipal securities is often free from both state and local income taxes. 10-Year Treasury bonds are issued by the U.S. government and are generally considered the safest of all bonds since they are backed by the full faith and credit of the U.S. government as to timely payment of principal and interest.
Preferred funds may invest in below investment-grade securities and unrated securities judged to be below investment-grade by the Advisor. Below investment-grade securities or equivalent unrated securities generally involve greater volatility of price and risk of loss of
income and principal, and may be more susceptible to real or perceived adverse economic and competitive industry conditions than higher grade securities.
Contingent capital securities (sometimes referred to as “CoCos”) are debt or preferred securities with loss absorption characteristics built into the terms of the security, for example a mandatory conversion into common stock of the issuer under certain circumstances, such as the issuer’s capital ratio falling below a certain level. Since the common stock of the issuer may not pay a dividend, investors in these instruments could experience a reduced income rate, potentially to zero, and conversion would deepen the subordination of the investor, hence worsening the investor’s standing in a bankruptcy. Some CoCos provide for a reduction in the value or principal amount of the security under such circumstances. In addition, most CoCos are considered to be high yield or “junk” securities and are therefore subject to the risks of investing in below investment-grade securities
Duration Risk. Duration is a mathematical calculation of the average life of a fixed-income or preferred security that serves as a measure of the security’s price risk to changes in interest rates (or yields). Securities with longer durations tend to be more sensitive to interest rate (or yield) changes than securities with shorter durations. Duration differs from maturity in that it considers potential changes to interest rates, and a security’s coupon payments, yield, price and par value and call features, in addition to the amount of time until the security matures. Various techniques may be used to shorten or lengthen the Fund’s duration. The duration of a security will be expected to change over time with changes in market factors and time to maturity.
5 things to know about preferred securities:
They tend to offer higher yields than similarly rated bonds due to their lower claim on a company’s assets in the event of liquidation.
Most pay dividends rather than interest, taxed at a lower rate similar to capital gains.
They are issued mostly by banks, insurance companies and real estate investment trusts (REITs)—companies such as J.P. Morgan, Bank of America and Wells Fargo.
They are offered in two formats: $25 par securities traded on stock exchanges, and $1000 par securities traded in the institutional over-the-counter market.
They come in a variety of structures, including many with relatively low interest-rate sensitivity, such as fixed-to-floating-rate securities.

3
Fixed Income Index Yields Before Taxes After Taxes (income <$479K)(a)
After Taxes (income>$479K)(b)
1%2%3%4%5%6%7%8%
3.13.5
4.1
2.5 2.5
5.7
4.0 3.9
1.9 1.9
3.5 3.54.0
6.5
4.0
10-Year TreasuryCorporate Bonds(f)Municipal Bonds(e)High Yield Bonds(d)Preferred Securities(c)
Preferred Securities Appear Attractive Relative to High YieldAs economic growth trends higher, conventional wisdom suggests that investors reposition portfolios away from interest-rate-sensitive bonds and into those securities that are more credit sensitive. Within credit-sensitive fixed income, we see better value in preferred securities than in high-yield bonds. As depicted in the chart below the yield spreads between high-yield bonds and investment-grade preferred securities are narrow relative to the historical average. Preferred securities currently offer similar income, better credit quality, and in our view, better value than high-yield bonds.
Yield Comparison: Preferred Securities vs. High Yield Bonds January 1997–September 30, 2018
Preferred Securities(a)
High Yield Bonds(b)
4%
8%
12%
16%
20%
24%
Historical Average Spread (1997–2018): 223 bps
Cyclical risk pressuring high yield spreads
Average Yields (2002–2007)Preferreds: 6.8%
10-Year Treasury: 4.4%
2011 2012 2013 2014 2015 2016 2017 201820102009200820072006200520042003200220012000199919981997
At September 30, 2018. Source: Morningstar.Data quoted represents past performance, which is no guarantee of future results. An investor cannot invest directly in an index and index performance does not reflect the deduction of any fees, expenses or taxes. Please note that the yields shown are based on unmanaged indexes and are provided for illustrative purposes only. The indexes’ performance is not illustrative of the Fund’s performance, and the Fund may invest in financial instruments and strategies not included or represented in the index. There is no guarantee that investors will experience the type of performance reflected above. There is no guarantee that any historical trend illustrated above will be repeated in the future and there is no way to predict precisely when such a trend might begin. (a) ICE BofAML Fixed Rate Preferred Securities Index. (b) ) ICE BofAML High-Yield Master Index. See index definitions on back page.
6.5%
5.7%
Current Spread 0.8%
A Tax-Advantaged Income OpportunityIn addition to offering potentially attractive yields, preferred securities may allow investors to keep more of what they earn. Preferreds generally pay qualified dividend income (QDI), which is taxed at a lower rate than ordinary income. Compared with the top income tax rate of 38.8%, QDI is taxed at just 23.8% for those in the top tax bracket and 18.8% for investors in most lower brackets.
The chart below compares after-tax yields for fixed income categories and makes a conservative assumption that half of the income paid on a preferreds portfolio is QDI-eligible. Note that professional tax advice may be necessary to ensure receipt of these benefits.
(a) For individuals (married, jointly filing) with income exceeding $400k but less than $479k, qualified dividend income is taxed at 18.8% and the marginal tax rate used was 38.8%. Both rates include the Medicare surcharge of 3.8%. (b) For individuals (married, jointly filing) with income exceeding $479k but less than $600k, qualified dividend income is taxed at 23.8% and the marginal tax rate used was 38.8%. Both rates include the Medicare surcharge of 3.8%. (c) ICE BofAML Fixed Rate Preferred Securities Index (Credit quality: BBB). (d) ICE BofAML High Yield Master Index (Credit quality: B+). (e) ICE BofAML Municipal Master Index (Credit quality: AA-). (f) ICE BofAML Corporate Master Index (Credit quality: A-). See index definitions on back page.
Preferred Income Advantage after tax calculations assumes preferred securities income is taxed at the respective qualified dividend rate and marginal tax rate on a 50/50 blended basis. All other securities reflect full taxation at the respective marginal rates based on income.
At September 30, 2018. Source: Cohen & Steers, ICE BofAML.
Data quoted represents past performance, which is no guarantee of future results. Please see back page and below for additional disclosures.
Notes: Yields shown on a yield-to-maturity basis. State and local taxes are not included in these calculations.

4
Potential for Enhanced Total Return from a Global Institutional Investment UniverseOf the estimated $967 billion securities that comprise the preferred securities market, about $671 billion are securities issued by foreign issuers.(1) In fact, many issuers of preferreds offer securities in multiple markets and currencies. We believe there is potential for an active manager like Cohen & Steers to take advantage of material differences in prices and/or yields. In our view, better values can often be found for securities of the same issuer in one market relative to another.
We believe investors are better served using an active manager with the skill and resources to access the full universe of preferred securities. Not only can this offer a broader opportunity set for finding value, but it can also enhance the ability to manage through a rising interest rate environment—something we see as crucial in the coming years.
Institutional and Retail Market Breakdown
■ 47% Institutional Preferreds (Over-the-Counter)
■ 34% Non-USD Institutional Preferreds (Over-the-Counter)
■ 19% Retail Preferreds (Exchange-Traded)
47%
19%
34%
U.S. and Non-U.S. Market Breakdown
■ 74% Foreign Issuers
■ 26% U.S. Issuers
74%
26%
69% of the $967 Billion Global Preferred Market Consists of Securities of Foreign Issuers.
Annualized Total Returns of Institutional and Retail Preferreds1997–2018
2%
4%
6%
8%
10%
6.3
4.9
Institutional (Over-the-Counter)(a) Retail (Exchange-Traded)(b)
2%
4%
6%
8%
10%
6.3
4.9
Institutional (Over-the-Counter)(a) Retail (Exchange-Traded)(b)
At September 30, 2018. Source: Bloomberg.Data quoted represents past performance, which is no guarantee of future results. An investor cannot invest directly in an index and index performance does not reflect the deduction of any fees, expenses or taxes. The information presented above does not reflect the performance of any fund managed or serviced by Cohen & Steers, and there is no guarantee that investors will experience the type of performance reflected above. All returns are shown gross of fees and other expenses. There is no guarantee that any historical trend illustrated above will be repeated in the future or any way to know in advance when such a trend might begin. (a) ICE BofAML US IG Institutional Capital Securities Index. (b) ICE BofAML Core Fixed Rate Preferred Securities Index. See index definitions on back page.
Along with a broad range of global securities, Cohen & Steers has access to the institutional (over-the-counter) preferred securities market, which can be especially important in a rising-rate environment, given the lower duration of certain institutional preferred securities. Since 1997, the market for institutional (over-the-counter) preferred securities has outperformed retail (exchange-traded) preferred securities by 1.4% annually.
(1) At September 30, 2018. Source: Bloomberg and Cohen & Steers.Based on par values of approximately 1,400 preferred securities, which include Tier 1, Tier 2, and subordinated debt instruments.
5
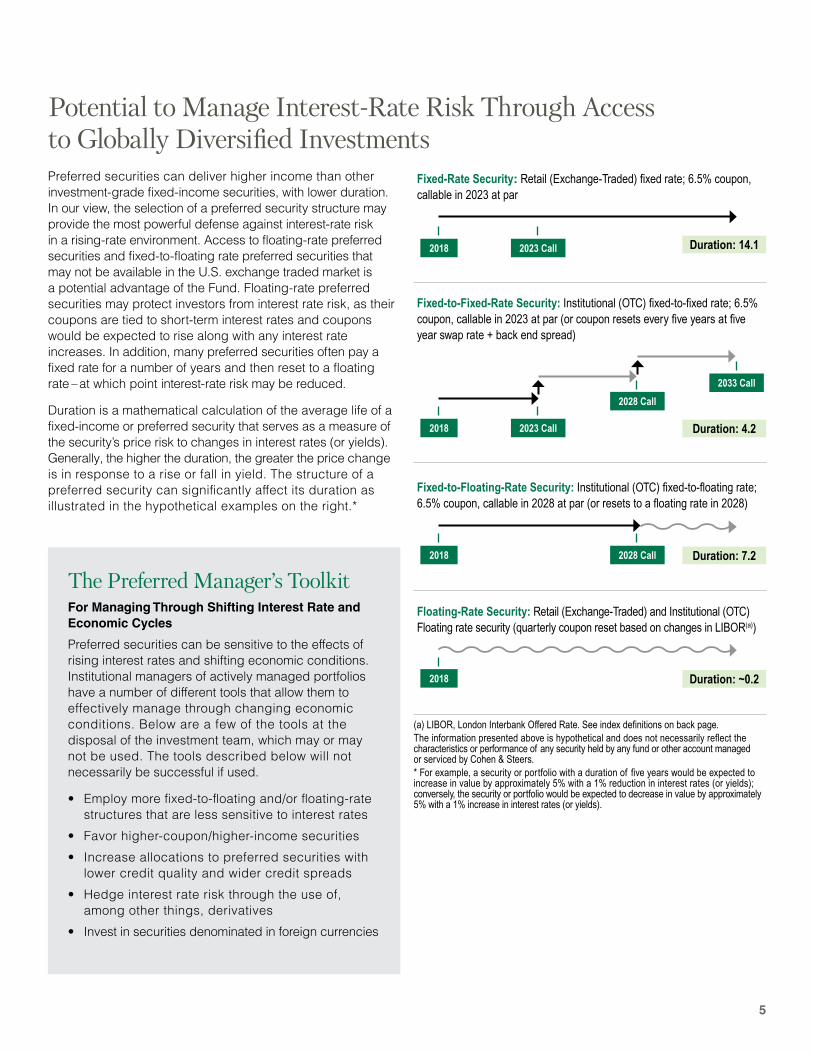
Potential to Manage Interest-Rate Risk Through Access to Globally Diversified Investments
The Preferred Manager’s ToolkitFor Managing Through Shifting Interest Rate and Economic Cycles
Preferred securities can be sensitive to the effects of rising interest rates and shifting economic conditions. Institutional managers of actively managed portfolios have a number of different tools that allow them to effectively manage through changing economic conditions. Below are a few of the tools at the disposal of the investment team, which may or may not be used. The tools described below will not necessarily be successful if used.
• Employ more fixed-to-floating and/or floating-rate structures that are less sensitive to interest rates
• Favor higher-coupon/higher-income securities
• Increase allocations to preferred securities with lower credit quality and wider credit spreads
• Hedge interest rate risk through the use of, among other things, derivatives
• Invest in securities denominated in foreign currencies
Preferred securities can deliver higher income than other investment-grade fixed-income securities, with lower duration. In our view, the selection of a preferred security structure may provide the most powerful defense against interest-rate risk in a rising-rate environment. Access to floating-rate preferred securities and fixed-to-floating rate preferred securities that may not be available in the U.S. exchange traded market is a potential advantage of the Fund. Floating-rate preferred securities may protect investors from interest rate risk, as their coupons are tied to short-term interest rates and coupons would be expected to rise along with any interest rate increases. In addition, many preferred securities often pay a fixed rate for a number of years and then reset to a floating rate –at which point interest-rate risk may be reduced.
Duration is a mathematical calculation of the average life of a fixed-income or preferred security that serves as a measure of the security’s price risk to changes in interest rates (or yields). Generally, the higher the duration, the greater the price change is in response to a rise or fall in yield. The structure of a preferred security can significantly affect its duration as illustrated in the hypothetical examples on the right.*
(a) LIBOR, London Interbank Offered Rate. See index definitions on back page.The information presented above is hypothetical and does not necessarily reflect the characteristics or performance of any security held by any fund or other account managed or serviced by Cohen & Steers.* For example, a security or portfolio with a duration of five years would be expected to increase in value by approximately 5% with a 1% reduction in interest rates (or yields); conversely, the security or portfolio would be expected to decrease in value by approximately 5% with a 1% increase in interest rates (or yields).
Fixed-Rate Security: Retail (Exchange-Traded) fixed rate; 6.5% coupon, callable in 2023 at par
Fixed-to-Fixed-Rate Security: Institutional (OTC) fixed-to-fixed rate; 6.5% coupon, callable in 2023 at par (or coupon resets every five years at five year swap rate + back end spread)
Fixed-to-Floating-Rate Security: Institutional (OTC) fixed-to-floating rate; 6.5% coupon, callable in 2028 at par (or resets to a floating rate in 2028)
Floating-Rate Security: Retail (Exchange-Traded) and Institutional (OTC) Floating rate security (quarterly coupon reset based on changes in LIBOR(a))
2018 Duration: ~0.2
2028 Call
2033 Call
2018 Duration: 4.2
2028 Call2018 Duration: 7.2
2023 Call
2023 Call
2018 Duration: 14.1

6
Security Type Breakdown
■ 74% Fixed-to-Floating Rate
■ 2% Floating-Rate
■ 20% Fixed-Rate
■ 4% Cash
74%
20%
4%
2%
Sector Weights
■ 48% Banking ■ 24% Insurance■ 7% Other ■ 7% Utilities■ 5% Other Assets■ 3% Real Estate■ 3% Finance■ 3% Pipeline
48%7%
7%
5%3%
24%
3%3%
Geographic Breakdown(a)
■ 50% United States■ 12% United Kingdom■ 11% Other■ 7% Japan■ 6% France ■ 4% Switzerland ■ 3% Canada■ 3% Netherlands■ 3% Australia
50%
12%
4%5%
7%
11%
6%
3%3%3%4%
Standard & Poor’s Credit Quality Breakdown
■ 3% A-■ 13% BBB+■ 10% BBB■ 32% BBB-■ 2% Cash
■ 9% BB+■ 5% BB■ 4% BB-■ 2% B+■ 4% B
■ 16% Not Rated*
■ 60% Investment-Grade
■ 24% Below Investment-Grade
■ 16% Not Rated*24%
16% 60%
Source: Cohen & Steers, using Standard & Poor’s ratings. The letter ratings are provided to indicate the proposed creditworthiness of the underlying holdings in the portfolio and generally range from A (highest) to B (lowest). Ratings do not apply to the Fund’s common shares.* Securities may be rated investment grade by other rating agencies.
Portfolio weights are subject to change without notice. (a) Generally, securities are USD-denominated.
NASDAQ Symbols
Class A: CPXAX Class C: CPXCX Class F: CPXFX Class I: CPXIX Class R: CPRRX Class Z: CPXZX
Portfolio weights are subject to change without notice. Due to rounding, values might not add up to 100%. Other includes Brokerage, Cash, Telecommunication Svcs., ETF and Derivatives.
Cohen & Steers Preferred Securities and Income FundThe investment objective of the Fund is to seek total return through high current income and capital appreciation by investing in preferred and debt securities issued by U.S. and non-U.S. companies. Preferred securities are issued by banks, insurance companies, REITs and other diversified financials as well as utility, energy, pipeline and telecommunications companies.
The pie charts below depict the Fund’s weights as of September 30, 2018.

7
William Scapell, CFA, Executive Vice President and Portfolio Manager, leads the preferred securities team. He brings 27 years of industry experience to the investment process. Prior to joining the firm in 2003, he worked in the fixed-income research department
at Merrill Lynch, where he was Chief Strategist for preferred securities. He was previously in bank supervision and monetary policy roles at the Federal Reserve Bank of New York.
Elaine Zaharis-Nikas, CFA, Senior Vice President and Portfolio Manager, has 21 years of investment experience. Joining Cohen & Steers in 2003, she previously worked at JPMorgan Chase for eight years as a credit analyst and internal auditor.
Active Management by an Experienced and Tenured TeamBy working with Cohen & Steers, investors gain access to a large and experienced team of preferred securities specialists.
Portfolio managers William Scapell and Elaine Zaharis-Nikas have an average of 24 years of experience and have been managing the firm’s preferred securities portfolios since 2003, along with Austin Fagan, the team’s dedicated trader. They are backed by a team of analysts whose proprietary research is supported by extensive contacts in the industry. The group also leverages the global research capabilities of Cohen & Steers’ market-leading real estate and infrastructure investment professionals. Together, the team oversees $13.6 billion(1) in preferred securities across all the firm’s strategies for individual investors and pension funds around the world.
(1) As of September 30, 2018.(2) At September 30, 2018. 12-Month Distribution Yield is calculated by adding the Fund’s trailing 12-month income distributions, and dividing the sum by the Fund’s most recent month ended NAV. Note that the number of income distributions is based on the Fund’s distribution payment frequency (i.e., monthly, quarterly or semi-annually) as disclosed in the Fund’s prospectus. The Fund may pay distributions in excess of its net investment company taxable income and, to the extent this occurs, the distribution yield quoted will include a return of capital. Shareholders of record will be notified of the estimated return of capital for each distribution. This information is also available at cohenandsteers.com. (3) 30 days ending September 30, 2018. The SEC yield is calculated by dividing annualized net investment income per share during a 30-day period by the maximum offering price per share as of the close of that period. SEC yield reflects the rate at which the fund is earning income on its current portfolio of securities. The SEC 30-Day Yield is computed under an SEC standardized formula and is based on the maximum offer price per share. Subsidized (Sub.) yields reflect fee waivers in effect. Without such waivers, yields would be reduced. Unsubsidized (Unsub.) yields do not reflect fee waivers.
For more information, contact your financial advisor or visit our website at cohenandsteers.com.
Class A Share Yields at September 30, 2018
Distribution Yield(2):
5.27%SEC Yield (Sub.)(3):
3.94%SEC Yield (Unsub.)(3):
3.94%
Total Returns (A Share Class)
PeriodExcluding
Sales ChargeIncluding
Sales Charge(a)
ICE BofAML Fixed Rate
Preferred Sec IndexBlended
Benchmark(b)S&P 500
IndexQTD 1.24% -2.55% 0.19% 1.11% 7.71%YTD -1.33% -5.03% 0.23% -0.47% 10.56%1 Year -0.36% -4.10% 0.67% 0.22% 17.91%3 Year 5.48% 4.15% 5.47% 5.15% 17.30%5 Year 6.64% 5.83% 7.11% 6.27% 13.95%Since Inception (5/3/10) 7.96% 7.47% 6.72% 6.70% 13.46%
At September 30, 2018. Returns stated are net of fees. Gross Expense Ratio Class A: 1.16%, Net Expense Ratio Class A: 1.16%, as disclosed in the May 1, 2018 prospectus as supplemented on June 18, 2018. Through June 30, 2020, Cohen & Steers has contractually agreed to waive its fee and/or reimburse the Fund so that the Fund’s total annual operating expenses (excluding acquired fund fees and expenses, taxes and extraordinary expenses) do not exceed 1.20% for Class A shares. This arrangement can be amended at any time by agreement of the Fund and the Advisor. Absent such arrangements, returns would have been lower. (a) Maximum 3.75% sales charge; returns for other share classes will differ due to differing expense structures and sales charges. (b) The blended benchmark consists of 50% ICE BofAML US Capital Securities Index and 50% ICE BofAMLFixed Rate Preferred Securities Index through 12/31/2016. Thereafter, it consists of 60% ICE BofAML US IG InstitutionalCapital Securities Index, 30% ICE BofAML Core Fixed Rate Preferred Securities Index, and 10% Bloomberg BarclaysDeveloped Market USD Contingent Capital Index.
Data quoted represents past performance, which is no guarantee of future results.Current performance may be lower or higher than the performance quoted. The investment return and the principal value of an investment will fluctuate and shares, when redeemed, may be worth more or less than their original cost. Periods greater than 12 months are annualized. Returns are historical and include change in share price and reinvestment of all distributions. Month-end performance information can be obtained by visiting our website at cohenandsteers.com.An investor cannot invest directly in an index and index performance does not reflect the deduction of any fees, expenses or taxes. During certain periods presented above, the Advisor waived fees and/or reimbursed expenses. Without this arrangement, performance would be lower.

Copyright © 2018 Cohen & Steers, Inc. All rights reserved.
Data quoted represents past performance, which is no guarantee of future results. Returns stated net of fees. There is no guarantee that any historical trend illustrated in this brochure will be repeated in the future, and there is no way to predict precisely when such a trend will begin. There is no guarantee that a market forecast made in this brochure will be realized.
The views and opinions are as of September 30, 2018 and are subject to change without notice. This material represents an assessment of the market environment at a specific point in time and should not be relied upon as investment advice, does not constitute a recommendation to buy or sell a security or other investment and is not intended to predict or depict performance of any investment. This material is not being provided in a fiduciary capacity and is not intended to recommend any investment policy or investment strategy or take into account the specific objectives or circumstances of any investor. Please consult with your investment, tax or legal adviser regarding your individual circumstances prior to investing.
Please consider the investment objectives, risks, charges and expenses of the Fund carefully before investing. A summary prospectus and prospectus containing this and other information may be obtained from your financial advisor, by calling 800 330 7348 or by visiting cohenandsteers.com. Please read the summary prospectus or prospectus carefully before investing.
Cohen & Steers Preferred Securities and Income Fund is distributed by Cohen & Steers Securities, LLC., and is available only to U.S. residents.
The Fund may pay distributions in excess of its net investment company taxable income, and this excess would be a return of capital distributed from the Fund’s assets. The estimated composition of each distribution, including any return of capital, will be provided to shareholders of record and is also available at cohenandsteers.com. Please note that these estimates may change substantially by year-end due to portfolio activity and tax recharacterizations, and shareholders will be notified following year-end regarding the final composition of all distributions via Form 1099-DIV.
Special risks of investing in foreign securities include (i) currency fluctuations, (ii) lower liquidity, (iii) political and economic uncertainties, and (iv) differences in accounting standards. Some international securities may represent small- and medium-sized companies, which may be more susceptible to price volatility and less liquid than larger companies.
Index DefinitionsAn investor cannot invest directly in an index, and index performance does not reflect the deduction of any fees, expenses or taxes.
The Barclays Developed Contingent Capital Index includes hybrid capital securities in developed markets with explicit equity conversion or write down loss absorption mechanisms that are based on an issuer’s regulatory capital ratio or other explicit solvency-based triggers.
ICE BofAML Capital Securities Index: Is a subset of the ICE BofAML U.S. Corporate Index including all fixed-to-floating rate, perpetual callable and capital securities.
ICE BofAML Core Fixed Rate Preferred Securities Index tracks the performance of fixed-rate U.S. dollar-denominated preferred securities issued in the U.S. domestic market.
ICE BofAML Corporate Master Index tracks the performance of U.S. dollar-denominated investment-grade corporate debt publicly issued in the U.S. domestic market. Qualifying securities must have an investment-grade rating (based on an average of Moody’s, S&P and Fitch) and an investment-grade-rated country of risk (based on an average of Moody’s, S&P and Fitch foreign currency long-term sovereign debt ratings).
ICE BofAML Fixed Rate Preferred Securities Index tracks the performance of fixed-rate U.S. dollar-denominated preferred securities issued in the U.S. domestic market. Qualifying securities must be rated investment-grade (based on an average of Moody’s, S&P and Fitch) and must have an investment-grade-rated country of risk (based on an average of Moody’s, S&P and Fitch foreign currency long-term sovereign debt ratings).
ICE BofAML High-Yield Master Index tracks the performance of U.S. dollar-denominated below-investment-grade corporate debt publicly issued in the U.S. domestic market
ICE BofAML Municipal Master Index tracks the performance of U.S. dollar-denominated investment-grade tax-exempt debt publicly issued by U.S. states and territories, and their political subdivisions, in the U.S. domestic market. Qualifying securities must have at least one year remaining term to final maturity, a fixed coupon schedule and an investment-grade rating (based on an average of Moody’s, S&P and Fitch).
ICE BofAML U.S. Capital Securities Index: Is a subset of ICE BofAML U.S. Corporate Index including all fixed-to-floating rate, perpetual callable and capital securities.
ICE BofAML US IG Institutional Capital Securities Index is a subset of the ICE BofAML U.S. Corporate Index including all fixed-to-floating rate, perpetual callable and capital securities.
The 10-Year Treasury note is a debt obligation issued by the United States government that matures in 10 years.
LIBOR (London Interbank Offered Rate) is the average interest rate that leading banks in London charge when lending to other banks.
NOT FDIC INSURED • MAY LOSE VALUE • NO BANK GUARANTEE • NOT INSURED BY ANY GOVERNMENT AGENCY
GB5007 Q318cohenandsteers.com 800 330 7348
Preferred Securities Third Quarter 2018
Class A—CPXAX• No initial or subsequent investment minimums.• Maximum front-end sales charge of 3.75% and ongoing distribution
fees. Reduced front-end sales charges are available. Please read the prospectus for details.
Class C—CPXCX• No initial or subsequent investment minimums.• No front-end sales charge, but a contingent deferred sales charge of
1.00% for shares redeemed within one year of purchase.• Higher ongoing distribution and service fees.
Class F—CPXFX• Available for purchase only through financial intermediaries.• No sales charge or service fee.Class I—CPXIX• Minimum investment of $100,000. No minimum for subsequent investments.Class R—CPRRX• Available for purchase only by group retirement plans.• No front-end sales charge, but higher ongoing distribution fee.Class Z—CPXZX• Available for purchase only by group retirement plans.• No sales charge or service fee.
Cohen & Steers Preferred Securities and Income Fund offers six classes of shares. General information on applicable minimums, sales charges and fees is outlined below. Please see the summary prospectus or prospectus for more detailed information.
From Thomson Reuters Lipper Awards, © 2018 Thomson Reuters. All rights reserved. Used by permission and protected by the Copyright Laws of the United States. The printing, copying, redistribution, or retransmission of this Content without express written permission is prohibited.Lipper Leader ratings for Consistent Return reflect funds’ historic returns, adjusted for volatility, relative to peers. Ratings for consistent return are computed for all Lipper classifications with five or more distinct portfolios and span both equity and fixed-income funds. The ratings are subject to change every month and are calculated for the following time periods: 3-year, 5-year, 10-year, and overall. The overall calculation is based on an equal-weighted average of percentile ranks for the Consistent Return metrics over 3-year, 5-year, and 10-year periods (if applicable). The highest 20% of funds in each classification are named Lipper Leaders for Consistent Return. The next 20% receive a rating of 4; the middle 20% are rated 3; the next 20% are rated 2, and the lowest 20% are rated 1.

Factsheet September 30, 2018
Cohen & Steers Preferred Securities and Income Fund
cohenandsteers.com 800 330 7348
General Information
CUSIP Symbol
A Shares 19248X109 CPXAX
C Shares 19248X208 CPXCX
F Shares 19248X604 CPXFX
I Shares 19248X307 CPXIX
R Shares 19248X406 CPRRX
Z Shares 19248X505 CPXZX
NAV per Share (Class A) $13.42
Total Net Assets $6.9 Billion
Number of Holdings 216
Dividend Frequency Monthly
Expense Ratio Gross (Class A)(1) 1.16%
Expense Ratio Net (Class A)(1) 1.16%
Average Modified Duration(2) 4.6
SEC Yield (Class A–30 Days ending 09/30/2018–Subsidized)(3)
3.94%
SEC Yield (Class A–30 Days ending 09/30/2018–Unsubsidized)(3)
3.94%
12-Month Distribution Yield(4) 5.27%
(1) As disclosed in the May 1, 2018 prospectus, supplemented on June 18, 2018. Cohen & Steers Capital Management, Inc., the Fund's investment advisor (the "Advisor"), has contractually agreed to waive its fee and/or reimburse expenses through June 30, 2020 so that the Fund's total annual operating expenses (excluding acquired fund fees and expenses, taxes and extraordinary expenses) do not exceed 1.20% for Class A shares. Absent such arrangements, returns would have been lower. This contractual agreement can be amended at any time by agreement of the Fund’s Board of Directors and the Advisor and will terminate automatically in the event of termination of the investment advisory agreement between the Advisor and the Fund. (2) Average modified duration measures a preferred security's sensitivity to interest rates by indicating an approximate percentage of change in a preferred security or preferred security fund's price given a 1% change in interest rates.
(3) The SEC yield is calculated by dividing annualized net investment income per share during a 30-day period by the maximum offering price per share as of the close of that period. SEC yield reflects the rate at which the fund is earning income on its current portfolio of securities. Since certain distributions received by the funds from real estate investment trusts (REITs) may consist of dividend income, return of capital and capital gains, and the character of these distributions cannot be determined until after the end of the year, the SEC yield has been adjusted for the funds that invest significantly in REITs based on estimates of return of capital and capital gains. Subsidized yields reflect fee waivers, without such waivers, yields would be reduced. Unsubsidized yields do not reflect fee waivers in effect. (4) 12-month distribution yield is calculated by adding the fund's trailing 12-month income distributions, and dividing the sum by the fund's most recent month ended NAV. Note that the number of income distributions is based on the fund's distribution payment frequency (i.e., monthly, quarterly or semi-annually) as disclosed in the fund's prospectus. A fund may pay distributions in excess of its net investment company taxable income and, to the extent this occurs, the distribution yield quoted will include a return of capital. Shareholders of record will be notified of the estimated return of capital for each distribution and this information is also available at cohenandsteers.com.
Portfolio Managers
Managing Fund Since
Years of Experience
William Scapell, CFA Inception 27
Elaine Zaharis-Nikas, CFA 2015 21
Total Returns
Excluding Sales
Charge Including Sales
Charge(1)
ICE BofAML Fixed Rate Pfd Sec Index Linked Index(2) S&P 500 Index
QTD 1.24% -2.55% 0.19% 1.11% 7.71%
YTD -1.33% -5.03% 0.23% -0.47% 10.56%
1 Year -0.36% -4.10% 0.67% 0.22% 17.91%
3 Year 5.48% 4.15% 5.47% 5.15% 17.30%
5 Year 6.64% 5.83% 7.11% 6.27% 13.95%
Since Inception (5/3/10) 7.96% 7.47% 6.72% 6.70% 13.46%
(1) Maximum 3.75% sales charge; returns for other share classes will differ due to differing expense structures and sales charges. (2) Linked Index: The blended benchmark consists of 50% ICE BofAML US Capital Securities Index and 50% ICE BofAML Fixed Rate Preferred Securities Index through 12/31/2016. Thereafter, it consists of 60% ICE BofAML US IG Institutional Capital Securities Index, 30% ICE BofAML Core Fixed Rate Preferred Securities Index, and 10% Bloomberg Barclays Developed Market USD Contingent Capital Index. Data quoted represents past performance, which is no guarantee of future results. Performance returns stated net of fees. There is no guarantee that any historical trend illustrated in this report will be repeated in the future, and there is no way to predict when such a trend will begin. There is no guarantee that any market forecast in this report will be realized. Current performance may be lower or higher than the performance quoted. The investment return and the principal value of an investment will fluctuate and shares, when redeemed, may be worth more or less than their original cost. Periods greater than 12 months are annualized. Returns are historical and include change in share price and reinvestment of all distributions. Month-end performance information can be obtained by visiting our website at cohenandsteers.com. There is no guarantee that any investment objective will be achieved. An investor cannot invest directly in an index, and index performance does not reflect the deduction of fees, expenses or taxes. During certain periods presented above, the Advisor waived fees and/or reimbursed expenses. Without this arrangement, performance would be lower.
Sector Diversification
Portfolio weights are subject to change without notice. Due to rounding, values might not add up to 100%. Other includes Brokerage, Cash, Telecommunication Svcs., ETF and Derivatives.
Geographic Diversification
Portfolio weights are subject to change without notice. Due to rounding, values might not add up to 100%.
48% Banking24% Insurance7% Other7% Utilities5% Other Assets3% Real Estate3% Finance3% Pipeline
50% United States12% United Kingdom11% Other7% Japan6% France4% Switzerland3% Canada3% Netherlands3% Australia
The investment objective of the Fund is to seek total return through high current income and capital appreciation by
investing in preferred and debt securities issued by U.S. and non-U.S. companies. Preferred securities are issued by
banks, insurance companies, REITs and other diversified financials as well as utility, energy, pipeline and
telecommunications companies.

Factsheet September 30, 2018
cohenandsteers.com 800 330 7348
OFS10 Q318
Cohen & Steers Preferred Securities and Income Fund
Cohen & Steers is a global
investment manager specializing in
liquid real assets, including real
estate securities, listed infrastructure,
commodities and natural resource
equities, as well as preferred
securities and other income solutions.
Founded in 1986, the firm is
headquartered in New York City, with
offices in London, Hong Kong, Tokyo
and Seattle.
Credit Quality
A- 3% BB- 4%
BBB+ 13% B+ 2%
BBB 10% B 4%
BBB- 32% Not Rated 16%
BB+ 9% Cash 2%
BB 5%
Source: Standard & Poor's. The letter ratings are provided to indicate the proposed credit worthiness of the underlying holdings in the portfolio and generally range from A (highest) to D (lowest). Credit ratings are subject to change. Holdings designated NR are not rated by Standard & Poor's. Ratings do not apply to the Fund's shares.
Top Ten Holdings
Name Sector % of Market Value
General Electric Co 5% 12/29/49 Other Assets 2.2%
Rabobank Nederland NV 11% 12/1/49 Banking 1.8%
JP Morgan 6.75% Banking 1.8%
RBS 8.625 12/29/49 Banking 1.7%
Ally Financial Inc. 8.125% 2/15/40 Pfd. A Financial Services 1.6%
Wells Fargo & Co. 7.98% 2/28/49 Banking 1.6%
Prudential Financial 5.625% 6/15/43 Insurance 1.5%
Enel Spa 8.75% 9/24/73 144A Utility 1.4%
Metlife Inc 9.25% 4/8/2038 144A Insurance 1.4%
BHP Billiton Fin USA 6.75% 10/19/75 Other Assets 1.4%
The mention of specific securities is not a recommendation or solicitation to buy, sell or hold any particular security and should not be relied upon as investment advice. Weights may vary over time and holdings are subject to change without notice. Please consider the investment objectives, risks, charges and expenses of the Fund carefully before investing. A summary prospectus and prospectus containing this and other information may be obtained by visiting cohenandsteers.com or by calling 800 330 7348. Please read the summary prospectus and prospectus carefully before investing.
The ICE BofAML Fixed Rate Preferred Securities Index tracks the performance of fixed-rate US dollar-denominated preferred securities issued in the US domestic market. The ICE BofAML US Capital Securities Index is a subset of The ICE BofAML US Corporate Index including all fixed-to-floating rate, perpetual callable and capital securities. The Bloomberg Barclays Developed USD Contingent Capital Index includes hybrid capital securities in developed markets with explicit equity conversion or write down loss absorption mechanisms that are based on an issuer's regulatory capital ratio or other explicit solvency-based triggers. The ICE BofAML Core Fixed Rate Preferred Securities Index tracks the performance of fixed-rate US dollar-denominated preferred securities issued in the US domestic market. ICE BofAML US IG Institutional Capital Securities Index is a subset of the ICE BofAML US Corporate Index including all fixed-to-floating rate, perpetual callable and capital securities. The S&P 500 Index is an unmanaged index of 500 large-capitalization stocks that is frequently used as a general measure of U.S. stock market performance. An investor cannot invest directly in an index, and index performance does not reflect the deduction of fees, expenses or taxes. Percentages may differ from data in the Fund's financial statements due to the effect of fair value pricing of foreign securities. The fund implements fair value pricing when the daily change in a specific U.S. market index exceeds a predetermined percentage. In the event fair value pricing is implemented on the first day of the period, the fund's return may diverge from the performance of its benchmark, which is not fair valued. This divergence is usually reduced on the day following the implementation of fair value pricing by the fund, as the value of the securities in the index that are held by the fund typically move closer to the fund's fair valued price when the market reopens. This factsheet is provided for informational purposes and is not an offer to purchase or sell Fund shares.
For distribution when preceded or accompanied by a currently effective prospectus.
Cohen & Steers U.S. registered open-end funds are distributed by Cohen & Steers Securities, LLC, and are only available to U.S. residents.
Risks. There are special risks associated with investing in the Fund.
In general, the risks of investing in preferred securities are similar to those of investing in bonds, including credit risk and interest-rate risk. As nearly all preferred securities have issuer call options, call risk and reinvestment risk are also important considerations. In addition, investors face equity-like risks, such as deferral or omission of distributions, subordination to bonds and other more senior debt, and higher corporate governance risks with limited voting rights. An investment in the Fund is subject to investment risk, including the possible loss of the entire principal amount that you invest. The value of these securities, like other investments, may move up or down, sometimes rapidly and unpredictably.
The Fund may invest in below-investment grade securities and unrated securities judged to be below investment-grade by the Advisor. Below-investment-grade securities or equivalent unrated securities generally involve greater volatility of price and risk of loss of income and principal, and may be more susceptible to real or perceived adverse economic and competitive industry conditions than higher-grade securities. The Funds' benchmarks do no contain below investment-grade securities.
NOT FDIC INSURED • MAY LOSE VALUE • NO BANK GUARANTEE • NOT INSURED BY ANY GOVERNMENT AGENCY