Embed Size (px)
Citation preview

A Practical Approach for Power Utilities Seeking to Create Sustaining Business Value with Analytics
The advent of smart meters, intelligent electronic devices and phasor measurement units has generated a wealth of data that can and should be more effectively mined and applied by global utilities to improve their operational performance and market competitiveness.
Cognizant 20-20 Insights | July 2017
COGNIZANT 20-20 INSIGHTS

Cognizant 20-20 Insights
A Practical Approach for Power Utilities Seeking to Create Sustaining Business Value with Analytics | 2
Executive Summary
Amid an aging grid, power utilities are working
feverishly to transform their underlying infra-
structure to adapt to ever-changing market
dynamics and customers’ shifting requirements.
Even as they struggle to replace 60% of their
grid assets over the next decade,1 many utilities
are aggressively embracing smart meters and
alternate renewable energy sources as consum-
ers are becoming more energy conscious and
digitally empowered to gain greater control and
insights from their power consumption.
To sustain growth, industry leaders are focusing
on ways to improve generation performance,
optimize asset performance and longevity,
transform customer operations and continu-
ously boost operational effectiveness. Big data
and analytics are playing pivotal roles in helping
utilities to realize these business imperatives.
Industry research suggests that utilities which
apply customer analytics and big data to their
decision-making are 23 times more likely to out-
perform their competitors compared with those
that do not.2
Excited about the possibilities, many leading util-
ities are implementing stand-alone analytics use
cases and continuing to realize proven benefits.
But most remain skeptical about the large invest-
ments needed to improve their enterprise data
management/analytics capabilities and generate
the highest return on investment (ROI).
This white paper provides utilities decision-mak-
ers with a proven approach for optimizing business
value from analytics programs. A use-case prior-
itization approach coupled with cognizance of
analytics maturity offers clear direction on busi-
ness and technology strategy when building a
use-case implementation roadmap.
In our view, an analytics maturity assessment
remains a critical activity, and the maturity levels
will directly influence the speed of implementa-
tion for use cases. This white paper will detail
how to approach these requirements.
A use-case prioritization approach coupled with cognizance of analytics maturity offers clear direction on business and technology strategy when building a use-case implementation roadmap.
Cognizant 20-20 Insights
A Practical Approach for Power Utilities Seeking to Create Sustaining Business Value with Analytics | 3
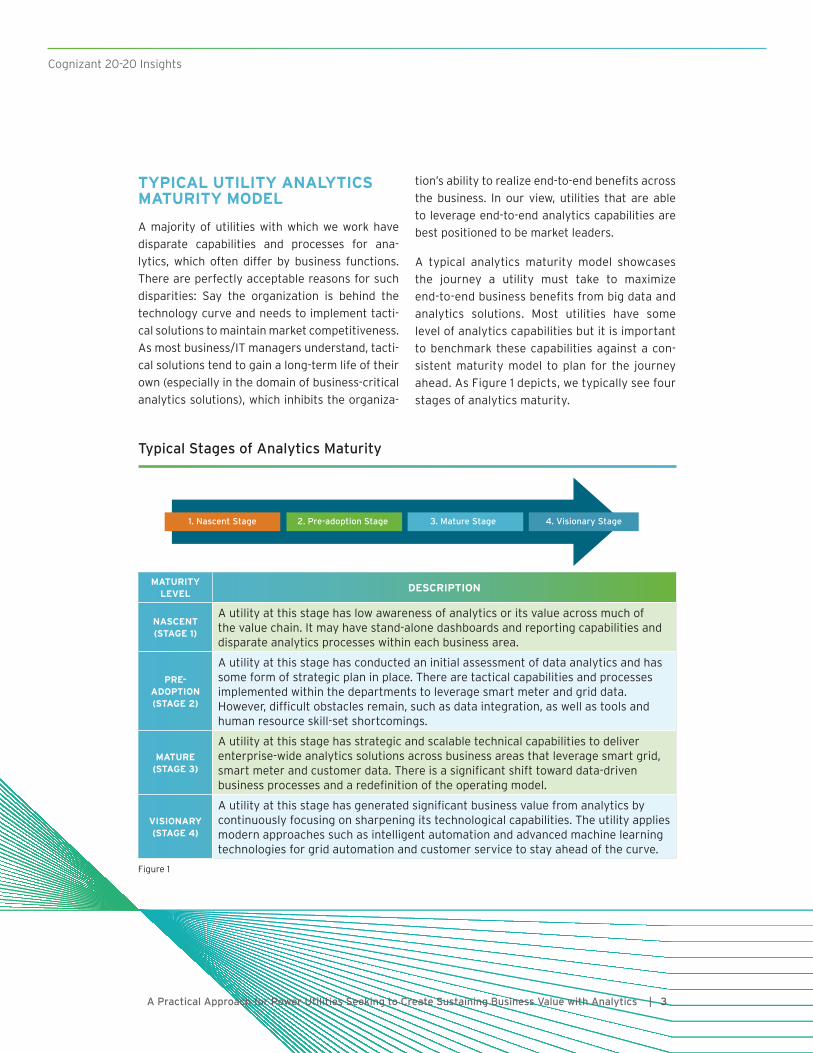
Typical Stages of Analytics Maturity
1. Nascent Stage 2. Pre-adoption Stage
3. Mature Stage 4. Visionary Stage
MATURITY LEVEL
DESCRIPTION
NASCENT(STAGE 1)
A utility at this stage has low awareness of analytics or its value across much of the value chain. It may have stand-alone dashboards and reporting capabilities and disparate analytics processes within each business area.
PRE-ADOPTION(STAGE 2)
A utility at this stage has conducted an initial assessment of data analytics and has some form of strategic plan in place. There are tactical capabilities and processes implemented within the departments to leverage smart meter and grid data. However, difficult obstacles remain, such as data integration, as well as tools and human resource skill-set shortcomings.
MATURE(STAGE 3)
A utility at this stage has strategic and scalable technical capabilities to deliver enterprise-wide analytics solutions across business areas that leverage smart grid, smart meter and customer data. There is a significant shift toward data-driven business processes and a redefinition of the operating model.
VISIONARY(STAGE 4)
A utility at this stage has generated significant business value from analytics by continuously focusing on sharpening its technological capabilities. The utility applies modern approaches such as intelligent automation and advanced machine learning technologies for grid automation and customer service to stay ahead of the curve.
Figure 1
TYPICAL UTILITY ANALYTICS MATURITY MODEL
A majority of utilities with which we work have
disparate capabilities and processes for ana-
lytics, which often differ by business functions.
There are perfectly acceptable reasons for such
disparities: Say the organization is behind the
technology curve and needs to implement tacti-
cal solutions to maintain market competitiveness.
As most business/IT managers understand, tacti-
cal solutions tend to gain a long-term life of their
own (especially in the domain of business-critical
analytics solutions), which inhibits the organiza-
tion’s ability to realize end-to-end benefits across
the business. In our view, utilities that are able
to leverage end-to-end analytics capabilities are
best positioned to be market leaders.
A typical analytics maturity model showcases
the journey a utility must take to maximize
end-to-end business benefits from big data and
analytics solutions. Most utilities have some
level of analytics capabilities but it is important
to benchmark these capabilities against a con-
sistent maturity model to plan for the journey
ahead. As Figure 1 depicts, we typically see four
stages of analytics maturity.

Cognizant 20-20 Insights
A Practical Approach for Power Utilities Seeking to Create Sustaining Business Value with Analytics | 4
Our utility maturity model is based on evaluation
of the parameters illustrated in Figure 2.
Progress across the analytics journey requires
an unrelenting focus on a few critical success
factors that allow the organization to achieve
business benefits irrespective of its current
stage of maturity. It is imperative that organiza-
tions drive home the need to embed these critical
success factors within their in-flight or upcoming
analytics programs.
CRITICAL SUCCESS FACTORS FOR CREATING ANALYTICS PROGRAM VALUE
Successful analytics programs depend on
various factors. For instance, utilities must con-
sider the key success factors enumerated in
Figure 3 to maximize the value generated for
the organization. (Also see the Quick Take that
underscores the importance of these critical
success factors.)
Key Parameters of an Analytics Maturity Model
1B. RegulatoryReadiness
2B. Data Quality
3B. IT Architecture
4B. Decision-Making
5B. In-ProgressCapability
TOWERS SUB-TOWERS
1. Organizational Strategic Alignment/Use Case Approach
2. Data Quality/Governance
3. Technology/Infra/Internal Resource Capability
4. Organizational Culture and Decision-Making Process
5. Analytics Adoption
1A. Analytics Vision &Strategy
2A. Data Strategy
3A. Technology/Tools
4A. Organizational Structure/Ops Model
5A. In-PracticeCapability
1C. CustomerReadiness
2C. Data Governance
3C. IT Infrastructure
4C. Human ResourceSkills/Culture
5C. Near-Future Capability
Figure 2
A Critical Success Factor Framework for Analytics
CLEARLY DEFINED ORGANIZATION VISION AND MISSION
DEFINE ADOPT SELECT IDENTIFY IMPLEMENT
Clear business objectives aligned
to market and organization
drivers.
Data and analytics driven
culture for informed
decision-making.
Right technolo-gy platforms, products and partners for scalability.
Data quality issues and
information integration gaps across systems.
Robust mechanisms for data governance
and analytics ROI calculation.
Figure 3

Cognizant 20-20 Insights
• Define clear business objectives. The ana-
lytics program must be driven by specific
business needs and supported by meaning-
ful and relevant ROI calculations. Utilities’
business priorities vary based on market con-
ditions – such as regulated vs. deregulated
markets. A regulated utility may need to max-
imize its capital expenditures (CapEx), while a
utility operating in a deregulated market may
want to maximize net present value (NPV).
• Adopt a data- and analytics-driven culture.
Creating a culture where data is treated as
an asset is critical. All business units should
leverage cross-functional data and make
use of available tools for all analytics pur-
poses. Quite often, utilities struggle to break
corporate silos and suffer from ineffective
collaboration and substandard analytics tool
adoption.
• Select the right technology platforms,
products and partners. Utilities should
evaluate platforms and technologies that
fit specific business requirements and data
attributes. The platform must be capable of
managing a data deluge, adapt to low latency
and support advanced use cases for real-
time analytics such as phasor measurement
unit (PMU) optimization, micro-grid flexibility
management, etc.
• Identify data quality issues and information
gaps. Data quality is essential to an analytics
implementation strategy. The millions spent
on analytics can be worthless if the underly-
ing data is of low quality. The ideal data set
should be de-duplicated, cleansed, synchro-
nized, enriched and updated.
1
QUICK TAKE
Having the Right Utility Business Objectives A “vertically integrated utility” operating in a regulated market and a
“retailer utility” operating in a “contestable deregulated market” will have
different objectives for utility analytics.
A utility servicing a regulated market would need to create a strong rate
case for utility analytics capital investment, and get it approved by the reg-
ulator by justifying customer and operational benefits. They would likely go
for the big bang approach, with significant investments.
A Practical Approach for Power Utilities Seeking to Create Sustaining Business Value with Analytics | 5

Cognizant 20-20 Insights
A Practical Approach for Power Utilities Seeking to Create Sustaining Business Value with Analytics | 6
QUICK TAKE
Typical Pitfalls When Deploying Analytics Focusing on a critical success factor framework would enable utilities to avoid common
pitfalls when implementing analytics programs. The following are prime examples:
• Lack of clear business objectives:
» One large utility successfully received approvals for CapEx analytics investments. Its
IT team quickly ensured that all the right projects were up and running for data lake
creation and master data governance (MDG). But the business team could not come
up with the right set of prioritized use cases to create expected business value.
• Lack of data & ROI validations:
» One large electricity supplier has implemented multiple smart meter event analyt-
ics applications, only to discover later that the continuously increasing number of
smart meters in the field impacts benefits realization from analytics use cases. This
was due to issues with real-time and batch-oriented data exchange between legacy
systems and the real-time analytics solution, resulting in data inconsistencies and
skewed analytics reports.
• Lack of right technology platforms, products and partners:
» One large utility has selected a market leading analytics tool, only to find out later
that the tool has a minimum data latency of 2-3 seconds, which makes it unsuitable
for real-time analytics use cases.
• Lack of data availability and data-driven cultures:
» One large electricity supplier maintained four databases for different business
units. There were integration issues among the databases and applications due to
poor data quality and duplication of data in different formats across systems. Data
unavailability virtually ruled out the possibility of implementing some high-impact
use cases.
• Lack of data governance:
» One large utility tasted success with its analytics pilot projects. It has kept on adding
additional analytics applications. But later it had to stop using pilot applications on
account of poor data governance. There were no formal roles, processes or tools in
place for managing, making decisions or enforcing how data is defined, changed,
distributed, analyzed or consumed.

A Practical Approach for Power Utilities Seeking to Create Sustaining Business Value with Analytics | 7
• Implement robust mechanisms for measure
and governance. Utilities should establish
an operating model and data governance
mechanism to ensure the success of their
analytics business applications. Data custo-
dianship should rest with the business team.
This includes setting up a governing body,
special data steward roles, processes and pro-
cedures to ensure continuing data quality in
business-as-usual processes.
TYPICAL UTILITY ANALYTICS USE CASES
Defining clear business objectives at a granular
level within an organization’s business areas is
critical to create appropriate analytics use cases.
In most cases, business objectives are influenced
by the use cases that respond to imperatives
drawn from the marketplace, internal efficiency
targets, and/or future investments or trends. The
first step is to identify the business pain points
in each of the business functions and create an
inventory of potential use cases or identify ways
to solve the pain areas by applying analytics (see
Figure 4, next page).
How to Derive Business Value from Analytics
The following examples provide guidance on
the art of use case creation.
• Electricity theft analytics: U.S. utilities
lose 1.5% to 2% of revenue due to electric-
ity theft.3 This means a utility with $1 billion
in revenue loses $15 million to $20 million
annually. Assuming 70% analytics accuracy
to predict the electricity theft events, the
utility could save $10.5 million to $14 million
each year.
• Call center optimization: Reducing customer
call volumes by proactively providing billing
queries and self-service options is a mean-
ingful use case. A reduction in call volumes
further translates into significant money sav-
ings for the utilities by helping them optimize
their labor and overhead costs. Additionally,
an agent-handled customer call costs approxi-
mately 50 times more than using self-service.4
With the advent of smart technologies, utili-
ties are exploring new analytics use cases that
depend on legacy IT foundation systems as refer-
ential data sources. This, coupled with real-time
data streams from smart technologies, would
deliver end-to-end benefits across a utility’s value
chain – such as improved customer experience,
reduced cost to serve, increased up-sell/cross-
sell opportunities and improved brand loyalty.
Many big data use cases are more aspirational,
focusing on real-time analytics solutions.
Utility analytics use cases can be broadly classi-
fied into five categories, based on business areas:
• Customer analytics: Use cases directly
impacting customer processes, experience
and perceived customer value to the utility.
• Grid analytics: Use cases directly impacting
transmission and distribution network opera-
tions including asset management.
Cognizant 20-20 Insights

Cognizant 20-20 Insights
A Practical Approach for Power Utilities Seeking to Create Sustaining Business Value with Analytics | 8
• Advanced metering infrastructure (AMI)
analytics: Use cases leveraging smart meter/
sensors data to improve AMI operations.
• Renewable/distributed energy (RE/DE)
integration analytics: Use cases supporting
virtual power plant (VPP) and nontraditional
generation source integration to the grid.
• Noncore functional analytics: Use cases to
improve noncore functions such as supply
chain management, project management, etc.
High-level use cases identified here can also be
categorized in three value towers (see Figure 5,
page 10):
• Increase revenue potential/plug revenue
leaks.
• Reduce operational expenses/improve opera-
tional efficiency.
• Improve strategic positioning and competitive
edge.
Utilities must create a robust framework to prior-
itize use cases in light of their analytics maturity.
A periodic evaluation of a utility’s analytics
capabilities, with a lens on specific business and
technical areas, is needed to successfully priori-
tize and implement analytics use cases. It is also
important to note that the required analytics
maturity level is heavily dependent on the busi-
ness drivers and value realization targets defined
by various business units within the utility.
Analytics Use Cases Across the Value Chain
Customer Segmentation
Propensity Analytics
Prepay Analytics
Energy Efficiency
Load Forecasting
Social Media Analytics
Lifetime Value Analytics
Billing Analytics
Behavioral Analytics
Credit & Collections
Marketing Analytics
Customer Experience
Competitive Intelligent
CUSTOMERANALYTICS
Trust & Reputation
Tariff modelling
Risk Analytics
AMI Operations
NTL/Theft Analytics
AMI ANALYTICS
Operational Intelligence
Call Center Optimization
Pricing Optimization
Load Research
DR Effectiveness
GENERATION TRANSMISSION DISTRIBUTION RETAIL/CUSTOMER
Predictive Asset Analytics
Power Quality Optimization
Volt/VAR Analytics
Plant Optimization
Renewable Forecast (Wind/Solar)
Inventory Analytics
Fault Optimization Analytics
VPP Optimization
GRID ANALYTICS
Network Monitoring
Asset Performance/health monitoring
PMU Analytics
Field Crew/Work performance
Supply Chain Analytics
Project Management Analytics
Increase revenue potential/ plug-in revenue leaks
Reduce operational expenses/improve operational efficiency
Improve strategic and competitive edge in the marketplace
RE/DE Flexibility Index
Micro Grid Flexibility Index
RE/DE Optimization
PR
ED
ICT
IVE
D
IAG
NO
ST
IC&
OP
TIM
IZE
D
ES
CR
IPT
IVE
Grid Reliability Analytics
Predictive Storm Damage/Outage Analytics
Network Analytics/Simulation
System Planning Analytics
Operations Analytics
EV Optimization
RE/DE ANALYTICS
NONCORE FUNCTIONAL ANALYTICS
VALUE TOWERS
Figure 4

QUICK TAKE
Having the Right Data Quality Utilities traditionally manage multiple legacy systems and databases to
service different departments, which often creates duplicates and unsynchro-
nized data across the organization. These critical information gaps hinder the
utility’s ability to effectively leverage the available data for getting real busi-
ness insights.
QUICK TAKE
Having the Right Mindset: Start Small, Fail Fast It is crucial that utilities have a robust mechanism to continuously innovate and
optimize the analytics models built by running ROI calculations and feasibility
studies. A success mantra here is to adopt a “start small, fail fast” mindset,
thereby keeping time-to-market and cost-effectiveness measures in check.
A periodic evaluation of a utility’s analytics capabilities, with a lens on specific business and technical areas, is needed to successfully prioritize and implement analytics use cases.
Cognizant 20-20 Insights
A Practical Approach for Power Utilities Seeking to Create Sustaining Business Value with Analytics | 9

Cognizant 20-20 Insights
A Practical Approach for Power Utilities Seeking to Create Sustaining Business Value with Analytics | 10
Value Tower 1: Sample Use Cases to Increase Revenue Potential/Plug Revenue Leaks
Analytics Description Associated KPIs Key Business Outcomes
VPP Optimization
• Real-time renewable energy (RE)/DE selection.
• RE/DE revenue impact prediction.
• RE/DE risk analytics.
• Cost of electricity.
• Supply-plan adherence.
• Revenue risk.
• Better grid balancing.
• Low cost of power.
• Improved revenue predictability.
EV Optimization
• Electric vehicle (EV) battery optimization.
• EV demand response (DR) enablement.
• EV charging detection.
• Peak demand.
• DR load curtailment.
• EV charging cost.
• Better demand response.
• Lower EV charging cost.
• Grid stability.
Program Propensity/Effectiveness Analytics
• Evaluate energy efficiency (EE)/DR/demand
side management (DSM) programs.
• Program cost/benefit analysis.
• Design new programs.
• Program enrollment.
• Program participation.
• Program NPV.
• Greater program adoption.
• Achieve program objectives.
• Maximize program NPV.
Value Tower 2: Sample Use Cases to Improve Operational Efficiency/Energy Efficiency
Analytics Description Associated KPIs Key Business Outcomes
Micro Grid Flexibility Analytics
• Real-time grid flexibility index.
• Incentive optimization for RE/DE.
• Pricing vs. flexibility analytics.
• Grid reliability.
• Grid flexibility index.
• RE/DE on-demand
availability.
• Better grid balancing.
• Improved grid reliability.
• Right price incentive for RE/DE.
Renewable Forecast
• Renewable forecast (solar/wind).
• Demand dispatch decision support.• Dispatch plan adherence.
• Revenue risk. • Improved revenue predictability.
• Trading optimization.
Storm Damage Analytics
• Storm path tracking.
• Predictive damage assessment.
• Outage restore optimization.
• Time to restoration.
• Planned vs. unplanned
outages.
• Improved reliability.
• Customer satisfaction.
Value Tower 3: Sample Use Cases to Improve Strategic Positioning and Competitive Edge
Analytics Description Associated KPIs Key Business Outcomes
Competitive Intelligence
• Customer interest in similar products.
• Online performance of competitive products
and services.
• Product success rate.
• Market share.
• Product lifecycle cost.
• Improve product lifecycle.
• Better product design.
Trust and Reputation
• Public image analytics.
• Campaign design/proactive image-building.• Brand perception.
• Brand liking.• Effective public relationship programs.
• Improved customer enrollment.
Social Media Sentiment
• Social media activity and responses.
• Identify & analyze influencers/trends.• Percent positive/negative
impressions.
• Online impressions.
• Effective marketing programs.
• Effective public relations programs.
Figure 5

Cognizant 20-20 Insights
A Practical Approach for Power Utilities Seeking to Create Sustaining Business Value with Analytics | 11
A FRAMEWORK FOR PRIORITIZING USE CASES
Identification of use cases within utilities can lead
business/IT managers to adopt similar types of
business cases with apparently similar business
benefits. This leads to challenges in prioritization,
which is especially true of utility organizations
that are at the initial stages of the analytics
maturity cycle. Use-case prioritization should be
based on business value potential and data/ana-
lytics readiness. To do this, decision-makers must
consider multiple parameters (and their weights)
to derive a quadrant view of different priorities
for analytics use cases.
• Business value potential typically depends
on parameters such as:
» Business strategy alignment: Use cases
should fall in line with overall business
strategy. For example, when the immedi-
ate focus is to improve customer service,
the utility shall prioritize the customer
analytics use cases.
» Volume of customers affected: The cus-
tomer is core to utility operations. The
analytics use case that impacts a large
number of customers should therefore be
prioritized.
» Strategic/top-line/bottom-line impact:
The implementation must bring strate-
gic advantage, revenue enhancement or
reduction in operational expenses.
• Data/analytics readiness depends on param-
eters such as:
» Data quality/availability: Quality of data
is the most important element of a suc-
cessful analytics use case. The higher the
data quality and availability, the easier the
implementation.
» Analytics method complexity: Descrip-
tive analytics is easy to implement.
However, real-time/prescriptive analytics
use cases require diligent model-building
and complex analytics tools.
» Human resource/skill sets: The utility
needs access to human resources with
proven analytics skills. A utility must
develop an internal pool or establish a
strategic partnership with vendors.
Figure 6 reveals the typical framework for priori-
tizing analytics use cases.
The applicability and importance of specific use
cases depends purely on individual business sce-
A Framework for Prioritizing Analytics Use Cases
Business Value
Quick Win
Must Have
Nice to Have
Transformational
Use Case 9 Use Case 4
Use Case 11 Use Case 6
Use Case 12 Use Case 5
Use Case 7
Use Case 8 Use Case 1
Use Case 10 Use Case 3 Use Case 2
High
Low
Low High
Bus
ines
s V
alue
Data/Analytics Readiness
Business Value Potential
Business Strategy Alignment
Volume of Customers Affected
Strategic/Top-Line/Bottom-Line Impact
Data/Analytics Readiness
Data Quality/Availability
Analytics Method Complexity
Human Resource/Skill Set
Sco
re/R
atin
g
Wei
ghti
ng
Sco
re/R
atin
g
Wei
ghti
ng
Figure 6

Cognizant 20-20 Insights
A Practical Approach for Power Utilities Seeking to Create Sustaining Business Value with Analytics | 12
narios. For instance, product/pricing analytics
will provide greater benefit to a deregulated util-
ity compared with a regulated one.
Our suggested prioritization framework provides
the following classification scheme for use cases:
• Must have: Easy-to-build analytics use cases
(e.g., those that require low effort/incremental
investment/little or no data cleansing), which
bring large business benefits to the utility.
• Quick wins: Easy-to-build use cases with low
to medium benefits and which need minimal
efforts for improving data/analytics readiness.
• Transformational: Use cases that are difficult
to build but bring large business benefits to
the utility (e.g., significant effort is required to
improve data/analytics readiness).
• Nice to have: Difficult-to-build use cases
that bring low to medium business benefits
to utilities that need data/analytics readiness
improvement.
Analytics use cases prioritized as “must have”
need to be implemented with immediate effect;
this is where an organization’s inherent and
already established analytics capabilities are
tested. Transformational use cases require a
greater technical focus to improve the data/ana-
lytics capabilities within the organization that
will deliver long-term benefits. Organizations
that combine their use-case prioritization with
clear understanding of their analytics maturity
can make informed decisions when creating a
roadmap for prioritized use cases.
A UTILITY ANALYTICS ROADMAP: CREATING AGILITY REGARDLESS OF MATURITY LEVEL
Utilities can identify analytics use cases, prioritize
them and – based on their organizational matu-
rity – define projects to deliver the must have
and transformational impact. These projects,
if focused on critical success factors discussed
The Trajectory of Analytics Use Cases
Matured In Focus Aspirational
Stage 1
LOW
HIGH
Stage 2 Stage 3 Stage 4
NASCENT VISIONARY
HIGH
LOW
Transformational
Nice to Have
Must Have
Quick Wins
Transformational
Nice to Have
Must Have
Quick Wins
Transformational
Nice to Have
Must Have
Quick Wins Transformational
Nice to Have
Must Have
Quick Wins
Spee
d/Ea
se o
f Im
plem
enta
tion
Analytics – Maturity Levels
Ana
lyti
cs P
rogr
am R
isk
Figure 7
A Practical Approach for Power Utilities Seeking to Create Sustaining Business Value with Analytics | 13
earlier, will deliver the required benefits. But the
challenge in the new-age analytics world is the
speed at which these solutions can be delivered
and how agile or favorable to change these solu-
tions are in today’s digital world.
Smart technologies and the ever-increasing dig-
ital shift has raised the bar on organizational
agility for delivering business change at unprec-
edented speed. Utilities have tried their hand
at a bimodal IT model5 that combines legacy
technologies with new-age, flexible-to-change
technologies, but recent developments indicate
that when it comes to analytics capability, this
model is insufficient.
Two variables are affected by the maturity of an
organization’s analytics capabilities: speed/ease
of implementation and analytics program risk.
Figure 7, previous page, illustrates a roadmap that
organizations typically follow as they traverse
analytics maturity stages and improve on speed/
ease of implementation as well as in reducing
risks that undermine analytics programs.
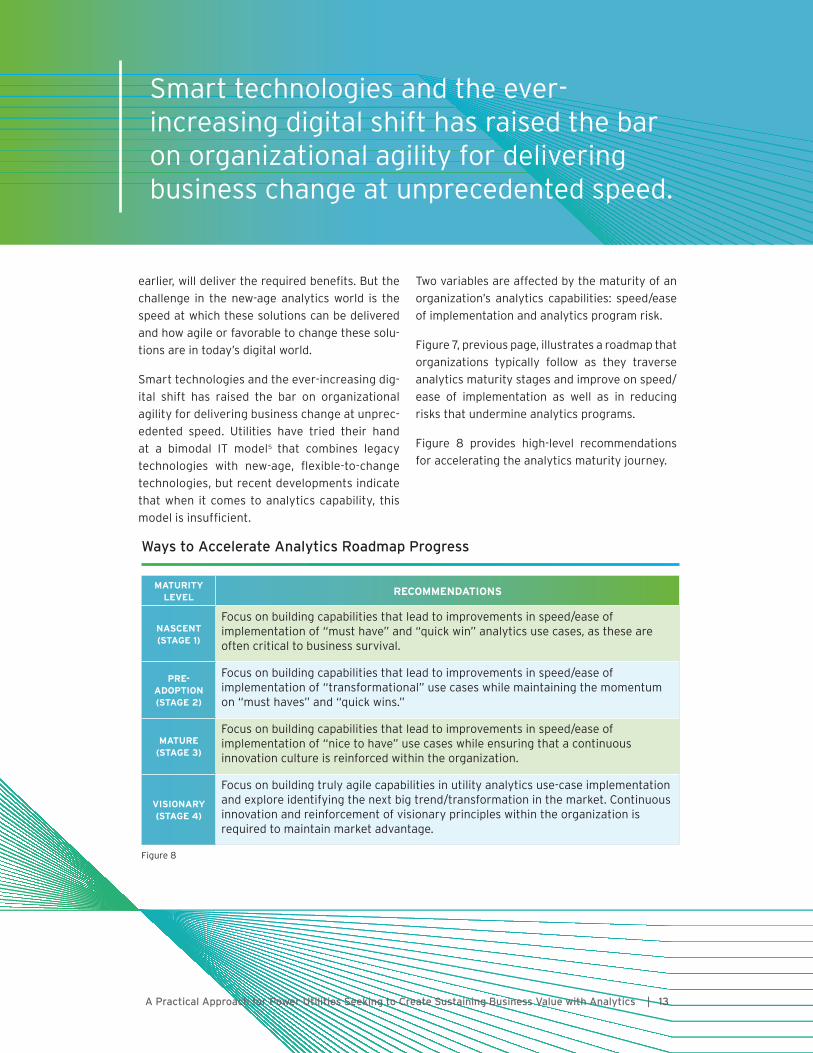
Figure 8 provides high-level recommendations
for accelerating the analytics maturity journey.
Smart technologies and the ever-increasing digital shift has raised the bar on organizational agility for delivering business change at unprecedented speed.
Ways to Accelerate Analytics Roadmap Progress
MATURITY LEVEL
RECOMMENDATIONS
NASCENT(STAGE 1)
Focus on building capabilities that lead to improvements in speed/ease of implementation of “must have” and “quick win” analytics use cases, as these are often critical to business survival.
PRE-ADOPTION(STAGE 2)
Focus on building capabilities that lead to improvements in speed/ease of implementation of “transformational” use cases while maintaining the momentum on “must haves” and “quick wins.”
MATURE(STAGE 3)
Focus on building capabilities that lead to improvements in speed/ease of implementation of “nice to have” use cases while ensuring that a continuous innovation culture is reinforced within the organization.
VISIONARY(STAGE 4)
Focus on building truly agile capabilities in utility analytics use-case implementation and explore identifying the next big trend/transformation in the market. Continuous innovation and reinforcement of visionary principles within the organization is required to maintain market advantage.
Figure 8

Cognizant 20-20 Insights
A Practical Approach for Power Utilities Seeking to Create Sustaining Business Value with Analytics | 14
LOOKING FORWARD
Amid utilities’ increased pressure to transform
and the resultant market disruptions, analytics
will continue to be the key for determining the
future of utilities in both regulated and deregu-
lated markets. Hence, it is crucial for all utilities
to adopt best-in-class analytics strategies in
order to truly maximize their returns.
As in most cases, there is no one-size-fits-all
approach for analytics. Depending on the cur-
rent business and IT landscape, utilities should
adopt a tailored approach that is feasible and
well aligned with their business and organiza-
tional objectives. It is imperative that maturity
model principles and underlying parameters are
revisited every few months (more than annually)
to ensure that the measurement scale is in step
with the latest market trends.
As a starting point, we believe the maturity
model/frameworks provided in this white paper
will be helpful for all utilities to assess their cur-
rent analytics capabilities and enable them to
formulate their future strategy for generating
sustainable business value. As utilities move
forward with their analytics transformation
journeys, we recommend that they:
• Focus on return on investment: Calculat-
ing ROI for analytics investments can be
pretty tricky, especially when implemented
in silos. Hence, organizations need to peri-
odically calculate and measure the tangible
and intangible benefits delivered from all
analytics investments/initiatives. Even more
critical, utilities should carefully assess the
synergies and long-term value derived from
incremental analytics deployments.
• Build strong partnerships and alliances:
In most cases, utilities will struggle to have
enough in-house expertise to effectively
build and scale their analytics capabili-
ties. Therefore, they need a strong partner
ecosystem with a suitable mix of research
institutes, third-party analytics product
vendors, system integrators and consulting
groups.
• Foster a continuous focus on innovation
and growth: The Internet of Things (IoT) and
digital advancements continue to reduce the
barrier of entry for new players and redefine
the role of incumbents. Given this, utilities
can’t be complacent, and should seek to
improve their market position and analytics
maturity level by challenging themselves to
improve, innovate and build newer capabili-
ties/models to help secure future relevance
and stay ahead of the competition.
FOOTNOTES
1 http://www.harriswilliams.com/sites/default/files/industry_reports/ep_td_white_paper_06_10_14_final.pdf
2 http://www.mckinsey.com/business-functions/marketing-and-sales/our-insights/five-facts-how-customer-analyt-
ics-boosts-corporate-performance
3 Rural Electric Magazine, June 2015. http://remagazine.coop/power-theft/
4 http://www.oracle.com/us/products/applications/web-self-service-1897186.pdf
5 http://www.gartner.com/smarterwithgartner/busting-bimodal-myths/

Cognizant 20-20 Insights
A Practical Approach for Power Utilities Seeking to Create Sustaining Business Value with Analytics | 15
Girish K.G Consulting Manager, Energy and Utilities Practice
Vicky Gosar Consulting Manager, Energy and Utilities Practice
Sahil Uppal Senior Consultant, Energy and Utilities Practice
Girish K.G is a Consulting Manager within Cognizant Business Consulting’s Energy
and Utilities Practice. He has 10 years of consulting, plant operations and mainte-
nance experience working with global power utilities. Girish has held client-facing
lead roles in multiple consulting engagements, where he has offered counsel on pro-
cess transformation and business requirements. He is also responsible for developing
Cognizant’s smart offerings and analytics solutions for utilities. Girish has strong
experience in utility analytics, smart grid/metering, asset management, retail and C&I
billing, and complex pricing. He holds a post-graduate degree in management from
Indian Institute of Management. Girish can be reached at [email protected].
The authors wish to thank Asutosh Tripathy, a Senior Consultant within Cognizant’s
Energy and Utilities Practice, for his valuable inputs to this white paper.
Vicky Gosar is a Consulting Manager within Cognizant Business Consulting’s Energy
and Utilities Practice. He has nine years of experience in delivering consulting assign-
ments in the energy and utilities domain, primarily in the UK and Ireland. In recent
years, Vicky has led the development of Cognizant’s smart metering capabilities in
the UK and Ireland, specifically in the areas of smart metering analytics, operations,
infrastructure support and customer-facing delivery processes. He also has extensive
experience in upstream oil and gas operations, electricity balancing and settlements,
enterprise reporting and analytics. Vicky holds a post-graduate degree in industrial
engineering from National Institute of Industrial Engineering (NITIE), India. He can be
reached at [email protected].
Sahil Uppal is a Senior Consultant within Cognizant Business Consulting’s Energy
and Utilities Practice. He has more than eight years of consulting, technology and
project management experience working with global energy and utilities companies.
In recent years, Sahil has played a consulting partner role with large U.S. utilities,
executing multiple consulting/business analysis engagements and providing overall
program oversight. He has strong experience in the areas of AMI/smart grid, asset
management, enterprise analytics and supply chain operations. Sahil holds a global
M.B.A. degree in IT management and consulting from SP School of Global Manage-
ment, Singapore-Sydney-Dubai. He can be reached at [email protected].
ABOUT THE AUTHORS
ACKNOWLEDGMENTS

World Headquarters
500 Frank W. Burr Blvd.Teaneck, NJ 07666 USAPhone: +1 201 801 0233Fax: +1 201 801 0243Toll Free: +1 888 937 3277
European Headquarters
1 Kingdom Street Paddington Central London W2 6BD EnglandPhone: +44 (0) 20 7297 7600 Fax: +44 (0) 20 7121 0102
India Operations Headquarters
#5/535 Old Mahabalipuram RoadOkkiyam Pettai, ThoraipakkamChennai, 600 096 IndiaPhone: +91 (0) 44 4209 6000Fax: +91 (0) 44 4209 6060
© Copyright 2017, Cognizant. All rights reserved. No part of this document may be reproduced, stored in a retrieval system, transmitted in any form or by any means,electronic, mechanical, photocopying, recording, or otherwise, without the express written permission from Cognizant. The information contained herein is subject to change without notice. All other trademarks mentioned herein are the property of their respective owners.
TL Codex 2826
ABOUT COGNIZANT
Cognizant (NASDAQ-100: CTSH) is one of the world’s leading professional services companies, transforming clients’ business, operating and technology models for the digital era. Our unique industry-based, consultative approach helps clients envision, build and run more innova-tive and efficient businesses. Headquartered in the U.S., Cognizant is ranked 205 on the Fortune 500 and is consistently listed among the most admired companies in the world. Learn how Cognizant helps clients lead with digital at www.cognizant.com or follow us @Cognizant.