Embed Size (px)
Citation preview
APPROVED: Gerald A. Knezek, Co-Major Professor Tandra Tyler-Wood, Co-Major Professor William Moen, Committee Member Brian C. O'Connor, Coordinator of the
Information Science Doctoral Program Phillip Turner, Dean of the School of Library
and Information Sciences Sandra L. Terrell, Dean of the Robert B.
Toulouse School of Graduate Studies
COGNITIVE PLAYFULNESS, INNOVATIVENESS, AND BELIEF OF ESSENTIALNESS:
CHARACTERISTICS OF EDUCATORS WHO HAVE THE ABILITY TO MAKE
ENDURING CHANGES IN THE INTEGRATION OF TECHNOLOGY
INTO THE CLASSROOM ENVIRONMENT
Lemoyne Luette Scott Dunn, B.S., M.S.
Dissertation Prepared for the Degree of
DOCTOR OF PHILOSOPHY
UNIVERSITY OF NORTH TEXAS
August 2004
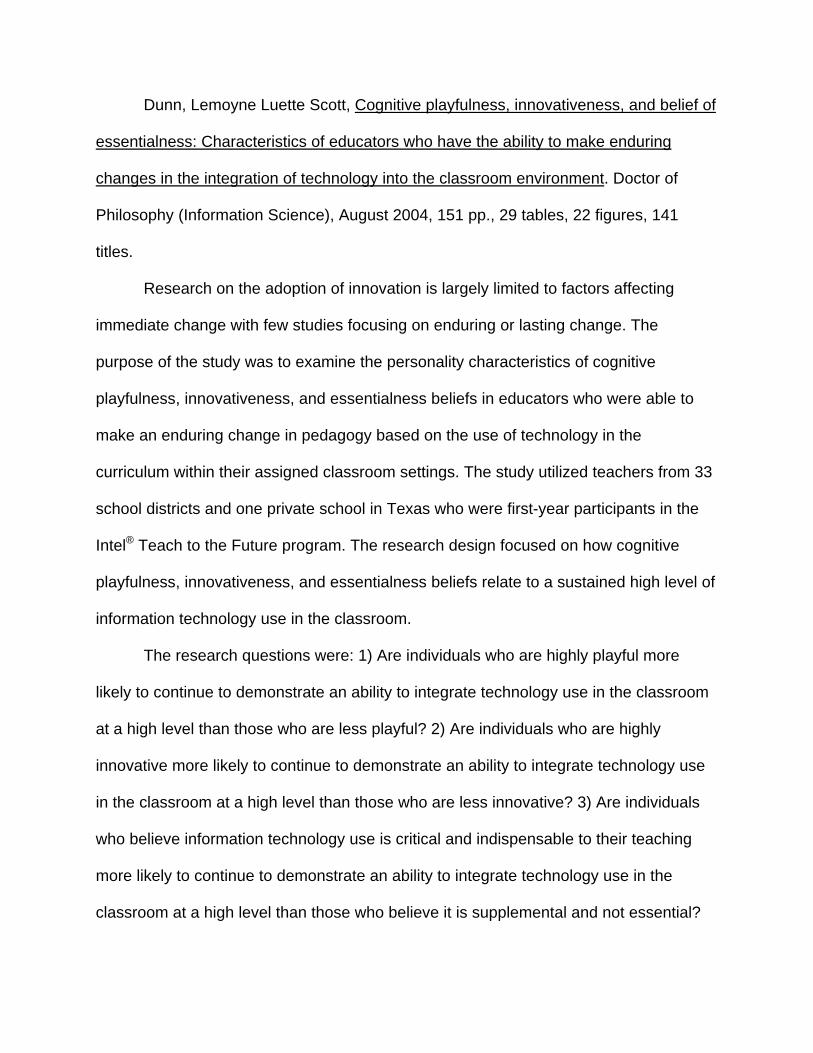
Dunn, Lemoyne Luette Scott, Cognitive playfulness, innovativeness, and belief of
essentialness: Characteristics of educators who have the ability to make enduring
changes in the integration of technology into the classroom environment. Doctor of
Philosophy (Information Science), August 2004, 151 pp., 29 tables, 22 figures, 141
titles.
Research on the adoption of innovation is largely limited to factors affecting
immediate change with few studies focusing on enduring or lasting change. The
purpose of the study was to examine the personality characteristics of cognitive
playfulness, innovativeness, and essentialness beliefs in educators who were able to
make an enduring change in pedagogy based on the use of technology in the
curriculum within their assigned classroom settings. The study utilized teachers from 33
school districts and one private school in Texas who were first-year participants in the
Intel® Teach to the Future program. The research design focused on how cognitive
playfulness, innovativeness, and essentialness beliefs relate to a sustained high level of
information technology use in the classroom.
The research questions were: 1) Are individuals who are highly playful more
likely to continue to demonstrate an ability to integrate technology use in the classroom
at a high level than those who are less playful? 2) Are individuals who are highly
innovative more likely to continue to demonstrate an ability to integrate technology use
in the classroom at a high level than those who are less innovative? 3) Are individuals
who believe information technology use is critical and indispensable to their teaching
more likely to continue to demonstrate an ability to integrate technology use in the
classroom at a high level than those who believe it is supplemental and not essential?
The findings of the current study indicated that playfulness, innovativeness, and
essentialness scores as defined by the scales used were significantly correlated to an
individual's sustained ability to use technology at a high level. Playfulness was related to
the educator's level of innovativeness, as well. Also, educators who believed the use of
technology was critical and indispensable to their instruction were more likely to be able
to demonstrate a sustained high level of technology integration.
Further research is recommended to investigate numerous personality traits,
such as playfulness, innovativeness, creativity, and risk-taking that might relate to
technology adoption. Doing so may lead to modifications of professional development,
assisting individuals in adapting better and faster to systemic change.
ii
ACKNOWLEDGEMENTS
I wish to thank Dr. Gerald Knezek and Dr. Tandra Tyler-Wood, my co-chairs for
their time, guidance, faith, patience, comfort, and assistance. They were always there
for me. I also wish to thank Dr. William Moen for giving of his time to serve on my
committee. I am grateful to Dr. Brian O'Connor and Morgan O'Donnell, as well, for
watching over me from the beginning of the process.
My commendations to the Intel Foundation, the Bill & Melinda Gates Foundation,
and the Texas Telecommunications Infrastructure Fund (TIF) for the generous support
of the programs that gave teachers the opportunity to gain competence and confidence
with technology integration. I would also like to thank the Master Teachers and
Participant Teachers who have assisted in this research in various ways.
Thanks to my many personal friends, family members, and colleagues at the
Texas Center for Educational Technology for supporting my efforts and listening to my
ramblings and babblings. I would especially like to thank Dr. Martha Peet for her special
efforts and faith in me. She remains my most special friend.
I wish to thank our daughters, Sara and Brandi, who were both in college during
the writing of this dissertation, for being proud of my efforts and believing in me. I hope I
have instilled in both of you the value and joy of life-long learning.
My most special thanks go to my loving husband of 30 years, Branon, whose
patience, faith, and support helps me make it through every step of life. One college bill
down, two to go.
And lastly, I give praise to God who gives me every day. May I spend each one
wisely.
iii
TABLE OF CONTENTS
ACKNOWLEDGEMENTS ……………….………………………….………………………… ii
LIST OF TABLES ………………………………………………..………………….………… iv
LIST OF FIGURES ………………………………………………………………………….... vi
CHAPTER 1 INTRODUCTION ………………………………………………………………..1 Problem Statement Purpose of the Study Significance of the Study Theoretical Framework Research Questions Hypotheses Limitations of the Study
Definitions CHAPTER 2 LITERATURE REVIEW. …………………………………………………….. 20 Adoption of Information Technology Historical Adoption Models
Unified Theory of Acceptance and Use of Technology Enduring or Lasting Change Cognitive Playfulness
Innovativeness Essentialness Beliefs CHAPTER 3 METHODOLOGY ……………………………………...…………………….. 49 Introduction Identified Population Identified Sample Hypotheses to be Tested Research Design Pilot Study Instrumentation Data Collection Procedures Data Analysis Procedures Human Subjects Protection CHAPTER 4 FINDINGS …………………………………………………………………….. 76 Introduction Description of Participants Analysis of Hypothesis 1 Analysis of Hypothesis 2 Analysis of Hypothesis 3
Summary
iv
CHAPTER 5 DISCUSSION, CONCLUSIONS, AND RECOMMENDATIONS……...…109 Introduction
Summary of Findings Limitations of the Study Discussion Conclusions Recommendations for Future Study
APPENDIX A UNIT PLAN TEMPLATE ………………………………..……………….…125
APPENDIX B THEORETICAL MODEL ………………………………..………….………127 APPENDIX C SURVEY INSTRUMENT ……………………………….………….………129 APPENDIX D UNIVERSITY OF NORTH TEXAS COMMITTEE FOR
THE PROTECTION OF HUMAN SUBJECTS RESEARCH CONSENT FORM …………………………………………………………..…………………….139
REFERENCES …………………………………………………………………………..….142
v
LIST OF TABLES
Table 1 Scoring Rubric for Levels of Use Instrument - Essentialness Belief Scores ………………….………………..……………..….65
Table 2 Stages of Concern and Levels of Use …………………………………....……….70
Table 3 Stages of Adoption of Technology and ACOT Stages……………...………….. 71
Table 4 Frequencies of Gender of Participants …………………..……………….……….79
Table 5 Statistics of Age, Experience, and Computer Use at Home …..………....……..79
Table 6 Frequencies of Experience …………………………………….…..………...…….80
Table 7 Frequencies of Computer Use at Home …………………………………………..81
Table 8 Frequency of Use of 1st Unit ………………………………..…………...….……..83
Table 9 Statistics of Playfulness, Innovativeness, and Essentialness Scores …...….…86
Table 10 Inconsistent Responses…………………………………………………….……..89
Table 11 Statistics of ACOT Stages and Playfulness Scores ……….……….….…..…..91
Table 12 Correlation of ACOT Stages to Playfulness Scores……………….……………91
Table 13 Means of Playfulness Scores by ACOT Stages ……………………..…....…...92
Table 14 Correlation of Playfulness Scores to Number of Units Made or Modified ….……………….……….. 93
Table 15 Means of Playfulness Scores by Number of Units Made or Modified…...…....94
Table 16 Means of Playfulness Scores (without outlier) by Number of Units Made or Modified ……………………………. 95 Table 17 Pearson Correlation of High Playfulness Scores to
Number of Units Made …………………….…...….... 96
Table 18 Kendall's Tau-b Correlation of High Playfulness Scores to Number of Units Made ………………….………....…96
Table 19 Correlation of Playfulness Scores to Perception of Choice …….…….…….... 97
Table 20 Statistics of ACOT Stages and Innovativeness Scores…..…………….…...... 98
vi
Table 21 Correlation of ACOT Stages to Innovativeness Scores………………...…..….98
Table 22 Means of Innovativeness Scores by ACOT Stages……………………...……..99
Table 23 Correlation of Innovativeness Scores to Playfulness Scores …….……...….100
Table 24 Correlation of Innovativeness Scores to Perception of Choice Scores .…....102
Table 25 Statistics of ACOT Stages and Essentialness Belief Scores..…..………...…103
Table 26 Correlation of ACOT Stages to Essentialness Scores……………..…...….…103
Table 27 Means of Essentialness Beliefs by ACOT Stages………………..……..…….104
Table 28 Essentialness Belief Scores by High or Low ACOT Stages………..……..….105
Table 29 Risk Estimate …………….……………………………………………………….106
vii
LIST OF FIGURES
Figure 1 Response Pattern Assigned LU = 0 ……………………………………………. 59
Figure 2 Response Pattern Assigned LU = 1 ……………………………………………. 60
Figure 3 Response Pattern Assigned LU = 2 ……………………………………………. 61
Figure 4 Response Pattern Assigned LU = 3 ……………………………………….…… 62
Figure 5 Example 1 of Response Pattern Assigned LU = 9 ……………………….……..63
Figure 6 Example 2 of Response Pattern Assigned LU = 9 ……………………………. 64
Figure 7 Example 3 of Response Pattern Assigned LU = 9 ……………………………. 65
Figure 8 ACOT Stages of Technology Integration ……………………………………….. 67
Figure 9 Age Distribution ………………….…………….…………………..…………….…80
Figure 10 Use of Information Technology ………………..……………………………...…81
Figure 11 Usefulness and Ease of Use Distributions …………….……….……....…….. 82
Figure 12 Number of Units Made or Modified ……………..……………..………………. 83
Figure 13 Distributions of Voluntariness (Perception of Choice).... …….……….………84
Figure 14 Distributions of Change in Teaching Style and Value of Essential Questions ………………….…….………85
Figure 15 Distribution of Playfulness Scores ...…………………………….…….……..…87
Figure 16 Distribution of Innovativeness Scores ……………….………….…….……..…87
Figure 17 Distribution of Essentialness Scores ……………...……………….…….…..…89
Figure 18 Distribution of ACOT Stages…………….……..…………………..…….………90
Figure 19 Scatterplot of Playfulness Scores and ACOT Stages …………..…………….92
Figure 20 Scatterplot of Playfulness Scores and Number of Units Made Or Modified ……………………..….…. 94
viii
Figure 21 Scatterplot of Innovativeness Scores and ACOT Stages…………………..…99
Figure 22 Scatterplot of Innovativeness Scores and Playfulness Scores………….…..101
1
CHAPTER 1
INTRODUCTION
Problem Statement
As a result of funding initiatives such as the Telecommunications Infrastructure
Fund (TIF) and the E-rate discounts, general knowledge indicates that most schools in
Texas have:
• At least some computers in almost every classroom
• Internet access in most classrooms
• Some form of productivity software available for student and teacher use
• Most teachers trained in basic technology skills
• Technology integration as one of the goals in the district long-range plan
• Administrators who give at least superficial support for technology integration
Yet many classroom teachers in Texas remain only sporadic users of information
technology. For the purposes of the current study, the term information technology
refers not only to computers, but several other semi-conductor-based tools, such as
personal digital assistants, Smartboards®1, digital cameras, digital video cameras, Web
cams, GPS units, and related peripherals, such as probes, used in the process of
instruction. The focus of the current study was not on the use of particular information
technologies, but the integration of information technologies into the curriculum.
The term “technology integration” holds different meanings for different people.
For some, it is using computers for word processing reports; for others, technology
1 SMART Technologies, Inc., http://www.smarttech.com/
2
integration requires multiple pieces of equipment, software, and Internet access. For the
purposes of the current study, technology integration was defined by the researcher as
a high level of technology use in which information technology is so ubiquitous and
essential to the educational experience that the use of technology as a tool is assumed
and is not the focus of the lesson. In the field of educational technology, technology use
begins to be referred to as technology integration at the point in time when a teacher’s
use of technology in the classroom affects the overall learning environment, shifting the
focus from teacher-directed learning to the use of student-directed, collaborative,
project-based activities, more actively engaging students in the learning process
(Dwyer, Ringstaff, and Sandholtz, 1991; Rieber and Welliver, 1989). Everett Rogers
(1995) coined the word “routinization” to describe such a level of technology adoption.
Rogers defined routinization as the point where use becomes "incorporated into the
regular activities of the organization, and the innovation loses its separate identity"
(1995, p. 399). The innovation becomes simply an integral tool that one selects to
complete a project. Items that have become routinized in the classroom include
pencils/pens, crayons/markers, textbooks, overhead projectors, chalk/whiteboards, etc.
Teachers do not plan lessons based on these items. They simply plan their lessons
and use whatever tool is appropriate to meet the educational objectives. Marcinkiewicz
(1994) defined this level of adoption as the point at which a teacher views information
technologies as not just supplemental but as critical and indispensable to the
instructional process. However, in many classrooms today, the use of information
technology is still used simply to support isolated activities unrelated to a central
instructional theme, concept, or topic (Moersch, 1995). For the purposes of the current
3
study, anything at this level of adoption is considered as technology use and not
technology integration.
Most school districts have technology integration as a targeted objective in their
long-range plan. Yet when questioned, few members of the educational community can
easily communicate what is meant by this phrase. The vagueness of the target may, at
least in part, explain why technology integration remains so elusive. Perhaps someday,
when administrators review their long-range plans and become aware that technology
use is so integrated in the curriculum that listing technology integration as a goal is
inconsequential, true technology integration may be observed.
Purpose of the Study
Much research has been done in business, agriculture, and other fields on the
adoption of innovations, but relatively few innovation adoption studies have been
directed toward the positive factors related to technology adoption in education and
fewer still delve into the aspect of making an enduring change. Two early studies on
innovation adoption, Mort (1953) and Carlson (1965), emphasized innovativeness and
personal networks as key components in adoption rate. While several adoption models
have been developed, the most popular and most quoted is Rogers' Individual
Innovations Theory (1995). Rogers classified people into groups based on their
innovativeness as: 1) Innovators, 2) Early Adopters, 3) Early Majority, 4) Late Majority,
and 5) Laggards and claimed these groups together approximated the standard bell
curve.
The purpose of the study was to examine the personality characteristics of
cognitive playfulness, innovativeness, and essentialness beliefs in educators who were
4
able to make an enduring change in pedagogy based on the usage of technology. The
goal was to develop a theoretical model that, while acknowledging the multitude of
external and internal factors that affect the adoption of any innovation, attempted to
isolate the characteristic of playfulness to explain why some educators routinely
integrate technology into their lessons more often, and at a higher level, than others.
The belief of this researcher was that Innovators are integrating information
technology in their classrooms now at whatever levels their financial and curricular
situations allow. They view technology as an integral part of the lesson and are
constantly encouraging and empowering students and fellow educators to apply
appropriate technologies as tools to enhance learning and problem solving. They have
reached the level of routinization of technology use in the classroom. For the purpose of
the current study, this level of adoption was labeled as enduring change if it had
persisted for three years following the individual's Intel®2 Teach to the Future training
session. This program is discussed in more detail below.
It was also suspected that the Early Adopters and the Early Majority are just
beginning to reach this level, integrating technology into at least one or two projects a
year. However, these projects often still have the technology itself as the target. They
know they are expected to use technology with their students so they often append it to
their lessons more than integrate it into the lesson.
Unfortunately, educational innovations in general have historically shown very
slow adoption rates. According to Rogers (1995), the concept of kindergarten took 50
years to reach complete adoption, driver's education took 18 years and modern math
2 Intel Teach to the Future, www.intel.com/education/teach
5
took 5 years. According to Moore's law (Schaller, 1996), technology makes major
changes (doubles in the number of transistors on a chip) every 18 months. Since
changes not only in technology but also in our lives in general continue to occur at an
unbelievably rapid rate, the educational community will find it difficult to keep up with
these technological changes at the current rate of adoption.
Information technology has become generally ubiquitous in most schools in
Texas and basic technology skills have been taught; yet many educators still do not feel
comfortable utilizing technology as they do other tools in their classroom. The research
questions identify additional factors that may be utilized to help the educational
community manage the rampant changes in technology. Given similar situations, why
do some people fully adopt a new technology when others do not? What personality
factors are most common among classroom teachers who thoroughly adopt the use of
information technology? Is there a relationship between certain personality traits such
as cognitive playfulness, and an individual's full adoption (routinization) of information
technology over an extended period?
Significance of the Study
Technology plays a major role in most facets of life today and continues to
change at an astounding rate. Technological changes mold both culture and society in
immeasurable ways. Research on adoption of innovations is largely limited to the
factors and barriers affecting immediate change. Little research outside the field of
clinical psychology considers factors leading to enduring or lasting change.
Learning implies a change--a change in knowledge, a change in attitude, a
change in belief, or a change in behavior. If the factors involved in the successful
6
generation of enduring or lasting change were better understood, educators might be
able to make use of these factors to extend the positive effects of the lessons they
deliver. Scores of studies, such as those discussed below, relate to the presence of,
effectiveness of, barriers to, the attitudes toward, and the positive and negative effects
of technology use in the classroom.
Some characteristics may prove hard to define, but the value to information
science, education, psychology and many other fields is clear. Determining whether the
critical illusive attribute is spontaneity, creativity, cognitive playfulness, risk-taking,
enthusiasm, cognitive differentiation, or some other factor will require extensive
research. However, if one can determine the qualities integral for routinization of
information technology use in the classroom, perhaps a method for strengthening these
qualities can be developed to assist individuals in dealing with the amazing speed of
change and subsequent modifications of technology usage, which, for the foreseeable
future, seems inevitable.
Theoretical Framework
Over the past two decades, two major models of adoption have been proposed
and repeatedly tested. The Technology Acceptance Model (TAM) designed by Davis
(1989) was proposed to predict the use of an information system. The second theory,
the Theory of Planned Behavior (TPB) (Ajzen, 1985), was designed to predict behavior
in many contexts and has been applied often to the adoption of information systems.
The latter theory, built upon the Theory of Reasoned Action (TRA) (Fishbein and Ajzen,
1975), added the construct of perceived behavioral control. A comparison study of these
models (Mathieson, 1991) found that although both models provided good predictive
7
validity in reference to an individual's intention to use an information system, TAM
slightly outperformed the TPB and TAM was found to be easier to use. The TAM
proposed that perceived usefulness and perceived ease of use, both of which are
determined by external variables, predict an individual's attitude. Davis (1989) also
suggested that this attitude predicts a behavioral intention to use and that this
behavioral intention predicts actual use of the system.
Although both the TAM and the TPB explained much of the variance in an
individual's intention to adopt an innovation, several other major theories incorporated
factors that were not included in either of these two theories. Supported by a significant
body of research in psychology, the Motivational Model (MM) (Deci, 1971; Davis,
Bagozzi, and Warshaw, 1992) applied the motivational theory factors, extrinsic and
intrinsic motivation, to technology adoption. Also based on psychological research, the
Social Cognitive Theory (SCT) (Bandura, 1977) was further extended by Compeau and
Higgins (1995) to explore an individual's use of technology. The Model of PC Utilization
(MPCU) was especially appropriate for predicting an individual's acceptance and use of
technology, as it was designed to predict actual usage instead of just intention to use
(Thompson, Higgins, and Howell, 1991). Moore and Benbasat (1991) adapted Rogers'
(1995) Innovation Diffusion Theory (IDT) to study the adoption of technology
acceptance, including the characteristics of the innovation itself.
In an effort to combine these competing theories into a single unified theory,
Venkatesh, Morris, Davis, and Davis (2003) proposed a composite model based on
eight of the currently utilized models and combinations of those models. The Unified
8
Theory of Acceptance and Use of Technology (UTAUT) theorizes that four constructs --
performance expectancy, effort expectancy, social influence, and facilitating conditions
-- serve as direct determinants of user acceptance and usage behavior. The theory
also predicted that gender, age, experience, and voluntariness of use act as moderating
variables on various numbers of the direct determinants. Venkatesh and his colleagues
suggested that future research should attempt to "test additional boundary conditions of
the model in an attempt to provide an even richer understanding of technology adoption
and usage behavior (Venkatesh et al., 2003, p. 470)." The current study examined the
construct of cognitive playfulness as an additional moderating variable on technology
adoption that was not included in any of the models from which the UTAUT was
composed.
Play is a basic human instinct, easily recognizable but often difficult to define.
Play is evidenced by activities, but the construct itself is more of an attitude than a
display of specific types of activity. Abundant evidence suggests that play is part of the
normal personality (Barnett, 1990, 1991; Lieberman, 1977). Brenner (2001, p.6)
describes play as "the serious things that we do all day merely infused with a playful
spirit." Barnett (1990, 1991) defines play as a predisposition to engage in playful
activities and interactions.
Playfulness is easy to observe in the world around us and comes in many forms,
yet also eludes a clear and concise definition as. Playfulness can be readily observed in
infancy and is a major feature in the lives of young children. It tends to be demonstrated
throughout the teenage years in most individuals, yet many societies begin to view
playfulness as inappropriate somewhere around early adulthood. Csikszentmihalyi
9
(1975) proposed the flow theory as a construct for understanding and studying
playfulness in human interactions with computers. In flow theory, the subjective human-
computer interaction is viewed as playful and exploratory. Playfulness can result in
individual and organizational learning (Lieberman, 1977; Miller, 1973) and creativity
(Csikszentmihalyi, 1975). The playfulness of interest in the current study, while most
likely related to playfulness of children and adolescents, is a more cognitive playfulness,
a characteristic within an individual that causes them to "play" with a problem until the
problem is solved. It was this conception of playfulness as an exploratory, intrinsic,
individual tenacity that was the focus of the current study.
Early research demonstrated that playfulness in the workplace can effect an
individual's perceptions, attitudes, subjective experiences, motivations, and
performance related to work (Csikszentmihalyi, 1975; Lieberman, 1977; Miller, 1973).
Recent research in this area is limited and largely focuses on a group of researchers,
Martocchio, Webster and their colleagues, who developed the parsimonious Adult
Playfulness Scale (APS) and found evidence to support playfulness as a predictor in
microcomputer interactions (Glynn and Webster, 1992). Playfulness was also positively
associated with a positive mood and with personal satisfaction during interactions with
computers. Individuals rated higher in playfulness exhibited higher task evaluations,
involvement, and performance. Glynn and Webster's results suggest the importance of
studying the impact of playfulness in the adoption of information technologies and the
viability of the scale for this purpose.
Several studies in various fields (Hurt, Joseph, and Cook, 1977; Kirton, 1976,
1978; Leavitt and Walton, 1975) have posited innovativeness as a personality trait
10
related to adoption and developed scales attempting to measure innovativeness.
Defined by Hurt et al. (1977) as one's willingness to change, innovativeness was also
proposed by Marcinkiewicz (1993, 1994) as a factor in innovation adoption.
Marcinkiewicz (1994) found that innovativeness was one of the strongest predictors of a
teacher's use of technology.
Marcinkiewicz also categorized teachers' computer use into three levels, non-
use, utilization, and integration using a 4-question Level of Use (LU) assessment tool.
Non-use implies the absence of any use of computers at all for teaching. Teachers who
use technology in the classroom are placed into one of the two remaining groups based
on how expendable they feel technology is to their personal teaching style.
Essentialness beliefs are explored as a possible predictor variable in the current study.
None of the previously discussed instruments explicitly measure an individual's
intrinsic motivation. The specific area of intrinsic motivation of concern not captured by
these instruments was voluntariness (Moore and Benbasat, 1991) or self-determination
(Deci, 1985). The construct of voluntariness represents the degree of freedom of use of
the innovation. If the use is indeed completely voluntary, an individual performs a
certain activity simply because they want to. Self-determination, the degree to which an
individual perceives their use of information technology as voluntary, has shown to
moderate social influences, a direct determinant of intention to use (Venkatesh et al.,
2003). The current study employs self-determination as a categorizing factor on usage
leading to a greater level of adoption and permanence of use. Since gender, age, and
experience have been shown to be moderators in the UTAUT model, demographic

11
information were collected but were not posited to have any significant effect on
adoption level and permanence of use.
12
Research Questions
The following research questions were addressed by the current study:
1. Are individuals who are highly playful more likely to continue to demonstrate an
ability to integrate technology use in the classroom at a high level than those who
are less playful? Studies by Glynn and Webster (1992) found that individuals
rated higher in playfulness exhibited higher task evaluations, involvement, and
performance than those with lower playfulness scores. Playfulness was defined
by Glynn and Webster as being composed of the constructs of cognitive
spontaneity, creativity, expressiveness, fun, and silliness. A sustained high level
of information technology use was demonstrated when information technology
was used over time to empower students, enhance learning, and encourage
problem solving. During the Apple Classroom of Tomorrow (ACOT) project,
Dwyer, Ringstaff, and Sandholtz (1991) identified five evolutionary stages of
technology integration through which individuals progress when learning to use
information technology in the classroom. The first three stages, Entry, Adoption,
and Adaption, focus on skill acquisition and the use of technology to support
existing teaching methods. ACOT stages 4 and 5, Appropriation and Invention,
focus on the ability to integrate technology in a way that result in major
modifications in the way instruction is delivered and the engagement of students
in the learning activities. The ACOT stages are discussed further in the
Instrumentation section of Chapter 3. For the purposes of the current study,
teachers at ACOT stages 4 and 5 were defined as demonstrating the ability to
integrate technology at a high level. This ability to integrate technology at a high
13
level was considered for the purposes of the current study to be sustained if the
level was present three years after the initial Intel Teach to the Future
professional development experience. Creating and delivering lessons that
implement technology to support these higher-level thinking skills requires
creativity, expressiveness, and a sense of fun. Also, due to the uncertainties
involved when using technology, spontaneity would also be useful in those
situations where things do not go exactly as planned. There should be a
significant difference in playfulness scores between educators who are able to
demonstrate a high level of information technology use as an integral part of their
teaching and educators who do not.
2. Are individuals who are highly innovative more likely to continue to demonstrate
an ability to integrate technology use in the classroom at a high level than those
who are less innovative? Using a version of the Innovativeness Scale by Hurt et
al. (1977), Marcinkiewicz (1994) found that innovativeness was one of the
strongest predictors of a teacher's use of technology. Using a similar version of
the same scale, Okolica and Stewart (1996) found a significant relationship
between individual innovativeness and the extent of an individual's use of the
advanced aspects of voice mail. There are not many good examples of high-level
information technology integration in the field of education. A large number of
educators simply use technology to teach the same way they always have but
with different tools, e.g. showing a PowerPoint presentation instead of using
transparencies on the overhead. However, it is likely that the more innovative
educators would be using technology in a more creative, student-centered
14
manner. Therefore, there should be a significant difference in innovativeness
scores between educators who are able to demonstrate a high level of
information technology use in their teaching and educators who cannot.
3. Are individuals who believe that information technology use is critical and
indispensable to their teaching more likely to continue to demonstrate an ability
to integrate technology use in the classroom at a high level than those who
believe that it is supplemental and not essential? Rieber and Welliver (1989)
established the use of the attribute of expendability in their model of instructional
transformation. By categorizing teachers' computer use into three levels -- non-
use, utilization, and integration -- a significant pedagogical transformation can be
identified by an individual’s perceived dependence on technology as essential for
a desired educational experience (Marcinkiewicz, 1993). Individuals who believe
that information technology use in the classroom is both critical and
indispensable should be more likely to demonstrate a high level of information
technology use as an integral part of their teaching than individuals who believe it
to be supplemental and not essential.
Hypotheses
The following null hypotheses were tested:
1. There is no positive relationship between an individual's ability to sustain a high
level of information technology usage as measured by an individual’s Apple
Classroom of Tomorrow (ACOT) stage and the individual's level of cognitive
playfulness as measured by their score on the Adult Playfulness Scale (APS).
15
2. There is no positive relationship between an individual's ability to sustain a high
level of information technology usage as measured by an individual’s ACOT
stage and their level of innovativeness as measured by the individual's score on
Marcinkiewicz’s Innovativeness Scale (IS).
3. There is no positive relationship between an individual's ability to sustain a high
level of information technology usage as measured by an individual’s ACOT
stage and their perception of essentialness of information technology use as
measured by the individual's score on Marcinkiewicz’s 4-question Level of Use
(LU) assessment instrument.
Limitations of the Study
This correlational study utilized classroom teachers from 33 school districts and
one private school in North Central Texas who were first-year participants in a 3-year
educational technology integration grant program, Intel® Teach to the Future. Not all
participants involved in the first year of the program were still available. Some had
moved and several had been promoted to other positions in the district or had taken
jobs in the business sector. Also, since the sample of educators selected represented
only individuals from North Central Texas, the current study may have limited
generalizability to other locations.
Human memory is known to be short and susceptible to modification over time;
therefore, self-report was an issue to the validity of a study such as this. Change
initiation for this group occurred three years ago and memories can become quite vague
after that long. Every attempt was made to add validation support mechanisms to the
study design. Also to be considered is the fact that actual use often deviates slightly
16
from the intended use, but it is a major assumption in this field of study that the
difference can be viewed as non-significant.
Self-report was also an issue particularly when the factors relate to personality.
Research in the field of psychology has long supported a theory of the existence of a
difference between personality and self-concept (Epstein, 1973). This theory suggests
that we develop a view of ourselves early in adulthood that may persist despite actual
changes in our real nature brought on by life experiences. This paradox could certainly
affect the validity of self-reported personality traits.
The constructs in the current study are by their very nature indistinct and difficult
to clearly define. For the purposes of the current study, limitations on their definitions
are applied and the definitions may not necessarily coincide exactly with the definition of
the study participants. Every attempt to clarify constructs with the participants was
made.
Definitions
Cognitive Playfulness -- Operationally defined for the current study, cognitive
playfulness was described as a characteristic within an individual, composed of
cognitive, affective, and behavioral components, that causes the individual to "play" with
a problem until it is solved. A playful individual is apt to have a predisposition to engage
in certain activities in a non-serious or fanciful manner. Playful interactions tend to be
enjoyable, engaging, and not a function of external needs.
Cognitive Spontaneity -- This term represents a key construct of playfulness that
encompasses curiosity, inventiveness, and the need to play with ideas.
17
Critical / Essential -- Information technology is viewed as an integral part of the lesson.
The curricular objective of information technology use is to empower students, enhance
learning, and encourage problem solving.
Enduring Change -- For the purposes of the current study, enduring change was
defined as a change persisting for at least 3 years since the individual's first exposure to
the Intel Teach to the Future program.
Essential Question -- "…provocative questions designed to engage student interest and
guide inquiry into the important ideas in a field of study. Rather than yielding pat
answers, essential questions are intended to stimulate discussion and rethinking over
time" (Wiggins, McTighe, & McTighe, 1998, p. 277). Essential questions are open-
ended, concept-based, universal, and abstract. Essential questions are also multi-
layered, have no one right answer, and may be global enough to serve as a focus for an
entire year's curriculum. Essential questions reside at the top of Bloom's Taxonomy
(Bloom, 1956), requiring students to evaluate, synthesize, and analyze to formulate
meaning from the information gathered.
Information Technology -- The term not only refers to computers but several other semi-
conductor-based tools, such as personal digital assistants, Smartboards®, digital
cameras, digital video cameras, Web cams, GPS units, and related peripherals, such as
probes, used in the process of instruction.
Non-user -- Any educator who uses no information technology in their instruction, but
may or may not use information technology on a limited basis as a productivity or
presentation tool was considered a non-user.
18
Pedagogy -- Pedagogy is the art or science of teaching (SIL International, 1999). The
construct covers a broad range of skills and abilities including essential subject
knowledge, prescriptive methods, use of organizers, and other factors relating to
teaching and learning styles. The element of pedagogy referred to in the current study
was an effortless use of technology beyond simple productivity, such as word
processing of reports. The pedagogy sought included the use of various information
technologies to accomplish a variety of instructional and management goals and the
development of new learning environments that are constructivist-based; that is, where
learning is student-directed.
Routinization -- This term was coined by Rogers (1995, p. 399) as the point where use
becomes "incorporated into the regular activities of the organization, and the innovation
loses its separate identity."
Sustained High-level Technology Integration – Sustained high-level technology
integration is evidenced in the classroom when the use of technology is effortless on the
part of both the teacher and the students. Usage goes beyond simple productivity, such
as word processing of reports. Students are regularly seen using various information
technologies to accomplish a variety of instructional and management goals in learning
environments that are constructivist-based. An ability to integrate technology at a high
level was considered for the purposes of the current study to be sustained if the level
was present three years past the initial professional development experience.
Supplemental/Not essential -- Information technology in the classroom is treated as an
auxiliary activity for the students.
19
Technology Integration -- Technology integration is demonstrated when the use of
technology in the classroom affects the overall learning environment, shifting the focus
from teacher-directed learning to more student-directed, collaborative, project-based
activities, engaging students more actively in the learning process. Technology
integration implies technology use, but on a higher level than simple technology use.
Technology Use -- Any use of computers or other information technology, regardless of
purpose or method of use.
Unit/Unit Plan -- The curriculum of the Intel Teach to the Future program uses the term
unit (or unit plan) to refer to teaching plans that integrate technology into project work in
the classroom (Appendix A). Individuals develop a unit based on a lesson currently
taught with emphasis placed on integrating technology in a way that focuses on
standards-based learning goals, project-based learning, authentic and open-ended
tasks, group work, and performance assessment (Intel Education: Unit & Project Plans,
2004). Although the Intel Teach to the Future curriculum utilizes Microsoft®3 Office
products and the Internet, the focus of that professional development was the support
information technologies can give to the classroom curriculum, not the use of specific
technologies.
3 Microsoft Corporation, www.microsoft.com
20
CHAPTER 2
LITERATURE REVIEW
Adoption of Information Technology
Using theories on the diffusion of innovation discussed below, several
researchers have attempted to develop models related to the integration of information
technology. Daniel Surry (1997) classified these studies as falling into one of two major
categories: Macro and Micro. Macro theorists such as Leonard-Barton and Deschamps
(1988) focused on reforming and restructuring educational institutions and making
systemic changes. Micro theorists, such as Farquhar and Surry (1994), attempted to
increase the adoption and utilization of specific instructional products by a specific set of
potential adopters. The current study addressed enduring changes at the Micro level.
In the theory of Adoption Analysis, Farquhar and Surry further divided the
categories of theories into sub-categories based on the philosophy of technology and
technological change: Technological Determinism (Developer-centered) and
Technological Instrumentalism (Adopter-centered). These philosophies span a
continuum and are based largely on beliefs related to autonomy and continuity.
Determinists view technology as the primary cause of social change occurring in
revolutionary steps, an autonomous force beyond our control. Determinists are
commonly either radically utopian or dystopian. Karl Marx well represents the most
utopian side of this philosophical camp, with George Orwell falling into the latter
category. The Developer-centered (Determinist) theorist believes that diffusion can be
attained solely through the efficiency, effectiveness, and elegance of an innovation
reflecting a build-it-and-they-will-come attitude. Determinists believe that based on
21
superiority alone, a technological product or system will replace inferior products and
systems. Top-down reform is an example of this way of thinking. Hall and Hord (1987)
discussed the reasons behind the failure of many such projects.
Instrumentalists, on the other hand, argue that technology is a powerful force for
change, yet is only a tool. Instrumentalists view social conditions and human aspiration
as the primary causes of change. Also, Instrumentalists consider technological growth
to be a more gradual, evolutionary change. They direct their attention to the human and
interpersonal aspects of the innovation. Instrumentalists often cite the failure of the
Dvoark keyboard, a theoretically superior technological innovation, as an example of the
influence of human factors in the adoption of a new technology. Ernest Burkman (1987)
developed a product utilization theory from an instrumentalist's view insisting that the
opinions, needs, and perceptions of the potential user were of primary importance to the
acceptance of an innovation. Burkman’s User-Oriented Instructional Development
theory also included the idea of post-adoption support. Burkman cited failure to include
this support as one of the primary causes of failure in change attempts. Mehlinger's
(1994) Bottom-Up reform theory and Hall and Hord's (1987) Concerns-Based Adoption
Model (CBAM) are examples of the instrumentalist's attempt at creating a systemic
model, focusing on the point of view of the potential adopters.
Historical Adoption Models
A large number of models in the literature attempt to explain the relationship
between innovations and adoption levels and serve as a launching point for further
related research. Rogers' landmark and often-quoted book, Diffusion of Innovations,
begins with a statement of the common problem, the need for organizations to "speed
22
up the rate of diffusion of an innovation" (Rogers, 1995, p. 1). This is still a problem
faced today if education is going to keep from falling further behind in the application of
technology. Although not concerned with information technology directly, diffusion
theory offers a global framework for the study of innovation adoption.
Rogers' theory lists four major factors that influence the diffusion process: the
qualities of the innovation itself, the communication channels, time, and the nature of
the social system in which the innovation exists. In order to be adopted, the innovation
itself must be perceived as 1) having a relative advantage (being better than the existing
situation), 2) being consistent with the user's existing values, experiences, and needs,
3) easy to understand and use, 4) easy to try out, and 5) easily observable. The
adoption of information technology in the classroom may fail in many of these areas
because 1) information technology is expensive compared to the classic methods that
appear to work, 2) it often requires a radical systemic change on the part of educators,
3) technology has a very distinctive vocabulary and appears to require specialists to
keep it running, 4) the often prohibitive costs make teachers fear that if they have
availability of technology they will be expected to use it, and 5) teaching is a closed-door
profession that often makes successful use of technology hard to view. Despite all of
these barriers, some teachers in some schools still succeed in fully integrating
technology into their curriculum.
The successful integration of information technology often can be attributed to
the communication channels available to the individual. Communication channels can
range from the team teacher next door to formal professional development to formal
post-graduate education. Thanks to advanced communication techniques, such as
23
email and the Internet, and a plethora of online educational opportunities, most
educators now have the ability to attain almost any knowledge they desire. Yet only a
few teachers search it out. Certainly most educators understand the value of education.
The question was why do some continually strive to grow and others stay in their
comfort zone.
A common reason given by teachers for the lack of technology integration in their
classrooms is a perceived shortage of time. Often the people who seek out new
experiences and knowledge opportunities are individuals who make the time when there
is adequate personal value associated with the effort. Also, at the speed at which
technological innovations are occurring today, there is little time to adopt a new
technology before it is replaced by a newer technology.
Another issue is the nature of the social system in which the educator exists.
Some school environments are much more conducive to innovation, experimentation,
and risk taking than others. Some have a lock-step curriculum where teachers are
forced to cover certain topics on certain days using certain methods. It is doubtful that
teachers in those situations are fully integrating technology in their classrooms.
However, in schools that encourage innovation, there are still educators who hesitate
and others who refuse to budge out of their rut.
The only remaining factors to be found are individual differences in people. The
Innovation Decision Process Theory (also referred to as Innovation Diffusion Theory)
posited by Rogers (1995) asserts that in the process of adopting an innovation, people
go through five distinct stages: Knowledge, Persuasion, Decision, Implementation, and
24
Confirmation. The question remains how to get educators to move through these stages
more quickly.
Geoffrey Moore (1991) modified Rogers' theory slightly by suggesting that there
are actually cracks in the bell curve that vary in width. Moore proposed that the variance
in the width of these cracks was due to the group members' psychographic profiles.
Psychographic profiles are the combination of psychology and demographics that affect
the adoption profiles of the groups. Moore categorized each group as follows:
• Innovators are techno-centric, fascinated with any fundamental change in
technology. Members of this group must accept the innovation before the
adoption will proceed to the other groups. Innovators tend to score higher on risk
taking and adventure seeking and also generally tend to rank higher on
education and wealth than individuals in other groups.
• Early Adopters are not technologists, but they can see the value of an innovation
as it relates to fulfillment of a personal or professional need. They often adopt an
innovation based on intuition rather than on referrals from other people.
• Members of the Early Majority are extremely practical and want many others
actively using the innovation before they adopt it. The innovation must be easy
for these people to adopt. These traits cause the relatively large gap between the
Early Majority and the Early Adopters.
• Members of the Late Majority wait until the usage of the innovation is well
established by a significant group of others. These individuals need much
support and tend to buy from large, well-established companies.
• Laggards don't want anything to do with the innovation.
25
The purpose of the study was to examine the personality characteristics of
cognitive playfulness, innovativeness, and essentialness beliefs in educators who were
able to make an enduring change in pedagogy based on the usage of technology. It is
hoped that later studies can attempt to determine if cognitive playfulness can be
modified to boost an individual's innovativeness (move them to the next adoption group
faster or narrow the "chasm" of Moore's model) and make the changes last.
The last three decades have produced a number of integrated theories with roots
in psychology, sociology, and management information systems that include various
psychological traits as well as situational variables. For reviews see Dillon and Morris,
1996; Venkatesh et al (2003). The Theory of Reasoned Action (TRA) was an early
model by Fishbein and Ajzen (1975). Based in social psychology, this theory uses
measurements of an individual's attitude toward performing a given behavior and
subjective norms concerning this behavior. The TRA has been used to attempt to
predict a broad range of intentions and behaviors. It is important to note that Fishbein
and Ajzen suggested that attitudes are formed by both cognitive and affective
components. This delineation is significant in differentiating between perceived
usefulness and intrinsic motivators discussed later. Subjective norms represent
perceptions of how others who are important to individuals expect the individual to
behave. The TRA proved to be exceptionally robust and offered extraordinary predictive
validity even outside of the original boundary conditions of the theory. See Sheppard,
Hartwick, and Warshaw (1988) for a more complete review of this theory.
Based on the TRA, Ajzen (1985) proposed the Theory of Planned Behavior
(TPB), adding perceived behavioral control as an additional predictive determinant of
26
intention and behavior. This additional construct, a factor also found within the
perceived ease of use (Davis, 1989), is similar to the psychological construct of locus of
control focusing on internal and external constraints on behavior (Taylor and Todd,
1995) and to self-efficacy (Bandura, 1977). Ajzen (1991) presented a review of several
studies that utilized TPB in a variety of settings as support for his model.
Davis (1989) posited the Technology Acceptance Model (TAM), a parsimonious
model also based on the TRA, by excluding the social norm construct arguing that the
impact of social norm is context driven (Davis et al., 1992). Davis and his colleagues
believed that the technology use involved in their study was of a personal and individual
nature and not likely to be affected by social influences. The TAM originally included
only the constructs of perceived usefulness and perceived ease of use. Perceived
usefulness was defined in TAM as the degree to which a person believes that use of the
system will enhance his or her performance and ease of use is defined as the degree to
which a person believes that use of the system will be free from effort (Davis, 1989).
The user's attitude was defined as feelings of favorableness or unfavorableness toward
the system. Although research consistently shows that behavioral intention is the
strongest predictor of actual use (Ajzen, 1991; Davis, Bagozzi, and Warshaw, 1989;
Knezek, Christensen, Hancock, and Shoho, 2000; Taylor and Todd, 1995), in the case
of mandatory settings subjective norms were shown to have an impact on behavioral
intention and usage and therefore were added back in as additional predictors in a
modified version of the TAM.
In addition to the removal of social norms as a factor, the original TAM displays
other major differences from the TRA. First, TAM suggests an extremely strong direct
27
relationship between perceived usefulness and behavioral intention. TAM also posits
perceived ease of use as both a direct effect on behavioral attitude and an indirect
effect through perceived usefulness (Davis, 1989) although these relationships were not
found to be as strong as the direct relationship between perceived usefulness and
behavioral attitude. In his study, Davis (1989) reported a shared variance (R2) of
between .47 (time 1) and .51 (time 2) when using TAM as a predictor of behavioral
intention. These variances compare to .32 and .26, respectively, for the TRA. TAM has
proven to be robust in several studies (Adams, Nelson, and Todd, 1992; Agarwal and
Prasad, 1998; Keil, Beranek, and Konsynski, 1995; Mathieson, 1991; Venkatesh and
Morris, 2000). Adams et al. (1992) found the effects of both perceived usefulness and
perceived ease of use may change over time through prolonged use of the technology.
Although several studies have attempted to determine the antecedents of perceived
usefulness and perceived ease of use (Karahanna and Straub, 1999; Venkatesh and
Davis, 1996), concern for the antecedents was beyond the scope and tangential to the
objectives of the present study.
The Model of PC Utilization (MPCU) (Thompson et al., 1991) adapted from the
work of Trandis (1971) included the constructs of job-fit, complexity, long-term
consequences, and facilitating conditions in addition to social factors. The goal of the
MPCU was to predict actual behavior, not behavioral intention, in the context of
personal computer (PC) use by knowledge workers in an optional use environment.
Job-fit and complexity are constructs very similar to perceived ease of use as described
by Davis (1989) and long-term consequences related very closely to perceived
usefulness. The findings of Thompson et al. confirmed the effects of social factors,
28
complexity, job-fit, and long-term consequences on PC use but contrary to other
studies, failed to find evidence that affect and facilitating conditions influenced PC use.
Around the same time, Moore and Benbasat (1991) were modifying Rogers
(1995) Innovation Diffusion Theory (IDT) to study individual technology acceptance by
adding the constructs of voluntariness and image to Roger's variables of relative
advantage, compatibility, complexity, observability, and trialability. Image was defined
as the degree to which use of an innovation is perceived to enhance one's image or
status in one's social system (Moore and Benbasat, 1991). Rogers’ (1995) included
image as part of relative advantage. Image also demonstrated strong similarities to
parts of the constructs of perceived usefulness and social factors. Perceived
voluntariness, the degree to which use of the innovation is perceived as being voluntary,
or of free will, was also considered a necessary factor and found to be more than a
binary variable. Although this approach to the study of adoption focused largely on the
perceptions of the technology itself provides a strong context and an excellent general
theory, it offers little explicit treatment of the personality constructs involved in adoption.
The field of psychology supplies a significant body of research to support the
value of extrinsic and intrinsic motivation in the prediction of an individuals' behavior
with several motivational models. Vallerand (1997) provided a reasonably
comprehensive review of this theoretical foundation. Research on motivation has been
approached over several decades from a number of theoretical perspectives (Freud,
1962; Hull, 1943; Skinner, 1953). Originally conceived as a one-dimensional construct,
motivation is currently viewed as multi-dimensional, divided primarily between extrinsic
and intrinsic motivations (Deci, 1971, 1975). An individual is said to be extrinsically
29
motivated when their behavior occurs as a means to an alternate end, rather than for
the sake of result of the behavior itself (Deci, 1975). Although research continues in an
attempt to further identify and sub-divide the construct of extrinsic motivation, for the
purposes of the current study, extrinsic motivators are considered to be factored in
through Davis' (1989) construct of Usefulness and therefore included in the model.
The individual's characteristic that focuses on the enjoyment of the behavior itself
and not the final product is termed intrinsic motivation (Davis et al., 1992; Deci, 1975;
Igbaria, Parasuraman, and Baroudi, 1996). Previous research found individuals who are
high in intrinsic motivation tend to show more creativity (Amabile, 1996), grasp concepts
better (Grolnick and Ryan, 1987), and tend to retain the material longer (Conti, Amabile,
and Pollak, 1995). Individuals who reported high intrinsic motivation were also found to
be more persistent and showed a preference for novel and difficult tasks (Gottfried,
1990). Lasting changes in behavior often require a higher level of creativity, persistence,
and a preference for novel and difficult tasks, thus implying that intrinsic motivation may
prove to be a major factor in the permanence of an individual's adoption of an
innovation. Research in the area of playfulness as discussed below (Webster and
Martocchio, 1992) found that the usage of technology might be stimulated by intrinsic
enjoyment and fun.
Compeau and Higgins (1995) modified a landmark psychological theory on
behavior, the Social Cognitive Theory (SCT) (Bandura, 1986) to predict technology use
behavior. The new model was developed to test the influence of computer self-efficacy,
outcome expectations, affect, and anxiety on computer usage. The results of a second,
longitudinal study (Compeau, Higgins, and Huff, 1999) strengthened the original
30
findings by demonstrating continuing predictive capability of self-efficacy and
performance-related outcome expectations. Self-efficacy also was found to be a
significant predictor of affect, anxiety, and use at the end of the year-long study. Taking
into account direct and indirect effects, self-efficacy explained 18% of the variance in an
individual's use of technology (total effect = 0.43).
Unified Theory of Acceptance and Use of Technology
Recently, Venkatesh et al. (2003) developed a model unifying 25 constructs from
the major existing theories in a continuing attempt to better predict intention to use and
actual usage of technology. The Unified Theory of Acceptance and Use of Technology
(UTAUT) contains four key constructs: performance expectancy, effort expectancy,
social influence, and facilitating conditions. Four modifying variables -- gender, age,
experience, and voluntariness -- mediate the various core constructs.
Performance expectancy defined by Venkatesh et al. (2003, p. 447) as "the
degree to which an individual believes that using the system will help him or her better
attain significant rewards" is found in almost all adoption models and is the strongest
predictor of intention, significant in both mandatory and voluntary settings. As supported
by previous research, Venkatesh's construct, developed from the constructs of
perceived usefulness (TAM and TPB), extrinsic motivation (from several psychological
models), job-fit (MPCU), relative advantage (IDT), and outcome expectations (SCT),
demonstrated a good model for predicting behavioral intention.
Effort expectancy, the degree of ease of use of the system, is founded on the
constructs of perceived ease of use (TAM), complexity (MPCU), and ease of use (IDT).
Although effort expectancy is significant at the beginning in both mandatory and
31
voluntary settings, it becomes non-significant over periods of extended use (Agarwal
and Prasad, 1998; Davis et al., 1989; Thompson et al., 1991). The effect of effort
expectancy was found to be stronger on women, older workers, and individuals with
limited experience. Because the effect of effort expectancy was found to diminish with
experience and the participants' first known exposure to information technology was
over 3 years ago, effort expectancy should not be highly significant in the determination
of an individual's behavioral intention in the current study.
Social influence is defined as the degree to which an individual perceives that
important others believe he or she should use a new system (Fishbein and Ajzen,
1975). Similar to the constructs of subjective norm (TRA, the modified version of TAM,
and TPB), social factors (MPCU) and image (IDT), the construct of social influence has
been found to be significant only in situations of mandatory use (Venkatesh et al.,
2003). Even in mandatory situations, social influence appears to become non-significant
over time due to experience with the system (Venkatesh and Davis, 2000). Like effort
expectancy, due to the extended length of time since the participants' first known
exposure to information technology, social influences should not be highly significant in
the determination of an individual's behavioral intention in the current study.
Facilitating conditions, the degree to which an individual believes that
organizational and technical infrastructures exist to support the use of the system
(Venkatesh et al., 2003), have historically been considered by educators as major
barriers to usage of information technology. The construct of facilitating conditions in the
UTAUT model was formed from perceived behavioral control (TPB), facilitating
conditions (MPCU), and compatibility (IDT) and refers to the various barriers to usage.
32
Venkatesh (2000) found that effort expectancy fully mediated the effect of facilitating
conditions on intention. Therefore, if performance expectancy and effort expectancy are
taken into account, facilitating conditions are not expected to be highly significant in
predicting intention.
The UTAUT model proved robust, predicting 70% of the shared variance
(adjusted R2) in usage intention with four main effects and four moderators (Venkatesh
et al., 2003). The real question now becomes, what is it about some educators that,
despite all the possible barriers to using information technology in their classrooms,
drives them to treat technology as critical and indispensable to the instructional process.
While individuals’ past experiences with information technology may flavor their
opinions, some educators have bad experiences and still go back and try it again. Why
do some educators have this tenacity? Individual characteristics appear to be the only
remaining variable that may explain variances in technology usage.
Enduring or Lasting Change
Many individuals make changes in their lives only to revert back to their original
behaviors a short time later. Yet, a certain number of individuals succeed in making an
enduring change. A search of the literature found that the use of the terms enduring,
lasting, long-term, and longitudinal is relative and varies from a few hours to decades
depending on the topic being studied. However, when the search was limited to the
fields of education and personality studies, a large number of longitudinal studies ran for
a period of 3 years (Fuligni and Witkow, 2004; McGinnis, Kramer, and Watanabe, 1998;
van Leeuwen, de Fruyt, and Mervielde, 2004). Therefore, for the purposes of the current
33
study, an enduring change in pedagogy was defined as an ability to use information
technology at a high-level in the classroom that has persisted for at least 3 years.
Research, primarily found in the field of clinical psychology, has shown that
certain characteristics must be present in order for change to endure. Kottler (2001)
found that in order for change to endure, it must be internalized by the individual and be
significant enough to alter the individual's behavior. Kottler observed that lasting change
required certain factors of personality and interpersonal style. According to Kottler, the
best predictor of lasting change is self-efficacy, the confidence in your ability to reach
and maintain your goal. Self-efficacy, discussed in more detail below, is subsumed in
the UTAUT construct of effort expectancy.
Most theories of innovation adoption discussed earlier include attitudes toward
information technology in one form or another as a large factor in determining an
individual's level of technology adoption. Few explored individual differences in much
detail other than the standard demographic factors, such as age and gender. Agarwal
and Prasad (1999) defined individual differences as any dissimilarity across individuals,
such as personality, demographic, and situational variables. The current study focused
on the personality trait of cognitive playfulness, its composite factors, and its
relationship to the depth and endurance of an individual's ability to use information
technology in the classroom at a high level.
Cognitive Playfulness
The difficulty of defining playfulness has frustrated researchers for decades and
even led some researchers to suggest that the category of playfulness is so vague that
it should be dropped altogether as a category for research (Berlyne, 1969). Huizinga
34
(1955, originally published 1938) highlighted the importance of play as an essential
prerequisite and characteristic of social interaction. Freud (1962, originally published in
1923) made reference to play as an expression of personality patterns and internal
desires. Piagetian theories of child development view play as a window into a child's
mind (Piaget, 1951).
Interest in the construct of play is not new and types of play have been organized
in many ways. Piaget (1951) posited the following categories of play:
• Practice play is an individual activity in which functions or activities are
performed simply for the intrinsic value of the activity. It was this form of
play that was the focus of the current study.
• Symbolic play involves make-believe activities and representations of
absent objects. Symbolic play may contain essentials of practice play, but
practice play is never symbolic.
• Games with arbitrary rules that are imposed by agreement of the players.
Practice play often includes repetition of activities, often in apparently aimless
ways, in order to test the limits of a newfound ability or object. Miller (1973, p. 92)
termed this activity "galumphing" meaning "patterned, voluntary elaboration or
complication of process, where the pattern is not under the dominant control of goals."
Miller used this term to describe the attention a two-year old gives to a new object or the
focus of an adult who buys a new camera and "plays with" the knobs and controls for an
extensive period of time. There is often "deliberate complication" (Piaget, 1951) in this
kind of play, as in selecting not to read the manual or instructions. These activities are
seldom efficient or focused on a specific task. The process becomes play when it is the
35
process itself that is interesting. Huizinga (1955) maintained that play could be very
serious if the act of doing was clearly rewarding and encouraged repetition of the
activity.
There are three general approaches to defining play (Barnett, 1991). Early
studies of play (Piaget, 1951) focused on observable categories of behavior that
conformed to specific behavioral definitions and have been criticized a great deal in the
literature for using a simplistic view of play and for lacking statistical robustness
generated by observational inconsistencies. The second approach examined the play
context or physical environment describing the characteristics that are likely to
encourage playful behaviors. The situation-specific nature of this approach brought to
question its validity as a descriptor of an individual's playful nature.
The third and most commonly used approach in the current literature defined
play as a psychological predisposition or set that serves to note its occurrence and to
distinguish it from other genres of behavior, thus putting the focus on the individual and
not the physical context (Barnett, 1991). The philosophy of psychological predisposition
employed by Lieberman (1966, 1977), Singer and Rummo (1973), and other
contemporary researchers was the approach to the study of play in the current
research.
Play is easily evidenced by activities, but the construct itself is more of an attitude
than any given activity. Barnett (1990, 1991) defined the construct as a predisposition to
engage in playful activities and interactions, and suggested that there exists a more
general playful personality trait or style that is independent from situational contexts and
tasks. Until the mid-90s, most of the research on playfulness studied children (Papert,
36
1980; Piaget, 1951) substantiating the presence of play in infancy and confirming the
construct as a major feature in the lives of young children. Play tends to continue to be
demonstrated throughout the teenage years in most individuals, yet many societies
begin to view play as inappropriate somewhere around early adulthood. However,
Cattell (1979) has shown that characteristics of preschool children's playful tendencies
are also distributed across many adult personality factors.
Playfulness is easy to observe in the world around us and comes in many forms,
yet also eludes a clear and concise definition. A substantial body of evidence suggests
that play is part of the normal personality (Barnett, 1990, 1991; Lieberman, 1977).
Lieberman (1966) was among the first to postulate the construct of playfulness in
children as a trait and to focus on the child instead of the setting. Lieberman’s work
served as the foundation for many of the studies discussed below. Lieberman defined
five components of the quality of playfulness in children: cognitive spontaneity, social
spontaneity, physical spontaneity, manifest joy, and sense of humor. From these five
constructs, Lieberman developed the Children's Playfulness Scale (CPS). Barnett and
Kleiber (1982) replicated Lieberman's work and confirmed the five playfulness factors
with preschool children, but noted that the components of playfulness were mediated by
gender, intelligence, divergent-thinking ability, and home environment. The instrument
was revised and proved to be fairly robust with alpha coefficients from .70 to .87 for the
five component factors and .77 to .80 for the scale as a whole (Barnett, 1991).
Lieberman (1977) extended her own work to adolescents and found additional forms of
playfulness such as horseplay, a large range of social activities, hostile wit, and hurtful
pranks.
37
Singer and Rummo (1973) studied classroom behaviors of students in
Kindergarten and labeled one of the behaviors as playfulness. The attributes that
loaded significantly on this construct were similar to those found by Lieberman:
imaginativeness, humorous and playful attitude, emotional expressiveness, novelty
seeking, curiosity, openness, and communicativeness. The playfulness quality was
found to be significantly but only moderately stable over a 1-year period, perhaps
suggesting that students were convinced very early that school is not play, it is work.
Csikszentmihalyi (1975) proposed the flow theory and it has proved to be useful
as a construct for understanding and studying playfulness in human interactions with
computers. In flow theory, the subjective human-computer interaction is viewed as
playful and exploratory. According to flow theory, flow states occur during optimal and
enjoyable experiences in which we feel "in control of our actions, masters of our own
fate…we feel a sense of exhilaration, a deep sense of enjoyment" (Csikszentmihalyi,
1990, p. 3). In order to experience a flow state, the activity must challenge the individual
enough to encourage playful, exploratory behaviors, without being beyond their
capabilities (Webster, Trevino, and Ryan, 1993). If the activity is too challenging, anxiety
will result. If the activity is not challenging enough, the individual becomes bored.
Woszczynski, Roth, and Segars (2002) suggested that playfulness was actually divided
into observable playful behaviors and a latent variable referred to as flow state.
Research characterized flow state as a self-reinforcing optimal experience
(Csikszentmihalyi, 1975) that can cause users to become so absorbed that they lose
track of time and individuals who enjoy an activity will probably want to repeat it.
Research on flow state adds credence to the belief that playfulness may be a factor in
38
an individual's adoption of an innovation. Trevino and Webster (1992) suggested four
factors of flow in relation to computer interactions: a sense of control over the
interaction, a heightened state of cognitive curiosity about the interaction, an intrinsic
interest in the interaction, and a perception of focus on the interaction.
Although playfulness is a multifaceted construct existing on multiple levels, the
current study focused on cognitive playfulness as an individual trait. In agreement with
Glynn and Webster (1992), the current study proposed that a playful individual has a
predisposition to engage in certain activities in a non-serious or fanciful manner.
Starbuck and Webster (1991) suggested that immediate pleasure and involvement in
the activity were major factors in the definition of playfulness. Both of these concepts
relate directly to the concept of flow discussed above in which Csikszentmihalyi (1975)
suggested that playful interactions tend to be enjoyable, engaging, and not a function of
external needs. Glynn and Webster (1992) posited that playfulness included cognitive,
affective, and behavioral components. Barnett (1991) held that individuals who scored
high in playfulness tended to be guided by internal motivation and self-imposed goals,
tended to disregard externally-imposed rules, and tended to be an active participant.
Playfulness was found to be positively correlated with such personality characteristics
as an individual's intrinsic motivational orientation and innovative attitudes (Glynn and
Webster, 1993).
The playfulness of interest in the current study, while most likely related to
playfulness of children and adolescents, was more specifically a cognitive playfulness, a
characteristic within an individual that causes them to "play" with a problem until the
39
problem is solved. It was this conception of cognitive playfulness as an exploratory,
intrinsic, individual characteristic that was the focus of the current study.
Play and work have long been considered a dichotomy (Kabanoff, 1980)
although play and work may actually be points on a continuum. Although many people
use the word play to refer to taking part in leisure activities outside of work hours, an
overabundance of phrases permeates our language and strongly suggests several
different meanings for the word play. Terms such as play along with, play both ends
against the middle, play catch-up ball, play down, played out, play for time, play into
someone's hands, play one's cards right, and play up are just a few examples of
colloquialisms using the word play while referring to aspects of work. Hiemstra (1983)
reported that employees often use the word play in reference to computer interactions.
Anecdotal evidence suggested that this use of the word play might be quite common.
Early research demonstrated that playfulness in the workplace can affect an
individual's perceptions, attitudes, subjective experiences, motivations, and
performance related to work (Csikszentmihalyi, 1975; Lieberman, 1977; Miller, 1973).
Carroll and Mack (1984) suggested that individuals with a capacity to treat work as play
tend to be successful adult learners and problem solvers. Playfulness can result in
increased individual and organizational learning (Lieberman, 1977; Miller, 1973) and
creativity (Csikszentmihalyi, 1975). Recent research in this area is limited, and largely
focuses on the group of researchers, Martocchio, Webster and their colleagues, who
studied what they referred to rather interchangeably in various articles as both
microcomputer playfulness and cognitive playfulness (Glynn and Webster, 1992, 1993;
Martocchio, 1992; Martocchio and Webster, 1992; Webster and Martocchio, 1992,
40
1993; Webster et al., 1993). Through various studies, the same researchers developed
the Adult Playfulness Scale (APS) and found evidence to support playfulness as a
predictor in microcomputer interactions (Glynn and Webster, 1992). Playfulness was
also positively associated with a positive mood and with personal satisfaction during
interactions with computers. Individuals rated higher in playfulness exhibited higher task
evaluations, involvement, and performance. Simply labeling work as "play" caused
younger employees to demonstrate higher motivation to learn and to perform better on
an objective test (Webster and Martocchio, 1993). The differences were not found when
the task was labeled "work."
There are several possible positive outcomes of playfulness at work. A playful
response is a creative one that develops an individual's flexibility (Ellis, 1973). More
effective learning caused by higher motivation may result in higher quality output, more
organizational creativity, and greater individual and corporate flexibility (Levy, 1983;
Miller, 1973; Starbuck and Webster, 1991; Webster and Martocchio, 1993) making the
organization more adaptable to change.
Several negative outcomes are also possible. Playfulness is not appropriate in all
situations and should not be encouraged where speed is essential. Playfulness may
waste time if the best procedure is already known. Webster and Martocchio (1992)
suggested that future research is needed to determine the extent to which playfulness
represents an important ingredient to adaptability.
Webster et al. (1993) found that curiosity and intrinsic interest appeared to be
highly interdependent in interactions with computers and that these factors encouraged
repetition of use of the technology. Curiosity and intrinsic interest are so interdependent
41
that Webster and her colleagues went so far as to suggest that they might be treated as
a single dimension when studying flow. High intrinsic motivation has also been
associated with a tendency to lose track of time (Conti, 2001). The positive subjective
experience associated with the flow state has been shown to be a significant predictor
in the performance of an activity (Csikszentmihalyi, 1975). This particular type of
intrinsic interest was described as that which accompanies cognitive arousal and use of
the imagination.
Personality characteristics such as playfulness and intrinsic motivation exist on
multiple levels. An individual can exhibit a given characteristic on a global level that is
demonstrated in their general personality across time and situations, a contextual level
pertaining to a certain life domain or role, or a state level determined by a transient
current situation. According to Vallerand (2000), there is a top-down effect of an
individual's intrinsic motivation at each of these hierarchical levels. An individual who is
highly intrinsically motivated at the global or personality level is likely to demonstrate a
high level of intrinsic motivation at both the contextual and situational levels. Because of
Vallerand's findings, for the purpose of the current study playfulness and intrinsic
motivation were measured as traits at the global level.
Vallerand and Bissonnette (1992) and Vallerand (2000) subdivided intrinsic
motivation into three more specific constructs: the need to know, the need to
accomplish, and the need to experience the stimulation. These terms more clearly
define the elements of the construct of intrinsic motivation that drives some individuals
to perform certain behaviors with a tenacity not necessarily shared with their peers or
co-workers. Vallerand and Bissonnette's proposed constructs lend clarification to the
42
exploration of cognitive curiosity and the desire to attain competence with the
technology (Webster et al., 1993). Individuals with playful dispositions appear to be
guided more by internal motivation, self-imposed goals, a focus on pretense and non-
literality, a freedom from externally-imposed rules, and active involvement (Rubin, Fein,
and Vandenberg, 1983). Studies suggest that intrinsic motivation fosters experiential
involvement. Individuals who are highly intrinsically motivated tend to experience
activities as pleasurable and interesting and therefore tend to pursue the activities as an
end unto themselves (Wild, Kuiken, and Schopflocher, 1995). Highly-motivated
individuals would be expected to show more tenacity in their interactions with
technology.
The perception of focus on the interaction found in individuals in the flow state
often results in a modification of their perception of time passage. The terms cognitive
absorption (Roche and McConkey, 1990; Tellegen and Atkinson, 1974), cognitive
engagement (Webster and Ho, 1997), and openness to experience (McCrae and Costa,
1983) have much in common with this focused condition, also often resulting in an
individual "losing track of time." The trait of cognitive absorption reflects a readiness to
engage in experiential, non-instrumental functioning (Wild et al., 1995). Non-
instrumental functioning -- performing an activity with no particular purpose, goal, or
direction -- corresponds closely to the definition of cognitive playfulness. Vallerand
(1997) proposed cognitive absorption as a situational intrinsic motivator. Agarwal and
Karahanna (2000) viewed cognitive absorption as composed of the four dimensions of
flow (Trevino and Webster, 1992), playfulness (Webster and Martocchio, 1992), and
43
ease of use (Davis, 1989). Cognitive engagement (Webster and Ho, 1997) is defined as
flow without the notion of control.
Cognitive spontaneity is a construct found in early studies by Lieberman (1977).
Cognitive spontaneity represents a key construct of playfulness that encompasses
curiosity, inventiveness, and the need to play with ideas. Although cognitive spontaneity
is the basis for the cognitive component of playfulness, it does not address the
emotional or social qualities of play. Cognitive spontaneity and cognitive playfulness are
often used synonymously (Martocchio and Webster, 1992).
The construct of creativity is common in many studies of playfulness (Amabile,
1988; Lieberman, 1977). A large body of research on creativity reveals that creativity
requires persistence and energy. Both of these characteristics would seem to be
required for an individual to reach a high level of technology integration in the
classroom. The paradox of the relationship of creativity to playfulness is that creativity is
often demonstrated in response to a need (Amabile, 1988) and individuals who score
high on playfulness often disregard needs (Miller, 1973).
A few studies (Anthony, Clarke, and Anderson, 2000; Holt and Crocker, 2000)
have utilized Costa’s NEO Five Factor model incorporating five dimensions of
personality: neuroticism, extroversion, openness, agreeableness, and
conscientiousness (Costa and McCrae, 1992). Individuals with a lower openness rating
tended to avoid unfamiliar situations including the highly unstable environment of
technology. Individuals who rated higher on openness tended to be more
unconventional and more open to broader and more innovative experiences using novel
cues to draw inferences about the state of the world around them. These are the risk-
44
takers. Openness appears to be a multi-dimensional construct (Wild et al., 1995) that
remains a promising area for future research.
A large body of research is available on risk taking and risk perception, mostly
related to negative connotations, and was outside the scope of this paper. However, a
limited survey of pertinent studies found that intolerance for ambiguity significantly
related to the concern about the dangers of technology and that both desire for control
and ambiguity intolerance were significant factors in an individual’s risk perception
(Myers, Henderson-King, and Henderson-King, 1997). Risk perception, risk taking, and
risk aversion appeared to exist in a self-fulfilling loop. Individuals who are more willing to
take risks did so more often. Individuals who took risks and succeeded were more
willing to do so the next time based on the amount of psychological, emotional, or
physical value resulting from the success. Individuals who failed were less likely to take
risks again based on the amount of damage caused by the failure.
Locus of control refers to one's perception of their ability to control the external
events of their world (Presno, 1998). Individuals with an external sense of control
believe that individuals external to themselves, such as supervisors or higher
management, have control over situations and an individual is unable to enact change
because of this perceived lack of control. Self-efficacy, closely related to the construct of
locus of control, represents a belief in one's personal abilities. Albert Bandura
introduced the construct as a central concept of his Social Cognitive Theory (Bandura,
1977). A number of studies exist correlating the effects of both global and domain-
specific self-efficacy to behaviors (Bandura, 1995). In a recent study on the relationship
between computer self-efficacy and outcome expectancy, Compeau et al. (1999) found
45
that outcome expectancy as a result of self-efficacy had an impact on how individuals
feel about technology and their resultant uses of technology. An individual's self-efficacy
level reflects a sense of control over the environment and can enhance or impede
motivation (Schwarzer, Mueller, and Greenglass, 1999). Positive self-efficacy, often
colloquially labeled a can-do attitude, has a positive impact on motivation.
Woszczynski et al. (2002) proposed that playfulness in computer interactions
was a result of an individual's openness to experience and their emotional stability
under stressful conditions. The possibility that self-efficacy, risk perception, and
tolerance for ambiguity are related to openness and emotional stability may indicate that
self-efficacy, risk perception, and tolerance for ambiguity may be measures of an
individual's level of playfulness. This cyclical line of thought opens an interesting area
for future research.
Innovativeness
Research in the mid-1970s produced several attempts at defining the construct
of innovativeness and developing an instrument with which to measure it. Despite a lack
of support from previous literature on the value of pursuing the concept of
innovativeness as a global trait not directly related to rate of adoption or the number of
innovations adopted from a given list, Leavitt and Walton (1975) believed attempting to
predict adoption behavior would be valuable to the marketing community. Based on
their survey of previous research, Leavitt and Walton (1975, p. 549) defined an
innovative individual as an individual who is "open to new experiences and often goes
out of his way to experience different and novel stimuli particularly of the meaningful
sort." The reliability of their scale was determined to be quite high and the results of the
46
study indicated a moderate degree of independence for the construct of innovativeness.
Using this scale, Craig and Ginter (1975) determined seven factors: concern for
wastefulness, social desirability, novelty seeking, risk aversion, style consciousness,
satisfaction with the status quo, and other directedness. A study by Irani (2000)
confirmed these factors, suggesting that early adopters may be intrinsically motivated to
adopt a new technological innovation, ignoring minor disadvantages and risks. Skinner
(1996) found that the need for uniqueness, somewhat related to novelty seeking, was
also substantially correlated to innovativeness.
Kirton (1976) proposed an adaption-innovation continuum related to an
individual's preferred cognitive strategies for dealing with change. Kirton considered an
individual's position on the adaption-innovation scale as a style, stable across time and
situations, with links to certain personality traits (Kirton, 1989). Kirton found three factors
related to variations in innovation: originality (the number of ideas that individuals
generate), efficiency (coping with tasks in systematic and precise ways), and rule-group
conformity (preference to operate within rules and structures). Using the social and
cultural dimensions of Kirton's scale as a foundation, Oner (2000) determined that
among Turkish adults, innovativeness was encouraged within the context of work,
science, and technology, but it was not preferred within the family and interpersonal
relationships. This small study involved a group with strong cultural traditions, but the
effect of social context on innovation adoption remains a promising field for future study.
Marcinkiewicz (1993) found that innovativeness was a strong predictor of a
teacher's use of technology. Innovativeness, defined by Hurt, Joseph, and Cook (1977)
as one's willingness to change, contrasts with earlier definitions of innovativeness that
47
focused on the speed at which one adopts (Rogers and Shoemaker, 1971). For the
purposes of the current study, the focus was on a sustained high level of adoption and
not the rate of adoption. Innovative attitudes were also found to be positively correlated
to playfulness (Glynn and Webster, 1993).
More recently, Parasuraman (2000) posited the construct of technology
readiness and developed a scale composed of four components related to opinions
about technology: optimism (a positive view of technology), innovativeness (a tendency
to be a technology pioneer and thought leader), discomfort (perceived lack of control
over technology), and insecurity (distrust of technology and skepticism about its ability
to work properly). Parasuraman believed these factors moderated the relationships in
TAM. According to Yi, Tung, and Wu (2003), individuals ranking high in technology
innovativeness have a stronger intrinsic motivation to use new technologies and enjoy
the stimulation related to the process of experimentation. According to Yi, Tung, and
Wu's findings, both optimism and innovation moderate perceived usefulness and
behavioral intention, but neither interacts with perceived ease of use, suggesting that for
more innovative individuals, perceived usefulness becomes less of a factor in adoption.
Essentialness Beliefs
The use of the attribute of expendability was established by Rieber and Welliver
(1989) in their model of instructional transformation to describe the continuum of
teacher involvement with technology. Initial exposure to technology includes becoming
familiar with the technology (familiarization). The teacher then begins to use the
technology in the classroom (utilization). As technology use becomes critical to the
teacher’s style of delivery (integration), the teacher becomes more aware of the
48
changes in their role as teacher. At that point, the teacher begins to readjust the
student-teacher-computer relationship (reorientation). When this relationship has been
optimized, the teacher enters the final level (evolution) and continues to improve
instruction through the systematic implementation of information technology.
Marcinkiewicz (1993) inverted the attribute of expendability to develop the
construct of essentialness. Marcinkiewicz categorized teachers' computer use into three
levels -- non-use, utilization, and integration -- using a forced-choice, 4-question Level
of Use (LU) assessment tool. Non-use implies the absence of any use of computers at
all for teaching. Teachers who use technology in the classroom are placed into one of
the two remaining groups based on how expendable they feel technology is to their
personal teaching style. The teacher must decide if they feel the use of instructional
technology is critical and indispensable to their instruction or if the use of instructional
technology is supplemental and not essential.
49
CHAPTER 3
METHODOLOGY
Introduction
This correlational study focused on the personality characteristics of cognitive
playfulness, innovativeness, and essentialness beliefs in PK-12 Texas educators who
were able to make an enduring change in pedagogy based on the use of technology in
the curriculum. The goal was to develop a theoretical model that, while acknowledging
the multitude of external and internal factors that affect the adoption of any innovation,
attempted to isolate the characteristic of playfulness to explain why some educators
routinely integrate technology into their lessons more often and at a higher level than
others. The conditions required for innovation adoption found in previous research were
organized into one or more of three broad categories. The first category included
variables regarding values and risks, such as an individual's beliefs about the value of
information technology, the role of the educator, and society's expectations. It also
included the individual's concerns regarding self-image, possible damage to or misuse
of the equipment, and lack of time. The second category included personal skills from
the individual's past experiences and education, both formal and informal, and their
perceptions of external support. The third category, which was the focus of the current
study, included intrinsic motivational factors such as the individual's personality
characteristics of cognitive playfulness, innovativeness, and an individual's
essentialness beliefs. The proposed model in found in Appendix B. Based on existing
research, the constructs of cognitive spontaneity, expressiveness, fun, creativity, and
50
silliness form the factors of playfulness. Cognitive playfulness may have either a direct
or an indirect effect on the probability of an individual's making an enduring change.
This chapter covers the following topics: identified population, identified sample,
research hypotheses, research design, pilot study, instrumentation, data collection
procedures, data analysis procedures, and human subjects protection.
Identified Population
The population for the current study was public and private PK-12 teachers in
Texas who participated in the Intel® Teach to the Future program. This international
program, funded by grants from the Intel Foundation and by the Bill & Melinda Gates
Foundation, began in January 2000 and with a replication grant from the Texas
Telecommunications Infrastructure Fund (TIF), continued through December 2003.
Through additional support from the Intel Foundation, the program remains funded
through December 2004. The University of North Texas (UNT) continues to serve as
one of the two Regional Training Agencies (RTAs) for Texas, supporting school districts
and private schools in north and west Texas. The RTA at Texas A&M University
supports south and east Texas districts. It is estimated that by December 31, 2003,
approximately 40,000 Texas teachers had participated in this program and that number
continues to grow.
Intel and the Institute of Computer Technology (ICT) trained Senior Trainers
(STs) in the delivery of the 40-hour Intel Teach to the Future curriculum. More
information about the Intel Teach to the Future program and curriculum can be found at
www.intel.com/education/teach. The curriculum, written by ICT and pilot tested through
the Intel Applying Computers in Education (ACE) program, focuses on thematic unit
51
development including technology integration and the educational concept of essential
questions. Essential questions are "…provocative questions designed to engage
student interest and guide inquiry into the important ideas in a field of study. Rather than
yielding pat answers, essential questions are intended to stimulate discussion and
rethinking over time" (Wiggins, McTighe, & McTighe, 1998, p. 277). In addition,
essential questions are open-ended, concept-based, universal, and abstract. Moreover,
essential questions are multi-layered, have no one right answer, and may be global
enough to serve as a focus for an entire year's curriculum. Essential questions also
reside at the top of Bloom's Taxonomy (Bloom, 1956), requiring students to evaluate,
synthesize, and analyze to make meaning from the information gathered. For more
information on essential questions see Wiggins, McTighe, and McTighe (1998).
Essential questions form the foundation of the Intel Teach to the Future unit plan
around which the 40-hour curriculum is built. The curriculum of the Intel Teach to the
Future program uses the term unit (or unit plan) to refer to teaching plans that integrate
technology into project work in the classroom (Appendix A). Individuals develop a unit
based on a lesson currently taught with emphasis placed on integrating technology in a
way that focuses on standards-based learning goals, project-based learning, authentic
and open-ended tasks, group work, and performance assessment (Intel Education: Unit
& Project Plans, 2004). Although the project is PC-based using Microsoft® Office
products, the format is flexible enough to use with any platform or productivity software.
Little of the curriculum addresses hardware or software training. The focus of the 40-
hour curriculum is project-based learning, integrating technology where appropriate.
52
Identified Sample
Participants in the correlational study were classroom teachers from 33 school
districts and one private school in north central Texas who were selected to be 1st-year
Participant Teachers in a 3-year information technology grant program, Intel® Teach to
the Future. Districts involved in the first year of the study included districts of almost all
sizes (extremely small to extremely large) in rural, suburban, and urban settings. A
private school also participated in the first year of the study. Participating teachers, who
represented a wide variety of grade levels and teaching fields, were required to have
basic technology skills and access to classroom technology in order to participate in the
program. While this was not a statistically random selection of teachers throughout the
state, it does reflect a broad demographic scope. Because these districts self-selected
to participate in the first year of program, it is recognized that the results of the current
study are only generalizable to other participants in this program and may be limited to
only first year participants. First-year participants were chosen in order to maximize the
demonstration of enduring change evidenced over a 3-year period.
Intel Senior Trainers trained and certified 100 selected teachers from the area
served by the University of North Texas (UNT) RTA as Intel Master Teachers (MTs)
during the summer of 2000. The Master Teachers were each expected to deliver the
same training to 20 classroom teachers, called Participant Teachers (PTs), in their own
districts during the following school year. As would be expected, not all MTs had full
classes of 20. The total number of first-year PTs was 1,748. Of these, 31 contact
records contained no email addresses. Many of the remaining email addresses were no
longer valid. Although it was estimated that approximately 1,500 of the emails would still
53
reach the Participant Teachers, this estimate proved to be high. Two attempts were
made to locate valid email addresses for all emails that bounced.
Using the Participant Teachers from the Intel Teach to the Future program was
expected to provide a relatively normally-distributed sample based on the teacher's level
of adoption and assured that participants not only had the basic technology skills but
had also been exposed to methods for technology integration into the curriculum. It also
assumed that they had at least some access to the technology and the Internet in their
classrooms, as this was a requirement for participation in the grant. Martin, Gersick,
Nudell, and McMillan-Culp (2002) found that 78% of the teachers completing the Intel
Teach to the Future training implemented their unit in their classroom that same year.
This fact demonstrated the teachers' ability to integrate technology into their curriculum,
but did not in itself demonstrate enduring change. Instead, the teacher's current ability
to use technology at a high level in the classroom approximately three years after their
initial training was used to demonstrate enduring change.
Hypotheses to be Tested
The following null hypotheses were tested:
1. There is no positive relationship between an individual's ability to sustain a high
level of information technology usage as measured by an individual’s Apple
Classroom of Tomorrow (ACOT) stage and the individual's level of cognitive
playfulness as measured by their score on the Adult Playfulness Scale (APS).
2. There is no positive relationship between an individual's ability to sustain a high
level of information technology usage as measured by an individual’s ACOT
54
stage and their level of innovativeness as measured by the individual's score on
Marcinkiewicz’s Innovativeness Scale (IS).
3. There is no positive relationship between an individual's ability to sustain a high
level of information technology usage as measured by an individual’s ACOT
stage and their perception of essentialness of information technology use as
measured by the individual's score on Marcinkiewicz’s 4-question Level of Use
(LU) assessment instrument.
Research Design
Due to the exploratory nature of the current study, correlations (Pearson and
Kendall tau-b) and descriptive statistics were used to investigate relationships between
the predictor variables and the criterion variable. No joint effects of the predictor
variables were hypothesized.
The predictor variables were playfulness, innovativeness, and essentialness
beliefs. The criterion variable was a sustained ability to use information technology at a
high-level in the classroom as evidenced by the individual's ACOT stage using the
Apple Classroom of Tomorrow Stages of Technology Integration.
Pilot Study
A pilot study was conducted by sending emails containing the instrument URL to
the second-year Master Teachers and requesting them to have one of their Participant
Teachers respond to the survey. Second-year Master Teachers were from different
districts than Master Teachers participating in the first year of the program. This assured
a group similar to, but mutually exclusive from, the actual target sample. Of the 100
55
emails sent, 22 responses were received. 20 of the respondents answered all questions
on the survey.
The internal consistency reliability (Cronbach's Alpha) for the Adult Playfulness
Scale was .66. Although this is generally considered within the acceptable range, it was
much lower than the literature had suggested. Because Glynn and Webster (1992)
found the scale to have consistently high reliabilities (alpha µ .87), and a test-retest
reliability of .84, suggesting strong internal consistency and homogeneity of items, the
playfulness scale was deemed acceptable for use in the actual study.
The Innovativeness Scale demonstrated an internal consistency reliability
(Cronbach's Alpha) of .64. Again, supported by the literature asserting the scale to have
an internal reliability of .89 (Hurt et al., 1977, p. 61), it was determined that the moderate
reliability may be an effect of the small sample size and the instrument was deemed
acceptable for use.
Marcinkiewicz's Level's of Use Scale proved more problematic than expected.
Ten of the 22 respondents (46%) gave inconsistent responses to the forced-choice
questions, bringing into doubt the clarity and specificity of the wording used. Despite this
situation, it was decided to include the instrument in the final survey and investigate the
inconsistent answers further.
Although the sample size was small, data analysis showed interesting results.
The measure of the criterion variable, the ACOT stages, demonstrated a normal curve
with a slight skew toward the higher end. Measured on a scale of 1 - 5, with 1
representing Entry stage use and 5 representing Invention stage use, it was not
unexpected that results showed few or no stage-1 responses as all respondents
56
theoretically had availability to information technology and training in integration of
information technology prior to the survey.
Playfulness scores exhibited a normal distribution with a "high playfulness" group
appearing at a score above 120. Playfulness scores were found to be significantly
correlated to the ACOT stages (p = .49), significant at the .05 level on a 1-tailed test).
These results were deemed promising.
Innovativeness scores in the pilot group appeared to be bi-modal with an
inordinate percentage clustering on the low innovativeness end of the scale while a
suspicious bubble of scores appeared on the high innovativeness end of the scale. It
was determined that if this bi-modal distribution appeared in the final results, these two
groups would be analyzed separately as well as together. While the innovativeness
scores on the pilot did not demonstrate a significant correlation to the ACOT stages,
innovativeness scores and ACOT stages may still be related.
As discussed above, individuals had trouble with the essentialness test. When
including the inconsistent responses, Kendall's tau-b showed no significant correlation.
However, when the inconsistent responses are removed, Kendall's tau-b showed a
significant correlation (.42, significant at the .05 level on a 1-tailed test). Those who
viewed instructional technology as supplemental and not essential appeared to have
lower ACOT stages than those who viewed instructional technology as critical and
indispensable. Consistent with the other pilot data, these results supported further
research in these areas.
57
Instrumentation
A review of the availability, appropriateness, and fiscal feasibility of measurement
tools for the predictor variables and the assessment of technology adoption revealed
several suitable instruments. The Adult Playfulness scale (APS) (Glynn and Webster,
1992) was selected as a measurement of the individual's cognitive playfulness, and the
Innovativeness Scale (IS) and the Levels of Use Scale (LU) (Marcinkiewicz, 1994) were
chosen to measure the individual's innovativeness and essentialness beliefs,
respectively. The Apple Classroom of Tomorrow (ACOT) Stages of Technology
Integration was administered as a measure of the criterion variable, the ability to use
information technology at a high level. General demographic information, technology
use information, other technology opinion data, and information on the impact of the
training received in the Intel Teach to the Future program were gathered. Although not
all of the latter data was analyzed for the current study, future research might deem the
data useful. The demographics and other questions for future research comprised the
first section of the final instrument used in the current study. The Innovativeness Scale,
the Levels of Use Scale, the Adult Playfulness Scale, the ACOT Stages of Technology
Integration, and two open-ended questions comprised the remaining sections. The final
instrument (Appendix C) was placed on the Web at
http://insight.southcentralrtec.org/ilib/dissertation/dissertation.html for electronic delivery
and response.
The Innovativeness Scale (IS) (Marcinkiewicz, 1994) is a 10-item, self-report
measure and comprised the first 10 questions of section 2. Each item was scored from
1 to 7 (extremely disagree, quite disagree, slightly disagree, neither, slightly agree, quite
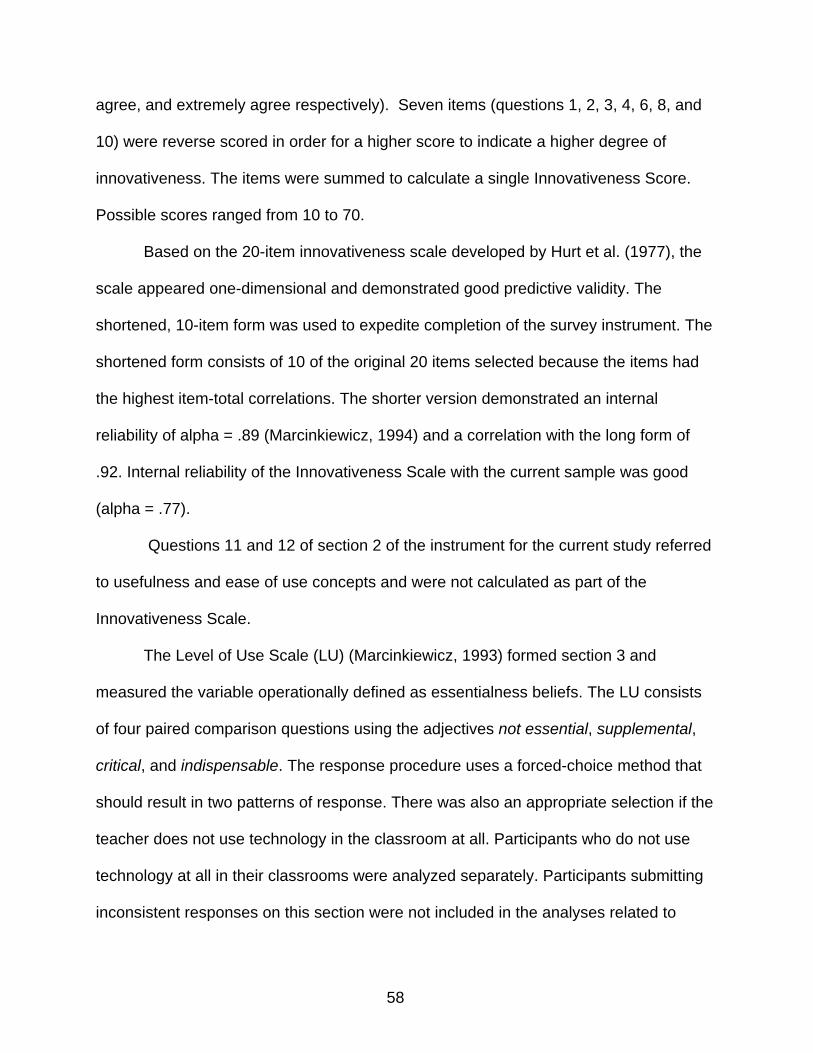
58
agree, and extremely agree respectively). Seven items (questions 1, 2, 3, 4, 6, 8, and
10) were reverse scored in order for a higher score to indicate a higher degree of
innovativeness. The items were summed to calculate a single Innovativeness Score.
Possible scores ranged from 10 to 70.
Based on the 20-item innovativeness scale developed by Hurt et al. (1977), the
scale appeared one-dimensional and demonstrated good predictive validity. The
shortened, 10-item form was used to expedite completion of the survey instrument. The
shortened form consists of 10 of the original 20 items selected because the items had
the highest item-total correlations. The shorter version demonstrated an internal
reliability of alpha = .89 (Marcinkiewicz, 1994) and a correlation with the long form of
.92. Internal reliability of the Innovativeness Scale with the current sample was good
(alpha = .77).
Questions 11 and 12 of section 2 of the instrument for the current study referred
to usefulness and ease of use concepts and were not calculated as part of the
Innovativeness Scale.
The Level of Use Scale (LU) (Marcinkiewicz, 1993) formed section 3 and
measured the variable operationally defined as essentialness beliefs. The LU consists
of four paired comparison questions using the adjectives not essential, supplemental,
critical, and indispensable. The response procedure uses a forced-choice method that
should result in two patterns of response. There was also an appropriate selection if the
teacher does not use technology in the classroom at all. Participants who do not use
technology at all in their classrooms were analyzed separately. Participants submitting
inconsistent responses on this section were not included in the analyses related to
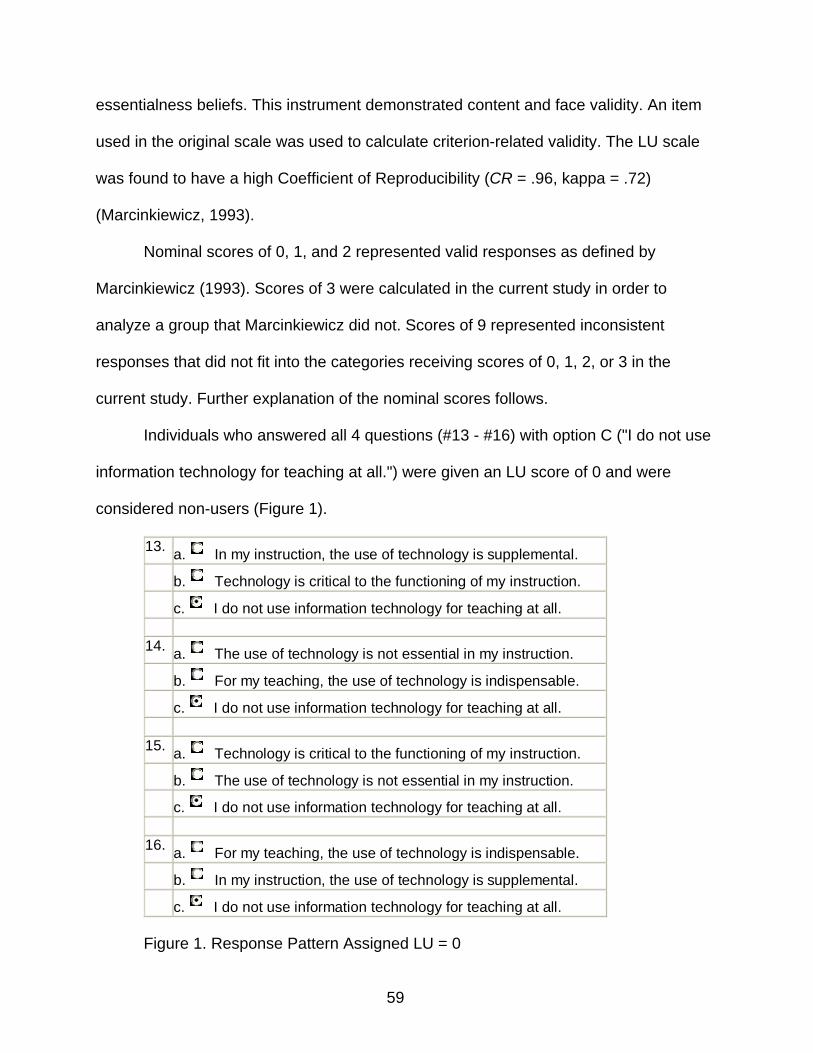
59
essentialness beliefs. This instrument demonstrated content and face validity. An item
used in the original scale was used to calculate criterion-related validity. The LU scale
was found to have a high Coefficient of Reproducibility (CR = .96, kappa = .72)
(Marcinkiewicz, 1993).
Nominal scores of 0, 1, and 2 represented valid responses as defined by
Marcinkiewicz (1993). Scores of 3 were calculated in the current study in order to
analyze a group that Marcinkiewicz did not. Scores of 9 represented inconsistent
responses that did not fit into the categories receiving scores of 0, 1, 2, or 3 in the
current study. Further explanation of the nominal scores follows.
Individuals who answered all 4 questions (#13 - #16) with option C ("I do not use
information technology for teaching at all.") were given an LU score of 0 and were
considered non-users (Figure 1).
13. a. In my instruction, the use of technology is supplemental. b. Technology is critical to the functioning of my instruction. c. I do not use information technology for teaching at all. 14. a. The use of technology is not essential in my instruction. b. For my teaching, the use of technology is indispensable. c. I do not use information technology for teaching at all. 15. a. Technology is critical to the functioning of my instruction. b. The use of technology is not essential in my instruction. c. I do not use information technology for teaching at all. 16. a. For my teaching, the use of technology is indispensable. b. In my instruction, the use of technology is supplemental. c. I do not use information technology for teaching at all.
Figure 1. Response Pattern Assigned LU = 0
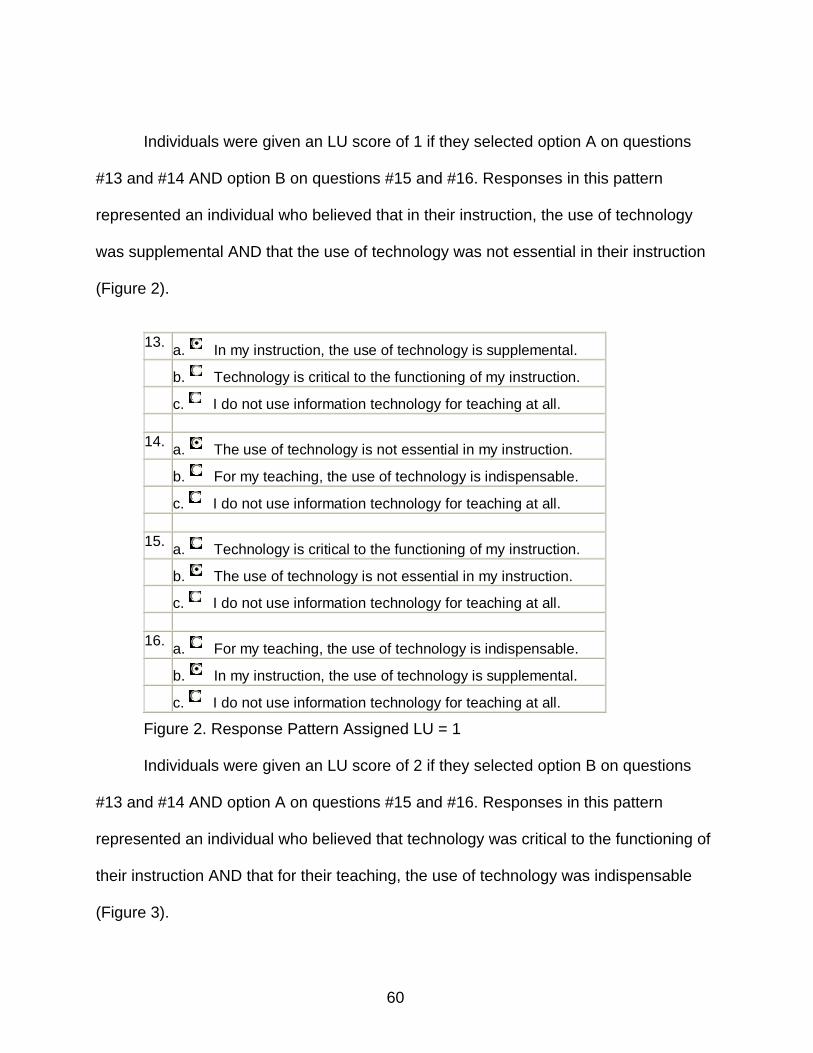
60
13. a. In my instruction, the use of technology is supplemental. b. Technology is critical to the functioning of my instruction. c. I do not use information technology for teaching at all. 14. a. The use of technology is not essential in my instruction. b. For my teaching, the use of technology is indispensable. c. I do not use information technology for teaching at all. 15. a. Technology is critical to the functioning of my instruction. b. The use of technology is not essential in my instruction. c. I do not use information technology for teaching at all. 16. a. For my teaching, the use of technology is indispensable. b. In my instruction, the use of technology is supplemental. c. I do not use information technology for teaching at all.
Individuals were given an LU score of 1 if they selected option A on questions
#13 and #14 AND option B on questions #15 and #16. Responses in this pattern
represented an individual who believed that in their instruction, the use of technology
was supplemental AND that the use of technology was not essential in their instruction
(Figure 2).
Figure 2. Response Pattern Assigned LU = 1
Individuals were given an LU score of 2 if they selected option B on questions
#13 and #14 AND option A on questions #15 and #16. Responses in this pattern
represented an individual who believed that technology was critical to the functioning of
their instruction AND that for their teaching, the use of technology was indispensable
(Figure 3).
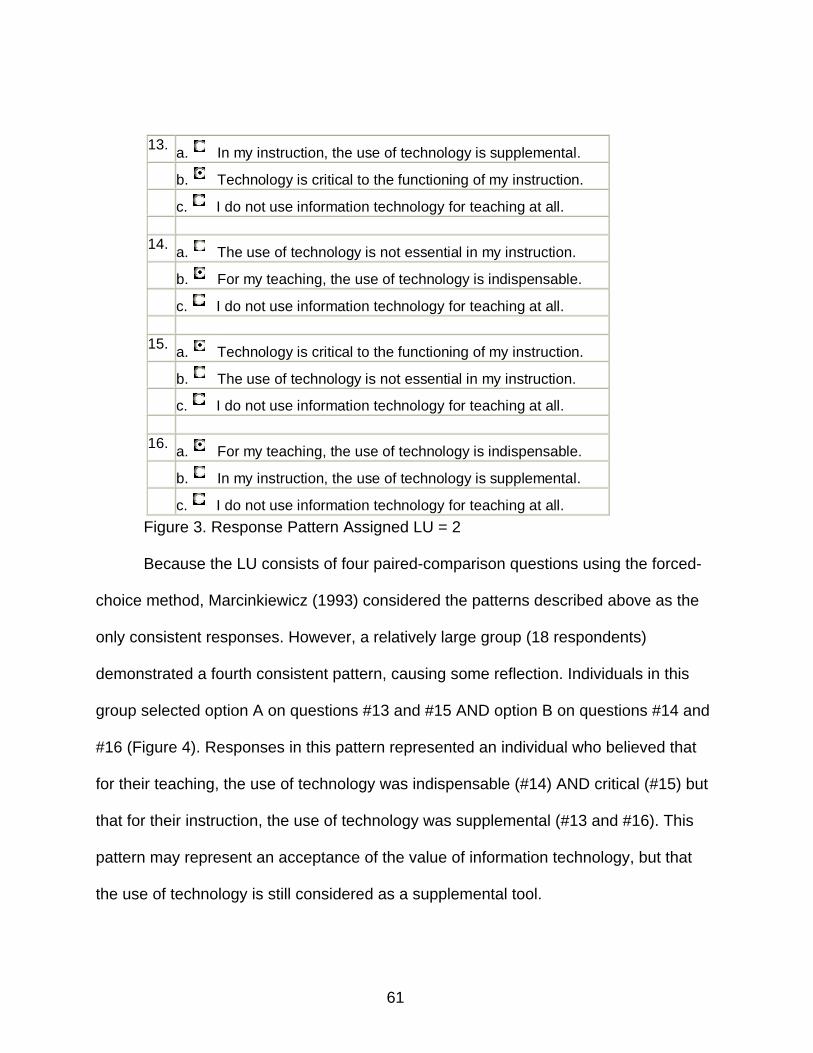
61
13. a. In my instruction, the use of technology is supplemental. b. Technology is critical to the functioning of my instruction. c. I do not use information technology for teaching at all. 14. a. The use of technology is not essential in my instruction. b. For my teaching, the use of technology is indispensable. c. I do not use information technology for teaching at all. 15. a. Technology is critical to the functioning of my instruction. b. The use of technology is not essential in my instruction. c. I do not use information technology for teaching at all. 16. a. For my teaching, the use of technology is indispensable. b. In my instruction, the use of technology is supplemental. c. I do not use information technology for teaching at all.
Figure 3. Response Pattern Assigned LU = 2
Because the LU consists of four paired-comparison questions using the forced-
choice method, Marcinkiewicz (1993) considered the patterns described above as the
only consistent responses. However, a relatively large group (18 respondents)
demonstrated a fourth consistent pattern, causing some reflection. Individuals in this
group selected option A on questions #13 and #15 AND option B on questions #14 and
#16 (Figure 4). Responses in this pattern represented an individual who believed that
for their teaching, the use of technology was indispensable (#14) AND critical (#15) but
that for their instruction, the use of technology was supplemental (#13 and #16). This
pattern may represent an acceptance of the value of information technology, but that
the use of technology is still considered as a supplemental tool.
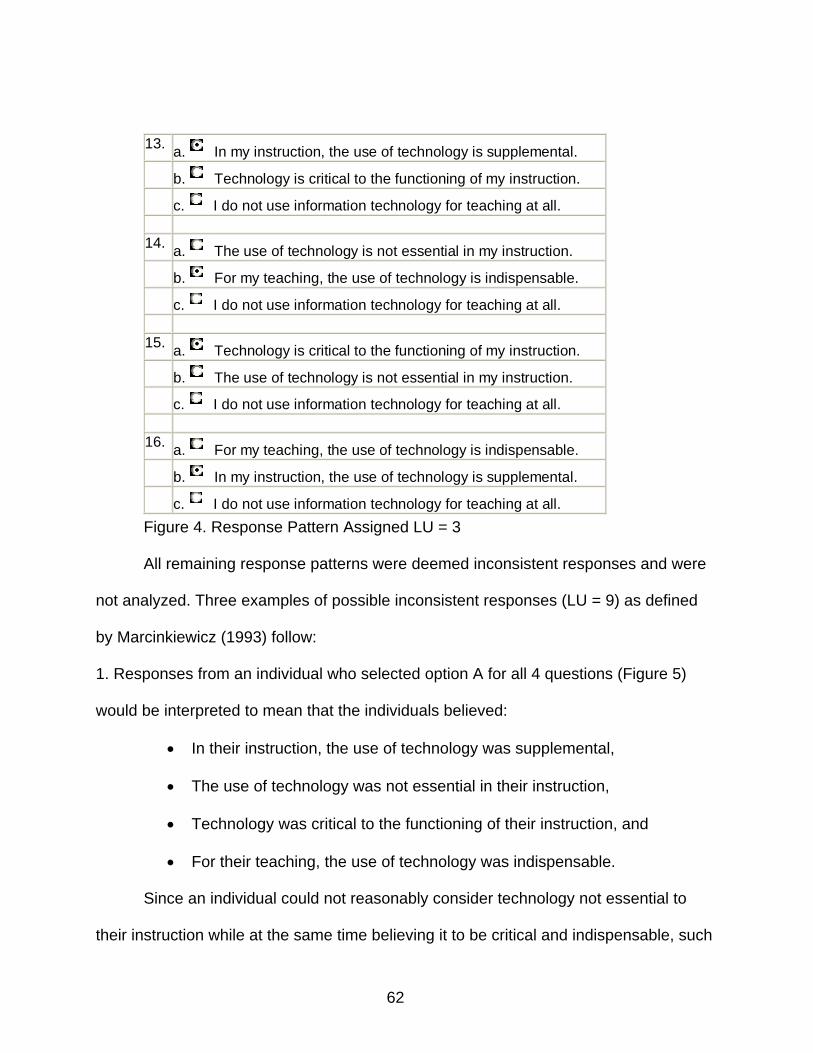
62
13. a. In my instruction, the use of technology is supplemental. b. Technology is critical to the functioning of my instruction. c. I do not use information technology for teaching at all. 14. a. The use of technology is not essential in my instruction. b. For my teaching, the use of technology is indispensable. c. I do not use information technology for teaching at all. 15. a. Technology is critical to the functioning of my instruction. b. The use of technology is not essential in my instruction. c. I do not use information technology for teaching at all. 16. a. For my teaching, the use of technology is indispensable. b. In my instruction, the use of technology is supplemental. c. I do not use information technology for teaching at all.
Figure 4. Response Pattern Assigned LU = 3
All remaining response patterns were deemed inconsistent responses and were
not analyzed. Three examples of possible inconsistent responses (LU = 9) as defined
by Marcinkiewicz (1993) follow:
1. Responses from an individual who selected option A for all 4 questions (Figure 5)
would be interpreted to mean that the individuals believed:
• In their instruction, the use of technology was supplemental,
• The use of technology was not essential in their instruction,
• Technology was critical to the functioning of their instruction, and
• For their teaching, the use of technology was indispensable.
Since an individual could not reasonably consider technology not essential to
their instruction while at the same time believing it to be critical and indispensable, such
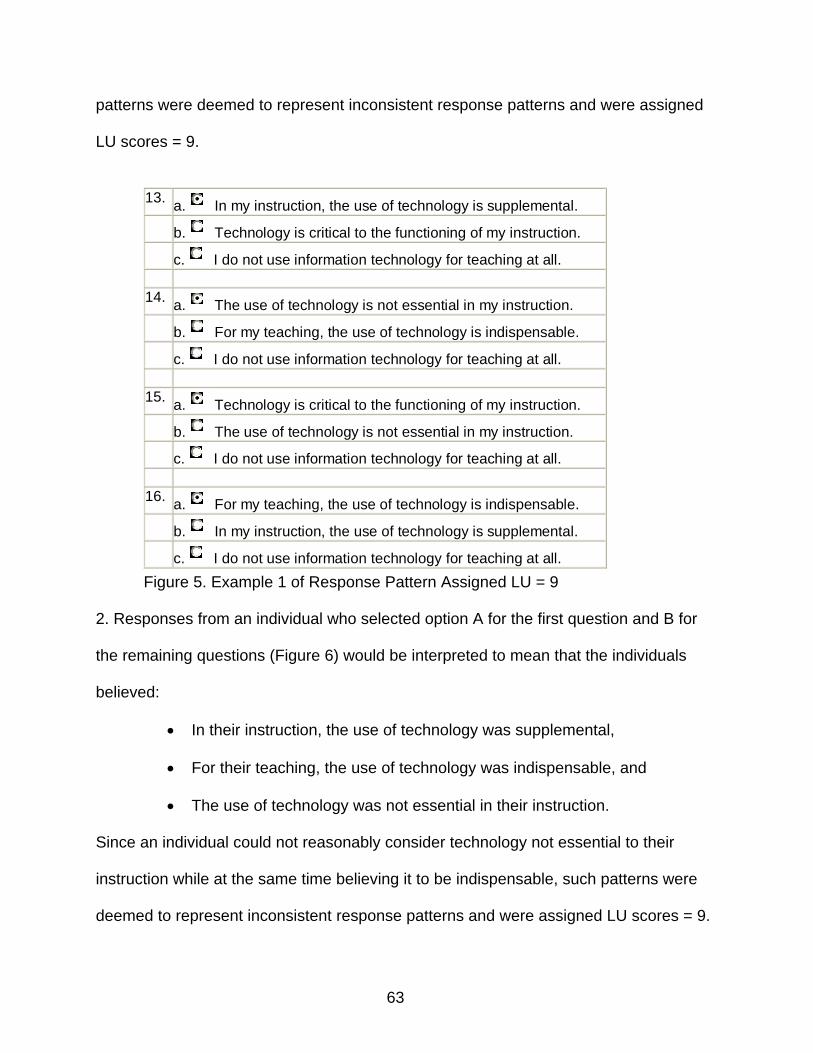
63
13. a. In my instruction, the use of technology is supplemental. b. Technology is critical to the functioning of my instruction. c. I do not use information technology for teaching at all. 14. a. The use of technology is not essential in my instruction. b. For my teaching, the use of technology is indispensable. c. I do not use information technology for teaching at all. 15. a. Technology is critical to the functioning of my instruction. b. The use of technology is not essential in my instruction. c. I do not use information technology for teaching at all. 16. a. For my teaching, the use of technology is indispensable. b. In my instruction, the use of technology is supplemental. c. I do not use information technology for teaching at all.
patterns were deemed to represent inconsistent response patterns and were assigned
LU scores = 9.
Figure 5. Example 1 of Response Pattern Assigned LU = 9
2. Responses from an individual who selected option A for the first question and B for
the remaining questions (Figure 6) would be interpreted to mean that the individuals
believed:
• In their instruction, the use of technology was supplemental,
• For their teaching, the use of technology was indispensable, and
• The use of technology was not essential in their instruction.
Since an individual could not reasonably consider technology not essential to their
instruction while at the same time believing it to be indispensable, such patterns were
deemed to represent inconsistent response patterns and were assigned LU scores = 9.
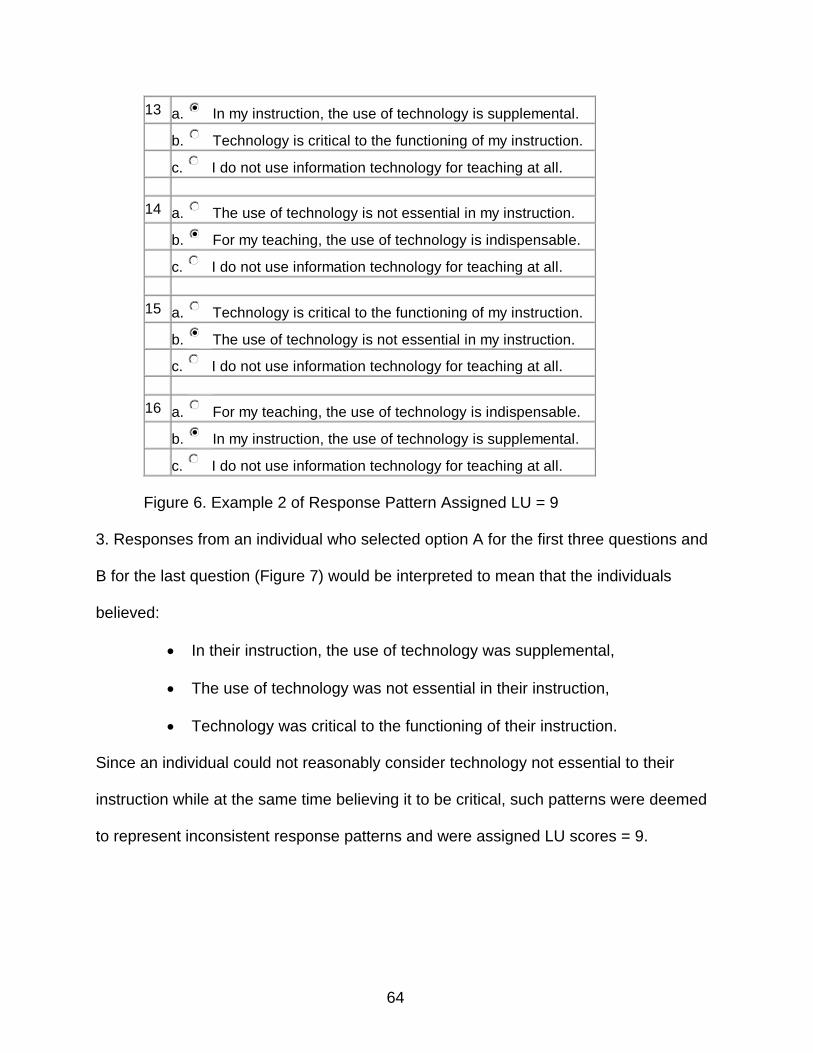
64
Figure 6. Example 2 of Response Pattern Assigned LU = 9
3. Responses from an individual who selected option A for the first three questions and
B for the last question (Figure 7) would be interpreted to mean that the individuals
believed:
• In their instruction, the use of technology was supplemental,
• The use of technology was not essential in their instruction,
• Technology was critical to the functioning of their instruction.
Since an individual could not reasonably consider technology not essential to their
instruction while at the same time believing it to be critical, such patterns were deemed
to represent inconsistent response patterns and were assigned LU scores = 9.
13 a. nmlkji In my instruction, the use of technology is supplemental. b. nmlkj Technology is critical to the functioning of my instruction. c. nmlkj I do not use information technology for teaching at all. 14 a. nmlkj The use of technology is not essential in my instruction. b. nmlkji For my teaching, the use of technology is indispensable. c. nmlkj I do not use information technology for teaching at all. 15 a. nmlkj Technology is critical to the functioning of my instruction. b. nmlkji The use of technology is not essential in my instruction. c. nmlkj I do not use information technology for teaching at all. 16 a. nmlkj For my teaching, the use of technology is indispensable. b. nmlkji In my instruction, the use of technology is supplemental. c. nmlkj I do not use information technology for teaching at all.
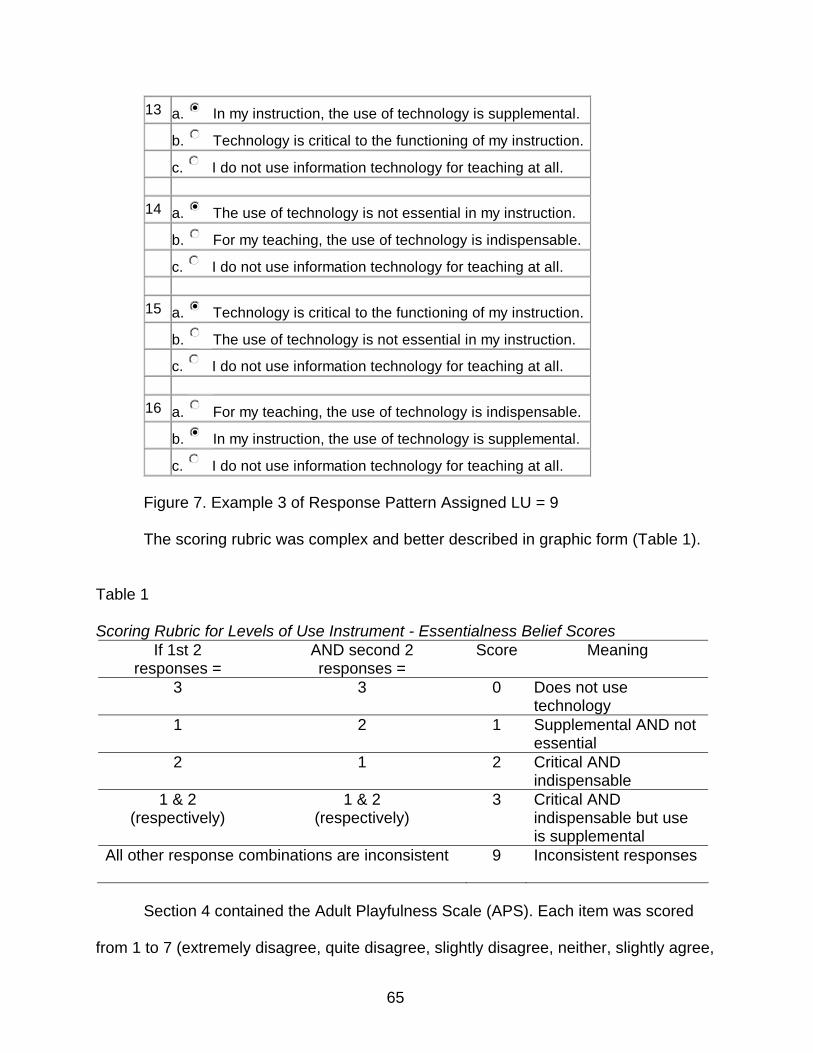
65
13 a. nmlkji In my instruction, the use of technology is supplemental. b. nmlkj Technology is critical to the functioning of my instruction. c. nmlkj I do not use information technology for teaching at all. 14 a. nmlkji The use of technology is not essential in my instruction. b. nmlkj For my teaching, the use of technology is indispensable. c. nmlkj I do not use information technology for teaching at all. 15 a. nmlkji Technology is critical to the functioning of my instruction. b. nmlkj The use of technology is not essential in my instruction. c. nmlkj I do not use information technology for teaching at all. 16 a. nmlkj For my teaching, the use of technology is indispensable. b. nmlkji In my instruction, the use of technology is supplemental. c. nmlkj I do not use information technology for teaching at all. Figure 7. Example 3 of Response Pattern Assigned LU = 9
The scoring rubric was complex and better described in graphic form (Table 1).
Table 1
Scoring Rubric for Levels of Use Instrument - Essentialness Belief Scores If 1st 2
responses = AND second 2 responses =
Score Meaning
3 3 0 Does not use technology
1 2 1 Supplemental AND not essential
2 1 2 Critical AND indispensable
1 & 2 (respectively)
1 & 2 (respectively)
3 Critical AND indispensable but use is supplemental
All other response combinations are inconsistent 9 Inconsistent responses
Section 4 contained the Adult Playfulness Scale (APS). Each item was scored
from 1 to 7 (extremely disagree, quite disagree, slightly disagree, neither, slightly agree,
66
quite agree, extremely agree, respectively). Items 2, 3, 5, 6, 8, 12, 14, 16, 17, and 19
were reverse scored in order for a higher score to represent a higher level of
playfulness. The scores were summed to calculate a single Playfulness Score. Possible
scores ranged from 21 to 147. Internal reliability of the innovativeness scale with the
current sample was very good (alpha = .81).
The APS was developed as a scale suitable for the workplace with the goal of
distinguishing high playfulness from low playfulness (Glynn and Webster, 1992). This
21-item, self-rated, context-free scale attempts to measure playfulness as a
multidimensional construct comprised of cognitive, affective, and behavioral
components. Previous scales such as those created by Jackson (1984) were found by
Costa and McCrae (1988) to lack the behavioral element. Also, Jackson's cognitive
scale included adjectives such as logical and rational later found to be unrelated to the
construct of playfulness.
Although directly related to the Micro-Computer Playfulness scale (Webster and
Martocchio, 1992), the APS measures the relatively stable trait of playfulness as
opposed to a situation-specific playfulness by instructing the individual to "describe how
you would characterize yourself in general." The scale demonstrated consistently high
scale reliabilities (alpha ≥ .87) and a test-retest reliability of .84 (Glynn and Webster,
1992). Results of Glynn and Webster's initial assessment of the instrument also
supported concurrent, convergent, incremental, and predictive validity. The adjectives
selected for the final instrument demonstrated good discriminate validity in
differentiating work from play and good face validity as a personality measure. Using the
original longer version, Glynn (1992) found spontaneity, expressiveness, fun, creativity,
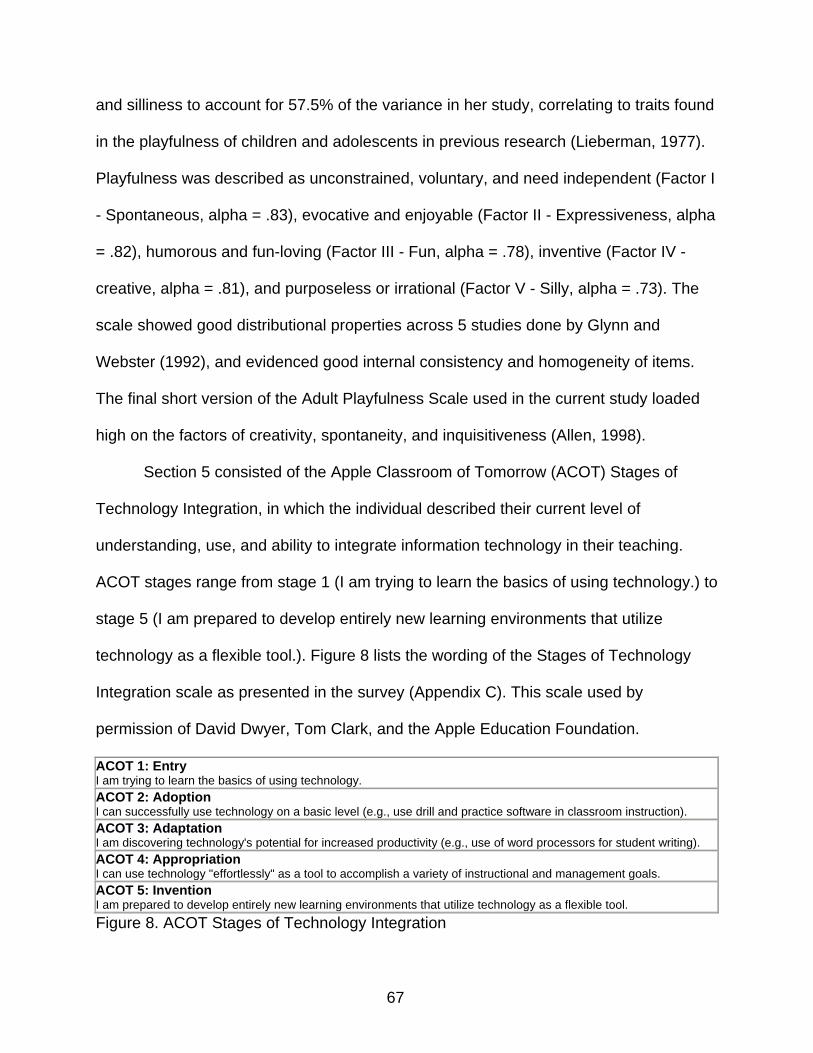
67
and silliness to account for 57.5% of the variance in her study, correlating to traits found
in the playfulness of children and adolescents in previous research (Lieberman, 1977).
Playfulness was described as unconstrained, voluntary, and need independent (Factor I
- Spontaneous, alpha = .83), evocative and enjoyable (Factor II - Expressiveness, alpha
= .82), humorous and fun-loving (Factor III - Fun, alpha = .78), inventive (Factor IV -
creative, alpha = .81), and purposeless or irrational (Factor V - Silly, alpha = .73). The
scale showed good distributional properties across 5 studies done by Glynn and
Webster (1992), and evidenced good internal consistency and homogeneity of items.
The final short version of the Adult Playfulness Scale used in the current study loaded
high on the factors of creativity, spontaneity, and inquisitiveness (Allen, 1998).
Section 5 consisted of the Apple Classroom of Tomorrow (ACOT) Stages of
Technology Integration, in which the individual described their current level of
understanding, use, and ability to integrate information technology in their teaching.
ACOT stages range from stage 1 (I am trying to learn the basics of using technology.) to
stage 5 (I am prepared to develop entirely new learning environments that utilize
technology as a flexible tool.). Figure 8 lists the wording of the Stages of Technology
Integration scale as presented in the survey (Appendix C). This scale used by
permission of David Dwyer, Tom Clark, and the Apple Education Foundation.
ACOT 1: Entry I am trying to learn the basics of using technology. ACOT 2: Adoption I can successfully use technology on a basic level (e.g., use drill and practice software in classroom instruction). ACOT 3: Adaptation I am discovering technology's potential for increased productivity (e.g., use of word processors for student writing). ACOT 4: Appropriation I can use technology "effortlessly" as a tool to accomplish a variety of instructional and management goals. ACOT 5: Invention I am prepared to develop entirely new learning environments that utilize technology as a flexible tool. Figure 8. ACOT Stages of Technology Integration
68
ACOT scores represent self-reported stages of technology adoption (Dwyer et
al., 1991). Entry stage (ACOT = 1) refers to a teacher who is still learning the basics of a
technology, e.g. how to set up the equipment and operate it. At the Adoption stage
(ACOT = 2), the teacher is beginning to use the technology for management duties, e.g.
grade books and quizzes, to support traditional instruction. The teacher enters the
Adaption stage (ACOT = 3) when use of software such as word processors and
spreadsheets or commercially-produced content area programs supports instruction. At
the Appropriation stage (ACOT = 4), the focus turns to new approaches to teaching,
such as collaborative, project-based technology use, and technology becomes one of
several instructional tools. At the Invention stage (ACOT = 5), the highest ACOT stage,
teachers report a readiness to adjust their fundamental perceptions of instruction toward
the usage of technology as a flexible tool. The limitations of the descriptions and range
of the ACOT stages are discussed in Chapter 5.
Background of ACOT Project
The Apple Classroom of Tomorrow Project (ACOT), begun in 1985, was a
collaborative long-term research and development effort between public schools,
universities, research agencies, and Apple Computer, Inc. ACOT initially included seven
classrooms that represented a cross-section of America’s elementary and secondary
schools. The goal of the project was to study how access to and routine use of
interactive computer technologies by teachers and students might change teaching and
learning (Apple Classroom of Tomorrow, 2004). The ACOT program adhered to the
constructivist philosophy of collaborative, student-directed learning. Results of the study
can be found at www.apple.com/education/k12/leadership/acot/library.html.
69
Basis of ACOT Stages
The ACOT research produced an adoption model for the use of technology in the
classroom known as the Stages of Instructional Evolution and a related scale referred to
as the Stages of Technology Integration. Based on interviews with the teachers,
classroom observations, teacher self-reports, email, and other documents collected
during a 3-year qualitative, longitudinal study, David Dwyer and his colleagues
developed a grounded theory generalizing the experience of dozens of elementary and
high school teachers in five cities. The data were triangulated to assure veracity of the
observations. The model demonstrates strong face validity, evident from the number of
responses received to articles, presentations, and a book that resulted from the work
(D. Dwyer, personal communication, June 17, 2004). The ACOT study has served as a
framework for many doctoral dissertations and continues to be referenced as "a
foundation for research related to using technology as an integral part of teaching and
learning." (Barron, Kemker, Harmes, and Kalaydjian, 2003, p. 496).
External Validity of ACOT Instrument
According to Newhouse (2001), the ACOT model and other concerns-based
adoption models (CBAM), such as the instructional transformation model and the
Project Information Technology (PIT) model are based on Fuller’s model (Fuller, 1969),
but are specific to the implementation of computers in schools. Currently, many of the
models being used in research on technology in the classroom have their foundations in
the CBAM project from the Southwest Educational Development Laboratory at the
University of Texas (Newhouse, 2001).
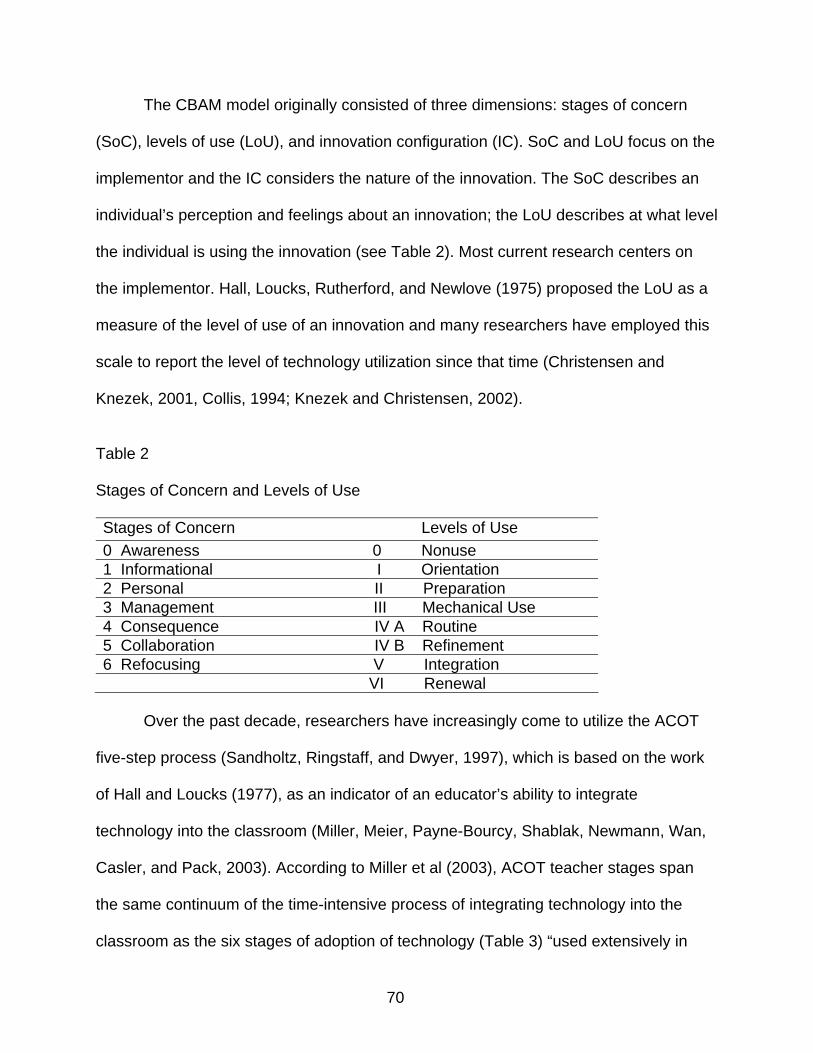
70
The CBAM model originally consisted of three dimensions: stages of concern
(SoC), levels of use (LoU), and innovation configuration (IC). SoC and LoU focus on the
implementor and the IC considers the nature of the innovation. The SoC describes an
individual’s perception and feelings about an innovation; the LoU describes at what level
the individual is using the innovation (see Table 2). Most current research centers on
the implementor. Hall, Loucks, Rutherford, and Newlove (1975) proposed the LoU as a
measure of the level of use of an innovation and many researchers have employed this
scale to report the level of technology utilization since that time (Christensen and
Knezek, 2001, Collis, 1994; Knezek and Christensen, 2002).
Table 2
Stages of Concern and Levels of Use
Stages of Concern Levels of Use 0 Awareness 0 Nonuse 1 Informational I Orientation 2 Personal II Preparation 3 Management III Mechanical Use 4 Consequence IV A Routine 5 Collaboration IV B Refinement 6 Refocusing V Integration VI Renewal
Over the past decade, researchers have increasingly come to utilize the ACOT
five-step process (Sandholtz, Ringstaff, and Dwyer, 1997), which is based on the work
of Hall and Loucks (1977), as an indicator of an educator’s ability to integrate
technology into the classroom (Miller, Meier, Payne-Bourcy, Shablak, Newmann, Wan,
Casler, and Pack, 2003). According to Miller et al (2003), ACOT teacher stages span
the same continuum of the time-intensive process of integrating technology into the
classroom as the six stages of adoption of technology (Table 3) “used extensively in
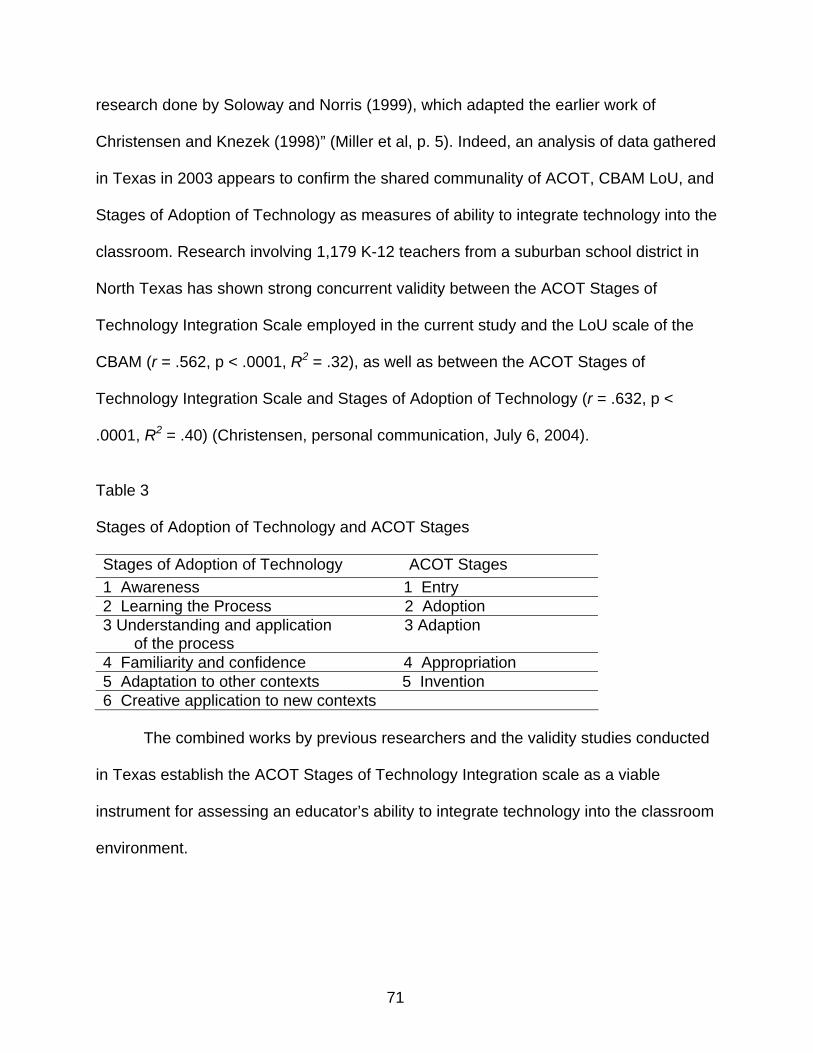
71
research done by Soloway and Norris (1999), which adapted the earlier work of
Christensen and Knezek (1998)” (Miller et al, p. 5). Indeed, an analysis of data gathered
in Texas in 2003 appears to confirm the shared communality of ACOT, CBAM LoU, and
Stages of Adoption of Technology as measures of ability to integrate technology into the
classroom. Research involving 1,179 K-12 teachers from a suburban school district in
North Texas has shown strong concurrent validity between the ACOT Stages of
Technology Integration Scale employed in the current study and the LoU scale of the
CBAM (r = .562, p < .0001, R2 = .32), as well as between the ACOT Stages of
Technology Integration Scale and Stages of Adoption of Technology (r = .632, p <
.0001, R2 = .40) (Christensen, personal communication, July 6, 2004).
Table 3
Stages of Adoption of Technology and ACOT Stages
Stages of Adoption of Technology ACOT Stages 1 Awareness 1 Entry 2 Learning the Process 2 Adoption 3 Understanding and application 3 Adaption of the process 4 Familiarity and confidence 4 Appropriation 5 Adaptation to other contexts 5 Invention 6 Creative application to new contexts
The combined works by previous researchers and the validity studies conducted
in Texas establish the ACOT Stages of Technology Integration scale as a viable
instrument for assessing an educator’s ability to integrate technology into the classroom
environment.
72
Data Collection Procedures
Although some of the original participant teachers (PTs) were known to have left
their districts and were no longer available, 1,081 email addresses were available and
presumed valid for the remaining participants. Because of their participation in the Intel
Teach to the Future program, those 1,081 teachers were assumed to be users of the
Internet and email, making online delivery of the survey instrument possible, thus
reducing costs and delivery time, and making the return of the survey instruments much
easier. The survey instrument was posted as a single unit to a secure server at the
Texas Center for Educational Technology at the University of North Texas in Denton,
Texas. The delivery form automatically fed into an Excel spreadsheet minimizing data
entry errors. Participants could exit the survey at any time and no default values were
set for any question.
Each PT in the sample received an email informing them of the study and
requesting their participation. Full disclosure as required by human subjects research
guidelines was given. The email included the URL required to access the survey
instrument. Any participant who wished to register for a drawing for a key-disk memory
device could do so by entering their email address at the end of the survey. Participants'
email addresses were used only for the drawing and will not be used for any other
purpose in the future.
Unfortunately, the email requesting participation was sent on the same day that a
major worldwide virus attack occurred. In order to protect themselves, some email
services and many school districts temporarily closed their networks in order to contain
the effects of the virus. This policy caused the delivery failure of many participation
73
request emails. Even when the second request was emailed, few additional
respondents replied. Because of this unforeseen event, the deadline was extended and
another request for participation was sent via email two weeks later. The third request
resulted in an improved response rate.
Data Analysis Procedures
Descriptive statistics were collected and analyzed for the following demographic
items: age, gender, and years of experience with technology. Other responses
regarding pedagogy and technology use were also analyzed. Hypothesis testing was
carried out using the appropriate correlation coefficient for each major research
question.
1. Research question 1: Pearson product-moment correlation between ACOT
stages and Playfulness scores
2. Research question 2: Pearson product-moment correlation between ACOT
stages and Innovativeness scores
3. Research question 3: Kendall's tau-b correlation between ACOT stages and
Essentialness Belief scores (a nominal variable)
The results were analyzed using the Statistical Program for the Social Sciences®
(SPSS 12.0 for Windows) data analysis software (©SPSS, Chicago, IL, www.spss.com).
Human Subjects Protection
The survey used in the current study contained questions regarding the use of
information technology in the classroom, attitudes toward information technology, and
some personality and demographic questions. Filling out the online survey was
74
estimated to take between 30-45 minutes. The evaluation was used to determine the
relationship between certain personality traits and information technology use.
Determining the personality characteristics of the various levels of information
technology users may be helpful in improving design of professional development,
curriculum, and support systems to encourage a higher level of information technology
use by educators and students to prepare them for the future.
There were no foreseeable risks to completing the online survey. The individual
was free to withdraw consent and discontinue participation in the study at any time
without consequences. There might be unforeseen circumstances that develop under
which an individual's participation may be terminated by the investigator. Answers to the
survey are stored on a secure server at the University of North Texas. Only the
researchers and their research assistants have access to the data using a secure
password. Only the last 4 digits of social security numbers are used as a key for the
database. School name was only used in the unlikely occurrence of a duplicate key.
There is a possibility that data from this survey could be used for further research
beyond the initial study. Such a study would be initiated only upon additional approval
from the University of North Texas Institutional Review Board. The board would
examine any request for further research and would require stringent control of
confidentiality and security of the data. Written and oral reports will never contain
information about an individual person nor will any person be identified in such reports.
This research study has been reviewed and approved by the UNT Committee for
the protection of Human Subjects. UNT IRB can be contacted at (940) 565-3940 or
http://www.unt.edu/ospa/irb/contact.htm with any questions or concerns regarding this

75
study. (See Appendix D for complete form.) Data collection did not occur until approval
was granted from the IRB.
76
CHAPTER 4
FINDINGS
Introduction
The current study examined the relationships of cognitive playfulness,
innovativeness, essentialness beliefs, and a sustained high level of use of information
technology in the classroom. Demographic information, as well as the findings and
analyses of each research question, are presented in this chapter. The following null
hypotheses were tested:
1. There is no positive relationship between an individual's ability to sustain a high
level of information technology usage as measured by an individual’s Apple
Classroom of Tomorrow (ACOT) stage and the individual's level of cognitive
playfulness as measured by their score on the Adult Playfulness Scale (APS).
2. There is no positive relationship between an individual's ability to sustain a high
level of information technology usage as measured by an individual’s ACOT
stage and their level of innovativeness as measured by the individual's score on
Marcinkiewicz’s Innovativeness Scale (IS).
3. There is no positive relationship between an individual's ability to sustain a high
level of information technology usage as measured by an individual’s ACOT
stage and their perception of essentialness of information technology use as
measured by the individual's score on Marcinkiewicz’s 4-question Level of Use
(LU) assessment instrument.
Pearson product-moment correlations were computed to investigate the
relationship between the predictor variables of playfulness and innovativeness and the
77
criterion variable, the individuals' ACOT stages. Due to the non-interval nature of the LU
scale, a Kendall's tau-b correlation was computed to investigate the relationship
between the predictor variable of essentialness beliefs and the criterion variable, the
individuals' ACOT stages. The SPSS PC statistical package version 12.0 for Windows
was used to perform the statistical analysis.
Description of Participants
The participants in the current study were Participant Teachers (PTs) from the
first year of the Intel Teach to the Future program. During 2000, 6,971 PTs were trained
in the United States (Martin, K., personal communication, May 26, 2004). The total
number of first-year PTs enrolled in the program through the UNT RTA was 1,748. Of
these, 31 records contained no email addresses. As anticipated, many of the remaining
email addresses were no longer valid but the number of emails returned as non-
deliverable was larger than expected. Although due to the nature of the Internet it was
difficult to be absolutely certain, it was estimated that approximately 636 emails did not
reach the Participant Teachers; that is, notification was received that the emails were
non-deliverable. Little success was gained from the two additional attempts to locate
valid email addresses for all emails that were not delivered. Out of the 1,081 email
contacts presumed to have reached the intended recipients, 281 responses were
received, representing a response rate of approximately 26% of the contacted
participants. It must be noted that unfortunate timing on the part of the researcher
resulted in the initial request for participation being sent on the same day as a major
virus attack when many districts had just shut down their email systems and many
people were afraid to open emails from unknown senders. Of the responses received,
78
75 individuals did not respond to the question determining the individual's ACOT stage.
Because the ACOT stage was the criterion variable, these 75 responses were removed
from the data set leaving an N = 206. Because of incomplete questionnaires, the
number of cases for each scale and each correlation were not identical.
The respondents were 86% female (n = 178) and 14% male (n = 28) (Table 4),
which was fairly representative of the teaching profession (Texas PK-16 Public
Education Information Resource, 2004) and of the Intel Teach to the Future Participant
Teachers, as well (K. McMillan-Culp, personal communication, May 24, 2004). Ages of
respondents (Table 5) ranged from 27 to 68 (M = 45.79, SD = 10.02). The distribution of
the ages appeared to be bi-modal, with a dichotomization point of 38 (Figure 9). This
finding was relatively consistent with other research that found teachers were typically
awarded veteran status around the age of 36 (Robinson, 2002). Therefore, the ages
were dichotomized with ages 27 to 37 representing the younger group and ages 38 to
68 representing the older teachers. Five percent of the respondents reported less than
5 years experience with technology, 39% reported 5 to 9 years experience with
technology, and 55% reported 10 or more years experience with technology (Table 6).
Ninety-six percent (n=197) reported using computers at home (Table 7). Current
research has found that usage of a computer at home was a major correlate to usage at
work (Christensen and Knezek, 2003).
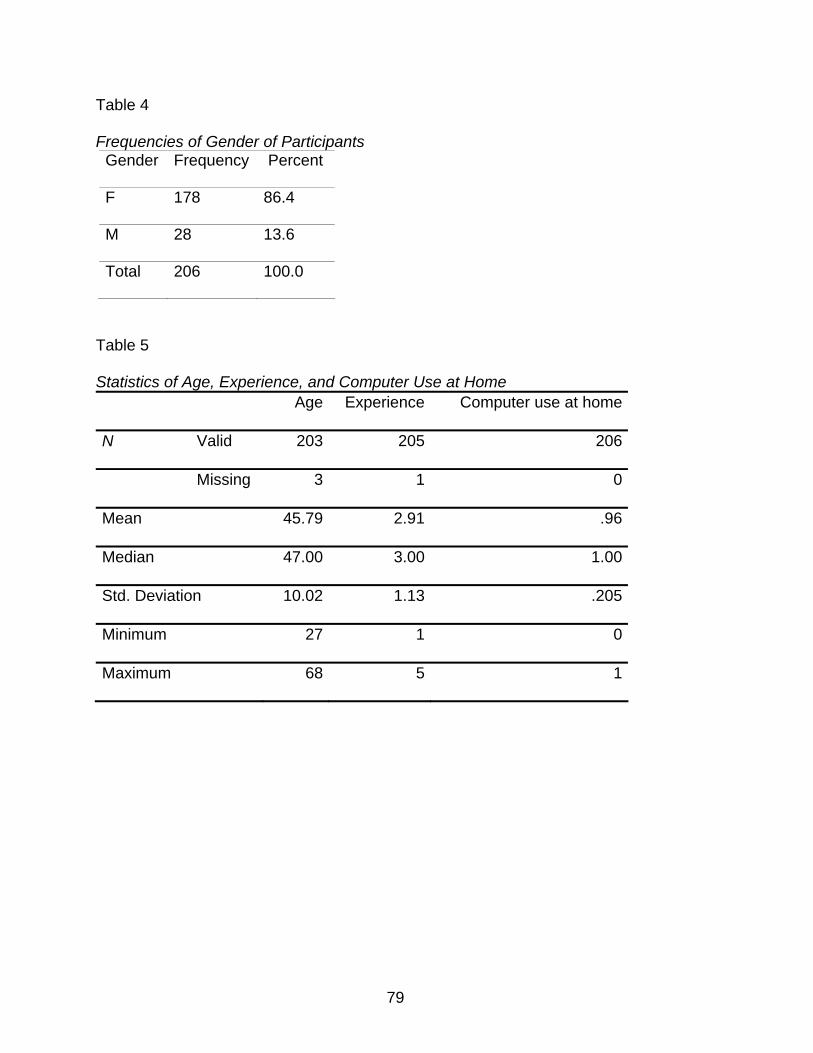
79
Table 4
Frequencies of Gender of Participants Gender Frequency Percent
F 178 86.4
M 28 13.6
Total 206 100.0
Table 5
Statistics of Age, Experience, and Computer Use at Home Age Experience Computer use at home
N Valid 203 205 206
Missing 3 1 0
Mean 45.79 2.91 .96
Median 47.00 3.00 1.00
Std. Deviation 10.02 1.13 .205
Minimum 27 1 0
Maximum 68 5 1
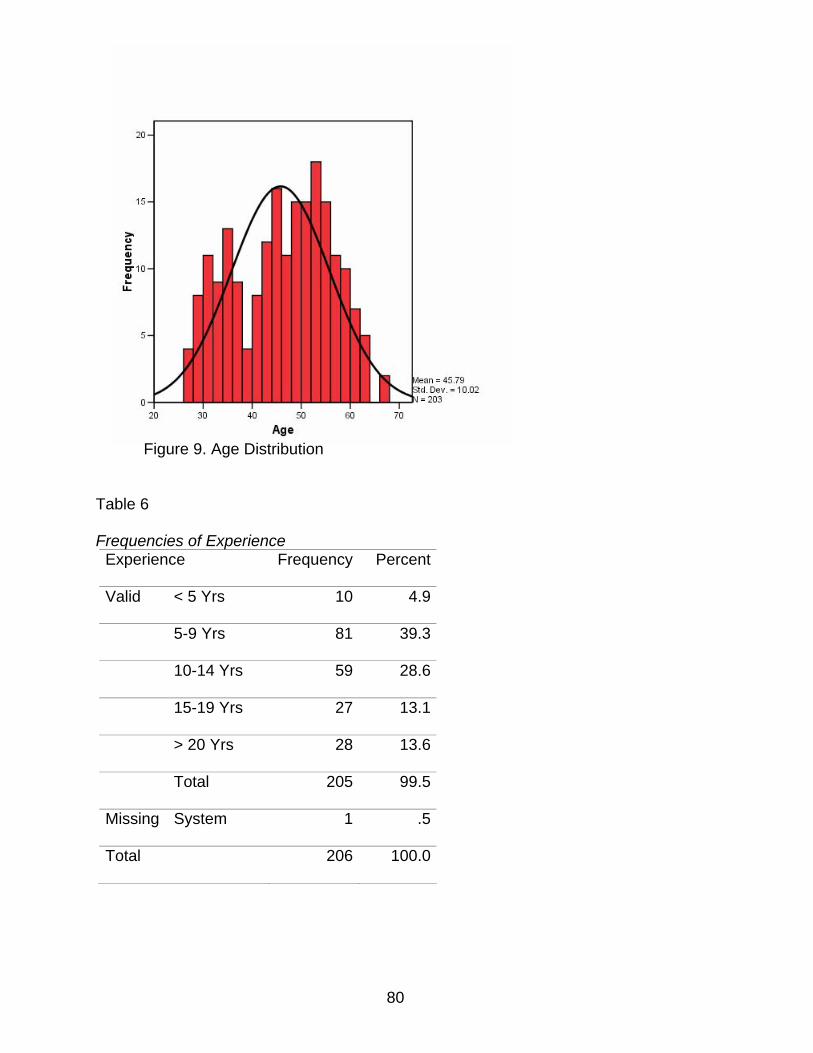
80
Figure 9. Age Distribution
Table 6
Frequencies of Experience Experience Frequency Percent
Valid < 5 Yrs 10 4.9
5-9 Yrs 81 39.3
10-14 Yrs 59 28.6
15-19 Yrs 27 13.1
> 20 Yrs 28 13.6
Total 205 99.5
Missing System 1 .5
Total 206 100.0
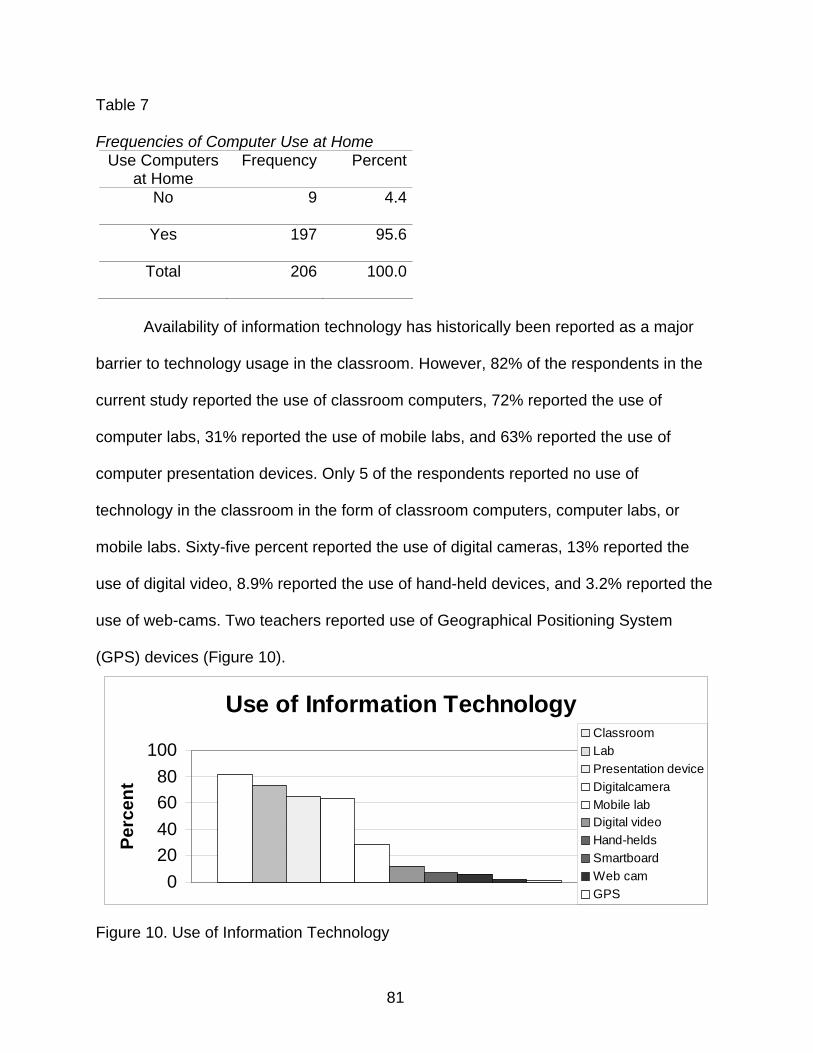
81
Table 7
Frequencies of Computer Use at Home Use Computers
at Home Frequency Percent
No 9 4.4
Yes 197 95.6
Total 206 100.0
Availability of information technology has historically been reported as a major
barrier to technology usage in the classroom. However, 82% of the respondents in the
current study reported the use of classroom computers, 72% reported the use of
computer labs, 31% reported the use of mobile labs, and 63% reported the use of
computer presentation devices. Only 5 of the respondents reported no use of
technology in the classroom in the form of classroom computers, computer labs, or
mobile labs. Sixty-five percent reported the use of digital cameras, 13% reported the
use of digital video, 8.9% reported the use of hand-held devices, and 3.2% reported the
use of web-cams. Two teachers reported use of Geographical Positioning System
(GPS) devices (Figure 10).
Figure 10. Use of Information Technology
Use of Information Technology
020406080
100
Perc
ent
ClassroomLabPresentation deviceDigitalcameraMobile labDigital videoHand-heldsSmartboardWeb camGPS
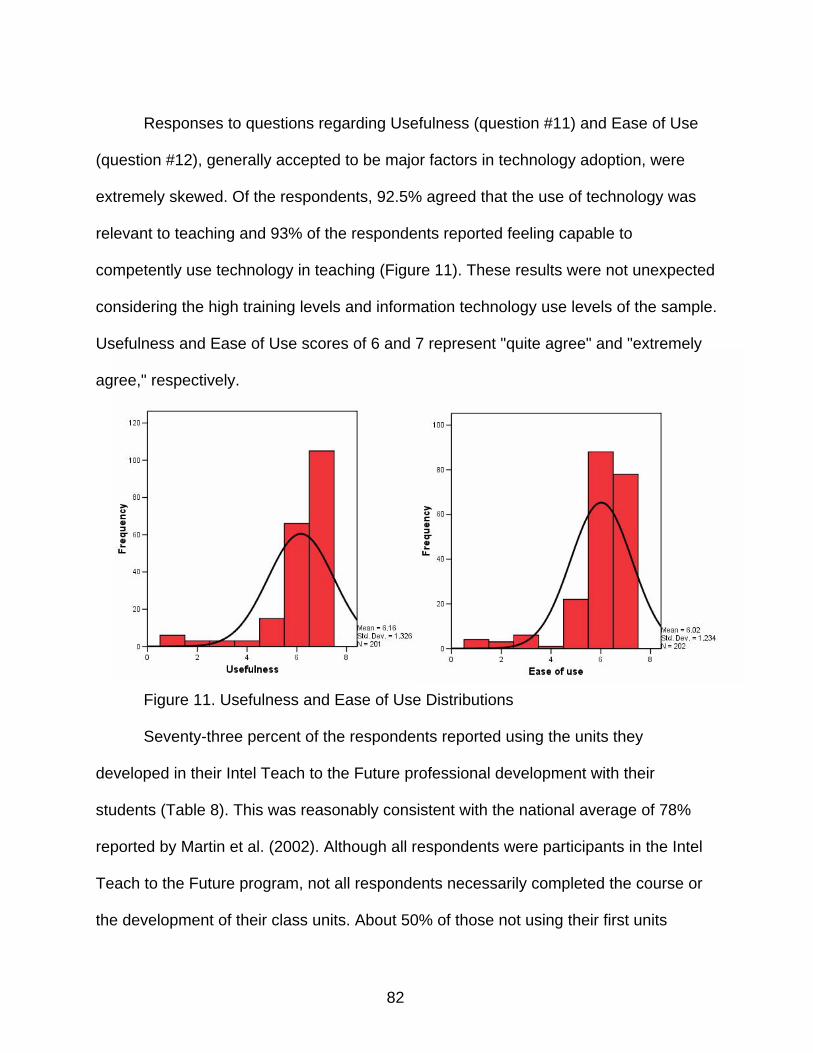
82
Responses to questions regarding Usefulness (question #11) and Ease of Use
(question #12), generally accepted to be major factors in technology adoption, were
extremely skewed. Of the respondents, 92.5% agreed that the use of technology was
relevant to teaching and 93% of the respondents reported feeling capable to
competently use technology in teaching (Figure 11). These results were not unexpected
considering the high training levels and information technology use levels of the sample.
Usefulness and Ease of Use scores of 6 and 7 represent "quite agree" and "extremely
agree," respectively.
Figure 11. Usefulness and Ease of Use Distributions
Seventy-three percent of the respondents reported using the units they
developed in their Intel Teach to the Future professional development with their
students (Table 8). This was reasonably consistent with the national average of 78%
reported by Martin et al. (2002). Although all respondents were participants in the Intel
Teach to the Future program, not all respondents necessarily completed the course or
the development of their class units. About 50% of those not using their first units
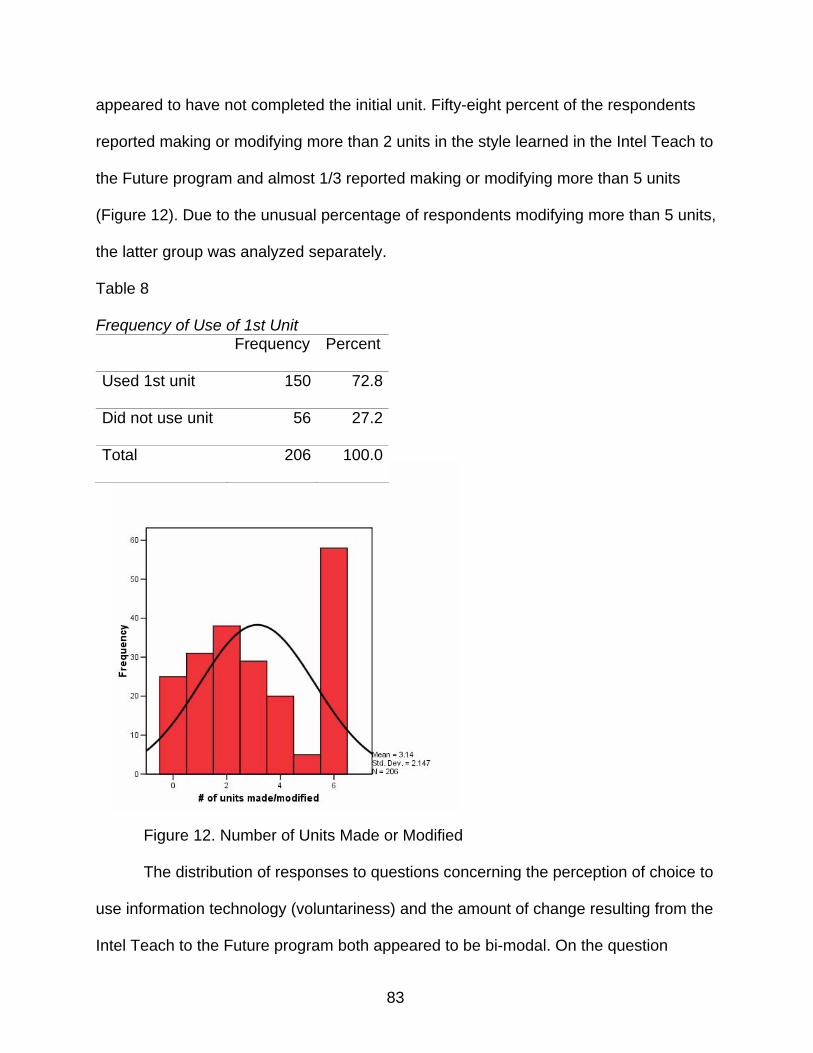
83
appeared to have not completed the initial unit. Fifty-eight percent of the respondents
reported making or modifying more than 2 units in the style learned in the Intel Teach to
the Future program and almost 1/3 reported making or modifying more than 5 units
(Figure 12). Due to the unusual percentage of respondents modifying more than 5 units,
the latter group was analyzed separately.
Table 8
Frequency of Use of 1st Unit Frequency Percent
Used 1st unit 150 72.8
Did not use unit 56 27.2
Total 206 100.0
Figure 12. Number of Units Made or Modified
The distribution of responses to questions concerning the perception of choice to
use information technology (voluntariness) and the amount of change resulting from the
Intel Teach to the Future program both appeared to be bi-modal. On the question
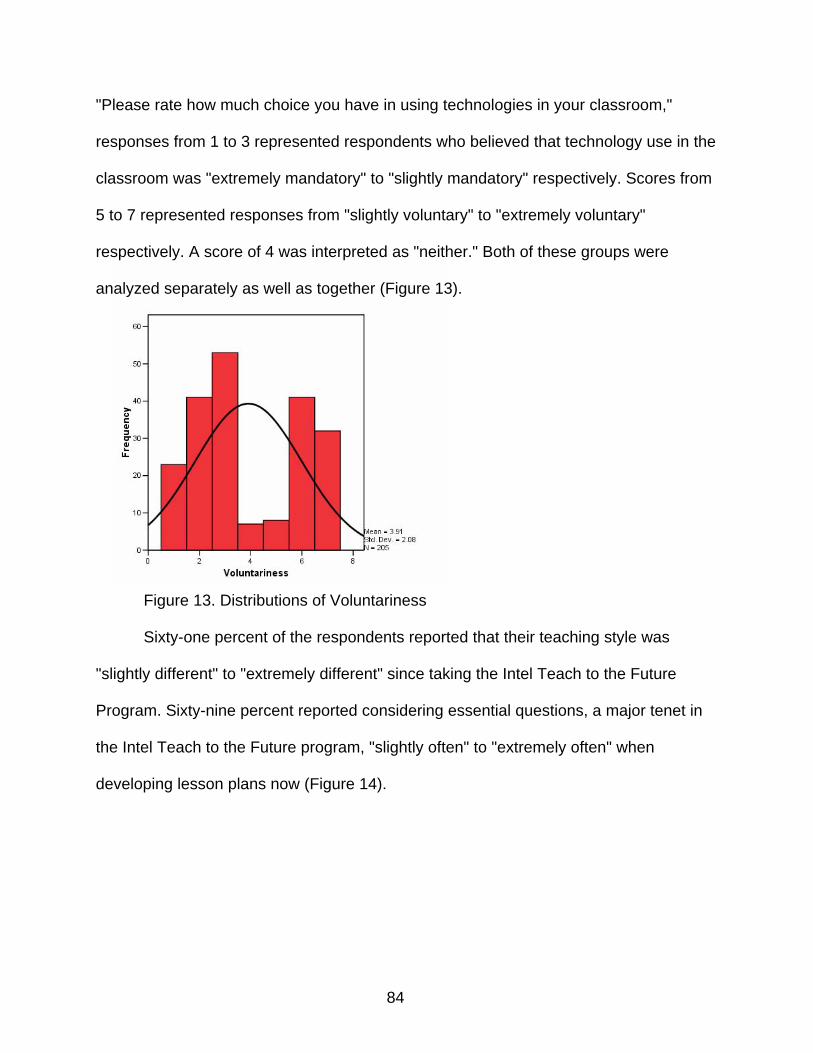
84
"Please rate how much choice you have in using technologies in your classroom,"
responses from 1 to 3 represented respondents who believed that technology use in the
classroom was "extremely mandatory" to "slightly mandatory" respectively. Scores from
5 to 7 represented responses from "slightly voluntary" to "extremely voluntary"
respectively. A score of 4 was interpreted as "neither." Both of these groups were
analyzed separately as well as together (Figure 13).
Figure 13. Distributions of Voluntariness
Sixty-one percent of the respondents reported that their teaching style was
"slightly different" to "extremely different" since taking the Intel Teach to the Future
Program. Sixty-nine percent reported considering essential questions, a major tenet in
the Intel Teach to the Future program, "slightly often" to "extremely often" when
developing lesson plans now (Figure 14).
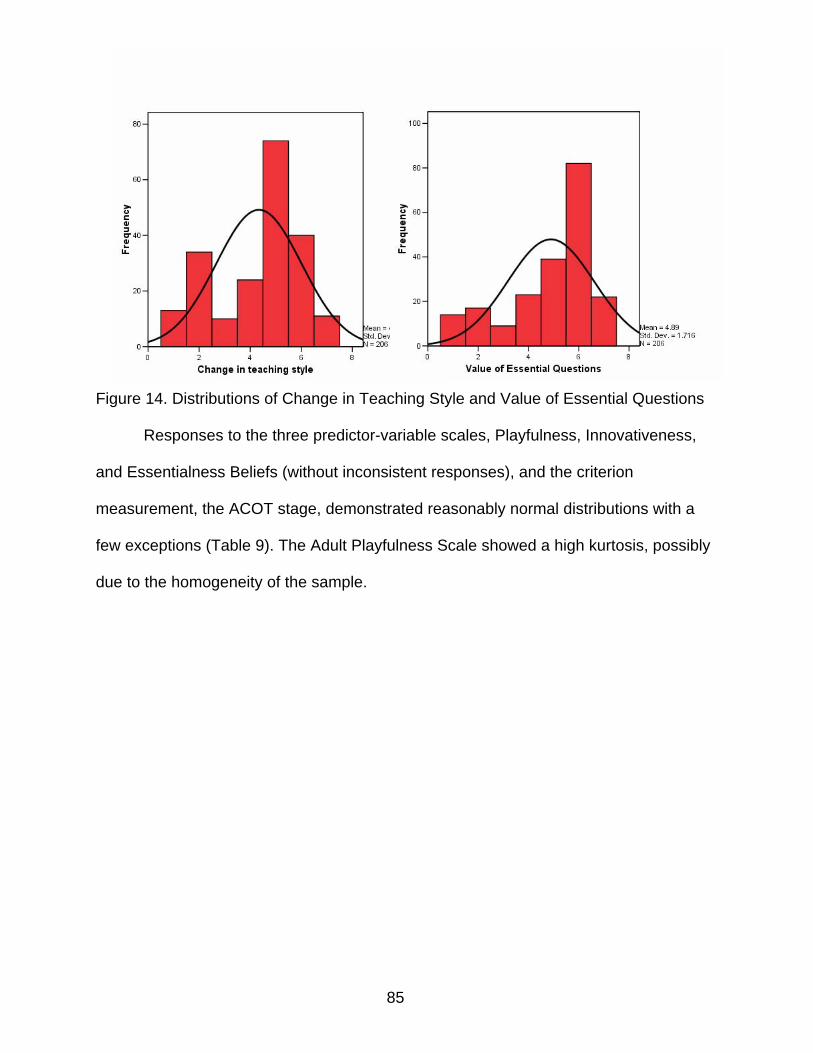
85
Figure 14. Distributions of Change in Teaching Style and Value of Essential Questions
Responses to the three predictor-variable scales, Playfulness, Innovativeness,
and Essentialness Beliefs (without inconsistent responses), and the criterion
measurement, the ACOT stage, demonstrated reasonably normal distributions with a
few exceptions (Table 9). The Adult Playfulness Scale showed a high kurtosis, possibly
due to the homogeneity of the sample.
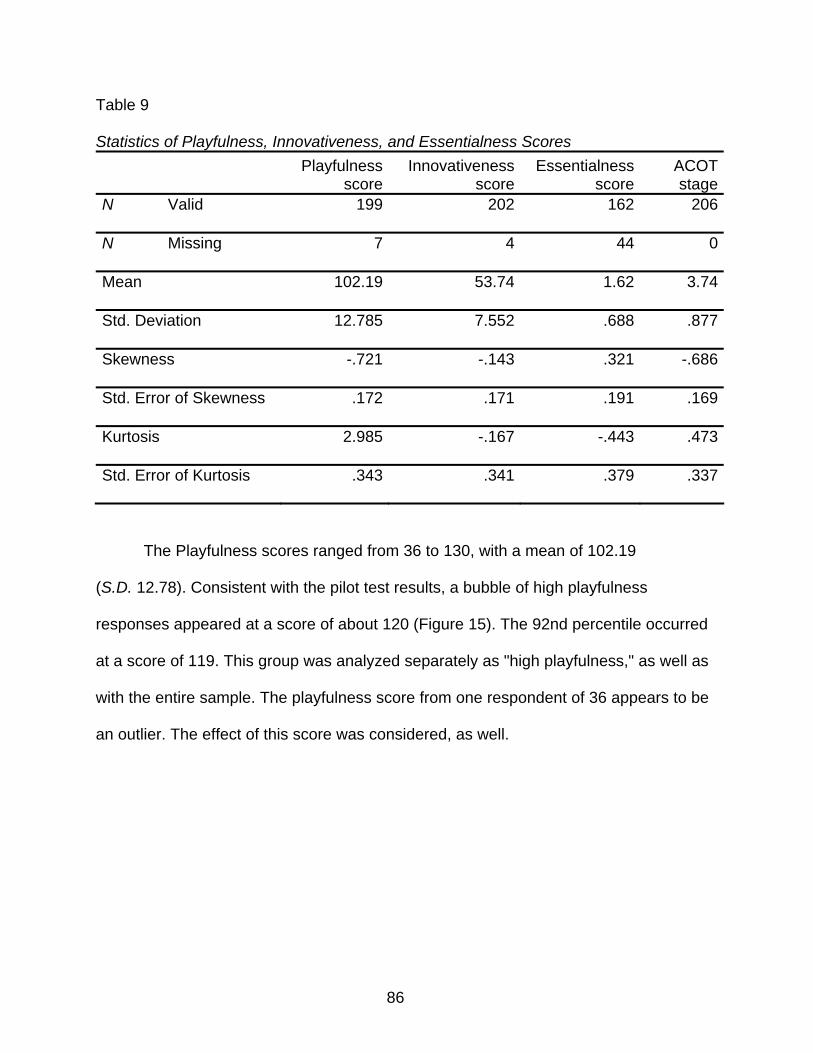
86
Table 9
Statistics of Playfulness, Innovativeness, and Essentialness Scores Playfulness
score Innovativeness
scoreEssentialness
score ACOTstage
N Valid 199 202 162 206
N Missing 7 4 44 0
Mean 102.19 53.74 1.62 3.74
Std. Deviation 12.785 7.552 .688 .877
Skewness -.721 -.143 .321 -.686
Std. Error of Skewness .172 .171 .191 .169
Kurtosis 2.985 -.167 -.443 .473
Std. Error of Kurtosis .343 .341 .379 .337
The Playfulness scores ranged from 36 to 130, with a mean of 102.19
(S.D. 12.78). Consistent with the pilot test results, a bubble of high playfulness
responses appeared at a score of about 120 (Figure 15). The 92nd percentile occurred
at a score of 119. This group was analyzed separately as "high playfulness," as well as
with the entire sample. The playfulness score from one respondent of 36 appears to be
an outlier. The effect of this score was considered, as well.
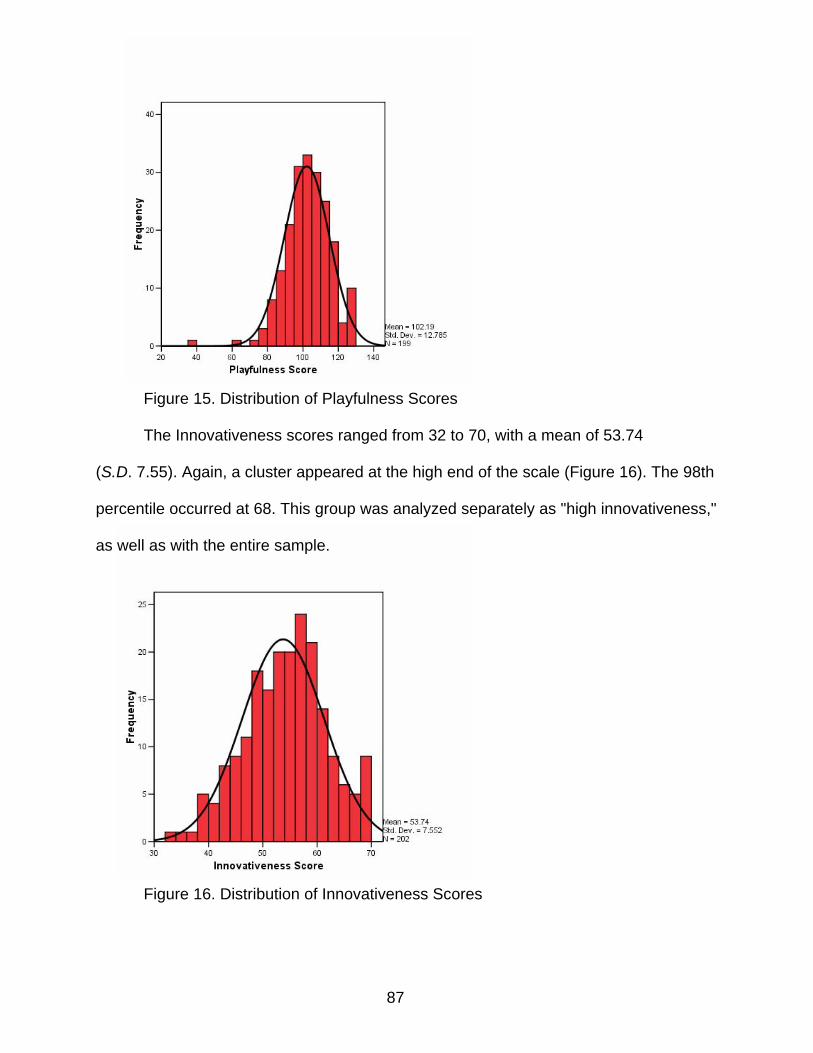
87
Figure 15. Distribution of Playfulness Scores
The Innovativeness scores ranged from 32 to 70, with a mean of 53.74
(S.D. 7.55). Again, a cluster appeared at the high end of the scale (Figure 16). The 98th
percentile occurred at 68. This group was analyzed separately as "high innovativeness,"
as well as with the entire sample.
Figure 16. Distribution of Innovativeness Scores
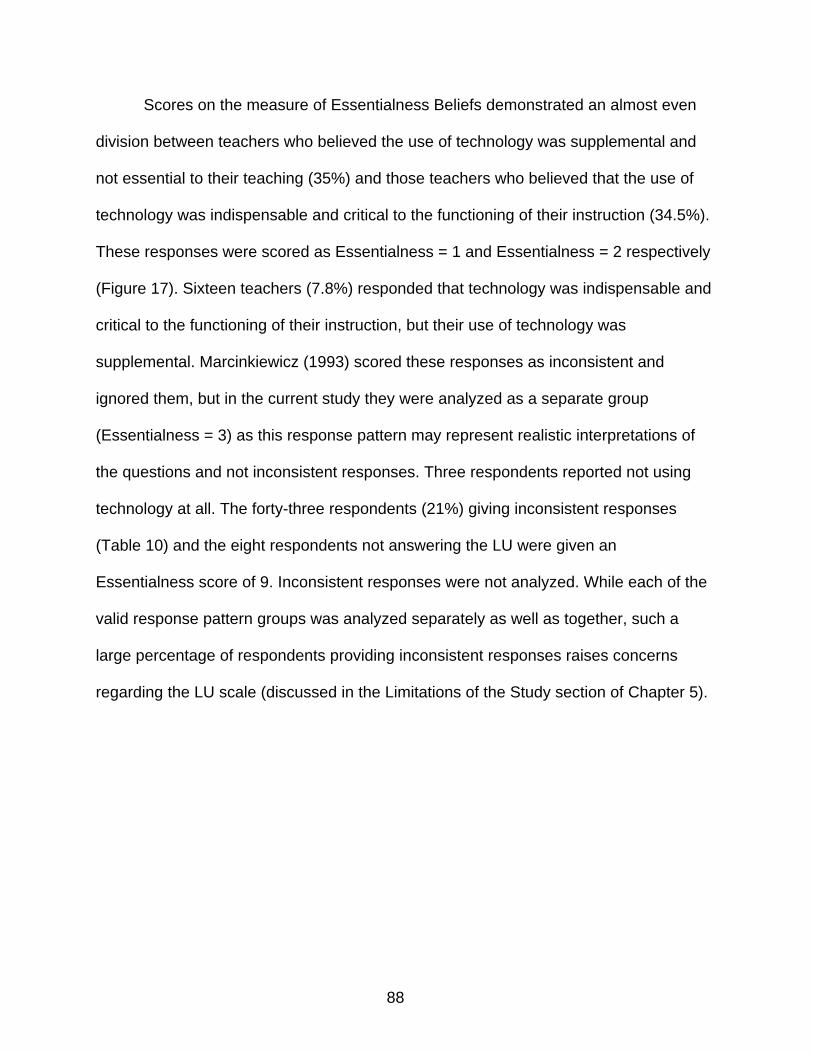
88
Scores on the measure of Essentialness Beliefs demonstrated an almost even
division between teachers who believed the use of technology was supplemental and
not essential to their teaching (35%) and those teachers who believed that the use of
technology was indispensable and critical to the functioning of their instruction (34.5%).
These responses were scored as Essentialness = 1 and Essentialness = 2 respectively
(Figure 17). Sixteen teachers (7.8%) responded that technology was indispensable and
critical to the functioning of their instruction, but their use of technology was
supplemental. Marcinkiewicz (1993) scored these responses as inconsistent and
ignored them, but in the current study they were analyzed as a separate group
(Essentialness = 3) as this response pattern may represent realistic interpretations of
the questions and not inconsistent responses. Three respondents reported not using
technology at all. The forty-three respondents (21%) giving inconsistent responses
(Table 10) and the eight respondents not answering the LU were given an
Essentialness score of 9. Inconsistent responses were not analyzed. While each of the
valid response pattern groups was analyzed separately as well as together, such a
large percentage of respondents providing inconsistent responses raises concerns
regarding the LU scale (discussed in the Limitations of the Study section of Chapter 5).
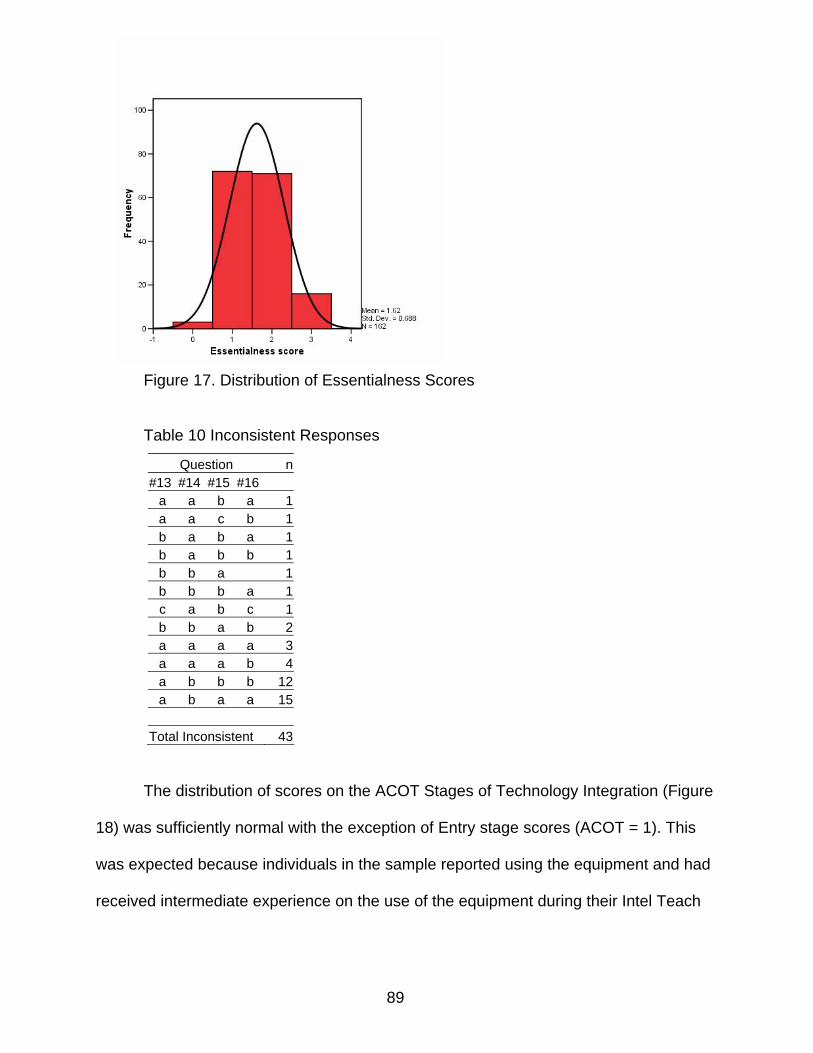
89
Figure 17. Distribution of Essentialness Scores
Table 10 Inconsistent Responses
Question n #13 #14 #15 #16
a a b a 1 a a c b 1 b a b a 1 b a b b 1 b b a 1 b b b a 1 c a b c 1 b b a b 2 a a a a 3 a a a b 4 a b b b 12 a b a a 15
Total Inconsistent 43
The distribution of scores on the ACOT Stages of Technology Integration (Figure
18) was sufficiently normal with the exception of Entry stage scores (ACOT = 1). This
was expected because individuals in the sample reported using the equipment and had
received intermediate experience on the use of the equipment during their Intel Teach
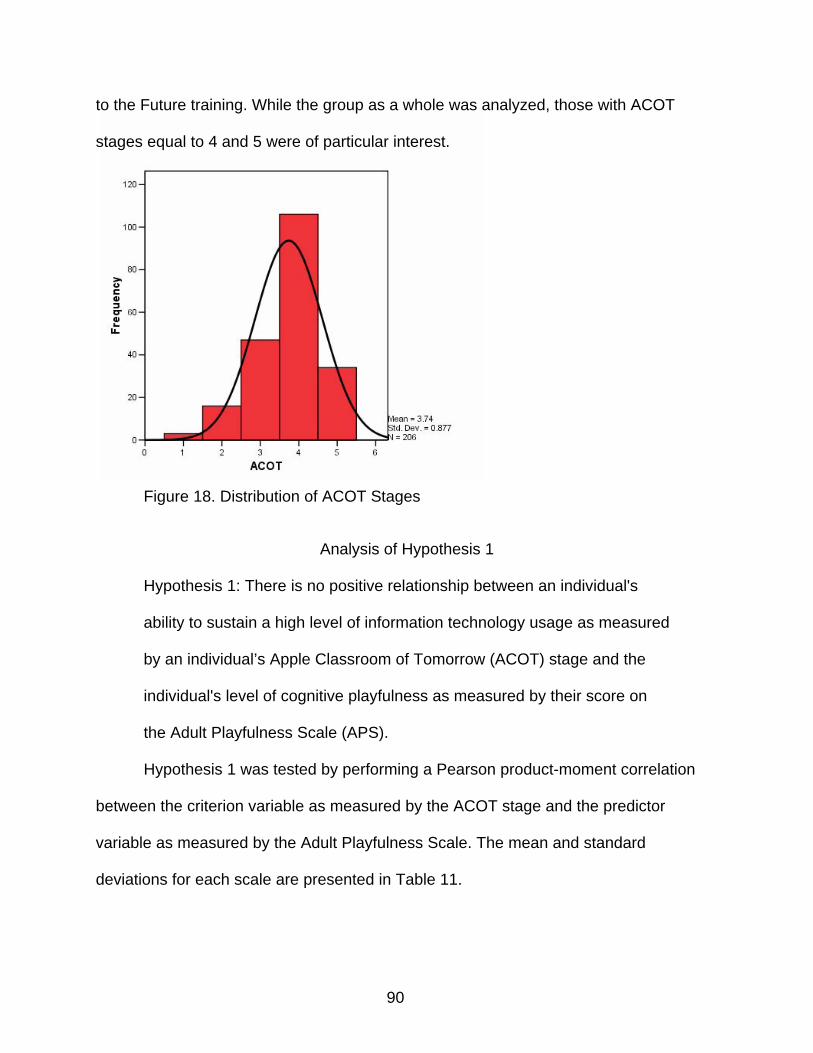
90
to the Future training. While the group as a whole was analyzed, those with ACOT
stages equal to 4 and 5 were of particular interest.
Figure 18. Distribution of ACOT Stages
Analysis of Hypothesis 1
Hypothesis 1: There is no positive relationship between an individual's
ability to sustain a high level of information technology usage as measured
by an individual’s Apple Classroom of Tomorrow (ACOT) stage and the
individual's level of cognitive playfulness as measured by their score on
the Adult Playfulness Scale (APS).
Hypothesis 1 was tested by performing a Pearson product-moment correlation
between the criterion variable as measured by the ACOT stage and the predictor
variable as measured by the Adult Playfulness Scale. The mean and standard
deviations for each scale are presented in Table 11.
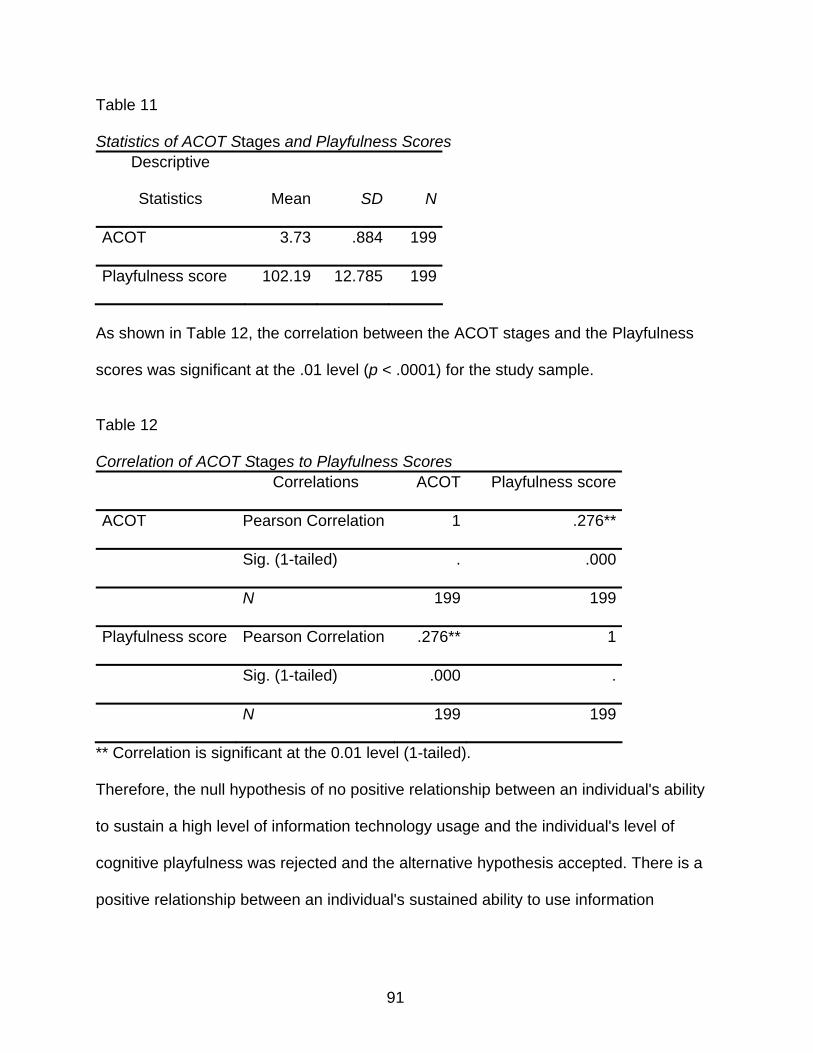
91
Table 11
Statistics of ACOT Stages and Playfulness Scores Descriptive
Statistics Mean SD N
ACOT 3.73 .884 199
Playfulness score 102.19 12.785 199
As shown in Table 12, the correlation between the ACOT stages and the Playfulness
scores was significant at the .01 level (p < .0001) for the study sample.
Table 12
Correlation of ACOT Stages to Playfulness Scores Correlations ACOT Playfulness score
ACOT Pearson Correlation 1 .276**
Sig. (1-tailed) . .000
N 199 199
Playfulness score Pearson Correlation .276** 1
Sig. (1-tailed) .000 .
N 199 199
** Correlation is significant at the 0.01 level (1-tailed). Therefore, the null hypothesis of no positive relationship between an individual's ability
to sustain a high level of information technology usage and the individual's level of
cognitive playfulness was rejected and the alternative hypothesis accepted. There is a
positive relationship between an individual's sustained ability to use information
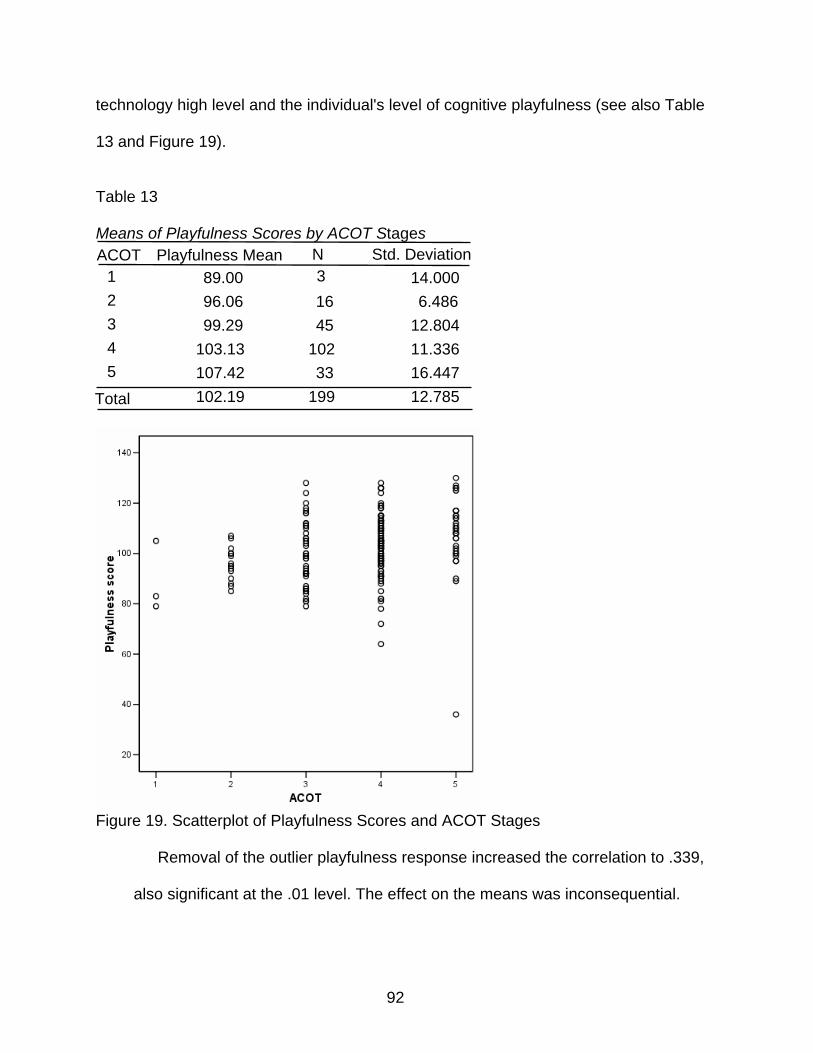
92
technology high level and the individual's level of cognitive playfulness (see also Table
13 and Figure 19).
Table 13
Means of Playfulness Scores by ACOT Stages
Figure 19. Scatterplot of Playfulness Scores and ACOT Stages
Removal of the outlier playfulness response increased the correlation to .339,
also significant at the .01 level. The effect on the means was inconsequential.
89.00 3 14.00096.06 16 6.48699.29 45 12.804
103.13 102 11.336107.42 33 16.447102.19 199 12.785
ACOT 1 2 3 4 5
Total
N Std. DeviationPlayfulness Mean
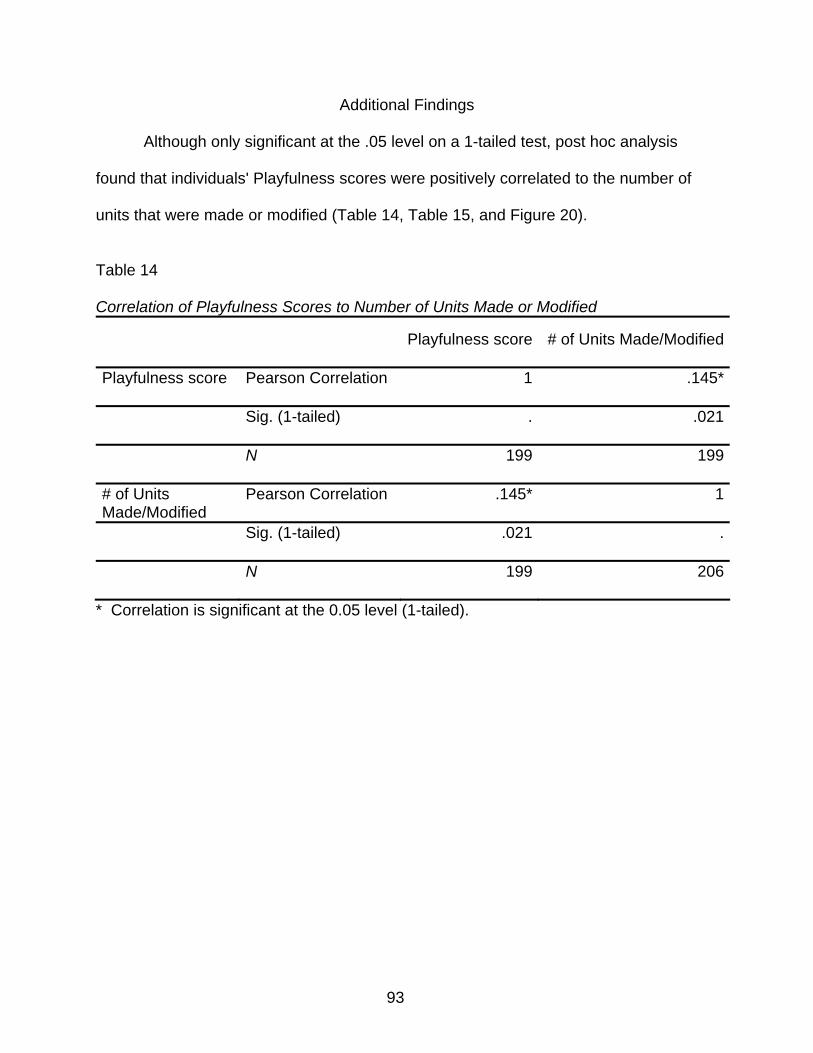
93
Additional Findings
Although only significant at the .05 level on a 1-tailed test, post hoc analysis
found that individuals' Playfulness scores were positively correlated to the number of
units that were made or modified (Table 14, Table 15, and Figure 20).
Table 14
Correlation of Playfulness Scores to Number of Units Made or Modified
Playfulness score # of Units Made/Modified
Playfulness score Pearson Correlation 1 .145*
Sig. (1-tailed) . .021
N 199 199
# of Units Made/Modified
Pearson Correlation .145* 1
Sig. (1-tailed) .021 .
N 199 206
* Correlation is significant at the 0.05 level (1-tailed).
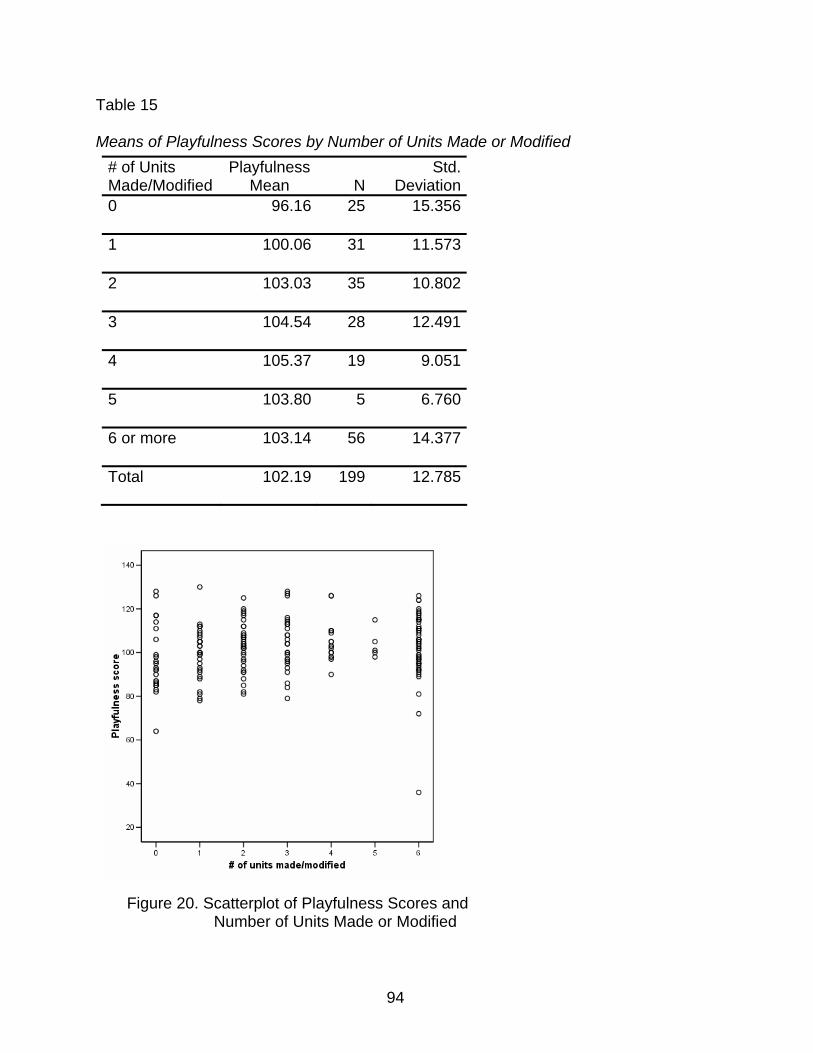
94
Table 15
Means of Playfulness Scores by Number of Units Made or Modified
Figure 20. Scatterplot of Playfulness Scores and Number of Units Made or Modified
# of Units Made/Modified
Playfulness Mean N
Std. Deviation
0 96.16 25 15.356
1 100.06 31 11.573
2 103.03 35 10.802
3 104.54 28 12.491
4 105.37 19 9.051
5 103.80 5 6.760
6 or more 103.14 56 14.377
Total 102.19 199 12.785
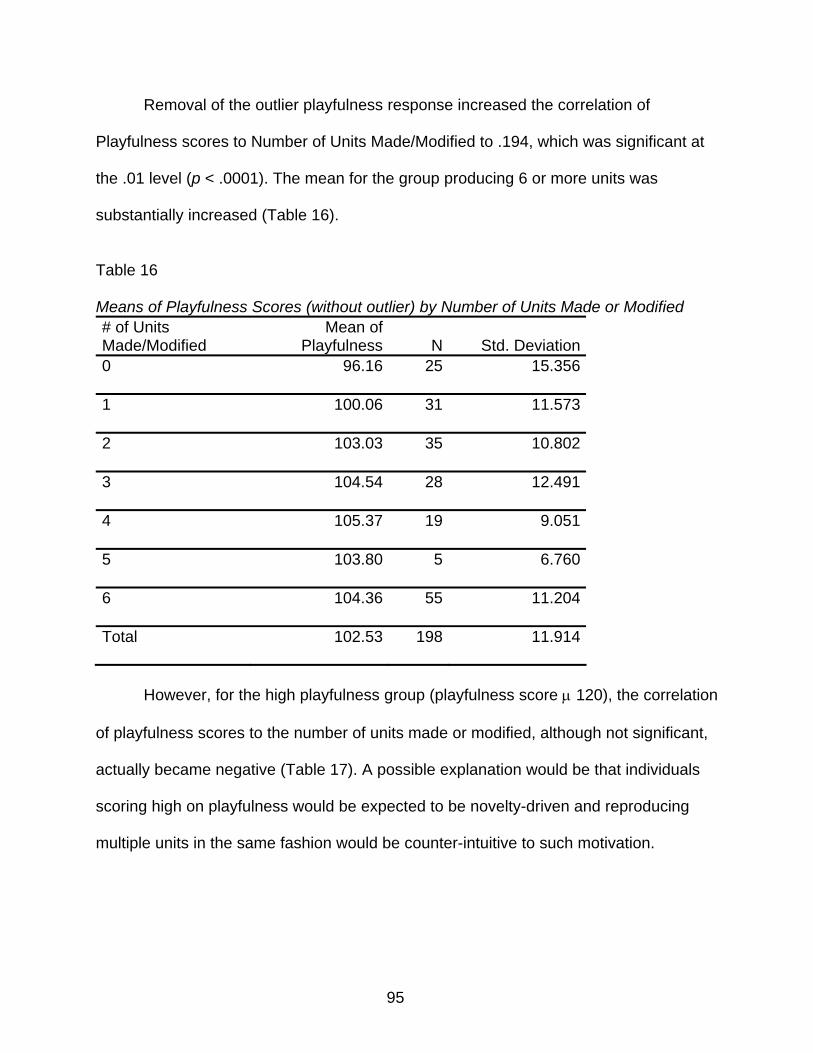
95
Removal of the outlier playfulness response increased the correlation of
Playfulness scores to Number of Units Made/Modified to .194, which was significant at
the .01 level (p < .0001). The mean for the group producing 6 or more units was
substantially increased (Table 16).
Table 16
Means of Playfulness Scores (without outlier) by Number of Units Made or Modified
# of Units Made/Modified
Mean of Playfulness N Std. Deviation
0 96.16 25 15.356
1 100.06 31 11.573
2 103.03 35 10.802
3 104.54 28 12.491
4 105.37 19 9.051
5 103.80 5 6.760
6 104.36 55 11.204
Total 102.53 198 11.914
However, for the high playfulness group (playfulness score µ 120), the correlation
of playfulness scores to the number of units made or modified, although not significant,
actually became negative (Table 17). A possible explanation would be that individuals
scoring high on playfulness would be expected to be novelty-driven and reproducing
multiple units in the same fashion would be counter-intuitive to such motivation.
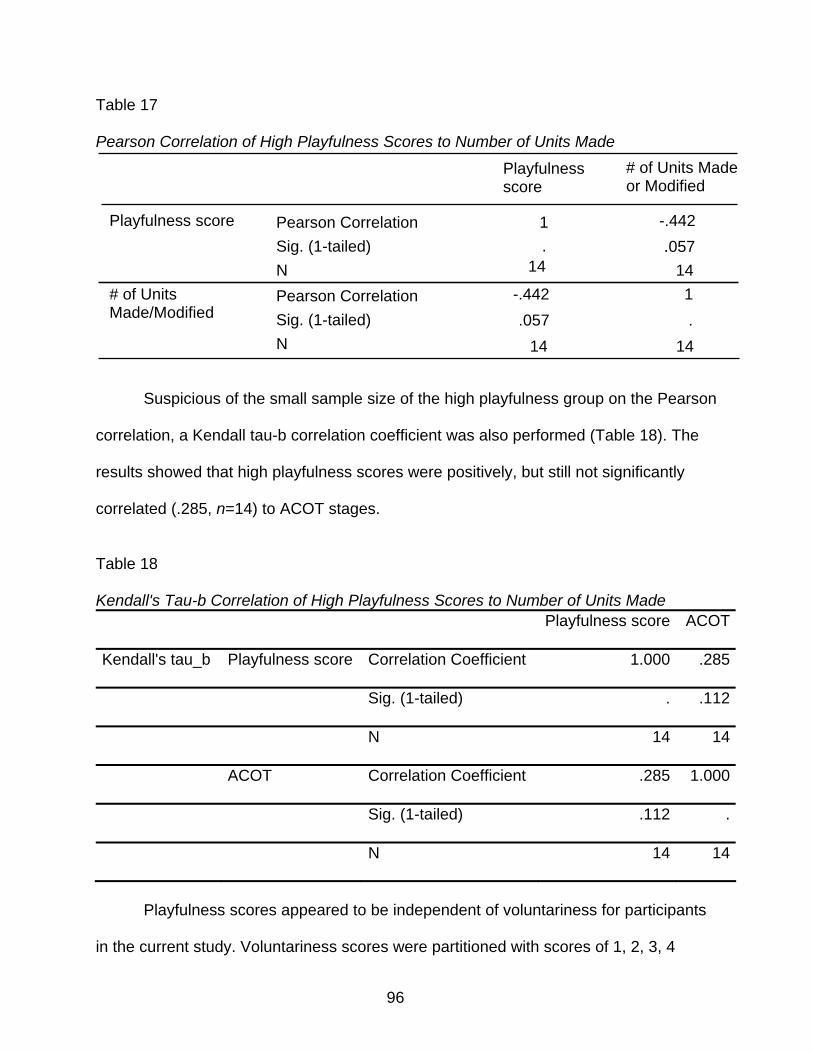
96
Table 17
Pearson Correlation of High Playfulness Scores to Number of Units Made
Suspicious of the small sample size of the high playfulness group on the Pearson
correlation, a Kendall tau-b correlation coefficient was also performed (Table 18). The
results showed that high playfulness scores were positively, but still not significantly
correlated (.285, n=14) to ACOT stages.
Table 18
Kendall's Tau-b Correlation of High Playfulness Scores to Number of Units Made Playfulness score ACOT
Kendall's tau_b Playfulness score Correlation Coefficient 1.000 .285
Sig. (1-tailed) . .112
N 14 14
ACOT Correlation Coefficient .285 1.000
Sig. (1-tailed) .112 .
N 14 14
Playfulness scores appeared to be independent of voluntariness for participants
in the current study. Voluntariness scores were partitioned with scores of 1, 2, 3, 4
1. .057
14 14-.442 1.057 .
14 14
Playfulness score
# of Units Made/Modified
Playfulness score
# of Units Made or Modified
Pearson CorrelationSig. (1-tailed)N Pearson CorrelationSig. (1-tailed)N
-.442
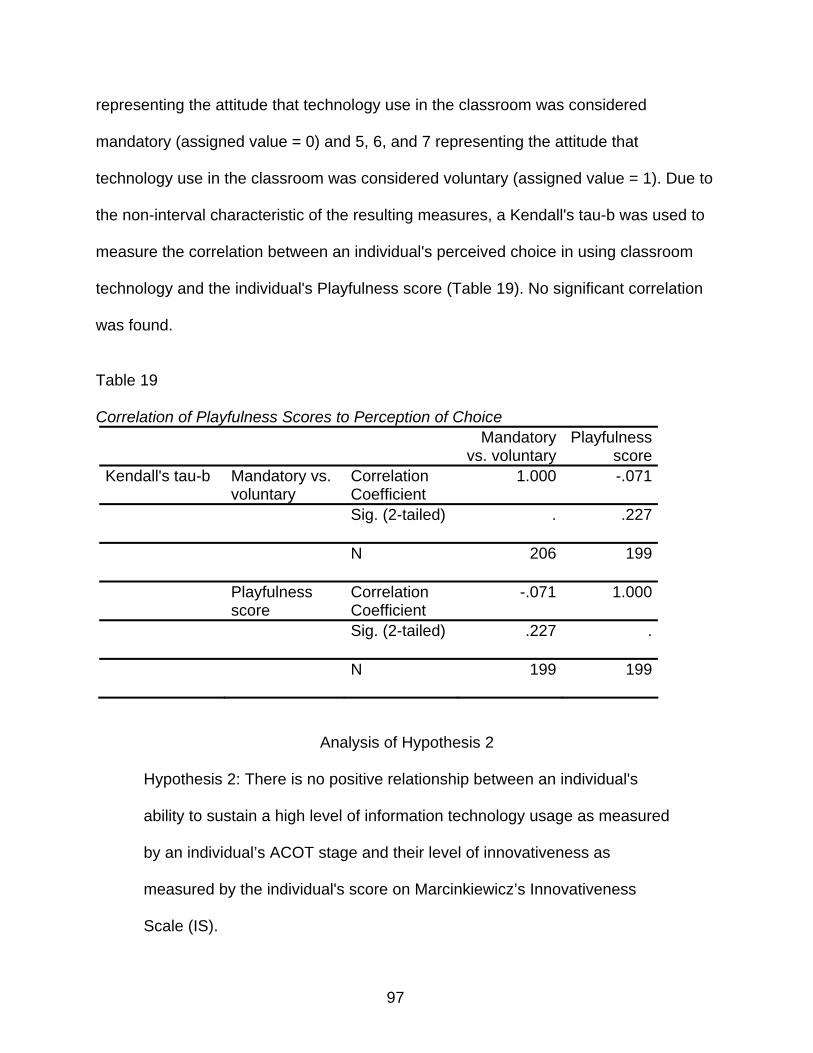
97
representing the attitude that technology use in the classroom was considered
mandatory (assigned value = 0) and 5, 6, and 7 representing the attitude that
technology use in the classroom was considered voluntary (assigned value = 1). Due to
the non-interval characteristic of the resulting measures, a Kendall's tau-b was used to
measure the correlation between an individual's perceived choice in using classroom
technology and the individual's Playfulness score (Table 19). No significant correlation
was found.
Table 19
Correlation of Playfulness Scores to Perception of Choice
Mandatory vs. voluntary
Playfulness score
Kendall's tau-b Mandatory vs. voluntary
Correlation Coefficient
1.000 -.071
Sig. (2-tailed) . .227
N 206 199
Playfulness score
Correlation Coefficient
-.071 1.000
Sig. (2-tailed) .227 .
N 199 199
Analysis of Hypothesis 2
Hypothesis 2: There is no positive relationship between an individual's
ability to sustain a high level of information technology usage as measured
by an individual’s ACOT stage and their level of innovativeness as
measured by the individual's score on Marcinkiewicz’s Innovativeness
Scale (IS).
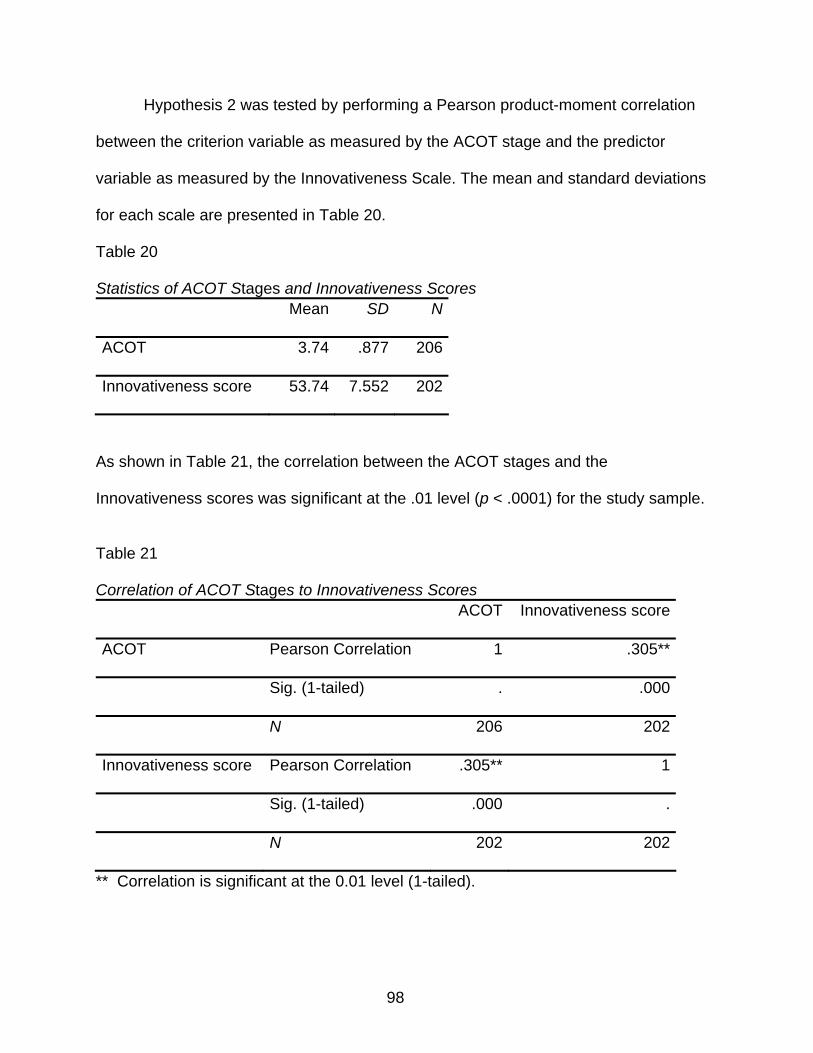
98
Hypothesis 2 was tested by performing a Pearson product-moment correlation
between the criterion variable as measured by the ACOT stage and the predictor
variable as measured by the Innovativeness Scale. The mean and standard deviations
for each scale are presented in Table 20.
Table 20
Statistics of ACOT Stages and Innovativeness Scores Mean SD N
ACOT 3.74 .877 206
Innovativeness score 53.74 7.552 202
As shown in Table 21, the correlation between the ACOT stages and the
Innovativeness scores was significant at the .01 level (p < .0001) for the study sample.
Table 21
Correlation of ACOT Stages to Innovativeness Scores ACOT Innovativeness score
ACOT Pearson Correlation 1 .305**
Sig. (1-tailed) . .000
N 206 202
Innovativeness score Pearson Correlation .305** 1
Sig. (1-tailed) .000 .
N 202 202
** Correlation is significant at the 0.01 level (1-tailed).
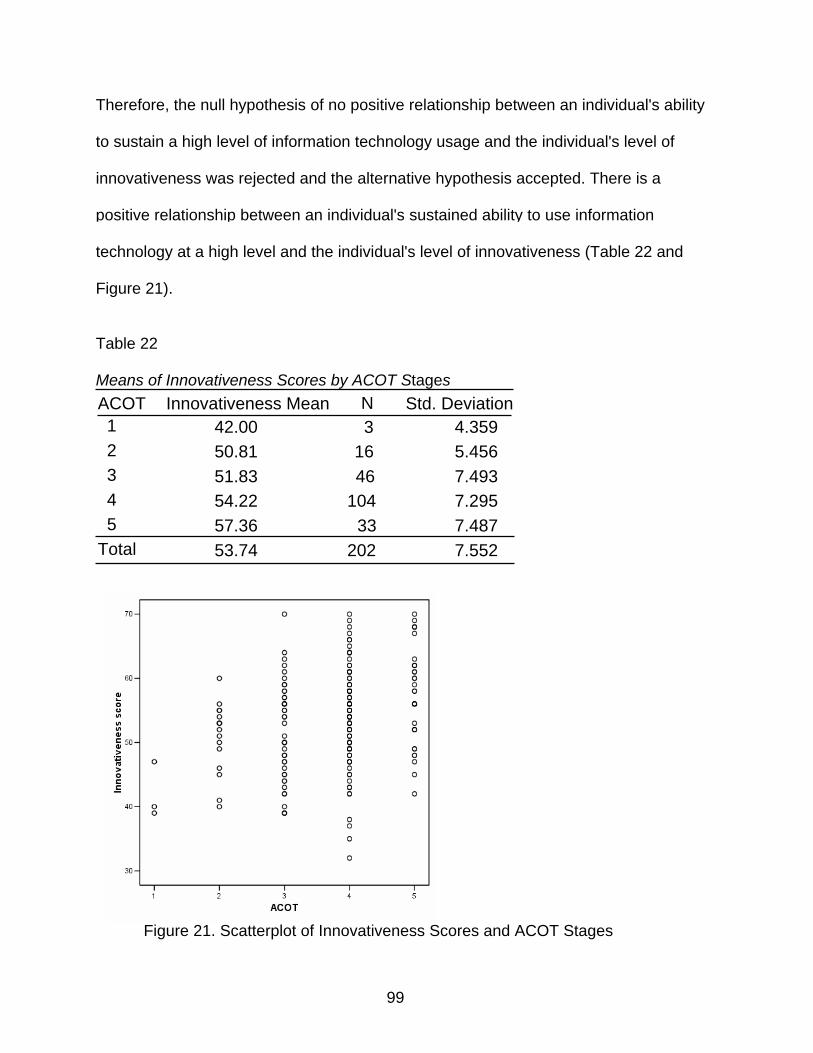
99
Therefore, the null hypothesis of no positive relationship between an individual's ability
to sustain a high level of information technology usage and the individual's level of
innovativeness was rejected and the alternative hypothesis accepted. There is a
positive relationship between an individual's sustained ability to use information
technology at a high level and the individual's level of innovativeness (Table 22 and
Figure 21).
Table 22
Means of Innovativeness Scores by ACOT Stages
Figure 21. Scatterplot of Innovativeness Scores and ACOT Stages
42.00 3 4.35950.81 16 5.45651.83 46 7.49354.22 104 7.29557.36 33 7.48753.74 202 7.552
ACOT 1 2 3 4 5
Total
Innovativeness Mean N Std. Deviation
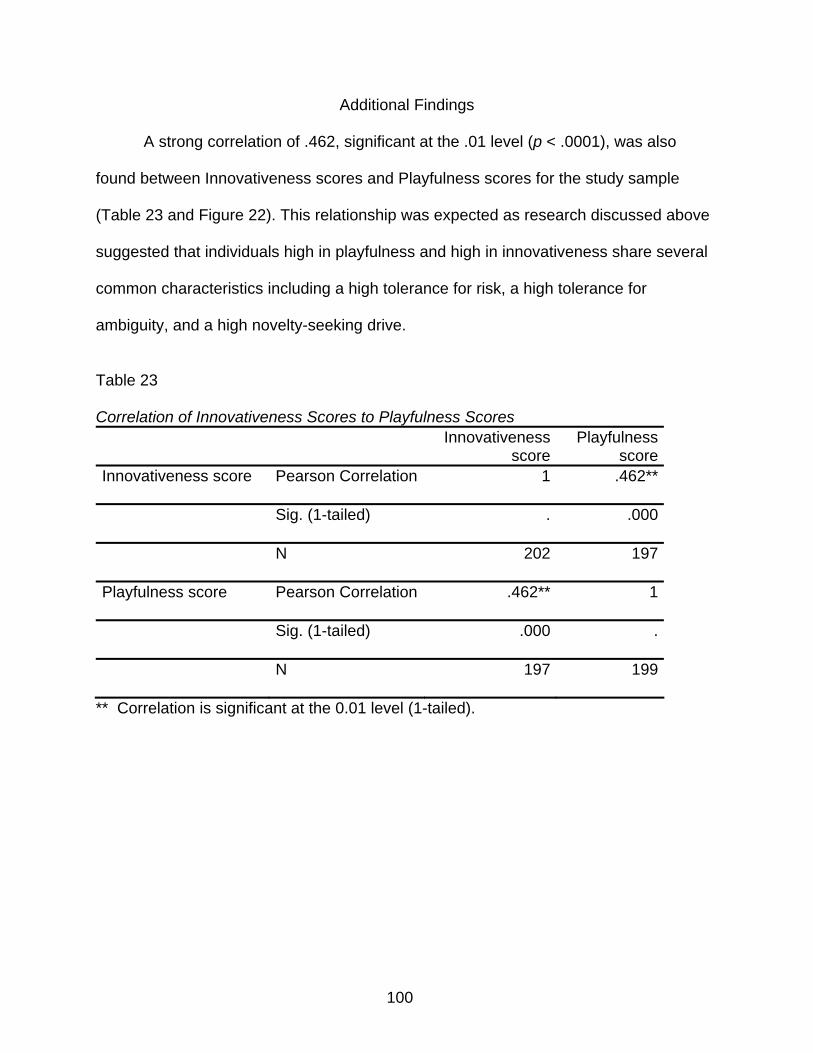
100
Additional Findings
A strong correlation of .462, significant at the .01 level (p < .0001), was also
found between Innovativeness scores and Playfulness scores for the study sample
(Table 23 and Figure 22). This relationship was expected as research discussed above
suggested that individuals high in playfulness and high in innovativeness share several
common characteristics including a high tolerance for risk, a high tolerance for
ambiguity, and a high novelty-seeking drive.
Table 23
Correlation of Innovativeness Scores to Playfulness Scores Innovativeness
score Playfulness
scoreInnovativeness score Pearson Correlation 1 .462**
Sig. (1-tailed) . .000
N 202 197
Playfulness score Pearson Correlation .462** 1
Sig. (1-tailed) .000 .
N 197 199
** Correlation is significant at the 0.01 level (1-tailed).
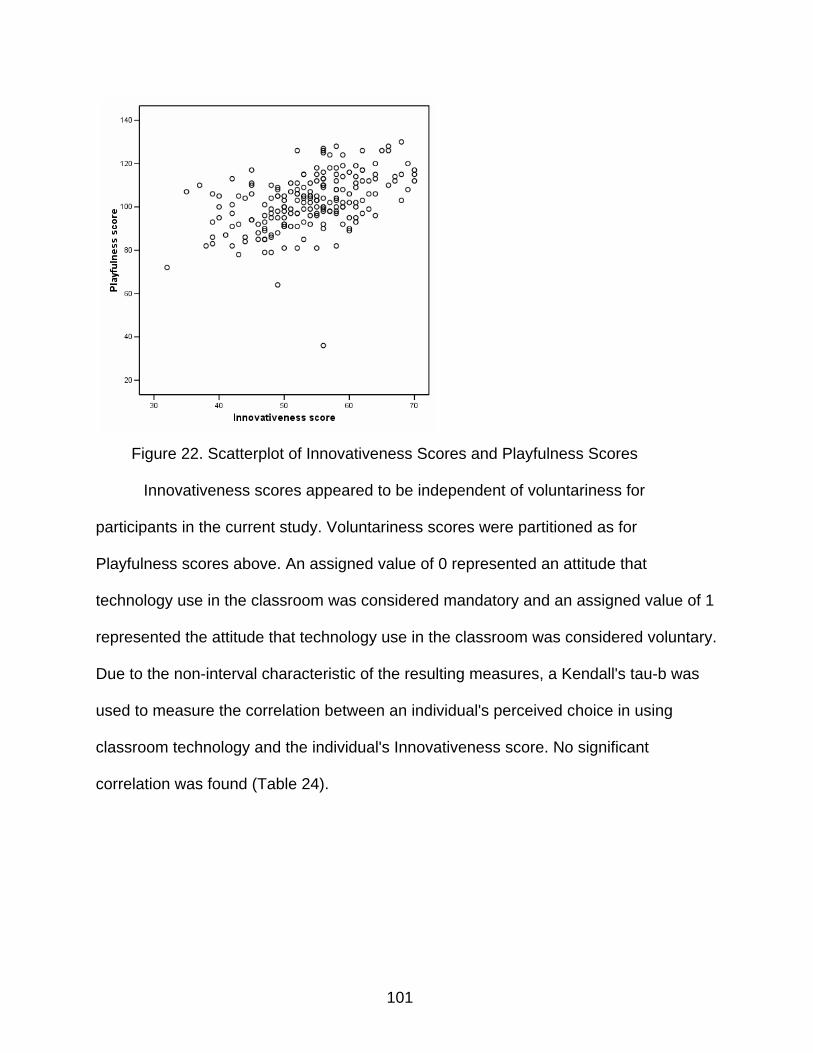
101
Figure 22. Scatterplot of Innovativeness Scores and Playfulness Scores
Innovativeness scores appeared to be independent of voluntariness for
participants in the current study. Voluntariness scores were partitioned as for
Playfulness scores above. An assigned value of 0 represented an attitude that
technology use in the classroom was considered mandatory and an assigned value of 1
represented the attitude that technology use in the classroom was considered voluntary.
Due to the non-interval characteristic of the resulting measures, a Kendall's tau-b was
used to measure the correlation between an individual's perceived choice in using
classroom technology and the individual's Innovativeness score. No significant
correlation was found (Table 24).
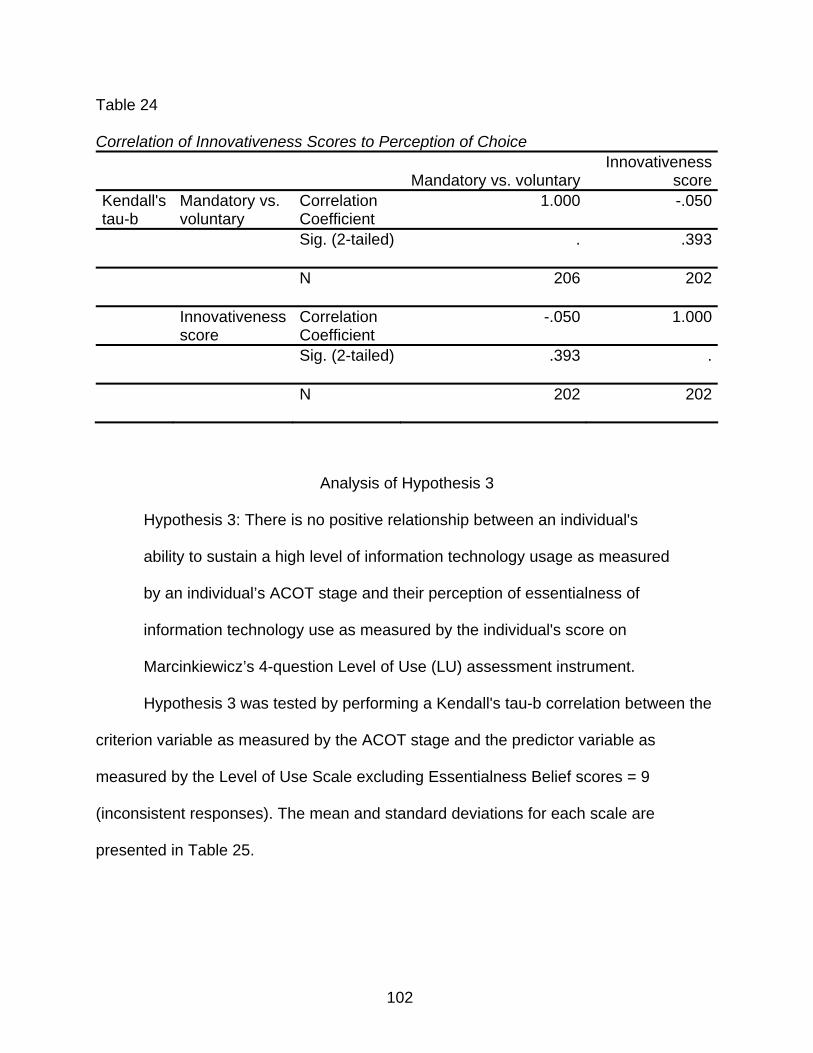
102
Table 24
Correlation of Innovativeness Scores to Perception of Choice
Mandatory vs. voluntary Innovativeness
score Kendall's tau-b
Mandatory vs. voluntary
Correlation Coefficient
1.000 -.050
Sig. (2-tailed) . .393
N 206 202
Innovativeness score
Correlation Coefficient
-.050 1.000
Sig. (2-tailed) .393 .
N 202 202
Analysis of Hypothesis 3
Hypothesis 3: There is no positive relationship between an individual's
ability to sustain a high level of information technology usage as measured
by an individual’s ACOT stage and their perception of essentialness of
information technology use as measured by the individual's score on
Marcinkiewicz’s 4-question Level of Use (LU) assessment instrument.
Hypothesis 3 was tested by performing a Kendall's tau-b correlation between the
criterion variable as measured by the ACOT stage and the predictor variable as
measured by the Level of Use Scale excluding Essentialness Belief scores = 9
(inconsistent responses). The mean and standard deviations for each scale are
presented in Table 25.
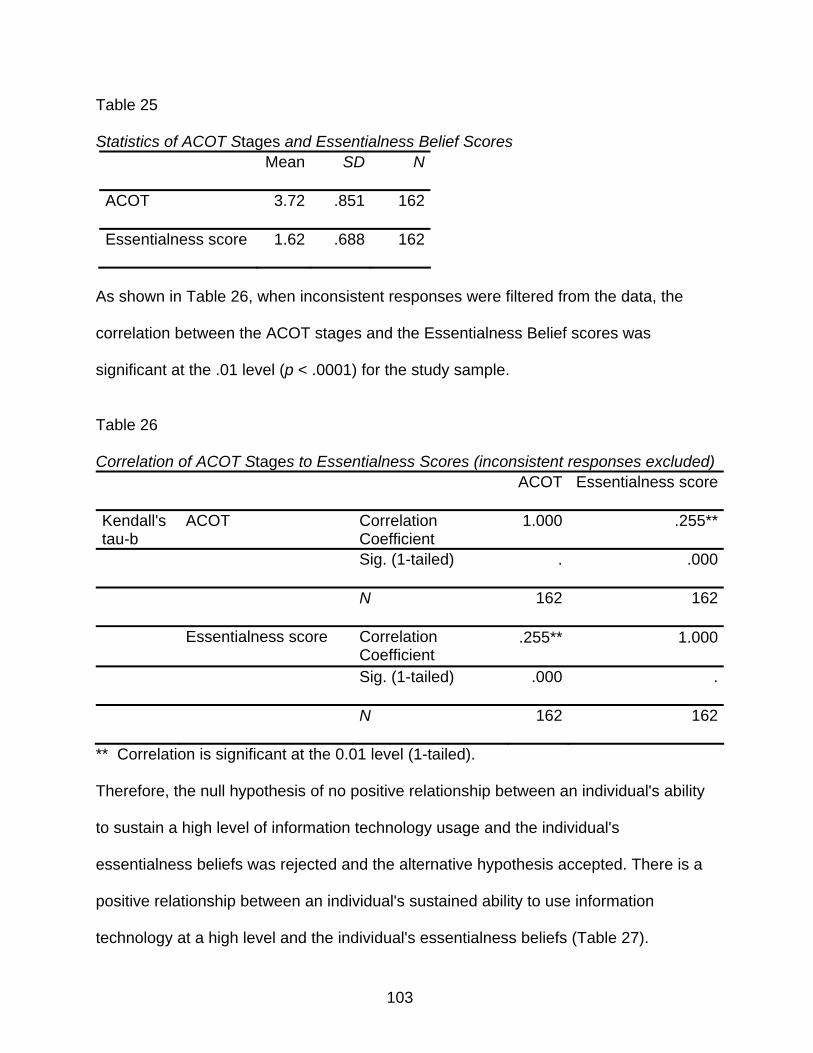
103
Table 25
Statistics of ACOT Stages and Essentialness Belief Scores Mean SD N
ACOT 3.72 .851 162
Essentialness score 1.62 .688 162
As shown in Table 26, when inconsistent responses were filtered from the data, the
correlation between the ACOT stages and the Essentialness Belief scores was
significant at the .01 level (p < .0001) for the study sample.
Table 26
Correlation of ACOT Stages to Essentialness Scores (inconsistent responses excluded) ACOT Essentialness score
Kendall's tau-b
ACOT Correlation Coefficient
1.000 .255**
Sig. (1-tailed) . .000
N 162 162
Essentialness score Correlation Coefficient
.255** 1.000
Sig. (1-tailed) .000 .
N 162 162
** Correlation is significant at the 0.01 level (1-tailed). Therefore, the null hypothesis of no positive relationship between an individual's ability
to sustain a high level of information technology usage and the individual's
essentialness beliefs was rejected and the alternative hypothesis accepted. There is a
positive relationship between an individual's sustained ability to use information
technology at a high level and the individual's essentialness beliefs (Table 27).
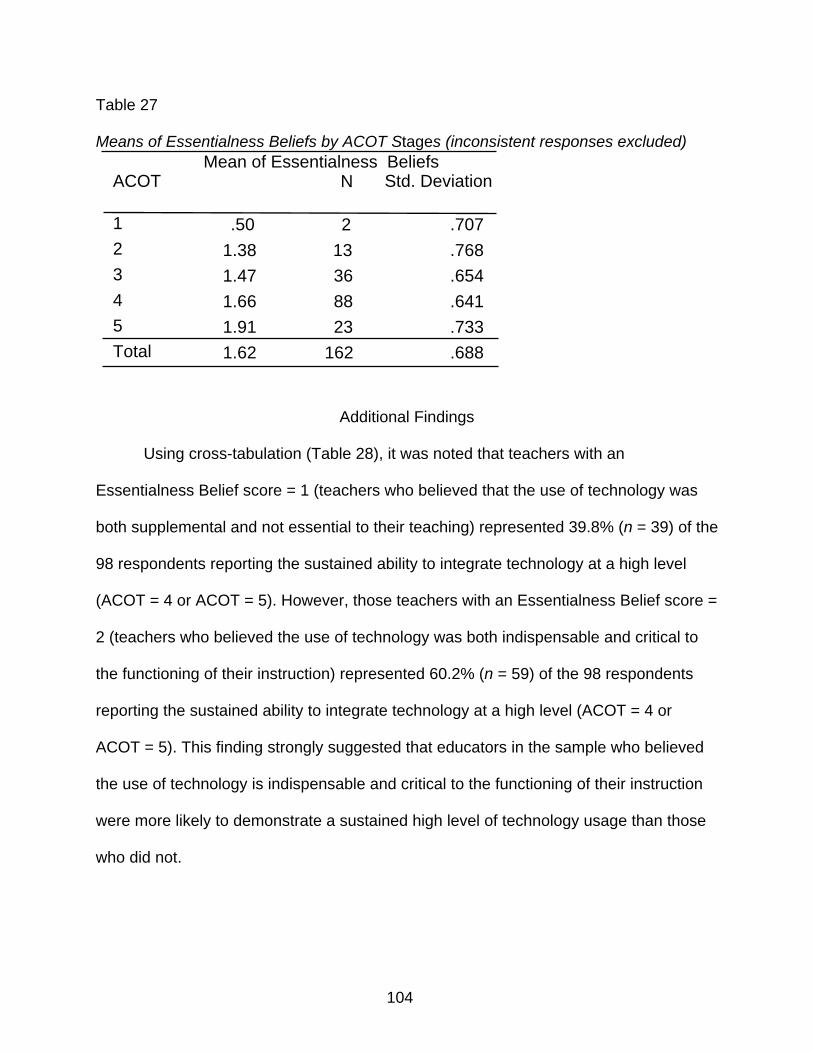
104
Table 27
Means of Essentialness Beliefs by ACOT Stages (inconsistent responses excluded)
Additional Findings
Using cross-tabulation (Table 28), it was noted that teachers with an
Essentialness Belief score = 1 (teachers who believed that the use of technology was
both supplemental and not essential to their teaching) represented 39.8% (n = 39) of the
98 respondents reporting the sustained ability to integrate technology at a high level
(ACOT = 4 or ACOT = 5). However, those teachers with an Essentialness Belief score =
2 (teachers who believed the use of technology was both indispensable and critical to
the functioning of their instruction) represented 60.2% (n = 59) of the 98 respondents
reporting the sustained ability to integrate technology at a high level (ACOT = 4 or
ACOT = 5). This finding strongly suggested that educators in the sample who believed
the use of technology is indispensable and critical to the functioning of their instruction
were more likely to demonstrate a sustained high level of technology usage than those
who did not.
.50 2 .7071.38 13 .7681.47 36 .6541.66 88 .6411.91 23 .7331.62 162 .688
ACOT
1 2 3 4 5 Total
N Std. DeviationMean of Essentialness Beliefs
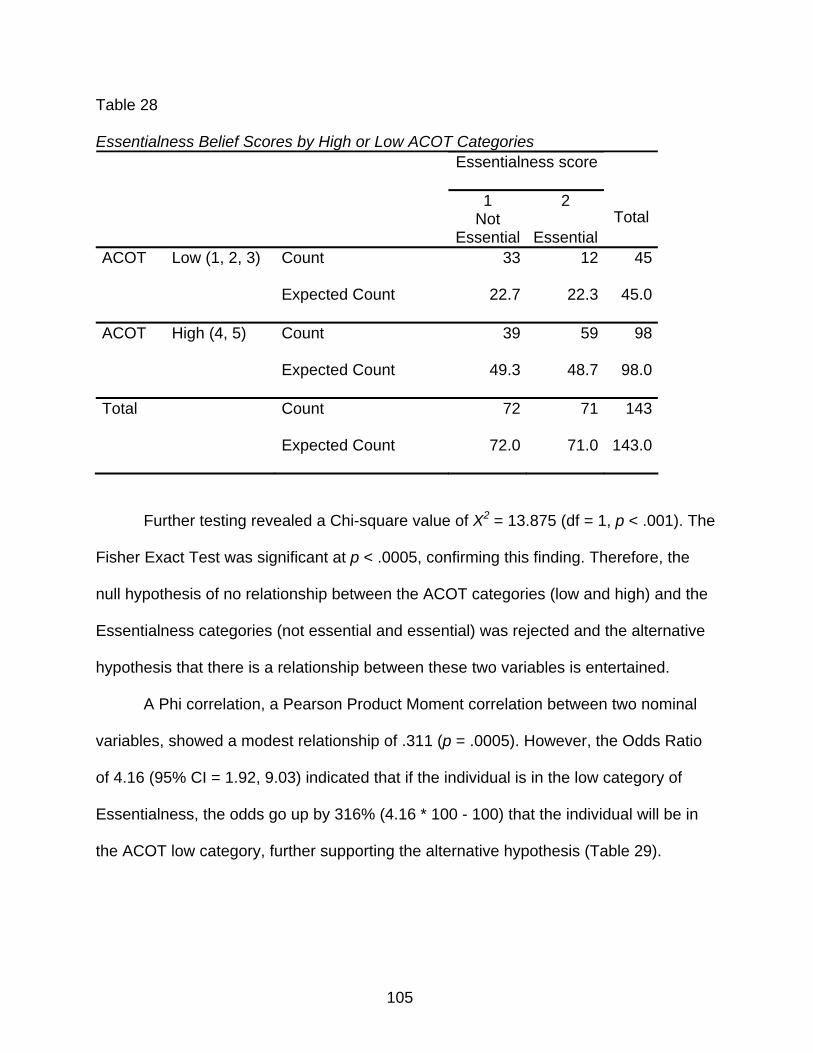
105
Table 28
Essentialness Belief Scores by High or Low ACOT Categories Essentialness score
1
Not Essential
2
Essential Total
ACOT Low (1, 2, 3) Count 33 12 45
Expected Count 22.7 22.3 45.0
ACOT High (4, 5) Count 39 59 98
Expected Count 49.3 48.7 98.0
Total Count 72 71 143
Expected Count 72.0 71.0 143.0
Further testing revealed a Chi-square value of X2 = 13.875 (df = 1, p < .001). The
Fisher Exact Test was significant at p < .0005, confirming this finding. Therefore, the
null hypothesis of no relationship between the ACOT categories (low and high) and the
Essentialness categories (not essential and essential) was rejected and the alternative
hypothesis that there is a relationship between these two variables is entertained.
A Phi correlation, a Pearson Product Moment correlation between two nominal
variables, showed a modest relationship of .311 (p = .0005). However, the Odds Ratio
of 4.16 (95% CI = 1.92, 9.03) indicated that if the individual is in the low category of
Essentialness, the odds go up by 316% (4.16 * 100 - 100) that the individual will be in
the ACOT low category, further supporting the alternative hypothesis (Table 29).
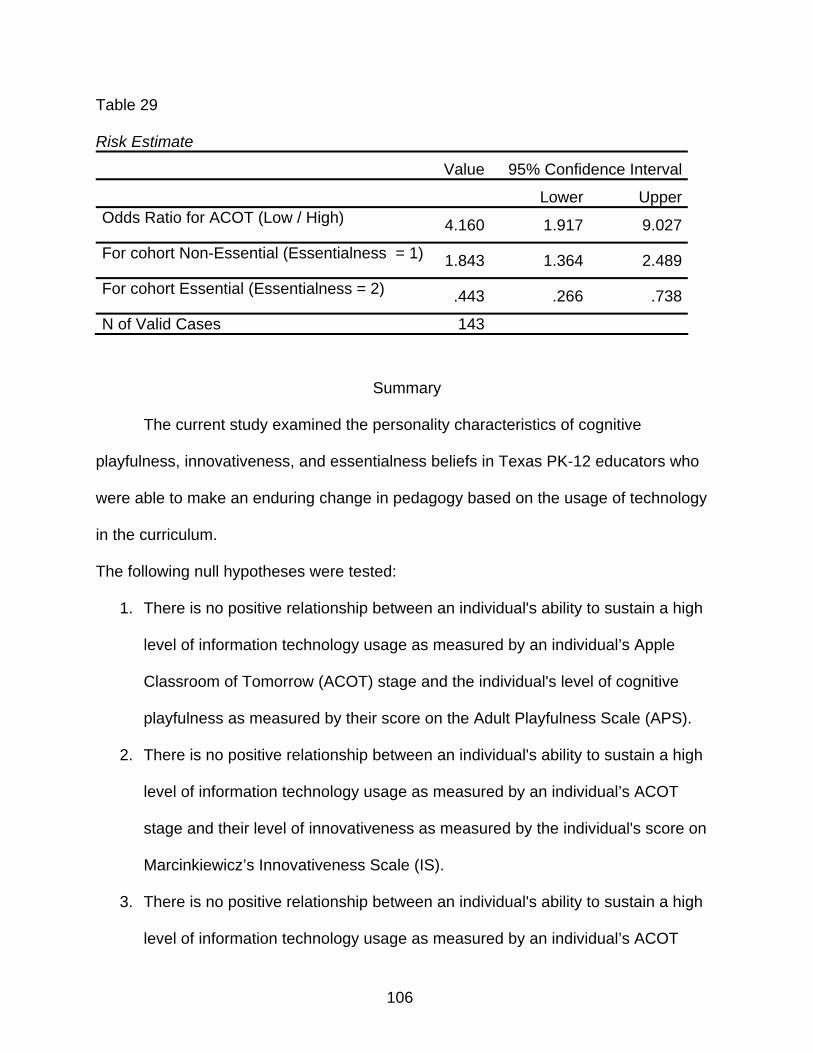
106
Table 29
Risk Estimate
Value 95% Confidence Interval
Lower UpperOdds Ratio for ACOT (Low / High) 4.160 1.917 9.027
For cohort Non-Essential (Essentialness = 1) 1.843 1.364 2.489
For cohort Essential (Essentialness = 2) .443 .266 .738
N of Valid Cases 143
Summary
The current study examined the personality characteristics of cognitive
playfulness, innovativeness, and essentialness beliefs in Texas PK-12 educators who
were able to make an enduring change in pedagogy based on the usage of technology
in the curriculum.
The following null hypotheses were tested:
1. There is no positive relationship between an individual's ability to sustain a high
level of information technology usage as measured by an individual’s Apple
Classroom of Tomorrow (ACOT) stage and the individual's level of cognitive
playfulness as measured by their score on the Adult Playfulness Scale (APS).
2. There is no positive relationship between an individual's ability to sustain a high
level of information technology usage as measured by an individual’s ACOT
stage and their level of innovativeness as measured by the individual's score on
Marcinkiewicz’s Innovativeness Scale (IS).
3. There is no positive relationship between an individual's ability to sustain a high
level of information technology usage as measured by an individual’s ACOT
107
stage and their perception of essentialness of information technology use as
measured by the individual's score on Marcinkiewicz’s 4-question Level of Use
(LU) assessment instrument.
The respondents were 86% female and 14% male and ranged in age from 27 to
68. Ninety-five percent reported more than 5 years experience with technology and over
half reported 10 or more years experience with technology. Ninety-six percent reported
using computers at home.
Availability of information technology in the classroom did not seem to be a major
barrier for teachers in the study sample. Eighty-two percent of the respondents in the
current study reported the use of classroom computers, 72% reported use of computer
labs, 31% reported use of mobile labs, and 63% reported use of computer presentation
devices. Only 5 of the respondents reported no use of technology in the classroom in
the form of classroom computers, computer labs, or mobile labs. Sixty-five percent
reported use of digital cameras.
Of the respondents, 92.5% agreed that the use of technology was relevant to
teaching (Usefulness) and 93% reported feeling capable to competently use technology
in teaching (Ease of Use). These results were not unexpected considering the fact that
all of the respondents had participated in the Intel Teach to the Future program, an
intermediate-level training focusing on the integration of technology into the curriculum.
The three predictor variables, playfulness, innovativeness, and essentialness
beliefs, each showed a significant correlation to an individual's sustained ability to
integrate technology at a high level in the classroom. The testing of Hypotheses 1, 2,
108
and 3 all revealed significant results at the .01 level. All null hypotheses were rejected.
All predictor variables were correlated to the criterion variable for the study sample.
Further analysis of the sample data showed an educator's level of playfulness
was related to the likelihood of continued development of such units by the teacher, as
well as to the teacher's level of innovativeness. Also, educators in the study sample who
believed the use of technology was indispensable and critical to the functioning of their
instruction were more likely to demonstrate a sustained high level of technology use
than those who did not.
109
CHAPTER 5
DISCUSSION, CONCLUSIONS, AND RECOMMENDATIONS
Introduction
The current study adds to the body of research regarding the effects of
playfulness, innovativeness, and beliefs of essentialness on educators who are able to
make enduring changes. The use of information technology in the curriculum is
important for the provision of a well-rounded education. For the purposes of the current
study, teachers at ACOT stages 4 and 5 were defined as demonstrating the ability to
integrate technology at a high level, as teachers at those stages are prepared to use
technology to make major modifications in their pedagogy or teaching style. Teachers at
ACOT stages 4 and 5 can integrate information technologies in the classroom as
appropriate to support student-directed learning focusing on higher-order thinking and
problem solving. This ability to integrate technology at a high level was considered for
the purposes of the current study to be sustained if the level was present three years
after the initial Intel Teach to the Future professional development experience.
It is evident that many educators believe in the importance of utilizing information
technology by both their words and their actions. Districts often list technology
integration as one of the major goals in the district's long-range plan, yet the term
remains vaguely defined and few teachers achieve a high level of sustained information
technology usage in their classrooms. Schools and districts continue to spend huge
amounts of limited budgets on information technologies for the classroom, yet many of
these tools remain under-utilized. Many teachers are trained in both skills of technology
use and methods of technology integration, yet these activities often remain
110
supplemental to the curriculum. The research questions of the current study attempted
to identify additional factors that may be utilized to help the educational community
better manage the rampant changes in technology and better utilize the resources
teachers have.
Summary of Findings
The current study attempted to examine the personality characteristics of
cognitive playfulness, innovativeness, and essentialness beliefs in educators who were
able to make an enduring change in pedagogy based on the usage of technology in the
curriculum. The element of pedagogy referred to in the current study was the effortless
use of technology beyond simple productivity such as word processing of reports. The
pedagogy sought included the use of various information technologies to accomplish a
variety of instructional and management goals and the development of new learning
environments that are constructivist-based. Based on this definition of change in
pedagogy, the Apple Classroom of Tomorrow (ACOT) Stages of Technology Integration
was administered as a measure of the criterion variable, the ability to use information
technology at a high level. Entry stage (ACOT = 1) referred to a teacher who was still
learning the basics of a technology. At the Adoption stage (ACOT = 2), the teacher was
beginning to use the technology for classroom management duties and to support
traditional instruction. A teacher enters the Adaption stage (ACOT = 3) when use of
software, such as word processors and spreadsheets or commercially produced content
area programs, supports the individual's original instruction style. At the Appropriation
stage (ACOT = 4), the focus turns to new approaches to teaching, such as
collaborative, project-based technology use, and technology becomes one of several
111
instructional tools. At the Invention stage (ACOT = 5), the highest ACOT stage, teachers
reported a readiness to adjust their fundamental perceptions of instruction toward the
usage of technology as a flexible tool. For the purposes of the current study, teachers at
ACOT stages 4 and 5 were defined as reporting the ability to integrate technology at a
high level as teachers at those levels are prepared to use technology to make major
modifications in the way instruction is delivered. This ability to integrate technology at a
high level was considered for the purposes of the current study to be sustained if the
level was present three years past the initial professional development experience.
The following null hypotheses were tested:
1. There is no positive relationship between an individual's ability to sustain a high
level of information technology usage as measured by an individual’s Apple
Classroom of Tomorrow (ACOT) stage and the individual's level of cognitive
playfulness as measured by their score on the Adult Playfulness Scale (APS).
2. There is no positive relationship between an individual's ability to sustain a high
level of information technology usage as measured by an individual’s ACOT
stage and their level of innovativeness as measured by the individual's score on
Marcinkiewicz’s Innovativeness Scale (IS).
3. There is no positive relationship between an individual's ability to sustain a high
level of information technology usage as measured by an individual’s ACOT
stage and their perception of essentialness of information technology use as
measured by the individual's score on Marcinkiewicz’s 4-question Level of Use
(LU) assessment instrument.
112
Appropriate correlation coefficients were calculated for each research question
using alpha = .01 as the criterion for rejection of the null hypotheses. Research question
1 examined whether individuals who were playful were more likely to continue to
demonstrate an ability to use technology in the classroom at a high level than those who
were less playful. A significant correlation was found in the sample group between
Playfulness scores and ACOT stages. Post hoc tests revealed that there was also a
relationship for individuals in the current study between the Playfulness scores and the
number of units an individual made or modified. However, when those individuals who
scored high in playfulness (120 and above) were analyzed separately, the correlation
ceased to be significant and even became marginally negative. While this may be a
factor of the small sample size of those with high playfulness scores, it may also reflect
the fact that highly playful individuals tend to be novelty-driven and may find
reproducing multiple units in the same fashion too repetitive. It is possible that
individuals with high playfulness have already moved on to more creative educational
endeavors, with or without the use of instructional technologies. Also, a high level of
technology use may already be such an integral part of their pedagogy that its daily
occurrences are no longer noticed.
Research question 2 addressed whether individuals who are highly innovative
were more likely to continue to demonstrate an ability to use technology in the
classroom at a high level than those who were less innovative. A significant correlation
was found in the sample group between Innovativeness scores and ACOT stages. Post
hoc tests revealed that a strong correlation also existed between innovativeness scores
and playfulness scores for individuals in the current study sample. This was not
113
surprising as the research describes the constructs of innovativeness and playfulness
as encompassing several of the same characteristics: a high tolerance for risk, a high
tolerance for ambiguity, a high level of creativity, and a high novelty-seeking drive.
Research question 3 asked if individuals who believed that information
technology use was critical and indispensable to their teaching were more likely to
continue to demonstrate an ability to use technology in the classroom at a high level
than those who believed that it was supplemental and not essential. A significant
correlation was found in the sample group between Essentialness Belief scores and
ACOT stages. Post hoc tests also revealed that teachers in the current study sample
who believed the use of technology was indispensable and critical to the functioning of
their instruction represented a disproportionate amount of those individuals with high
ACOT stages (ACOT = 4 or 5), further supporting the concept that essentialness
significantly impacts the sustained high level of information technology use in the
classroom.
Limitations of the Study
This correlational study utilized classroom teachers from 33 school districts and
one private school in North Central Texas who were first-year participants in a 3-year
educational technology integration grant program, Intel® Teach to the Future. Of the
1,748 participants who took part in the first year of the program through the UNT RTA,
only 206 complete questionnaires were returned. Although 26% of those contacted
returned questionnaires, the number of individuals returning completed questionnaires
represented only 12% of the original class members. The small response rate places
114
doubt on the generalizability of the results to Intel Teach to the Future participants as a
group.
The individuals in the sample shared several unique features that may affect
generalizability of the study results. The group represented individuals who worked in
districts that applied to participate in the first year of the Intel Teach to the Future
program. This fact may reflect a more general district-wide attitude toward innovation or
risk-taking in these districts. While the incentives for the individuals to participate in the
program varied from district to district, from "it's a condition of employment" to stipends
of several hundred dollars, the districts did choose to participate in the program.
Participating districts did, for the most part, strongly encourage individuals to participate
in the program. Also, since the sample of educators selected represents only individuals
from central Texas, the current study may have limited generalizability to other regions
and districts.
The constructs in the current study are by their very nature indistinct and difficult
to clearly define. For the purposes of the current study, limitations on their definitions
are applied and the definitions may not necessarily coincide exactly with the definition of
the study participants. Every attempt to clarify constructs with the participants was
made.
Additional concerns developed throughout the study based on two of the
measurement instruments selected. Marcinkiewicz's Levels of Use scale proved to be
problematic. Many individuals had difficulty providing consistent response patterns as
defined by Marcinkiewicz to the four-question, forced-answer instrument. Although
Marcinkiewicz (1993) made reference to inconsistent answers, he made no reference to
115
the percentage of respondents who gave inconsistent answers. In the current study,
only 169 respondents produced consistent responses, while 112 either failed to answer
that portion of the survey instrument or gave inconsistent responses to the four
questions. Such a large percentage of respondents giving inconsistent responses brings
the validity of the instrument into question.
The Apple Classroom of Tomorrow (ACOT) Stages of Technology Integration
scale was used to measure the criterion variable of an individual's ability to use
technology at a high level, in part because the ACOT program adhered to the
constructivist philosophy of collaborative, student-directed learning. The ability to use
technology at a high level was considered for the purposes of the current study to be
sustained if it was still present three years after the initial exposure to the Intel Teach to
the Future program. The instructions on the ACOT Stages of Technology Integration
scale asked the individual to select the category that best described their current level of
understanding and use of information technology for teaching. The ACOT stages
ranged from stage 1 (I am trying to learn the basics of using technology.) to stage 5 (I
am prepared to develop entirely new learning environments that utilize technology as a
flexible tool.).
The descriptions given for Entry stage (ACOT = 1), Adoption stage (ACOT = 2),
and Adaption stage (ACOT = 3) are fairly clear and understandable. However, at the
Appropriation stage (ACOT = 4) and the Invention stage (ACOT = 5), when the focus
was meant to be on new approaches to learning, such as collaborative, project-based
technology use, the wording may not be concise or descriptive enough to convey the
intended level of integration. For certain teachers who reported themselves at ACOT
116
stage 4, the phrase "a variety of instructional and management goals" may still imply
teacher-directed instructional goals and not constructivist goals. At the Invention stage
(ACOT = 5), the highest ACOT stage, the phrase "prepared to develop" implies intention
and not necessarily actual use. Because several previous studies (Ajzen, 1991; Davis,
Bagozzi, and Warshaw,1989; Knezek, Christensen, Hancock, and Shoho, 2000; Taylor
and Todd, 1995) consistently showed that behavioral intention is the strongest predictor
of actual use, this was deemed acceptable.
It became evident by the end of the study, however, that the five stages of the
ACOT scale may not have been enough levels to delineate a high level of technology
usage well. Another difficulty was the difference of opinion among experts in the field
regarding the use of the terms technology use and technology integration. The current
study demonstrated the need to more stringently define these terms as the field of study
matures. Such definitions are necessary to support robust research.
It is suggested that future studies consider the use of alternative scales, such as
the Levels of Technology Implementation (LoTi) developed by Dr. Christopher Moersch
(Moersch, 1995). Dr. Moersch developed the eight-level scale in an effort to accurately
measure authentic classroom technology use. The LoTi scale focuses on the use of
technology as an interactive learning medium integrated in an exemplary manner that
supports purposeful problem-solving, performance-based assessment practices, and
experiential learning. The eight levels of the scale appear to better differentiate a high
level of technology integration than the five ACOT stages.
117
Discussion
In agreement with Adams et al. (1992), the effects of both perceived usefulness
and perceived ease of use appeared to change over time through prolonged use of the
technology. Responses to questions regarding perceived usefulness and perceived
ease, historically the most major contributors to technology adoption (Davis, 1989),
showed that the teachers in the current study, as a whole, believed that the use of
technology was relevant to teaching and that they believed themselves capable to
competently use technology in teaching. The factors of Usefulness and Ease of Use
showed significant but only small correlations to the ACOT stages for individuals in the
study sample. This may imply that although most individuals in the current study believe
that educational technology is both useful and relatively easy to use, many may still not
use it regularly at a high level into their educational practices.
Lack of technology has often been listed as one the major barriers to technology
usage in the classroom. This sample of teachers appeared to have more than adequate
use of technology both at school and at home as well as several years of experience
using technology. Ninety-five percent reported using classroom computers, computer
labs, or mobile computer labs, and having more than 5 years experience with
technology. Over half of the respondents reported 10 or more years experience with
technology. It appears that computers in the respondents' districts may be becoming
almost as commonplace in the classroom as overhead projectors.
It is possible that in reference to the level of information technology use in the
classroom, Usefulness and Ease of Use are becoming non-issues for the teachers in
the current study. The reasons for this may relate to the popularity of computers at
118
home and the use of home computers for both personal and professional activities.
Ninety-six percent of the respondents reported using a computer at home. It is
conceivable that personal computers may finally be reaching the point where they
cease to be considered technology innovations and more often are considered a
standard appliance, like a television or refrigerator, which one would expect to find in
most homes.
Similar to the results of Moore and Benbasat (1991), the current study found
perceived voluntariness, the degree to which use of the innovation was perceived as
being voluntary, or of free will, to be more than a binary variable. However, the
responses did produce a decidedly bi-modal distribution indicating that in the study
sample there is a group of individuals who use technology in the classroom because it
is mandated and another group who use it either because they want to or because they
believe it is essential to the delivery of a well-rounded education. There did not,
however, appear to be any significant correlation between voluntariness and any other
variable with the group of teachers studied.
Over 60% of the respondents reported a change in their teaching styles and a
focus on essential questions when planning their lessons after participating in the Intel®
Teach to the Future program. Most educators would agree that this is good. This
implied shift to a more constructivist attitude of teaching, however, does not directly
imply a sustained high use of technology in the classroom. Constructivist lessons can
be delivered with little or no technology integration. Yet moving teachers toward a
constructivist style of teaching represents a logical step toward better utilizing whatever
educational tools are available, be they technology-based or not.
119
The Playfulness scores in the current study were found to reflect a normal
distribution. This supports the most commonly-used concept in the current literature that
defines play as a psychological predisposition or global trait that has been found to be
fairly stable across situations (Barnett, 1991; Lieberman, 1966, 1977; Singer and
Rummo, 1973). Unfortunately, it is this same stability that may prove to make it difficult
to alter an individual's playfulness level. However, the results of the current study imply
potential value for such an attempt.
Playfulness at work can encourage creative ideas and aid in the development of
an individual's flexibility (Ellis, 1973). Unfortunately, several negative outcomes are also
possible. Time wasting may result if the best procedure is already known. Even when
there are not actual negative effects from being too playful at work, there are also social
mores that strongly suggest that playfulness at work and certain other times is
inappropriate behavior. Perhaps changing social mores can be more easily addressed
as an approach to encourage productive and creative playfulness in individuals than
attempting to change personality traits.
Innovativeness, as well as playfulness, has been shown to be closely related to
creativity, productive thinking and problem solving and should therefore continue to be
explored as these qualities are highly valued in today's workplace. Yi, Tung, and Wu
(2003), found that individuals ranking high in technology innovativeness have a stronger
intrinsic motivation to use new technologies and enjoy the stimulation related to the
process of experimentation.
120
Conclusions
According to Rogers' theory, for an innovation to be adopted it must be perceived
as 1) having a relative advantage (being better than the existing situation), 2) being
consistent with the user's existing values, experiences, and needs, 3) easy to
understand and use, 4) easy to try out, and 5) easily observable. Based on the
responses to questions regarding technology competency, the importance of using
technology in the classroom, teaching styles, and use of technology, it would seem wise
when offering professional development to focus less on teaching technology skills in
isolation and more on modeling good teaching methods that actually integrate
technology at a high level so that teachers can easily observe and try out these
methods.
Barnett and Kleiber (1982) found that the home environment mediated
components of playfulness in children. Based on those findings and the results of the
current study, it is reasonable in situations in which the goal is for all group members to
adopt a new innovation to attempt to create a more playful, open environment where
risk taking is not only encouraged but even rewarded. Such an environment might place
the participants in a more playful and innovative mind-set, thus facilitating innovation
adoption. It is imperative that sufficient time for experimentation and play be included in
the professional development agenda, as these activities do take longer than direct
instruction.
Because the characteristics of both playfulness and innovation appear to be fairly
normally distributed, it would seem reasonable to assume that regardless of the
techniques employed to encourage expression of these characteristics, some
121
individuals would remain on the low end of the curve. With this in mind, however, it is
still a worthwhile goal to attempt to raise the median playfulness and innovativeness
scores of a group if implementation of an enduring change is the goal.
Recommendations for Future Study
The results of the current study open several avenues for future research. On the
topic of playfulness alone, there is a multitude of opportunities to delve more deeply into
the various definitions of playfulness and create measurement instruments for each
type. The only current Adult Playfulness Scale found created for use in the workplace
(Glynn & Webster, 1992) covers five factors: spontaneity, expressiveness, fun,
creativity, and silliness. Only two of those factors, spontaneity and creativity, specifically
address the construct of cognitive playfulness. Factors from other studies mentioned
above include social spontaneity, physical spontaneity, manifest joy, a sense of humor,
horseplay, a large range of social activities, hostile wit, and hurtful pranks. These
attributes are similar to those found by Lieberman: imaginativeness, humorous and
playful attitude, emotional expressiveness, novelty seeking, curiosity, openness, and
communicativeness. Perhaps some combination of these characteristics would more
specifically define cognitive playfulness. It is also recommended that a study consider
the effects of removing the terms conscientious and erratic from the Adult Playfulness
Scale. Both had a negative inter-item correlation in the current study, suggesting that
the use of the terms may not be completely clear.
In regard to innovativeness, the question must be raised as to when classroom
technology will cease to be considered an innovation. Computers began appearing in
classrooms around 1983, over 20 years ago, and a large percentage of the population
122
now have them in their homes. Innovation seems like a strange word to attach to
something that old that is in such common use. Perhaps it is time to study the under-
utilization of technology in the classroom from a different perspective than innovation
adoption theory.
The Essentialness Beliefs scale, based on the Level of Use Scale (Marcinkiewicz
1993, 1994), attempts to measure an interesting construct, but it appears that there are
serious issues with the wording of the statements. Semi-structured interviews of a
sample of the respondents might be useful in determining how the wording could be
improved to clarify the construct.
Several other personality characteristics remain as possible factors that may
affect a teacher's use of technology in the classroom. A large body of research exists
concerning intrinsic motivation and this construct has recently been broken down into 3
more specific sub-constructs: the need to know, the need to accomplish, and the need
to experience the stimulation. Measurement of these sub-constructs may prove useful in
areas such as career counseling. Gottfried (1990) found that individuals who reported
high intrinsic motivation were also found to be more persistent and showed a preference
for novel and difficult tasks. An extension of that work may be appropriately applied to
technology integration.
A desire for control and a tolerance for ambiguity were found to be significant
factors in an individual’s risk perception (Myers, Henderson-King, and Henderson-King,
1997). The possibility that self-efficacy, risk perception, and tolerance for ambiguity are
related to openness and emotional stability may indicate that self-efficacy, risk
perception, and tolerance for ambiguity may be measures of an individual's level of
123
playfulness. This cyclical line of thought opens an interesting area for future research.
Perhaps placing individuals in situations that appear risky but are actually safe would
give them successes and therefore build their risk tolerance.
Costa and McCrae (1992) used the NEO Five Factor model incorporating five
dimensions of personality: neuroticism, extroversion, openness, agreeableness, and
conscientiousness. That study found that individuals who rated higher on Openness
tended to be more unconventional and more open to broader and more innovative
experiences. Individuals with a lower openness rating tended to avoid unfamiliar
situations, which would likely include the highly unstable environment of technology.
Openness appears to be a multi-dimensional construct (Wild et al., 1995) and remains a
promising area for future research.
The construct of creativity is common in many studies of playfulness. This area
is relevant to future study, but is far too broad to be discussed in this paper. Since
creativity often reflects similar characteristics to playfulness, continued research in this
area is recommended.
Based on the findings of the current study it is recommended that further
research be done to investigate the numerous personality traits, such as playfulness,
innovativeness, openness, creativity, and risk-taking that might relate to technology
adoption and usage. When attempting to implement a systemic change related to
technology use, an individual's demonstration of such traits may be used as one
consideration in selecting initial participants who may be expected to become opinion
leaders for the remaining members of a group. Also, determining how to create a playful
124
learning environment may well lead to modifications of professional development and
other learning experiences to assist individuals in adapting better and faster to change.

125
APPENDIX A
UNIT PLAN TEMPLATE
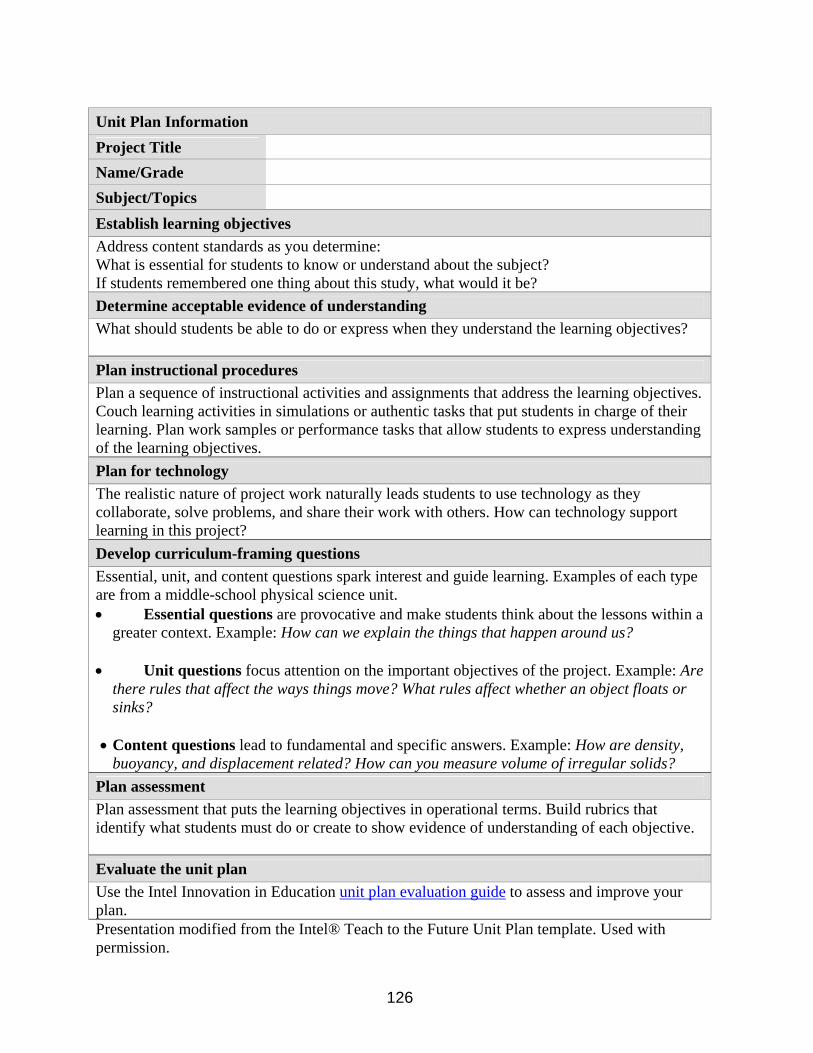
126
Presentation modified from the Intel® Teach to the Future Unit Plan template. Used with permission.
Unit Plan Information Project Title Name/Grade Subject/Topics Establish learning objectives Address content standards as you determine: What is essential for students to know or understand about the subject? If students remembered one thing about this study, what would it be? Determine acceptable evidence of understanding What should students be able to do or express when they understand the learning objectives? Plan instructional procedures Plan a sequence of instructional activities and assignments that address the learning objectives. Couch learning activities in simulations or authentic tasks that put students in charge of their learning. Plan work samples or performance tasks that allow students to express understanding of the learning objectives. Plan for technology The realistic nature of project work naturally leads students to use technology as they collaborate, solve problems, and share their work with others. How can technology support learning in this project? Develop curriculum-framing questions Essential, unit, and content questions spark interest and guide learning. Examples of each type are from a middle-school physical science unit. • Essential questions are provocative and make students think about the lessons within a
greater context. Example: How can we explain the things that happen around us? • Unit questions focus attention on the important objectives of the project. Example: Are
there rules that affect the ways things move? What rules affect whether an object floats or sinks?
• Content questions lead to fundamental and specific answers. Example: How are density,
buoyancy, and displacement related? How can you measure volume of irregular solids? Plan assessment Plan assessment that puts the learning objectives in operational terms. Build rubrics that identify what students must do or create to show evidence of understanding of each objective. Evaluate the unit plan Use the Intel Innovation in Education unit plan evaluation guide to assess and improve your plan.

127
APPENDIX B
THEORETICAL MODEL
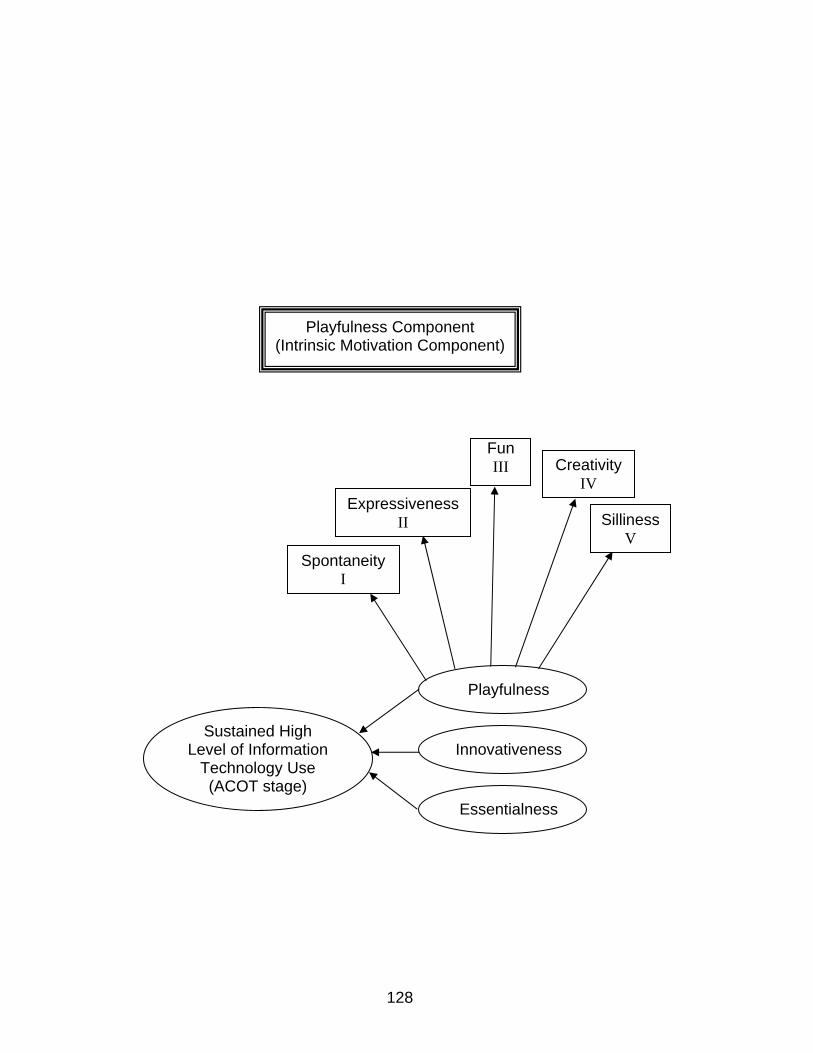
128
Playfulness Component (Intrinsic Motivation Component)
Essentialness
Sustained High Level of Information
Technology Use (ACOT stage)
Playfulness
Innovativeness
SpontaneityI
ExpressivenessII
Fun III Creativity
IV
SillinessV

129
APPENDIX C
SURVEY INSTRUMENT
130
INSIGHT Instrument Library
Home Overview News About Contact Us
Cognitive Playfulness and Technologies survey
The purpose of the following survey is to collect data for research related to a doctoral dissertation in Information Science. The survey consists of 6 sections consisting of 53 questions on 7 screens and should take less than 20 minutes to complete. Please allow enough time to complete the survey in one attempt and do not skip any of the first 51 questions. The last two questions are optional.
All responses are completely confidential. You may receive a descriptive summary of the results of this study and be entered into a drawing for a key disk by giving your email address at the end of the survey. Thank you for your support in this effort.
Please note: For the purpose of this study, the term information technology refers to not only computers, but several other semi-conductor-based tools such as personal digital assistants, Smartboards® , digital cameras, digital video cameras, Web cams, GPS units, and related peripherals such as probes used in the process of instruction.
I have read the Consent Form and I agree to it and wish to complete the survey.
Proceed to section 1
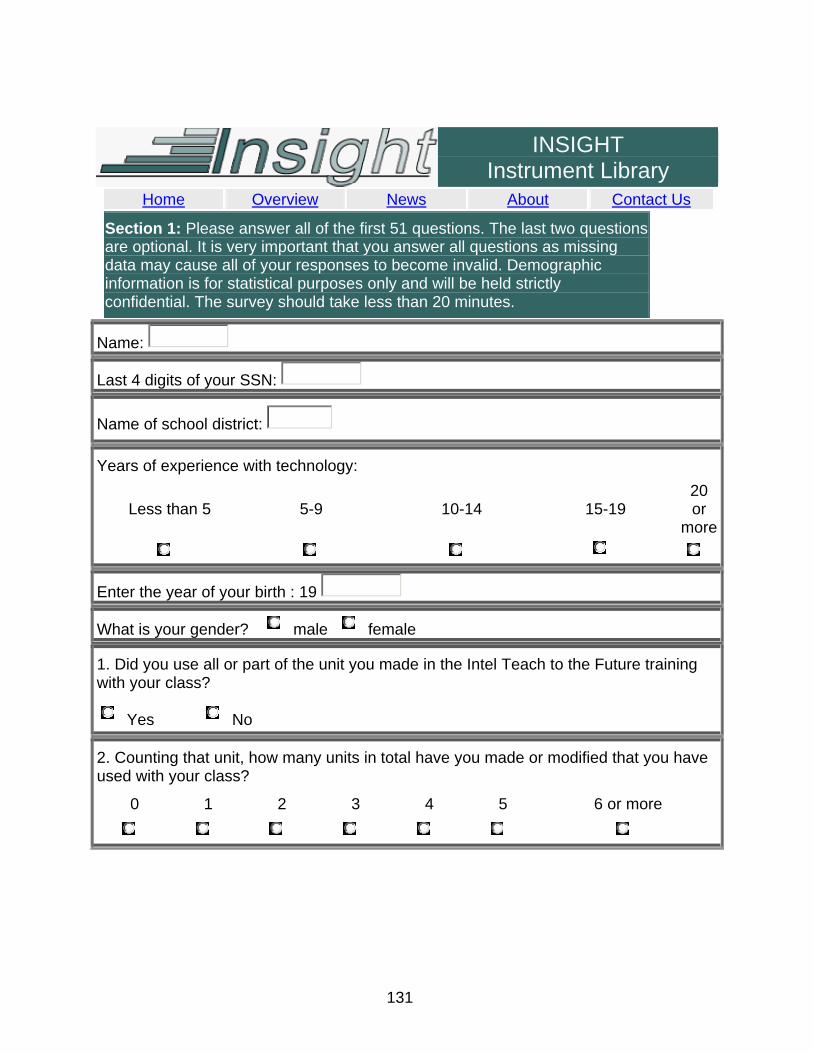
131
INSIGHT Instrument Library
Home Overview News About Contact Us
Section 1: Please answer all of the first 51 questions. The last two questions are optional. It is very important that you answer all questions as missing data may cause all of your responses to become invalid. Demographic information is for statistical purposes only and will be held strictly confidential. The survey should take less than 20 minutes.
Name:
Last 4 digits of your SSN:
Name of school district:
Years of experience with technology:
Less than 5 5-9 10-14 15-19 20 or
more
Enter the year of your birth : 19
What is your gender? male female
1. Did you use all or part of the unit you made in the Intel Teach to the Future training with your class?
Yes No
2. Counting that unit, how many units in total have you made or modified that you have used with your class?
0 1 2 3 4 5 6 or more
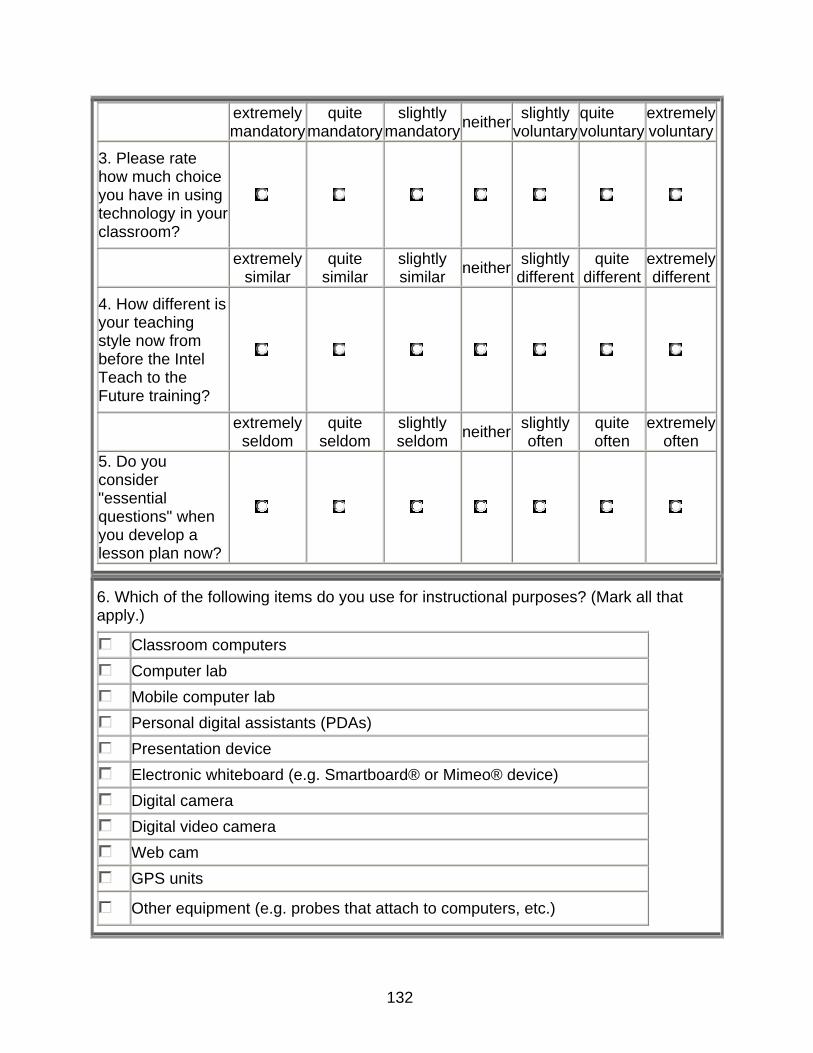
132
extremely mandatory
quite mandatory
slightly mandatoryneither slightly
voluntary quite voluntary
extremely voluntary
3. Please rate how much choice you have in using technology in your classroom?
extremely similar
quite similar
slightly similar neither slightly
different quite
different extremely different
4. How different is your teaching style now from before the Intel Teach to the Future training?
extremely seldom
quite seldom
slightly seldom neither slightly
often quite often
extremely often
5. Do you consider "essential questions" when you develop a lesson plan now?
6. Which of the following items do you use for instructional purposes? (Mark all that apply.)
Classroom computers
Computer lab
Mobile computer lab
Personal digital assistants (PDAs)
Presentation device
Electronic whiteboard (e.g. Smartboard® or Mimeo® device)
Digital camera
Digital video camera
Web cam
GPS units
Other equipment (e.g. probes that attach to computers, etc.)
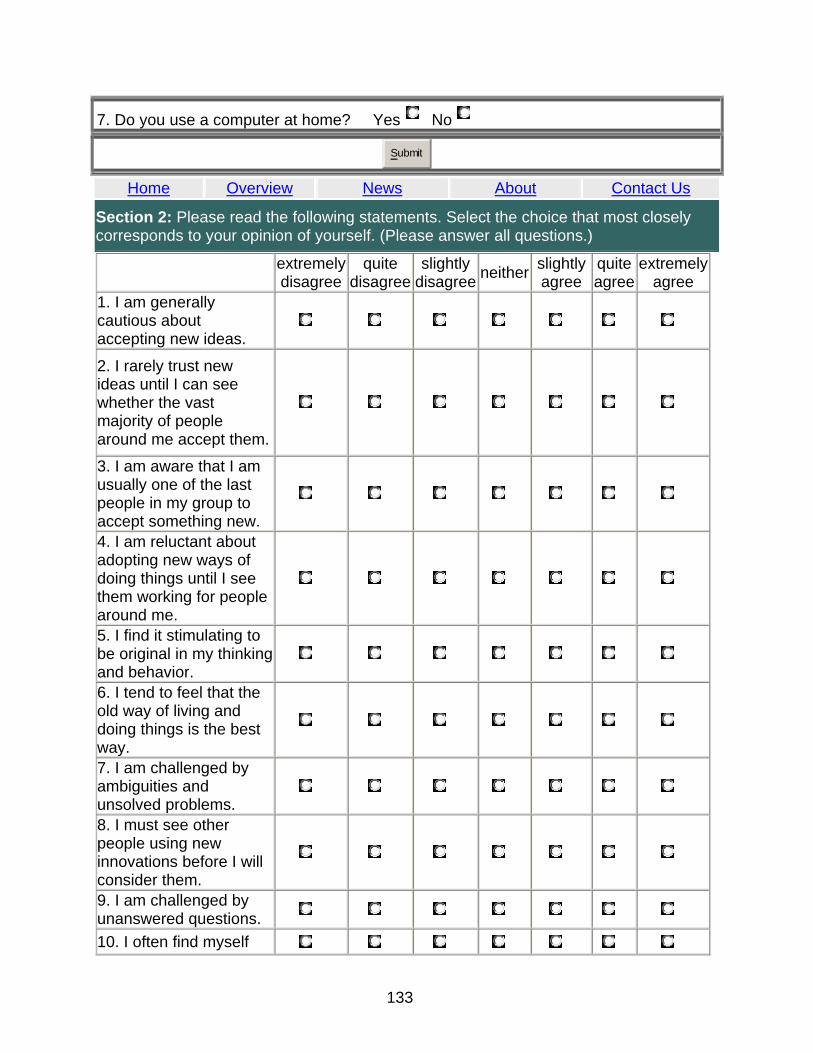
133
7. Do you use a computer at home? Yes No
Submit
Home Overview News About Contact Us
Section 2: Please read the following statements. Select the choice that most closely corresponds to your opinion of yourself. (Please answer all questions.)
extremely disagree
quite disagree
slightly disagree neither slightly
agree quite agree
extremely agree
1. I am generally cautious about accepting new ideas.
2. I rarely trust new ideas until I can see whether the vast majority of people around me accept them.
3. I am aware that I am usually one of the last people in my group to accept something new.
4. I am reluctant about adopting new ways of doing things until I see them working for people around me.
5. I find it stimulating to be original in my thinking and behavior.
6. I tend to feel that the old way of living and doing things is the best way.
7. I am challenged by ambiguities and unsolved problems.
8. I must see other people using new innovations before I will consider them.
9. I am challenged by unanswered questions. 10. I often find myself
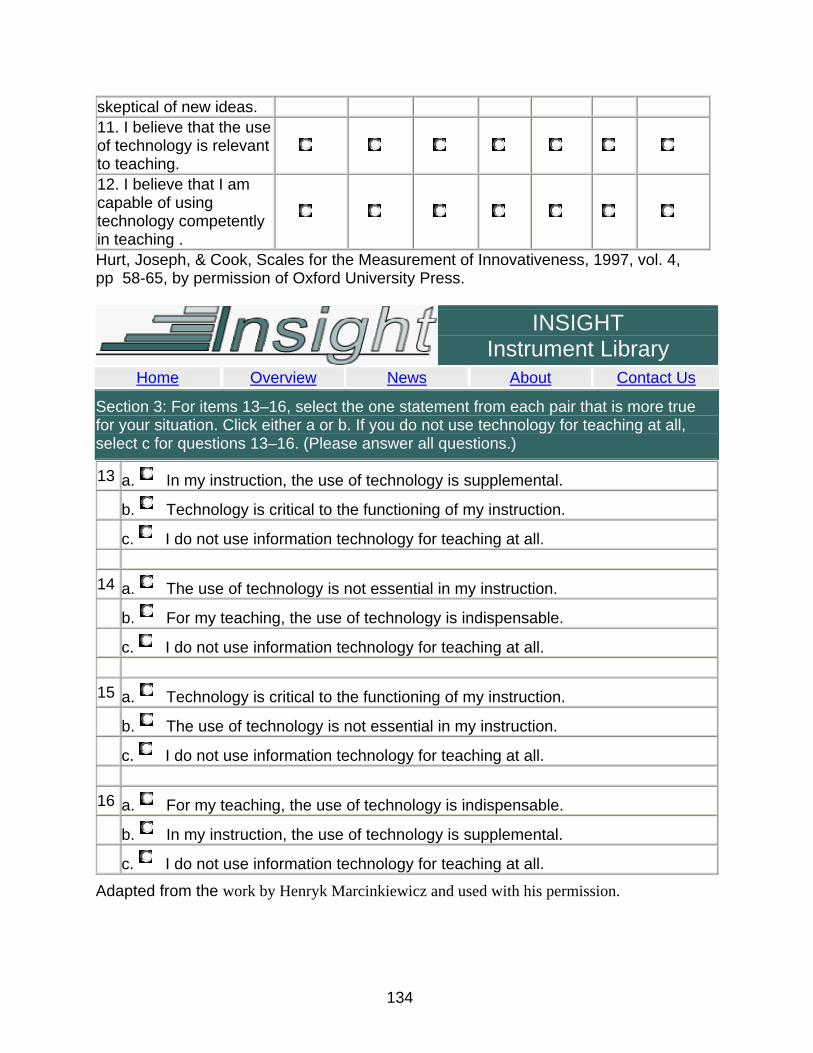
134
skeptical of new ideas. 11. I believe that the use of technology is relevant to teaching.
12. I believe that I am capable of using technology competently in teaching .
Hurt, Joseph, & Cook, Scales for the Measurement of Innovativeness, 1997, vol. 4, pp 58-65, by permission of Oxford University Press.
INSIGHT Instrument Library
Home Overview News About Contact Us
Section 3: For items 13–16, select the one statement from each pair that is more true for your situation. Click either a or b. If you do not use technology for teaching at all, select c for questions 13–16. (Please answer all questions.)
13 a. In my instruction, the use of technology is supplemental. b. Technology is critical to the functioning of my instruction. c. I do not use information technology for teaching at all. 14 a. The use of technology is not essential in my instruction. b. For my teaching, the use of technology is indispensable. c. I do not use information technology for teaching at all. 15 a. Technology is critical to the functioning of my instruction. b. The use of technology is not essential in my instruction. c. I do not use information technology for teaching at all. 16 a. For my teaching, the use of technology is indispensable. b. In my instruction, the use of technology is supplemental. c. I do not use information technology for teaching at all.
Adapted from the work by Henryk Marcinkiewicz and used with his permission.
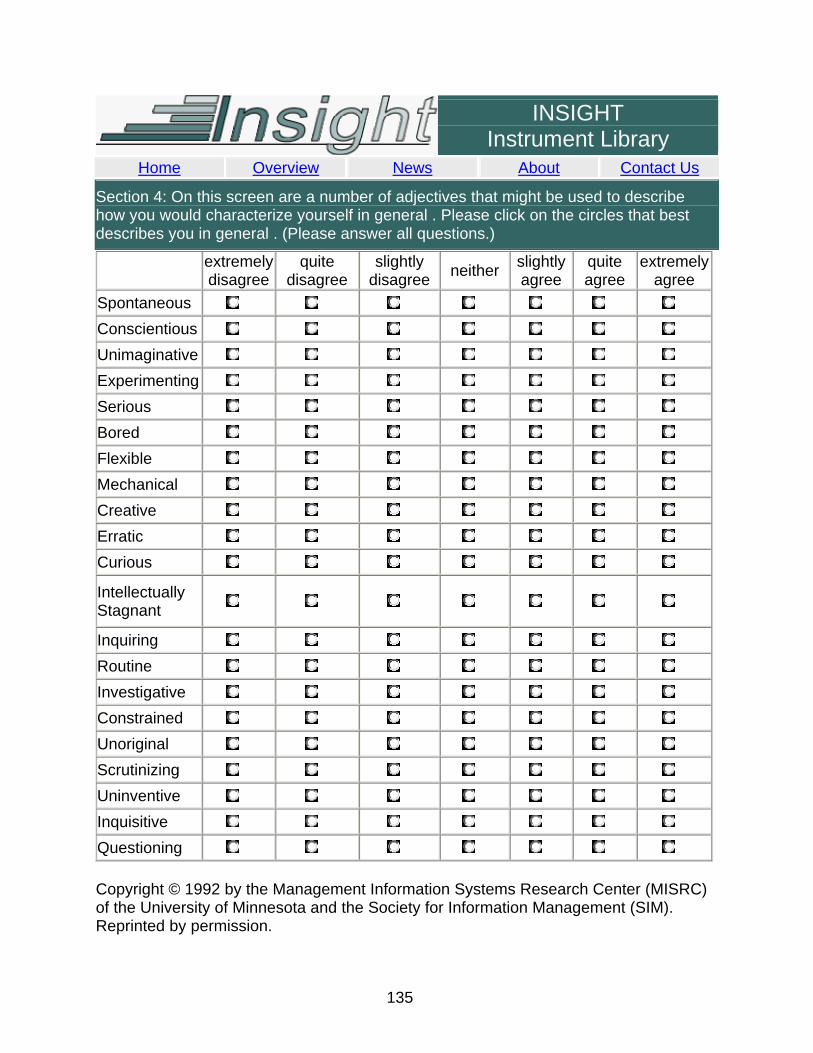
135
INSIGHT Instrument Library
Home Overview News About Contact Us
Section 4: On this screen are a number of adjectives that might be used to describe how you would characterize yourself in general . Please click on the circles that best describes you in general . (Please answer all questions.)
extremely disagree
quite disagree
slightly disagree neither slightly
agree quite agree
extremely agree
Spontaneous Conscientious Unimaginative Experimenting Serious Bored Flexible Mechanical Creative Erratic Curious Intellectually Stagnant
Inquiring Routine Investigative Constrained Unoriginal Scrutinizing Uninventive Inquisitive Questioning Copyright © 1992 by the Management Information Systems Research Center (MISRC) of the University of Minnesota and the Society for Information Management (SIM). Reprinted by permission.
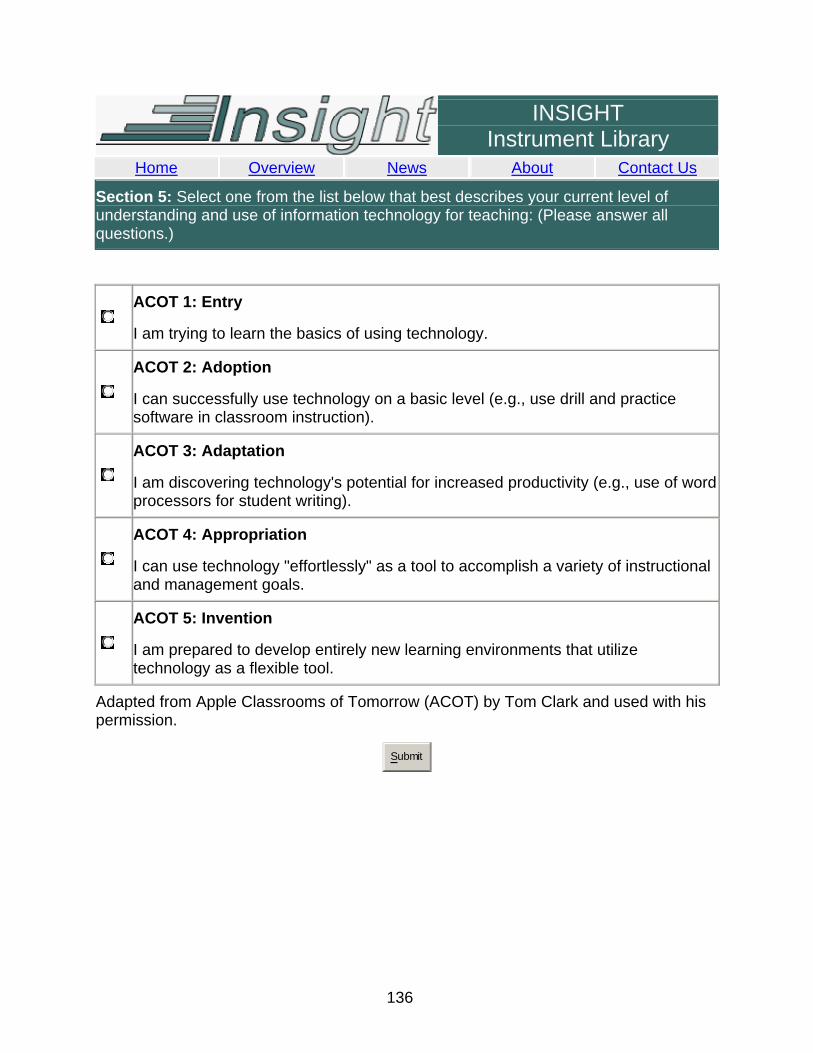
136
INSIGHT Instrument Library
Home Overview News About Contact Us
Section 5: Select one from the list below that best describes your current level of understanding and use of information technology for teaching: (Please answer all questions.)
ACOT 1: Entry
I am trying to learn the basics of using technology.
ACOT 2: Adoption
I can successfully use technology on a basic level (e.g., use drill and practice software in classroom instruction).
ACOT 3: Adaptation
I am discovering technology's potential for increased productivity (e.g., use of word processors for student writing).
ACOT 4: Appropriation
I can use technology "effortlessly" as a tool to accomplish a variety of instructional and management goals.
ACOT 5: Invention
I am prepared to develop entirely new learning environments that utilize technology as a flexible tool.
Adapted from Apple Classrooms of Tomorrow (ACOT) by Tom Clark and used with his permission.
Submit
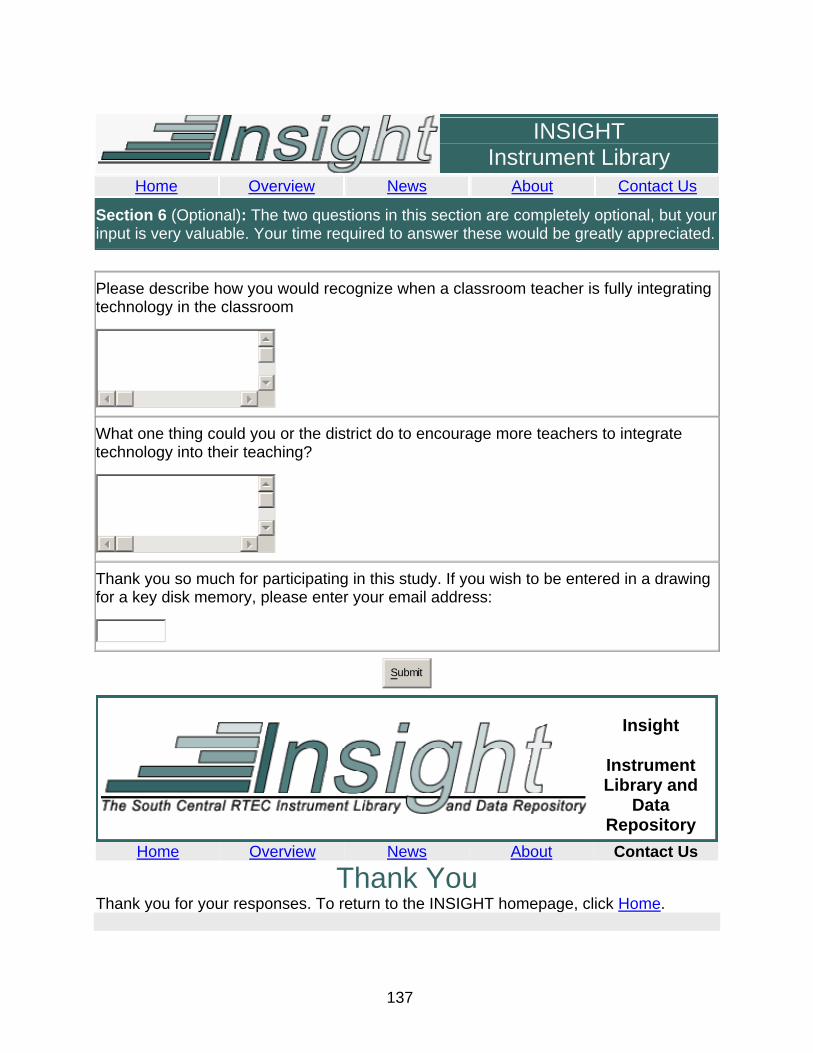
137
INSIGHT Instrument Library
Home Overview News About Contact Us
Section 6 (Optional): The two questions in this section are completely optional, but your input is very valuable. Your time required to answer these would be greatly appreciated.
Please describe how you would recognize when a classroom teacher is fully integrating technology in the classroom
What one thing could you or the district do to encourage more teachers to integrate technology into their teaching?
Thank you so much for participating in this study. If you wish to be entered in a drawing for a key disk memory, please enter your email address:
Submit
Insight
Instrument Library and
Data Repository
Home Overview News About Contact Us
Thank You Thank you for your responses. To return to the INSIGHT homepage, click Home.
138
APPENDIX D
UNIVERSITY OF NORTH TEXAS COMMITTEE
FOR THE PROTECTION OF HUMAN SUBJECTS RESEARCH
CONSENT FORM
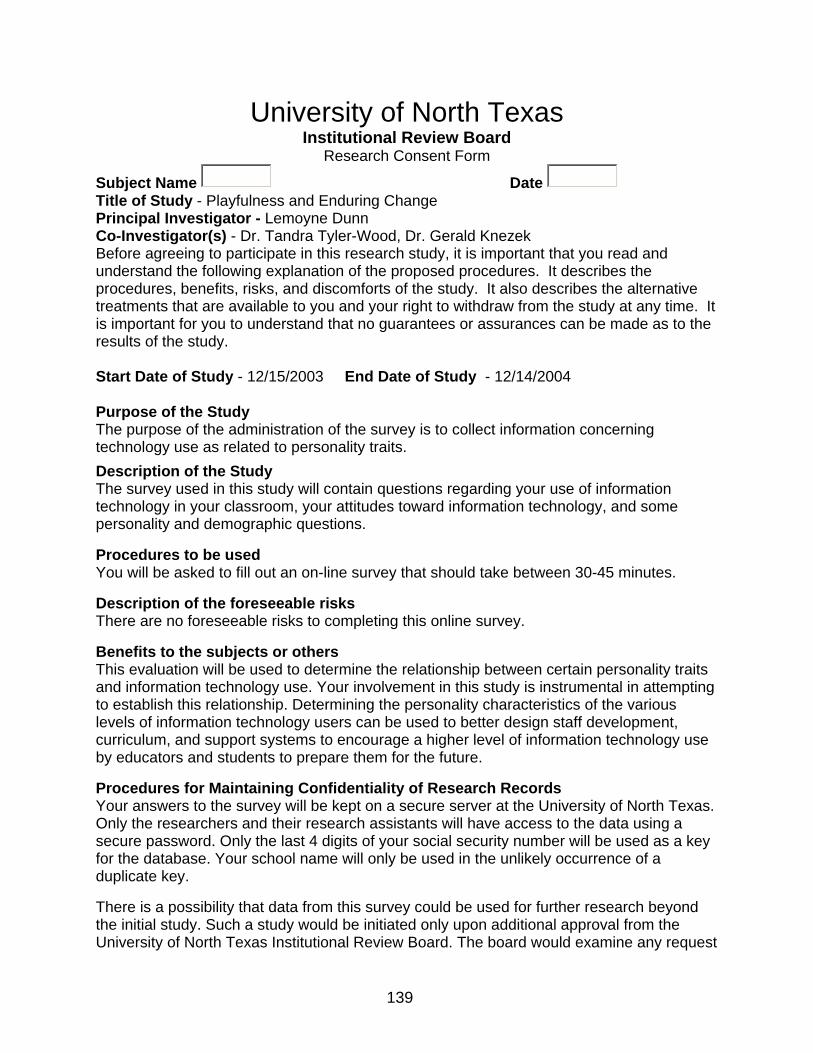
139
University of North Texas Institutional Review Board
Research Consent Form
Subject Name Date Title of Study - Playfulness and Enduring Change Principal Investigator - Lemoyne Dunn Co-Investigator(s) - Dr. Tandra Tyler-Wood, Dr. Gerald Knezek Before agreeing to participate in this research study, it is important that you read and understand the following explanation of the proposed procedures. It describes the procedures, benefits, risks, and discomforts of the study. It also describes the alternative treatments that are available to you and your right to withdraw from the study at any time. It is important for you to understand that no guarantees or assurances can be made as to the results of the study. Start Date of Study - 12/15/2003 End Date of Study - 12/14/2004 Purpose of the Study The purpose of the administration of the survey is to collect information concerning technology use as related to personality traits. Description of the Study The survey used in this study will contain questions regarding your use of information technology in your classroom, your attitudes toward information technology, and some personality and demographic questions.
Procedures to be used You will be asked to fill out an on-line survey that should take between 30-45 minutes.
Description of the foreseeable risks There are no foreseeable risks to completing this online survey.
Benefits to the subjects or others This evaluation will be used to determine the relationship between certain personality traits and information technology use. Your involvement in this study is instrumental in attempting to establish this relationship. Determining the personality characteristics of the various levels of information technology users can be used to better design staff development, curriculum, and support systems to encourage a higher level of information technology use by educators and students to prepare them for the future.
Procedures for Maintaining Confidentiality of Research Records Your answers to the survey will be kept on a secure server at the University of North Texas. Only the researchers and their research assistants will have access to the data using a secure password. Only the last 4 digits of your social security number will be used as a key for the database. Your school name will only be used in the unlikely occurrence of a duplicate key.
There is a possibility that data from this survey could be used for further research beyond the initial study. Such a study would be initiated only upon additional approval from the University of North Texas Institutional Review Board. The board would examine any request
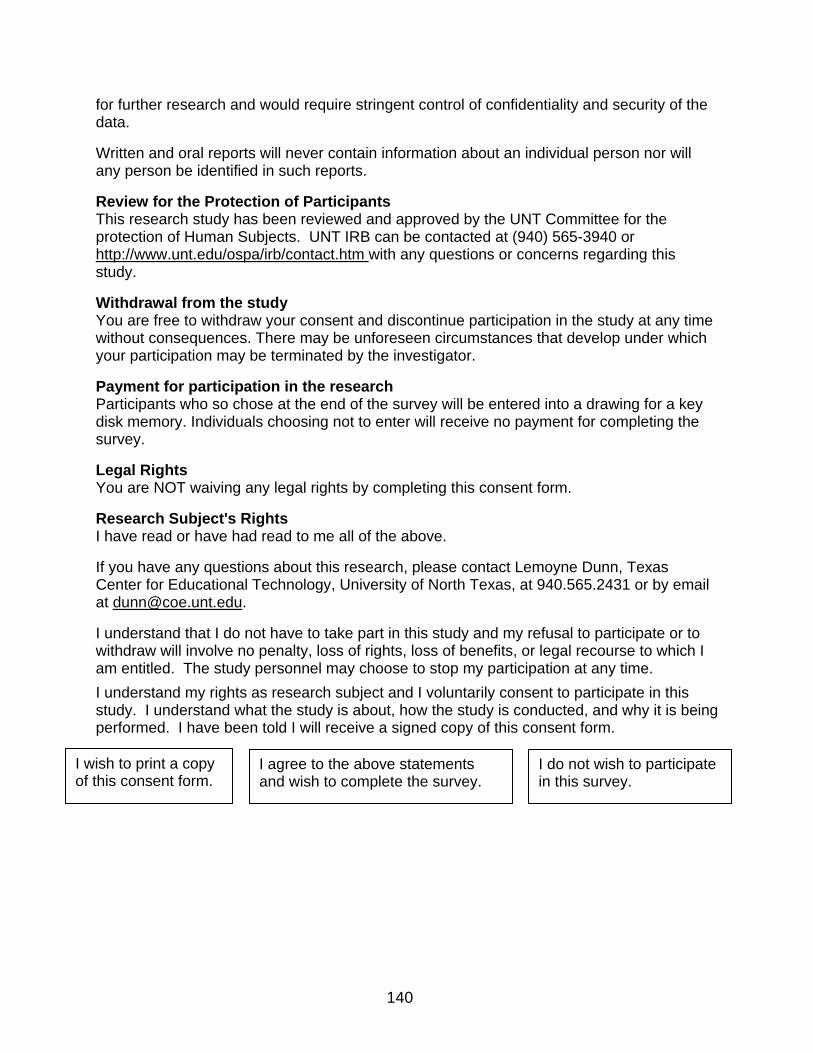
140
for further research and would require stringent control of confidentiality and security of the data.
Written and oral reports will never contain information about an individual person nor will any person be identified in such reports.
Review for the Protection of Participants This research study has been reviewed and approved by the UNT Committee for the protection of Human Subjects. UNT IRB can be contacted at (940) 565-3940 or http://www.unt.edu/ospa/irb/contact.htm with any questions or concerns regarding this study.
Withdrawal from the study You are free to withdraw your consent and discontinue participation in the study at any time without consequences. There may be unforeseen circumstances that develop under which your participation may be terminated by the investigator.
Payment for participation in the research Participants who so chose at the end of the survey will be entered into a drawing for a key disk memory. Individuals choosing not to enter will receive no payment for completing the survey.
Legal Rights You are NOT waiving any legal rights by completing this consent form.
Research Subject's Rights I have read or have had read to me all of the above.
If you have any questions about this research, please contact Lemoyne Dunn, Texas Center for Educational Technology, University of North Texas, at 940.565.2431 or by email at [email protected].
I understand that I do not have to take part in this study and my refusal to participate or to withdraw will involve no penalty, loss of rights, loss of benefits, or legal recourse to which I am entitled. The study personnel may choose to stop my participation at any time. I understand my rights as research subject and I voluntarily consent to participate in this study. I understand what the study is about, how the study is conducted, and why it is being performed. I have been told I will receive a signed copy of this consent form.
I agree to the above statements and wish to complete the survey.
I do not wish to participate in this survey.
I wish to print a copy of this consent form.
141
REFERENCE LIST
Adams, D.A., Nelson, R. R., & Todd, P.A. (1992). Perceived usefulness, ease of use, and usage of information technology: A replication. MIS Quarterly, 16(2), 227-247.
Agarwal, R., & Karahanna, E. (2000). Time flies when you're having fun: Cognitive
absorption and beliefs about information technology usage. MIS Quarterly, 24(4), 665-682.
Agarwal, R., & Prasad, J. (1998). A conceptual and operational definition of personal
innovativeness in the domain of information technology. Information Systems Research, 9(2), 204-215.
Agarwal, R., & Prasad, J. (1999). Are individual differences germane to the acceptance
of new information technologies? Decision Sciences, 30(2), 361-391. Ajzen, I. (1985). From intentions to actions: A theory of planned behavior. In J. Kuhl and
J. Beckmann (Eds.), Action Control: From Cognition to Behavior, Springer Verlag, NY, 11-39.
Ajzen, I. (1991). The theory of planned behavior. Organizational Behavior and Human
Decision Processes, 50(2), 179-211. Allen, J.W. (1998). The relationship between microcomputer playfulness and end-user
intention to adopt information technology. Dissertation Abstracts International, 59 (02), p. 546. (UMI No. AAT 9824391)
Amabile, T. M. (1996). Creativity in context: Update to the social psychology of
creativity. Boulder, CO: Westview Press. Anthony, L.M., Clarke, M.C., & Anderson, S.J. (2000). Technophobia and personality
subtypes in a sample of South African university students. Computers in Human Behavior, 16(1), 31-44.
Apple Classroom of Tomorrow. http://www.apple.com/education/k12/leadership/acot/.
Retrieved: May 23, 2004. Bandura, A. (1977). Self-efficacy: toward a unifying theory of behavioral change.
Psychological Review, 84, 191-215. Bandura, A. (1986). Social foundations of thought and action: A social cognitive theory.
Englewood Cliffs, NJ: Prentice Hall. Bandura, A. (Ed.). (1995). Self-efficacy in changing societies. NY: Cambridge
University Press
142
Barnett, L.A. (1990). Playfulness: definition, design, and measurement. Play and
Culture 3, 319-336. Barnett, L.A. (1991). The playful child: Measurement of a disposition to play. Play and
Culture 4, 51-74. Barnett, L.A., & Kleiber, D.A. (1982). Concomitants of playfulness in early childhood;
Cognitive abilities and gender. Journal of Genetic Psychology, 141, 115-127. Barron, A.E., Kemker K., Harmes, C., & Kalaydjian, K. (2003). Large-scale research
study on technology in K-12 schools: Technology integration as it relates to the national technology standards. Journal of Research on Technology in Education, 35(4), 489-507. Eugene, OR.
Berlyne, D.E. (1969). Laughter, humor and play. In G. Lindzey & E. Aronson (Eds.), The
handbook of social psychology, (3), 795-852. Reading, MA: Addison-Wesley. Bloom, B.S. (Ed.), Engelhart, M.D., Furst, E.J., Hill, W.H., & Krathwohl, D.R. (1956).
Taxonomy of educational objectives: The classification of educational goals. Handbook 1: Cognitive domain. New York: David McKay.
Brenner, P. (2001). If life is a game, how come I'm not having fun? A guide to life's
challenges. Albany, NY: State University of New York Press. Burkman, E. (1987). Factors affecting utilization. Instructional technology: Foundations.
Hillsdale, NJ: Lawrence Erlbaum. Carlson, R. O. (1965). Adoption of Educational Innovations. Eugene University of
Oregon Center for the Advanced Study of Educational Administration. Carroll, J.M. & Mack, R.L. (1984). Learning to use a word processor: By doing, by
thinking, and by knowing. In J.C. Thomas & M.L. Schneider (Eds.), Human factors in computer systems (p. 13-51). Norwoood, NJ: Ablex.
Cattell, R.G. (1979). Personality and learning theory (vol.1): The structure of personality
in its environment. NY: Springer. Christensen, R. & Knezek, G. (2001). Equity and diversity in K-12 applications of
information technology: KIDS project finding for 2000-2001. Denton, TX: University of North Texas. Institute for the Integration of Technology into Teaching & Learning (IITTL).
Christensen, R., & Knezek, G. (2003). Teacher home access as a primary indicator of
stage of adoption of technology. Information and Technology and Teacher
143
Education Annual 2003, (p. 867-870). Charlottesville, VA: Association for the Advancement of Computing in Education.
Collis, B. (1994). Triple innovation in the Netherlands. The Computing Teacher, 22(2),
23-26. Compeau, D., & Higgins, C.A. (1995). Application of social cognitive theory to training
for computer skills. Information Systems Research, 6(2), 118-143. Compeau, D., Higgins, C.A., & Huff, S. (1999). Social cognitive theory and individual
reactions to computing technology: a longitudinal study. Management Information Systems (MIS) Quarterly, 23(2), 145-158.
Conti, R. (2001). Time flies: Investigating the connection between intrinsic motivation
and the experience of time. Journal of Personality, 69(1), 1-26. Conti, R., Amabile, T. M., & Pollak, S. (1995). The positive impact of creative activity:
Effects of creative task engagement and motivational focus on college students' learning. Personality and Social Psychology Bulletin, 21, 1107-1116.
Costa, P.T. & McCrae, R.R. (1992). NEO PI-R: professional manual. Revised NEO
Personality Inventory (NEO PI-R) and NEO Five Factor Inventory (NEO-FFI). Psychological Assessment Resources (PAR), Odessa, FL.
Craig, C.S., & Ginter, J.L. (1975). An empirical test of a scale for innovativeness.
Advances in Consumer Research, 2, 555-562. Csikszentmihalyi, M. (1975). Beyond boredom and anxiety. San Francisco, CA: Jossey-
Bass. Csikszentmihalyi, M. (1990). The psychology of optimal experience. NY: Harper-Row. Davis, F.D. (1989). Perceived usefulness, perceived ease of use, and user acceptance
of information technology. MIS Quarterly, 13(3), 319-340. Davis, F.D., Bagozzi, R.P., & Warshaw, P.R. (1989). User acceptance of computer
technology: A comparison of two theoretical models. Management Science, 35(8), 982-1003.
Davis, F.D., Bagozzi, R.P., & Warshaw, P.R. (1992). Extrinsic and intrinsic motivation to
use computers in the workplace. Journal of Applied Social Psychology, 22(14) 1111-1132.
Deci, E. L. (1971). Effects of externally mediated rewards on intrinsic motivation.
Journal of Personality and Social Psychology, 18, 105-115.
144
Deci, E. L. (1975). Intrinsic motivation. New York: Plenum. Deci, E. L. (1985). Intrinsic motivation and self-determination in human behavior. New
York: Plenum. Dillon, A., & Morris, M.G. (1996). User acceptance of information technology: Theories
and Models. Annual Review of Information Science and Technology (ARIST), 31, 3-32.
Dwyer, Ringstaff, & Sandholtz. (1991). Changes in teachers' beliefs and practices in
technology-rich classrooms. Educational Leadership, 48(8), 45-52. Ellis, M.J. (1973). Why people play. Englewood Cliffs, NJ: Prentice-Hall. Epstein, S. (1973). The self-concept revisited: Or a theory of a theory. American
Psychologist, 28, 404-416. Farquhar, J. F., & Surry, D. W. (1994). Adoption analysis: An additional tool for
instructional developers. Education and Training Technology International, 31(1), 19-25.
Fishbein, M., & Ajzen, I. (1975). Belief, Attitude, Intention and Behavior: An introduction
to theory and research, Reading MA: Addison-Wesley. Freud, S. (1962). The ego and the id. New York: Norton. (Original work published in
1923.) Fuligni, A.J. & Witkow, M. (2004). The postsecondary educational Progress of Youth
from immigrant families. Journal of Research on Adolescence, 14(2), 159-183. Fuller, F.F. (1969). Concerns of teachers: A developmental conceptualization. American
Educational Research Journal, 6(2), 207-226. Glynn, M. A., & Webster, J. (1992). The Adult Playfulness Scale: an initial assessment.
Psychological Reports, 71, 83-103. Glynn, M. A., & Webster, J. (1993). Refining the nomological net of the Adult
Playfulness Scale: personality, motivational, and attitudinal correlates for highly intelligent adults. Psychological Reports, 72, 1023-1026.
Gottfried, A. E. (1990). Academic intrinsic motivation in young elementary school
students. Journal of Educational Psychology, 82, 525-538. Grolnick, W. S., & Ryan, R. M. (1987). Autonomy in children's learning: An experimental
and individual difference investigation. Journal of Personality and Social Psychology, 52, 890-898.
145
Hall, G.E. & Hord, S. M. (1987). Change in Schools. Albany, NY: SUNY Press. Hall, G.E. & Loucks, S.F. (1977). A developmental framework for determining whether
the treatment is actually implemented. American Educational Research Journal, 14(3), 263-276.
Hall, G.E., Loucks, S.F., Rutherford, W.L., & Newlove, B.W. (1975). Levels of use of the
innovation: A framework for analyzing innovation adoption. Journale of Teacher Education, 26(1).
Hiemstra, G. (1983). You say you want a revolution? "Information technology" in
organizations. Communications Yearbook, 7, 802-827. Holt, D.T., & Crocker, M. (2000). Prior negative experiences: their impact on computer
training outcomes. Computers & Education, 35, 295-308. Huizinga, J. (1955). Homo ludens: A study of the play element in culture. Boston:
Beacon Press. (First published in 1938.) Hull, C. L. (1943). Principles of behavior. New York: Appleton-Century-Crofts. Hurt, H.T., Joseph, K., & Cook, C.D. (1977). Scales for the measurement of
innovativeness. Human Communication Research, 4(1), 58-65. Igbaria, M., Parasuraman, S., & Baroudi, J.J. (1996). A motivational model of
microcomputer usage. Journal of Management Information Systems, 13(1), 127-143.
Intel Education: Unit & Project Plans. http://www.intel.com/education/unitplans/.
Accessed May 22, 2004. Irani, T. (2000). Prior experience, perceived usefulness and the web: Factors
influencing adoption of Internet communication tools. Paper presented to the Southern Association of Agricultural Scientists; Lexington, KY. http://agnews.tamu.edu/saas/paperti.htm. Accessed: March 2004.
Kabanoff, B. (1980). Work and nonwork: A review of models, methods, and findings.
Psychological Bulletin, 88, 60-77. Karahanna, E., & Straub, D.W. (1999). The psychological origins of perceived
usefulness and ease-of-use. Information & Management, 35, 237-250. Keil, M., Beranek, P.M., & Konsynski, B.R. (1995). Usefulness and ease of use: Field
study evidence regarding task considerations. Decision Support Systems 13, 75-91.
146
Kirton, M.J. (1976). Adaptors and Innovators: A description and measure. Journal of
Applied Psychology 61, 622-629. Kirton, M.J. (1978). Field dependence and adaption-innovation theories. Perceptual and
Motor Skills, 47, 1239-1245. Kirton, M.J. (1989). Adaptors and innovators: A description and measure. Journal of
Applied Psychology, 61,622-629. Knezek, G. & Christensen, R. (1998, March 13). Parallel form for measuring teachers’
attitudes toward computer. Paper presented at Society of Information Technology & Teacher Education (SITE) 9th International Conference, Washington, DC.
Knezek, G. & Christensen, R. (2002). Technology, pedagogy, professional development
and reading achievement: KIDS project findings for 2001-2002. Denton, TX: University of North Texas. Institute for the Integration of Technology into Teaching & Learning (IITTL).
Knezek, G., Christensen, R., Hancock, R., & Shoho, S. (2000) Toward a structural
model of technology integration. Proceedings of the Annual Hawaii Educational Research Association.
Kottler, Jeffrey. (2001). Making changes last. Hove, England: Brunner-Routledge. Leavitt, C., & Walton, J. (1975). Development of a scale for innovativeness. In M.J.
Schlinger (Ed.), Advances in Consumer Research, 545-554. Leonard-Barton, D., & Deschamps, I. (1988). Managerial Influence in the
implementation of new technology. Management Science 34(10), 1252-1265. Lieberman, J.N. (1966). Playfulness: An attempt to conceptualize a quality of play and
the player. Psychological Reports, 19, 1278-1301. Lieberman, J. N. (1977). Playfulness. New York: Academic Press. Marcinkiewicz, H.R. (1993). Computers and teachers: Factors influencing computer use
in the classroom. Journal of Research on Computing in Education, 26(2), 220-237.
Marcinkiewicz, H.R. (1994). Differences in computer use of practicing versus preservice
teachers. Journal of Research on Computing in Education, 27(2), 184-197. Martin, W., Gersick, A., Nudell, H., & McMillan-Culp, K. (2002). An evaluation of Intel
Teach to the Future year two final report. Retrieved April 17, 2003, from http://www2.edc.org/CCT/publications_report_summary.asp?numPubId=92.
147
Martocchio, J. J. (1992). Microcomputer usage as an opportunity: The influence of
context in employee training. Personnel Psychology, 45, 529-551. Martocchio, J. J., & Webster, J. (1992). Effects of feedback and cognitive playfulness on
performance in microcomputer software training. Personnel Psychology, 45, 553-578.
Mathieson, K. (1991). Predicting user intentions: Comparing the Technology
Acceptance Model with the Theory of Planned Behavior, Information Systems Research 2(3), 173-191.
McCrae, R.R., & Costa, P.T., Jr. (1983). Joint factors in self-report ratings: Neuroticism,
extraversion and openness to experiences. Personality and Individual Differences, 4, 245-255.
McGinnis, J.R., Kramer, S., Watanabe, T. (1998, April). A longitudinal assessment of
teacher candidates' attitudes and beliefs in a reform-based mathematics and science teacher preparation program. Poster session presented at the annual meeting of the National Association for Research in Science Teaching, San Diego, CA.
Mehlinger, H. D. (1994). School Reform in the Information Age. Bloomington, IN. Miller, S. (1973). Ends, means, and galumphing: some leitmotifs of play. American
Anthropologist, 75, 87-89. Miller, S., Meier, E., Payne-Bourcy, L., Shablak, S., Newmann, D.L., Wan, T.Y., Casler,
E., & Pack, G. (2003). Technology use as a catalyst for change: A leadership framework for transforming urban teacher preparation. Special issue: Leadership and technology in schools in International Electronic Journal for Leadership in Learning, 7(12). Retrieved: July 6, 2004, from http://www.ucalgary.ca/~iejll/volume7/miller.htm.
Moersch, C. (1995). Levels of technology implementation (LoTi): A framework for
measuring classroom technology use. Learning and Leading with Technology, 23, 40-42.
Moore, G. A. (1991). Crossing the chasm: Marketing and selling high-tech products to
mainstream customers. NY: Harper Business Essentials. Moore, G. C., & Benbasat, I. (1991). Development of an instrument to measure the
perceptions of adopting an information technology innovation. Information Systems Research, 2(2), 192-222.
Mort, P.R. (1953). Educational adaptability. The School Executive, 71(1), 199-200.
148
Myers, J.R., Henderson-King, D.H., & Henderson-King, E.I. (1997). Facing
technological risks: The importance of individual differences. Journal of Research in Personality, 31, 1-20.
Newhouse, C.P. (2001). Applying the concerns-based adoption model to research on
computers in classrooms. Journal of Research on Technology in Education, 33(5).
Okolica, C., & Stewart, C.M. (1996). Factors influencing the use of voice messaging
technology: Voice Mail Implementation in a Corporate Setting. Central Business Review, 15(1), 52-59.
Oner, B. (2000). Innovation and adaption in a Turkish sample: A preliminary study. The
Journal of Psychology, 134(6), 671-676. Papert, S. (1980). Mindstorms. NY: Basic Books. Parasuraman, A. (2000). Technology Readiness Index (TRI): A multiple-item scale to
measure readiness to embrace new technologies. Journal of Service Research, 2(4), 307-320.
Piaget, J. (1951). Play, dreams and imitations in childhood. NY: W. W. Norton. (First
published in 1945.) Presno, C. (1998). Taking the byte out of Internet anxiety: Instructional techniques that
reduce computer/Internet anxiety in the classroom. Educational Computing Research, 18(2), 147-161.
Rieber, L.P., & Welliver, P.W. (1989). Infusing educational technology into mainstream
educational computing. International Journal of Instructional Media, 16(1), 21-32. Robinson, L.M. (2002). Perceptions of preservice educators, inservice educators, and
professional development personnel regarding effective methods for learning technology integration skills (Doctoral dissertation, University of North Texas, 2002). Digital Dissertations, 63(12), 4279 (UMI No. AAT 307625).
Roche, S.M., & McConkey, K.M. (1990). Absorption: Nature, assessment, and
correlates. Journal of Personality and Social Psychology, 59(1), 91-101. Rogers, E.M. (1995). Diffusion of innovation. NY: The Free Press. Rogers, E.M. & Shoemaker, F.F. (1971). Communication of innovations: A cross-
cultural approach. NY: The Free Press.
149
Rubin, K.H., Fein, G.G., & Vandenberg, B. (1983). Play. In E.M. Hetherington (Eds.), Handbook of Child psychology: Vol. 4. Socialization, personality, and social development, 693-774), NY: Wiley.
Sandholtz, J.H., Ringstaff, C., & Dwyer, D.C. (1997). Teaching with technology:
Creating student-centered classrooms. NY: Teachers College Press. Schaller, R. (1996). The origin, nature, and implications of "Moore's Law." Retrieved
April 17, 2003, from http://mason.gmu.edu/~rschalle/moorelaw.html#N_19_. Schwarzer, R., Mueller, J., & Greenglass, E. (1999). Assessment of perceived general
self-efficacy on the Internet: data collection in cyberspace. Anxiety, Stress & Coping, 12(2), 145-161.
Sheppard, B.H., Hartwick, J., & Warshaw, P.R. (1988). The theory of reasoned action: A
meta-analysis of past research with recommendations for modifications and future research. Journal of Consumer Research, 15(x), 325-343.
SIL International (formerly known as the Summer Institute of Linguistics). (1999).
www.sil.org/lingalinks/literact/ReferenceMatedrials/GlossaryOfLiteracyTerms/WhatIsPedagogy.htm. Retrieved May 22, 2004.
Singer, D.G., & Rummo, J. (1973). Ideational creativity and behavioral style in
kindergarten aged children. Developmental Psychology, 8, 154-161. Skinner, B. F. (1953). Science and human behavior. New York: Macmillan. Skinner, N.F. (1996). Behavioral implications of adaption-innovation: Adaption-
innovation and motivation for uniqueness. Social Behavior and personality, 24(3), 231-234.
Starbuck, W.H., & Webster, J. (1991). When is play productive? Accounting,
Management, and Information Technology, 1, 71-90. Surry, D. W. (1997). Diffusion theory and instructional technology. Paper presented at
the Annual Conference of the Association for Educational Communications and Technology (AECT).
Taylor, S., & Todd, P.A. (1995). Understanding Information Technology Usage: A Test
of Competing Models. Information Systems Research, 6(4), 144-176. Tellegen, A., & Atkinson, G. (1974). Openness to absorbing and self-altering
experiences. Journal of Abnormal Psychology, 83, 268-277. Texas PK-16 Public Education Information Resource. Retrieved May 21, 2004,
http://www.texaseducationinfo.org/reports/Reports_Educator.asp.
150
Thompson, R.L., Higgins, C.A., & Howell, J.M. (1991). Personal computing: Toward a
conceptual model of utilization. MIS Quarterly, 15(1), 124-143. Trandis, H.C. (1971). Attitude and Attitude Change. NY: John Wiley and Sons, Inc. Trevino, L.K. & Webster, J. (1992). Flow in computer-mediated communication:
Electronic mail and voice mail evaluation and impacts. Communication Research, 19, 539-573.
Vallerand, R. J. (1997). Toward a Hierarchical model of Intrinsic and Extrinsic
Motivation. In M. Zanna (Ed.), Advances in Experimental Social psychology, 29, 309-330. NY: Academic Press.
Vallerand, R. J. (2000). Deci & Ryan's Self-Determination Theory: A view from the
Hierarchical Model of intrinsic and extrinsic motivation. Psychological Inquiry, 11(4), 312-318.
Vallerand, R. J., & Bissonnette, R. (1992). Intrinsic, extrinsic, and amotivational styles
as predictors of behavior: A prospective study. Journal of Personality, 60, 599-620.
van Leeuwen, K., de Fruyt, F., Mervielde, I. (2004). A longitudinal study of the utility of
the resilient, overcontrolled, and undercontrolled personality types as predictors of children's and adolescents' problem behaviour. International Journal of Behavioral Development, 28(3), 210-220.
Venkatesh, V. (2000). Determinants of perceived ease of use: Integrating perceived
behavioral control, computer anxiety and enjoyment into the Technology Acceptance Model. Information Systems Research, 11(4), 342-365.
Venkatesh, V., & Davis, F.D. (1996). A model of the antecedents of perceived ease of
use: Development and test. Decision Sciences, 27(3), 451-481. Venkatesh, V., & Davis, F.D. (2000). A theoretical extension of the technology
acceptance model: Four longitudinal field studies. Management Science, 45(x), 186-204.
Venkatesh, V., & Morris, M.G. (2000). Why don't men ever stop to ask for directions?
Gender, social influence, and their role in technology acceptance and usage behavior. MIS Quarterly, 24(1), 115-139.
Venkatesh, V., Morris, M.G., Davis, G.B., & Davis, F.D. (2003). User acceptance of
information technology: Toward a unified view. MIS Quarterly, 27(3), 425-478.
151
Webster, J., & Ho, H. (1997). Audience engagement in multi-media presentations. Data Base for the Advances in Information Systems, 28(2), 63-77.
Webster, J., & Martocchio, J. J. (1992). Microcomputer playfulness: Development of a
measure with workplace implications. MIS Quarterly, 16(2), 201-226. Webster, J., & Martocchio, J. J. (1993). Turning work into play: Implications for
microcomputer software training. Journal of Management, 19(1), 127-146. Webster, J., Trevino, L. K., & Ryan, L. (1993). The dimensionality and correlates of flow
in human-computer interactions. Computers in Human Behavior, 9(4), 411-426. Wiggins, G., McTighe, J., & McTighe, J. (1998). Understanding by Design. Association
for Supervision & Curriculum Development. Wild, T.C., Kuiken, D., & Schopflocher, D. (1995). The role of absorption in experiential
involvement. Journal of Personality and Social Psychology, 69(3), 569-579. Woszczynski, A.B., Roth, P.L., & Segars, A.J. (2002). Exploring the theoretical
foundations of playfulness in computer interactions. Computers in Human Behavior, 18(4), 369-388.
Yi, Y., Tung, L.L., & Wu, Z. (2003). Incorporating Technology Readiness (TR) into TAM:
Are individual traits important to understand technology acceptance? Paper presented at the Diffusion Interest Group in Information Technology (DIGIT) Workshop, Seattle, WA. www.mis.temple.edu/digit/digit2003/files/DIGIT-2003-yi.pdf. Accessed: March 2004.