Embed Size (px)
Citation preview
SC I ENCE ADVANCES | R E S EARCH ART I C L E
COGN I T IVE NEUROSC I ENCE
1HumanResearchandEngineeringDirectorate,U.S. ArmyResearchLaboratory, AberdeenProving Ground, MD 21005, USA. 2Department of Biomedical Engineering, ColumbiaUniversity, New York, NY 10027, USA. 3Mathematics Department, University at Buffalo,SUNY, Buffalo, NY 14260, USA. 4Department of Biomedical Engineering, University ofPennsylvania, Philadelphia, PA 19104, USA. 5Department of Psychology, CarnegieMellonUniversity, Pittsburgh, PA 15213, USA. 6Department of Psychological and Brain Sciences,University of California, Santa Barbara, Santa Barbara, CA93106, USA. 7CDSEProgramandNeuroscience Program, University at Buffalo, SUNY, Buffalo, NY 14260, USA.*Corresponding author. Email: [email protected] (K.B.); [email protected] (S.F.M.)
Bansal et al., Sci. Adv. 2019;5 : eaau8535 3 April 2019
Copyright © 2019
The Authors, some
rights reserved;
exclusive licensee
American Association
for the Advancement
of Science. No claim to
originalU.S. Government
Works. Distributed
under a Creative
Commons Attribution
NonCommercial
License 4.0 (CC BY-NC).
Cognitive chimera states in human brain networksKanika Bansal1,2,3*, Javier O. Garcia1,4, Steven H. Tompson1,4, Timothy Verstynen5,Jean M. Vettel1,4,6, Sarah F. Muldoon3,7*
The human brain is a complex dynamical system, and how cognition emerges from spatiotemporal patterns ofregional brain activity remains an open question. As different regions dynamically interact to perform cognitivetasks, variable patterns of partial synchrony can be observed, forming chimera states. We propose that thespatial patterning of these states plays a fundamental role in the cognitive organization of the brain and presenta cognitively informed, chimera-based framework to explore how large-scale brain architecture affects brain dy-namics and function. Using personalized brain network models, we systematically study how regional brain stim-ulation produces different patterns of synchronization across predefined cognitive systems. We analyze theseemergent patterns within our framework to understand the impact of subject-specific and region-specific struc-tural variability on brain dynamics. Our results suggest a classification of cognitive systems into four groups withdiffering levels of subject and regional variability that reflect their different functional roles.
D
on February 15, 2020http://advances.sciencem
ag.org/ow
nloaded from
INTRODUCTIONRhythmic behavior is ubiquitous in complex systems, and a diverseset of research has examined how interacting system elements cometogether to form synchronized, coherent behavior across domains thatspan biological, social, and engineered settings (1). However, theemergence of complete system-wide synchronization might not alwaysprovide the best description of system dynamics. In many systems,states of partial synchrony have been observed, where a system orga-nizes in separate domains of synchronized elements (2, 3). This is par-ticularly true in the human brain, where patterns of neurophysiologicalactivity evolve rapidly, showing transient domains of synchronizationacross subsets of brain regions (2). In the past decade, the rise of networkneuroscience approaches (4) have demonstrated a foundational role forpartial synchrony among separate cognitive subnetworks, where theunderlying architecture of the brain ensures efficient integration ofsensory input with stored knowledge while also segregating task-irrelevant information to support cognition (5). However, the fun-damental principles and constraints that subserve the intricate timingand specificity of these time-evolving patterns of synchrony are not wellunderstood (6).
The dynamical systems framework of chimera states offers a pow-erful tool to study the evolution of coherent and incoherent dynamicsin oscillating systems such as the brain. A chimera state emerges whena system of oscillators evolves into two subsets of mutually coherentand incoherent populations (7). Although chimera states represent anatural link between coherent and incoherent dynamics (8), initially,they were found and explored only analytically in the networks of ho-mogeneous phase oscillators (9, 10), and their relationship to realphysical systems was unknown. It was not until almost a decade aftertheir theoretical discovery that chimera states were demonstrated ex-perimentally (11, 12), lastly establishing their connection with real-world systems. Subsequently, chimera states were studied in a variety
of model systems under different coupling schemes, including global(13) and purely local (14) connections, and their presence in oscillat-ing systems was found to be more abundant than previously thought(15) [for an overview of studies on chimera states, see the recent re-view by Panaggio and Abrams (7)]. Chimera states have also beenfound to emerge under the presence of noise (16) and in heterogeneousnetworks (17). Given these findings, in the past few years, new classifi-cations of chimera states, such as multichimera (18), traveling chimera(19), and chimera death (20), have been defined on the basis of the spe-cific spatiotemporal dynamics involved.
Because of its natural ability to describe patterns of partial synchro-nization, the chimera framework has an intuitive utility for augment-ing our understanding of the brain. Patterns of synchronizationbetween cognitive systems are thought to form the basis of cognition,and the interplay of synchrony among subsets of brain regions hasbeen shown to be important both in normal brain function, for exam-ple, in the variability in task performance (5), and in the continuumbetween healthy and disease states (21). Recent work has speculatedthat similarities exist between chimera states and brain dynamics dur-ing unihemispheric sleep (7) and the transition to a seizure state inepilepsy (22). Fundamentally, these dynamics are the result ofcomplex interactions between neuronal populations and are oftenmodeled using networks of coupled oscillators. As a result, despitethe intuitive similarities between chimera states and brain dynamics,much of the work relating chimera dynamics to neuroscience, thus far,has focused on understanding chimera states at the level of neuronalnetworks, using mathematical modeling of networks of individualneurons with fewer elements and/or simplified connection topologies(18, 23). Only recently have neuronalmodels been used to examine thepossibility of the emergence of chimera-like states within large-scalebrain networks derived from two well-characterized animal brains—Caenorhabditis elegans (24) and the cat cortex (25). However, even inthese instances, the network connectivities were modified for simpli-city. Thus, there remains a gap between studies of chimera states andapplications to large-scale functional patterns of brain activity thoughtto underlie cognition. This largely reflects the computationalcomplexity of modeling whole-brain dynamics and identifying an in-formative, yet simplified, model of cognitive processing.
Here, we bridge this gap by presenting a cognitively informed,chimera-based framework combined with in silico experiments (26),where we leverage the existence of a core set of predefined cognitive
1 of 14
SC I ENCE ADVANCES | R E S EARCH ART I C L E
http://advances.sciencemD
ownloaded from
systems that constitute the functional organization of the brain (27, 28).Consequently, our framework keeps the computational complexity ofthe analysis to aminimumwhile providing the unique ability to connectchimera states as an underlying basis for cognition. Using personalizedbrain network models (BNMs), we study cognitive system–levelpatterns of synchrony that emerge across 76 brain regions within ninecognitive systems as the result of regional brain stimulation. Our anal-ysis focuses on how brain architecture relates to the frequency and typesof dynamical patterns produced after stimulation. More specifically, weaim to answer two questions: (i) Do patterns of synchronization ob-served for each cognitive system depend on what region was stimulated(region-specific effects) and (ii) does structural variability between par-ticipants decrease the consistency of patterns observed for each cogni-tive system (subject-specific effects)?
From our in silico experiments, we observe different patterns ofsynchronization that can be classified into three dynamical states:(i) a coherent state of global synchrony, (ii) a chimera state with co-existing domains of synchrony and desynchrony, and (iii) a meta-stable state with an absence of any large-scale stable synchrony. Ourresults demonstrate rich diversity in the states produced across all ninecognitive systems, including variability in patterns based on bothregion-specific and subject-specific structural variability. Critically,all nine cognitive systems give rise to chimera states, and this likelyreflects the foundational role that partial synchrony serves in large-scale brain function. Neuronal dynamics must concurrently segregatespecialized processing while integrating localized functions forcoordinated, cohesive cognitive performance. Our chimera-basedframework provides an avenue to study how dynamical states giverise to variability in cognitive performance, providing the first ap-proach that can uncover the link between chimera states and cognitivesystem functions that subserve human behavior.
on February 15, 2020
ag.org/
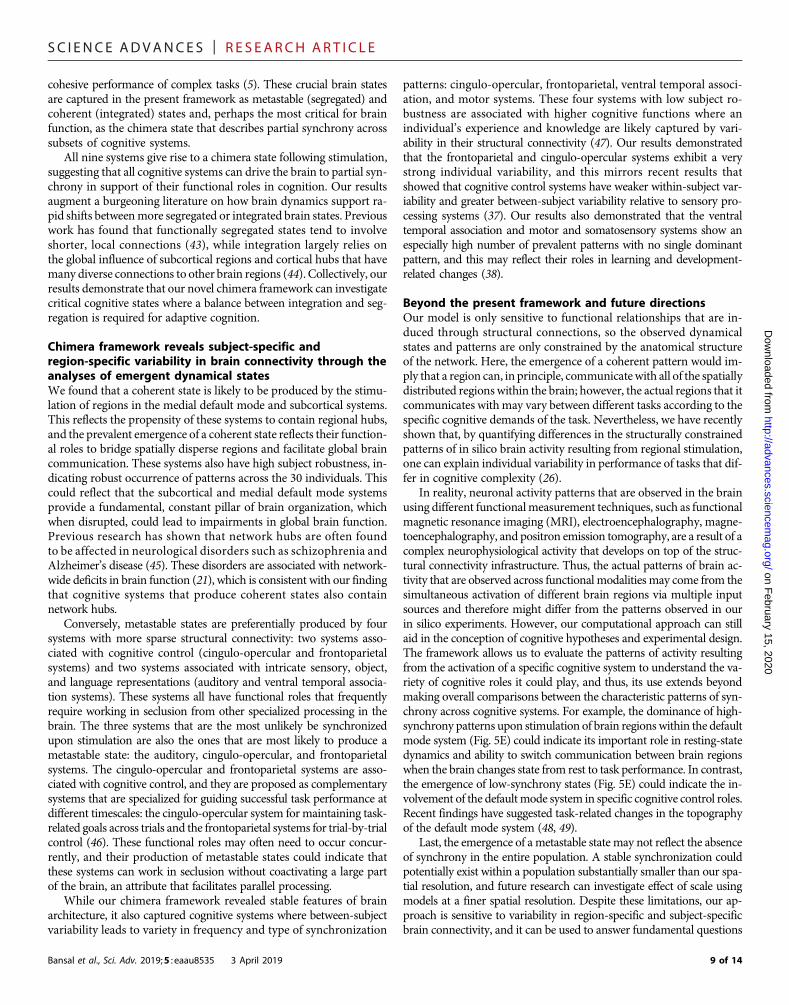
RESULTSWe first build subject-specific BNMs using anatomical connectivityderived from diffusion spectrum imaging (DSI) data of 30 healthyindividuals. We have previously shown that these data-driven BNMs,combined with in silico experiments, can successfully explain individ-ual variability in performance across certain language-based cognitivetasks (26). In the present work, we leverage these computationalBNMs to understand the structural constraints to the macroscopiccognitive organization of the brain. The steps to construct a BNMare illustrated in Fig. 1A. We first parcellate the brain into 76 regions(network nodes) and define weighted network edges based on struc-tural connectivity between brain regions. The dynamics of each brainregion are modeled using Wilson-Cowan oscillators (WCOs), a bio-logically inspired, nonlinear mean-field model of a small population ofneurons (29). The coupling between regions is derived on the basis ofthe unique structural connectivity of each individual (fig. S1). Whenmultiple WCOs are coupled, the resulting patterns of synchronizationare highly dependent on the topology of the coupling, ensuring thatthese BNMs are highly sensitive to individual variability in theunderlying anatomical connectivity (27, 30). As illustrated in Fig. 1Band fig. S1, we then perform in silico experiments by systematicallyapplying computational regional (nodal) stimulation to the BNM. Pre-vious work using in silico brain stimulation has studied the impact oflocal perturbations on large-scale brain dynamics (31) and shown thatstimulation of certain regions can produce activity patterns that aresimilar to resting-state activity of the brain (32). Here, we focus onBansal et al., Sci. Adv. 2019;5 : eaau8535 3 April 2019
assessing the resulting patterns of synchronization that emerge onthe basis of subject-specific and region-specific variation in structuralconnectivity as a result of computational regional stimulation.
Classification of brain states using cognitive systemsTraditionally, one would measure system-wide synchronization bycalculating a measure such as the Kuramoto order parameter withinthe entire network of oscillators (33). However, we are interested in ex-ploring how the stimulation of different brain regions drives brainfunction and how brain function is constrained by variability in struc-tural connectivity. Therefore, we instead focus on the relationship be-tween patterns of synchronization among experimentally motivatedcognitive systems, where the regions assigned to each system have beenshown to support similar cognitive processes. Thus, on the basis of pre-vious research (27, 28), we assigned each of the 76 brain regions into oneof nine cognitive systems (fig. S2). Each cognitive system is defined byregions that coactivate in support of a generalized class of cognitivefunctions. This delineation includes several sensory motor–relatedsystems, including auditory (Aud), visual (V), and motor and somato-sensory (MS) systems, as well as the ventral temporal association system(VT) that encapsulates regions involved in knowledge representation.Several of the systems are involved in functional roles that are genericacross cognitive performance, including the attention system (Att), themedial default mode system (mDm), and two systems associated withcognitive control, the cingulo-opercular (CP) and frontoparietal (FP)systems. Last, we include the subcortical system that consists of the re-gions responsible for autonomic and primal functions.
A
B
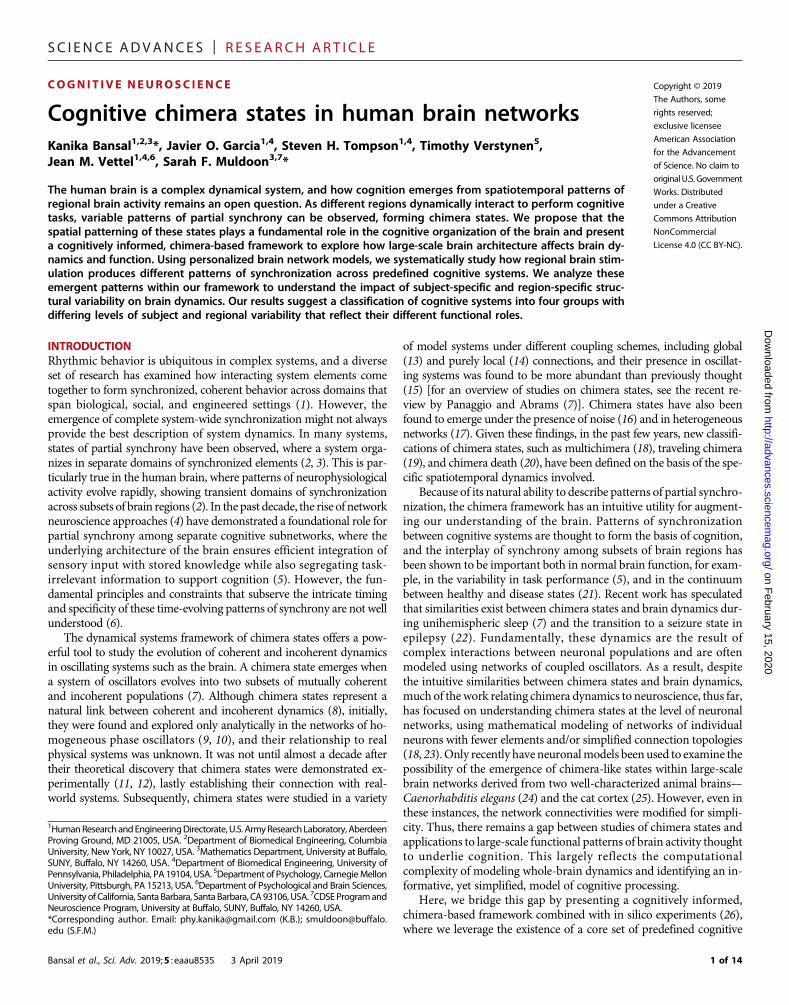
Fig. 1. Design of the in silico experiments. (A) We construct personalized BNMsby estimating white matter anatomical connectivity of the brain using DSI. This con-nectivity is combinedwith a brain parcellation schemewith 76 cortical and subcorticalregions to obtain a large-scale connectivity map of the regional brain volume. Theseregions constitute the nodes of the structural brain network whose dynamicsare simulated by nonlinear WCOs, coupled through the structural connectivitymap of a given subject (see Materials and Methods). (B) In the resulting data-driven models of the spatiotemporal dynamics of the brain, each brain region issystematically stimulated across a cohort of 30 subjects. The spread of the stimula-tion is measured through synchronization within the brain network.
2 of 14
SC I ENCE ADVANCES | R E S EARCH ART I C L E
on February 15, 2020
http://advances.sciencemag.org/
Dow
nloaded from
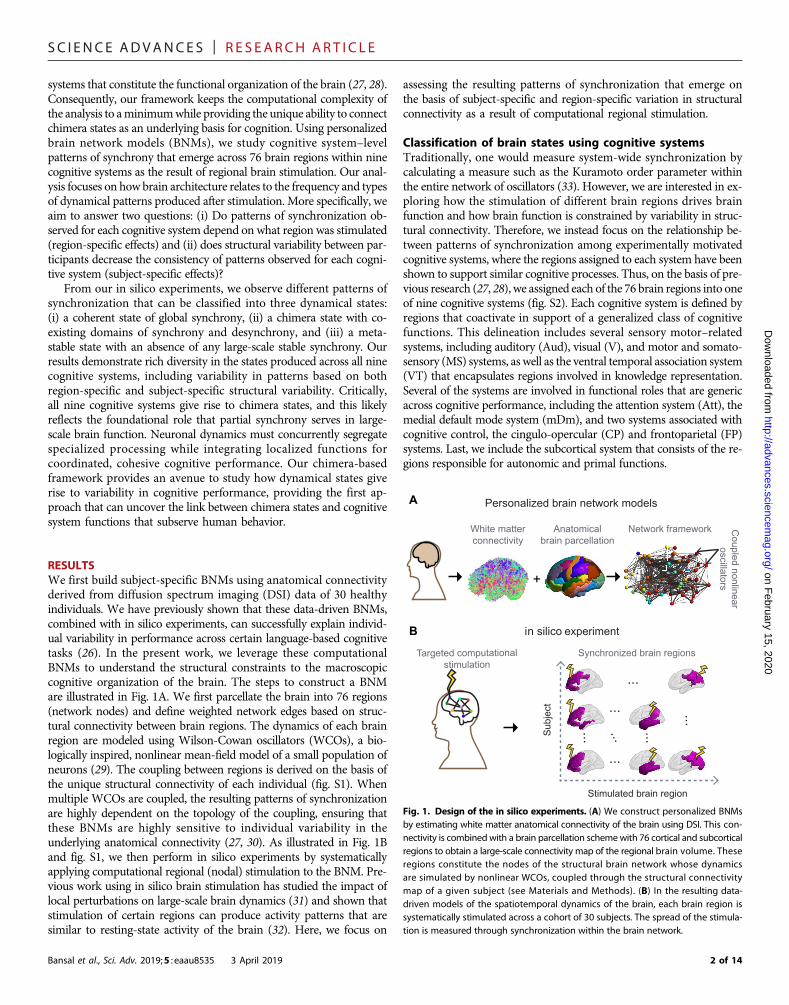
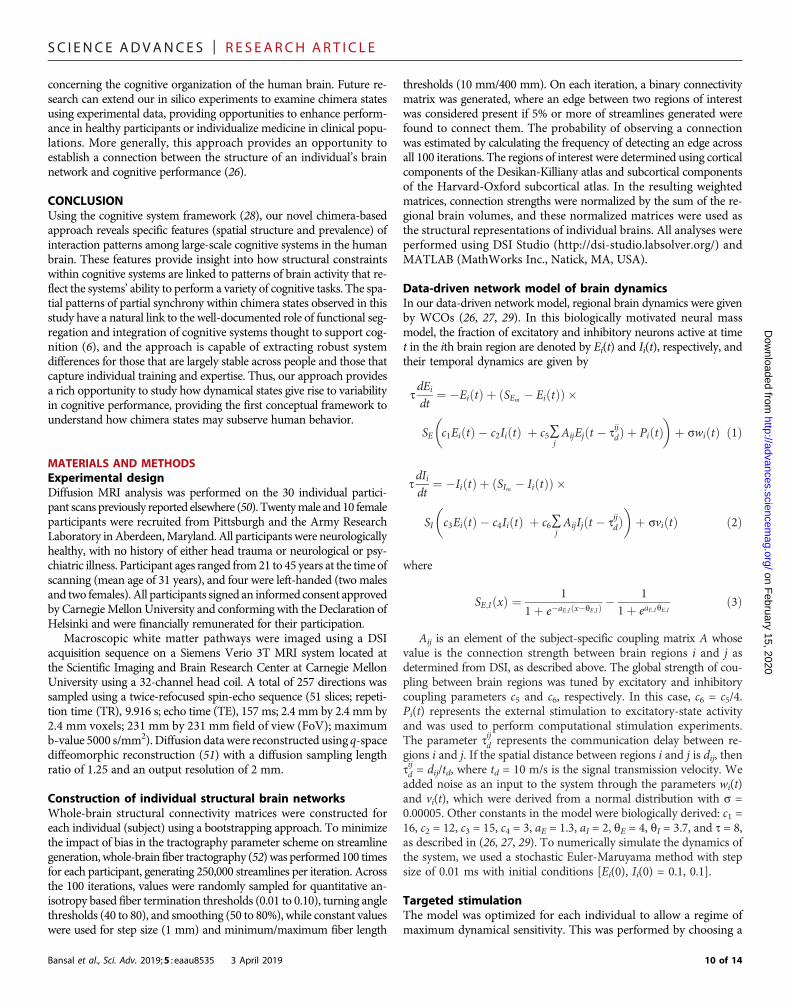
In each in silico experiment, we stimulate a brain region in eachsubject-specific BNM and then compute the cognitive system–levelsynchronization. Specifically, we calculate a cognitive system–basedKuramoto order parameter rsi,sj that measures the amount of syn-chrony among all oscillators (regions) within two cognitive systemssi and sj and obtain a cognitive system–based synchronization matrix,as shown in Fig. 2A. In this synchronization matrix, we define twocognitive systems, si and sj, to be synchronized if rsi,sj exceeds a thresh-old value rTh. In Fig. 2A, we chose rTh = 0.8 to define three dynamicalstates observed in this study: (i) a coherent state, where all cognitivesystems are synchronized; (ii) a cognitive chimera state, where somecognitive systems form a synchronized cluster (yellow) while the othersystems remain incoherent (blue); and (iii) a metastable state, whereno stable synchrony between cognitive systems is observed. In a meta-stable state, we observed oscillator populations to exhibit transientstates of synchrony and desynchrony [metastability (34)] and the ab-sence of a long-range stable synchronization. This state is character-ized by a high metastability index (Materials and Methods) and isdistinct from coherent and chimera states (fig. S3).
Next, we compare our cognitive system–based analysis with twotraditional measures of synchronization: (i) the classical Kuramotoorder parameter (33) calculated across all 76 oscillators (regions) thatcaptures the level of global synchrony in the network and (ii) the chi-mera index (24, 34) that describes the closeness of the state with anideal chimera state (see Materials and Methods). In Fig. 2B, we showhow the three dynamical states (coherent, chimera, and metastable)observed after stimulation of different brain regions in different subjectsare distributed in the global synchrony and chimera-index parameterspace. Each dot in this figure denotes a single brain region that wasstimulated, its position denotes the amount of global synchrony andchimera index it produced in the network, and its color represents theclassification of the emergent state within our cognitive framework. Inthe parameter space of the global synchrony and chimera index, weobserve a separation in the area occupied by these states. As expected,global synchrony decreases from the coherent to chimera to metastablestate. Thus, a cognitively informed, system-based classification of dy-namical states is comparable to the traditional measures of estimatingsynchrony within a network.
We also examine how these two traditional metrics of synchroni-zation relate to the connectivity properties of the node (region) itself.As seen in Fig. 2C, the level of global synchrony is positively correlatedwith the degree of the region being stimulated (r = 0.81; P < 10−308).Stimulation of a network hub (highly connected brain region) is there-fore more likely to produce a coherent state, while stimulation of anonhub is more likely to result in either a chimera or metastable state.Figure 2D reveals that the chimera index shows a relativelyweaker andnegative correlation with the degree of the region stimulated (r = −0.61;P = 6.4 × 10−229). This relationship indicates the ability of moderatelyconnected brain regions to produce a variety of spatially distinct syn-chronization patterns as a result of stimulation. These results not onlydemonstrate that chimera states emerge among large-scale cognitivesystems, but also reveal that the variable structural connectivity of re-gions within cognitive systems can drive the whole brain into diversesynchronization patterns. It has been previously shown that the effec-tiveness of a brain region as a stimulation site is related to its positionwithin the cortical hierarchy (31), and we therefore also examinedwhether the emergence of a cognitive state can be predicted by theconnectivity between the stimulated region and the highly connectedcore, or rich club, of the brain (35). We obtained a set of core regions
Bansal et al., Sci. Adv. 2019;5 : eaau8535 3 April 2019
within each subject and then calculated the average shortest path lengthof each brain region to this core (see Materials and Methods). Thisquantity signifies the ease with which one can reach at a core regionfrom a given region within the network. In Fig. 2E, we observe thatthe average shortest path length to the core correlates negatively withthe global synchrony (r = −0.74; P < 10−308). This indicates that, apartfrom the core itself, the regions that are easily connected to the core arealso likely to produce a state with high synchrony. Here, colors identifythe cognitive classification of the emergent states into coherent (red),chimera (yellow), and metastable (blue) states. Although we do not ob-serve a direct separation of states based on the average shortest pathlength to the core, one can conclude that regions closest to the coreare more likely to produce a coherent state, while regions farthest fromthe core are likely to produce a metastable state.
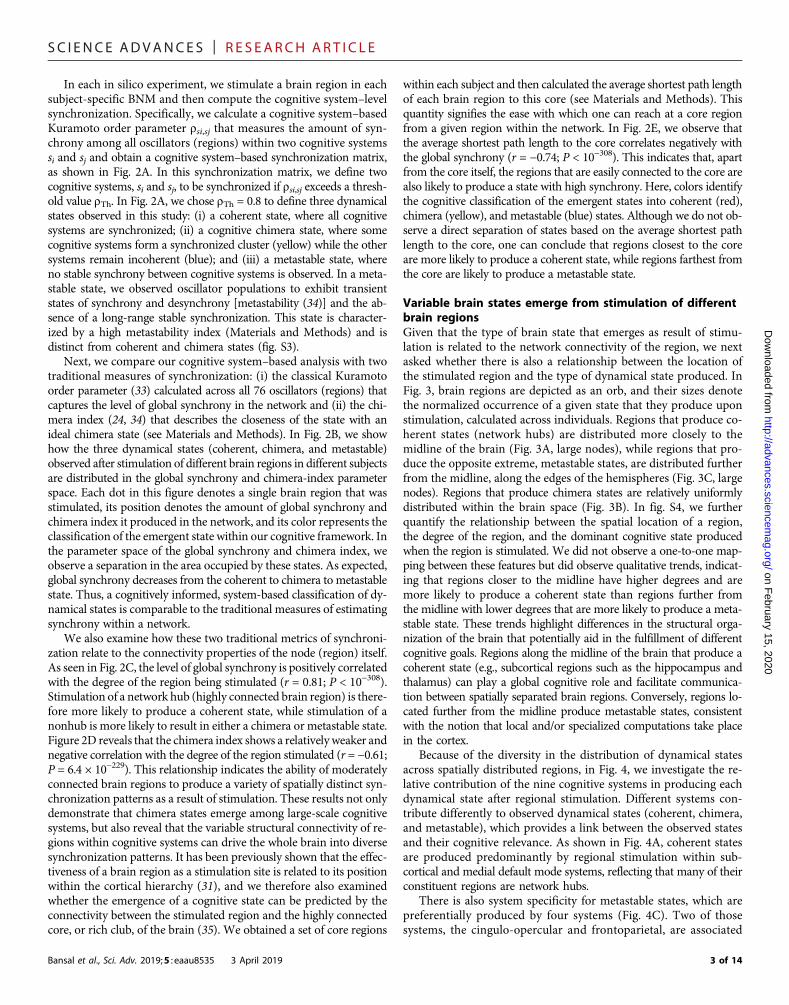
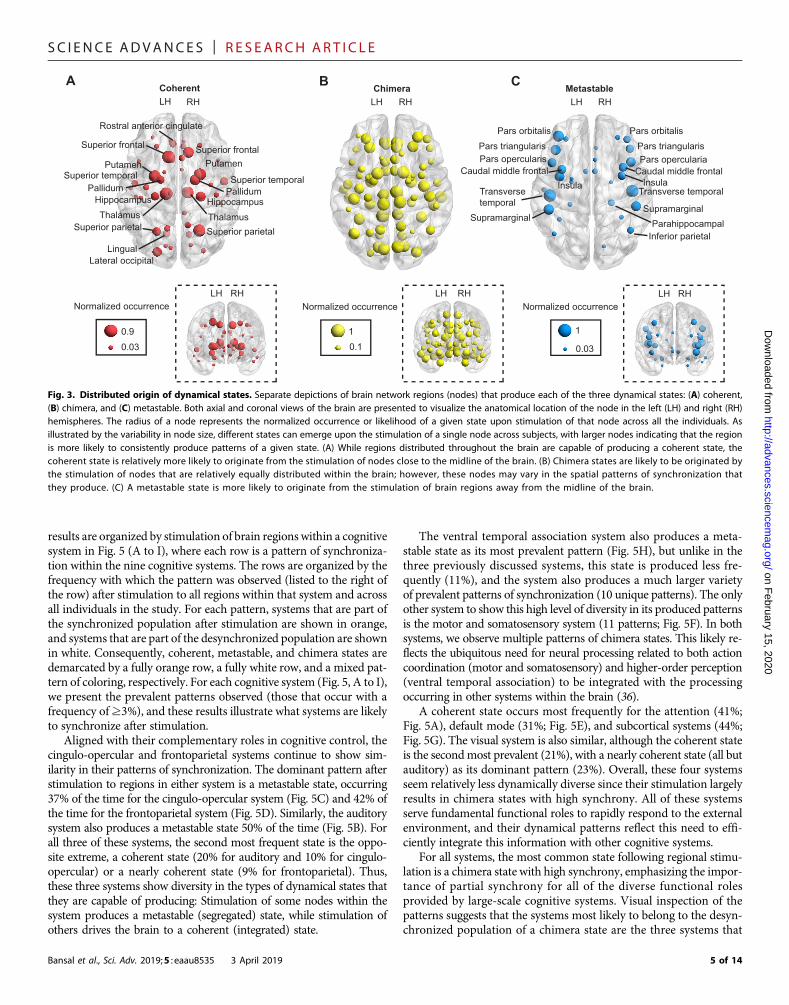
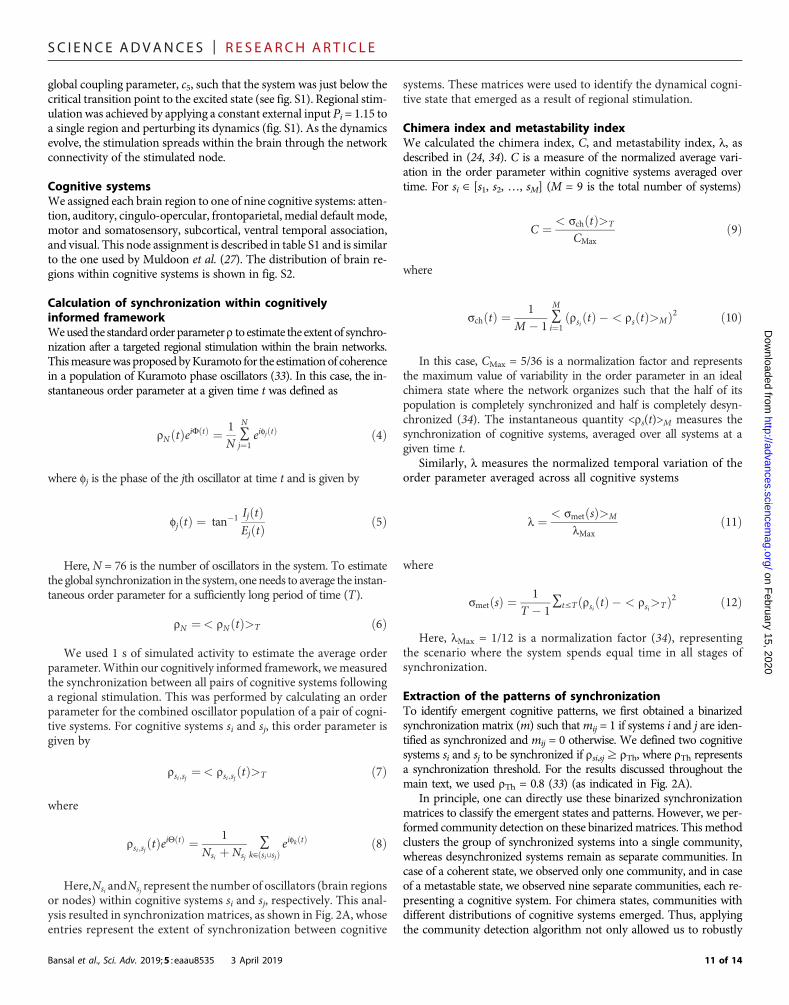
Variable brain states emerge from stimulation of differentbrain regionsGiven that the type of brain state that emerges as result of stimu-lation is related to the network connectivity of the region, we nextasked whether there is also a relationship between the location ofthe stimulated region and the type of dynamical state produced. InFig. 3, brain regions are depicted as an orb, and their sizes denotethe normalized occurrence of a given state that they produce uponstimulation, calculated across individuals. Regions that produce co-herent states (network hubs) are distributed more closely to themidline of the brain (Fig. 3A, large nodes), while regions that pro-duce the opposite extreme, metastable states, are distributed furtherfrom the midline, along the edges of the hemispheres (Fig. 3C, largenodes). Regions that produce chimera states are relatively uniformlydistributed within the brain space (Fig. 3B). In fig. S4, we furtherquantify the relationship between the spatial location of a region,the degree of the region, and the dominant cognitive state producedwhen the region is stimulated. We did not observe a one-to-one map-ping between these features but did observe qualitative trends, indicat-ing that regions closer to the midline have higher degrees and aremore likely to produce a coherent state than regions further fromthe midline with lower degrees that are more likely to produce a meta-stable state. These trends highlight differences in the structural orga-nization of the brain that potentially aid in the fulfillment of differentcognitive goals. Regions along the midline of the brain that produce acoherent state (e.g., subcortical regions such as the hippocampus andthalamus) can play a global cognitive role and facilitate communica-tion between spatially separated brain regions. Conversely, regions lo-cated further from the midline produce metastable states, consistentwith the notion that local and/or specialized computations take placein the cortex.
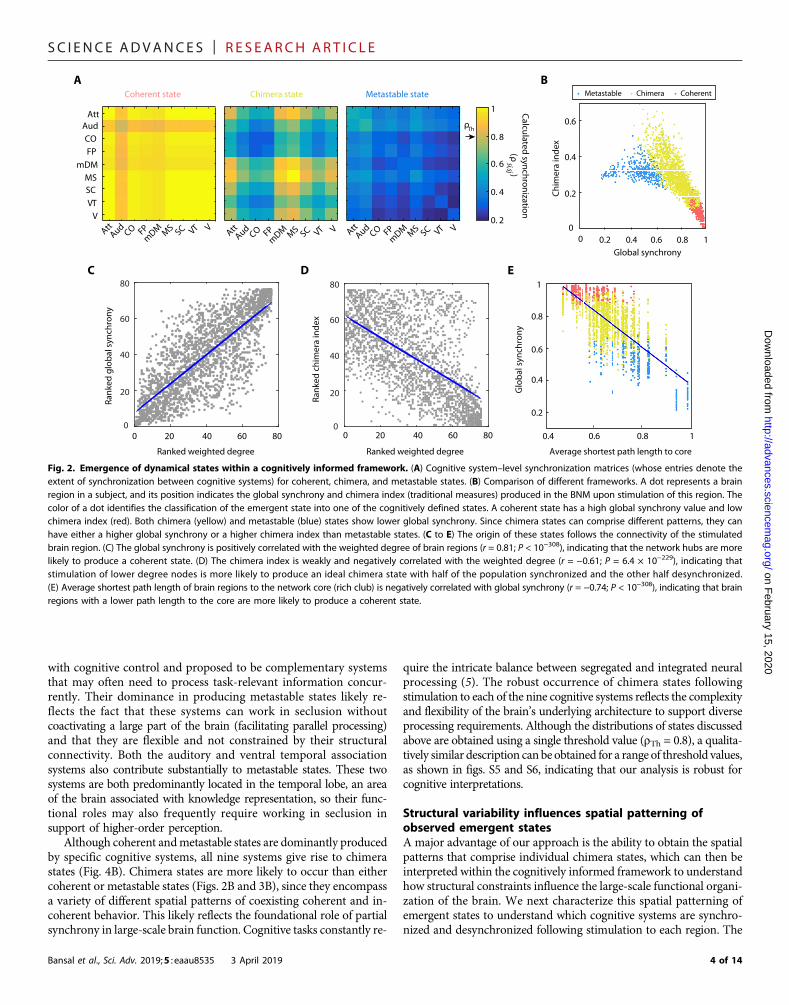
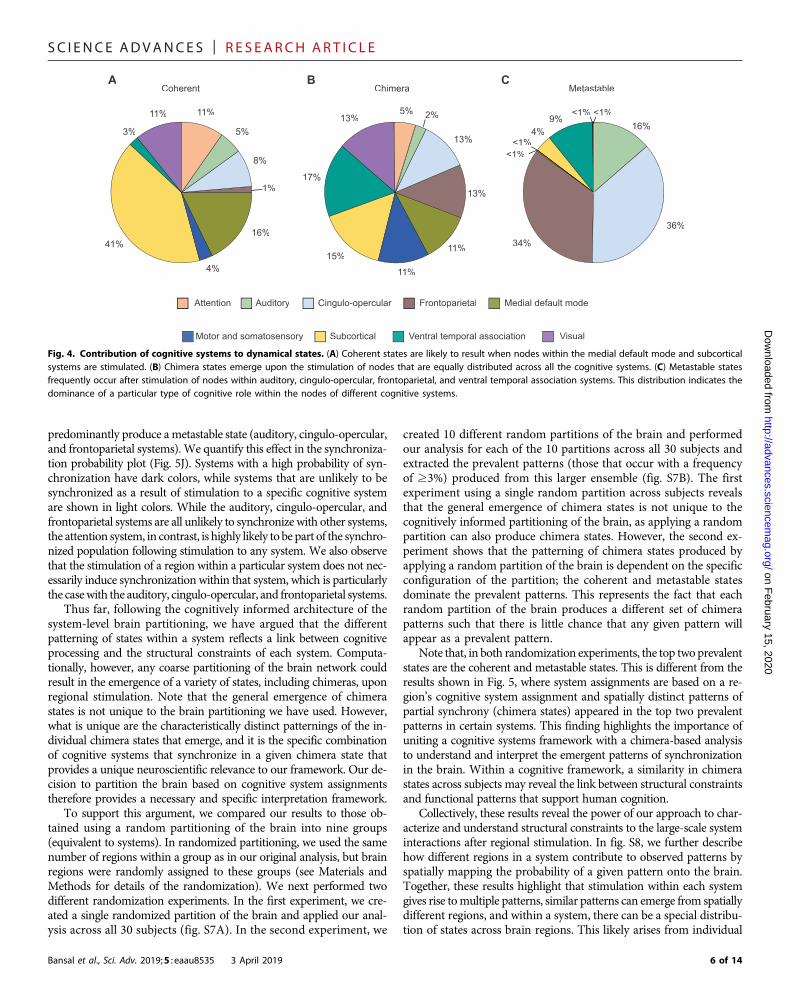
Because of the diversity in the distribution of dynamical statesacross spatially distributed regions, in Fig. 4, we investigate the re-lative contribution of the nine cognitive systems in producing eachdynamical state after regional stimulation. Different systems con-tribute differently to observed dynamical states (coherent, chimera,and metastable), which provides a link between the observed statesand their cognitive relevance. As shown in Fig. 4A, coherent statesare produced predominantly by regional stimulation within sub-cortical and medial default mode systems, reflecting that many of theirconstituent regions are network hubs.
There is also system specificity for metastable states, which arepreferentially produced by four systems (Fig. 4C). Two of thosesystems, the cingulo-opercular and frontoparietal, are associated
3 of 14
SC I ENCE ADVANCES | R E S EARCH ART I C L E
on February 15, 2020
http://advances.sciencemag.org/
Dow
nloaded from
with cognitive control and proposed to be complementary systemsthat may often need to process task-relevant information concur-rently. Their dominance in producing metastable states likely re-flects the fact that these systems can work in seclusion withoutcoactivating a large part of the brain (facilitating parallel processing)and that they are flexible and not constrained by their structuralconnectivity. Both the auditory and ventral temporal associationsystems also contribute substantially to metastable states. These twosystems are both predominantly located in the temporal lobe, an areaof the brain associated with knowledge representation, so their func-tional roles may also frequently require working in seclusion insupport of higher-order perception.
Although coherent andmetastable states are dominantly producedby specific cognitive systems, all nine systems give rise to chimerastates (Fig. 4B). Chimera states are more likely to occur than eithercoherent or metastable states (Figs. 2B and 3B), since they encompassa variety of different spatial patterns of coexisting coherent and in-coherent behavior. This likely reflects the foundational role of partialsynchrony in large-scale brain function. Cognitive tasks constantly re-
Bansal et al., Sci. Adv. 2019;5 : eaau8535 3 April 2019
quire the intricate balance between segregated and integrated neuralprocessing (5). The robust occurrence of chimera states followingstimulation to each of the nine cognitive systems reflects the complexityand flexibility of the brain’s underlying architecture to support diverseprocessing requirements. Although the distributions of states discussedabove are obtained using a single threshold value (rTh = 0.8), a qualita-tively similar description can be obtained for a range of threshold values,as shown in figs. S5 and S6, indicating that our analysis is robust forcognitive interpretations.
Structural variability influences spatial patterning ofobserved emergent statesA major advantage of our approach is the ability to obtain the spatialpatterns that comprise individual chimera states, which can then beinterpreted within the cognitively informed framework to understandhow structural constraints influence the large-scale functional organi-zation of the brain. We next characterize this spatial patterning ofemergent states to understand which cognitive systems are synchro-nized and desynchronized following stimulation to each region. The
Rank
ed g
loba
l syn
chro
ny
AMetastable Chimera Coherent
Chim
era
inde
x
00
0.2
0.4
0.6
0.2 0.4 0.6 0.8 1Global synchrony
B
0
20
40
60
80
0 20 40 60 80
Ranked weighted degree Ranked weighted degree
0
20
40
60
80
0 20 40 60 80
Rank
ed c
him
era
inde
x
0.2
0.4
0.6
0.8
1
0.4 0.6 0.8 1
Average shortest path length to core
Glo
bal s
ynch
rony
C D E
Coherent state Chimera state
AudCO
Att
mDMMS
FP
VTV
SC
AttAud
CO FPmDM MS SC VT V
Metastable state
0. 2
0. 4
0. 6
0. 8
1 Calculated synchronization (ρ
si,sj )
ρ Th
AttAud
CO FPmDM MS SC VT V Att
AudCO FP
mDM MS SC VT V
Fig. 2. Emergence of dynamical states within a cognitively informed framework. (A) Cognitive system–level synchronization matrices (whose entries denote theextent of synchronization between cognitive systems) for coherent, chimera, and metastable states. (B) Comparison of different frameworks. A dot represents a brainregion in a subject, and its position indicates the global synchrony and chimera index (traditional measures) produced in the BNM upon stimulation of this region. Thecolor of a dot identifies the classification of the emergent state into one of the cognitively defined states. A coherent state has a high global synchrony value and lowchimera index (red). Both chimera (yellow) and metastable (blue) states show lower global synchrony. Since chimera states can comprise different patterns, they canhave either a higher global synchrony or a higher chimera index than metastable states. (C to E) The origin of these states follows the connectivity of the stimulatedbrain region. (C) The global synchrony is positively correlated with the weighted degree of brain regions (r = 0.81; P < 10−308), indicating that the network hubs are morelikely to produce a coherent state. (D) The chimera index is weakly and negatively correlated with the weighted degree (r = −0.61; P = 6.4 × 10−229), indicating thatstimulation of lower degree nodes is more likely to produce an ideal chimera state with half of the population synchronized and the other half desynchronized.(E) Average shortest path length of brain regions to the network core (rich club) is negatively correlated with global synchrony (r = −0.74; P < 10−308), indicating that brainregions with a lower path length to the core are more likely to produce a coherent state.
4 of 14
SC I ENCE ADVANCES | R E S EARCH ART I C L E
on February 15, 2020
http://advances.sciencemag.org/
Dow
nloaded from
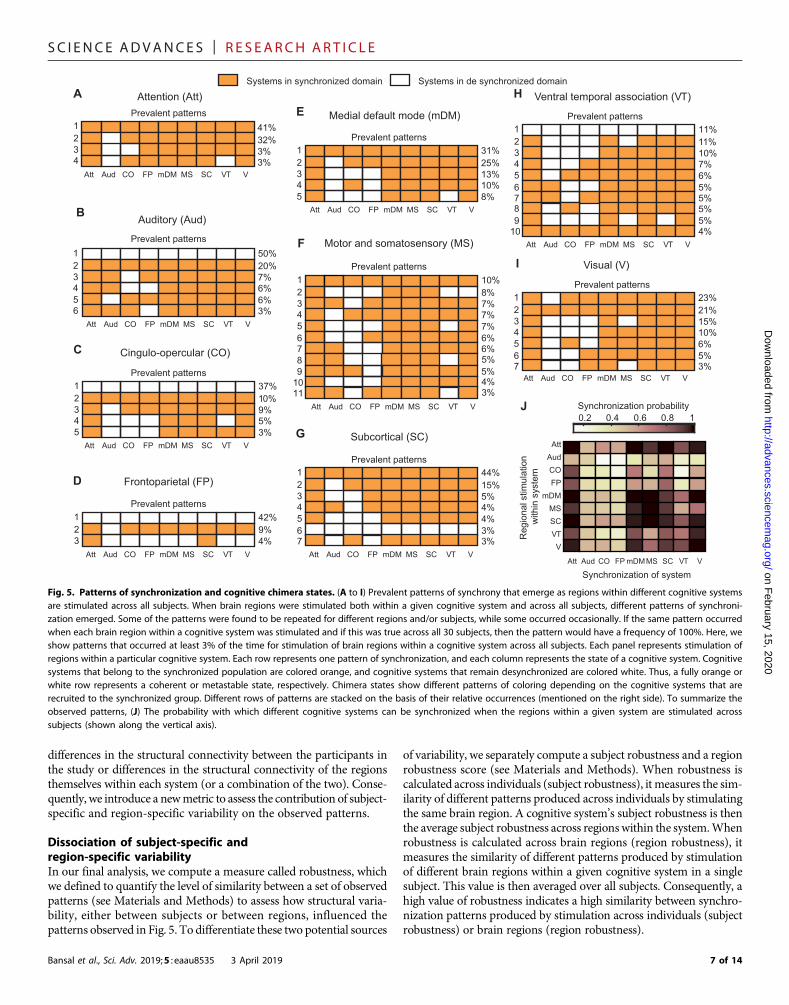
results are organized by stimulation of brain regionswithin a cognitivesystem in Fig. 5 (A to I), where each row is a pattern of synchroniza-tion within the nine cognitive systems. The rows are organized by thefrequency with which the pattern was observed (listed to the right ofthe row) after stimulation to all regions within that system and acrossall individuals in the study. For each pattern, systems that are part ofthe synchronized population after stimulation are shown in orange,and systems that are part of the desynchronized population are shownin white. Consequently, coherent, metastable, and chimera states aredemarcated by a fully orange row, a fully white row, and a mixed pat-tern of coloring, respectively. For each cognitive system (Fig. 5, A to I),we present the prevalent patterns observed (those that occur with afrequency of≥3%), and these results illustrate what systems are likelyto synchronize after stimulation.
Aligned with their complementary roles in cognitive control, thecingulo-opercular and frontoparietal systems continue to show sim-ilarity in their patterns of synchronization. The dominant pattern afterstimulation to regions in either system is a metastable state, occurring37% of the time for the cingulo-opercular system (Fig. 5C) and 42% ofthe time for the frontoparietal system (Fig. 5D). Similarly, the auditorysystem also produces a metastable state 50% of the time (Fig. 5B). Forall three of these systems, the second most frequent state is the oppo-site extreme, a coherent state (20% for auditory and 10% for cingulo-opercular) or a nearly coherent state (9% for frontoparietal). Thus,these three systems show diversity in the types of dynamical states thatthey are capable of producing: Stimulation of some nodes within thesystem produces a metastable (segregated) state, while stimulation ofothers drives the brain to a coherent (integrated) state.
Bansal et al., Sci. Adv. 2019;5 : eaau8535 3 April 2019
The ventral temporal association system also produces a meta-stable state as its most prevalent pattern (Fig. 5H), but unlike in thethree previously discussed systems, this state is produced less fre-quently (11%), and the system also produces a much larger varietyof prevalent patterns of synchronization (10 unique patterns). The onlyother system to show this high level of diversity in its produced patternsis the motor and somatosensory system (11 patterns; Fig. 5F). In bothsystems, we observe multiple patterns of chimera states. This likely re-flects the ubiquitous need for neural processing related to both actioncoordination (motor and somatosensory) and higher-order perception(ventral temporal association) to be integrated with the processingoccurring in other systems within the brain (36).
A coherent state occurs most frequently for the attention (41%;Fig. 5A), default mode (31%; Fig. 5E), and subcortical systems (44%;Fig. 5G). The visual system is also similar, although the coherent stateis the secondmost prevalent (21%), with a nearly coherent state (all butauditory) as its dominant pattern (23%). Overall, these four systemsseem relatively less dynamically diverse since their stimulation largelyresults in chimera states with high synchrony. All of these systemsserve fundamental functional roles to rapidly respond to the externalenvironment, and their dynamical patterns reflect this need to effi-ciently integrate this information with other cognitive systems.
For all systems, the most common state following regional stimu-lation is a chimera state with high synchrony, emphasizing the impor-tance of partial synchrony for all of the diverse functional rolesprovided by large-scale cognitive systems. Visual inspection of thepatterns suggests that the systems most likely to belong to the desyn-chronized population of a chimera state are the three systems that
Pars orbitalisPars triangularis
Supramarginal
Inferior parietalParahippocampal
Caudal middle frontal
Transverse temporal
LH RH
LH RH
LH RH
LH RH
CMetastableChimera
BA
LH RHCoherent
Normalized occurrence Normalized occurrence
PutamenSuperior temporal
Hippocampus
Superior frontal
Putamen
Superior parietalSuperior parietal
Lateral occipital
Normalized occurrence
0.9 10.1
1
0.030.03
LH RH
Pars opercularia
HippocampusThalamus
Pallidum
Superior frontal
Superior temporal
Lingual
Rostral anterior cingulate
Thalamus
Insula
Pars orbitalisPars triangularisPars opercularis
Caudal middle frontalInsulaTransverse
temporalSupramarginal
Pallidum
LH RH
Fig. 3. Distributed origin of dynamical states. Separate depictions of brain network regions (nodes) that produce each of the three dynamical states: (A) coherent,(B) chimera, and (C) metastable. Both axial and coronal views of the brain are presented to visualize the anatomical location of the node in the left (LH) and right (RH)hemispheres. The radius of a node represents the normalized occurrence or likelihood of a given state upon stimulation of that node across all the individuals. Asillustrated by the variability in node size, different states can emerge upon the stimulation of a single node across subjects, with larger nodes indicating that the regionis more likely to consistently produce patterns of a given state. (A) While regions distributed throughout the brain are capable of producing a coherent state, thecoherent state is relatively more likely to originate from the stimulation of nodes close to the midline of the brain. (B) Chimera states are likely to be originated bythe stimulation of nodes that are relatively equally distributed within the brain; however, these nodes may vary in the spatial patterns of synchronization thatthey produce. (C) A metastable state is more likely to originate from the stimulation of brain regions away from the midline of the brain.
5 of 14
SC I ENCE ADVANCES | R E S EARCH ART I C L E
on February 15, 2020
http://advances.sciencemag.org/
Dow
nloaded from
predominantly produce ametastable state (auditory, cingulo-opercular,and frontoparietal systems). We quantify this effect in the synchroniza-tion probability plot (Fig. 5J). Systems with a high probability of syn-chronization have dark colors, while systems that are unlikely to besynchronized as a result of stimulation to a specific cognitive systemare shown in light colors. While the auditory, cingulo-opercular, andfrontoparietal systems are all unlikely to synchronize with other systems,the attention system, in contrast, is highly likely to be part of the synchro-nized population following stimulation to any system. We also observethat the stimulation of a region within a particular system does not nec-essarily induce synchronization within that system, which is particularlythe casewith the auditory, cingulo-opercular, and frontoparietal systems.
Thus far, following the cognitively informed architecture of thesystem-level brain partitioning, we have argued that the differentpatterning of states within a system reflects a link between cognitiveprocessing and the structural constraints of each system. Computa-tionally, however, any coarse partitioning of the brain network couldresult in the emergence of a variety of states, including chimeras, uponregional stimulation. Note that the general emergence of chimerastates is not unique to the brain partitioning we have used. However,what is unique are the characteristically distinct patternings of the in-dividual chimera states that emerge, and it is the specific combinationof cognitive systems that synchronize in a given chimera state thatprovides a unique neuroscientific relevance to our framework. Our de-cision to partition the brain based on cognitive system assignmentstherefore provides a necessary and specific interpretation framework.
To support this argument, we compared our results to those ob-tained using a random partitioning of the brain into nine groups(equivalent to systems). In randomized partitioning, we used the samenumber of regions within a group as in our original analysis, but brainregions were randomly assigned to these groups (see Materials andMethods for details of the randomization). We next performed twodifferent randomization experiments. In the first experiment, we cre-ated a single randomized partition of the brain and applied our anal-ysis across all 30 subjects (fig. S7A). In the second experiment, we
Bansal et al., Sci. Adv. 2019;5 : eaau8535 3 April 2019
created 10 different random partitions of the brain and performedour analysis for each of the 10 partitions across all 30 subjects andextracted the prevalent patterns (those that occur with a frequencyof ≥3%) produced from this larger ensemble (fig. S7B). The firstexperiment using a single random partition across subjects revealsthat the general emergence of chimera states is not unique to thecognitively informed partitioning of the brain, as applying a randompartition can also produce chimera states. However, the second ex-periment shows that the patterning of chimera states produced byapplying a random partition of the brain is dependent on the specificconfiguration of the partition; the coherent and metastable statesdominate the prevalent patterns. This represents the fact that eachrandom partition of the brain produces a different set of chimerapatterns such that there is little chance that any given pattern willappear as a prevalent pattern.
Note that, in both randomization experiments, the top two prevalentstates are the coherent and metastable states. This is different from theresults shown in Fig. 5, where system assignments are based on a re-gion’s cognitive system assignment and spatially distinct patterns ofpartial synchrony (chimera states) appeared in the top two prevalentpatterns in certain systems. This finding highlights the importance ofuniting a cognitive systems framework with a chimera-based analysisto understand and interpret the emergent patterns of synchronizationin the brain. Within a cognitive framework, a similarity in chimerastates across subjects may reveal the link between structural constraintsand functional patterns that support human cognition.
Collectively, these results reveal the power of our approach to char-acterize and understand structural constraints to the large-scale systeminteractions after regional stimulation. In fig. S8, we further describehow different regions in a system contribute to observed patterns byspatially mapping the probability of a given pattern onto the brain.Together, these results highlight that stimulation within each systemgives rise tomultiple patterns, similar patterns can emerge from spatiallydifferent regions, and within a system, there can be a special distribu-tion of states across brain regions. This likely arises from individual
11%
5%
8%
1%
16%
4%
41%
3%
11% <1%<1%
<1%
16%
36%
34%
4%9%
5% 2%
13%
13%
11%
11%
15%
17%
13%
Attention Auditory FrontoparietalCingulo-opercular Medial default mode
Motor and somatosensory Ventral temporal associationSubcortical Visual
Coherent Chimera MetastableA B C
<1%
Fig. 4. Contribution of cognitive systems to dynamical states. (A) Coherent states are likely to result when nodes within the medial default mode and subcorticalsystems are stimulated. (B) Chimera states emerge upon the stimulation of nodes that are equally distributed across all the cognitive systems. (C) Metastable statesfrequently occur after stimulation of nodes within auditory, cingulo-opercular, frontoparietal, and ventral temporal association systems. This distribution indicates thedominance of a particular type of cognitive role within the nodes of different cognitive systems.
6 of 14
SC I ENCE ADVANCES | R E S EARCH ART I C L E
on February 15, 2020
http://advances.sciencemag.org/
Dow
nloaded from
differences in the structural connectivity between the participants inthe study or differences in the structural connectivity of the regionsthemselves within each system (or a combination of the two). Conse-quently, we introduce a newmetric to assess the contribution of subject-specific and region-specific variability on the observed patterns.
Dissociation of subject-specific andregion-specific variabilityIn our final analysis, we compute a measure called robustness, whichwe defined to quantify the level of similarity between a set of observedpatterns (see Materials and Methods) to assess how structural varia-bility, either between subjects or between regions, influenced thepatterns observed in Fig. 5. To differentiate these two potential sources
Bansal et al., Sci. Adv. 2019;5 : eaau8535 3 April 2019
of variability, we separately compute a subject robustness and a regionrobustness score (see Materials and Methods). When robustness iscalculated across individuals (subject robustness), it measures the sim-ilarity of different patterns produced across individuals by stimulatingthe same brain region. A cognitive system’s subject robustness is thenthe average subject robustness across regionswithin the system.Whenrobustness is calculated across brain regions (region robustness), itmeasures the similarity of different patterns produced by stimulationof different brain regions within a given cognitive system in a singlesubject. This value is then averaged over all subjects. Consequently, ahigh value of robustness indicates a high similarity between synchro-nization patterns produced by stimulation across individuals (subjectrobustness) or brain regions (region robustness).
Attention (Att)
Auditory (Aud)
1234
1234
12345
41%32%3%3%
50%20%7%6%
37%10%9%5%3%
Cingulo-opercular (CO)
Att Aud CO FP mDM MS SC VT V
1234567
10%8%7%7%7%
Motor and somatosensory (MS)
6%6%
12345
31%25%13%10%8%
Medial default mode (mDM)
123
42%9%4%
Frontoparietal (FP)
123456
23%21%15%10%6%
Visual (V)
5%
1234567
11%11%10%7%6%
Ventral temporal association (VT)
5%5%
123456
44%15%5%4%4%
Subcortical (SC)
3%
A
B
C
D
E
F
G
H
I
5%
Prevalent patterns
Prevalent patterns
Prevalent patterns
Synchronization of system
Prevalent patterns
Prevalent patterns
Prevalent patterns
Prevalent patterns
Prevalent patterns
Prevalent patterns
Systems in de synchronized domainSystems in synchronized domain
0.2 0.4 0.6 0.8 1
89 5%
4%10
89
10
5%5%4%
J
Reg
iona
l stim
ulat
ion
with
in s
yste
m
Synchronization probability
Att Aud CO FP mDM MS SC VT V
Att Aud CO FP mDM MS SC VT V
Att Aud CO FP mDM MS SC VT V
Att Aud CO FP mDM MS SC VT V
Att Aud CO FP mDM MS SC VT V
Att Aud CO FP mDM MS SC VT V
Att Aud CO FP mDM MS SC VT V
Att Aud CO FP mDM MS SC VT V
Att Aud CO FP mDMMS SC VT V
AttAudCOFP
mDMMSSCVTV
56
6%3%
3%11
7 3%
7 3%
Fig. 5. Patterns of synchronization and cognitive chimera states. (A to I) Prevalent patterns of synchrony that emerge as regions within different cognitive systemsare stimulated across all subjects. When brain regions were stimulated both within a given cognitive system and across all subjects, different patterns of synchroni-zation emerged. Some of the patterns were found to be repeated for different regions and/or subjects, while some occurred occasionally. If the same pattern occurredwhen each brain region within a cognitive system was stimulated and if this was true across all 30 subjects, then the pattern would have a frequency of 100%. Here, weshow patterns that occurred at least 3% of the time for stimulation of brain regions within a cognitive system across all subjects. Each panel represents stimulation ofregions within a particular cognitive system. Each row represents one pattern of synchronization, and each column represents the state of a cognitive system. Cognitivesystems that belong to the synchronized population are colored orange, and cognitive systems that remain desynchronized are colored white. Thus, a fully orange orwhite row represents a coherent or metastable state, respectively. Chimera states show different patterns of coloring depending on the cognitive systems that arerecruited to the synchronized group. Different rows of patterns are stacked on the basis of their relative occurrences (mentioned on the right side). To summarize theobserved patterns, (J) The probability with which different cognitive systems can be synchronized when the regions within a given system are stimulated acrosssubjects (shown along the vertical axis).
7 of 14
SC I ENCE ADVANCES | R E S EARCH ART I C L E
http://advances.sciencemag
Dow
nloaded from
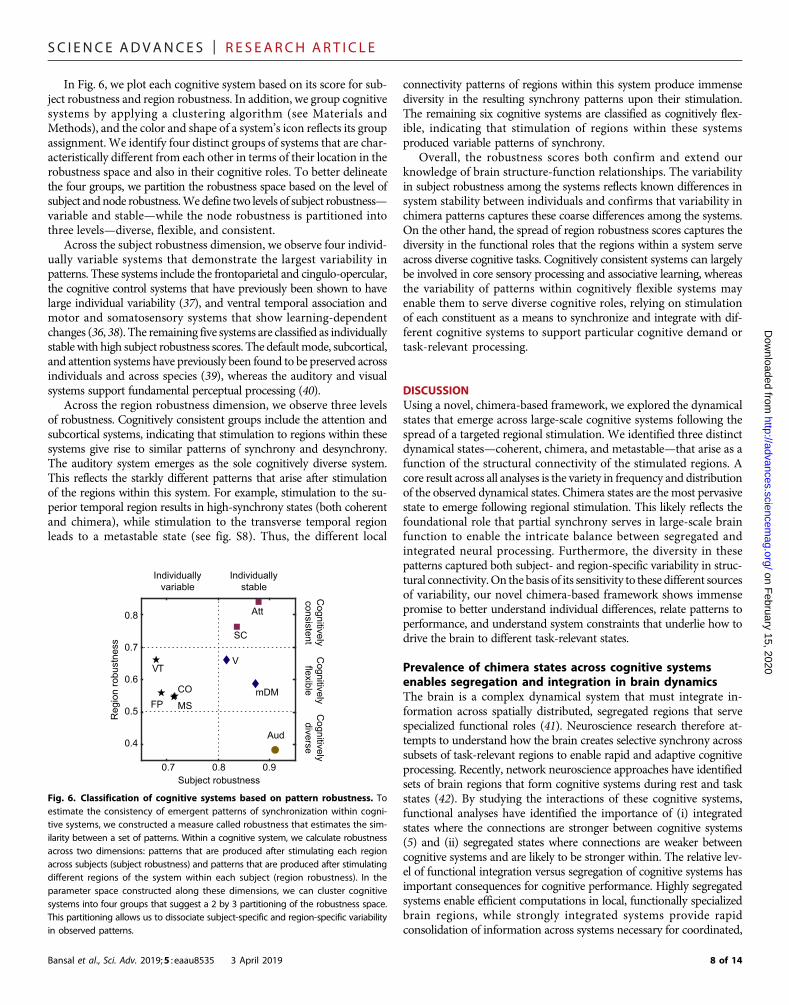
In Fig. 6, we plot each cognitive system based on its score for sub-ject robustness and region robustness. In addition, we group cognitivesystems by applying a clustering algorithm (see Materials andMethods), and the color and shape of a system’s icon reflects its groupassignment. We identify four distinct groups of systems that are char-acteristically different from each other in terms of their location in therobustness space and also in their cognitive roles. To better delineatethe four groups, we partition the robustness space based on the level ofsubject andnode robustness.Wedefine two levels of subject robustness—variable and stable—while the node robustness is partitioned intothree levels—diverse, flexible, and consistent.
Across the subject robustness dimension, we observe four individ-ually variable systems that demonstrate the largest variability inpatterns. These systems include the frontoparietal and cingulo-opercular,the cognitive control systems that have previously been shown to havelarge individual variability (37), and ventral temporal association andmotor and somatosensory systems that show learning-dependentchanges (36, 38). The remaining five systems are classified as individuallystable with high subject robustness scores. The defaultmode, subcortical,and attention systems have previously been found to be preserved acrossindividuals and across species (39), whereas the auditory and visualsystems support fundamental perceptual processing (40).
Across the region robustness dimension, we observe three levelsof robustness. Cognitively consistent groups include the attention andsubcortical systems, indicating that stimulation to regions within thesesystems give rise to similar patterns of synchrony and desynchrony.The auditory system emerges as the sole cognitively diverse system.This reflects the starkly different patterns that arise after stimulationof the regions within this system. For example, stimulation to the su-perior temporal region results in high-synchrony states (both coherentand chimera), while stimulation to the transverse temporal regionleads to a metastable state (see fig. S8). Thus, the different local
Bansal et al., Sci. Adv. 2019;5 : eaau8535 3 April 2019
connectivity patterns of regions within this system produce immensediversity in the resulting synchrony patterns upon their stimulation.The remaining six cognitive systems are classified as cognitively flex-ible, indicating that stimulation of regions within these systemsproduced variable patterns of synchrony.
Overall, the robustness scores both confirm and extend ourknowledge of brain structure-function relationships. The variabilityin subject robustness among the systems reflects known differences insystem stability between individuals and confirms that variability inchimera patterns captures these coarse differences among the systems.On the other hand, the spread of region robustness scores captures thediversity in the functional roles that the regions within a system serveacross diverse cognitive tasks. Cognitively consistent systems can largelybe involved in core sensory processing and associative learning, whereasthe variability of patterns within cognitively flexible systems mayenable them to serve diverse cognitive roles, relying on stimulationof each constituent as a means to synchronize and integrate with dif-ferent cognitive systems to support particular cognitive demand ortask-relevant processing.
on February 15, 2020
.org/
DISCUSSIONUsing a novel, chimera-based framework, we explored the dynamicalstates that emerge across large-scale cognitive systems following thespread of a targeted regional stimulation. We identified three distinctdynamical states—coherent, chimera, and metastable—that arise as afunction of the structural connectivity of the stimulated regions. Acore result across all analyses is the variety in frequency and distributionof the observed dynamical states. Chimera states are the most pervasivestate to emerge following regional stimulation. This likely reflects thefoundational role that partial synchrony serves in large-scale brainfunction to enable the intricate balance between segregated andintegrated neural processing. Furthermore, the diversity in thesepatterns captured both subject- and region-specific variability in struc-tural connectivity.On the basis of its sensitivity to these different sourcesof variability, our novel chimera-based framework shows immensepromise to better understand individual differences, relate patterns toperformance, and understand system constraints that underlie how todrive the brain to different task-relevant states.
Prevalence of chimera states across cognitive systemsenables segregation and integration in brain dynamicsThe brain is a complex dynamical system that must integrate in-formation across spatially distributed, segregated regions that servespecialized functional roles (41). Neuroscience research therefore at-tempts to understand how the brain creates selective synchrony acrosssubsets of task-relevant regions to enable rapid and adaptive cognitiveprocessing. Recently, network neuroscience approaches have identifiedsets of brain regions that form cognitive systems during rest and taskstates (42). By studying the interactions of these cognitive systems,functional analyses have identified the importance of (i) integratedstates where the connections are stronger between cognitive systems(5) and (ii) segregated states where connections are weaker betweencognitive systems and are likely to be stronger within. The relative lev-el of functional integration versus segregation of cognitive systems hasimportant consequences for cognitive performance. Highly segregatedsystems enable efficient computations in local, functionally specializedbrain regions, while strongly integrated systems provide rapidconsolidation of information across systems necessary for coordinated,
0.7 0.8 0.9
0.4
0.5
0.6
0.7
0.8
Subject robustness
Reg
ion
robu
stne
ss
Aud
mDM
Att
SC
V
FPCO
MS
VT
Individuallyvariable
Individuallystable
Cognitively
consistentC
ognitivelyflexible
Cognitivelydiverse
Fig. 6. Classification of cognitive systems based on pattern robustness. Toestimate the consistency of emergent patterns of synchronization within cogni-tive systems, we constructed a measure called robustness that estimates the sim-ilarity between a set of patterns. Within a cognitive system, we calculate robustnessacross two dimensions: patterns that are produced after stimulating each regionacross subjects (subject robustness) and patterns that are produced after stimulatingdifferent regions of the system within each subject (region robustness). In theparameter space constructed along these dimensions, we can cluster cognitivesystems into four groups that suggest a 2 by 3 partitioning of the robustness space.This partitioning allows us to dissociate subject-specific and region-specific variabilityin observed patterns.
8 of 14
SC I ENCE ADVANCES | R E S EARCH ART I C L E
on February 15, 2020
http://advances.sciencemag.org/
Dow
nloaded from
cohesive performance of complex tasks (5). These crucial brain statesare captured in the present framework as metastable (segregated) andcoherent (integrated) states and, perhaps the most critical for brainfunction, as the chimera state that describes partial synchrony acrosssubsets of cognitive systems.
All nine systems give rise to a chimera state following stimulation,suggesting that all cognitive systems can drive the brain to partial syn-chrony in support of their functional roles in cognition. Our resultsaugment a burgeoning literature on how brain dynamics support ra-pid shifts betweenmore segregated or integrated brain states. Previouswork has found that functionally segregated states tend to involveshorter, local connections (43), while integration largely relies onthe global influence of subcortical regions and cortical hubs that havemany diverse connections to other brain regions (44). Collectively, ourresults demonstrate that our novel chimera framework can investigatecritical cognitive states where a balance between integration and seg-regation is required for adaptive cognition.
Chimera framework reveals subject-specific andregion-specific variability in brain connectivity through theanalyses of emergent dynamical statesWe found that a coherent state is likely to be produced by the stimu-lation of regions in the medial default mode and subcortical systems.This reflects the propensity of these systems to contain regional hubs,and the prevalent emergence of a coherent state reflects their function-al roles to bridge spatially disperse regions and facilitate global braincommunication. These systems also have high subject robustness, in-dicating robust occurrence of patterns across the 30 individuals. Thiscould reflect that the subcortical and medial default mode systemsprovide a fundamental, constant pillar of brain organization, whichwhen disrupted, could lead to impairments in global brain function.Previous research has shown that network hubs are often foundto be affected in neurological disorders such as schizophrenia andAlzheimer’s disease (45). These disorders are associated with network-wide deficits in brain function (21), which is consistent with our findingthat cognitive systems that produce coherent states also containnetwork hubs.
Conversely, metastable states are preferentially produced by foursystems with more sparse structural connectivity: two systems asso-ciated with cognitive control (cingulo-opercular and frontoparietalsystems) and two systems associated with intricate sensory, object,and language representations (auditory and ventral temporal associa-tion systems). These systems all have functional roles that frequentlyrequire working in seclusion from other specialized processing in thebrain. The three systems that are the most unlikely be synchronizedupon stimulation are also the ones that are most likely to produce ametastable state: the auditory, cingulo-opercular, and frontoparietalsystems. The cingulo-opercular and frontoparietal systems are asso-ciated with cognitive control, and they are proposed as complementarysystems that are specialized for guiding successful task performance atdifferent timescales: the cingulo-opercular system for maintaining task-related goals across trials and the frontoparietal systems for trial-by-trialcontrol (46). These functional roles may often need to occur concur-rently, and their production of metastable states could indicate thatthese systems can work in seclusion without coactivating a large partof the brain, an attribute that facilitates parallel processing.
While our chimera framework revealed stable features of brainarchitecture, it also captured cognitive systems where between-subjectvariability leads to variety in frequency and type of synchronization
Bansal et al., Sci. Adv. 2019;5 : eaau8535 3 April 2019
patterns: cingulo-opercular, frontoparietal, ventral temporal associ-ation, and motor systems. These four systems with low subject ro-bustness are associated with higher cognitive functions where anindividual’s experience and knowledge are likely captured by vari-ability in their structural connectivity (47). Our results demonstratedthat the frontoparietal and cingulo-opercular systems exhibit a verystrong individual variability, and this mirrors recent results thatshowed that cognitive control systems have weaker within-subject var-iability and greater between-subject variability relative to sensory pro-cessing systems (37). Our results also demonstrated that the ventraltemporal association and motor and somatosensory systems show anespecially high number of prevalent patterns with no single dominantpattern, and this may reflect their roles in learning and development-related changes (38).
Beyond the present framework and future directionsOur model is only sensitive to functional relationships that are in-duced through structural connections, so the observed dynamicalstates and patterns are only constrained by the anatomical structureof the network. Here, the emergence of a coherent pattern would im-ply that a region can, in principle, communicatewith all of the spatiallydistributed regionswithin the brain; however, the actual regions that itcommunicates withmay vary between different tasks according to thespecific cognitive demands of the task. Nevertheless, we have recentlyshown that, by quantifying differences in the structurally constrainedpatterns of in silico brain activity resulting from regional stimulation,one can explain individual variability in performance of tasks that dif-fer in cognitive complexity (26).
In reality, neuronal activity patterns that are observed in the brainusing different functionalmeasurement techniques, such as functionalmagnetic resonance imaging (MRI), electroencephalography, magne-toencephalography, and positron emission tomography, are a result of acomplex neurophysiological activity that develops on top of the struc-tural connectivity infrastructure. Thus, the actual patterns of brain ac-tivity that are observed across functional modalities may come from thesimultaneous activation of different brain regions via multiple inputsources and therefore might differ from the patterns observed in ourin silico experiments. However, our computational approach can stillaid in the conception of cognitive hypotheses and experimental design.The framework allows us to evaluate the patterns of activity resultingfrom the activation of a specific cognitive system to understand the va-riety of cognitive roles it could play, and thus, its use extends beyondmaking overall comparisons between the characteristic patterns of syn-chrony across cognitive systems. For example, the dominance of high-synchrony patterns upon stimulation of brain regions within the defaultmode system (Fig. 5E) could indicate its important role in resting-statedynamics and ability to switch communication between brain regionswhen the brain changes state from rest to task performance. In contrast,the emergence of low-synchrony states (Fig. 5E) could indicate the in-volvement of the defaultmode system in specific cognitive control roles.Recent findings have suggested task-related changes in the topographyof the default mode system (48, 49).
Last, the emergence of a metastable state may not reflect the absenceof synchrony in the entire population. A stable synchronization couldpotentially exist within a population substantially smaller than our spa-tial resolution, and future research can investigate effect of scale usingmodels at a finer spatial resolution. Despite these limitations, our ap-proach is sensitive to variability in region-specific and subject-specificbrain connectivity, and it can be used to answer fundamental questions
9 of 14
SC I ENCE ADVANCES | R E S EARCH ART I C L E
httpD
ownloaded from
concerning the cognitive organization of the human brain. Future re-search can extend our in silico experiments to examine chimera statesusing experimental data, providing opportunities to enhance perform-ance in healthy participants or individualize medicine in clinical popu-lations. More generally, this approach provides an opportunity toestablish a connection between the structure of an individual’s brainnetwork and cognitive performance (26).
CONCLUSIONUsing the cognitive system framework (28), our novel chimera-basedapproach reveals specific features (spatial structure and prevalence) ofinteraction patterns among large-scale cognitive systems in the humanbrain. These features provide insight into how structural constraintswithin cognitive systems are linked to patterns of brain activity that re-flect the systems’ ability to perform a variety of cognitive tasks. The spa-tial patterns of partial synchrony within chimera states observed in thisstudy have a natural link to the well-documented role of functional seg-regation and integration of cognitive systems thought to support cog-nition (6), and the approach is capable of extracting robust systemdifferences for those that are largely stable across people and those thatcapture individual training and expertise. Thus, our approach providesa rich opportunity to study how dynamical states give rise to variabilityin cognitive performance, providing the first conceptual framework tounderstand how chimera states may subserve human behavior.
on February 15, 2020
://advances.sciencemag.org/
MATERIALS AND METHODSExperimental designDiffusion MRI analysis was performed on the 30 individual partici-pant scans previously reported elsewhere (50). Twentymale and 10 femaleparticipants were recruited from Pittsburgh and the Army ResearchLaboratory inAberdeen,Maryland. All participants were neurologicallyhealthy, with no history of either head trauma or neurological or psy-chiatric illness. Participant ages ranged from21 to 45 years at the time ofscanning (mean age of 31 years), and four were left-handed (two malesand two females). All participants signed an informed consent approvedby CarnegieMellon University and conforming with the Declaration ofHelsinki and were financially remunerated for their participation.
Macroscopic white matter pathways were imaged using a DSIacquisition sequence on a Siemens Verio 3T MRI system located atthe Scientific Imaging and Brain Research Center at Carnegie MellonUniversity using a 32-channel head coil. A total of 257 directions wassampled using a twice-refocused spin-echo sequence (51 slices; repeti-tion time (TR), 9.916 s; echo time (TE), 157 ms; 2.4 mm by 2.4 mm by2.4 mm voxels; 231 mm by 231 mm field of view (FoV); maximumb-value 5000 s/mm2). Diffusion datawere reconstructed using q-spacediffeomorphic reconstruction (51) with a diffusion sampling lengthratio of 1.25 and an output resolution of 2 mm.
Construction of individual structural brain networksWhole-brain structural connectivity matrices were constructed foreach individual (subject) using a bootstrapping approach. To minimizethe impact of bias in the tractography parameter scheme on streamlinegeneration, whole-brain fiber tractography (52) was performed 100 timesfor each participant, generating 250,000 streamlines per iteration. Acrossthe 100 iterations, values were randomly sampled for quantitative an-isotropy based fiber termination thresholds (0.01 to 0.10), turning anglethresholds (40 to 80), and smoothing (50 to 80%), while constant valueswere used for step size (1 mm) and minimum/maximum fiber length
Bansal et al., Sci. Adv. 2019;5 : eaau8535 3 April 2019
thresholds (10 mm/400 mm). On each iteration, a binary connectivitymatrix was generated, where an edge between two regions of interestwas considered present if 5% or more of streamlines generated werefound to connect them. The probability of observing a connectionwas estimated by calculating the frequency of detecting an edge acrossall 100 iterations. The regions of interest were determined using corticalcomponents of the Desikan-Killiany atlas and subcortical componentsof the Harvard-Oxford subcortical atlas. In the resulting weightedmatrices, connection strengths were normalized by the sum of the re-gional brain volumes, and these normalized matrices were used asthe structural representations of individual brains. All analyses wereperformed using DSI Studio (http://dsi-studio.labsolver.org/) andMATLAB (MathWorks Inc., Natick, MA, USA).
Data-driven network model of brain dynamicsIn our data-driven network model, regional brain dynamics were givenby WCOs (26, 27, 29). In this biologically motivated neural massmodel, the fraction of excitatory and inhibitory neurons active at timet in the ith brain region are denoted by Ei(t) and Ii(t), respectively, andtheir temporal dynamics are given by
tdEidt
¼ �EiðtÞ þ ðSEm � EiðtÞÞ �
SE c1EiðtÞ � c2IiðtÞ þ c5∑jAijEjðt � tijdÞ þ PiðtÞ
� �þ swiðtÞ ð1Þ
tdIidt
¼ �IiðtÞ þ ðSIm � IiðtÞÞ �
SI c3EiðtÞ � c4IiðtÞ þ c6∑jAijIjðt � tijdÞ
� �þ sviðtÞ ð2Þ
where
SE;IðxÞ ¼ 1
1þ e�aE;Iðx�qE;IÞ �1
1þ eaE;IqE;Ið3Þ
Aij is an element of the subject-specific coupling matrix A whosevalue is the connection strength between brain regions i and j asdetermined from DSI, as described above. The global strength of cou-pling between brain regions was tuned by excitatory and inhibitorycoupling parameters c5 and c6, respectively. In this case, c6 = c5/4.Pi(t) represents the external stimulation to excitatory-state activityand was used to perform computational stimulation experiments.The parameter tijd represents the communication delay between re-gions i and j. If the spatial distance between regions i and j is dij, thentijd = dij/td, where td = 10 m/s is the signal transmission velocity. Weadded noise as an input to the system through the parameters wi(t)and vi(t), which were derived from a normal distribution with s =0.00005. Other constants in the model were biologically derived: c1 =16, c2 = 12, c3 = 15, c4 = 3, aE = 1.3, aI = 2, qE = 4, qI = 3.7, and t = 8,as described in (26, 27, 29). To numerically simulate the dynamics ofthe system, we used a stochastic Euler-Maruyama method with stepsize of 0.01 ms with initial conditions [Ei(0), Ii(0) = 0.1, 0.1].
Targeted stimulationThe model was optimized for each individual to allow a regime ofmaximum dynamical sensitivity. This was performed by choosing a
10 of 14
SC I ENCE ADVANCES | R E S EARCH ART I C L E
on February 15, 2020
http://advances.sciencemag.org/
Dow
nloaded from
global coupling parameter, c5, such that the system was just below thecritical transition point to the excited state (see fig. S1). Regional stim-ulationwas achieved by applying a constant external input Pi = 1.15 toa single region and perturbing its dynamics (fig. S1). As the dynamicsevolve, the stimulation spreads within the brain through the networkconnectivity of the stimulated node.
Cognitive systemsWe assigned each brain region to one of nine cognitive systems: atten-tion, auditory, cingulo-opercular, frontoparietal, medial default mode,motor and somatosensory, subcortical, ventral temporal association,and visual. This node assignment is described in table S1 and is similarto the one used by Muldoon et al. (27). The distribution of brain re-gions within cognitive systems is shown in fig. S2.
Calculation of synchronization within cognitivelyinformed frameworkWeused the standardorderparameterr to estimate the extent of synchro-nization after a targeted regional stimulation within the brain networks.Thismeasurewas proposed byKuramoto for the estimationof coherencein a population of Kuramoto phase oscillators (33). In this case, the in-stantaneous order parameter at a given time t was defined as
rNðtÞeiFðtÞ ¼1N∑N
j¼1eifjðtÞ ð4Þ
where fj is the phase of the jth oscillator at time t and is given by
fjðtÞ ¼ tan�1 IjðtÞEjðtÞ ð5Þ
Here, N = 76 is the number of oscillators in the system. To estimatethe global synchronization in the system, one needs to average the instan-taneous order parameter for a sufficiently long period of time (T).
rN ¼< rNðtÞ>T ð6Þ
We used 1 s of simulated activity to estimate the average orderparameter.Within our cognitively informed framework, wemeasuredthe synchronization between all pairs of cognitive systems followinga regional stimulation. This was performed by calculating an orderparameter for the combined oscillator population of a pair of cogni-tive systems. For cognitive systems si and sj, this order parameter isgiven by
rsi;sj ¼< rsi;sjðtÞ>T ð7Þ
where
rsi;sjðtÞeiQðtÞ ¼1
Nsi þ Nsj∑
k∈ðsi∪sjÞeifkðtÞ ð8Þ
Here,Nsi andNsj represent the number of oscillators (brain regionsor nodes) within cognitive systems si and sj, respectively. This anal-ysis resulted in synchronization matrices, as shown in Fig. 2A, whoseentries represent the extent of synchronization between cognitive
Bansal et al., Sci. Adv. 2019;5 : eaau8535 3 April 2019
systems. These matrices were used to identify the dynamical cogni-tive state that emerged as a result of regional stimulation.
Chimera index and metastability indexWe calculated the chimera index, C, and metastability index, l, asdescribed in (24, 34). C is a measure of the normalized average vari-ation in the order parameter within cognitive systems averaged overtime. For si ∈ [s1, s2, …, sM] (M = 9 is the total number of systems)
C ¼ < schðtÞ>T
CMaxð9Þ
where
schðtÞ ¼ 1M � 1
∑M
i¼1ðrsiðtÞ � < rsðtÞ>MÞ2 ð10Þ
In this case, CMax = 5/36 is a normalization factor and representsthe maximum value of variability in the order parameter in an idealchimera state where the network organizes such that the half of itspopulation is completely synchronized and half is completely desyn-chronized (34). The instantaneous quantity <rs(t)>M measures thesynchronization of cognitive systems, averaged over all systems at agiven time t.
Similarly, l measures the normalized temporal variation of theorder parameter averaged across all cognitive systems
l ¼ < smetðsÞ>M
lMaxð11Þ
where
smetðsÞ ¼ 1T � 1
∑t≤TðrsiðtÞ � < rsi>TÞ2 ð12Þ
Here, lMax = 1/12 is a normalization factor (34), representingthe scenario where the system spends equal time in all stages ofsynchronization.
Extraction of the patterns of synchronizationTo identify emergent cognitive patterns, we first obtained a binarizedsynchronization matrix (m) such thatmij = 1 if systems i and j are iden-tified as synchronized and mij = 0 otherwise. We defined two cognitivesystems si and sj to be synchronized if rsi,sj ≥ rTh, where rTh representsa synchronization threshold. For the results discussed throughout themain text, we used rTh = 0.8 (33) (as indicated in Fig. 2A).
In principle, one can directly use these binarized synchronizationmatrices to classify the emergent states and patterns. However, we per-formed community detection on these binarizedmatrices. This methodclusters the group of synchronized systems into a single community,whereas desynchronized systems remain as separate communities. Incase of a coherent state, we observed only one community, and in caseof a metastable state, we observed nine separate communities, each re-presenting a cognitive system. For chimera states, communities withdifferent distributions of cognitive systems emerged. Thus, applyingthe community detection algorithm not only allowed us to robustly
11 of 14
SC I ENCE ADVANCES | R E S EARCH ART I C L E
on February 15, 2020
http://advances.sciencemag.org/
Dow
nloaded from
classify the emergent dynamical states but also let us separate variousspatially distributed patterns of chimera states. Community detectionwas performed using modularity maximization through thegeneralized Louvain algorithm (53). For community detection, thevalue of the resolution parameter was varied between 0.8 and 0.95,and a consensus was run to determine the community structure (54).
Network connectivity featuresWeighted degree and rankingThe weighted degree (Wi) of a brain region or node i is defined as∑j Aij, and the distribution of weighted degrees typically varies acrosssubjects. Therefore, to be able to compare weighted degrees acrosssubjects, we ranked each node within a subject such that the highervalue of the node rank signifies the higher value of its weighted de-gree. Similar rankings were obtained for each node for the amount ofglobal synchrony and chimera index it produced upon stimulation.Rich club analysisA set of core nodes was defined such that the brain network can bepartitioned into two separate groupswith one group consisting of highlyconnected hubs (core) and the other group composed of peripheralnodeswith low intragroup connectivity.We used the BrainConnectivityToolbox (55) to obtain a set of core nodes for each subject (brainnetwork). To define a set of core regions, we used a range of thresholds(0.5 to 1.5; a lower value of this threshold allows a higher number ofnodes to be classified as the core). We then identified the regions thatwere assigned to the core across the entire range of thresholds, andthese nodes where chosen to form the core of given subject. Then,we obtained the average shortest path length to the core for each brainregion i, within each subject using the following steps: (i) calculatingthe average of the shortest path lengths between node i and the groupof core nodes (Dsub
i ¼< Dsubij >j; j ∈ Core) and (ii) normalizingDsub
i bymaximum of Dsub
i in a subject. The shortest path length between twonodes was calculated with the Brain Connectivity Toolbox (55), and itrepresents the smallest path through network edges that connectsthose nodes.
Randomizing brain network partitioningTo assess the importance of a cognitively informed framework, weobtained the patterns of synchronization when the brain was ran-domly partitioned into nine different groups (systems). To obtain arandom partition of the brain, we fixed the number of regions in eachgroup to match their sizes with the original cognitively informedpartitioning (systems 1 to 9 were 4, 4, 12, 10, 8, 6, 14, 10, and 8 regionsper system, respectively) and then randomly assigned brain regionsto each of these groups. We then used the previously simulated brainactivity for each subject to calculate the system-level Kuramoto pa-rameter, system-level synchronization matrices, and the patterns ofsynchrony (as described above) based on the new random parti-tioning of the brain. In the first randomization experiment, a singlerandom partition was created and applied across all 30 subjects toextract the prevalent patterns (those that occur with a frequency of≥3%) for each group. In the second randomization experiment, 10 dif-ferent random partitions were created, and each partition was appliedacross all 30 subjects to extract the prevalent patterns from this largerensemble.
Pattern robustnessA pattern in our analysis describes whether the given cognitive systemfalls into the synchronized population or remains desynchronized
Bansal et al., Sci. Adv. 2019;5 : eaau8535 3 April 2019
(Fig. 5). To calculate similarity between patterns, we defined the ro-bustness of a set of observed patterns as follows
R ¼ 1pðp� 1Þ∑
pi;j¼1
1M∑M
s¼1dsi;j
� �ð13Þ
where p is the number of patterns in the set. dsi;j ¼ 1 if the cognitivesystem, s, falls into the same state of either synchrony or desynchronyin patterns i and j, and dsi;j ¼ 0 otherwise.
We calculated the robustness of cognitive systems in two dimensions:across individuals for a given brain region within the system (subjectrobustness) and across regions of the system in a given subject (regionrobustness). For subject robustness of a given cognitive system, p con-stitutes the patterns that are produced by a given node for all thesubjects and equals the number of subjects, i.e., 30. For region robust-ness of a given cognitive system, p constitutes the patterns that all thenodes for a given cognitive system produce for a given subject, and thevalue of p varies between systems. Thus, for each cognitive system, weobtained two distributions of robustness, one for each subject andregion.
Clustering of cognitive systems using robustness featuresIn the subject-region robustness parameter space, we grouped cogni-tive systems into clusters using the k-means algorithm and silhouetteanalysis. We used k = 3, 4, 5, and 6 and identified the stable clusteringthat maximizes similarity within clusters and dissimilarity across clus-ters. One can obtain different clusterings of data based on the k value(number of clusters), and the silhouette value assesses the quality ofthe clustering. A value close to 1 signifies optimal clustering, meaningthat the data points are more distant (defined by the Euclidean dis-tance) from other clusters as compared to their own cluster, while anegative value signifies the opposite. Thus, if ai denotes the averagedistance of a data point i from the data points in its own cluster andbi denotes the average distance from the data points in other clusters,then the silhouette value is given by Si = (bi − ai)/max(ai, bi). For k = 4,we observed an optimized clustering. The corresponding silhouette plotis shown in fig. S9.
Rendering of brain imagesBrainNet Viewer was used to perform spatial mapping onto brainimages (56).
Statistical analysisAll correlations in the manuscript were computed using the stan-dard Pearson’s correlation and deemed significant if P < 0.05.
SUPPLEMENTARY MATERIALSSupplementary material for this article is available at http://advances.sciencemag.org/cgi/content/full/5/4/eaau8535/DC1Fig. S1. Optimizing personalized BNMs and applying targeted regional stimulation.Fig. S2. Distribution of brain volume within cognitive systems.Fig. S3. Metastable state and metastability index.Fig. S4. Relation between connectivity, position, and emergent cognitive state.Fig. S5. Effect of changing synchronization threshold on the distribution of states.Fig. S6. Likelihood of the emergence of dynamical states across cognitive systems.Fig. S7. Patterns of synchrony for randomly partitioned brain networks.Fig. S8. Normalized contribution of brain regions to the prevalent patterns of synchronization.Fig. S9. Clustering of cognitive systems using pattern robustness.Table S1. Assignment of brain regions to cognitive systems.
12 of 14
SC I ENCE ADVANCES | R E S EARCH ART I C L E
on February 15, 2020
http://advances.sciencemag.org/
Dow
nloaded from
REFERENCES AND NOTES1. A. Pikovsky, M. Rosenblum, J. Kurths, Synchronization: A Universal Concept in Nonlinear
Sciences (Cambridge Univ. Press, 2001).2. M. A. Bertolero, B. T. T. Yeo, M. D’Esposito, The modular and integrative
functional architecture of the human brain. Proc. Natl. Acad. Sci. U.S.A. 112,E6798–E6807 (2015).
3. L. M. Pecora, F. Sorrentino, A. M. Hagerstrom, T. E. Murphy, R. Roy, Cluster synchronizationand isolated desynchronization in complex networks with symmetries. Nat. Commun. 5,4079 (2014).
4. D. S. Bassett, O. Sporns, Network neuroscience. Nat. Neurosci. 20, 353–364 (2017).5. J. M. Shine, P. G. Bissett, P. T. Bell, O. Koyejo, J. H. Balsters, K. J. Gorgolewski, C. A. Moodie,
R. A. Poldrack, The dynamics of functional brain networks: Integrated network statesduring cognitive task performance. Neuron 92, 544–554 (2016).
6. G. Deco, G. Tononi, M. Boly, M. L. Kringelbach, Rethinking segregation andintegration: Contributions of whole-brain modelling. Nat. Rev. Neurosci. 16, 430–439(2015).
7. M. J. Panaggio, D. M. Abrams, Chimera states: Coexistence of coherence and incoherencein networks of coupled oscillators. Nonlinearity 28, R67–R87 (2015).
8. O. E. Omel’chenko, Y. L. Maistrenko, P. A. Tass, Chimera states: The natural link betweencoherence and incoherence. Phys. Rev. Lett. 100, 044105 (2008).
9. Y. Kuramoto, D. Battogtokh, Coexistence of coherence and incoherence innonlocally coupled phase oscillators. Nonlinear Phenom. Complex Syst. 5, 380–385(2002).
10. D. M. Abrams, S. H. Strogatz, Chimera states for coupled oscillators. Phys. Rev. Lett. 93,174102 (2004).
11. M. R. Tinsley, S. Nkomo, K. Showalter, Chimera and phase-cluster states in populations ofcoupled chemical oscillators. Nat. Phys. 8, 662–665 (2012).
12. A. M. Hagerstrom, T. E. Murphy, R. Roy, P. Hövel, I. Omelchenko, E. Schöll,Experimental observation of chimeras in coupled-map lattices. Nat. Phys. 8, 658–661(2012).
13. J. D. Hart, K. Bansal, T. E. Murphy, R. Roy, Experimental observation of chimera and clusterstates in a minimal globally coupled network. Chaos 26, 094801 (2016).
14. C. R. Laing, Chimeras in networks with purely local coupling. Phys. Rev. E 92, 050904(2015).
15. G. C. Sethia, A. Sen, Chimera states: The existence criteria revisited. Phys. Rev. Lett. 112,144101 (2014).
16. S. A. M. Loos, J. C. Claussen, E. Schöll, A. Zakharova, Chimera patterns under the impact ofnoise. Phys. Rev. E 93, 012209 (2016).
17. C. R. Laing, Chimera states in heterogeneous networks. Chaos 19, 013113 (2009).18. I. Omelchenko, O. E. Omel’chenko, P. Hövel, E. Schöll, When nonlocal coupling between
oscillators becomes stronger: Patched synchrony or multichimera states. Phys. Rev. Lett.110, 224101 (2013).
19. J. Xie, E. Knobloch, H.-C. Kao, Multicluster and traveling chimera states in nonlocalphase-coupled oscillators. Phys. Rev. E 90, 022919 (2014).
20. A. Zakharova, M. Kapeller, E. Schöll, Chimera death: Symmetry breaking in dynamicalnetworks. Phys. Rev. Lett. 112, 154101 (2014).
21. V. Menon, Large-scale brain networks and psychopathology: A unifying triple networkmodel. Trends Cogn. Sci. 15, 483–506 (2011).
22. R. G. Andrzejak, C. Rummel, F. Mormann, K. Schindler, All together now: Analogiesbetween chimera state collapses and epileptic seizures. Sci. Rep. 6, 23000 (2016).
23. B. K. Bera, D. Ghosh, M. Lakshmanan, Chimera states in bursting neurons. Phys. Rev. E 93,012205 (2016).
24. J. Hizanidis, N. E. Kouvaris, G. Zamora-López, A. Díaz-Guilera, C. G. Antonopoulos,Chimera-like states in modular neural networks. Sci. Rep. 6, 19845 (2016).
25. M. S. Santos, J. D. Szezech, F. S. Borges, K. C. Iarosz, I. L. Caldas, A. M. Batista, R. L. Viana,J. Kurths, Chimera-like states in a neuronal network model of the cat brain.Chaos, Solitons Fractals 101, 86–91 (2017).
26. K. Bansal, J. D. Medaglia, D. S. Bassett, J. M. Vettel, S. F. Muldoon, Data-driven brainnetwork models differentiate variability across language tasks. PLOS Comput. Biol. 14,e1006487 (2018).
27. S. F. Muldoon, F. Pasqualetti, S. Gu, M. Cieslak, S. T. Grafton, J. M. Vettel, D. S. Bassett,Stimulation-based control of dynamic brain networks. PLOS Comput. Biol. 12, e1005076(2016).
28. J. D. Power, A. L. Cohen, S. M. Nelson, G. S. Wig, K. A. Barnes, J. A. Church, A. C. Vogel,T. O. Laumann, F. M. Miezin, B. L. Schlaggar, S. E. Petersen, Functional networkorganization of the human brain. Neuron 72, 665–678 (2011).
29. H. R. Wilson, J. D. Cowan, Excitatory and inhibitory interactions in localized populations ofmodel neurons. Biophys. J. 12, 1–24 (1972).
30. K. Bansal, J. Nakuci, S. F. Muldoon, Personalized brain network models for assessingstructure–function relationships. Curr. Opin. Neurobiol. 52, 42–47 (2018).
31. L. L. Gollo, J. A. Roberts, L. Cocchi, Mapping how local perturbations influence systems-level brain dynamics. Neuroimage 160, 97–112 (2017).
Bansal et al., Sci. Adv. 2019;5 : eaau8535 3 April 2019
32. A. Spiegler, E. C. A. Hansen, C. Bernard, A. R. McIntosh, V. K. Jirsa, eNeuro, in press,doi:10.1523/ENEURO.0068-16.2016.
33. Y. Kuramoto, Self-entrainment of a population of coupled non-linear oscillators, inInternational Symposium on Mathematical Problems in Theoretical Physics, H. Araki, Ed.(Springer, 1975), vol. 39, pp. 420–422.
34. M. Shanahan, Metastable chimera states in community-structured oscillator networks.Chaos 20, 013108 (2010).
35. M. P. van den Heuvel, O. Sporns, Rich-club organization of the human connectome.J. Neurosci. 31, 15775–15786 (2011).
36. D. L. Sheinberg, N. K. Logothetis, Noticing familiar objects in real world scenes: The role oftemporal cortical neurons in natural vision. J. Neurosci. 21, 1340–1350 (2001).
37. C. Gratton, T. O. Laumann, A. N. Nielsen, D. J. Greene, E. M. Gordon, A. W. Gilmore,S. M. Nelson, R. S. Coalson, A. Z. Snyder, B. L. Schlaggar, N. U. F. Dosenbach, S. E. Petersen,Functional brain networks are dominated by stable group and individual factors, notcognitive or daily variation. Neuron 98, 439–452.e5 (2018).
38. J. Scholz, M. C. Klein, T. E. J. Behrens, H. Johansen-Berg, Training induces changes inwhite-matter architecture. Nat. Neurosci. 12, 1370–1371 (2009).
39. D. S. Margulies, J. L. Vincent, C. Kelly, G. Lohmann, L. Q. Uddin, B. B. Biswal, A. Villringer,F. X. Castellanos, M. P. Milham, M. Petrides, Precuneus shares intrinsic functional architecturein humans and monkeys. Proc. Natl. Acad. Sci. U.S.A. 106, 20069–20074 (2009).
40. C. F. Stevens, An evolutionary scaling law for the primate visual system and its basis incortical function. Nature 411, 193–195 (2001).
41. A. P. Alivisatos, M. Chun, G. M. Church, R. J. Greenspan, M. L. Roukes, R. Yuste, The brainactivity map project and the challenge of functional connectomics. Neuron 74, 970–974(2012).
42. S. M. Smith, P. T. Fox, K. L. Miller, D. C. Glahn, P. M. Fox, C. E. Mackay, N. Filippini,K. E. Watkins, R. Toro, A. R. Laird, C. F. Beckmann, Correspondence of the brain’s functionalarchitecture during activation and rest. Proc. Natl. Acad. Sci. U.S.A. 106, 13040–13045(2009).
43. R. Liégeois, E. Ziegler, C. Phillips, P. Geurts, F. Gómez, M. A. Bahri, B. T. Yeo, A. Soddu,A. Vanhaudenhuyse, S. Laureys, R. Sepulchre, Cerebral functional connectivity periodically(de)synchronizes with anatomical constraints. Brain Struct. Funct. 221, 2985–2997 (2016).
44. J. M. Shine, M. J. Aburn, M. Breakspear, R. A. Poldrack, The modulation of neural gainfacilitates a transition between functional segregation and integration in the brain.eLife 7, e31130 (2018).
45. N. A. Crossley, A. Mechelli, J. Scott, F. Carletti, P. T. Fox, P. Mcguire, E. T. Bullmore, The hubsof the human connectome are generally implicated in the anatomy of brain disorders.Brain 137, 2382–2395 (2014).
46. L. Cocchi, A. Zalesky, A. Fornito, J. B. Mattingley, Dynamic cooperation and competitionbetween brain systems during cognitive control. Trends Cogn. Sci. 17, 493–501 (2013).
47. M. A. Powell, J. O. Garcia, F.-C. Yeh, J. M. Vettel, T. Verstynen, Local connectomephenotypes predict social, health, and cognitive factors. Netw. Neurosci. 2, 86–105 (2018).
48. D. Vatansever, D. K. Menon, A. E. Manktelow, B. J. Sahakian, E. A. Stamatakis, Defaultmode network connectivity during task execution. Neuroimage 122, 96–104 (2015).
49. D. Vatansever, D. K. Menon, E. A. Stamatakis, Default mode contributions to automatedinformation processing. Proc. Natl. Acad. Sci. U.S.A. 114, 12821–12826 (2017).
50. T. D. Verstynen, The organization and dynamics of corticostriatal pathways link themedial orbitofrontal cortex to future behavioral responses. J. Neurophysiol. 112,2457–2469 (2014).
51. F. C. Yeh, W. Y. I. Tseng, NTU-90: A high angular resolution brain atlas constructed byq-space diffeomorphic reconstruction. Neuroimage 58, 91–99 (2011).
52. F. C. Yeh, T. D. Verstynen, Y. Wang, J. C. Fernández-Miranda, W. Y. I. Tseng, Deterministicdiffusion fiber tracking improved by quantitative anisotropy. PLOS ONE 8, e80713 (2013).
53. G. S. Jeub, Lucas, M. Bazzi, I. S. Jutla, P. J. M. Mucha, A generalized Louvain method forcommunity detection implemented in MATLAB; http://netwiki.amath.unc.edu/GenLouvain).
54. D. S. Bassett, M. A. Porter, N. F. Wymbs, S. T. Grafton, J. M. Carlson, P. J. Mucha, Robustdetection of dynamic community structure in networks. Chaos 23, 013142 (2013).
55. M. Rubinov, O. Sporns, Complex network measures of brain connectivity: Uses andinterpretations. Neuroimage 52, 1059–1069 (2010).
56. M. Xia, J. Wang, Y. He, BrainNet Viewer: A network visualization tool for human brainconnectomics. PLOS ONE 8, e68910 (2013).
Acknowledgments: We acknowledge G. Lieberman for the preprocessing of the brainanatomical connectivity data and R. Roy and J. D. Hart for a useful discussion on chimerastates. Funding: This work is supported by the Army Research Laboratory through contractnos. W911NF-10-2-0022 and W911NF-17-2-0158 from the U.S. Army Research Office. The viewsand conclusions contained in this document are those of the authors and should not beinterpreted as representing the official policies, either expressed or implied, of the ArmyResearch Laboratory or the U.S. government. The U.S. government is authorized to reproduceand distribute reprints for government purposes notwithstanding any copyright notationherein. Author contributions: K.B. conceived the idea. K.B., J.M.V., and S.F.M. designed the
13 of 14

SC I ENCE ADVANCES | R E S EARCH ART I C L E
research. T.V. and J.M.V. collected the data. S.F.M. developed the BNM. K.B. implemented themodel and led the analysis. All authors contributed analysis ideas and wrote the paper.Competing interests: The authors declare that they have no competing interests.Data and materials availability: All data needed to evaluate the conclusions in the paperare present in the paper and/or the Supplementary Materials. Additional data related to thispaper may be requested from the authors. Data are also publicly available on Zenodo(doi:10.5281/zenodo.2590868; https://zenodo.org/record/2590869).
Bansal et al., Sci. Adv. 2019;5 : eaau8535 3 April 2019
Submitted 20 July 2018Accepted 13 February 2019Published 3 April 201910.1126/sciadv.aau8535
Citation: K. Bansal, J. O. Garcia, S. H. Tompson, T. Verstynen, J. M. Vettel, S. F. Muldoon,Cognitive chimera states in human brain networks. Sci. Adv. 5, eaau8535 (2019).
14 of 14
on February 15, 2020
http://advances.sciencemag.org/
Dow
nloaded from
Cognitive chimera states in human brain networksKanika Bansal, Javier O. Garcia, Steven H. Tompson, Timothy Verstynen, Jean M. Vettel and Sarah F. Muldoon
DOI: 10.1126/sciadv.aau8535 (4), eaau8535.5Sci Adv
ARTICLE TOOLS http://advances.sciencemag.org/content/5/4/eaau8535
MATERIALSSUPPLEMENTARY http://advances.sciencemag.org/content/suppl/2019/04/01/5.4.eaau8535.DC1
REFERENCES
http://advances.sciencemag.org/content/5/4/eaau8535#BIBLThis article cites 52 articles, 6 of which you can access for free
PERMISSIONS http://www.sciencemag.org/help/reprints-and-permissions
Terms of ServiceUse of this article is subject to the
is a registered trademark of AAAS.Science AdvancesYork Avenue NW, Washington, DC 20005. The title (ISSN 2375-2548) is published by the American Association for the Advancement of Science, 1200 NewScience Advances
License 4.0 (CC BY-NC).Science. No claim to original U.S. Government Works. Distributed under a Creative Commons Attribution NonCommercial Copyright © 2019 The Authors, some rights reserved; exclusive licensee American Association for the Advancement of
on February 15, 2020
http://advances.sciencemag.org/
Dow
nloaded from