Embed Size (px)
Citation preview
COGNITIVE ANALYSIS OF STUDENTS’ LEARNING OF TRIGONOMETRY
IN DYNAMIC GEOMETRY ENVIRONMENT:
A TEACHING EXPERIMENT
A THESIS SUBMITTED TO
THE GRADUATE SCHOOL OF NATURAL AND APPLIED SCIENCES
OF
MIDDLE EAST TECHNICAL UNIVERSITY
BY
ZÜLAL ŞAHİN
IN PARTIAL FULFILLMENT OF THE REQUIREMENTS
FOR
THE DEGREE OF DOCTOR OF PHILOSOPHY
IN
SECONDARY SCIENCE AND MATHEMATICS EDUCATION
OCTOBER 2015

Approval of the thesis:
COGNITIVE ANALYSIS OF STUDENTS’ LEARNING OF TRIGONOMETRY
IN DYNAMIC GEOMETRY ENVIRONMENT:
A TEACHING EXPERIMENT
submitted by ZÜLAL ŞAHİN in partial fulfillment of the requirements for the
degree of Doctor of Philosophy in Secondary Science and Mathematics
Education Department, Middle East Technical University by,
Prof. Dr. Gülbin Dural Ünver __________
Dean, Graduate School of Natural and Applied Sciences
Prof. Dr. Ömer Geban __________
Head of Department, Secondary Science and Mathematics Education
Assoc. Prof. Dr. Ayhan Kürşat Erbaş __________
Supervisor, Secondary Science and Mathematics Edu. Dept. METU
Examining Committee Members:
Prof. Dr. Ziya Argün __________________
Secondary Science and Mathematics Edu. Dept., Gazi Uni.
Assoc. Prof. Dr. Ayhan Kürşat Erbaş __________________
Secondary Science and Mathematics Edu. Dept., METU
Prof. Dr. Ahmet Arıkan __________________
Secondary Science and Mathematics Edu. Dept., Gazi Uni.
Prof. Dr. Erdinç Çakıroğlu __________________
Elementary Mathematics Edu. Dept., METU
Assoc. Prof. Dr. Bülent Çetinkaya __________________
Secondary Science and Mathematics Edu. Dept., METU
Date: October 14, 2015

iv
I hereby declare that all information in this document has been obtained and
presented in accordance with academic rules and ethical conduct. I also declare
that, as required by these rules and conduct, I have fully cited and referenced all
material and results that are not original to this work.
Name, Last name : Zülal Şahin
Signature :

v
ABSTRACT
COGNITIVE ANALYSIS OF STUDENTS’ LEARNING OF TRIGONOMETRY
IN DYNAMIC GEOMETRY ENVIRONMENT:
A TEACHING EXPERIMENT
Şahin, Zülal
Ph.D., Department of Secondary Science and Mathematics Education
Supervisor: Assoc. Prof. Dr. Ayhan Kürşat Erbaş
October 2015, 483 pages
Trigonometry is a part of mathematics in which algebra and geometry
converge. Dealing with trigonometric functions at secondary level is known as a
difficult task because it requires to work with right triangles, the unit circle, and graphs
of trigonometric functions simultaneously. For most students, this means excessive
amount of formulas unless they can establish connections among different
representational systems. There is a consensus in the literature that appropriate use of
technology can be effective in helping students make such connections. Dynamic
geometry environments can be a useful tool in teaching trigonometry due to their
opportunities that enable to construct mathematical objects within different
representational systems in a dynamically-and-linked way.
The overarching purpose of this study was to design an instruction in dynamic
geometry environment in order to support secondary students’ concept images on core
trigonometric functions, i.e., sine and cosine, in different representations (i.e.,
symbolic, circular, and graphic). The instructional sequence was designed initially
through inspiring from research literature on trigonometry, historical development of
trigonometry, our exploratory teaching experience, and initial interview results. And
vi
then, design of the instruction was continued through revising as a result of the on-
going prospective and retrospective cognitive analysis of the data that were collected
during the 17-week teaching experiment from two pairs of secondary students
separately.
Students were encouraged to reason about dynamically-linked transformations
of the core trigonometric functions within and between representational registers, as
well as reasoning about dynamically-changed visual components referring to the core
trigonometric functions. When compared with their initial serious recognition and
discrimination troubles, as the study progressed, significant improvements were
observed in students’ recognition and discrimination abilities within and between
different representational registers. The cognitive analysis of the data revealed the
importance of students’ constructions of well-defined concept definition images on
foundational trigonometric concepts (i.e., angle, angle measure, trigonometric value,
trigonometric functions, and periodicity) in order to recognize the same trigonometric
object within different representational registers. The importance of the basic visual
features’ discrimination in comprehension of trigonometry was also revealed in this
study. When the basic visual features referring to trigonometric functions (i.e., radius
of the circle, position of the center, position of the reference point on the circle
referring to trigonometric value) were systematically varied in the (unit) circle
register, and their dynamic-and-linked oppositions in the graphical register were
constructed, the students developed significant understandings that enabled them to
discriminate the basic form of sine and cosine functions from their general forms.
Finally, the findings of the study revealed that the discrimination ability required to be
reasoning about the new situations emerging as a consequence of the changed-visual
features through focusing on trigonometrically relevant objects (e.g., reference
point(s), reference right triangle, radius, displacement amount and direction) rather
than detailed processes (e.g., ordinate of a point, procedural definition of sine or
cosine).
Keywords: Mathematics education, angles, trigonometric functions, period,
recognition, discrimination, representation, representation transformations

vii
ÖZ
DİNAMİK GEOMETRİ ORTAMINDA
ÖĞRENCİLERİN TRİGONOMETRİ ÖĞRENMELERİNİN BİLİŞSEL ANALİZİ:
BİR ÖĞRETİM DENEYİ
Şahin, Zülal
Doktora, Orta Öğretim Fen ve Matematik Alanları Eğitimi Bölümü
Tez yöneticisi: Doç. Dr. Ayhan Kürşat Erbaş
Ekim 2015, 483 sayfa
Trigonometri matematiğin cebir ve geometriyi birleştiren bir alt alanıdır.
Ortaöğretim düzeyinde trigonometrik fonksiyonlarla ilgilenmek dik üçgenler, birim
çember ve trigonometrik fonksiyonların grafikleri gibi farklı gösterimlerle eş zamanlı
çalışmayı gerektirdiği için zor bir konu olarak bilinir. Bu farklı gösterimler arasındaki
bağlantıları kuramadıkça, pek çok öğrenci için trigonometri ezberlenmesi gereken aşırı
miktardaki formüller anlamına gelir. Literatürde teknolojinin uygun kullanımının
öğrencilerin bu bağlantıları kurmasında etkili olabileceğine dair ortak görüş vardır.
Dinamik geometri ortamları, matematiksel nesneleri dinamik-ve-bağlantılı olarak
farklı gösterimsel sistemler içinde yapılandırmayı kolaylaştıran imkanları nedeniyle
trigonometri öğretiminde faydalı bir araç olabilir.
Bu çalışmanın temel amacı, ortaöğretim öğrencilerinin temel trigonometrik
fonksiyonlar (sinüs ve kosinüs) üzerine kavram görüntülerini zenginleştirmek için
dinamik geometri ortamında bir eğitim tasarlamaktı. Eğitimsel sıralanış başlangıçta,
trigonometri araştırma literatürü, trigonometrinin tarihsel gelişimi, keşif amaçlı
öğretim tecrübemiz ve ilk görüşme sonuçlarından ilham alınarak tasarlandı. Daha
viii
sonra, eğitim tasarımı, 17-haftalık öğretim deneyi boyunca, iki çift ortaöğretim
öğrencisinden ayrı ayrı toplanan verilerin, sürekli devam eden geleceğe ve geçmişe
dönük bilişsel analiz sonuçlarına göre gözden geçirilerek düzenlenmesiyle devam etti.
Öğrenciler, gösterimsel kayıtlar içinde ve arasında, temel trigonometrik
fonksiyonların dinamik-ve-bağlantılı dönüşümleri, ve bunun yanı sıra, temel
trigonometrik fonksiyonlara işaret eden dinamik olarak değişen görsel bileşenler
üzerine muhakeme etmeye cesaretlendirildi. Başlangıçtaki ciddi fark etme ve ayırt
etme sorunları ile karşılaştırıldığında, çalışma ilerledikçe, öğrencilerin fark etme ve
ayırt etme becerilerinde önemli gelişmeler gözlemlendi. Verilerin bilişsel analizi,
temel trigonometrik kavramlar üzerine (açı, açı ölçüsü, trigonometrik değer,
trigonometrik fonksiyonlar ve periyodiklik) öğrencilerin iyi-tanımlı kavram tanım
görüntüleri yapılandırmalarının, farklı gösterimsel kayıtlar içinde temsil edilen aynı
trigonometrik nesneyi fark etmedeki önemini ortaya çıkardı. Ayrıca, bu çalışmada,
trigonometriyi kavramada, temel görsel özelliklerin önemi ortaya çıktı. Trigonometrik
fonksiyonlara işaret eden temel görsel özellikler (çemberin yarıçapı, merkezin
konumu, çember üzerindeki trigonometrik değere işaret eden referans noktanın
konumu) (birim) çember kayıdında sistematik olarak değiştirildiğinde, ve bunların
dinamik-ve-bağlantılı karşılıkları grafik kayıtta oluşturulduğunda, öğrenciler sinüs ve
kosinüs fonksiyonlarının basit fromlarını genel formlarından ayırt etmelerine imkan
veren önemli anlamalar geliştirdiler. Son olarak, çalışmanın bulguları, ayırt etme
becerisinin, değişen görsel özellikler sonucunda ortaya çıkan yeni durumların, detaylı
süreçlere odaklanmaktansa (ör., bir noktanın ordinatı, sinüs veya kosinüsün
prosedürel tanımı), trigonometrik olarak ilişkili nesnelere odaklanarak (ör., referans
nokta(lar), referans dik üçgen, yarıçap, yer değiştirme miktarı ve yönü) muhakeme
edilmesi gerektirdiğini ortaya çıkardı.
Anahtar Kelimeler: Matematik eğitimi, açılar, trigonometrik fonksiyonlar, periyot,
fark etme, ayırt etme, temsil, temsil değişimi

ix
To my family

x
ACKNOWLEDGEMENT
To my respectable supervisor, Assoc. Prof. Dr. Ayhan Kürşat Erbaş, for his
enduring, sincere and helpful support, guidance, recommendations and encouragement
throughout my doctoral study,
To my respectable committee members, Prof. Dr. Ziya Argün, Prof. Dr. Ahmet
Arıkan, Prof. Dr. Erdinç Çakıroğlu, and Assoc. Prof. Dr. Bülent Çetinkaya, for their
valuable contributions to my study,
To the witness-teacher and the secondary students of this study, for their
participations in the long-time experimentation process with patience,
To my dear friends, Arzu Aydoğan-Yenmez, Mahmut Kertil, Ali İhsan Mut,
and all others I could not write whose names here, for their friendships and constant
moral supports,
To each one in my family, especially my dear father, mother, brother and sister,
for their lifelong supports,
To my deary husband, Necati, for all of his love and constant support
throughout my doctoral education,
To my dear, precious, pretty and lovely daughter, Zeynep, for her smile
whenever I catch her eyes, her teaching me to be stronger, and her endless love,
To my dear, precious, pretty and lovely unborn daughter, Ayşe, for not leaving
me alone last seven months of my dissertation and her permission to complete my
study,
I would like to express my endless and sincere thanks.

xi
TABLE OF CONTENTS
ABSTRACT ................................................................................................................. v
ÖZ .............................................................................................................................. vii
ACKNOWLEDGEMENT ........................................................................................... x
TABLE OF CONTENTS ............................................................................................ xi
LIST OF TABLES .................................................................................................. xviii
LIST OF FIGURES .................................................................................................. xix
CHAPTERS
1. INTRODUCTION ................................................................................................ 1
1.1. Trigonometry ................................................................................................. 3
1.2. Purpose of the Study ...................................................................................... 5
1.3. Research Questions ....................................................................................... 7
1.4. Significance of the Study .............................................................................. 8
1.5. Definitions of Terms ................................................................................... 12
2. LITERATURE REVIEW ................................................................................... 19
2.1. Conceptual Framework ............................................................................... 19
xii
2.1.1. Concept image ...................................................................................... 19
2.1.2. Concept development process .............................................................. 23
2.1.3. Semiotic representations from a cognitive point of view ..................... 24
2.2. Comprehension of Trigonometry ................................................................ 28
2.3. Roots of Students’ Difficulties in Trigonometry ......................................... 29
2.4. Angle versus Angle Measure ....................................................................... 31
2.5. Sine and Cosine ........................................................................................... 34
2.6. Graphical Representation of Trigonometric Functions ............................... 38
2.7. Periodicity .................................................................................................... 40
2.8. Technology in Education ............................................................................. 41
2.9. Trigonometry with Technology ................................................................... 43
2.10. Summary of Literature Review ................................................................ 47
3. METHODOLOGY ............................................................................................. 53
3.1. Teaching Experiment ................................................................................... 53
3.2. Geometer’s Sketchpad ................................................................................. 55
3.3. Participants and Selection ............................................................................ 57
3.4. Initial Interviews .......................................................................................... 58
3.5. Instructional Design of This Study .............................................................. 61
xiii
3.6. Cognitive Base of Designed-Instruction of This Study ............................... 67
3.7. Experimentation Procedures ........................................................................ 73
3.7.1. Familiarity with GSP ........................................................................... 73
3.7.2. Implementation of the modeling task ................................................... 75
3.7.3. Role of the teacher-researcher .............................................................. 76
3.7.4. Role of the witness-teacher .................................................................. 76
3.7.5. Research setting and data collection .................................................... 77
3.8. Analysis of Data .......................................................................................... 80
3.8.1. Analysis of Initial Interviews ............................................................... 80
3.8.2. Analysis of Teaching Experiment ........................................................ 80
3.9. Ethical Aspects ............................................................................................ 82
4. RESULTS FROM INITIAL INTERVIEWS ...................................................... 83
4.1. Students’ Initial Concept Images on Trigonometric Functions Prior to
Teaching Experiment ............................................................................................. 84
4.1.1. On functions ......................................................................................... 84
4.1.2. On definition of angles ......................................................................... 86
4.1.3. On angle measures ............................................................................... 88
4.1.4. On definition of trigonometric functions ........................................... 100
4.1.5. On values of trigonometric functions ................................................. 105
4.1.6. On periodicity..................................................................................... 113
4.2. Summary of Students’ Initial Concept Images .......................................... 119

xiv
5. RESULTS FROM TEACHING EXPERIMENT: PART 1 .............................. 123
5.1. Development of Students’ Concept Images on Trigonometric Functions
(Basic Forms) throughout Teaching Experiment ................................................. 124
5.1.1. Development of students’ concept definition images ........................ 124
5.1.1.1. On trigonometric functions ......................................................... 124
5.1.1.2. On angles .................................................................................... 133
5.1.2. Development of Students’ Concept Images Rooted in (Unit) Circle
Register and Shaped between (Unit) Circle Register and Symbolic Register .. 147
5.1.2.1. On angles .................................................................................... 147
5.1.2.2. On trigonometric functions ......................................................... 158
5.1.3. Development of Students’ Concept Images Rooted in (Unit) Circle
Register and Shaped between Graphical Register and Others .......................... 175
5.1.3.1. Regarding angles ......................................................................... 175
5.1.3.2. Regarding trigonometric values .................................................. 178
5.1.3.3. Regarding periodicity as pattern based on behaviors of
trigonometric functions ................................................................................. 183
5.2. Summary of Students’ Developments on Angle and Angle Measure ....... 199
5.3. Summary of Students’ Developments on Basic Trigonometric Functions 204
5.4. Summary of Students’ Developments on Periodicity................................ 209
6. RESULTS FROM TEACHING EXPERIMENT: PART 2 .............................. 211
6.1. Development of Students’ Concept Images on Trigonometric Functions
(General Forms) throughout Teaching Experiment .............................................. 212

xv
6.1.1. Visual Feature Opposition A .............................................................. 212
6.1.1.1. Changed-radius in (unit) circle register ...................................... 212
6.1.1.2. Changed-magnitude in graphical register ................................... 222
6.1.2. Visual Feature Opposition D .............................................................. 245
6.1.2.1. Changed-center in (unit) circle register ...................................... 245
6.1.2.2. Parallel-displacement along the y-axis in graphical register ...... 258
6.1.3. Visual Feature Opposition C .............................................................. 269
6.1.3.1. Changed-arc with a constant difference in (unit) circle register . 269
6.1.3.2. Parallel-displacement along the x-axis in graphical register ...... 292
6.1.4. Visual Feature Opposition B .............................................................. 300
6.1.4.1. Changed-arc through folding angle in (unit) circle register ....... 300
6.1.4.2. Compressed/Stretched-wavelength in graphical register ............ 302
6.2. Periodicity as pattern based on behaviors of trigonometric functions ...... 306
6.3. Composed-Coefficients’ Visual Oppositions ............................................ 325
6.4. Summary of Students’ Developments on discrimination of Trigonometric
Functions from (Unit) Circle Register .................................................................. 343
6.5. Summary of Students’ Developments on discrimination of Trigonometric
Functions from Graphical Register ...................................................................... 348
6.6. Summary of Students Developments on Periodicity ................................. 353
6.7. Summary of Students’ Reasoning on Composed-Coefficients’ Visual
Oppositions ........................................................................................................... 357
7. RESULTS FROM TEACHING EXPERIMENT: PART 3 .............................. 361

xvi
7.1. Modeling Task with Ferris Wheel: Modeling Process .............................. 361
7.2. Summary of Students’ Way of Reasoning in Modeling Task ................... 395
8. DISCUSSIONS, IMPLICATIONS AND SUGGESTIONS ............................. 399
8.1. Students’ Initial Concept Images on Trigonometric Functions ................. 399
8.1.1. Students’ recognition problems .......................................................... 400
8.1.2. Students’ discrimination problems ..................................................... 403
8.2. Development of Students’ Concept Images on Trigonometric Functions 406
8.2.1. Students’ recognition of angle and angle measure ............................. 406
8.2.2. Students’ recognition of trigonometric functions ............................... 410
8.2.3. Students’ recognition of periodicity ................................................... 412
8.2.4. Students’ discrimination of trigonometric functions in (unit) circle
register… ........................................................................................................... 416
8.2.5. Students’ discrimination of trigonometric functions in graphical
register… ........................................................................................................... 419
8.3. Conceptual Frameworks of Trigonometry ................................................ 425
8.3.1. Cognitive concept maps ..................................................................... 425
8.3.2. Cognitive networks ............................................................................ 437
8.4. Implications and Suggestions for Curriculum and Instruction .................. 457
8.5. Limitation of the Study and Suggestions for Future Research .................. 463
REFERENCES ......................................................................................................... 465

xvii
APPENDICES
A. INITIAL INTERVIEW QUESTIONS ................................................................ 475
B. PARENTAL PERMISSION FORM ................................................................... 477
C. MODELING TASK ............................................................................................ 479
CURRICULUM VITAE .......................................................................................... 481

xviii
LIST OF TABLES
TABLES
Table 3.1. An example from different representations of the “sine” function ........... 56
Table 3.2. Possible actions with GSP for teaching trigonometry............................... 56
Table 3.3. Interview dates for ten students from two school ..................................... 59
Table 3.4. 10th grade trigonometry topics participants of this study had just completed
before the initial interviews ........................................................................................ 60
Table 3.5. Table of specification of initial interview tasks ........................................ 61
Table 3.6. Overview of the tasks in the first part of the instruction in the teaching
experiment .................................................................................................................. 65
Table 3.7. Overview of the tasks in the second part of the instruction in the teaching
experiment .................................................................................................................. 66
Table 3.8. Meeting dates of episodes for each pair .................................................... 78
Table 4.1. Students’ exemplifications of the function in the symbolic register ......... 84
Table 4.2. Students’ constructions of angle* ............................................................. 87
Table 4.3. Students’ constructions to articulate meaning of the unit circle ............... 90
Table 4.4. Students’ operations in the symbolic register on Q6 ................................ 94
Table 4.5. Students’ reasoning in the graphical register on Q6 ................................. 95
Table 4.6. Students’ definitions of sine and cosine .................................................. 102
Table 4.7. Students’ initial reasoning in Q7 ............................................................. 109
Table 4.8. Students’ second step reasoning in Q7 .................................................... 110

xix
LIST OF FIGURES
FIGURES
Figure 2.1. The Concept map of theory of concept image and concept definition (Tall
& Vinner, 1981) ......................................................................................................... 22
Figure 2.2. An example of different organizations of the stored information (Sfard,
1991, p. 27) ................................................................................................................ 24
Figure 2.3. Classification of the semiotic representations into the four representational
registers (Duval, 2006, p.110) .................................................................................... 27
Figure 2.4. A cognitive network for any graphic representation discrimination (Duval,
2006, p.125) ............................................................................................................... 27
Figure 2.5. An arc length image of angle measure that involves equivalence of arcs
(Moore, 2013, p. 228) ................................................................................................ 30
Figure 2.6. Proportional equality between degree and radian measures of the same
angle ........................................................................................................................... 33
Figure 2.7. Four students’ drawings of angles whose cosine is -4/5 (Brown, 2005, p.
228) ............................................................................................................................ 36
Figure 2.8. Static version linking the Ferris wheel to sine wave (Thompson, 2007, p.
144). ........................................................................................................................... 45
Figure 2.9. The chord function (Hertel & Cullen, 2011, p. 1404) ............................. 46
Figure 3.1. Research setting throughout the teaching experiment ............................ 78
Figure 3.2. An example of the Camera 1’s snapshot from Task 11 with Group1 ..... 79

xx
Figure 3.3. An example of the Camera 2’s snapshot from Task 12 with Group2 ..... 79
Figure 4.1. Zafer’s transformation of the vertical-line test within the graphical register
into the multi-functional and non-discursive register ................................................ 85
Figure 4.2. Defne’s reasoning about the repetition of the graph in Q8 ..................... 96
Figure 4.3. Defne’s reasoning about the domain and range of sine and cosine in Q8
.................................................................................................................................... 96
Figure 4.4. Ebru’s conversions about definition of sine and cosine from the (unit)
circle register into the symbolic register .................................................................. 104
Figure 4.5. Ebru’s reasoning about the repetition of the graph in Q8 ..................... 117
Figure 4.6. Zafer’s reasoning about the repetition of the graph in Q8 .................... 118
Figure 4.7. Zafer’s construction of y=sin(x) and y=2sin(x) in the table................... 118
Figure 4.8. Zafer’s construction of y=sin(x) and y=2sin(x) functions’ graphs........ 118
Figure 4.9. Zafer’s reasoning in the symbolic register about the function in Q8 .... 119
Figure 5.1. Manipulable similar right triangles ....................................................... 129
Figure 5.2. Similar right triangles whose side lengths were labeled as opposite,
adjacent and hypotenuse regarding the angle C ....................................................... 131
Figure 5.3. Teacher-researcher’s construction on paper to associate the definition of
“sine” on the right triangle with that on the unit circle ............................................ 132
Figure 5.4. Right triangle to discuss the relation between sine and cosine ratios of
complementary angles .............................................................................................. 133
Figure 5.5. Teacher-researcher’s constructions to articulate “angle” and “angle
measure in degrees” on paper ................................................................................... 133
xxi
Figure 5.6. Construction of an angle and its measure in degrees in GSP ................ 136
Figure 5.7. Construction of a circle centered on the vertex of the angle ................. 136
Figure 5.8. Construction of an angle with positive measure in radians in GSP ...... 139
Figure 5.9. Construction of an angle with negative measure in radians in GSP ..... 139
Figure 5.10. Constructions of an angle with two arcs to make sense of the direction
.................................................................................................................................. 142
Figure 5.11. Ways of operating to establish relation between arc lengths and arc angles
.................................................................................................................................. 146
Figure 5.12. Manipulable calculations of the ratios of arc lengths to the radius by the
dynamically-connected constructions ...................................................................... 146
Figure 5.13. An angle on the (unit) circle register and its principal measure in the
symbolic register ...................................................................................................... 152
Figure 5.14. An example of the dynamic construction of angles with the same principal
angle by GSP ............................................................................................................ 153
Figure 5.15. Angles in each quadrant with the same reference angle ..................... 157
Figure 5.16. Angles in each quadrant with complementary reference angle ........... 157
Figure 5.17. Reference right triangle and principal arc on the unit circle ............... 165
Figure 5.18. Relations among ordinate [abscissa] of P, length of the red [blue]
segment, sine [cosine] of alpha ................................................................................ 167
Figure 5.19. Reference right triangle with legs entitled by the related trigonometric
expression ................................................................................................................. 171
Figure 5.20. An example of a real number’s consideration as an angle measure in
radians ...................................................................................................................... 173
xxii
Figure 5.21. Construction of the (alpha,sin(alpha)) ordered pair within the graphical
regsiter ..................................................................................................................... 187
Figure 5.22. Constructions to associate relateted componets of sine between the
graphical regsiter and the (unit) circle register ....................................................... 188
Figure 5.23. Constructions to associate relateted componets of cosine between the
graphical regsiter and the (unit) circle register ....................................................... 188
Figure 5.24. Construction of sine graph in the [0,2π) interval via taking the trace point
(for the point P') and animate point (for the point P) advantages of GSP ............... 191
Figure 5.25. Construction the rate of change for the sine function within the (unit)
circle register ........................................................................................................... 191
Figure 5.26. Construction of the sine graph with its extended domain from [0,2π) to
the x-axis .................................................................................................................. 194
Figure 5.27. Construction of the (alpha-2π,sin(alpha)) ordered pair within the
graphical regsiter ..................................................................................................... 197
Figure 5.28. Construction of the sine graph’s left and right first parts in the graphical
register corresponding to the first full-round turnings, respectively, in the clockwise
and counterclockwise directions in the (unit) circle register .................................. 197
Figure 6.1. Construction of the non-unit circle and the unit circle together with their
reference right triangles in in the (unit) circle register ............................................ 220
Figure 6.2. Assigning a distance different from 1cm as the unit length in the symbolic
register by the aid of the coordinate plane in the (unit) circle register ................... 221
Figure 6.3. Conversion of the arcs remaining in an angle regarding circles with
different radii in the (unit) circle register into this angle’s measure in radians in the
symbolic register ...................................................................................................... 221

xxiii
Figure 6.6.4. Generalization of the y-values of the points referring to the same angle
on circles with different radii with respect to sine of this angle in the (unit) circle
register ..................................................................................................................... 222
Figure 6.5. Construction of r.sine graph in the [0,2π) interval via taking the trace point
(for the point R') and animate point (for the point P) advantages of GSP ............... 230
Figure 6.6. Construction of sine and r.sine graphs’ right first parts in the graphical
register corresponding to the first full-round turning in the counterclockwise direction
respectively on the unit circle and r-unit circle in the (unit) circle register ............ 231
Figure 6.7. Construction of the sine and 6.sine graphs with their extended domains
from [0,2π) to the x-axis ........................................................................................... 232
Figure 6.8. Construction of the generalized r.sine graph together with its aritmetic
form (e.g., h(x)=3.sin(x) in case the radius was about 3) in order to ease the conversion
of the sine and r.sine functions between the (unit) circle register and the graphical
register ..................................................................................................................... 237
Figure 6.9. Construction of the simultaneous graphs of the sine and –sine functions in
the graphical register ............................................................................................... 238
Figure 6.10. Construction of the parallel displacement of the point P' in the graphical
register along the x-axis by π in the negative direction ........................................... 239
Figure 6.11. Construction of an equavalence of the sine function in the graphical
register via the parallel displacement of the –sine function along the x-axis by π in the
positive direction ...................................................................................................... 240
Figure 6.12. Construction of an equavalence of the –sine function in the graphical
register via the parallel displacement of the sine function along the x-axis by π in the
negative direction ..................................................................................................... 241
Figure 6.13. Construction of the manipulable a.sine function in the graphical register
by a slider for the coefficient a between –5 and 5 ................................................... 243
xxiv
Figure 6.14. Shape of the a.sine graph in case of the slider’s (–1) position for the
coefficient a .............................................................................................................. 244
Figure 6.15. Shape of the a.sine graph in case of the slider’s zero-position for the
coefficient a .............................................................................................................. 244
Figure 6.16. Construction of the unit circle with a manipulable-center in terms of sine
in the (unit) circle register ....................................................................................... 252
Figure 6.17. The ordinate and sine value corresponding to the point P on the unit circle
with the manipulable-center ..................................................................................... 253
Figure 6.18. Ordinate of the point P as an additive relation of the corresponding sine
value and the ordinate of the center point ................................................................ 254
Figure 6.19. Ordinate of the point P as an additive relation in case of the negative sine
values ........................................................................................................................ 254
Figure 6.20. Role of the directed-opposite side in the (unit) circle register on the
additive relation indicating the ordinate of the point P ............................................ 255
Figure 6.21. Parallel displacement of the unit circle in terms of sine along the x-axis
in the (unit) circle register ....................................................................................... 256
Figure 6.22. Parallel displacement of the unit circle in terms of sine along the y-axis
in the (unit) circle register ....................................................................................... 257
Figure 6.23. Construction of the traced graph of the ordered-pair (x,yP) in the graphical
register as dynamically-linked to the point P on the unit circle whose center is located
on the different point from the origin in the (unit) circle register ........................... 262
Figure 6.24. Construction of the manipulated-traced graph of the ordered-pair (x,yP)
in the graphical register by the manipulation of the center in the (unit) circle register
.................................................................................................................................. 263
xxv
Figure 6.25. Construction of the traced graph of the ordered-pair (x,yP) in the graphical
register together with the sine graph ........................................................................ 264
Figure 6.26. Parallel displacement of the unit circle in terms of cosine along the x-axis
in the (unit) circle register ....................................................................................... 267
Figure 6.27. Construction of the traced graph of the (x,cos(x)+xO') ordered pair in the
graphical register together with the cosine graph ................................................... 268
Figure 6.28. Construction of two points P and P+4 as an example of the construction
of two points on the unit circle with a constant difference in terms of sine ............ 278
Figure 6.29. An example of the construction of the traced graph of the ordered-pair (x,
yP+4) in the graphical register so that yP+4 would refer to sin(x+4) ......................... 279
Figure 6.30. Zafer’s conversion trouble on transformation of the y=sin(x±2.3)
functions in the symbolic register into their representations in the graphical register
when considering them as the parallel displacements of the sine graph along the x-axis
by the 2.3-unit length ............................................................................................... 280
Figure 6.31. Construction of the parallel displacement of an arbitrary point A on the
sine graph along the x-axis by a constant value –e.g., 2.3– in the positive direction; and
then the new point’s parallel displacement along the x-axis by the complement of this
constant value into 2π –e.g., about 4. ....................................................................... 281
Figure 6.32. An example of the construction of the traced graph of the ordered-pair (x,
yP') in the graphical register so that yP' would refer to sin(x+π+4) .......................... 284
Figure 6.33. Transformed-construction of the reference right triangle in the (unit)
circle register through the rotation about the origin by the π/2-radian fixed angle . 288
Figure 6.34. Construction of the reference right triangle in the second quadrant as the
complemet of the rotated-construction by π/2-radian of the reference right triangle in
the first quadrant ...................................................................................................... 288
xxvi
Figure 6.35. Labelling the legs of the reference right triangle in the second quadrant
which is the complemet of the rotated-construction by π/2-radian of the reference right
triangle in the first quadrant ..................................................................................... 289
Figure 6.36. Construction of two points P and P+1 as an example of the construction
of two points on the unit circle with a constant difference in terms of cosine ......... 291
Figure 6.37. Construction of y=cos(x) and y=cos(x+1) functions in each register .. 292
Figure 6.38. At the end of Task 10, Defne’s constructions on a paper when reasoning
about f(x)=sin(x+5) function’s graph ....................................................................... 297
Figure 6.39. Through folding the principal angle corresponding to a point, the point P,
on the unit circle, construction of another point, the point P' .................................. 316
Figure 6.40. Simultaneous constructions of y=sin(2x) function in the (unit) circle
register and the graphical register together with y=sin(x) function ........................ 317
Figure 6.41. Construction of dynamically-linked three points, P, P' and P'', on the unit
circle with the principal measures, respectively, x, 2x and 3x ................................. 318
Figure 6.42. Construction of y=sin(3x) function’s graph together with y=sin(x) and
y=sin(2x) ................................................................................................................... 319
Figure 6.43. Construction of the ordered pairs (x,sin(x)) and (x,sin(2x)) as
dynamically-linked with their correspondences in the (unit) circle register ........... 324
Figure 6.44. Simultaneous constructions of y=sin(x) and y=sin(2x) functions in the
(unit) circle register and the graphical register through emphasizing the principal arc’s
conversion into the graphical register ..................................................................... 325
Figure 6.45. Conversion of a general form of sine function composed by all
coefficients in the symbolic register into the graphical register ............................. 335

xxvii
Figure 6.46. An example of the conversion of a and d coefficients in the symbolic
register regarding the general form of sine function, i.e., y=a.sin(bx+c)+d, into the
graphical register ..................................................................................................... 336
Figure 6.47. An example of the conversion of a, b and d coefficients in the symbolic
register regarding the general form of sine function, i.e., y=a.sin(bx+c)+d, into the
graphical register ..................................................................................................... 337
Figure 6.48. An example of the conversion of some combinations of all coefficients
in the symbolic register regarding the general form of sine function, i.e.,
y=a.sin(bx+c)+d, into the graphical register ........................................................... 338
Figure 6.49. Two other examples of the conversion of the general form of sine function
in the symbolic register, i.e., y=a.sin(bx+c)+d, into the graphical register so as to
discuss the composed effect of b and c coefficients ................................................ 339
Figure 7.1. Defne’s drawing of a circle and a base line to model the Ferris wheel and
the floor .................................................................................................................... 370
Figure 7.2. Defne’s drawing to model Ferris wheel ................................................ 371
Figure 7.3. Cemre’s first drawing to model Ferris wheel ........................................ 372
Figure 7.4. Cemre’s second drawing to model Ferris wheel ................................... 372
Figure 7.5. Ebru’s drawing to model Ferris wheel .................................................. 373
Figure 7.6. Zafer’s drawing to model Ferris wheel ................................................. 374
Figure 7.7. Cemre’s writing the function to model the ground clearance ............... 378
Figure 7.8. Zafer’s consideration of the ground clearance by f(x)=70sin(x)+74 function
in case the position of the car was inside of the third quadrant (Step1. modeling the
terminal side of the angle)........................................................................................ 378
xxviii
Figure 7.9. Zafer’s consideration of the ground clearance by f(x)=70sin(x)+74 function
in case the position of the car was inside of the third quadrant (Step2. modeling the
angle as a dynamic turning by its principal arc in the (unit) circle register) .......... 379
Figure 7.10. Zafer’s consideration of the ground clearance by f(x)=70sin(x)+74
function in case the position of the car was inside of the third quadrant (Step3.
modeling the opposite side of the reference right triangle) ..................................... 379
Figure 7.11. Zafer’s consideration of the ground clearance by f(x)=70sin(x)+74
function in case the position of the car was inside of the third quadrant (Step4.
modeling the ground clearance) .............................................................................. 380
Figure 7.12. Zafer’s checking of f(x)=70sin(x)+74 in case of sin(x)= –1 ................ 380
Figure 7.13. Zafer’s drawing to articulate the meaning of x in f(x)=70sin(x)+74 (Step1.
modeling the terminal side of the angle) .................................................................. 381
Figure 7.14. Zafer’s drawing to articulate the meaning of x in f(x)=70sin(x)+74 (Step2.
modeling the angle as a dynamic turning by its principal arc in the (unit) circle
register) .................................................................................................................... 381
Figure 7.15. Cemre’s direct proportion to determine the time at which one car replaced
on the next car’s position ......................................................................................... 385
Figure 7.16. Cemre’s direct proportion to determine the turning amount in degrees at
1 second .................................................................................................................... 386
Figure 7.17. Defne’s direct proportion to determine turning amount at 15 seconds 387
Figure 7.18. Defne’s reasoning about “angle” based on “time” in minutes ............ 387
Figure 7.19. Defne’s revision of the function so as to model the ground clearance
.................................................................................................................................. 387

xxix
Figure 7.20. The researcher’s construction in GSP environment to model for another
Ferris wheel with a different radius and a different ground line from those in the
modeling task ........................................................................................................... 389
Figure 7.21. Cemre’s revision of the function modeling the ground clearance ...... 390
Figure 7.22. Students’ reasoning efforts on the distance to the position gotten in the
car by a simpler analogy in the first quadrant without loss of generality ................ 392
Figure 7.23. Zafer’s drawing to model the distance to the point gotten in the car .. 393
Figure 7.24. Defne’s drawing to model the distance to the point gotten in the car . 394
Figure 7.25. Students’ controlling their model function for the distance to the position
gotton in the car through adopting it in case of the circle in GSP environment with the
7-cm radius whose center was located on the origin ................................................ 394
Figure 7.26. Final forms of two functions modelling respectively the ground clearance
and the distance to the position gotten in the car with respect to “time” in minutes 395
Figure 8.1. Cognitive concept map on angles that models the integration of a new
concept and the related current concepts into students’ cognitive knowledge structure
.................................................................................................................................. 431
Figure 8.2. Cognitive concept map on angles in the (unit) circle register that models
integration of a new concept and the related current concepts into students’ cognitive
knowledge structure ................................................................................................. 432
Figure 8.3. Cognitive concept map on sine [cosine] that models integration of a new
concept and the related current concepts into students’ cognitive knowledge structure
.................................................................................................................................. 433
Figure 8.4. Cognitive concept map on sine [cosine] as a function that models
integration of a new concept and the related current concepts into students’ cognitive
knowledge structure ................................................................................................. 435
xxx
Figure 8.5. Cognitive concept map on periodicity of core trigonometric functions that
models integration of a new concept and the related current concepts into students’
cognitive knowledge structure ................................................................................. 437
Figure 8.6. Cognitive network of the connections between visual feature oppositions
(A) and (D) for the representation discrimination in the (unit) circle register ......... 441
Figure 8.7. Cognitive network of the connections between visual feature oppositions
(A) and (C) for the representation discrimination in the (unit) circle register ......... 442
Figure 8.8. Cognitive network of the connections between visual feature oppositions
(A) and (B) for the representation discrimination in the (unit) circle register ......... 443
Figure 8.9. Cognitive network of the connections between visual feature oppositions
(C) and (D) for the representation discrimination in the (unit) circle register ........ 444
Figure 8.10. Cognitive network of the connections between visual feature oppositions
(B) and (D) for the representation discrimination in the (unit) circle register ......... 445
Figure 8.11. Cognitive network of the connections between visual feature oppositions
(B) and (C) for the representation discrimination in the (unit) circle register ......... 446
Figure 8.12. Cognitive network of the connections between visual feature oppositions
(A), (B), (C) and (D) for the representation discrimination in the (unit) circle register
.................................................................................................................................. 447
Figure 8.13. Cognitive network of the connections between visual feature oppositions
(A) and (D) for the representation discrimination in the graphical register ............ 448
Figure 8.14. Cognitive network of the connections between visual feature oppositions
(A) and (C) for the representation discrimination in the graphical register ............ 449
Figure 8.15. Cognitive network of the connections between visual feature oppositions
(A) and (B) for the representation discrimination in the graphical register ............. 450
xxxi
Figure 8.16. Cognitive network of the connections between visual feature oppositions
(C) and (D) for the representation discrimination in the graphical register ............ 451
Figure 8.17. Cognitive network of the connections between visual feature oppositions
(B) and (D) for the representation discrimination in the graphical register ............ 452
Figure 8.18. Cognitive network of the connections between visual feature oppositions
(B) and (C) for the representation discrimination in the graphical register ............ 453
Figure 8.19. Cognitive network of the connections between visual feature oppositions
(A), (B), (C) and (D) for the representation discrimination in the graphical register
.................................................................................................................................. 454
Figure 8.20. Cognitive network of the connections between sine and cosine in the
(unit) circle register as a consequence of the visual feature oppositions (R) and (SRRT)
.................................................................................................................................. 455
Figure 8.21. Cognitive network of the connections between sine and cosine in the
graphical register as a consequence of the visual feature oppositions (S) and (C* and
C**) ........................................................................................................................... 456

xxxii

1
CHAPTER 1
1. INTRODUCTION
The importance of mathematics has increased day by day. Any more, there is
a different view on learning and teaching of mathematics (National Council of
Teachers of Mathematics [NCTM], 2000). Teaching for understanding has been
emphasized on-going calls for reform in education (NCTM, 2000). Therefore,
development of deep understanding of mathematical concepts is essential for
mathematics education also.
Tall and Vinner (1981) differentiate a student’s conception (or mental
understanding) of a concept from its formal mathematical definition by using the
notion of concept image and concept definition, respectively. According to them, while
the term concept image refers to all the mental pictures and associated properties, and
processes with a concept, the term concept definition refers the “form of words used
to specify that concept” (p. 152). Students’ concept images are acquired through
different experiences over the years based on their prior knowledge. In many
situations, it is desirable for students to evoke rich concept images (Harel, Selden &
Selden, 2006).
Using formal definitions of a concept to produce examples and counter
examples (Dahlberg&Housman, 1997), making connections to other concepts and
converting between its multiple representations (Duval, 1999) are the ways for
students to evoke rich concept images. Multiple representations, especially visual ones
(such as graphs) (Goldenberg, 1988), are important factors for understanding of
functions, before introducing static (symbolic) definitions (Dreyfus, 1993; Kaput,
1987). Nevertheless, students have difficulties in inferring from visualization of graphs
(Goldenberg, 1988) and connecting diagram with its symbolic representation (Zazkis,
2
Dubinsky & Dautermann, 1996). Despite of students’ difficulties with visualization, it
has the power in mathematical reasoning (Dreyfus, 1991) and understanding
(Presmeg, 1994). Moreover, helping students acquire the ability to visualize
mathematical concepts enriches their concept images (Harel, Selden & Selden, 2006).
In this respect, visual aspects of computer technology, particularly dynamic geometry
environments, can help students make connection between visual and symbolic
representations of the same mathematical concept.
Dynamic geometry environments provide dynamic diagrams so that students
can slightly distort to meet their expectations, which is impossible in paper-and-pencil
diagrams (Laborde, Kynigos, & Strasser, 2006). Moreover, they give students the
opportunity of constructing graphs of functions which can be manipulated and
animated by the parameter, as well as the opportunity of dynamically linking between
graphs and other representations of a situation (Mackrell, 2002); and helps them
understand propositions by allowing them to perform geometric constructions with a
high degree of accuracy (Hanna, 2000). However, existing technology does not
guarantee learning.
Literature shows that technology usage can be effective only within appropriate
teaching-learning context (Ferrara, Pratt & Robutti, 2006). The study of Jones (2002),
in which published research on the use of dynamic geometry software (DGS) was
categorized, stated that a range of research showed that judicious use of DGS can foster
the understanding of proof. However, if used inappropriately, DGS might make things
worse instead of making significant effect on students’ conception (Jones, 2002).
Therefore, appropriate integration of technology into mathematics courses is needed.
It requires carefully designed teaching/learning activities according to not only
teachers’ but also students’ background, the task, the mathematical context, the class
context and the potentialities offered by the software (Ferrara et al., 2006).
Ubuz, Üstün and Erbaş (2009) reported that “if used appropriately” dynamic
geometry environments “can serve as an important vehicle to improve student
achievement in geometry and achieve a classroom culture where conjecturing,
analyzing, exploring, and reasoning are daily routines” (p.148). Also, Hannafin and
3
Scott (2001) showed that using dynamic geometry softwares in a student-centered
environment has a positive effect on the attitudes and beliefs of both teachers and
students about teaching and learning geometry. In the subject design of Weeden (2002)
where a dynamic geometry software was incorporated into her lessons, she observed
that the classroom experience was extremely enjoyable for both students and teachers,
they worked in collaboration and experienced reality of construction and properties of
shape while learning to use the software; moreover, she observed that students
developed a deeper understanding and a greater view of the whole picture.
Although dynamic geometry environments are often used in teaching geometry
because of its crucial role of geometric and graphical representations, it can be also
used in teaching trigonometry which is a visual part of mathematics converging
algebra and geometry.
1.1. Trigonometry
Trigonometry is a part of mathematics in which algebra and geometry
converge. Dealing with trigonometric functions is known as a difficult task since it
requires to work with right triangles, the unit circle, and graphs of trigonometric
functions simultaneously. Several students have trouble on coherent understanding
and flexible use of trigonometric functions in different representations (Brown, 2005).
To integrate trigonometric functions’ meaning in any representational context, the
meaning of angle measure is emphasized as the foundational cognitive idea
(Thompson, 2008). However, angle measure is a problematic issue that is needed to
be handled carefully in teaching of trigonometry (Akkoç, 2008; Fi, 2003; Thompson,
2008; Topçu, Kertil, Akkoç, Yılmaz &Önder, 2006). To indicate an angle measure on
a visual representation, an inner arc is created. Nevertheless, without its meaning for
the angle measure, this inner arc serves only as a pointer in a diagram (Thompson,
2008). Students have difficulties on clear meaning of angle measure in terms that the
measured-thing is what (Thompson, 2008; Moore, 2010).
4
Considering measurable attributes is foundational to make sense of the angle
measure (Moore, 2010; 2012; 2013; Hertel & Cullen, 2011). Measuring arc lengths in
radii (Moore, 2010; 2012; 2014) is important idea to promote reasoning about angle
measure as the meaningful numbers (Thompson, 2008). Also, there is a need to
develop coherent angle measures in degrees and radians (Thompson, 2008) through
merging their meanings as the proportional relation between the arc length subtended
by the angle and the circle’s circumference (Thompson, 2008; Moore, 2013).
However, literature indicates students’ troubles on the radian measure unit. The
meaning of the radian measure is dominated by degree meaning and restricted only
into transformations between degree and radian measures (Akkoç, 2008; Topçu, et al.,
2006). At that point, π comes to light as a cognitive obstacle when reasoning about its
real value in the trigonometry context (Akkoç, 2008; Fi, 2003; Topçu, et al., 2006).
The unit circle was emphasized as an important tool in the literature for strong
understanding of coordinate trigonometry or periodic function trigonometry (Brown,
2005; Moore, LaForest, & Kim, 2012; Weber, 2005). Nevertheless, students have
difficulties with the unit circle in terms of understanding, using and interpreting
trigonometric functions (Burch, 1981; Brown, 2005; Emlek, 2007; Güntekin, 2010;
Gür, 2009; Weber, 2005). Moore et al. (2012) lay emphasis on the importance of the
ability to use trigonometric functions in any circular context. They reported preservice
teachers’ difficulties in reasoning about trigonometric functions on the non-unit
circles.
Another critical aspect mentioned in the literature (Hertel & Cullen, 2011;
Thompson, 2008; Weber, 2005) is based on reasoning about trigonometric functions
as functions. Because trigonometric functions cannot be expressed as algebraic
formulas involving arithmetical procedures, students have trouble on reasoning about
them as functions (Weber, 2005). Therefore, it is attached importance to promote
reasoning about trigonometric functions as functions mapping from angle measure to
corresponding trigonometric value (Hertel & Cullen, 2011), as well as reasoning about
angle measure as the (meaningful) numbers referring to the argument of trigonometric
functions (Thompson, 2008).
5
Students’ difficulties on associating trigonometric functions properly with the
appropriate geometric models (Brown, 2005; Weber, 2005), and their problems with
the conception of prior knowledge (such as right triangles, the coordinate plane, ratio-
proportion, circle) and new knowledge (such as relationship between arc length and
angle measure, reference and principal angle, the unit circle) (Gür, 2009) are other
obstacles for effective learning of trigonometry.
Coherent understanding and flexible use of trigonometric functions in different
representations (i.e., symbolic, circular, and graphic) are expected from trigonometry
instructions. In comprehension of mathematics, Duval (2006) argued the importance
of recognition and discrimination tasks. Recognition tasks require recognition of the
same object represented in two different representational registers “whose contents
have very often nothing in common” (p. 112). Discrimination tasks require
discrimination “in any semiotic representation what is mathematically relevant and
what is not mathematically relevant?” (p. 115). Therefore, well-designed recognition
and discrimination tasks are critical to provide students with coherent understanding
and flexible use trigonometric functions in different representational registers but also
provide researchers and teachers with awareness of students’ understanding.
1.2. Purpose of the Study
In spite of the difficulties with trigonometry mentioned above, there is little
attention on this area in mathematics education research literature comparing with the
other subject areas. Unfortunately, research literature on trigonometric functions
concluded that the standard instruction, which is based on ratio method and unit circle
method, did not constitute students’ strong understanding of trigonometric functions
(Akkoç, 2008; Brown, 2005; Moore, 2014; Weber, 2005). This dissertation was
designed to contribute trigonometry of students through designing an instruction to
support students’ concept images on trigonometric functions in different
representations (i.e., symbolic, circular, and graphic) and investigate students’ evoked
concept images on trigonometric functions during the experimentation of this

6
instruction. The instruction of the study was including a sequential recognition and
discrimination tasks in the dynamic geometry environment. Instructional design
process of the study started through inspiring from research literature on trigonometry,
historical development of trigonometry, our exploratory teaching experience, and
initial interview results; and then, continued as an on-going revision process during
the experimentation to influence students’ trigonometry.
Base of the instruction was an animated circle which was located on the
coordinate plane and whose radius and center were manipulable. It was used to enrich
students’ concept images on the core trigonometric functions, i.e., sine and cosine.
Recognition and discrimination of sine and cosine in the different representational
registers required to deal not only with the basic forms of core trigonometric functions1
but also with their general forms2. On the one hand, main focus of the recognition
tasks was on promoting students to recognize the same trigonometric object that was
represented within different representations’ respective contents (such as, angle,
trigonometric value, trigonometric function, and periodicity). On the other hand, main
focus of the discrimination tasks was on promoting students to discriminate in any
representational register “what is mathematically relevant, and what is not
mathematically relevant” (Duval, 2006, p. 115) under the dynamic manipulation of the
represented objects. In general sense, our instructional focus was on the role of
coefficients on core trigonometric functions’ periods and different representations. For
this purpose, in the designed instruction, it was followed a way moving from their
geometric representations on the (unit) circle to the graphical representations together
with the symbolic representations.
A teaching experiment (Steffe & Thompson, 2000) was conducted to
experience, firsthand, students’ trigonometry on these recognition and discrimination
tasks, as well as to test and refine our design through composing new situations not
considered in the initial design to “encourage students to modify their current thinking”
(p. 285). Based on these modification, some conceptual frameworks were created to
1 The term “basic form” of core trigonometric functions refers to y=sin (x) and y=cos (x).
2 The term “general form” of core trigonometric functions refers to y=a sin (bx+c)+d and y=a cos (bx+c)+d.

7
analyze and enrich students’ trigonometry related to angle, sine and cosine (as a value
and as a function) and periodicity concepts. Also, some cognitive networks were
produced to dissociate the content of any semiotic representation and the object
represented in this representational system.
1.3. Research Questions
The overarching aim of the current study was to investigate how a dynamic
geometry environment contributes secondary students’ understanding of trigonometry.
For this aim, in the light of the theoretical base of the designed-instruction, following
main research questions and their sub-questions guided this study:
Prior to the instruction, what concept images on trigonometric functions do
secondary students who had just taken trigonometry have?
What are the problems of students’ recognition of foundational
trigonometric concepts3 related to trigonometric functions within any
representational register?
What are the problems of students’ discrimination of trigonometric
functions represented within any representational register from the
respective representational registers’ contents?
Are there any potential conflict factors in students’ concept images on
trigonometry?
What understanding related to trigonometric functions do students develop
during the experimentation of the designed-instruction in a dynamic geometry
environment that emphasizes the dynamically-linked transformations of the
represented objects?
3 As foundational trigonometric concepts, functions, angle, angle measure, trigonometric value,
trigonometric functions, and periodicity are determined based on trigonometry research literature, historical
development of trigonometry, our exploratory teaching experience, and initial interview results.

8
In what way do the dynamically-linked conversions of trigonometric functions
between representational registers influence students’ recognition of
trigonometric functions?
In what way do the dynamically-changed visual components referring to
trigonometric functions influence students’ discrimination of trigonometric
functions?
1.4. Significance of the Study
Mathematics is known as one of the most difficult subjects. Interestingly, not
only lower-achievers in mathematics but also average and even higher-achiever
students have difficulties with trigonometry. Even though trigonometry is a painful
subject for most students, it is an important part of mathematics in which algebra and
geometry converge. On the one hand, it is a useful tool in variety real-life applications
in two ways (Cooney, Beckmann, Lloyd,Wilson & Zbiek, 2010). Firstly, trigonometric
functions give us the opportunity to find unknown lengths in terms of known lengths
and angles. Secondly, as the natural and fundamental examples of periodic functions,
trigonometric functions are used to approximate any periodic functions. For instance,
in developing computer music, the sine and cosine functions are used to model sound
waves. On the other hand, beyond its importance in real-life, trigonometry has also an
important academic value for the students in transition from the secondary education
to the tertiary education. Achievement in calculus courses in tertiary education, in
which trigonometric functions are used when studying with, for example, limit,
derivative and integral, requires for students to have constructed adequate concept
images in their secondary education due to the fact that concepts are introduced in
tertiary education via their formal concept definitions. Therefore, to provide continuity
between secondary education and tertiary education, it is needed to help students
construct adequate concept images –or, mental structures for representing and
identifying corresponding concepts– during their secondary education period. Thus,
the current study is significant in terms of aiming to design an instruction to support

9
secondary students’ concept images on trigonometric functions in different
representations (i.e., symbolic, circular, and graphic), as well as to contribute
trigonometry of students4 through investigating their evoked concept images on
trigonometric functions during the experimentation of this designed-instruction.
A concept can be acquired through converting between its multiple
representations (Duval, 1999) because visualization can facilitate mathematical
understanding (Presmeg, 1994). However, a lack of the ability of students to connect
a diagram with its symbolic representation is the most harmful but quite common
difficulty with visualization (Duval, 2006; Zazkis, Dubinsky & Dautermann, 1996).
Helping students acquire the ability to visualize mathematical concepts enriches their
concept images (Harel, Selden & Selden, 2006). There is a consensus in the literature
that appropriate use of technology can be effective on students’ conceptualization by
providing quick visualization with a high degree of accuracy (Archavi, 2003;
Arzarello, Olivero, Paola & Robutti, 2002; Mariotti, 2000; Noraini, 2007). In this
respect, this study is significant in terms of its instructional design including a
sequential recognition and discrimination tasks both within and between different
representations of trigonometric functions (i.e., symbolic, circular, and graphic) in the
dynamic geometry environment.
Multiple studies have stated positive effect of trigonometry teaching by the aid
of dynamic geometry environments on students’ understanding (Blacket &Tall, 1991;
Choi-Koh, 2003; Hertel and Cullen, 2011; Thompson, 2007). Some studies did not
focus on trigonometric functions’ circular representation (Blacket &Tall, 1991; Choi-
Koh, 2003); or used a realistic model of the unit circle in the dynamic geometry
environment (Thompson, 2007). In this respect, it is needed to investigate the unique
role of dynamically linked-representations (i.e., symbolic, circular, and graphic) of
trigonometric functions on students’ understanding not only in the symbolic and
graphical but also most importantly circular representation. This is because historical
4 Steffe and Thompson (2000) differentiated students’ mathematics and mathematics of students phrases. On
the one hand, students’ mathematics refers to “whatever might constitute students’ mathematical realities”;
on the other hand, mathematics of students refers to “our [researchers’] interpretations of students’
mathematics” (p. 268). We use trigonometry of students as the same meaning with mathematics of students
notion in the trigonometry context.
10
origin of trigonometry was intimately tied to spherical trigonometry, and its
development entailed to understand trigonometry in the circular context (Katz, 2009).
Therefore, unlike some other studies in the sparse literature on trigonometry that
examined students’ understanding of trigonometry in a dynamic geometry
environment (Blacket &Tall, 1991; Choi-Koh, 2003; Hertel and Cullen, 2011;
Thompson, 2007), the instructional design of this study was followed a way moving
from the (any) circular representation to the graphical representation together with the
symbolic representation. In addition, this study investigated the unique role of
dynamically linked-representations of trigonometric functions “toward understanding
the progress students make over extended periods” (Steffe & Thompson, 2000, p. 273)
through a 17-week teaching experiment. Therefore, the current study is significant due
to its results that contribute the trigonometry literature.
Trigonometry was a part of the previous Turkish national high school
mathematics curriculums (Talim ve Terbiye Kurulu Başkanlığı [TTKB], 2005, 2011)
as a sub-learning domain at 10th grade. It was following a process starting from right
triangle trigonometry through directed angles to unit circle trigonometry, and then,
trigonometric functions’ graphs. However, there was no mention about the general
form of trigonometric functions (see Footnote 2) except for graphing and finding
periods of them. Circular representations of trigonometric functions were restricted to
the representation of the basic trigonometric functions (see Footnote 1) on the unit
circle. Subsequently, it was changed in 2013, and trigonometry was distributed at
grades 9, 11 and 12 through being revised. Although the covariation of the graphs with
respect to the changed-coefficients of a trigonometric function in the general form, for
example, f(x)=a sin (bx+c)+d, took place as an objective of the trigonometry course at
11th and 12th grades, there was no mention again about circular representations of
trigonometric functions’ general forms. Thus, the current study is significant as a
consequence of its suggestions regarding this issue to the curriculum designers. This
may limit for students to construct reified concept images on trigonometric functions
in their secondary education. As it is mentioned above, to provide continuity between
secondary education and tertiary education, it is needed to help students construct
adequate concept images during their secondary education period.
11
Trigonometric functions are the natural and fundamental examples of periodic
functions. Understanding of periodicity requires dual and simultaneous reasoning
about (i) regular intervals of DOMAIN and (ii) corresponding repeated values in
RANGE. It is cognitively difficult process especially when reasoning about them both
within and between all different representations of trigonometric functions (i.e.,
symbolic, graphic, and circular). Fi (2003) considers coterminal angles as the related
and necessary knowledge to model periodic phenomena (e.g., Ferris wheel problem),
as well as emphasize the importance of coterminal angles to generate angle measures
other than the principal ones. He reported preservice mathematics teachers’ inadequate
knowledge of coterminal angles and the periodicity idea as the problematic parts of
their understanding of trigonometric functions. However, many other studies focusing
on students’ understanding of trigonometric functions (Akkoç, 2008; Brown, 2005;
Hertel and Cullen, 2011; Moore, 2010; 2012; Moore, LaForest, & Kim, 2012;
Thompson, 2007; Topçu, Kertil, Akkoç, Yılmaz &Önder, 2006) mentioned little or
nothing about the periodicity idea in a detailed way. Therefore, the current study is
significant due to its results on periodicity considering different representations to
contribute the trigonometry literature.
In this study, a teaching experiment (Steffe & Thompson, 2000) was conducted
to experience, firsthand, students’ trigonometry throughout recognition and
discrimination tasks, as well as to test and refine our design through composing new
situations not considered in the initial design to “encourage students to modify their
current thinking” (p. 285). Based on these modification, some conceptual frameworks
were created to analyze and enrich students’ trigonometry related to angle, sine and
cosine (as a value and as a function) and periodicity concepts. Also, some cognitive
networks were produced to dissociate the content of any semiotic representation and
the object represented in this representational system. It is expected that these
conceptual frameworks and cognitive networks, the products of this study, guide
trigonometry teachers, other researchers and educators in designing more effective
tasks, as well as in analyzing students’ trigonometry.

12
1.5. Definitions of Terms
What we mean by some important terms during this study is clarified for the
readers as the following.
Concept image
Concept image is defined as “the total cognitive structure that is associated
with the concept, which includes all the mental pictures and associated properties and
processes” (Tall & Vinner, 1981, p. 152). A learner’s concept image on a mathematical
concept includes all cognitive processes by which the concept are conceived.
Concept definition
Tall and Vinner (1981) define concept definition as “the form of words used to
specify a concept” (p. 152). In this study, we define concept definition as the form of
objects within any representational content used to specify a concept.
Potential conflict factor
Tall and Vinner (1981) describe potential conflict factor as “a part of concept
image or concept definition which may conflict with another part of the concept image
or concept definition” (p. 153). The potential conflict factors can be “conveniently
considered based on the circumstances without causing any cognitive conflict. They
only become cognitive conflict factors when evoked simultaneously” (p.154). Tall and
Vinner (1981) argue the conflicting part of the concept image with the formal concept
definition itself as the more serious type of the potential conflict factor. They assert
the weak understanding of the concept definition as a source of the students’ problems
in mathematics especially when there are potential conflict factors between a strong
concept image and a weak concept definition image.
13
Core trigonometric functions
There are six trigonometric functions, namely sine, cosine, tangent, cotangent,
secant, and cosecant. In this study, we mean only sine and cosine as core trigonometric
functions.
Basic forms of trigonometric functions
Basic forms of trigonometric functions refers to the function mapping an angle
to its corresponding trigonometric value. For instance, the basic form of the sine
[cosine] function can be expressed symbolically as y= sin (x) [y= cos (x)].
General forms of trigonometric functions
We refer by general forms of trigonometric functions to trigonometric
functions so that their symbolic expressions are linear trigonometric equations and the
symbolic expressions of the angles used to determine trigonometric values are in the
linear form regarding the independent variables of the functions. For example, the
general form of the sine [cosine] function can be expressed symbolically as;
y= a sin (bx+c)+d [y= a cos (bx+c)+d]
Semiotic representational systems
Duval (2006) mentions representations as semiotic representational systems
within which a sign takes its meaning in opposition to other signs and their complex
associations. Semiotic representations can be considered as common tools for not only
the development of a new mathematical concept but also the communication of any
particular mental representations (or concept images). Therefore, natural language is a
highlighted semiotic representational system.
Representational registers
Duval (2006) classifies semiotic representations into four semiotic systems as
represented in Figure 2.3 (see Review of the Literature chapter), which are called the

14
representational registers, with respect to the nature of operations (discursive versus
non-discursive) and the properties of processes (multi-functional versus mono-
functional) that are used to describe a system. He defines the semiotic representations
as the registers only which permit transformations of representations due to the fact
that for understanding the thinking process in any mathematical activity, it is important
to focus on the level of semiotic representations instead of focusing on the particular
representation produced. Where, the level of semiotic representations means the ability
to transform a mathematical object from one semiotic representation into one another.
Treatment
Transformations are crucial in the mathematical understanding. Duval (2006)
separates transformations of semiotic representations in two types: treatment and
conversion. Treatments refer to the transformations of representations within the same
representational register.
Conversion
Conversions refer to the transformations of representations between the
different representational registers (Duval, 2006).
Conversion trouble
The cognitive complexity of conversions results in the troubles of students in
mathematical thinking, as well as leading them to “consider two representations of the
same object in different registers as being two mathematical objects” (Duval, 2006, p.
124). These conversion troubles (or cognitive distances between registers) are
observed only when tasks in which a representation within a source register is
systematically varied into its converted representation in the target register (also tasks
in which the roles of the source register and the target register are inverted) are given
to the students.

15
Content of a representation
“Conversion is a representation transformation, which is more complex than
treatment because any change of register first requires recognition of the same
represented object between two representations whose contents have very often
nothing in common.” (Duval, 2006, p. 112). Content of a representation is composed
of signs so that they take their meanings in opposition to other signs and their complex
associations. “The content of a representation depends more on the register of the
representation than on the object represented” (Duval, 2006, p. 114).
Recognition
Recognition is the one of the most important two cognitive skills (i.e.,
recognition and discrimination) in comprehension of mathematical concepts in a
mathematical activity (Duval, 2006). It can be defined as the ability to recognize the
same object represented in two different representational registers “whose contents
have very often nothing in common” (Duval, 2006, p. 112).
Discrimination
Discrimination is the one of the most important two cognitive skills (i.e.,
recognition and discrimination) in comprehension of mathematical concepts in a
mathematical activity (Duval, 2006). It can be defined as the ability to distinguish the
represented object in a register from the content of the semiotic representation. It
requires to be able to “discriminate in any semiotic representation what is
mathematically relevant and what is not mathematically relevant?” (Duval, 2006,
p.115).
Concept development process
Sfard (1991) classifies mathematical understanding as operational conception
(dynamic, sequential and detailed) versus structural conceptions (static, instantaneous
and integrative). However, she emphasized this distinction’s dual meaning rather than

16
dichotomy. She proposed that when learning a new mathematical concept, the first
developed conception type is operational. And then, the mathematical concept’s
development comes true through converting the operational conception (various
processes) into the structural conception (compact static whole) after a lengthy and
difficult process. Through inspiring mathematical concepts’ historical development
processes, Sfard (1991) separates this lengthy and difficult process into three
hierarchical stages: interiorization, condensation and reification.
Interiorization
Interiorization is the first stage of the concept development theory of Sfard
(1991) that means for students becoming familiar with the processes on the
mathematical object. A student in the interiorization stage becomes skillful in
performing the processes on lower-level mathematical objects.
Condensation
Condensation is the second stage of the concept development theory of Sfard
(1991) that means for students becoming skilled with seeing of the process as a
condensed whole without going into details. At this stage, the processes are easily
combined with other ones, lengthy sequences of operations are compressed into more
manageable ones, as well as generalizations and comparisons are smooth.
Reification
Reification is the last stage of the concept development theory of Sfard (1991)
that is defined as an instantaneous shift the ability to see familiar processes as a reified-
object. By this object (or mathematical construct), different representations of the
mathematical concept are semantically merged, which means any more fundamental
properties of this reified-object in its different representations and relations among
them can be investigated easily.
17
(Unit) circle register
In this study, throughout the teaching experiment, angles were represented on
the (unit) circle located on the perpendicular coordinate system or its translated form
which was the parallel displacement system. Where, the angle’s vertex was the center
and its initial side was the ray in the positive horizontal direction. We called this multi-
functional and non-discursive representational register as the (unit) circle register. We
used the unit term in parenthesis as a consequence of the changeable-meaning of the
unit with respect to the assumptions of the unit measure.
Graphical register
Graphical representation is a visual display so as to represent the coordinated-
variations of two variables on the coordinate plane. In this study, we called this mono-
functional and non-discursive representational register as the graphical register.
Symbolic register
Symbolic representation is based on a mathematical notational system
including symbols referring to numbers (e.g., 0, -1/2, π), relations (e.g., =, >, <),
functional expressions (e.g., f, log, sine), operations (e.g., ±, √, lim, dy/dx), etc. In this
study, we called this mono-functional and discursive representational register as the
symbolic register.
Language register
Semiotic representations can be considered as common tools for not only the
development of a new mathematical concept but also the communication of any
particular mental representations (or concept images). Therefore, natural language is a
highlighted semiotic representational system (Duval, 2006). In this study, we called
this multi-functional and discursive representational register as the language register.

18
19
CHAPTER 2
2. LITERATURE REVIEW
This chapter begins with the presentation of the conceptual framework for the
study. Also, this chapter includes the discussion on the relevant research literature on
trigonometry under the following subheadings: “Comprehension of Trigonometry”,
“Roots of Students’ Difficulties in Trigonometry”, “Angle versus Angle Measure”,
“Sine and Cosine”, “Graphical Representation of Trigonometric Functions”,
“Periodicity”, “Technology in Education”, “Trigonometry with Technology” and
“Summary of Literature Review”.
2.1. Conceptual Framework
The overarching purpose of this study is to examine students’ concept images
on trigonometric functions during the instruction in dynamic geometry environment
(including sequential tasks which emphasize multiple semiotic representations and
transformations both between and within them so that students can distinguish the
represented object (sine and cosine) from its used semiotic representation). Therefore,
the conceptual framework of this study includes concept image, concept development
process and semiotic representations from a cognitive point of view aspects.
2.1.1. Concept image
Mathematics is expressed through processes including formal descriptions and
representations (Sfard, 1991). However, comprehension of mathematics is more

20
different aspect in terms of cognitive functioning underlying the diversity of
mathematical processes (Duval, 2006). Tall and Vinner (1981) formulate the
distinction between formally defined mathematical concepts (i.e., concept definition)
and the cognitive processes by which they are conceived (i.e., concept image). They
articulated the term concept definition as “the form of words used to specify a concept”
(p. 152) and the term concept image as “the total cognitive structure that is associated
with the concept, which includes all the mental pictures and associated properties and
processes” (p. 152). The concept map in Figure 2.1 summarizes the relations and
distinction between the notion of the concept image and the concept definition.
When articulating these terms, Tall and Vinner (1981) use “concept definition”
in three different terminologies (i) formal concept definition, (ii) personal concept
definition and (iii) concept definition image. They use these terms; respectively, in the
meaning of (i) the definition of a concept that is accepted by the mathematical
community, (ii) a student’s own definition of the concept that is reconstructed from
the formal concept definition by himself/herself, and (iii) a part of the concept image
that is generated by the personal concept definition of each individual. Therefore, they
argue the concept definition image as quite a different matter from the formal concept
definition through considering the concept definition image’s different possibilities for
some individuals; namely, its non-existence, being “coherently related [/unrelated] to
the other parts of the concept image” (p. 153), as well as comprising some notions “not
acknowledged by mathematicians as a part of the formal theory” (p. 153). They
exemplify that,
…a teacher may give the formal definition and work with the general notion for a short while
before spending long periods in which all examples are given by formulae. In such a case, the
concept image may develop into a more restricted notion, whilst the concept definition is
largely inactive in the cognitive structure. Initially the student in this position can operate quite
happily with his restricted notion adequate in its restricted context. He may even have been
taught to respond with the correct formal definition whilst having an inappropriate concept
image. Later, when he meets the concept in a broader context he may be unable to cope.
(p.153)

21
Moreover, Tall and Vinner (1981) describe potential conflict factor as “a part
of concept image or concept definition which may conflict with another part of the
concept image or concept definition” (p. 153). The potential conflict factors can be
“conveniently considered based on the circumstances without causing any cognitive
conflict. They only become cognitive conflict factors when evoked simultaneously”
(p.154). Tall and Vinner (1981) argue the conflicting part of the concept image with
the formal concept definition itself as the more serious type of the potential conflict
factor. They assert the weak understanding of the concept definition as a source of the
students’ problems in mathematics especially when there are potential conflict factors
between a strong concept image and a weak concept definition image.
In this respect, concept development process is an absolutely important aspect
to help students construct well-structured concept images coherently related to the
concept definition.

22
Figure 2.1. The Concept map of theory of concept image and concept definition (Tall & Vinner, 1981)
22
23
2.1.2. Concept development process
Sfard (1991) classifies mathematical understanding as operational conception
(dynamic, sequential and detailed) versus structural conceptions (static, instantaneous
and integrative). However, she emphasized this distinction’s dual meaning rather than
dichotomy. She proposed that when learning a new mathematical concept, the first
developed conception type is operational. And then, the mathematical concept’s
development comes true through converting the operational conception (various
processes) into the structural conception (compact static whole) after a lengthy and
difficult process. Through inspiring mathematical concepts’ historical development
processes, Sfard (1991) separates this lengthy and difficult process into three
hierarchical stages: interiorization, condensation and reification.
First of all, the interiorization stage means for students becoming familiar with
the processes on the mathematical object. A student in the interiorization stage
becomes skillful in performing the processes on lower-level mathematical objects.
Next, the condensation stage means for students becoming skilled with seeing
of the process as a condensed whole without going into details. At this stage, the
processes are easily combined with other ones, lengthy sequences of operations are
compressed into more manageable ones, as well as generalizations and comparisons
are smooth.
Finally, the reification stage is defined as an instantaneous shift the ability to
see familiar processes as a reified-object. By this object (or mathematical construct),
different representations of the mathematical concept are semantically merged, which
means any more fundamental properties of this reified-object in its different
representations and relations among them can be investigated easily. Sfard exemplifies
the effect of reification on the schema of a student (in which the information is stored
–or organized– in many different ways) like in Figure 2.2. “A schema is an
individual’s mental construction connecting related processes and objects, and appears
to be somewhat similar to one’s concept image” (Harel, Selden & Selden, 2006, p.
157).
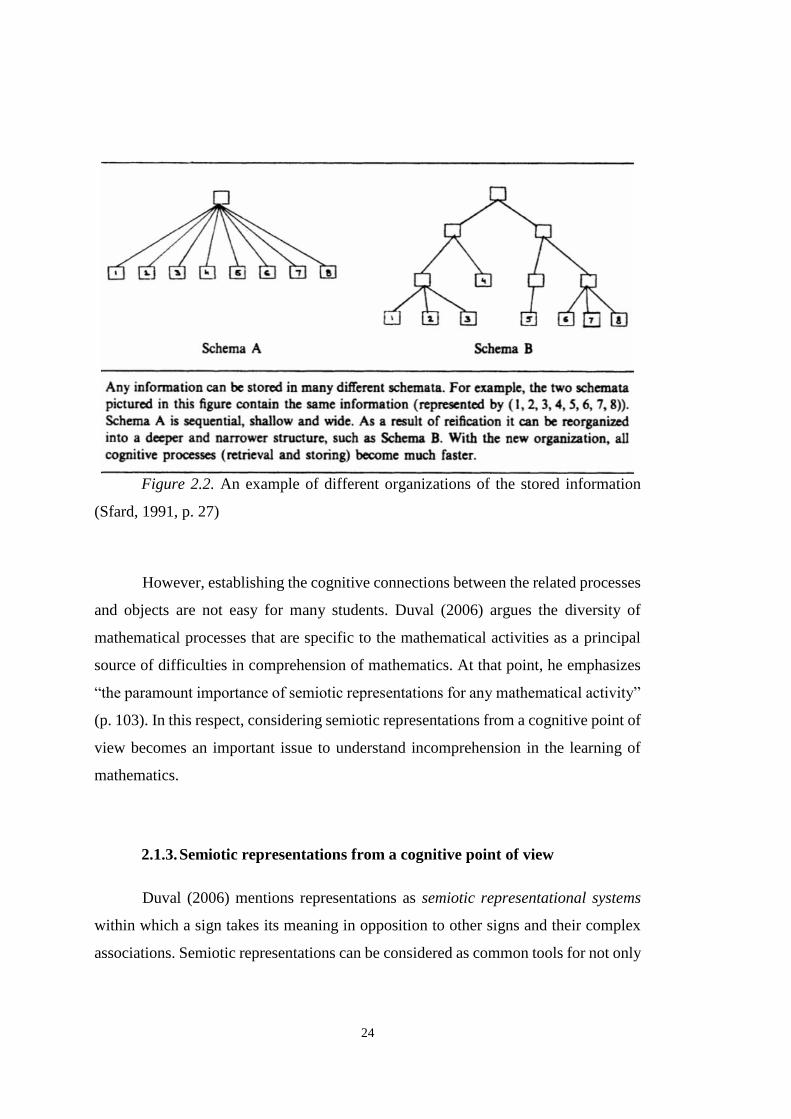
24
Figure 2.2. An example of different organizations of the stored information
(Sfard, 1991, p. 27)
However, establishing the cognitive connections between the related processes
and objects are not easy for many students. Duval (2006) argues the diversity of
mathematical processes that are specific to the mathematical activities as a principal
source of difficulties in comprehension of mathematics. At that point, he emphasizes
“the paramount importance of semiotic representations for any mathematical activity”
(p. 103). In this respect, considering semiotic representations from a cognitive point of
view becomes an important issue to understand incomprehension in the learning of
mathematics.
2.1.3. Semiotic representations from a cognitive point of view
Duval (2006) mentions representations as semiotic representational systems
within which a sign takes its meaning in opposition to other signs and their complex
associations. Semiotic representations can be considered as common tools for not only
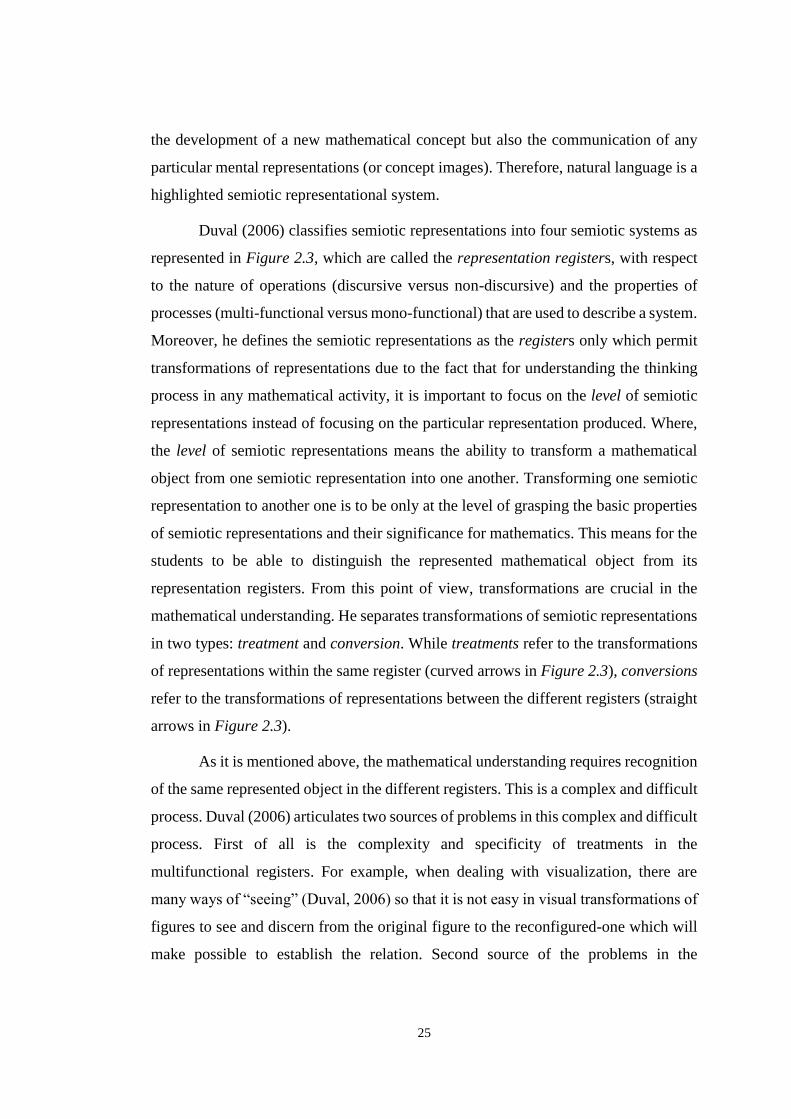
25
the development of a new mathematical concept but also the communication of any
particular mental representations (or concept images). Therefore, natural language is a
highlighted semiotic representational system.
Duval (2006) classifies semiotic representations into four semiotic systems as
represented in Figure 2.3, which are called the representation registers, with respect
to the nature of operations (discursive versus non-discursive) and the properties of
processes (multi-functional versus mono-functional) that are used to describe a system.
Moreover, he defines the semiotic representations as the registers only which permit
transformations of representations due to the fact that for understanding the thinking
process in any mathematical activity, it is important to focus on the level of semiotic
representations instead of focusing on the particular representation produced. Where,
the level of semiotic representations means the ability to transform a mathematical
object from one semiotic representation into one another. Transforming one semiotic
representation to another one is to be only at the level of grasping the basic properties
of semiotic representations and their significance for mathematics. This means for the
students to be able to distinguish the represented mathematical object from its
representation registers. From this point of view, transformations are crucial in the
mathematical understanding. He separates transformations of semiotic representations
in two types: treatment and conversion. While treatments refer to the transformations
of representations within the same register (curved arrows in Figure 2.3), conversions
refer to the transformations of representations between the different registers (straight
arrows in Figure 2.3).
As it is mentioned above, the mathematical understanding requires recognition
of the same represented object in the different registers. This is a complex and difficult
process. Duval (2006) articulates two sources of problems in this complex and difficult
process. First of all is the complexity and specificity of treatments in the
multifunctional registers. For example, when dealing with visualization, there are
many ways of “seeing” (Duval, 2006) so that it is not easy in visual transformations of
figures to see and discern from the original figure to the reconfigured-one which will
make possible to establish the relation. Second source of the problems in the
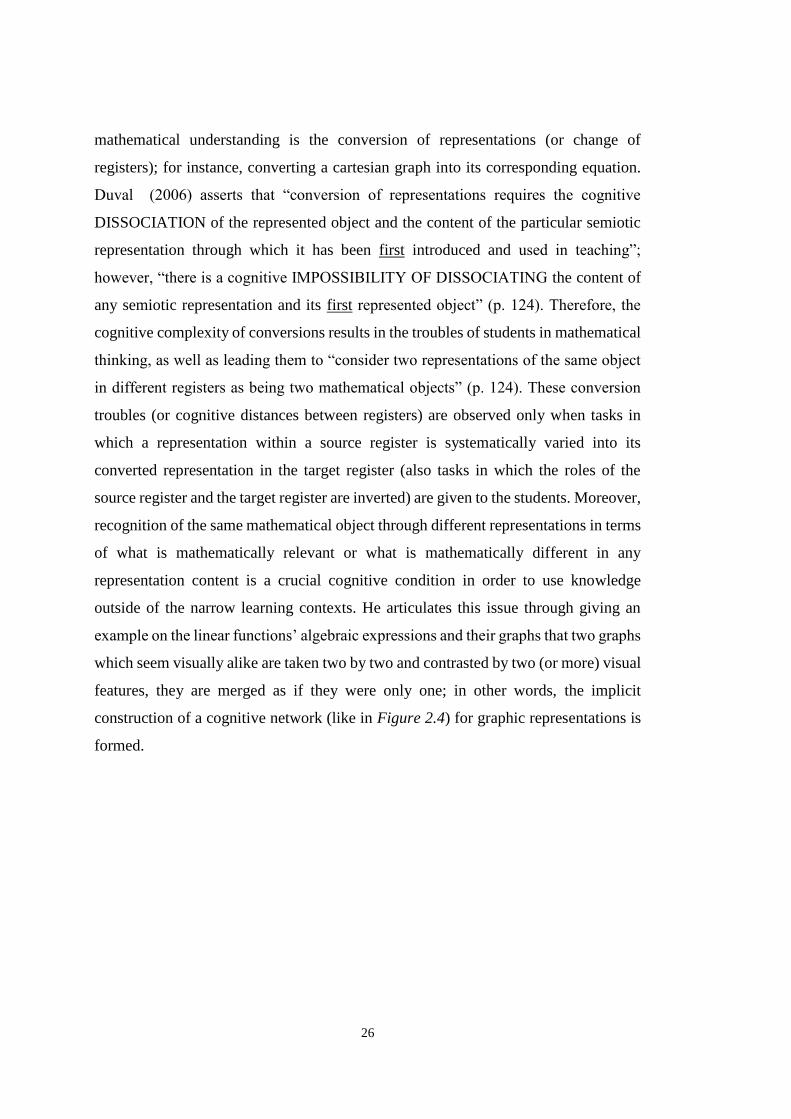
26
mathematical understanding is the conversion of representations (or change of
registers); for instance, converting a cartesian graph into its corresponding equation.
Duval (2006) asserts that “conversion of representations requires the cognitive
DISSOCIATION of the represented object and the content of the particular semiotic
representation through which it has been first introduced and used in teaching”;
however, “there is a cognitive IMPOSSIBILITY OF DISSOCIATING the content of
any semiotic representation and its first represented object” (p. 124). Therefore, the
cognitive complexity of conversions results in the troubles of students in mathematical
thinking, as well as leading them to “consider two representations of the same object
in different registers as being two mathematical objects” (p. 124). These conversion
troubles (or cognitive distances between registers) are observed only when tasks in
which a representation within a source register is systematically varied into its
converted representation in the target register (also tasks in which the roles of the
source register and the target register are inverted) are given to the students. Moreover,
recognition of the same mathematical object through different representations in terms
of what is mathematically relevant or what is mathematically different in any
representation content is a crucial cognitive condition in order to use knowledge
outside of the narrow learning contexts. He articulates this issue through giving an
example on the linear functions’ algebraic expressions and their graphs that two graphs
which seem visually alike are taken two by two and contrasted by two (or more) visual
features, they are merged as if they were only one; in other words, the implicit
construction of a cognitive network (like in Figure 2.4) for graphic representations is
formed.
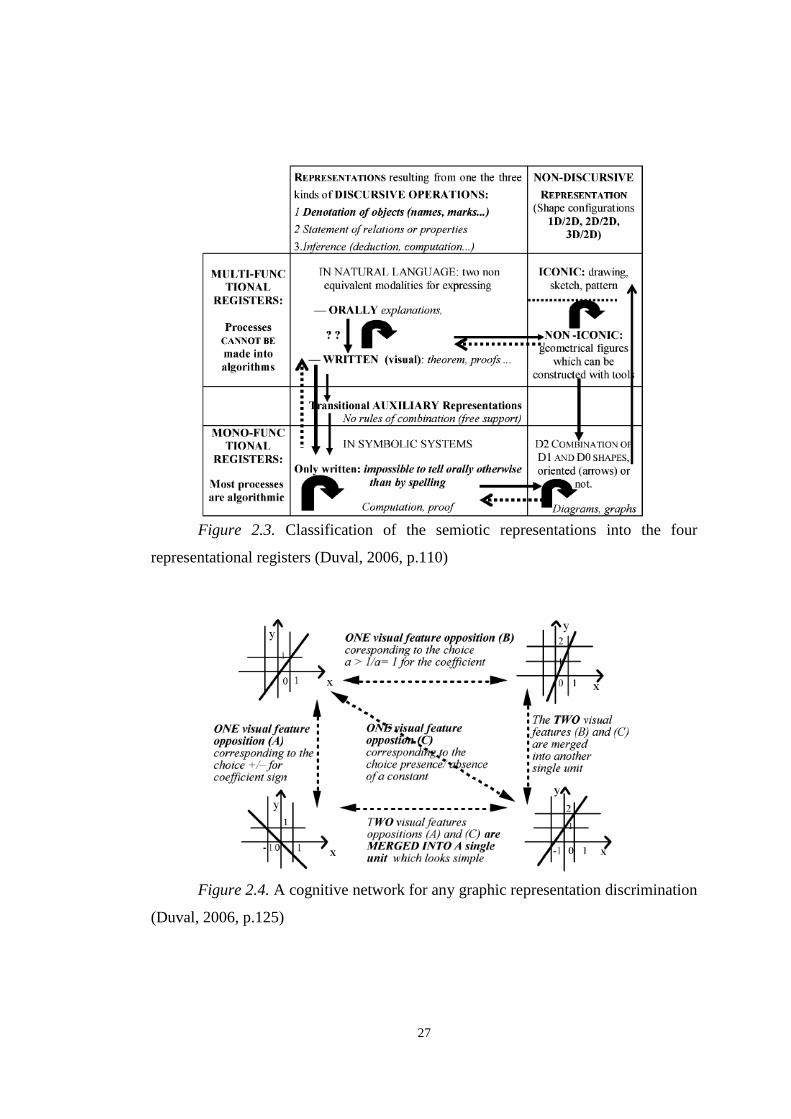
27
Figure 2.3. Classification of the semiotic representations into the four
representational registers (Duval, 2006, p.110)
Figure 2.4. A cognitive network for any graphic representation discrimination
(Duval, 2006, p.125)

28
To sum up, Duval (2006) emphasizes two main cognitive skills in
comprehension of mathematical concepts: recognition and discrimination. When
articulating these terms, he stresses the dissociation of the content of a representational
register and the mathematical object represented in this register. He articulates
recognition and discrimination terms, respectively, via following two perfect
questions: “When facing two representations from two different registers, how can one
recognize the same object represented within their respective content? … how can a
student discriminate in any semiotic representation what is mathematically relevant
and what is not mathematically relevant?” (p. 115).
2.2. Comprehension of Trigonometry
Trigonometry is a part of mathematics in which algebra and geometry
converge. It can be introduced traditionally in two ways: the ratio method and the unit
circle method. On the one hand, in the ratio method, trigonometric functions are
defined as the ratios of the lengths of sides from right angled triangles for the intended
acute angle. On the other hand, in the unit circle method, a circle with 1-unit radius is
used to define cosine and sine functions respectively as a horizontal and vertical
component of a point on the circle with respect to the intended angle. It is expected
from students to give meaning trigonometric functions coherently in both the right
triangle context and the unit circle context. However, interpretations of these
definitions by students (i.e., concept definition image) constitute trigonometric
functions’ meanings for each student.
Palmer (1980) determined that both methods were effective on helping
students to learn basic concepts of trigonometric facts; but Burch (1981) described
students’ difficulties with the unit circle (as cited in Thompson, 2007). The study of
Kendal and Stacey (1996) comparing the successes of each of these methods revealed
that students who were taught the ratio method performed much better than those who
were taught the unit circle method (as cited in Steer, Antioneta & Eaton, 2009).
However, the researchers still advocate the use of both methods because the unit circle

29
is appropriate for periodic nature of trigonometric functions (Thompson, 2007).
Unfortunately, research literature on trigonometric functions concluded that the
standard instruction, which is based on these two methods, did not constitute students’
strong understanding of trigonometric functions (Akkoç, 2008; Brown, 2005; Moore,
2014; Weber, 2005).
2.3. Roots of Students’ Difficulties in Trigonometry
As the root of students’ difficulties in trigonometry, Thompson (2008)
mentioned the right triangle trigonometry and the periodic functions’ trigonometry as
two unrelated trigonometries of elementary and secondary school mathematics. In the
right triangle trigonometry, sine and cosine are taught as ratios; and then, mentioned
on exercises especially on some special angle triangles, such as 30-60-90 and 45-45-
90 degree triangles, to solve some missing side. However, angle measure is not
considered in many students’ understanding as the argument of trigonometric
functions. In the right triangle trigonometry, Thompson (2008) claimed students’
consideration of whole triangle as the argument instead of the angle measure.
Therefore, in comprehension of trigonometry, he stressed the importance of
mentioning the arguments of trigonometric functions as the (meaningful) numbers
referring to the angle measure instead of the letters to name of angles, i.e., θ.
Many researchers (Akkoç, 2008; Fi, 2003; Thompson, 2008; Topçu, Kertil,
Akkoç, Yılmaz &Önder, 2006) emphasized the angle measure as problematic for
thinking about trigonometric functions. Akkoç (2008), Topçu et al. (2006) and Fi
(2003) concluded that preservice and/or inservice secondary mathematics teachers’
understanding on the meaning of the radian measure unit was constrained by their
understanding of the degree measure unit, and based only on the transformations
between the degree and the radian measure units without any other meaning of the
radian measure. Topçu et al. (2006) characterized the equation 𝐷
180=
𝑅
𝜋 as a possible
source of this understanding based on the participants’ consideration of this equation
30
as a cognitive unit during the interviews. Akkoç (2008) and Fi (2006) proposed the
presence of π in the radian measures as another source of the participants’ difficulty
with the radian measure unit due to their consideration of π as the unit for the radian
measure. This difficulty led to some misinterpretations of the preservice teachers; for
example, consideration of 1 radian as equal to 180 degree (Fi, 2006) and consideration
of the real value of π in the trigonometry context as equal to 180 (Akkoç, 2008).
In comprehension of trigonometry, Thompson (2008) stressed the need to
develop coherent angle measures in degrees and radians through merging their
meanings as the proportional relation between the arc length subtended by the angle
and the circle’s circumference. Indeed, Moore (2013) examined three precalculus
students’ angle measure understanding during a conducted-teaching experiment
including sequential tasks that require establishing multiplicative relationship among
a subtended arc length, a circle’s circumference and a circle’s radius. His study
concluded that these quantitative relationships fortified students’ transition abilities
between the measurement units (e.g., an arc length measure in feet) and angle measure
units (degree and radian) based on the invariant meaning of the proportional relation
between the arc length and the circle’s circumference (in terms of the radius as a
measurement unit) (see Figure 2.5).
Figure 2.5. An arc length image of angle measure that involves equivalence of
arcs (Moore, 2013, p. 228)
Thompson (2008; 2011) mentioned the inner arc of an acute angle of a right
triangle only as a pointer in a diagram (of the textbooks). Moreover, he emphasized

31
the lack of clear meaning of angle measure in terms that the measured-thing is what.
This idea was also highlighted in the study of Moore (2010) that examined precalculus
students’ ways of understanding the trigonometric functions from the viewpoint of the
students’ constructions of quantitative covariation throughout a teaching experiment
which was designed to support their understanding of the angle measure and the radius
as a measurement unit. Moore (2010) resulted that prior to the teaching experiment,
when describing the meaning of angle measure, students’ conceptions did not include
a measurement process involving measurable attribute (e.g., subtended arc length and
circumference). Results from the teaching experiment (Moore, 2010) indicated that in
conceptualizing angles and their measures, students’ construction of the meaning of
an angle as a measurable attribute and the radius as a unit of measurement was an
important idea. Moreover, this idea of an angle measure was mentioned as
foundational to leverage the reasoning abilities for learning and using the sine and
cosine functions as far as students’ reasoning about its covariational change with sine
and cosine was supported.
2.4. Angle versus Angle Measure
Angle and angle measure are two different concepts that is needed to be
dissociated from each other (Argün, Arıkan, Bulut, & Halıcıoğlu, 2014). Angle is a
shape constituted by two rays with a common endpoint. However, defining the angle
measure is more complex than defining the angle. Several aspects become a current
issue to define angle measure (e.g., angle measure axioms, angle measure units, angle
measure processes and procedures, etc.).
There are two different angle measure axioms (Argün et al., 2014). One of
them is that there exists for each angle a unique real number between 0 and 180 so that
it corresponds the degree measure of the angle. This axiom gives the straight angle

32
with 180 degree, otherwise, it considers the measure of the interior openness5 of an
angle. The other angle measure axiom is that Birkhoff’s angle measure postulate that
proposes the angle measure with respect to modulo 360. This axiom enables us to
define the reflex angles.
There are two commonly used angle measure units: degree and radian. The
degree is the more familiar unit of angle measure. For example, in the geometry
context, angles are mentioned with their degree measures. Akkoç (2008) stated this
situation as the possible cause of students’ strong concept images of degree which
dominated their concept images of radian. On the other hand, the radian is the unit of
angle measure that is mostly used in the trigonometry context. A complete revolution
corresponds to 2π in radians and 360 in degrees. This situation produces the
proportional equation 𝐷
360=
𝑅
2𝜋 between an angle’s degree and radian measures
through considering the same ratio between a subtended arc angle and the whole
circle’s angle both in degrees and in radians (Figure 2.6). Topçu et al. (2006) argued
this equation as a possible source of the restricted understanding of the meaning of the
radian measure only into the transformations between degree and radian measures. As
a consequence of incorrect interpretations of this equation, misunderstanding of π in
the trigonometry context arose. Many researchers (Akkoç, 2008; Fi, 2003; Topçu, et
al., 2006) reported the confusion about π as a real number in the trigonometry context.
They stressed two main troubles about π in the trigonometry context; (i) reasoning
about the real value of π as equal to 180 (ii) reasoning about π as a radian measure
unit. It means that strong understanding of the meaning of the radian requires beyond
the symbolic transformation from the degree measure. The study of Moore (2013)
emphasized the positive effect of students’ construction of the invariant meaning of
the proportional relation between the arc length and the circle’s circumference on their
transition abilities between the measurement units (e.g., an arc length measure in feet)
and angle measure units (degree and radian) based on the proportional quantitative
5 Interior openness refers to one of two regions separated by the angle’s rays that its measure is less than 180
degree.

33
relationships. This result stresses the importance of the mentioning relationships
together with the visual ideas such as arcs subtended by the angle and the whole circle.
Figure 2.6. Proportional equality between degree and radian measures of the
same angle
Tall and Vinner (1981) assert the weak understanding of the concept definition
as a source of the students’ problems in mathematics. At that point, the definition of
angle measure has a key role in students’ comprehension of angle measure concept. It
is expected from students to give meaning the angle measure coherently both in degree
and radian measure units in comprehension of trigonometric functions. There are
several different definitions of angle measure in textbooks based on the different ideas;
for example, rotation amount with respect to the complete revolution on the circle
centered at the vertex of the angle, visual procedures with a protractor, and magnitude
of the unit measure (1 degree or 1 radian) through multiplicative relationships (Moore,
2012). When indicating an angle’s measure on a visual representation, generally an
inner arc was created. Thompson (2008) argued this inner arc only as a pointer in a
diagram, and emphasized the lack of clear meaning of angle measure in terms that the
measured-thing is what. This idea emphasizes the importance of the making sense of

34
this inner arc in terms of its meaning for the angle measure beyond indicating the
measured-openness from two ones that are separated by an angle.
Although an angle has a static figure, the angle measure idea requires an
important cognitive condition, i.e., seeing this static structure from a dynamic point of
view. Especially, this cognitive condition is absolutely important for moving from the
right triangle trigonometry to the unit circle trigonometry through considering the
angle as a continuous variable through directed rotations and then their geometric
representations. Many of the studies in the literature (Brown, 2005; Fi, 2003;
Mitchelmore & White, 1996; Moore, 2010) emphasized the importance of thinking
about angles in terms of rotations in comprehension of trigonometric functions in
different representations, as well as using in the different contexts. Mitchelmore and
White (1996) characterized children’s perceptions of angles as static rather than as
dynamic turning. Fi (2003) reported preservice mathematics teachers’ weak
understanding of the rotational angles in terms of reasoning and using the coterminal
angles in the problem solving context despite of their strong understanding of the
counterclockwise and clockwise rotation and determination of the size of the angle of
a rotation. Consideration of the meaning of the coterminal angles is foundational to
understand the periodic nature of the trigonometric functions.
2.5. Sine and Cosine
Dealing with trigonometric functions is known as a difficult task since it
requires to work with right triangles, the unit circle, and graphs of trigonometric
functions simultaneously. Because trigonometric functions cannot be expressed as
algebraic formulas involving arithmetical procedures, students have trouble on
reasoning about them as functions (Weber, 2005). In comprehension of these
functions, there is a need to associate them properly with the appropriate geometric
models (Brown, 2005; Weber, 2005).
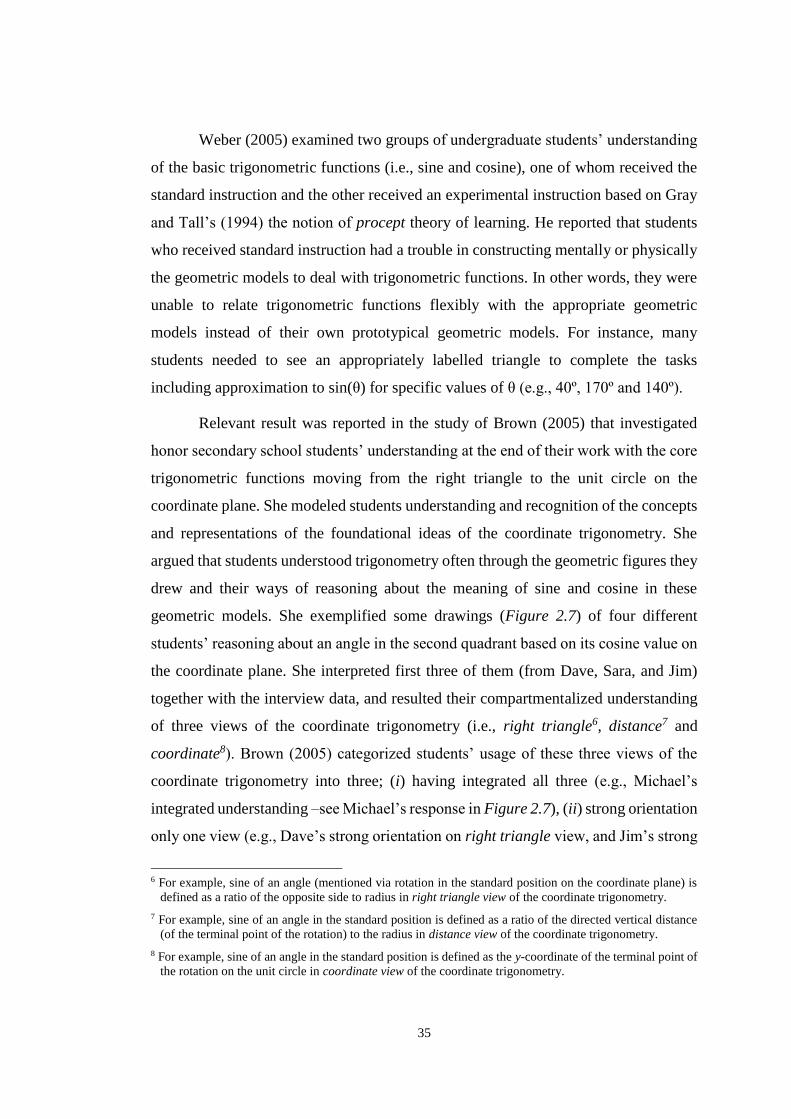
35
Weber (2005) examined two groups of undergraduate students’ understanding
of the basic trigonometric functions (i.e., sine and cosine), one of whom received the
standard instruction and the other received an experimental instruction based on Gray
and Tall’s (1994) the notion of procept theory of learning. He reported that students
who received standard instruction had a trouble in constructing mentally or physically
the geometric models to deal with trigonometric functions. In other words, they were
unable to relate trigonometric functions flexibly with the appropriate geometric
models instead of their own prototypical geometric models. For instance, many
students needed to see an appropriately labelled triangle to complete the tasks
including approximation to sin(θ) for specific values of θ (e.g., 40º, 170º and 140º).
Relevant result was reported in the study of Brown (2005) that investigated
honor secondary school students’ understanding at the end of their work with the core
trigonometric functions moving from the right triangle to the unit circle on the
coordinate plane. She modeled students understanding and recognition of the concepts
and representations of the foundational ideas of the coordinate trigonometry. She
argued that students understood trigonometry often through the geometric figures they
drew and their ways of reasoning about the meaning of sine and cosine in these
geometric models. She exemplified some drawings (Figure 2.7) of four different
students’ reasoning about an angle in the second quadrant based on its cosine value on
the coordinate plane. She interpreted first three of them (from Dave, Sara, and Jim)
together with the interview data, and resulted their compartmentalized understanding
of three views of the coordinate trigonometry (i.e., right triangle6, distance7 and
coordinate8). Brown (2005) categorized students’ usage of these three views of the
coordinate trigonometry into three; (i) having integrated all three (e.g., Michael’s
integrated understanding –see Michael’s response in Figure 2.7), (ii) strong orientation
only one view (e.g., Dave’s strong orientation on right triangle view, and Jim’s strong
6 For example, sine of an angle (mentioned via rotation in the standard position on the coordinate plane) is
defined as a ratio of the opposite side to radius in right triangle view of the coordinate trigonometry.
7 For example, sine of an angle in the standard position is defined as a ratio of the directed vertical distance
(of the terminal point of the rotation) to the radius in distance view of the coordinate trigonometry.
8 For example, sine of an angle in the standard position is defined as the y-coordinate of the terminal point of
the rotation on the unit circle in coordinate view of the coordinate trigonometry.
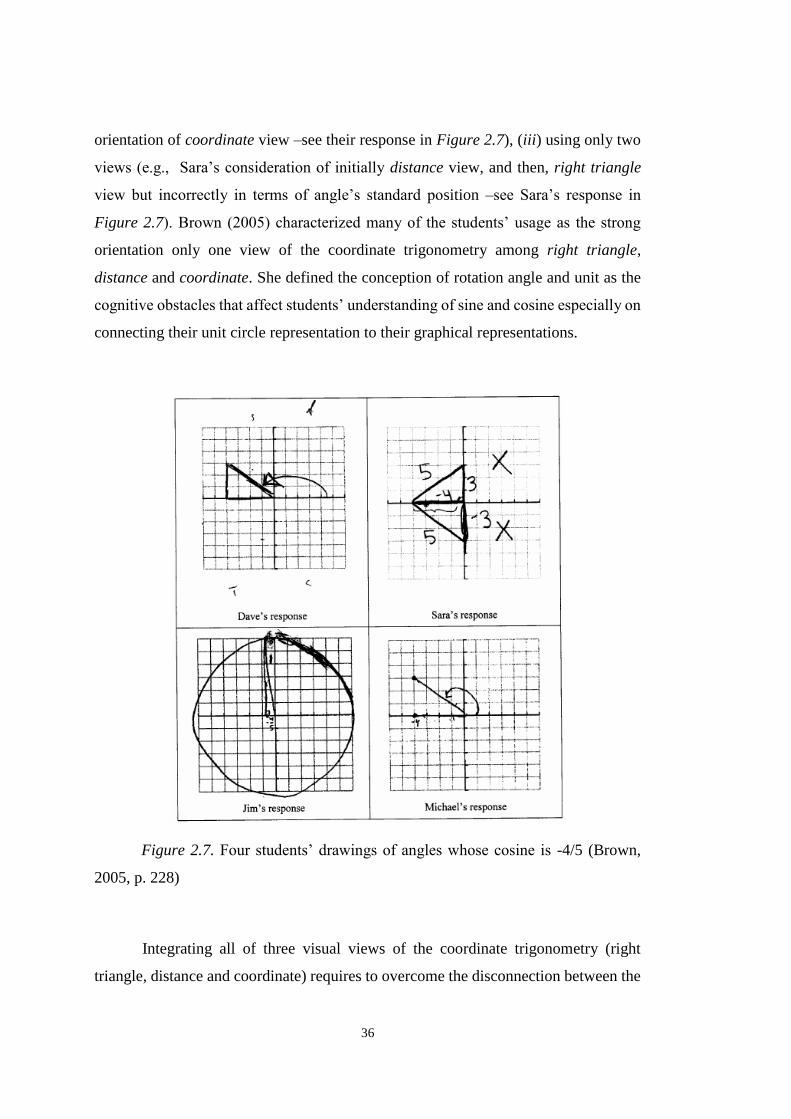
36
orientation of coordinate view –see their response in Figure 2.7), (iii) using only two
views (e.g., Sara’s consideration of initially distance view, and then, right triangle
view but incorrectly in terms of angle’s standard position –see Sara’s response in
Figure 2.7). Brown (2005) characterized many of the students’ usage as the strong
orientation only one view of the coordinate trigonometry among right triangle,
distance and coordinate. She defined the conception of rotation angle and unit as the
cognitive obstacles that affect students’ understanding of sine and cosine especially on
connecting their unit circle representation to their graphical representations.
Figure 2.7. Four students’ drawings of angles whose cosine is -4/5 (Brown,
2005, p. 228)
Integrating all of three visual views of the coordinate trigonometry (right
triangle, distance and coordinate) requires to overcome the disconnection between the

37
right triangle trigonometry and the periodic function trigonometry. Thompson (2008)
emphasized that “triangle trigonometry would draw from the meaning of angle
measure… and would also draw from similarity –that similar right triangles have same
ratios” (p. 36), as well as “periodic functions would draw from the meaning of angle
measure… and would additionally highlight how one must think of varying an angle
so as to systematically vary its measure” (p. 36). He emphasizes the meaning of angle
measure as a common reference both for triangle trigonometry and periodic functions’
trigonometry. This idea brings up two main angle concepts for discussion; namely,
reference angle and coterminal angle that produce the systematic behaviors of
trigonometric functions. Systematic variation of the angle measure provokes reasoning
about systematic covariation of trigonometric functions. Kaput (1992) argued that
making variation is needed for understanding of “invariance” which is the very
important aspect of mathematical thinking. At that point, the importance of the
meaning of the reference angle and the coterminal angles becomes a current issue in
comprehension of trigonometric functions especially in the graphical representations.
Fi (2003) reported the confusion about reference angles and coterminal angles
especially in using to simplify trigonometric expressions.
If the historical development of trigonometry is concerned, it is clearly seen
that trigonometry did not arise from an abstract need. On the contrary, beginning of
trigonometry was intimately tied to astronomy (Katz, 2009). Dealing quantitatively
with important aspects of astronomy such as the positions of stars and planets required
spherical trigonometry, and its development entailed to understand plane
trigonometry. The basic element in early plane trigonometry was to calculate the chord
length subtending a given arc in a circle with fixed radius (Brummelen, 2009; Katz,
2009; Sanford, 1958), after then, the trigonometric “chord” function was modified to
“sine” function (Katz, 2009). It was the fifteenth century when the sine of an arc was
defined as the half chord of double the arc (Sanford, 1958). According to this fact,
even if there is probably no best way to teaching of trigonometry, in the light of its
historical development we can conclude that teaching activities should include dealing
with a circle when studying trigonometric functions.
38
The unit circle was emphasized as an important tool in the literature for strong
understanding of coordinate trigonometry or periodic function trigonometry (Brown,
2005; Moore, LaForest, & Kim, 2012; Weber, 2005). Nevertheless, students have
difficulties with the unit circle in terms of understanding, using and interpreting
trigonometric functions (Burch, 1981; Brown, 2005; Emlek, 2007; Güntekin, 2010;
Gür, 2009; Weber, 2005). Moore, LaForest, and Kim (2012) lay emphasis on the
importance of the ability to use trigonometric functions in any circular context. They
reported preservice teachers’ difficulties in reasoning about trigonometric functions on
the non-unit circles. For instance, when encountered a non-unit circle context, students
tried to relate the given circle to the unit circle through mentioning the unit circle apart
from the given circle, instead of considering its radius as a unit. Moore, LaForest, and
Kim (2012) concluded that provoking students to consider units with different
measures promoted their unit circle understandings from their restricted understanding
of the unit circle notion with “one” radius to any given circle through considering its
radius as “one” unit.
2.6. Graphical Representation of Trigonometric Functions
Graphs represent the coordinated-variations of two variables on the coordinate
plane. Despite of their static configurations, they represent dynamic variation of the
rate of change between two variables. Duval (2006) considers graphs in the
monofunctional registers (i.e., in which most processes are algorithmic) and non-
discursive representation (i.e., including shape configuration) category (see Figure 2.3
on page 27). Producing a graph requires conversion of a mathematical object [or
function] from one register into the monofunctional and non-discursive register: for
instance, “passing from the algebraic notation for an equation to its graphic
representation” (Duval, 2006, p. 112). Duval (2006) argued students’ changing
performances based on reversing the direction of the conversion. He exemplified this
idea focusing students’ performances on the linear functions’ graphs and their
symbolic expressions. Whereas constructing linear functions’ graphs does not cause
39
any trouble for students, when only the direction of the conversion changes, i.e., seeing
the rule from its graphic representation is expected, students’ performances decrease
dramatically. Duval (2006) entitled the second task as recognition task due to its
requirement of recognition of the same object represented in two different registers
“whose contents have very often nothing in common” (p. 112).
Mathematical activities including simultaneous variation of two variable are
considered as critical cognitive supports for students’ constructions and interpretations
of graphs (Moore, 2012; Oehrtman, Carlson, & Thompson, 2008). Moore (2012)
analysed three students’ different interpretations of the sine and cosine graphs. First
interpretation of sine and cosine graphs was not based on the collection of the ordered
pairs whose values change in tandem, rather than “representing the “top half” and
“bottom half” of circles” (p. 84). Moore (2012) attributed this interpretation to
incomprehension of angle measure as a varying measure. Second interpretation on the
Ferris wheel problem (asking to reason about the variation of the vertical distance with
respect to the travelled arc length) was based on describing the vertical distance in
terms of its directed-behaviour and the rate of change, initially on the circular-diagram,
and then, on the created-graph. Moore (2012) attributed this interpretation to
comprehension of angle measure as rooted in reasoning about arcs. However, it may
be due to the realistic Ferris wheel context. Thompson (2007) resulted that “the use of
Ferris wheel problem produced a distinct advantage concerning the connection
between the unit circle and the graphing of trigonometric functions” (p. 205). Third
interpretation, having emerged when constructing the graph of y=sin(3x), was based
on the determination of some ordered pairs corresponding their x-values, e.g., 0, π/2
and π. Moore (2012) interpreted this graphing procedure as arising from “a pointwise
focus and then filling in variation between these points” (p. 89) instead of a continuum
variation of values. Considering these three different interpretation of sine function
together with the conversion notion of Duval (2006), it is obvious that these
interpretations maybe emerge as a consequence of the conversions from the different
source registers to the same target register (graphical representation). Therefore,
students changing performances may be due to their troubles in recognition of the
40
same object in the different representational registers (i.e., symbolic, circular, graphic)
whose contents are different.
Two main critical ideas are emphasized in the literature to provide students
with better understanding the connection of the unit circle to graphs of trigonometric
functions: (i) meaning of angle measure in terms of rotations on the unit circle and (ii)
directed distance approach on the unit circle and its connection to graphs of
trigonometric function (Brown, 2005; Hertel & Cullen, 2011; Moore, 2012; 2014).
From more inclusive point of view, the coordinated-variations of directed distance
with respect to arc length in radii rather than any other measurement units is
emphasized to generate coherent understanding of trigonometric functions (Moore,
2010; 2012; 2014). In addition, for instructions of sine and cosine, it is suggested that
a right triangle be embedded on the unit circle representation together with directed
lengths of its legs (Brown, 2005); and trigonometric function be interpreted as
functions mapping “one measurable quantity, angle, to another measurable quantity,
directed length” (Hertel & Cullen, 2011, p. 1401). Furthermore, the study of
Thompson (2007) revealed the importance of the appropriate real-life situations to
both teaching concept and students’ lives for facilitating their understanding of the
connections between the unit circle and the graphing of trigonometric functions.
2.7. Periodicity
Trigonometric functions are valuable functions for mathematics instruction
due to the fact that they are natural and fundamental examples of periodic functions,
and used to approximate any periodic functions. This is the reason why we, as
educators, emphasize persistently the importance of learning the periodic functions’
trigonometry in spite of students’ difficulties with the unit circle in terms of
understanding, using and interpreting (Burch, 1981; Brown, 2005; Emlek, 2007;
Güntekin, 2010; Gür, 2009; Kendal & Stacey, 1996; Weber, 2005). Consideration of
the meaning of coterminal angles on the unit circle approach is foundational to
understand the periodic nature of the trigonometric functions. Fi (2003) considers
41
coterminal angles as the related and necessary knowledge to model periodic
phenomena (e.g., Ferris wheel problem), as well as emphasize the importance of
coterminal angles to generate angle measures other than the principal ones. He
reported preservice mathematics teachers’ inadequate knowledge of coterminal angles
and the periodicity idea as the problematic parts of their understanding of
trigonometric functions.
Many other studies in the literature (Brown, 2005; Moore, 2010; Thompson,
2007) that focused on students’ understanding of trigonometric functions did not
investigate the periodicity phenomena, rather than focused on students’ understanding
of trigonometric functions in the four quadrant for the angles with principal measures.
2.8. Technology in Education
Appropriate integration of technology, which offers multiple-representation
and dynamicity opportunities, into trigonometry courses may enable us to cope with
these difficulties by facilitating to establish connections among symbolic, geometric
(on the unit circle) and graphic representations of trigonometric functions. Technology
enables students to do routine procedures quickly and accurately, to explore topics in
more depth (Garofalo, Drier, Harper, Timmerman, & Shockey, 2000) and to obtain
simultaneous connections between multiple representations (Ferrara, Pratt & Robutti,
2006); thus, allowing more time for conceptualizing and modeling.
There are several computer software programs to support and facilitate
learning environments. Dynamic Geometry softwares (DGS) are one of the
technologies used for teaching and learning of mathematics. They provide dynamic
diagrams that students can slightly distort to meet their expectations, which is
impossible in paper-and-pencil diagrams (Laborde, Kynigos, & Strasser, 2006), and
give students the opportunity of constructing graphs of functions which can be
manipulated and animated by the parameter, as well as the opportunity of dynamically
linking between graphs and other representations of a situation (Mackrell, 2002); and

42
helps them understand propositions by allowing them to perform geometric
constructions with a high degree of accuracy (Hanna, 2000).
However, existing technology does not guarantee learning. Literature shows
that technology usage can be effective only within appropriate teaching-learning
context (Ferrara et al., 2006). The study of Jones (2002), in which published research
on the use of dynamic geometry software was categorized, stated that a range of
research showed that judicious use of DGS can foster the understanding of proof.
However, if used inappropriately, DGS might make things worse instead of making
significant effect on students’ learning (Jones, 2002). Therefore, appropriate
integration of technology (particularly, of DGS) into mathematics courses is needed.
It requires carefully designed teaching/learning activities according to not only
teachers’ but also students’ background, the task, the mathematical context, the class
context and the potentialities offered by the software (Ferrara et al., 2006). In designing
teaching activities, the most important role belongs to teachers. The teacher must
decide if, when, and how technology will be used. In order to use technologies
knowledgeably, intelligently, mathematically, confidently, and appropriately, teachers
should be aware of the different roles of them, think clearly about their classroom
goals, consider particular needs of particular students, and choose technologies to
further those goals (Goldenberg, 2000).
The experimental study of Ubuz, Üstün and Erbaş (2009) showed that “if used
appropriately” dynamic geometry environments “can serve as an important vehicle to
improve student achievement in geometry and achieve a classroom culture where
conjecturing, analysing, exploring, and reasoning are daily routines” (p.148). Also,
Hannafin and Scott (2001) showed that using dynamic geometry softwares in a
student-centered environment has a positive effect on the attitudes and beliefs of both
teachers and students about teaching and learning geometry. In the subject design of
Weeden (2002) where a dynamic geometry software was incorporated into her lessons,
she observed that the classroom experience was extremely enjoyable for both students
and teachers, they worked in collaboration and experienced reality of construction and

43
properties of shape while learning to use the software; moreover, she observed that
students developed a deeper understanding and a greater view of the whole picture.
2.9. Trigonometry with Technology
There is some research examined the effect of using a dynamic geometry
environment on students’ understanding of trigonometry (Blackett & Tall, 1991), on a
10th-grade student’s learning experience and analytical thought process (Choi-Koh,
2003), on secondary school students’ thinking concerning the unit circle and the
graphing of trigonometric functions through animated real-life models (Thompson,
2007), and on preservice secondary mathematics teachers’ understanding of
trigonometric functions through their directed length interpretations (Hertel & Cullen,
2011).
Firstly, Blackett and Tall (1991) examined an experimental trigonometry
course including dynamic computer-based tasks with a simple piece of software
designed linking numerical input for lengths and angles to a visual display of a right
triangle when compared to the traditional trigonometry instruction. Each group had 1-
hour-10-minute four lessons and 35-minute four lessons in a two week period,
followed by an immediate post-test and a second post-test eight weeks later. Research
findings showed that the experimental students significantly outperformed than the
control students on a post-test in both standard and non-standard tasks. More
specifically, they stated that “experimental boys improved more than control boys and
experimental girls improved more than control girls. … control girls improved less
than the control boys, experimental girls improved more than the experimental boys”
(p. 6). These findings about gender differences related to mathematics performance
are unlike empirical evidence in the literature which shows that although females
perform at least as well as males in mathematics performance in the early years, as
they get teenage, differences in abilities emerge as biased to males especially on high
cognitive level tasks (Fennema, 1974; Fennema & Carpenter, 1981; Halpern, 1986;
Stage, Kreinberg, Eccles & Becker, 1985) and that males have more computer interests
44
and more self-confidence in their ability to use computers than female students (Chen,
1986; Koohang, 1989; Shashaani, 1993). Also, Blackett and Tall (1991) argued that
the computer representation enabled students to explore the relationship between
numerical and geometric data in an interactive manner. However, where, the geometric
representation of trigonometric functions by the software was tied to the ratio method
instead of the unit circle method.
Secondly, Choi-Koh (2003) examined a 10th grade student’s learning
experience and analytical thought process while using the graphing calculator (Casio
9850 Plus) to study trigonometry on the task the role of coefficients in the equation
𝑦 = 𝑎 sin(𝑏𝑥 + 𝑐) + 𝑑 by establishing connection between graphical and symbolic
representations. In this context, the geometric representation of trigonometric
functions on the circle was not mentioned. The student in this study was an average-
mathematics-performance student who had not taken trigonometry previously but had
used a computer and a calculator. The researcher provided the student with the
exploration-based learning environment during the study which was conducted in six
weeks. Data collected through observations and clinical interviews. This qualitative
case study concluded that the student’s reasoning and thinking moved from the
intuitive level (observing) to the operative level (explaining, abstracting,
systematizing), and finally, to the applicative level (inductive generalizing, making
formulas, reflecting), and his learning attitudes moved from passive (i.e., lack of intend
to work creatively and voluntarily) to more interested and motivated by the aid of his
voluntary use of graphing calculator.
Thirdly, the study of Thompson (2007) examined the role of a contextual
realistic problem, Ferris wheel, as an instructional starting point on secondary school
students’ understanding trigonometric functions from Realistic Mathematics
Education theoretical approach through conducting an action research. In this study,
the instruction started a unit of trigonometry by modelling the motion of an animated
Ferris wheel in Geometer’s Sketchpad. This sketch showed the moving Ferris wheel
tracing out the sine wave dynamically. Its static version was like Figure 2.8. Results
of the study revealed that Ferris wheel problem, which models trigonometric functions

45
via circular motion, leveraged students understanding in terms of connections between
the unit circle and graphs of trigonometric functions, as well as supported students’
comprehension of the general behaviour of trigonometric graphs regarding their
periods and magnitudes.
Figure 2.8. Static version linking the Ferris wheel to sine wave (Thompson,
2007, p. 144).
Finally, Hertel and Cullen (2011) designed an instructional sequence including
activities based on the directed length interpretations of trigonometric functions in a
dynamic geometry environment in order to generate robust and connected
understanding of trigonometric functions, and then analysed this instruction’s effect
on preservice secondary mathematics teachers’ understanding and problem solving
strategies related to the trigonometry content. In designing the activities, they attached
importance to promote reasoning about trigonometric functions as functions mapping
from angle measure to corresponding directed length considering these two measures
as measurable quantities. Each episode of the instruction included four cognitive steps.
Researchers articulated these cognitive steps for the first episode as follow;
(i) exploring the “chord” function (see chord CD in Figure 2.9) inspiring from
the sine function’s historical origin, i.e., calculating the “chord” length (for
more information about the historical development of sine, see the heading of
Sine and Cosine in Review of the Literature Chapter),
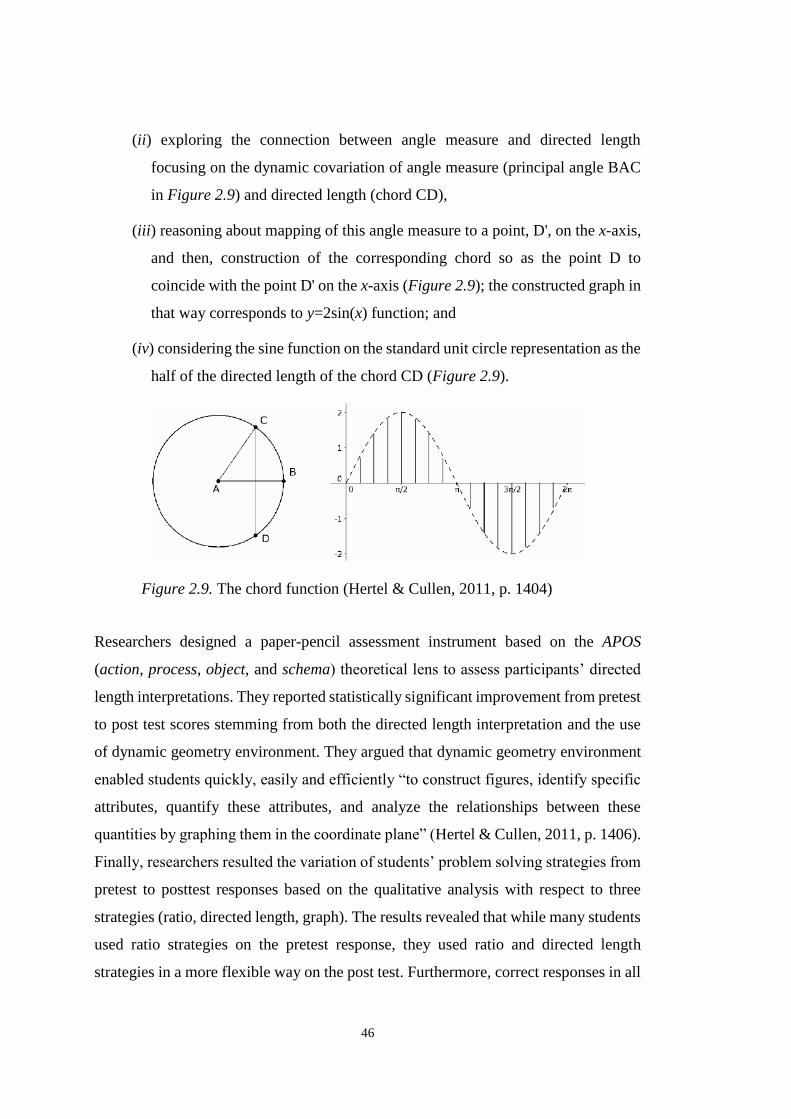
46
(ii) exploring the connection between angle measure and directed length
focusing on the dynamic covariation of angle measure (principal angle BAC
in Figure 2.9) and directed length (chord CD),
(iii) reasoning about mapping of this angle measure to a point, D', on the x-axis,
and then, construction of the corresponding chord so as the point D to
coincide with the point D' on the x-axis (Figure 2.9); the constructed graph in
that way corresponds to y=2sin(x) function; and
(iv) considering the sine function on the standard unit circle representation as the
half of the directed length of the chord CD (Figure 2.9).
Figure 2.9. The chord function (Hertel & Cullen, 2011, p. 1404)
Researchers designed a paper-pencil assessment instrument based on the APOS
(action, process, object, and schema) theoretical lens to assess participants’ directed
length interpretations. They reported statistically significant improvement from pretest
to post test scores stemming from both the directed length interpretation and the use
of dynamic geometry environment. They argued that dynamic geometry environment
enabled students quickly, easily and efficiently “to construct figures, identify specific
attributes, quantify these attributes, and analyze the relationships between these
quantities by graphing them in the coordinate plane” (Hertel & Cullen, 2011, p. 1406).
Finally, researchers resulted the variation of students’ problem solving strategies from
pretest to posttest responses based on the qualitative analysis with respect to three
strategies (ratio, directed length, graph). The results revealed that while many students
used ratio strategies on the pretest response, they used ratio and directed length
strategies in a more flexible way on the post test. Furthermore, correct responses in all

47
three strategies increased from pretest to posttest. They interpreted this result as the
integration of the directed length approach into students’ trigonometry schema.
2.10. Summary of Literature Review
To sum up, in the light of the overview of the related literature mentioned
above, it is clearly seen that there are some important aspects needed to be critically
concerned in trigonometry education. First of all is the importance of comprehension
of trigonometric functions as functions (Hertel & Cullen, 2011; Weber, 2005). Because
trigonometric functions cannot be expressed as algebraic formulas involving
arithmetical procedures, most students have trouble on reasoning about them as
functions (Weber, 2005). Therefore, it is attached importance to promote reasoning
about trigonometric functions as functions mapping from angle measure to
corresponding trigonometric value (Hertel & Cullen, 2011), as well as reasoning about
angle measure as the (meaningful) numbers referring to the argument of trigonometric
functions (Thompson, 2008).
In comprehension of trigonometric functions, there is a need to associate them
properly with the appropriate geometric models (Brown, 2005; Weber, 2005). Two
common geometric representations exist to model trigonometric functions visually:
right triangle representation and unit circle representation. However, students’
comprehensions of the right triangle trigonometry and the unit circle trigonometry are
fragmented and unrelated (Thompson, 2008). Coherent understanding and flexible use
of trigonometric functions require integration of different representations of
trigonometric functions (Brown, 2005). To integrate trigonometric functions’ meaning
in any representational context, the meaning of angle measure is emphasized as the
foundational cognitive idea (Thompson, 2008). However, angle measure is a
problematic issue that is needed to be handled carefully in teaching of trigonometry
(Akkoç, 2008; Fi, 2003; Thompson, 2008; Topçu, Kertil, Akkoç, Yılmaz &Önder,
2006).
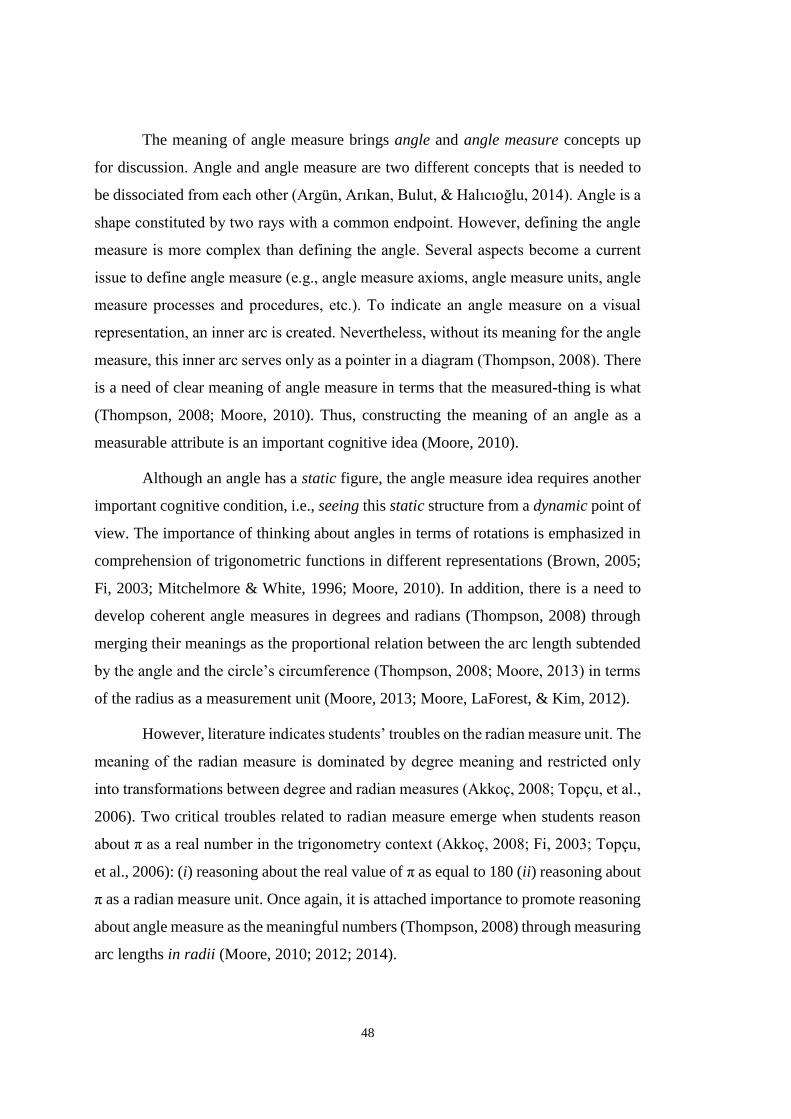
48
The meaning of angle measure brings angle and angle measure concepts up
for discussion. Angle and angle measure are two different concepts that is needed to
be dissociated from each other (Argün, Arıkan, Bulut, & Halıcıoğlu, 2014). Angle is a
shape constituted by two rays with a common endpoint. However, defining the angle
measure is more complex than defining the angle. Several aspects become a current
issue to define angle measure (e.g., angle measure axioms, angle measure units, angle
measure processes and procedures, etc.). To indicate an angle measure on a visual
representation, an inner arc is created. Nevertheless, without its meaning for the angle
measure, this inner arc serves only as a pointer in a diagram (Thompson, 2008). There
is a need of clear meaning of angle measure in terms that the measured-thing is what
(Thompson, 2008; Moore, 2010). Thus, constructing the meaning of an angle as a
measurable attribute is an important cognitive idea (Moore, 2010).
Although an angle has a static figure, the angle measure idea requires another
important cognitive condition, i.e., seeing this static structure from a dynamic point of
view. The importance of thinking about angles in terms of rotations is emphasized in
comprehension of trigonometric functions in different representations (Brown, 2005;
Fi, 2003; Mitchelmore & White, 1996; Moore, 2010). In addition, there is a need to
develop coherent angle measures in degrees and radians (Thompson, 2008) through
merging their meanings as the proportional relation between the arc length subtended
by the angle and the circle’s circumference (Thompson, 2008; Moore, 2013) in terms
of the radius as a measurement unit (Moore, 2013; Moore, LaForest, & Kim, 2012).
However, literature indicates students’ troubles on the radian measure unit. The
meaning of the radian measure is dominated by degree meaning and restricted only
into transformations between degree and radian measures (Akkoç, 2008; Topçu, et al.,
2006). Two critical troubles related to radian measure emerge when students reason
about π as a real number in the trigonometry context (Akkoç, 2008; Fi, 2003; Topçu,
et al., 2006): (i) reasoning about the real value of π as equal to 180 (ii) reasoning about
π as a radian measure unit. Once again, it is attached importance to promote reasoning
about angle measure as the meaningful numbers (Thompson, 2008) through measuring
arc lengths in radii (Moore, 2010; 2012; 2014).
49
In addition, the importance of the ability to use trigonometric functions in any
circular context is emphasized because provoking students to consider units with
different measures promotes their unit circle understandings from their restricted
understanding of the unit circle notion with “one” radius to any given circle through
considering its radius as “one” unit (Moore, LaForest, & Kim, 2012).
Finally, the coordinated-variation of the directed distance (referring to a
trigonometric value) (Brown, 2005; Hertel & Cullen, 2011) with respect to arc length
in radii rather than any other measurement units is emphasized to generate coherent
understanding of trigonometric functions (Moore, 2010; 2012; 2014). Comprehension
of simultaneous variation of two variable (Oehrtman, Carlson, & Thompson, 2008),
angle measure as a varying measure (Moore, 2012), and thinking about angle measure
in terms of rotations on the unit circle (Brown, 2005; Fi, 2003; Mitchelmore & White,
1996; Moore, 2010) are important ideas to construct and interpret graphs of
trigonometric functions; as well as the unit circle as an important tool (Brown, 2005;
Moore, LaForest, & Kim, 2012; Weber, 2005) and consideration of the meaning of
coterminal angles on the unit circle (Fi, 2003) are mentioned as foundational to
understand the periodic nature of the trigonometric functions.
To sum up, coherent understanding and flexible use of trigonometric functions
in different representations (i.e., symbolic, circular, and graphic) are expected from
trigonometry instructions. In comprehension of mathematics, Duval (2006) argued the
importance of (i) recognition tasks that require recognition of the same object
represented in two different representational registers “whose contents have very often
nothing in common” (p. 112), and (ii) discrimination tasks that require discrimination
“in any semiotic representation what is mathematically relevant and what is not
mathematically relevant?” (p. 115). Therefore, well-designed recognition and
discrimination tasks are critical to provide students with coherent understanding and
flexible use trigonometric functions in different representational registers but also
provide researchers (or teachers) with awareness of students’ understanding.
Recognition and discrimination of trigonometric functions require many
dynamic cognitive processes, such as reasoning about simultaneous variation of two

50
variable, i.e., angle measure and corresponding trigonometric value, (Oehrtman et al.,
2008), considering of angle measure as a varying measure (Moore, 2012), and thinking
about angles in terms of rotations (Brown, 2005; Fi, 2003; Mitchelmore & White,
1996; Moore, 2010). However, these processes are not easy in static paper-and-pencil
environment. Therefore, the last and the most important aspect is the need to ease for
students’ seeing the different representations and to establish connections between
them. In this respect, multiple-representation and dynamicity opportunities of new
technologies enable us to achieve this much more easily, quickly and truly than the
static paper-and-pencil environment.
For example, Geometer’s Sketchpad (GSP) (Jackiw, 2006) can be used for
teaching and learning of trigonometry because of the potential of providing dynamic
diagrams that students can slightly distort to meet their expectations, which is
impossible in paper-and-pencil diagrams (Laborde, Kynigos & Strasser, 2006). That
is, making variation –which is needed to be understood “invariance” that is the very
important aspect of mathematical thinking (Kaput, 1992)– opportunity of GSP can
facilitate students’ recognition and discrimination of trigonometric functions in
different contents of different representational registers. Moreover, in GSP
environment, it is possible to construct three different representations of trigonometric
functions (i.e., symbolic, circular, and graphic), as well as to measure some important
attributes related to trigonometry (e.g., arc length, arc angle, radius, directed length,
etc.). As far as these potentialities of GSP are concerned, appropriate use of GSP may
be useful to foster students’ comprehension of trigonometry. However, its appropriate
integration into trigonometry courses requires to carefully design teaching/learning
activities and the instructional sequence.
Accordingly, the overarching purpose of this study is to design an instruction9
including a sequential tasks in dynamic geometry environment with GSP in order to
help students enrich their concept images on the core trigonometric functions’10 basic
9 Designing of the instruction started through inspiring from research literature on trigonometry, historical
development of trigonometry, our exploratory teaching experience, and initial interview results; and then,
continued as an on-going process during the experimentation to influence students’ trigonometry.
10 The term “core trigonometric functions” refers to sine and cosine functions.
51
forms11 and general forms12; and then, is to construct living models of students’
concept images through gaining experiences on students’ trigonometry during the
conducted-teaching experiment based on the recognition and discrimination tasks of
this designed-instruction.
11 The term “basic form” refers to, for example, 𝑦 = 𝑠𝑖𝑛(𝑥) and 𝑦 = cos(𝑥).
12 The term “general form” refers to, for example, 𝑦 = 𝑎sin(𝑏x + 𝑐) + 𝑑 and 𝑦 = 𝑎 cos(𝑏x + c) + 𝑑.

52
53
CHAPTER 3
3. METHODOLOGY
In order to investigate the research questions of this study, a teaching
experiment (Steffe and Thompson, 2000) was conducted. The teaching experiment is
a technique designed to understand students’ conceptions in the context of
mathematics teaching (Cobb & Steffe, 1983, Hunting, 1983; Steffe, 1991). Steffe and
Thompson (2000) assert that “without the experiences afforded by teaching, there
would be no basis for coming to understand the powerful mathematical concepts and
operations students construct…” (p. 267).
3.1. Teaching Experiment
In order to explain students’ mathematical learning and development in the
context of teaching, experimental designs can be used. Nevertheless, classical
experimental methodologies are not adequate for addressing how students learn
specific mathematical concepts (Steffe & Thompson, 2000). In this respect, the
teaching experiment, which was derived from Piaget’s clinical interview (which is
used to understand students’ current knowledge), is a useful technique. But a teaching
experiment is more than a clinical interview in terms of the experimentation that is
included in a teaching experiment to influence students’ mathematical knowledge.
For researchers, knowing how to interact with the students and what to be the
outcomes of this interaction is an essential point to be able to conduct a teaching
experiment. Steffe and Thompson (2000) stated that “in their attempts to learn
students’ mathematics, the researchers create situations [not considered in the initial
design of a teaching experiment] and ways of interacting with students [both in a

54
responsive-and-intuitive way, as well as in an analytical way] that encourage the
students to modify their current thinking” (p. 285), and “meanings lie behind students’
language and actions” (p. 276). They recommend for the researchers who plan to
conduct a teaching experiment to experience the interaction in an exploratory teaching
with similar students who would be involved in the teaching experiment before
attempting to conduct a teaching experiment. Interaction is a central issue of a teaching
experiment. Steffe and Thompson (2000) consider two different types of interaction
with students in a teaching experiment, namely, responsive-and-intuitive, and
analytical. The aim of responsive-and-intuitive interaction is for researchers to explore
students’ reasoning. On the other hand, when researchers have some hypotheses about
students’ reasoning, then, in order to test these hypotheses, they turn to analytical
interactions from responsive-and-intuitive ones.
A sequence of teaching episodes is included in a teaching experiment. Each
teaching episode includes (at least) a teacher-researcher (myself), one or more students
(in this study, two pairs of students participated in the separate teaching experiments),
a witness or an observer in order to help the teacher-researcher both understand and
interpret students’ actions (a trigonometry teacher working at a cram school) and a
recording device (to “provide insight into the students’ actions and interactions that
were not available to the teacher-researcher when the interactions took place”) (Steffe
& Thompson, 2000, p.293). During the each teaching episode of the teaching
experiment, students’ independent contributions to the interactions (Steffe &
Thompson, 2000) and their reasoning (Ackermann, 1995) are the focus.
It is another important point that a teaching experiment is conducted not only
to test hypotheses but also continually generate them (Steffe & Thompson, 2000).
Primarily, before a teaching experiment, the teacher-researcher formulates major
research hypotheses to test (in this study, an instruction including sequential tasks in
dynamic geometry environment with Geometer’s Sketchpad (GSP) –designed through
inspiring the research literature on trigonometry, the historical development of
trigonometry, our exploratory teaching experience and initial interview results– helps

55
students enrich their concept images on trigonometric functions13) so as to guide the
initial selection of the students and the teacher-researcher’s overall general intentions.
However, it is recommended for the teacher-researcher to forget these major
hypotheses during the each episode of the teaching experiment for the purpose of
adapting to constraints14 encountered in the interaction with the students. In this way,
the teacher-researcher generates new hypotheses which allow make possible the
formulation of new situations of learning. And then, each student is tested on the
continually generated hypotheses through the teaching experiment by focusing on the
student’s independent contributions to the interactions and their reasoning during
teaching episodes with the goal of the possible greatest progress.
In the light of the recommendations mentioned above, as a seven-year
experienced mathematics teacher and as a researcher with the experience of the
interaction with a student who had just taken trigonometry (who was in the similar
condition with those in the teaching experiment15) in an exploratory teaching of the
sine function with Geometer’s Sketchpad (GSP) dynamic geometry environment
(Şahin, Ubuz & Erbaş, 2010), I decided to conduct a teaching experiment in GSP
environment to investigate how students’ concept images on trigonometric functions
change by the help of the designed-instruction.
3.2. Geometer’s Sketchpad
Geometer’s Sketchpad (GSP) (Jackiw, 2006) is a dynamic geometry
environment that has the potential for students to construct simultaneously the
geometric (on the circle), algebraic and graphical representations of trigonometric
functions (see Table 3.1) with dynamic linkage. In addition to its ease to learn use,
13 From this point forward, trigonometric functions refer to the core trigonometric functions sine and cosine.
14 Steffe and Thompson (2000) use the “constraint” term with a dual meaning in researchers’ imputations to
students’ mathematical understandings: (1) constrained by the students’ language and actions, (2)
constrained by the students’ mistakes that persist despite researchers’ best efforts to eliminate them.
15 From this point forward, the teaching experiment refers to the conducted teaching experiment in this study.
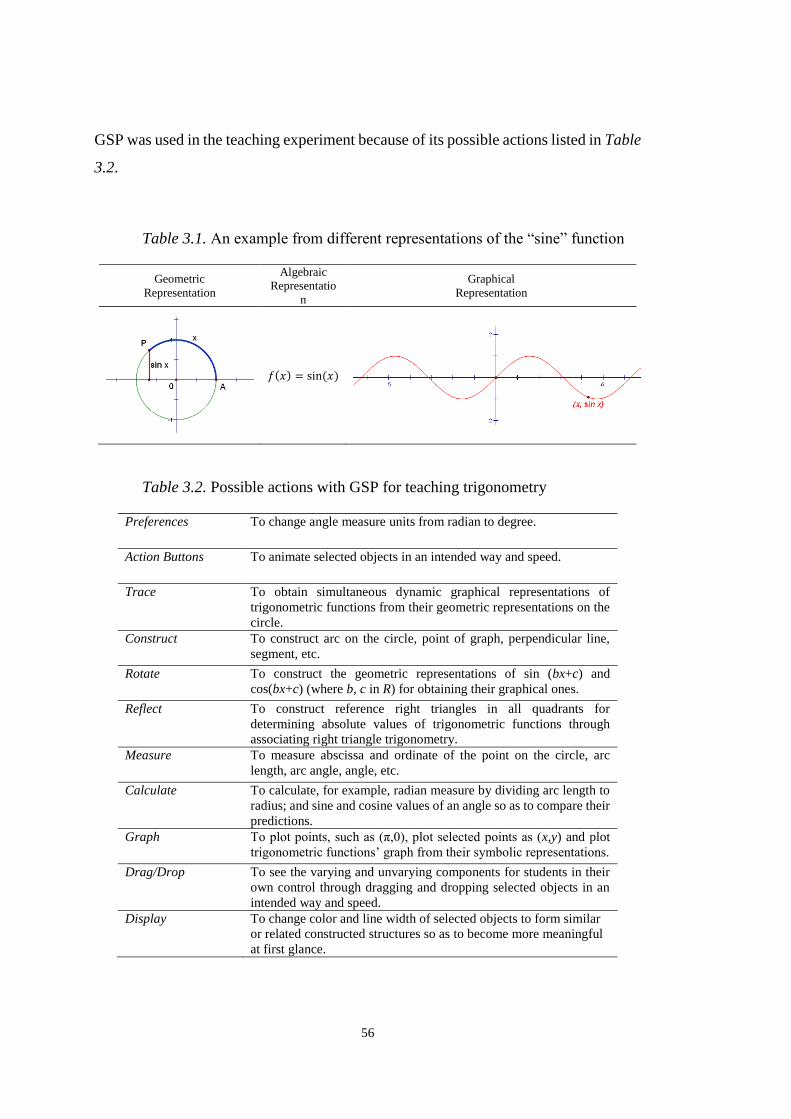
56
GSP was used in the teaching experiment because of its possible actions listed in Table
3.2.
Table 3.1. An example from different representations of the “sine” function
Geometric
Representation
Algebraic
Representatio
n
Graphical
Representation
𝑓(𝑥) = sin(𝑥)
Table 3.2. Possible actions with GSP for teaching trigonometry
Preferences To change angle measure units from radian to degree.
Action Buttons To animate selected objects in an intended way and speed.
Trace To obtain simultaneous dynamic graphical representations of
trigonometric functions from their geometric representations on the
circle.
Construct To construct arc on the circle, point of graph, perpendicular line,
segment, etc.
Rotate To construct the geometric representations of sin (bx+c) and
cos(bx+c) (where b, c in R) for obtaining their graphical ones.
Reflect To construct reference right triangles in all quadrants for
determining absolute values of trigonometric functions through
associating right triangle trigonometry.
Measure To measure abscissa and ordinate of the point on the circle, arc
length, arc angle, angle, etc.
Calculate To calculate, for example, radian measure by dividing arc length to
radius; and sine and cosine values of an angle so as to compare their
predictions.
Graph To plot points, such as (π,0), plot selected points as (x,y) and plot
trigonometric functions’ graph from their symbolic representations.
Drag/Drop To see the varying and unvarying components for students in their
own control through dragging and dropping selected objects in an
intended way and speed.
Display To change color and line width of selected objects to form similar
or related constructed structures so as to become more meaningful
at first glance.
57
3.3. Participants and Selection
The teaching experiment was conducted separately with two pairs of 11th
grade students in the fall semester of 2012 who had just taken trigonometry in the
spring semester at 10th grade. They were selected through the following three steps.
Firstly, from two Anatolian High Schools16 in Ankara in Turkey, with respect to the
recommendations of the school boards and mathematics teachers, two successful 10th
grades in the spring semester taking mainly mathematics and science courses were
determined to observe during trigonometry teaching. After then, according to the
classroom observations (from May 2, 2012 to May 31, 2012) and classroom
trigonometry teachers’ recommendations, ten 10th grade trigonometry students were
selected based on the ability to share and communicate their ideas, work well together
as pairs, having high performance in trigonometry17 and their willingness to participate
the study. Six of these students were from one school and four of them from the other.
Finally, among these ten students, four students were selected as the participants of the
teaching experiment by the purposive sampling through one-to-one clinical interviews
on eight open-ended questions (see Appendix A) prepared to understand students’
current knowledge, reasoning abilities, as well as essential mistakes on the concepts
related to trigonometry (such as function, unit circle, right triangle, sine and cosine,
coordinate plane, angle measure units, degree, radian, π, graphing, and periodicity).
They were the students, from the same school, who were at best (but not
adequate) reasoning related to trigonometry among all ten recommended “good”
trigonometry students from two schools. But they had similar essential mistakes with
those of other six students. The purpose of selecting these four students was to conduct
the teaching experiment in an aimed way without wasting much more time than a few
weeks for their preparation with enough prior principal knowledge to learn
trigonometric functions instead of dealing for several weeks with completing deficient
16 The schools are four-year public high schools with 9 to 12 graders who are admitted according to the basis
of their performances on the national exam with average top 2.3% and 8.4 % ranking.
17 It means students’ high performances on trigonometry exams including questions mainly based on
computational skills they took at their schools.

58
and missing prior knowledge. Three of them were female (Cemre, Defne and Ebru)
and one was male (Zafer) –all names of the students changed with pseudonyms. These
four selected students were grouped as two pairs (Cemre with Zafer and Defne with
Ebru) taking account of their explanation styles (or thinking aloud styles) so as to
create a more effective discussion environment by means of assigning each group to
both one uncommunicative student (Ebru and Zafer) who has been making no effort
to explain asked questions if they have no answer and one communicative student
(Defne and Cemre) who has been making an effort to explain asked questions even if
they have no answer.
3.4. Initial Interviews
In order not only to select the participants of the teaching experiment but also
to identify their current concept images on trigonometric functions and (if exists)
potential conflict factors, an approximately 75-minute task-based individual interview
was conducted with each of ten 10th grade trigonometry students. Because they were
not adults, parental permissions (Appendix B) were taken for all about their
participation of the study. These students were taken from the class to the library of
their school on a day at the end of the semester (approximately one week after their
last trigonometry exams) from June 1, 2012 to June 8, 2012 (see Table 3.3). At the end
of the semester, students had just completed the trigonometry course that aims
students’ understanding and reasoning on the trigonometry topics listed in Table 3.4.
Interview tasks were composed of eight open-ended questions (see Appendix
A) designed as an eight-page question booklet (each page included only one question
and enough blank to use as a worksheet). Beginning of the interview, the question
booklet and a pencil were given to the students. However, the interview was beyond
the answering only these questions. It allowed the researcher to scrutinize students’
concept images on their current knowledge and reasoning abilities related to
trigonometry mentioned in Table 3.5 through catching the occasions of provoking
students to critically think aloud.
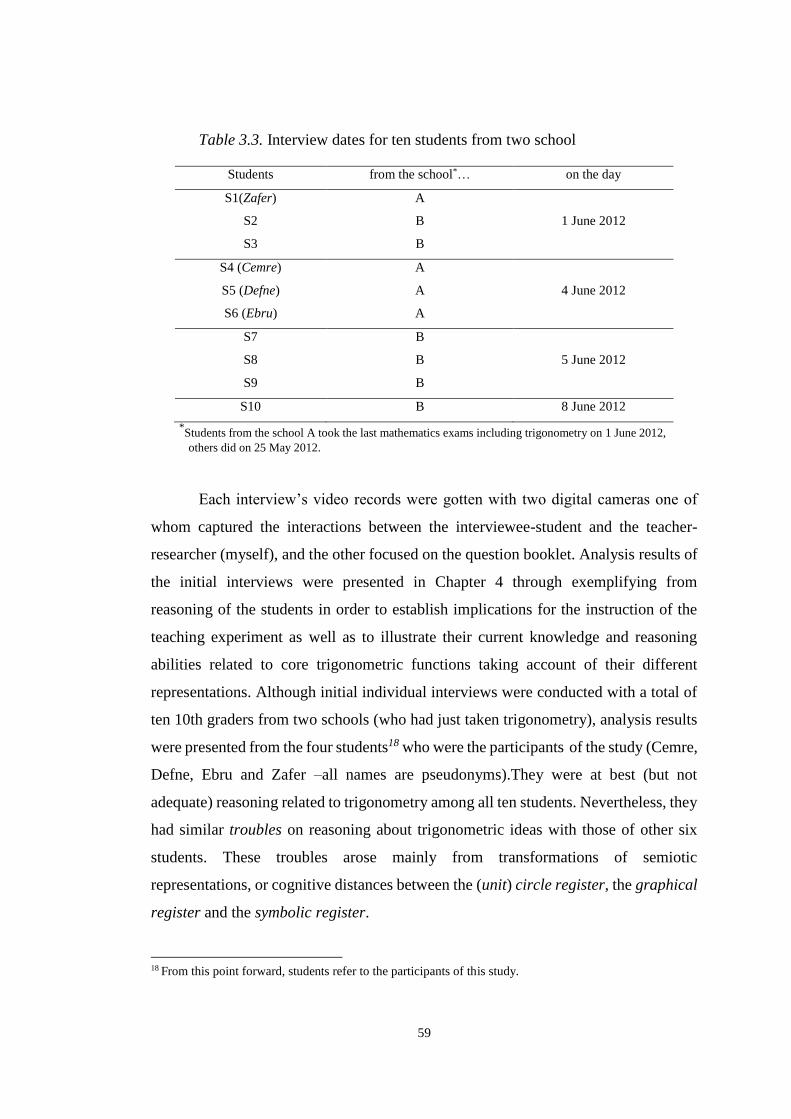
59
Table 3.3. Interview dates for ten students from two school
Students from the school*… on the day
S1(Zafer) A
1 June 2012 S2 B
S3 B
S4 (Cemre) A
4 June 2012 S5 (Defne) A
S6 (Ebru) A
S7 B
5 June 2012 S8 B
S9 B
S10 B 8 June 2012
*Students from the school A took the last mathematics exams including trigonometry on 1 June 2012,
others did on 25 May 2012.
Each interview’s video records were gotten with two digital cameras one of
whom captured the interactions between the interviewee-student and the teacher-
researcher (myself), and the other focused on the question booklet. Analysis results of
the initial interviews were presented in Chapter 4 through exemplifying from
reasoning of the students in order to establish implications for the instruction of the
teaching experiment as well as to illustrate their current knowledge and reasoning
abilities related to core trigonometric functions taking account of their different
representations. Although initial individual interviews were conducted with a total of
ten 10th graders from two schools (who had just taken trigonometry), analysis results
were presented from the four students18 who were the participants of the study (Cemre,
Defne, Ebru and Zafer –all names are pseudonyms).They were at best (but not
adequate) reasoning related to trigonometry among all ten students. Nevertheless, they
had similar troubles on reasoning about trigonometric ideas with those of other six
students. These troubles arose mainly from transformations of semiotic
representations, or cognitive distances between the (unit) circle register, the graphical
register and the symbolic register.
18 From this point forward, students refer to the participants of this study.
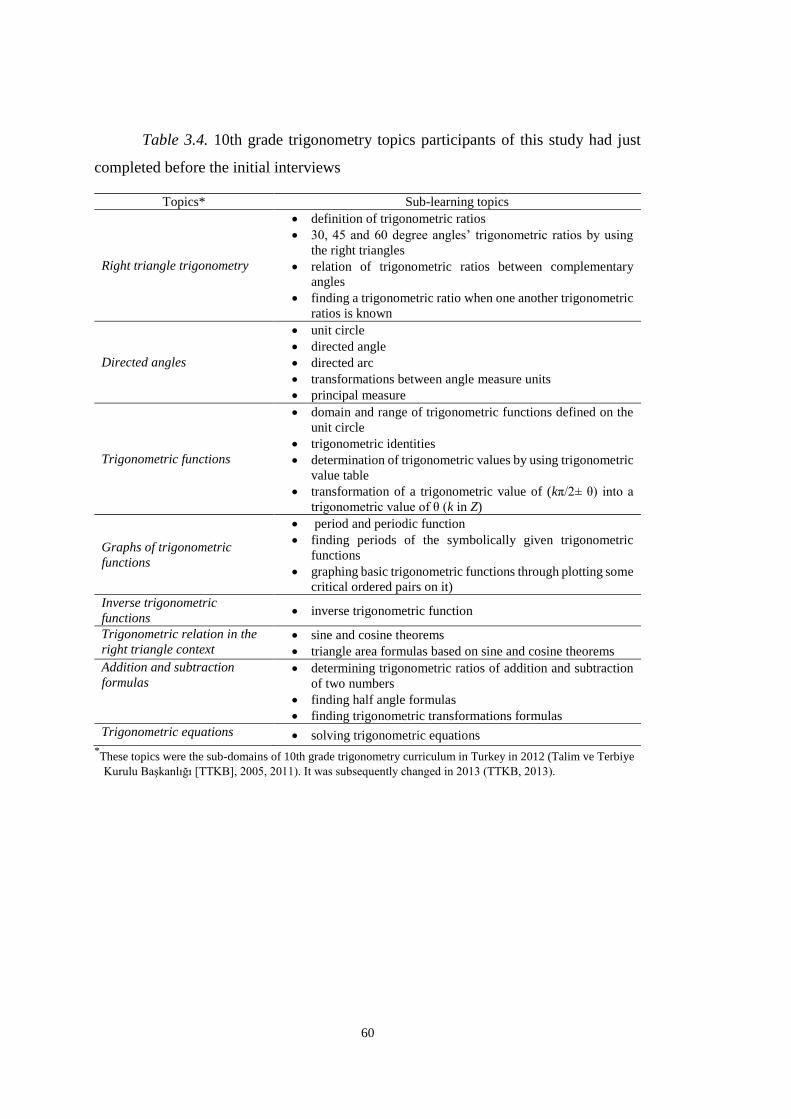
60
Table 3.4. 10th grade trigonometry topics participants of this study had just
completed before the initial interviews
Topics* Sub-learning topics
Right triangle trigonometry
definition of trigonometric ratios
30, 45 and 60 degree angles’ trigonometric ratios by using
the right triangles
relation of trigonometric ratios between complementary
angles
finding a trigonometric ratio when one another trigonometric
ratios is known
Directed angles
unit circle
directed angle
directed arc
transformations between angle measure units
principal measure
Trigonometric functions
domain and range of trigonometric functions defined on the
unit circle
trigonometric identities
determination of trigonometric values by using trigonometric
value table
transformation of a trigonometric value of (kπ/2± θ) into a
trigonometric value of θ (k in Z)
Graphs of trigonometric
functions
period and periodic function
finding periods of the symbolically given trigonometric
functions
graphing basic trigonometric functions through plotting some
critical ordered pairs on it)
Inverse trigonometric
functions inverse trigonometric function
Trigonometric relation in the
right triangle context sine and cosine theorems
triangle area formulas based on sine and cosine theorems
Addition and subtraction
formulas determining trigonometric ratios of addition and subtraction
of two numbers
finding half angle formulas
finding trigonometric transformations formulas
Trigonometric equations solving trigonometric equations *These topics were the sub-domains of 10th grade trigonometry curriculum in Turkey in 2012 (Talim ve Terbiye
Kurulu Başkanlığı [TTKB], 2005, 2011). It was subsequently changed in 2013 (TTKB, 2013).
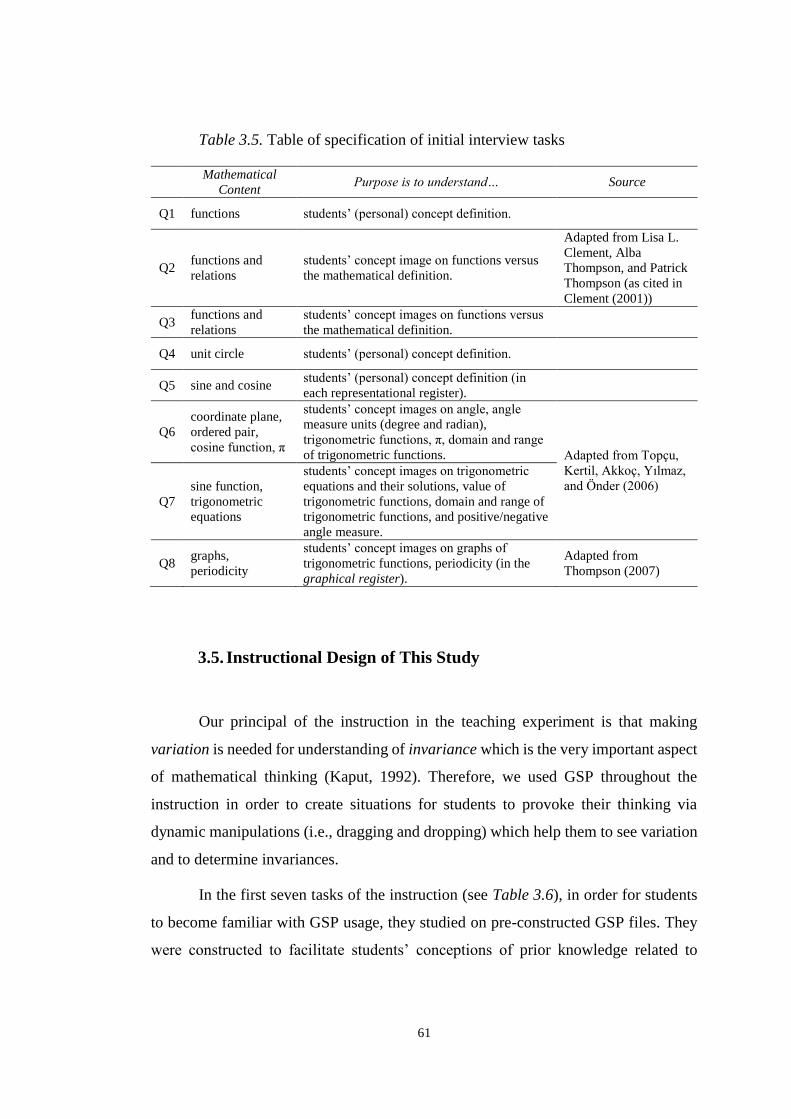
61
Table 3.5. Table of specification of initial interview tasks
Mathematical
Content Purpose is to understand… Source
Q1 functions students’ (personal) concept definition.
Q2 functions and
relations
students’ concept image on functions versus
the mathematical definition.
Adapted from Lisa L.
Clement, Alba
Thompson, and Patrick
Thompson (as cited in
Clement (2001))
Q3 functions and
relations
students’ concept images on functions versus
the mathematical definition.
Q4 unit circle students’ (personal) concept definition.
Q5 sine and cosine students’ (personal) concept definition (in
each representational register).
Q6
coordinate plane,
ordered pair,
cosine function, π
students’ concept images on angle, angle
measure units (degree and radian),
trigonometric functions, π, domain and range
of trigonometric functions. Adapted from Topçu,
Kertil, Akkoç, Yılmaz,
and Önder (2006)
Q7
sine function,
trigonometric
equations
students’ concept images on trigonometric
equations and their solutions, value of
trigonometric functions, domain and range of
trigonometric functions, and positive/negative
angle measure.
Q8 graphs,
periodicity
students’ concept images on graphs of
trigonometric functions, periodicity (in the
graphical register).
Adapted from
Thompson (2007)
3.5. Instructional Design of This Study
Our principal of the instruction in the teaching experiment is that making
variation is needed for understanding of invariance which is the very important aspect
of mathematical thinking (Kaput, 1992). Therefore, we used GSP throughout the
instruction in order to create situations for students to provoke their thinking via
dynamic manipulations (i.e., dragging and dropping) which help them to see variation
and to determine invariances.
In the first seven tasks of the instruction (see Table 3.6), in order for students
to become familiar with GSP usage, they studied on pre-constructed GSP files. They
were constructed to facilitate students’ conceptions of prior knowledge related to

62
trigonometry and fundamental properties of trigonometric functions by the teacher-
researcher (myself) and reviewed by at least two mathematics educators with extensive
experience on technology in mathematics education, especially on GSP. Examples
from their static versions were presented in Figure 5.1, Figure 5.2 and Figure 5.4 for
Task 1, Figure 5.6 and Figure 5.10 for Task 2, Figure 5.13, Figure 5.15 and Figure
5.16 for Task 3, Figure 5.17 for Task 4, Figure 5.19 for Task 5, and Figure 5.24 for
Task 6 and Task 7]. On the other hand, in the following nine tasks of the instruction
(see Table 3.7), each episode began with students’ re-construction of a circle on the
coordinate plane with GSP (whose radius and center are manipulable) and continued
with the manipulation of this circle for reasoning with respect to the teacher-
researcher’s directions. Totally seventeen tasks (see Table 3.6, Table 3.7 and Appendix
C) were prepared for the instruction (so as to be one task per episode). Instructional
sequence was designed taking into account some implications from the research
literature on trigonometry, historical development of trigonometry, our exploratory
teaching experience and initial interview results.
Firstly, before dealing with trigonometric functions, we need certain prior
knowledge such as angular measurement systems more based on measuring in radii
(Moore, 2012), perpendicular coordinate system, and directed arcs and angles (with
the direction counterclockwise or clockwise like in the history). In addition, before
dealing with trigonometric functions, we need certain prior experiences the notion of
right triangles [in terms of the properties of similar right triangles’ ratios of the lengths
of corresponding sides (Thompson, 2008), as well as integration of the right triangles
onto the (unit) circle], circles (in terms of radii, arc angles, arc lengths (Moore, 2010;
2012) and chord lengths (Hertel & Cullen, 2011)), and functions [in terms of their
meanings (Hertel & Cullen, 2011), different representations including graphs, rules
and relations between inputs and outputs etc. (Weber, 2005)]. Gür (2009) emphasized
that students’ problems with prior knowledge related to trigonometry are obstacles in
trigonometry learning. Therefore, students’ preparation with enough principal prior
knowledge is one of the most important aspects in understanding of trigonometric
functions. However, it is not enough because how the knowledge was stored (see
Figure 2.2) is another absolutely important aspect in the mathematical understanding

63
(Sfard, 1991). In this respect, it may be a useful way in the mathematical understanding
to continue to add new concepts to the old ones (which have been truly and easily
understood by the students) through associating new ones with the old ones and
motivating them to learn new ones.
Considering not only the importance of the unit circle for understanding the
periodic nature of trigonometric functions (Brown, 2005; Fi, 2003; Thompson, 2007;
Thompson, 2008; Weber, 2005) but also students’ difficulties with the unit circle in
terms of understanding, using and interpreting trigonometric functions (Burch, 1981;
Emlek, 2007; Güntekin, 2010; Gür, 2009; Weber, 2005) and students’ better
performances in the ratio method in the right triangle context compared to the unit
circle context (Kendal & Stacey, 1996), the instructional sequence was designed from
the right triangle context to the unit circle context. Our starting point was the Right
Triangle Trigonometry [Task 1]. Next, after the need “angles” in the right triangle
context, Angle Measure Units [Task 2] were mentioned as mainly based on measuring
in radii (Moore, 2012) and arc lengths. And then, angles in the unit circle context were
the focus in terms of Principal Angle and Reference Angle [Task 3] through
highlighting π as a real number when being discussed in the trigonometry context
(Akkoç, 2008; Fi, 2003; Topçu, Kertil, Akkoç, Yılmaz &Önder, 2006). Then, after
discussions on functions in terms of their meanings, different representations including
graphs, rules and relations between inputs and outputs etc., trigonometric functions
were defined as functions on the Unit Circle (sine and cosine) [Task 4] which was
integrated with the dynamic reference right triangle with 1-unit hypothesis (see Figure
5.17). Afterwards, in order to understand students’ difficulties about trigonometric
functions’ definitions, Periodic Nature of sine and cosine [Task 5] were preferred to
handle in the following episode. Then, regarding the crucial role of multiple
representations of a concept, especially visual ones, such as graphs (Goldenberg,
1988), and transformations among them on enriching students’ concept images
(Duval, 1999), Relations among Different Representations (of sine) [Task 6] and
Relations among Different Representations (of cosine) [Task 7] were mentioned in the
separate episodes according to our exploratory teaching experience (Şahin, Ubuz &
Erbaş, 2010) which indicated that the knowledge on sine and cosine functions should

64
be associated just after being stored in separate schemas in their own right including
all cognitive processes (i.e., all mental pictures and associated properties, and
processes regarding sine/cosine function) in all different representations. Moreover,
sine function was preferred to be first introduced with cosine function in the light of
the historical development of the trigonometric functions in which the basic element
was the trigonometric “chord” function (Katz, 2009) that was turned in the fifteenth
century into sine of an arc which was defined as the half chord of double the arc
(Sanford, 1958). Afterwards, respectively, Role of the Coefficient a for y=a.sin(x)
Function in the Different Representations [Task 8], Role of the Coefficient d for
y=sin(x)+d Function in the Different Representations [Task 9], Role of the coefficient
c for y=sin(x+c) Function in the Different Representations [Task 10], Role of the
Coefficient b for y=sin(bx) Function in the Different Representations [Task 11] were
discussed where the tasks’ sequencing was determined from easy to difficult according
to our exploratory teaching experience. After the all tasks on sine function were
completed in an intended way, Relation between sine and cosine Functions [Task 12]
was discussed considering all different representational registers. We preferred to
discuss this relation in Task 12 instead of doing after Task 7 because constructed rich
(or well-structured) concept images on sine function have the potential to ease to
construct well-structures concept images on cosine function through establishing the
relations and similarities of cognitive processes of sine with those of cosine. From this
point of view, after then, Role of the Coefficient a for y=a.cos(x) Function in the
Different Representations [Task 13], Role of the Coefficient d for y=cos(x)+d Function
in the Different Representations [Task 14], Role of the Coefficient c for y=cos(x+c)
Function in the Different Representations [Task 15], Role of the Coefficient b for
y=cos(bx) Function in the Different Representations [Task 16] were discussed through
establishing the relations and similarities of cognitive processes of sine with those of
cosine. Finally, a modeling task with Ferris wheel (Appendix C) was preferred to apply
in order to understand students’ way of thinking and conceptualization steps (Lesh &
English, 2005; Lesh & Sriraman, 2005) on sine and cosine functions. All these tasks
were clarified in depth with regard to the cognitive base of the instruction under the
following heading.

65
Table 3.6. Overview of the tasks in the first part of the instruction in the teaching experiment
One task per
episode Theme of Episodes Objectives (After the episode, it is expected that students should be able to …)
Task 1 Right Triangle
Trigonometry
interpret “invariance” components when making variation on a right triangle’s acute angles and lengths of sides
determine proportional ratios of similar right triangles
establish relation between opposite [adjacent] side’s length of a right triangle with 1 unit hypotenuse and sine [cosine] of an angle
realize the relationship of trigonometric ratios for complementary angles
Task 2 Angle Measure Units
discriminate the difference between what an angle is and what an angle measure is
investigate angles greater than 90 degrees or π/2 radians
identify directed angles and arcs
calculate the arc length, angle measure and radius
determine relationship among arc length, radius and angle measure
establish relations between angle-measure units (degree and radian)
Task 3 Principal Angle and
Reference Angle
model angles greater than 360 degrees or 2π radians
decide principal angle of an angle
decide reference angle of an angle
determine the position of an arbitrary angle (i.e., either greater than 360 degrees or 2π radian, or principal angle and reference angle) on
the unit circle
determine the position of a negative angle on the unit circle
Task 4 Unit Circle (sine and
cosine)
identify the sine and cosine functions by the unit circle integrated with the reference right triangle with 1-unit hypothesis
predict the value of the sine and cosine functions by using the coordinate axes as a ruler
transfer sine and cosine ratios of an arbitrary acute angle, θ, in a right triangle to the value of the sine and cosine functions of an angle
whose reference angles are the same, θ, or that are “θ ± kπ” (where k is an integer)
Task 5 Periodic nature of the
sine and cosine
interpret “invariance” components on the sine and cosine functions when making variation on the reference right triangle integrated
with the unit circle both within a quadrant and between quadrants
interpret the periodic nature of the sine and cosine functions
determine the period of the sine and cosine functions
Task 6
Relations among
different
representations (sine)
construct graphs of sine function through associating its definition on the unit circle as an ordered pair and via taking “trace” advantage
of GSP
differentiate the abscissa of an ordered pair between on the sine graph and on the unit circle
convert coordinates of an ordered pair on sine graph to the appropriate components on the unit circle
Task 7
Relations among
different
representations (cosine)
construct graphs of cosine function through associating its definition on the unit circle as an ordered pair and via taking “trace”
advantage of GSP
differentiate the ordinate of an ordered pair between on the cosine graph and on the unit circle
convert coordinates of an ordered pair on cosine graph to the appropriate components on the unit circle
65
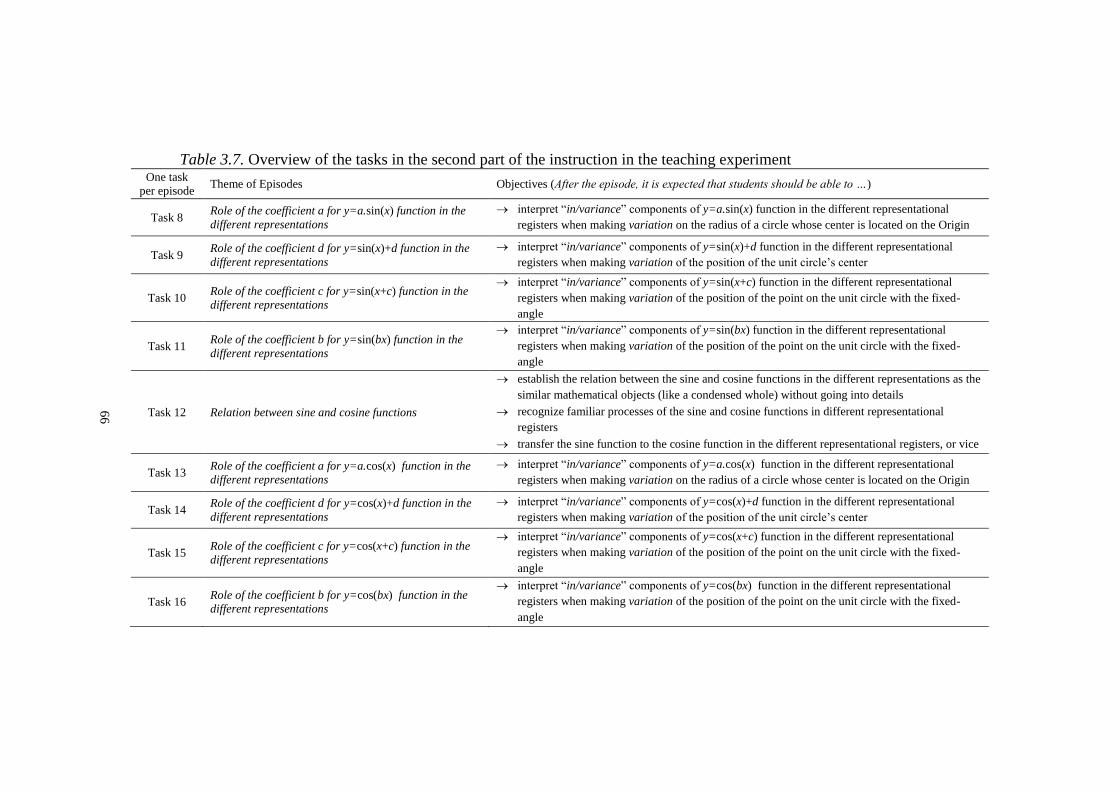
66
Table 3.7. Overview of the tasks in the second part of the instruction in the teaching experiment One task
per episode Theme of Episodes Objectives (After the episode, it is expected that students should be able to …)
Task 8 Role of the coefficient a for y=a.sin(x) function in the
different representations
interpret “in/variance” components of y=a.sin(x) function in the different representational
registers when making variation on the radius of a circle whose center is located on the Origin
Task 9 Role of the coefficient d for y=sin(x)+d function in the
different representations
interpret “in/variance” components of y=sin(x)+d function in the different representational
registers when making variation of the position of the unit circle’s center
Task 10 Role of the coefficient c for y=sin(x+c) function in the
different representations
interpret “in/variance” components of y=sin(x+c) function in the different representational
registers when making variation of the position of the point on the unit circle with the fixed-
angle
Task 11 Role of the coefficient b for y=sin(bx) function in the
different representations
interpret “in/variance” components of y=sin(bx) function in the different representational
registers when making variation of the position of the point on the unit circle with the fixed-
angle
Task 12 Relation between sine and cosine functions
establish the relation between the sine and cosine functions in the different representations as the
similar mathematical objects (like a condensed whole) without going into details
recognize familiar processes of the sine and cosine functions in different representational
registers
transfer the sine function to the cosine function in the different representational registers, or vice
versa Task 13
Role of the coefficient a for y=a.cos(x) function in the
different representations
interpret “in/variance” components of y=a.cos(x) function in the different representational
registers when making variation on the radius of a circle whose center is located on the Origin
Task 14 Role of the coefficient d for y=cos(x)+d function in the
different representations
interpret “in/variance” components of y=cos(x)+d function in the different representational
registers when making variation of the position of the unit circle’s center
Task 15 Role of the coefficient c for y=cos(x+c) function in the
different representations
interpret “in/variance” components of y=cos(x+c) function in the different representational
registers when making variation of the position of the point on the unit circle with the fixed-
angle
Task 16 Role of the coefficient b for y=cos(bx) function in the
different representations
interpret “in/variance” components of y=cos(bx) function in the different representational
registers when making variation of the position of the point on the unit circle with the fixed-
angle
66
67
3.6. Cognitive Base of Designed-Instruction of This Study
As it is mentioned above, not only students’ preparation with enough
knowledge on trigonometric functions but also how the knowledge was stored are
absolutely important aspects in the mathematical understanding (Sfard, 1991). Sfard
(1991) classifies mathematical understanding as operational conception (dynamic,
sequential and detailed) versus structural conceptions (static, instantaneous and
integrative). However, she emphasized this distinction’s dual meaning rather than
dichotomy. She proposed that when learning a new mathematical concept, the first
developed conception type is operational. And then, the mathematical concept’s
development comes true through converting the operational conception (various
processes) into the structural conception (compact static whole) after a lengthy and
difficult process. Through inspiring mathematical concepts’ historical development
processes, Sfard (1991) separates this lengthy and difficult process into three
hierarchical stages: interiorization, condensation and reification. First of all, the
interiorization stage means for students becoming familiar with the processes on the
mathematical object. Next, the condensation stage means for students becoming
skilled with seeing of the process as a condensed whole without going into details. At
this stage, the processes are easily combined with other ones, as well as generalizations
and comparisons are smooth. Finally, the reification stage is defined as an
instantaneous shift the ability to see familiar processes as a reified-object. By this
object (or mathematical construct), different representations of the mathematical
concept are semantically merged, which means any more fundamental properties of
this reified-object in its different representations and relations among them can be
investigated easily. Sfard (1991) indicates the effect of reification on the schema of a
student as a reorganization into a deeper and narrower structure so that “cognitive
processes become faster” (p. 27).
A schema is an individual’s mental construction connecting related processes
and objects, and appears to be somewhat similar to one’s concept image” (Harel,
Selden & Selden, 2006, p. 157). From this point of view, in the first part of the
instruction in the teaching experiment, it was intended to help students construct well-

68
structured cognitive schemas (or concept images) on both the necessary background
information (such as similar right triangles, trigonometric ratios, angle measure units,
directed angle, principal angle, reference angle, unit circle, π, coordinate plane) and
the principal information about the basic forms19 of trigonometric functions (such as
sine and cosine as functions, periodic nature of sine and cosine, relations among
different representations of the sine function, relations among different representations
of the cosine function, relations between sine and cosine functions) through
reorganizing their current cognitive schemas (or concept images). This part of the
instruction consisted of the seven tasks clarified in Table 3.6. There were two main
aims of these tasks. First of all was to prepare students so as to be in at least the
condensation stage in understanding of angle measure units, right triangles, the unit
circle, directed angles, principal angles, reference angles, functions and inferring from
visualization of graphs. It means for students becoming skilled with seeing of the
process as a condensed whole without going into details; for example, seeing angles
as a variable apart from their measure, seeing all similar right triangles as “similar” in
terms of their trigonometric ratios regardless of their lengths of sides, seeing the
lengths of the legs of a right triangle with 1-unit hypothesis the same as the respective
trigonometric value (sine or cosine), seeing the reference right triangle20 on the unit
circle in any quadrant, etc. For this purpose, students were provoked for operational
thinking through focusing on measures. For example, when dynamically manipulating
the figures, students were encouraged to determine the variance and invariance
measures of an arbitrary right triangle’s acute angles or sides, the variance and
invariance measures of the similar right triangles’ corresponding angles, sides,
proportional sides, similarity ratios and trigonometric ratios, the variance and
invariance measures of trigonometric ratios of complementary angles, the variance and
invariance measures of an arbitrary angle through changing the preference of the angle
measure unit from degrees to radians as well as directed degrees, the variance and
19 See Definitions of Terms heading at the end of Introduction chapter.
20 In this study, we mention the term reference right triangle as a right triangle in the (unit) circle register so
that its vertexes are the points P on the circle, its center and the intersection point of the horizontal axis and
the perpendicular line drawn from the point P to the horizontal axis (see Figure 5.17, Figure 6.1, and Figure
6.22).
69
invariance measures related to the radius and arc length of a circle whose center is
located on the vertex of an angle, as well as the variance and invariance measures of
an angle on the unit circle’s any quadrants and its principal, reference, coterminal and
directed values. The second aim of the first part was for students to become familiar
with the processes on the trigonometric functions’ basic forms. In this part of the
instruction, mainly students’ operational conceptions of trigonometric functions were
regarded instead of structural conceptions because this part corresponded to the
interioization stage in understanding of general forms21 of trigonometric functions.
Operational conception of trigonometric functions refers to determination of the value
of an angle measure (for an arbitrary angle measure unit preference), its corresponding
trigonometric value, signs of these values with respect to the quadrants of the unit
circle through focusing on the value of the coordinates of the point on the unit circle;
moreover, those of the corresponding point on the graph. However, this part
corresponded to at least the condensation stage in understanding of the basic forms of
trigonometric functions. It means for students becoming skilled with seeing of the
processes on and transformations within and between different representational
registers for the basic form of trigonometric functions (see Table 3.1).
Duval (2006) mentioned representations as semiotic representational systems
within which a sign takes its meaning in opposition to other signs and their complex
associations. Semiotic representations can be considered as common tools for not only
the development of a new mathematical concept but also the communication of
particular mental representations (or concept images). Therefore, natural language is a
highlighted semiotic representational system. Duval classified semiotic
representations into four semiotic systems (see Figure 2.3 in Review of the Literature
chapter), which are called the representation registers, with respect to the nature of
operations (discursive versus non-discursive) and the properties of processes (multi-
functional versus mono-functional) that are used to describe a system. Moreover, he
defines the semiotic representations as the registers only which permit transformations
of representations due to the fact that for understanding the thinking process in any
21 See Definitions of Terms heading at the end of Introduction chapter.
70
mathematical activity, it is important to focus on the level of semiotic representations
instead of focusing on the particular representation produced. Where, the level of
semiotic representations means the ability to transform a mathematical object from one
semiotic representation to one another. Transforming one semiotic representation to
another one is to be only at the level of grasping the basic properties of semiotic
representations and their significance for mathematics. This means for the students to
be able to distinguish the represented mathematical object from its representation
registers. From this point of view, transformations are crucial in the mathematical
understanding. Duval (2006) separates transformations of semiotic representations in
two types: treatment and conversion. While treatments refer to the transformations of
representations within the same register, conversions refer to the transformation of
representations between the different registers.
As it is mentioned above, the mathematical understanding requires recognition
of the same represented object in the different registers. This is a complex and difficult
process. Duval (2006) articulates two sources of problems in this complex and difficult
process. First of all is the complexity and specificity of treatments in the
multifunctional registers. For example, when dealing with visualization, there are
many ways of “seeing” (Duval, 1995) so that it is not easy in visual transformations of
figures to see and discern from the original figure to the reconfigured-one which will
make possible to establish the relation. Second source of the problems in the
mathematical understanding is the conversion of representations (or change of
registers), for instance, converting a Cartesian graph into its corresponding equation.
Duval (2006) asserts that conversion of representations requires recognition of the
same object represented in two different representational registers and discrimination
of the represented object from the content of the semiotic representation. Recognition
and discrimination are cognitively complex but the most important two cognitive skills
in comprehension of mathematical concepts in a mathematical activity in order to use
knowledge outside of the narrow learning contexts (Duval, 2006).
From this point of view, in the second and main part of the designed-instruction
in the teaching experiment, it was intended to help students enrich their concept images

71
on the general forms of the trigonometric functions providing them to construct the
reified-cognitive networks for the different representational registers of the
trigonometric functions without ignoring the role of language (or articulation –either
orally or written). We determined four registers to represent trigonometric functions,
namely, (unit) circle register22, graphical register, symbolic register and language
register. Our design was based on helping students enrich their concept images
through giving them opportunities in GSP environment to dynamically (or in a
systematically-varied way) compare and contrast visual features of the different
representations of trigonometric functions via focusing on what is mathematically
relevant or what is mathematically different in any representational register’s content.
This part of the instruction consisted of the nine tasks clarified in Table 3.7.
The overarching aim of these tasks was to prepare students so as to be in at
least the condensation stage in understanding of general forms of trigonometric
functions. It means for students at least becoming skilled with distinguishing the
represented trigonometric functions from the contents of the representational registers,
or at best seeing trigonometric functions as a reified-object so that all representational
registers are semantically merged. In other words, any more fundamental properties of
this reified-object in their different representations and relations among them can be
investigated easily. In this part of the instruction, students’ structural conceptions of
trigonometric functions (as a reified-object) were intended through operational way
of thinking (that is, through dynamic manipulations, i.e., dragging and dropping, to
compare and contrast visual features of the different representations of trigonometric
functions in a systematically-varied way as well as under the cover of possible actions
with GSP mentioned in Table 3.2).
In the light of the historical development of trigonometric functions, at the
beginning of the each episode of the teaching experiment as from the sixth episode to
the sixteenth, trigonometric functions were first introduced and used in the (unit) circle
register. And then, it was continued the graphical register and ended the symbolic
22 In this study, it was preferred to use the unit term in parenthesis as a consequence of the changeable-
meaning of the unit with respect to the assumptions of the unit measure as well as the importance of
conception of trigonometric functions on any circular representations either unit-circle or non-unit circle.
72
register without ignoring the language register in all other registers. And finally, the
order of the registers was inverted. In other words, each episode in itself included
conversion tasks that were simultaneous transformations among different registers
through comparing and contrasting visual features (for example, the circle’s radius and
position of its center, magnitudes and periods of graphs, coordinates of the points on
both the circle and graphs, arcs) in different representational registers of trigonometric
functions in a systematically-varied way and changing the roles of the source register
and the target register. Where, our aim was by the aid of GSP to provide students with
the cognitive DISSOCIATION of trigonometric functions and the content of the
particular semiotic representation. Furthermore, from an episode to the following one,
treatment tasks in all registers were done through dynamic manipulations on the radius
and center of an animated-circle constructed in GSP which was located on the
coordinate plane. Our way in discussions during these treatments was to compare and
contrast visual features of general trigonometric functions in any registers with those
of basic forms of trigonometric functions that were their first represented forms.
Where, our aim was to overcome by the aid of GSP the cognitive IMPOSSIBILITY
OF DISSOCIATING (Duval, 2006) the content of any semiotic representation and a
mathematical object’s first represented form in respective register through
construction of reified-cognitive networks within the (unit) circle register and the
graphical register.
Finally, the last part of the instruction was designed to see students’ conversion
troubles. Duval (2006) assert that conversion troubles (or cognitive distances between
registers) are observed only when tasks in which a representation within a source
register is systematically varied to its converted representation in the target register are
given to the students. At this point, modeling activities that include real-life situations
can be used as a valuable guide in order to see students’ way of thinking and possible
conceptualization steps. From this point of view, a modeling task with Ferris wheel
(see Appendix C) which was developed in the scope of the research project (with Grant
no: 110K250) supported by The Scientific and Technological Research Council of
Turkey (TUBITAK) was used to see students’ conversion troubles. This task required
to model functions which can be used to calculate, throughout the turning, some

73
instantaneous numerical data about a car on the Ferris wheel (which 36 cars would be
placed on at equal intervals, established on a platform 4 meters in height, in a 140-
meter diameter and complete a full-round in 30 minutes), namely, its ground clearance,
the distance to the point gotten in the car, how much time remains to complete a full
round. There were two main aims of us in this modeling task. First of all was to see
students’ abilities to transform their knowledge on trigonometric functions in the (unit)
circle register (located on coordinate plane) to the any circle context because of the
importance of making sense of trigonometric functions’ geometric representations on
a circle apart from the coordinate plane to fortify reified-structural understanding of
trigonometric functions like an object independent from its representational registers.
Second aim of the modeling task was to see students’ conversion troubles when not
only converting a representation within the (unit) circle register to its converted
representation in the symbolic register but also transforming the relations which is
originated by the basic forms of the sine or cosine functions in the (unit) circle register,
to those in the symbolic register.
To sum up, the intent of the instructional sequence was to help students
construct reified-structural understanding of trigonometric functions as an object
independent from its representational registers through enriching their concept images
on all representational registers of trigonometric functions including transformations
both between and within them. Detailed descriptions of the procedures for each task
are presented under the following heading.
3.7. Experimentation Procedures
3.7.1. Familiarity with GSP
Because the first episode of the teaching experiment was the first encounter
with GSP and its language (English) was different from the native language of the
students (Turkish), the each menu of GSP and their options were introduced to the
students before the implementation of Task 1. It took approximately 40 minutes. We

74
aimed to provide for students with familiarity on GSP usage through encouraging them
to use the some options of GSP, especially, under the Edit, Display, Construct,
Transform, Measure and Graph menus.
Firstly, after a blank page in GSP was opened, it was asked from each student
to construct geometric objects, for example, line segments and triangles, by using the
tools on the vertical ribbon (such as Selection Arrow Tool, Point Tool, Compass Tool,
Straightedge Tool and Text Tool). Next, before introducing Construct menu, how to
select an object on GSP file was mentioned. Then, for example, a segment between
the selected two points, point on it and midpoint of it was constructed by using
respectively segment, point on object and midpoint commands from Construct menu.
Where, when and why the commands function was discussed. For example, while the
point on object command does not function when only two points are selected, it
functions when a segment is selected.
After then, it was asked from each student to drag and drop the selected parts
of the constructed figures such as dragging and dropping of the endpoints, midpoint
and points on a segment. If they cannot manipulate some object (for example, midpoint
on a segment), the reasons for this were discussed. In order for students to become
familiar with the some frequently used-terms in English in GSP environment
throughout the teaching experiment (such as segment, circle, angle, degree, radian,
radius, arc length, length etc.), when speaking about them, it was preferred to use these
terms in English throughout the teaching experiment even though the experiment was
conducted in the Turkish language.
Afterwards, undo, redo and preference commands under the Edit menu, and
line width, color, hide objects, show all hidden commands under the Display menu
were introduced in terms of their functions through applying them as well as seeing
their effects. Next, we turned again the Construct menu in order to provide students
with the occasions to see the importance of the selection order of the objects. In
construction of a ray, the selection order of two points [for instance, A before B (in
contrast B before A)] affects the endpoint of the ray [A (in contrast B)].
75
Then, the Measure menu was introduced through an example on a constructed-
circle via measuring its radius, circumference and area by using the radius,
circumference and area active commands under the Measure menu. Besides, the
awareness of the simultaneously change on measures with the manipulation of this
circle through dragging and dropping was provided for students. Afterwards, by using
these obtained measures, some calculations had students done.
Finally, define coordinate system, plot points, plot new function commands
under the Graph menu were mentioned on the examples which were given by the
students. After provided with familiarity on GSP usage, students were studied on pre-
constructed GSP files on our main topic for Task 1. In the following six episodes, they
continued to study on pre-constructed GSP files until they became familiar with GSP
usage. On the other hand, the following nine episodes began with students’ re-
construction of a circle on the coordinate plane by GSP with respect to the teacher-
researcher’s directions (see Instructional Design of This Study heading for more
details).
3.7.2. Implementation of the modeling task
Although students were studied previous tasks separately as two pairs,
throughout this task, all of four students were worked as a group on a mathematical
modeling task with Ferris wheel (see Cognitive Base of Designed-Instruction heading
for its detailed description) since using small groups including three or four students
were recommended in the mathematical modeling tasks’ implementation process in
order to develop, describe, explain, manipulate the model and control important
conceptual systems (Lesh & Yoon, 2004). It was asked from students firstly to read
carefully the problem, next, to summarize their understandings on it, and then, to
propose their initial thoughts individually for the solution approaches and strategies in
about 15 minutes. Finally, students were encouraged to think more critically about how
to model the asked instantaneous numerical data about a car on the Ferris wheel (such
as, its ground clearance, the distance to the point gotten in the car, etc.). During this

76
process, it was important for us to avoid making any judgment either true or false.
Instead, we tried to guide them to provoke their thinking and reasoning via questioning
(e.g., how do you ensure that their model would function truly for an arbitrary position
of the car on the Ferris wheel?). In the implementation process, in case they need to
use GSP, it was provided for students.
3.7.3. Role of the teacher-researcher
As a teacher-researcher, throughout the seventeen-week instruction, my role
was a learning partner who provided help for students when dealing with GSP files.
During the instruction, I encouraged students to form conjectures (right or wrong)
about trigonometric functions, guided them by asking high-level questions (see
Protocols in Chapters 5, 6 and 7) to produce deeper learning than recall or recognition
questions, and had them think aloud. At the end of acquisition of each big idea in
trigonometry, I had them summarize their findings, and asked them to describe what
to learn and how to learn it.
3.7.4. Role of the witness-teacher
Throughout the teaching experiment, a mathematics teacher attended each
episode as a witness-teacher. She had a six-year experience at a cram school on
students’ trigonometry from each level. At the same time, she was a graduate student
of mathematics education. The teacher-researcher selected her as the witness-teacher
mostly based on her subject matter knowledge and skills on trigonometry, especially,
on the trigonometric formulas and rules memorized by students to solve trigonometric
problems easily and quickly. It was due to receive support both understand and
interpret students’ languages throughout the teaching experiment especially those
indicating trigonometric formulas and rules. In addition, she was selected based on
some other reasons; such as, her interest in technology usage in mathematics teaching,

77
her available time schedule and her willingness to attend the episodes of the teaching
experiment as the witness-teacher.
Her main role was to observe and provide feedback on the interaction with
students after the teaching episodes. She was as a passive observer during the episodes
due to her unwillingness to appear in the records. The teacher-researcher met her about
15 minutes before each teaching episode to give information about the instructional
goals. And then, at the end of the episodes, discussions were done on significant things
related to students’ understandings, as well as her perspective on students’ ways and
means of operating for alternative interpretations. These discussions were important
for not only the preparation of subsequent episodes but also the validation of the
teacher-researcher's decisions.
3.7.5. Research setting and data collection
Except for the last episode of the teaching experiment (a modeling task with
Ferris wheel), each teaching episode was conducted separately with two pairs of
students from 24 September 2012 to 9 February 2013. The meeting date of each
episode (see Table 3.8) was determined according to the pair’s preference. If their
suitable time was on the week day, the meeting took place on the library of their school
after the school courses. If their suitable time was at the weekend, the meeting took
place on the teacher-researcher’s study room at home. After the meetings, students
were leaved their homes. Although two different meeting places (the school library
and the teacher-researcher’s study room) existed, it was tried to provide the same
research setting for both places as in Figure 3.1. During the episodes of their teaching
experiment, each pair of students studied on the notebook computer on a long table
with two connected mousses in order to give each of them the opportunity to control
and manipulate the constructions. There were two digital cameras so that one of them
could capture the interactions among the pair of students and myself (Figure 3.2), and
the other could record computer screen (Figure 3.3).
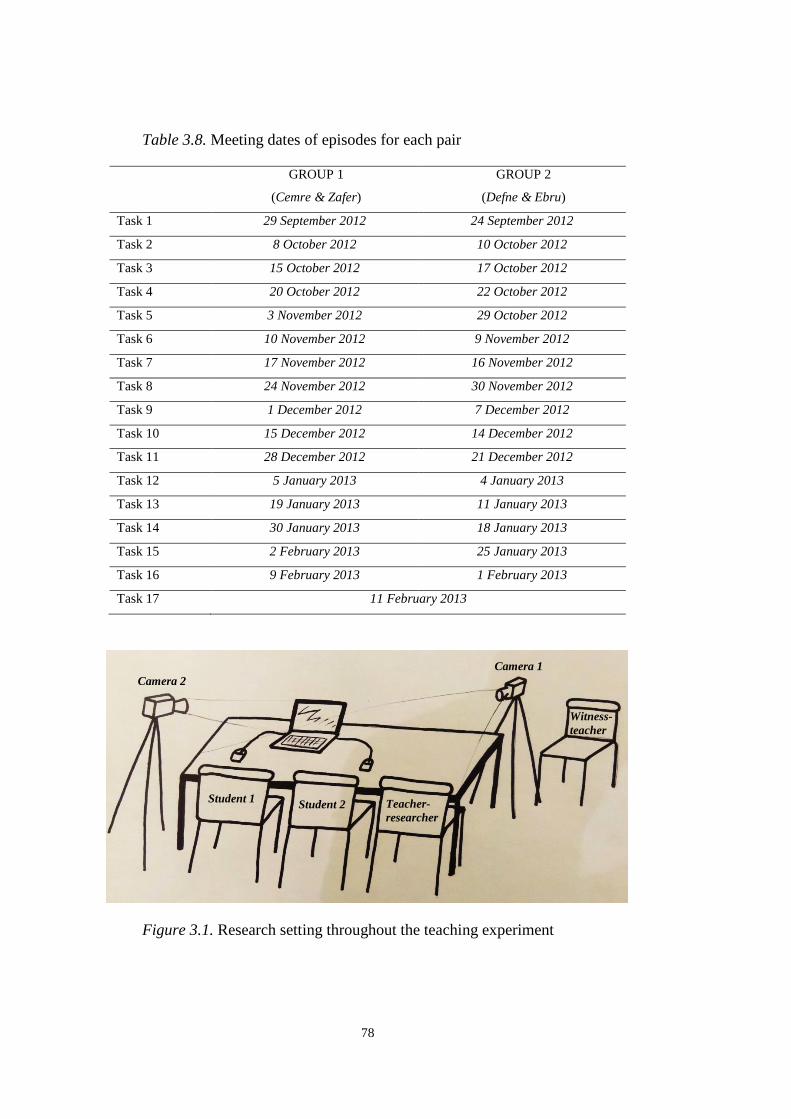
78
Table 3.8. Meeting dates of episodes for each pair
GROUP 1
(Cemre & Zafer)
GROUP 2
(Defne & Ebru)
Task 1 29 September 2012 24 September 2012
Task 2 8 October 2012 10 October 2012
Task 3 15 October 2012 17 October 2012
Task 4 20 October 2012 22 October 2012
Task 5 3 November 2012 29 October 2012
Task 6 10 November 2012 9 November 2012
Task 7 17 November 2012 16 November 2012
Task 8 24 November 2012 30 November 2012
Task 9 1 December 2012 7 December 2012
Task 10 15 December 2012 14 December 2012
Task 11 28 December 2012 21 December 2012
Task 12 5 January 2013 4 January 2013
Task 13 19 January 2013 11 January 2013
Task 14 30 January 2013 18 January 2013
Task 15 2 February 2013 25 January 2013
Task 16 9 February 2013 1 February 2013
Task 17 11 February 2013
Figure 3.1. Research setting throughout the teaching experiment
Camera 2
Student 1 Student 2 Teacher-
researcher
Witness-
teacher
Camera 1

79
Figure 3.2. An example of the Camera 1’s snapshot from Task 11 with Group1
Figure 3.3. An example of the Camera 2’s snapshot from Task 12 with Group2
Multiple sources of data were collected during the teaching experiment through
field notes from direct observations of both I (as a teacher-researcher) and the witness-
teacher, worksheets participants produced, video recordings with two digital cameras.
These records were used for retrospective analysis both between episodes to prepare
subsequent episodes (Steffe & Thompson, 2000) and at the end of the teaching
experiment to build and revise the models of students’ concept images on
trigonometric functions.

80
3.8. Analysis of Data
3.8.1. Analysis of Initial Interviews
Analysis of the initial interview data started with viewing video-records and
students’ worksheets simultaneously to determine the related-parts to the first main
research question of the study and its sub-questions (see Research Questions heading
of Introduction chapter). Next, these parts were transcribed so as to represent both
students’ language and actions including gestures. After then, transcriptions re-
analyzed to determine the initial model of students’ concept images on trigonometric
functions prior to the teaching experiment. This modeling process was cyclic. It
included re-reading, re-viewing, re-organizing and re-thinking about data.
3.8.2. Analysis of Teaching Experiment
Both prospective and retrospective analyses of video-record were made in
chronological order to model developments of students’ concept images on
trigonometry. On the one hand, cognitive analyses of data were conducted in an on-
going way between episodes to prepare subsequent episodes in order to modify
students’ concept images as well as my role as a teacher-researcher when interacting
with students in order to guide my future interactions. On the other hand, at the end of
the teaching experiment, retrospective analyses were conducted in chronological order
to model students’ concept images to represent their developments. Students’ concept
images were modeled based on cognitive analyses of students’ mathematical actions
and languages. Duval’s (2006) recognition and discrimination cognitive skills and
Sfard’s (1991) interiorization, condensation and reification classification provided us
with a theoretical lens for these cognitive analyses.
On-going prospective analyses started with on the days each episode was
conducted. Initially, field notes were read. Next, video records were viewed to
81
understand (i) “what students did”, “how they did” and “why they did”, and (ii) “how
was the interaction”. And then, (if needed) new situations were designed and
composed in the following episode(s) to modify students’ concept images (These
situations were articulated with their reasons in detail together with mathematics of
students in Chapter 5).
On the other hand, at the end of the teaching experiment, all episodes’ video-
records were viewed for each pair correspondingly. However, this process required to
view 34 different –approximately 90-minute– episodes’ video-records from two pairs
of students. Therefore, these video-records’ cognitive analyses were conducted
through separating them into three parts corresponding to three main parts of the
instructional design of the teaching experiment (see Instructional Design of This Study
and Cognitive Base of Designed-Instruction of This Study headings in this chapter).
Video records of the first seven episodes of the teaching experiment from each
pair were viewed in chronological order correspondingly to determine important parts
referring to (i) students’ concept definition images related to angle and trigonometric
functions, as well as (ii) students’ recognition of the basic form of trigonometric
functions within and between different representational registers.
Video-records of following nine episodes were also viewed in chronological
order correspondingly from two pairs to determine important parts referring to (i)
students’ recognition of the general form of trigonometric functions within and
between different representational registers, and (ii) students’ discrimination of
trigonometric functions represented within any representational register from their
respective representational registers’ contents.
Finally, video records of Modeling Task [i.e., 17th episode] were viewed
correspondingly from two pairs to determine important parts referring to (i) students’
abilities to transform their knowledge on trigonometric functions in the (unit) circle
register (located on coordinate plane) to the any circular context, and (ii) students’
conversion troubles between the (unit) circle register and the symbolic register in a
problem solving context.
82
After determination of the important parts as it is mentioned above, all these
parts were transcribed so as to represent both students’ language and actions including
gestures. And then, transcriptions were analyzed line-by-line to model development of
students’ concept images on trigonometric functions during the teaching experiment
through comparing and contrasting with eachother. This modeling process was cyclic.
It included re-reading, re-viewing, re-organizing and re-thinking about data.
3.9. Ethical Aspects
Throughout the study, the ethical aspects were considered. Moreover, as an
important ethical aspect, confidentiality of research data was provided in two ways: by
exchanging names of the students with pseudonyms, and by keeping those safe so that
it could be prevented, except the teacher-researcher and the witness-teacher, everyone
from reaching them.
83
CHAPTER 4
4. RESULTS FROM INITIAL INTERVIEWS
In this chapter, students’ understanding on foundational concepts related to
trigonometric functions is presented from cognitive analyses results of the initial
interviews. As foundational trigonometric concepts, functions23, angle24, angle
measure25, trigonometric value26, trigonometric functions and periodicity27 were
determined based on trigonometry research literature, historical development of
trigonometry, our exploratory teaching experience, and initial interview results. The
aim of this chapter is to provide the initial models of students’ concept images on
trigonometric functions prior to the teaching experiment. This chapter represents
trigonometry of students prior to the teaching experiment in terms of their recognition
problems on trigonometric functions within any representational register,
discrimination problems between trigonometric functions represented within any
representational register and the respective representational registers’ contents, as well
as potential conflict factors in their concept images on trigonometry.
23 Reasoning about trigonometric functions as functions is critical in understanding of trigonometric functions
(Hertel & Cullen, 2011; Thompson, 2008; Weber, 2005).
24 Angle and angle measure are two different concepts that is needed to be dissociated from each other (Argün,
Arıkan, Bulut, & Halıcıoğlu, 2014).
25 Reasoning about angle measure as the (meaningful) numbers referring to the argument of trigonometric
functions (Thompson, 2008) is important in understanding of trigonometric functions.
26 Trigonometric values correspond to the outputs of trigonometric functions.
27 Trgionometric functions are natural and fundamental examples of periodic functions. Understanding of
periodicity requires dual and simultaneous reasoning about (i) regular intervals of DOMAIN and (ii)
corresponding repeated values in RANGE.
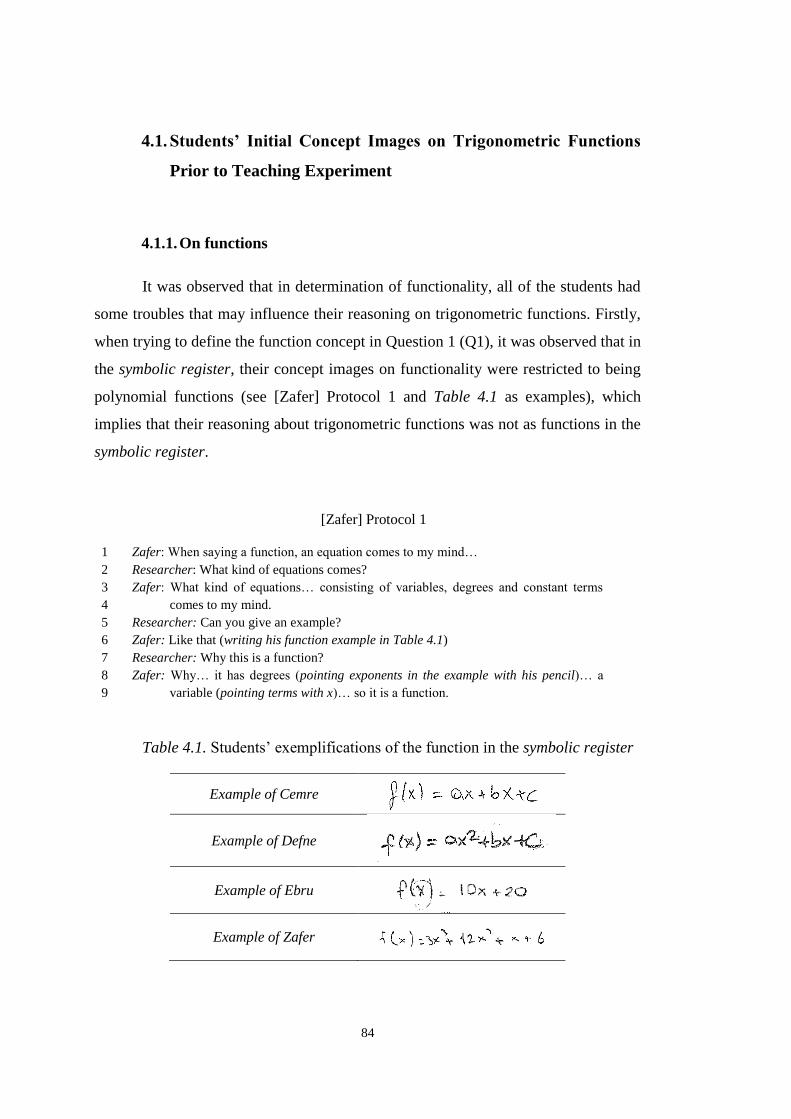
84
4.1. Students’ Initial Concept Images on Trigonometric Functions
Prior to Teaching Experiment
4.1.1. On functions
It was observed that in determination of functionality, all of the students had
some troubles that may influence their reasoning on trigonometric functions. Firstly,
when trying to define the function concept in Question 1 (Q1), it was observed that in
the symbolic register, their concept images on functionality were restricted to being
polynomial functions (see [Zafer] Protocol 1 and Table 4.1 as examples), which
implies that their reasoning about trigonometric functions was not as functions in the
symbolic register.
[Zafer] Protocol 1
Zafer: When saying a function, an equation comes to my mind… 1
Researcher: What kind of equations comes? 2
Zafer: What kind of equations… consisting of variables, degrees and constant terms 3
comes to my mind. 4
Researcher: Can you give an example? 5
Zafer: Like that (writing his function example in Table 4.1) 6
Researcher: Why this is a function? 7
Zafer: Why… it has degrees (pointing exponents in the example with his pencil)… a 8
variable (pointing terms with x)… so it is a function. 9
Table 4.1. Students’ exemplifications of the function in the symbolic register
Example of Cemre
Example of Defne
Example of Ebru
Example of Zafer

85
Secondly, their concept images on functionality included some conversion
troubles arising in the multi-functional and non-discursive register from usage of the
associated processes for being a function within the graphical register. For example,
in Q2 when determining whether the location of the caterpillar on the paper with
respect to time could be a function or not, Zafer transferred his knowledge on the
vertical-line test (corresponding to the circumstance for being a function that each
input in the domain must be related to exactly one output in the range) within the
graphical register (or the mono-functional and non-discursive register) into the multi-
functional and non-discursive register. He constructed a vertical-line on the
caterpillar’s path (Figure 4.1) and then explained that “it [the caterpillar’s location on
the paper with respect to time] is not a function… because… when drawn a straight
line like that… It is passing through two different points (concretizing two intersection
points of the path with the vertical line)”. Thus, it appears for Zafer to unable to
dissociate different meanings of the curve within these two different representational
registers.
Figure 4.1. Zafer’s transformation of the vertical-line test within the graphical
register into the multi-functional and non-discursive register
All these troubles related to functionality mentioned above arise from their
dominated concept images on functions by polynomial functions in the symbolic
register and their dominated mental images on functions within the multi-functional
and non-discursive register by the graphical register.
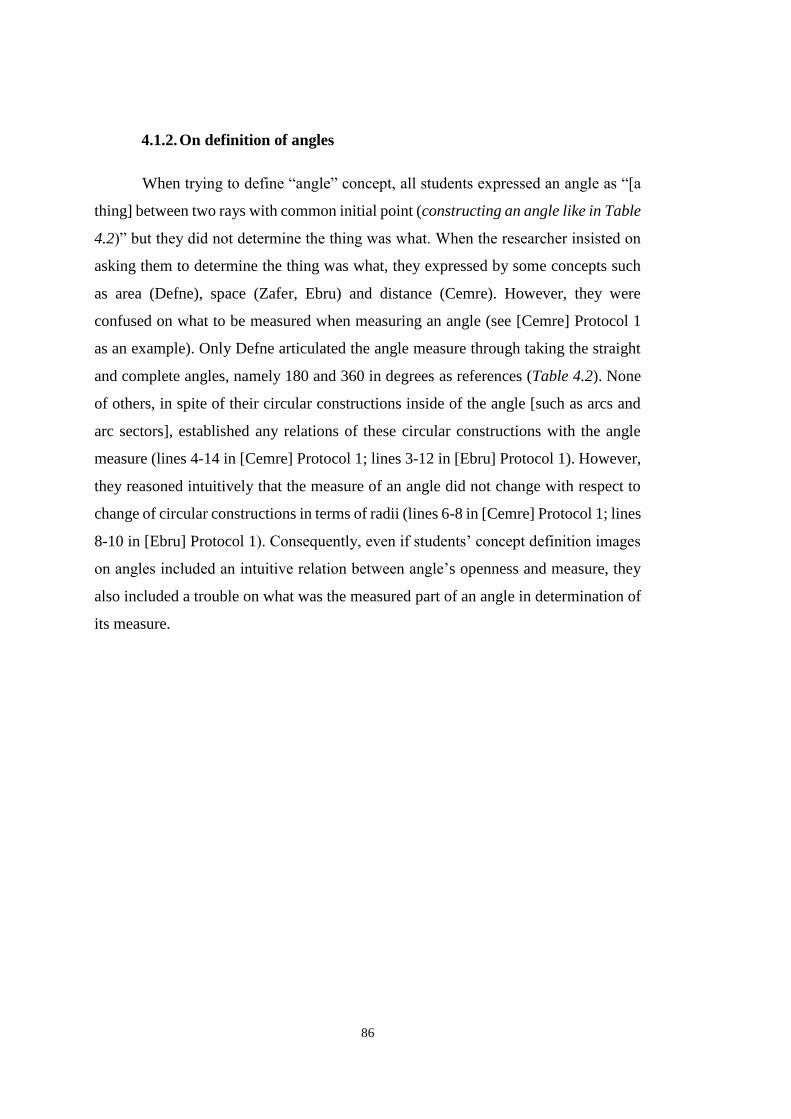
86
4.1.2. On definition of angles
When trying to define “angle” concept, all students expressed an angle as “[a
thing] between two rays with common initial point (constructing an angle like in Table
4.2)” but they did not determine the thing was what. When the researcher insisted on
asking them to determine the thing was what, they expressed by some concepts such
as area (Defne), space (Zafer, Ebru) and distance (Cemre). However, they were
confused on what to be measured when measuring an angle (see [Cemre] Protocol 1
as an example). Only Defne articulated the angle measure through taking the straight
and complete angles, namely 180 and 360 in degrees as references (Table 4.2). None
of others, in spite of their circular constructions inside of the angle [such as arcs and
arc sectors], established any relations of these circular constructions with the angle
measure (lines 4-14 in [Cemre] Protocol 1; lines 3-12 in [Ebru] Protocol 1). However,
they reasoned intuitively that the measure of an angle did not change with respect to
change of circular constructions in terms of radii (lines 6-8 in [Cemre] Protocol 1; lines
8-10 in [Ebru] Protocol 1). Consequently, even if students’ concept definition images
on angles included an intuitive relation between angle’s openness and measure, they
also included a trouble on what was the measured part of an angle in determination of
its measure.

87
Table 4.2. Students’ constructions of angle*
Cemre’s construction
Defne’s construction
Ebru’s construction
* Zafer preferred to articulate the angle by his construction in the first quadrant of the unit circle like in
Table 4.3, instead of constructing new one.
[Cemre] Protocol 1
Researcher: What is the angle? 1
Cemre: It is a thing between two lines… type of degrees… we measure… A thing but I 2
didn’t express what. (After 6-second pause) for example, here is an angle 3
(constructing rays of an angle like in Table 4.2)… distance between two 4
intersecting lines (drawing the black arc)... 5
Researcher: Well. What about this distance (drawing the green arc)? Does it mean the 6
same angle? 7
Cemre: Yes. 8
Researcher: But their distances are not same. How they are referring to the same angle? 9
Cemre: They are the same in degrees. 10
Researcher: Then, angle should be different from “distance”, is it? 11
Cemre: Yes. 12
Researcher: Well, what is the angle? 13
Cemre: (Smiling and stopping speaking and looking to the angle she constructed) 14
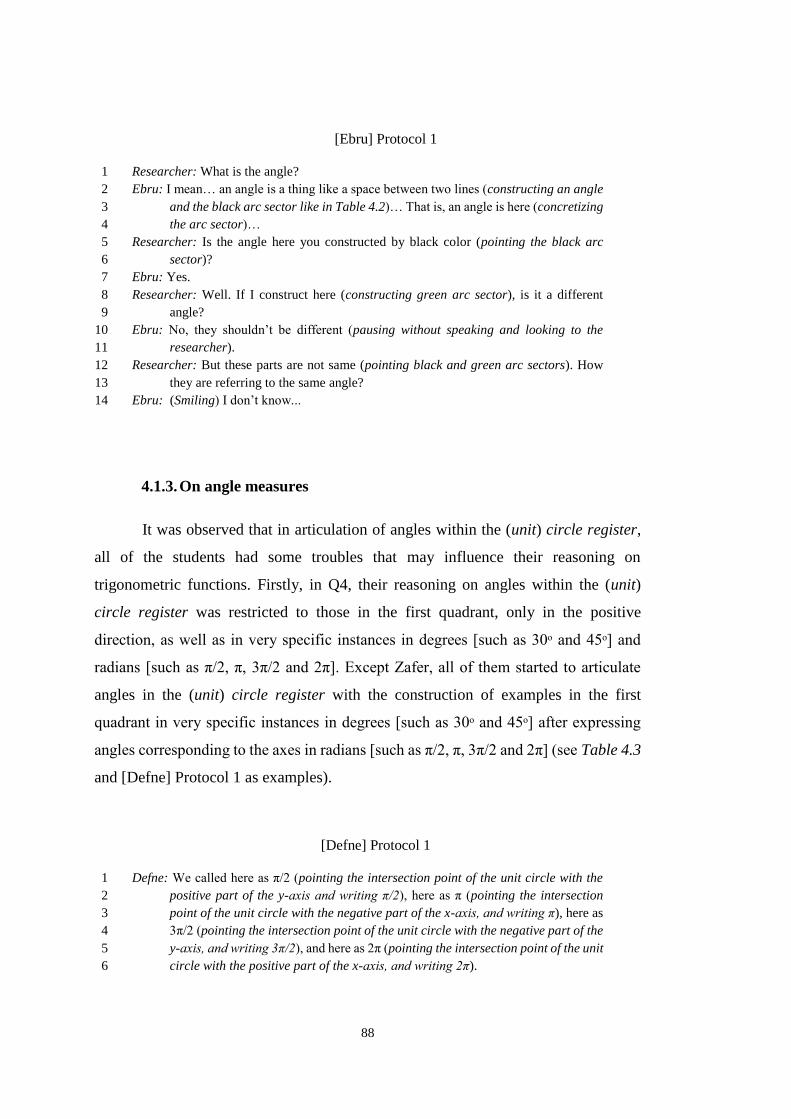
88
[Ebru] Protocol 1
Researcher: What is the angle? 1
Ebru: I mean… an angle is a thing like a space between two lines (constructing an angle 2
and the black arc sector like in Table 4.2)… That is, an angle is here (concretizing 3
the arc sector)… 4
Researcher: Is the angle here you constructed by black color (pointing the black arc 5
sector)? 6
Ebru: Yes. 7
Researcher: Well. If I construct here (constructing green arc sector), is it a different 8
angle? 9
Ebru: No, they shouldn’t be different (pausing without speaking and looking to the 10
researcher). 11
Researcher: But these parts are not same (pointing black and green arc sectors). How 12
they are referring to the same angle? 13
Ebru: (Smiling) I don’t know... 14
4.1.3. On angle measures
It was observed that in articulation of angles within the (unit) circle register,
all of the students had some troubles that may influence their reasoning on
trigonometric functions. Firstly, in Q4, their reasoning on angles within the (unit)
circle register was restricted to those in the first quadrant, only in the positive
direction, as well as in very specific instances in degrees [such as 30ᵒ and 45ᵒ] and
radians [such as π/2, π, 3π/2 and 2π]. Except Zafer, all of them started to articulate
angles in the (unit) circle register with the construction of examples in the first
quadrant in very specific instances in degrees [such as 30ᵒ and 45ᵒ] after expressing
angles corresponding to the axes in radians [such as π/2, π, 3π/2 and 2π] (see Table 4.3
and [Defne] Protocol 1 as examples).
[Defne] Protocol 1
Defne: We called here as π/2 (pointing the intersection point of the unit circle with the 1
positive part of the y-axis and writing π/2), here as π (pointing the intersection 2
point of the unit circle with the negative part of the x-axis, and writing π), here as 3
3π/2 (pointing the intersection point of the unit circle with the negative part of the 4
y-axis, and writing 3π/2), and here as 2π (pointing the intersection point of the unit 5
circle with the positive part of the x-axis, and writing 2π). 6
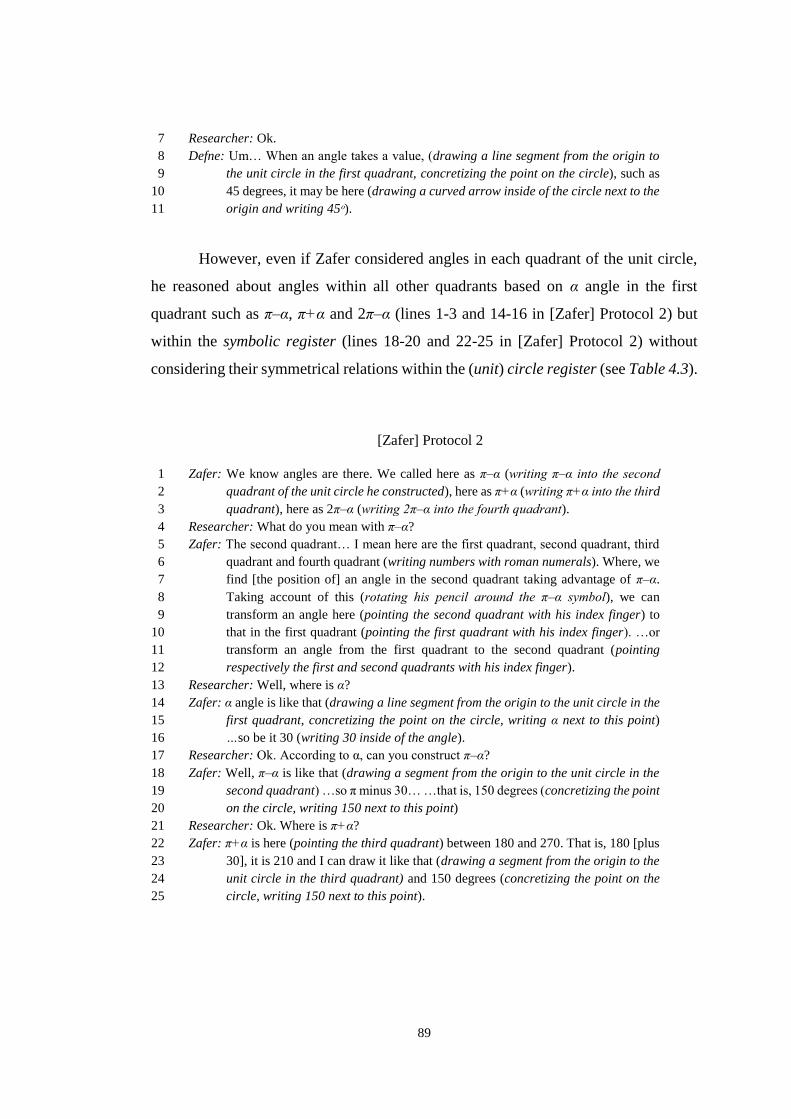
89
Researcher: Ok. 7
Defne: Um… When an angle takes a value, (drawing a line segment from the origin to 8
the unit circle in the first quadrant, concretizing the point on the circle), such as 9
45 degrees, it may be here (drawing a curved arrow inside of the circle next to the 10
origin and writing 45ᵒ). 11
However, even if Zafer considered angles in each quadrant of the unit circle,
he reasoned about angles within all other quadrants based on α angle in the first
quadrant such as π–α, π+α and 2π–α (lines 1-3 and 14-16 in [Zafer] Protocol 2) but
within the symbolic register (lines 18-20 and 22-25 in [Zafer] Protocol 2) without
considering their symmetrical relations within the (unit) circle register (see Table 4.3).
[Zafer] Protocol 2
Zafer: We know angles are there. We called here as π–α (writing π–α into the second 1
quadrant of the unit circle he constructed), here as π+α (writing π+α into the third 2
quadrant), here as 2π–α (writing 2π–α into the fourth quadrant). 3
Researcher: What do you mean with π–α? 4
Zafer: The second quadrant… I mean here are the first quadrant, second quadrant, third 5
quadrant and fourth quadrant (writing numbers with roman numerals). Where, we 6
find [the position of] an angle in the second quadrant taking advantage of π–α. 7
Taking account of this (rotating his pencil around the π–α symbol), we can 8
transform an angle here (pointing the second quadrant with his index finger) to 9
that in the first quadrant (pointing the first quadrant with his index finger). …or 10
transform an angle from the first quadrant to the second quadrant (pointing 11
respectively the first and second quadrants with his index finger). 12
Researcher: Well, where is α? 13
Zafer: α angle is like that (drawing a line segment from the origin to the unit circle in the 14
first quadrant, concretizing the point on the circle, writing α next to this point) 15
…so be it 30 (writing 30 inside of the angle). 16
Researcher: Ok. According to α, can you construct π–α? 17
Zafer: Well, π–α is like that (drawing a segment from the origin to the unit circle in the 18
second quadrant) …so π minus 30… …that is, 150 degrees (concretizing the point 19
on the circle, writing 150 next to this point) 20
Researcher: Ok. Where is π+α? 21
Zafer: π+α is here (pointing the third quadrant) between 180 and 270. That is, 180 [plus 22
30], it is 210 and I can draw it like that (drawing a segment from the origin to the 23
unit circle in the third quadrant) and 150 degrees (concretizing the point on the 24
circle, writing 150 next to this point). 25
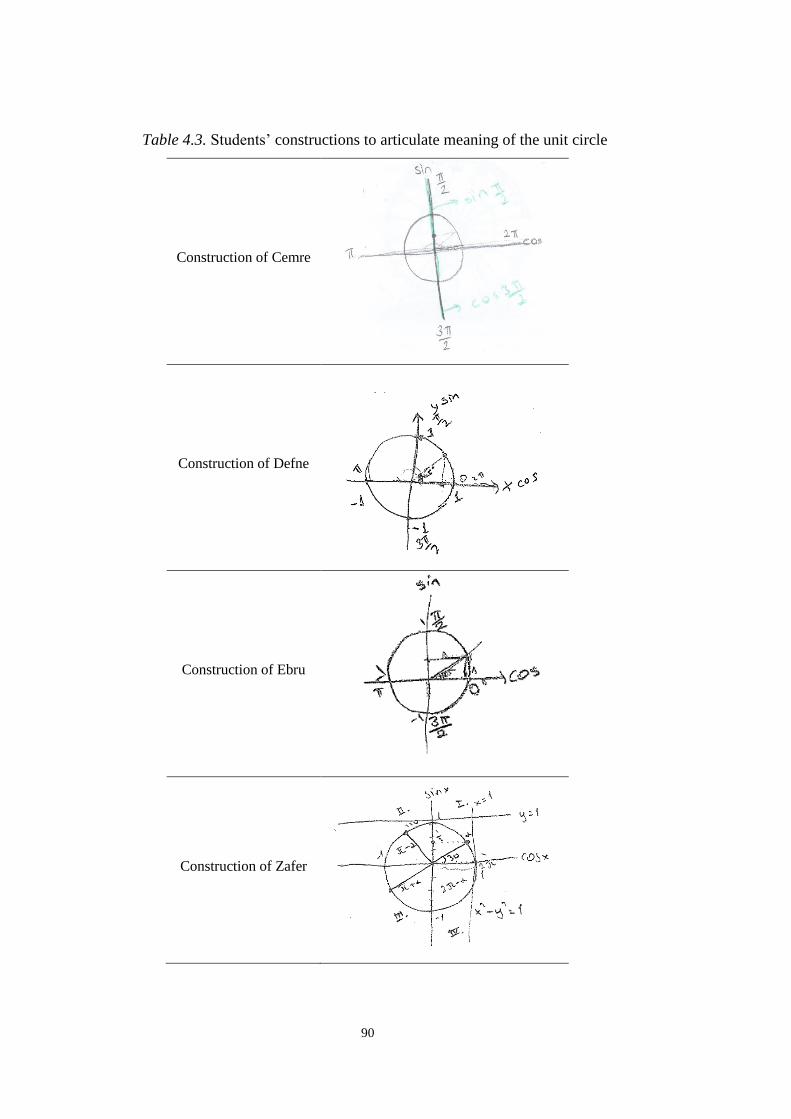
90
Table 4.3. Students’ constructions to articulate meaning of the unit circle
Construction of Cemre
Construction of Defne
Construction of Ebru
Construction of Zafer
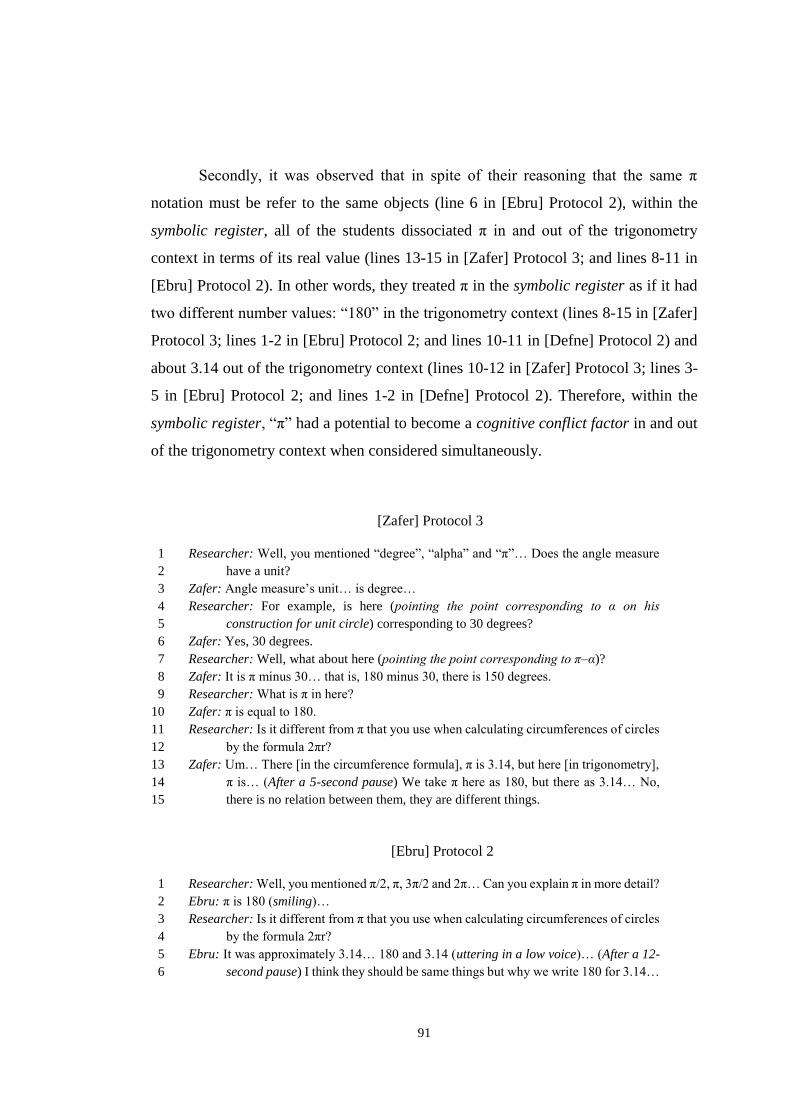
91
Secondly, it was observed that in spite of their reasoning that the same π
notation must be refer to the same objects (line 6 in [Ebru] Protocol 2), within the
symbolic register, all of the students dissociated π in and out of the trigonometry
context in terms of its real value (lines 13-15 in [Zafer] Protocol 3; and lines 8-11 in
[Ebru] Protocol 2). In other words, they treated π in the symbolic register as if it had
two different number values: “180” in the trigonometry context (lines 8-15 in [Zafer]
Protocol 3; lines 1-2 in [Ebru] Protocol 2; and lines 10-11 in [Defne] Protocol 2) and
about 3.14 out of the trigonometry context (lines 10-12 in [Zafer] Protocol 3; lines 3-
5 in [Ebru] Protocol 2; and lines 1-2 in [Defne] Protocol 2). Therefore, within the
symbolic register, “π” had a potential to become a cognitive conflict factor in and out
of the trigonometry context when considered simultaneously.
[Zafer] Protocol 3
Researcher: Well, you mentioned “degree”, “alpha” and “π”… Does the angle measure 1
have a unit? 2
Zafer: Angle measure’s unit… is degree… 3
Researcher: For example, is here (pointing the point corresponding to α on his 4
construction for unit circle) corresponding to 30 degrees? 5
Zafer: Yes, 30 degrees. 6
Researcher: Well, what about here (pointing the point corresponding to π–α)? 7
Zafer: It is π minus 30… that is, 180 minus 30, there is 150 degrees. 8
Researcher: What is π in here? 9
Zafer: π is equal to 180. 10
Researcher: Is it different from π that you use when calculating circumferences of circles 11
by the formula 2πr? 12
Zafer: Um… There [in the circumference formula], π is 3.14, but here [in trigonometry], 13
π is… (After a 5-second pause) We take π here as 180, but there as 3.14… No, 14
there is no relation between them, they are different things. 15
[Ebru] Protocol 2
Researcher: Well, you mentioned π/2, π, 3π/2 and 2π… Can you explain π in more detail? 1
Ebru: π is 180 (smiling)… 2
Researcher: Is it different from π that you use when calculating circumferences of circles 3
by the formula 2πr? 4
Ebru: It was approximately 3.14… 180 and 3.14 (uttering in a low voice)… (After a 12-5
second pause) I think they should be same things but why we write 180 for 3.14… 6

92
Researcher: Why do you think they are same? 7
Ebru: Eventually, both are π… …why we express them by the same notation if they were 8
different (a 7-second pause)… But, how and why one is 180 and the other is 3.14? 9
I don’t know… (After a 11-second pause) but I surmise… …they are as if 10
different… 11
[Defne] Protocol 2
Researcher: What do you think about cos(3.14)? 1
Defne: Well, then we find the value of cosine on 3.14… 2
Researcher: Ok. What is it approximately? 3
Defne: We think 3.14 as an angle… When saying cos(3.14), we should find the cosine 4
value corresponding to a 3.14-degree angle… cos(3.14)… (after a 7-second 5
pause, dragging her pencil in the first quadrant near the x-axis from the origin to 6
the right side on her construction for the unit circle) Then, it [3.14 as an angle] is 7
very small value… So, its cosine should be near the 1… 8
Researcher: Ok. What about cos(π)? 9
Defne: Then, you are asking the value of cosine of 180 (pointing the point on the unit 10
circle corresponding to the π-radian angle), it is minus 1… 11
Thirdly, when more critiques on π were done not only in the symbolic register
but also in the graphical register, as well as in and out of the trigonometry context on
Q6 and Q8, it was observed that students considered π in different representational
registers as being different mathematical objects which may correspond to different
real values (lines 28-42 in [Zafer] Protocol 7). In spite of their reasoning about the real
value of π within the symbolic register as 180 in the trigonometry context and as about
3.14 out of the trigonometry context (mentioned above), when dealing with conversion
activities (i.e., change of registers), some major troubles based on π were observed in
students’ reasoning.
First, on the one hand, when trying to convert the ordered pair (𝜋, 𝑓 (𝜋
6)) within
the symbolic register into the graphical register (see Table 4.4), Cemre and Defne
reasoned about its abscissa, π, through transferring their reasoning on π as 180 within
the symbolic register in the trigonometry context to that out of the trigonometry
context not only within the symbolic register (Table 4.4) but also within the graphical
register (Table 4.5). For example, before constructing the point corresponding to
(𝜋, 𝑓 (𝜋
6)) on the coordinate plane, after her determination of the value of its ordinate

93
as √3, Cemre said that “…π to √3, that is, 180 to √3 (writing her solution like in
Table 4.4)” and then constructed the point as if (180, √3) within the graphical
register. On the other hand, Ebru and Zafer reasoned about π, respectively, as if 𝜋 =
−1 and 2𝜋 = 1 within the graphical register (Table 4.5) through considering the
points on the unit circle corresponding to π and 2π as angle measures in radians within
the unit circle register. For example, when constructing the point corresponding to
(𝜋, √3) on the coordinate plane, Ebru reasoned that “…where is π on the x-axis…
(After 8-second pause) if we consider π in here, that is, minus one to zero like in the
unit circle (pointing a position on the left side of the x-axis regarding the origin with
her pen)… I think it should be here (concretizing the position)” and then constructed
the point within the graphical register like in Table 4.5. In a similar way, not only
when constructing the ordered pairs in Q6 on the coordinate plane (Table 4.5; and lines
10-12 in [Zafer] Protocol 4) but also when determining the position of a real number
on the x-axis scaled with numbers regarding π (lines 19-42 in [Zafer] Protocol 7), Zafer
reasoned that “…2π corresponds to 1 on the x-axis (pointing the intersection point of
the unit circle with the x-axis’s positive side which he constructed like in Table 4.3)”.
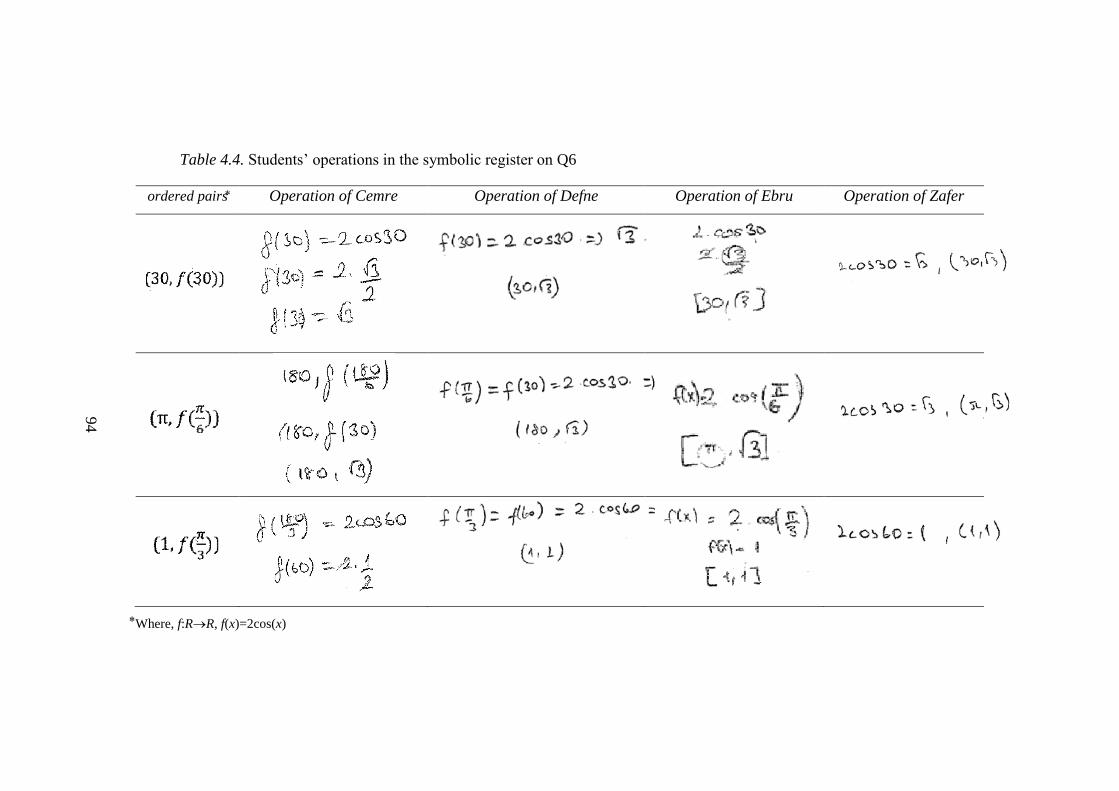
94
Table 4.4. Students’ operations in the symbolic register on Q6
ordered pairs Operation of Cemre Operation of Defne Operation of Ebru Operation of Zafer
Where, f:RR, f(x)=2cos(x)
94
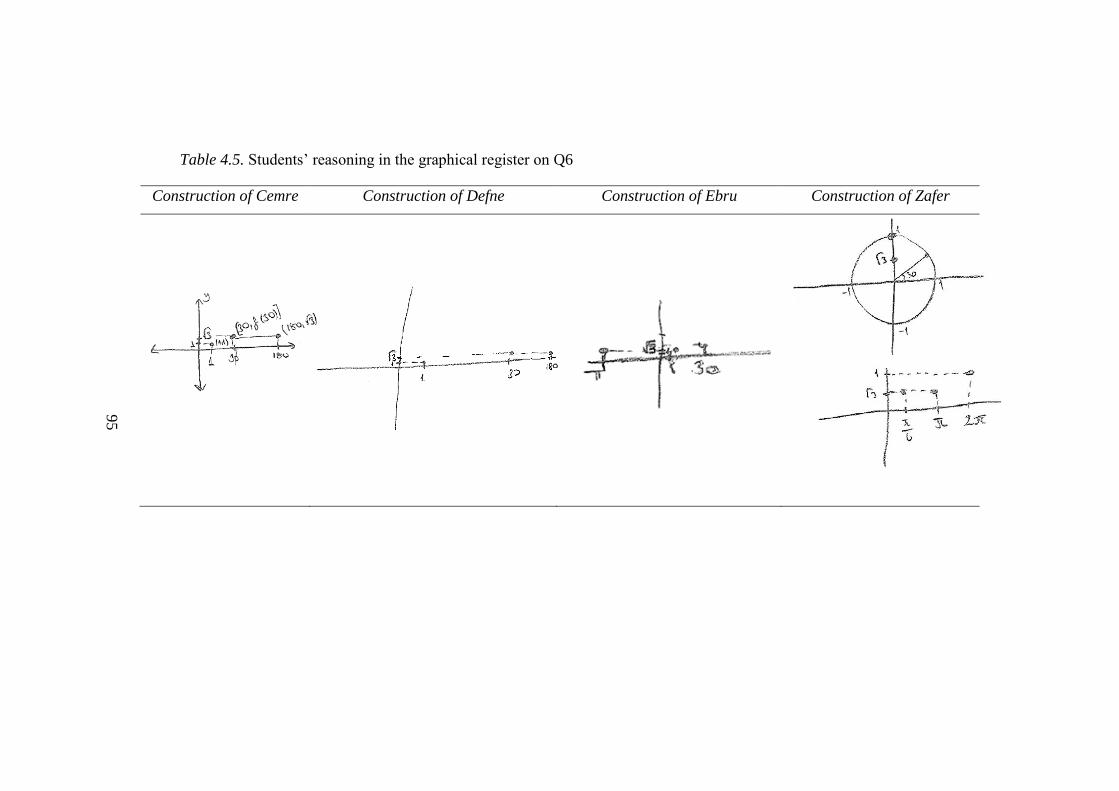
95
Table 4.5. Students’ reasoning in the graphical register on Q6
Construction of Cemre Construction of Defne Construction of Ebru Construction of Zafer
95

96
Second, in spite of her reasoning on π as 180 within the graphical register out
of the trigonometry context, a systematic variation of Defne’s reasoning on π was
observed as a consequence of the change of the source register from symbolic to
graphical and as a consequence of the variation on the scaling of the x-axis from
numbers regarding π to the real values. That is, when trying to convert the graph in Q8
into the symbolic register, Defne reasoned about the origin corresponding to “zero” on
the x-axis as if it was equal to 2π within the graphical register (Figure 4.2) through
considering the equivalence between 0 and 2π as angle measures in radians within the
unit circle register (Figure 4.3) (lines 29-41 in [Defne] Protocol 5).
Figure 4.2. Defne’s reasoning about the repetition of the graph in Q8
Figure 4.3. Defne’s reasoning about the domain and range of sine and cosine
in Q8
97
Third, in Q6 when determining ordinates of the given ordered pairs in the
symbolic register (see Table 4.4) that were defined by the cosine function, all of the
students accepted the argument as an angle in radians only if π notation exists in the
expression, otherwise as an angle in degrees. In other words, while their “seeing” of
30 in the expression 𝑓(30) = 2𝑐𝑜𝑠(30) was in degrees (lines 1 and 4 in [Cemre]
Protocol 2; and lines 1-4 in [Ebru] Protocol 3), their “seeing” of 𝜋
3 and
𝜋
6 in the
expressions 𝑓 (π
3) = 2𝑐𝑜𝑠(
π
3) and 𝑓 (
π
6) = 2𝑐𝑜𝑠(
π
6) were in radians (lines 10 and 17 in
[Cemre] Protocol 2; and lines 22-24 and 30-32 in [Ebru] Protocol 3). Besides, Ebru
and Zafer got confused about whether 30 in the x-component was an angle in degrees
or not because of their assumption on 30 in the function [𝑓(30) = 2𝑐𝑜𝑠(30)] as
degrees. Firstly, Ebru expressed her confusion about whether 30 in the x-component
should be assumed either as an angle in degrees or as a number (lines 4-19 in [Ebru]
Protocol 3). Secondly, Zafer also considered 30 in the x-component as an angle in
degrees in the symbolic register (line 10 in [Zafer] Protocol 4) and tried to show
(30, √3) on the (unit) circle register instead of on the graphical register (Table 4.5).
However, since he did not feel a satisfaction about this thinking process (lines 6-9 in
[Zafer] Protocol 4), he preferred to consider 30 as if it was equal to π/6 through
transforming 30 as if an angle in degrees to the corresponding value, π/6, in radians in
the symbolic register (lines 9-12 in [Zafer] Protocol 4), and then transferred this
reasoning within the graphical register apart from the unit circle (Table 4.5).
[Cemre] Protocol 2
Cemre: Where, I want firstly to find the value of cosine for 30, and then, to show on the 1
coordinate plane it (pointing the ordered pair (30, f(30)) with her pen) 2
Researcher: Ok. 3
Cemre: cos(30) is √3/2 (uttering in a low voice)… it should be multiplied with 2… That 4
is, it is asked from me to show 30 to √3 on the coordinate plane (writing her 5
solution for the ordered pair like in Table 4.4 and constructing a coordinate plane) 6
…so be here 30 (drawing a point on the x-axis), here √3 (drawing a point on the 7
y-axis) and so here 30 to √3 (constructing point corresponding to the ordered pair 8
(30, √3) and writing (30, √3) near this point). 9
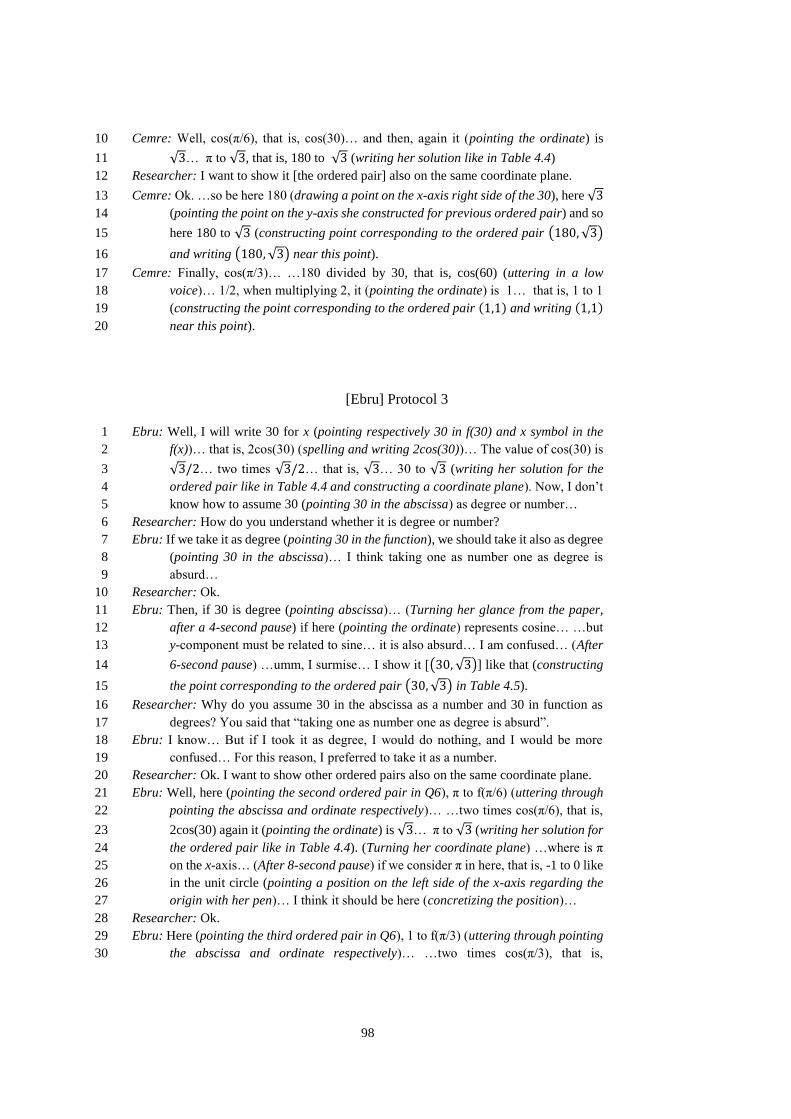
98
Cemre: Well, cos(π/6), that is, cos(30)… and then, again it (pointing the ordinate) is 10
√3… π to √3, that is, 180 to √3 (writing her solution like in Table 4.4) 11
Researcher: I want to show it [the ordered pair] also on the same coordinate plane. 12
Cemre: Ok. …so be here 180 (drawing a point on the x-axis right side of the 30), here √3 13
(pointing the point on the y-axis she constructed for previous ordered pair) and so 14
here 180 to √3 (constructing point corresponding to the ordered pair (180, √3) 15
and writing (180, √3) near this point). 16
Cemre: Finally, cos(π/3)… …180 divided by 30, that is, cos(60) (uttering in a low 17
voice)… 1/2, when multiplying 2, it (pointing the ordinate) is 1… that is, 1 to 1 18
(constructing the point corresponding to the ordered pair (1,1) and writing (1,1) 19
near this point). 20
[Ebru] Protocol 3
Ebru: Well, I will write 30 for x (pointing respectively 30 in f(30) and x symbol in the 1
f(x))… that is, 2cos(30) (spelling and writing 2cos(30))… The value of cos(30) is 2
√3/2… two times √3/2… that is, √3… 30 to √3 (writing her solution for the 3
ordered pair like in Table 4.4 and constructing a coordinate plane). Now, I don’t 4
know how to assume 30 (pointing 30 in the abscissa) as degree or number… 5
Researcher: How do you understand whether it is degree or number? 6
Ebru: If we take it as degree (pointing 30 in the function), we should take it also as degree 7
(pointing 30 in the abscissa)… I think taking one as number one as degree is 8
absurd… 9
Researcher: Ok. 10
Ebru: Then, if 30 is degree (pointing abscissa)… (Turning her glance from the paper, 11
after a 4-second pause) if here (pointing the ordinate) represents cosine… …but 12
y-component must be related to sine… it is also absurd… I am confused… (After 13
6-second pause) …umm, I surmise… I show it [(30, √3)] like that (constructing 14
the point corresponding to the ordered pair (30, √3) in Table 4.5). 15
Researcher: Why do you assume 30 in the abscissa as a number and 30 in function as 16
degrees? You said that “taking one as number one as degree is absurd”. 17
Ebru: I know… But if I took it as degree, I would do nothing, and I would be more 18
confused… For this reason, I preferred to take it as a number. 19
Researcher: Ok. I want to show other ordered pairs also on the same coordinate plane. 20
Ebru: Well, here (pointing the second ordered pair in Q6), π to f(π/6) (uttering through 21
pointing the abscissa and ordinate respectively)… …two times cos(π/6), that is, 22
2cos(30) again it (pointing the ordinate) is √3… π to √3 (writing her solution for 23
the ordered pair like in Table 4.4). (Turning her coordinate plane) …where is π 24
on the x-axis… (After 8-second pause) if we consider π in here, that is, -1 to 0 like 25
in the unit circle (pointing a position on the left side of the x-axis regarding the 26
origin with her pen)… I think it should be here (concretizing the position)… 27
Researcher: Ok. 28
Ebru: Here (pointing the third ordered pair in Q6), 1 to f(π/3) (uttering through pointing 29
the abscissa and ordinate respectively)… …two times cos(π/3), that is, 30
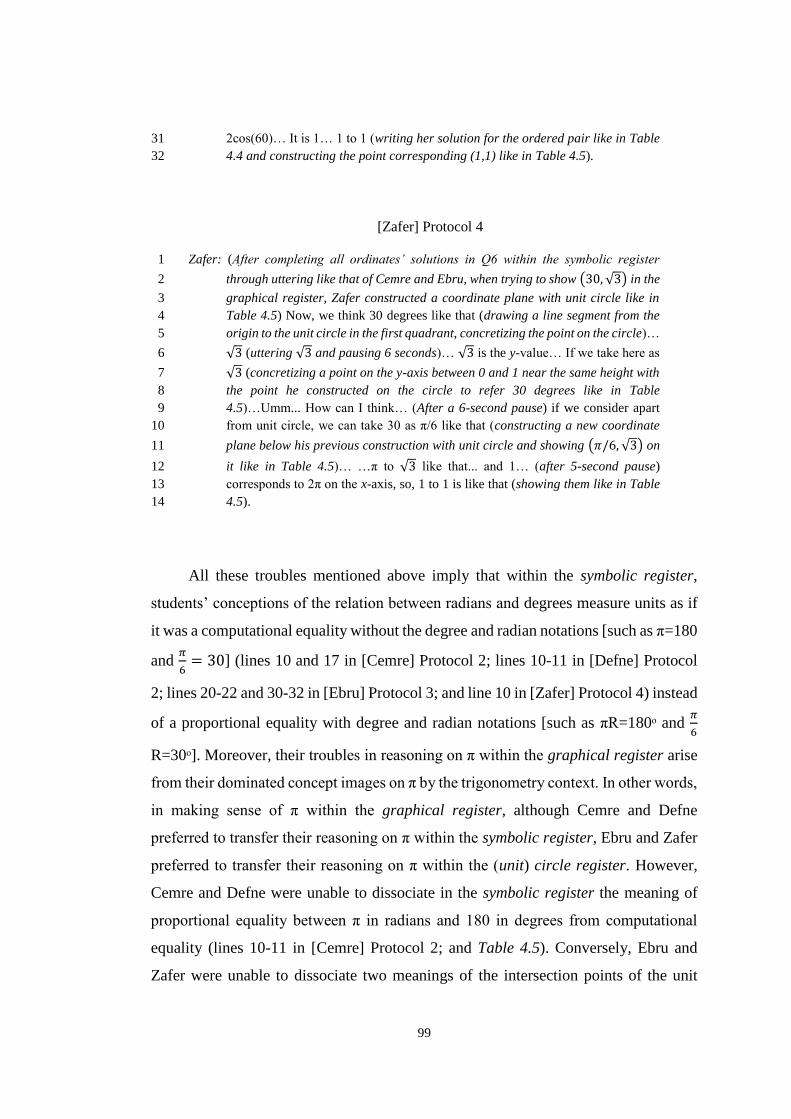
99
2cos(60)… It is 1… 1 to 1 (writing her solution for the ordered pair like in Table 31
4.4 and constructing the point corresponding (1,1) like in Table 4.5). 32
[Zafer] Protocol 4
Zafer: (After completing all ordinates’ solutions in Q6 within the symbolic register 1
through uttering like that of Cemre and Ebru, when trying to show (30, √3) in the 2
graphical register, Zafer constructed a coordinate plane with unit circle like in 3
Table 4.5) Now, we think 30 degrees like that (drawing a line segment from the 4
origin to the unit circle in the first quadrant, concretizing the point on the circle)… 5
√3 (uttering √3 and pausing 6 seconds)… √3 is the y-value… If we take here as 6
√3 (concretizing a point on the y-axis between 0 and 1 near the same height with 7
the point he constructed on the circle to refer 30 degrees like in Table 8
4.5)…Umm... How can I think… (After a 6-second pause) if we consider apart 9
from unit circle, we can take 30 as π/6 like that (constructing a new coordinate 10
plane below his previous construction with unit circle and showing (𝜋/6, √3) on 11
it like in Table 4.5)… …π to √3 like that... and 1… (after 5-second pause) 12
corresponds to 2π on the x-axis, so, 1 to 1 is like that (showing them like in Table 13
4.5). 14
All these troubles mentioned above imply that within the symbolic register,
students’ conceptions of the relation between radians and degrees measure units as if
it was a computational equality without the degree and radian notations [such as π=180
and 𝜋
6= 30] (lines 10 and 17 in [Cemre] Protocol 2; lines 10-11 in [Defne] Protocol
2; lines 20-22 and 30-32 in [Ebru] Protocol 3; and line 10 in [Zafer] Protocol 4) instead
of a proportional equality with degree and radian notations [such as πR=180ᵒ and 𝜋
6
R=30ᵒ]. Moreover, their troubles in reasoning on π within the graphical register arise
from their dominated concept images on π by the trigonometry context. In other words,
in making sense of π within the graphical register, although Cemre and Defne
preferred to transfer their reasoning on π within the symbolic register, Ebru and Zafer
preferred to transfer their reasoning on π within the (unit) circle register. However,
Cemre and Defne were unable to dissociate in the symbolic register the meaning of
proportional equality between π in radians and 180 in degrees from computational
equality (lines 10-11 in [Cemre] Protocol 2; and Table 4.5). Conversely, Ebru and
Zafer were unable to dissociate two meanings of the intersection points of the unit

100
circle with the x-axis [i.e., the points (-1,0) and (1,0)] as an abscissa corresponding to
these points within the graphical register and as an angle in radians corresponding to
these points within the unit circle register, which arose from their mental images on
angles as points on the circle instead of corresponding arcs. Besides, when trying to
convert her reasoning on π within the (unit) circle register into the graphical register,
Defne was unable to dissociate the meaning of the equivalence between “zero” and 2π
in radians from the equality between them within the graphical register, which arose
from her dominated concept image on principal angles (lines 40-41 in [Defne] Protocol
5) despite of her mental image on angles as dynamic turning (Figure 4.3, lines 8-11 in
[Defne] Protocol 1, and lines 29-41 in [Defne] Protocol 5).
To sum up, students’ reasoning on π in different representational registers
indicates that “coordinate plane” became a cognitive conflict factor when the position
of π on the x-axis is considered simultaneously within the graphical register and the
(unit) circle register.
4.1.4. On definition of trigonometric functions
It was observed that when trying to define sine and cosine in Q5, none of the
students mentioned them as functions (e.g., lines 1-6 in [Cemre] Protocol 3). Instead,
they defined sine and cosine firstly as values obtained from calculations of the ratios
in the right triangle context [respectively, as opposite side/hypotenuse and adjacent
side/hypotenuse] (lines 8-13 in [Cemre] Protocol 3; and Table 4.6). However, they
were not aware that these ratios for an angle in a right triangle were the same as those
in all similar right triangles (e.g., lines 5-7 in [Ebru] Protocol 4). This unawareness
arose from their reasoning about sine and cosine within the right triangle context as
calculations instead of ratios obtained from proportions in the similar right triangles.

101
[Cemre] Protocol 3
Researcher: What comes to your mind when thinking about sine or cosine? 1
Cemre: sine and cosine… conversion formulas come, the unit circle comes… degrees 2
come… π comes… right triangle comes… what else? (After 7-second pause) 3
nothing else comes to my mind… 4
Researcher: Ok. Does function comes? 5
Cemre: No, function doesn’t come to my mind now… 6
Researcher: How to define sine and cosine? 7
Cemre: In a right triangle, sine is opposite/hypotenuse and cosine is adjacent/hypotenuse 8
(drawing a right triangle with specific angle measures in degrees 30ᵒ-60ᵒ-90ᵒ and 9
writing these ratios like in Table 4.6) If the opposite side of the 30 is 1, then that 10
of 60 is √3, that of 90 is 2 (writing these values corresponding sides of her 11
construction of right triangle through uttering)… So sin60 is √3/2 and sin30 is 12
1/2… 13
[Ebru] Protocol 4
Researcher: For example, I take this small right triangle (drawing the green segment in 1
the right triangle that Ebru constructed like in Table 4.6), again is opposite 2
side/hypotenuse or sine of this angle (pointing x angle in Ebru’s construction) 3
same? 4
Ebru: (After a 6-second pause) I think they are different… …because hypotenuses 5
[lengths] of big triangle and small triangle are different, then their sine should 6
differ (pointing the sine formula she wrote)… 7

102
Table 4.6. Students’ definitions of sine and cosine
Cemre
Defne
Ebru
Zafer
Secondly, when articulating the unit circle, all students expressed the x-axis as
the cosine axis and y-axis as the sine axis without awareness of the correlation between
x-axis [y-axis] and cosine [sine] (see Table 4.3 and [Defne] Protocol 3 as examples).
They preferred to define sine and cosine for an angle but in the first quadrant by a set
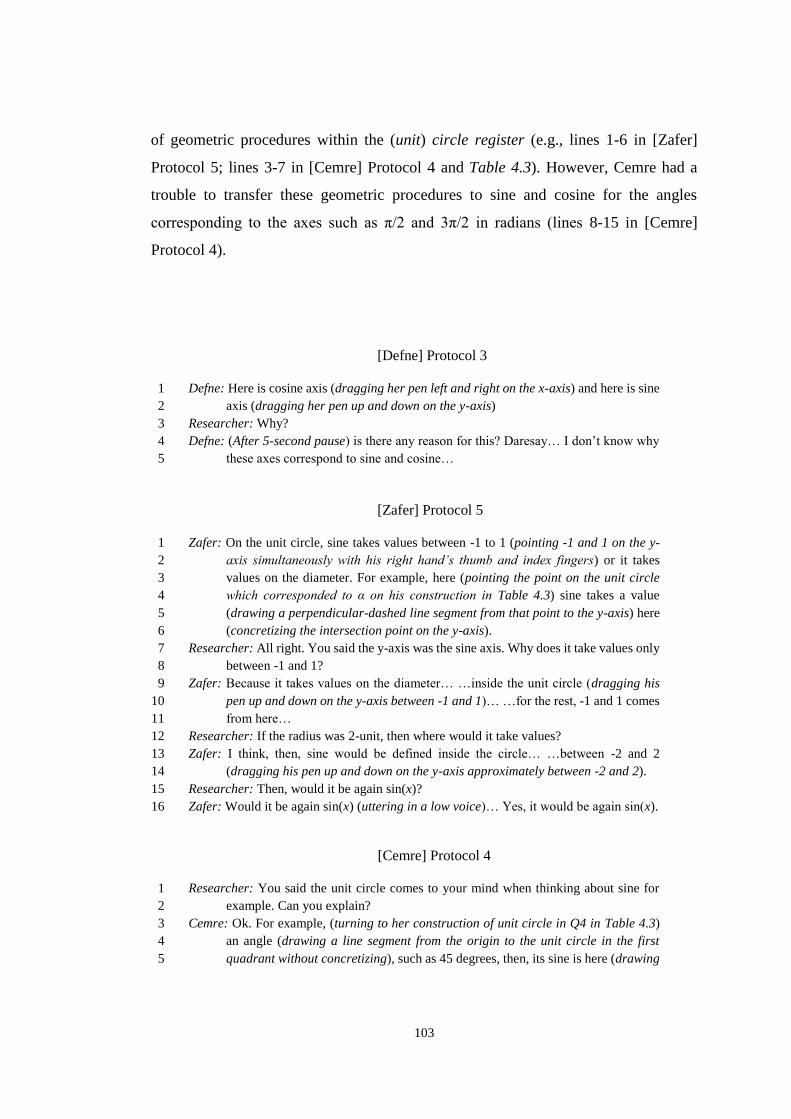
103
of geometric procedures within the (unit) circle register (e.g., lines 1-6 in [Zafer]
Protocol 5; lines 3-7 in [Cemre] Protocol 4 and Table 4.3). However, Cemre had a
trouble to transfer these geometric procedures to sine and cosine for the angles
corresponding to the axes such as π/2 and 3π/2 in radians (lines 8-15 in [Cemre]
Protocol 4).
[Defne] Protocol 3
Defne: Here is cosine axis (dragging her pen left and right on the x-axis) and here is sine 1
axis (dragging her pen up and down on the y-axis) 2
Researcher: Why? 3
Defne: (After 5-second pause) is there any reason for this? Daresay… I don’t know why 4
these axes correspond to sine and cosine… 5
[Zafer] Protocol 5
Zafer: On the unit circle, sine takes values between -1 to 1 (pointing -1 and 1 on the y-1
axis simultaneously with his right hand’s thumb and index fingers) or it takes 2
values on the diameter. For example, here (pointing the point on the unit circle 3
which corresponded to α on his construction in Table 4.3) sine takes a value 4
(drawing a perpendicular-dashed line segment from that point to the y-axis) here 5
(concretizing the intersection point on the y-axis). 6
Researcher: All right. You said the y-axis was the sine axis. Why does it take values only 7
between -1 and 1? 8
Zafer: Because it takes values on the diameter… …inside the unit circle (dragging his 9
pen up and down on the y-axis between -1 and 1)… …for the rest, -1 and 1 comes 10
from here… 11
Researcher: If the radius was 2-unit, then where would it take values? 12
Zafer: I think, then, sine would be defined inside the circle… …between -2 and 2 13
(dragging his pen up and down on the y-axis approximately between -2 and 2). 14
Researcher: Then, would it be again sin(x)? 15
Zafer: Would it be again sin(x) (uttering in a low voice)… Yes, it would be again sin(x). 16
[Cemre] Protocol 4
Researcher: You said the unit circle comes to your mind when thinking about sine for 1
example. Can you explain? 2
Cemre: Ok. For example, (turning to her construction of unit circle in Q4 in Table 4.3) 3
an angle (drawing a line segment from the origin to the unit circle in the first 4
quadrant without concretizing), such as 45 degrees, then, its sine is here (drawing 5

104
a perpendicular line segment to the y-axis and concretizing the intersection point 6
on the y-axis). 7
Researcher: Well. You said also, π comes to your mind. Can you explain how to find sin 8
of π/2 from the unit circle, for example? 9
Cemre: Umm… sin(π/2) is here (drawing the positive part of the y-axis from the origin 10
to up with the green pencil) 11
Researcher: Ok. What about cosin of 3π/2? 12
Cemre: cos(3π/2) (uttering in a low voice)… (After 11-second pause) cos(3π/2) is here 13
(drawing the negative part of the y-axis from the origin to down with the green 14
pencil). 15
Thirdly, Ebru preferred to convert her definition of sine and cosine as a set of
geometric procedures within the (unit) circle register into the symbolic register as
coordinates of a point on the unit circle [respectively, y-component and x-component]
(Figure 4.4). However, it was observed that she made an over-generalization of this
concept definition within the symbolic register to an arbitrary ordered pair. In other
words, she thought an arbitrary ordered pair’s abscissa as cosine and ordinate as sine.
For instance, when converting the ordered pairs in the Q6 within the symbolic register
to the corresponding points in the graphical register, she confused about their
ordinates that were defined by a function with respect to cosine as a consequence of
her over-generalized reasoning about the ordinate of an ordered-pair as sine (lines 12-
14 in [Ebru] Protocol 3). It may due to her consideration of the whole x-axis as the
cosine axis and the whole y-axis as the sine axis without awareness of the correlation
between the x-axis [y-axis] and cosine [sine].
Figure 4.4. Ebru’s conversions about definition of sine and cosine from the
(unit) circle register into the symbolic register
Finally, when defining sine and cosine on the unit circle, all students’ mental
images related to sine [cosine] of an angle were the point on the y-axis [x-axis] instead

105
of the reference right triangle’s opposite leg [adjacent leg] within the (unit) circle
register (lines 1-6 in [Zafer] Protocol 5; lines 3-7 in [Cemre] Protocol 4 and Table 4.3).
This mental image led students to encounter troubles in reasoning about coordinates
of a point on a non-unit circle (lines 7-16 in [Zafer] Protocol 5). This implies students’
compartmentalized concept definition images within the right triangle context and the
unit circle context.
4.1.5. On values of trigonometric functions
All students reasoned that sine and cosine takes their values between -1 and 1
(Figure 4.3, Zafer’s definition in Table 4.6, line 1 in [Zafer] Protocol 5, lines 33-35 in
[Defne] Protocol 5). However, it was observed that all of them faced some troubles
about ranges of sine and cosine as a consequence of their inabilities to dissociate ranges
of sine and cosine functions’ basic forms and those of their general forms. Firstly,
when converting the ordered pairs in Q6 within the symbolic register to the
corresponding points in the graphical register, Zafer got confused about the positions
of their ordinates [which were defined by the cosine function like in Table 4.4] on the
y-axis within the graphical register as a consequence of his transformation of his
reasoning about the range of cosine function’s basic form within the unit circle register
(lines 1-6 in [Zafer] Protocol 5) onto reasoning about a general form of cosine function
(lines 4-9 in [Zafer] Protocol 4), firstly, within the (unit) circle register, and then,
within the graphical register (see Construction of Zafer in Table 4.5). In other words,
he determined the position of √3 on the y-axis as if it was smaller than 1 as a
consequence of his reasoning that cosine takes their values on the diameter without
considering √3 as the value of 2cos(𝜋
6).
Secondly, when trying to convert the function within the graphical register to
the symbolic register in Q8, although Defne, Ebru and Zafer brought sine and/or cosine
functions to their mind considering to the shape of the graph independent from the
coordinate plane (line 1 in [Ebru] Protocol 6; line 11 in [Defne] Protocol 5; and lines
4-6 in [Zafer] Protocol 7), they were unable to reason about the function in the

106
symbolic register as a consequence of their failure to dissociate the content of the
trigonometric functions’ graphs in the general form and those in the basic form [which
were their first represented forms] in terms of “range”. That is, they got confused about
the range of the function given by the graph in Q8 concerning whether the range of a
function with respect to sine (or cosine) can include only positive values, as well as
the greater values than 1 considering the range of the basic forms of the sine and cosine
functions within the graphical register (lines 11, 16-19 in [Defne] Protocol 5; lines 1-
4 in [Ebru] Protocol 6; and lines 4-6 in [Zafer] Protocol 7).
In addition to their troubles about ranges of sine and cosine functions
mentioned above, students encountered some other troubles when trying to determine
the angle measures corresponding to −√3
2 under the 𝑦 = 𝑠𝑖𝑛(𝑥) function in Q7. Firstly,
a systematic variation of students’ performances was observed as a consequence of the
variation on the sign of the trigonometric value from positive to negative. Initially, all
of them preferred to reason without seeing the negative sign of −√3
2, and determined
x as 60. Where, while Zafer determined 60 [degrees] verbally according to his
memorization in the symbolic register, and then, transferred it in radians as π/3 in
written (lines 1-2 in [Zafer] Protocol 6), others preferred to construct a right triangle
in determination of 60 [degrees] (Table 4.7; lines 1-2 in [Cemre] Protocol 5; line 1 in
[Defne] Protocol 4; and line 1 in [Ebru] Protocol 5). However, in determination
process for −√3
2, except Defne (see Defne’s construction in Table 4.8), all others
encountered some troubles arising from difficulties in conversion of a trigonometric
equation given in the symbolic register into the corresponding construction within the
(unit) circle register.
For example, despite of her true explanation about the quadrants in which sine
takes negative values (line 2 in [Ebru] Protocol 5), Ebru could construct neither angles’
position within these quadrants not their sine values (see Ebru’s construction in the
Table 4.8), which may arise from her restricted concept definition image on sine into
the first quadrant within the (unit) circle register (see On definition of trigonometric
functions heading). As second example, after his reasoning in the symbolic register

107
(lines 1-8 in [Zafer] Protocol 6), Zafer constructed three angles within the (unit) circle
register, respectively, –π/3, π/3 and 2π/3 but based only on one dimension [angle
measure] instead of two dimensions [angle measure and its sine value], and without
considering their symmetrical relations (see Zafer’s construction in Table 4.8). As a
result of his unsymmetrical-one dimension construction, his reasoning restricted to
only the remembered rules in the symbolic register in determining the values
corresponding to the negative sine value ([Zafer] Protocol 6). Even though Cemre, as
third example, constructed a symmetrical structure in the third quadrant with that in
the first quadrant (lines 6-19 in [Cemre] Protocol 5), due to her being unable to
remember that sine took also negative values for angles in the fourth quadrant (lines
2-4 and 35-37 in [Cemre] Protocol 5), she could not construct the reflection of the
trigonometric equation within the fourth quadrant (see Cemre’s construction in Table
4.8).
Secondly, when trying to determine the real x values corresponding to −√3
2
under the 𝑦 = 𝑠𝑖𝑛(𝑥) function in Q7, a systematic variation of students’ performances
was observed as a consequence of the variation on the sign of the angle value from
positive to negative. In other words, they encountered troubles in treatment of the
angles with the same principal angle as both positive and negative within the (unit)
circle register. For an initial example, even if Zafer was seemed to be able to construct
a negative angle –π/3 within the (unit) circle register (see Zafer’s construction in Table
4.8), his determination of –π/3 was based on his reasoning with respect to the rules
within the symbolic register (lines 1-4 in [Zafer] Protocol 6), as well as his construction
of it within the (unit) circle register was as if a negative angles’ prototypical example.
Besides, he was unable to reason about this angle’s positive equivalent forms, which
may arise from his concept image of angles as static rather than as dynamic turning.
For another example, although Cemre and Defne determined and constructed 240
[degrees] within the (unit) circle register as a positive value providing 𝑠𝑖𝑛(𝑥) = −√3
2
equation through considering angles as dynamic turning (lines 6-19 in [Cemre]
Protocol 5; and lines 11-16 in [Defne] Protocol 4), they were unable to reason about
this angle’s negative equivalent forms as a conclusion of either their reasoning about
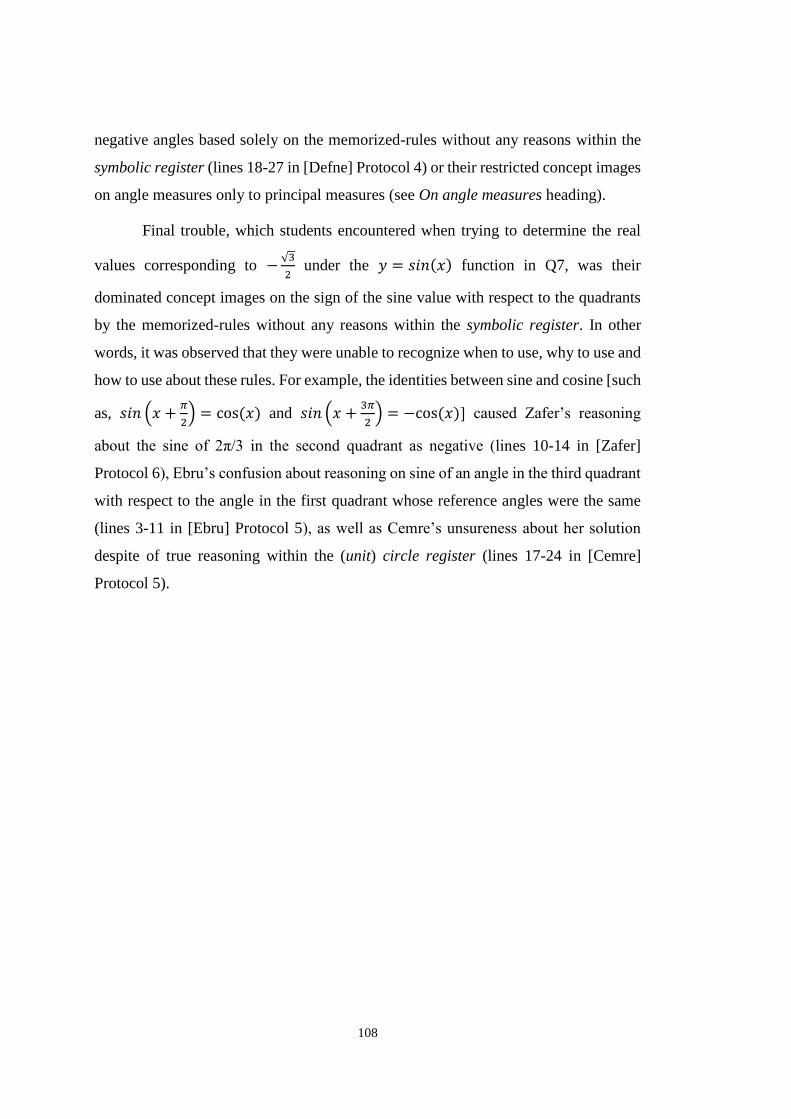
108
negative angles based solely on the memorized-rules without any reasons within the
symbolic register (lines 18-27 in [Defne] Protocol 4) or their restricted concept images
on angle measures only to principal measures (see On angle measures heading).
Final trouble, which students encountered when trying to determine the real
values corresponding to −√3
2 under the 𝑦 = 𝑠𝑖𝑛(𝑥) function in Q7, was their
dominated concept images on the sign of the sine value with respect to the quadrants
by the memorized-rules without any reasons within the symbolic register. In other
words, it was observed that they were unable to recognize when to use, why to use and
how to use about these rules. For example, the identities between sine and cosine [such
as, 𝑠𝑖𝑛 (𝑥 +𝜋
2) = cos(𝑥) and 𝑠𝑖𝑛 (𝑥 +
3𝜋
2) = −cos(𝑥)] caused Zafer’s reasoning
about the sine of 2π/3 in the second quadrant as negative (lines 10-14 in [Zafer]
Protocol 6), Ebru’s confusion about reasoning on sine of an angle in the third quadrant
with respect to the angle in the first quadrant whose reference angles were the same
(lines 3-11 in [Ebru] Protocol 5), as well as Cemre’s unsureness about her solution
despite of true reasoning within the (unit) circle register (lines 17-24 in [Cemre]
Protocol 5).
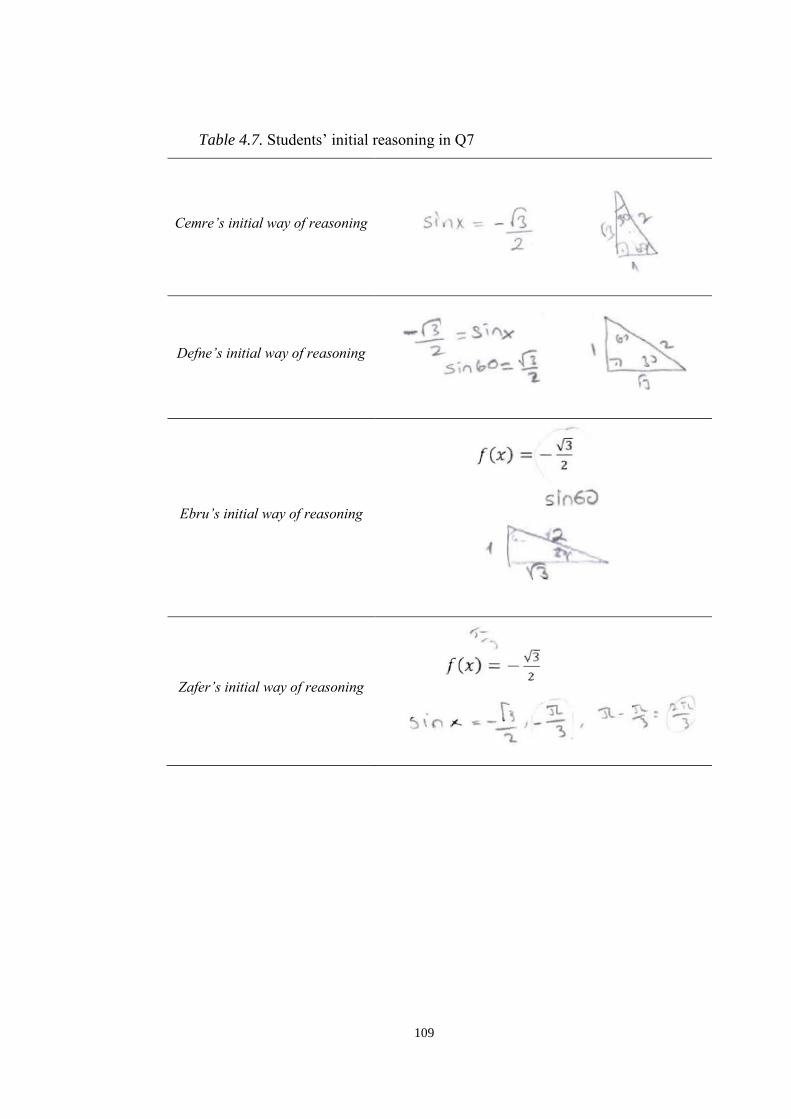
109
Table 4.7. Students’ initial reasoning in Q7
Cemre’s initial way of reasoning
Defne’s initial way of reasoning
Ebru’s initial way of reasoning
Zafer’s initial way of reasoning
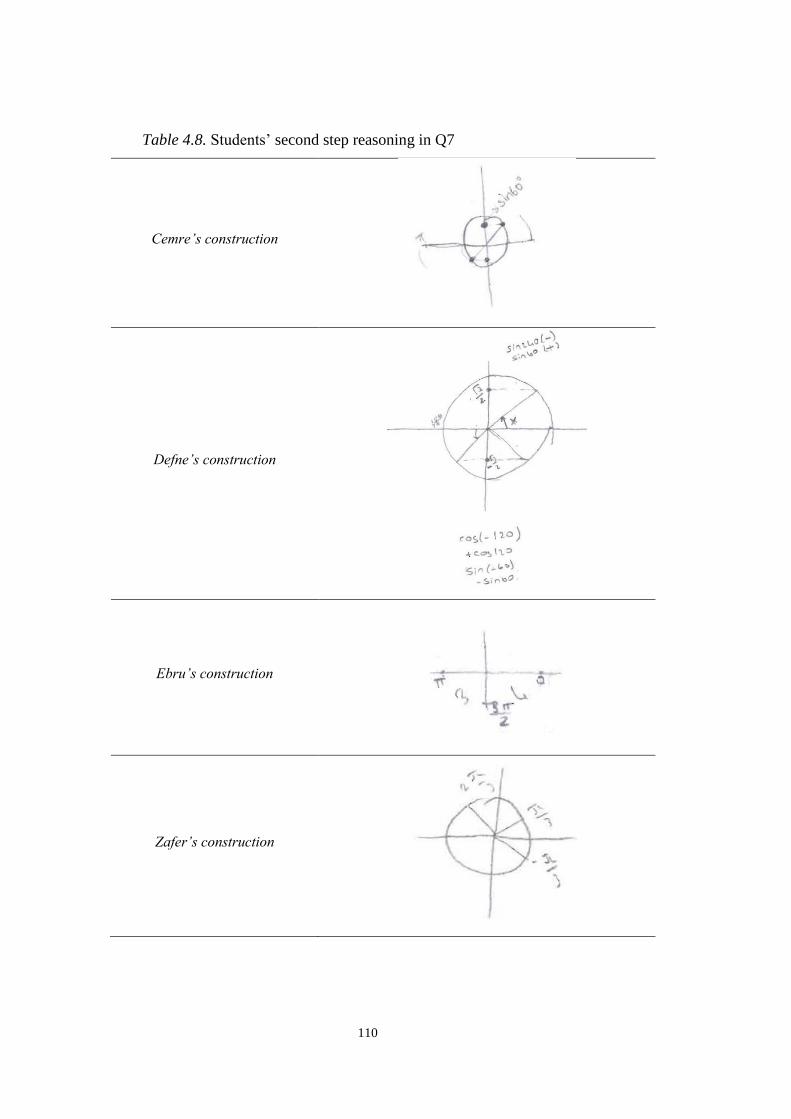
110
Table 4.8. Students’ second step reasoning in Q7
Cemre’s construction
Defne’s construction
Ebru’s construction
Zafer’s construction
111
[Cemre] Protocol 5
Cemre: Now, I think how to do about this minus… …If it is sin(60), sin(60) isn’t −√3/2, 1
it is √3/2. (After 14-second pause) sin(60) is in the first quadrant, and in the first 2
quadrant sign of sine is positive… In the third quadrant, negative… Is it 240 3
degrees? 4
Researcher: How do you find 240 degrees? 5
Cemre: If we think on the unit circle (drawing the unit circle like in Table 4.8), I am here 6
as sin(60) (constructing an angle on the unit circle and concretizing the projection 7
point on the y-axis of the point on the unit circle corresponding the 60-degree 8
angle). Because of the negative sign, I should be in the third quadrant (putting her 9
pencil on the circle’s third quadrant). We assume here as 180 (putting her pencil 10
on the intersection point with the negative x-axis). Since here (pointing the point 11
on the circle’s first quadrant which she constructed as 60 degrees) is 60, 180 plus 12
60, that is, 240 (drawing the line segment from the point on the circle’s first 13
quadrant through the origin to a point on the circle’s third quadrant). That is, here 14
is 60 (turning her pencil from the positive x-axis to the 60 degrees in the positive 15
direction), here is also 60 (turning her pencil from the negative x-axis to the 60 16
degrees in the positive direction), here is 180 (putting her pencil on the 17
intersection point with the negative x-axis), 180 plus 60, that is 240… But I am 18
not sure if it is correct... 19
Researcher: Why? 20
Cemre: Well, I am not sure if I am correct to adding 180 to 60… Umm, 240 aren’t familiar 21
to me… Also, sine and cosine changed their names as cosine and sine when an 22
angle exceeding π/2 and 3π/2, but here [in this solution] we didn’t change sine as 23
cosine. 24
Researcher: Why do the names of sine and cosine change when an angle exceeding π/2 25
and 3π/2? 26
Cemre: (After 6-second pause) I don’t know the reason. 27
Researcher: Ok. Well, are there any other x-values to provide the equation? 28
Cemre: When I think as cos(30), cos(30) is equal to sin(60). 29
Researcher: You seek the solution for this equation (pointing her equation in Table 4.7), 30
do you? 31
Cemre: (Pausing 11 seconds) 32
Researcher: Ok. In which quadrants does sine take negative values? 33
Cemre: Here, all [trigonometric functions] are positive (pointing the first quadrant in her 34
pencil), here are negative (pointing the third quadrant in her pencil and turning 35
her view from the question booklet to upward)… Umm... I try to remember, I had 36
memorized them. (After 5-second pause) I cannot do anything about this question. 37
[Defne] Protocol 4
Defne: Now, for being√3/2, it should be sin(60). But as a result of negative sign… (After 1
5-second pause) for being negative [sine value], sine in second quadrant is 2
positive, in first quadrant is positive (uttering through turning her view from the 3
question booklet to upward), then, it should be in third and fourth. Oh no… I am 4
confused… (After 11-second pause, she drawn a unit circle) √3/2 is like that 5
112
(constructing an angle in the first quadrant so as to correspond whose sine to 6
√3/2). −√3/2 could be here and also here, (constructing angles symmetrically in 7
the third and fourth quadrants so as to correspond whose sine to −√3/2) They 8
come up to same point (dragging her pencil from left to right on the chord between 9
the points on the circle corresponding to the angles in third and fourth quadrants 10
and pointing −√3/2 on the y-axis). Then here is 180 (writing 180 near the 11
intersection point of the circle with the negative x-axis) and also 60 degrees comes 12
from here (drawing a curved arrow in the positive direction in third quadrant) that 13
is, 240… That is, for being negative [−√3/2], x should be 240 (writing it 14
symbolically up-right side of the unit circle like in Table 4.8). So, the lowest 15
positive x is 240. 16
Researcher: Ok. What about the highest negative x? 17
Defne: Negative x (stopping speaking and looking to me). 18
Researcher: Have you ever heard about negative angles? 19
Defne: Yes. For example, cos(-120) absorb negative sign and it becomes plus cos120, but 20
sin(-60) gives negative sign outside and it becomes –sin60 (writing them like in 21
Table 4.8). So an angle has never been negative, we have taken the negative sign 22
outside the sine. 23
Researcher: (Pointing her writing -60 in the sin(-60)) You wrote -60 here. So, an angle 24
become negative, does it? 25
Defne: Yes, but we take it outside like that (pointing the negative sign of the –sin(60)), so 26
the angle is not negative anymore (pointing the 60 under the sine). 27
[Ebru] Protocol 5
Ebru: √3/2 is equal to sin60 from here (pointing her construction 30-60-90 right 1
triangle). But the negative sign exists here. Sine is negative in third and fourth 2
[quadrants]. 120 is in the second quadrant, 180 is not appropriate. I am confused… 3
(After 8-second pause, constructing a coordinate plane without unit circle like in 4
Table 4.8) integer multiplies of 60, it can be 120, or 180… Do we need to change 5
sine as cosine for transferring sin(60) into the third quadrant? 6
Researcher: Why do we need this change? 7
Ebru: I don’t know why, but we changed sine and cosine when an angle exceeding 90 8
and 270. For example,sin(𝜋
2+ 𝑥) is equal to cos(𝑥). 9
Researcher: But in this question there is not such a term related to π/2 or 3π/2. 10
Ebru: Yes. (After 7-second pause) I don’t want to think about this question. 11
[Zafer] Protocol 6
Zafer: How to do… sin(x) is equal to −√3/2 (writing it as an equation like in Table 4.7). 1
Where, our angle is 60. 60, so, is π/3, and even –π/3 because sine gives the negative 2
sign outside, yes, it is right (writing it near the equation and getting it into the 3
circle). Therefore, the highest negative value is –π/3. Besides, π minus π/3, that is, 4
2π/3 is another value. (Turning the question and reading in a low voice). I 5

113
methinks that the highest negative value is this (getting π/3 again into the circle), 6
the lowest positive real value… …what the lowest positive real value is… 7
…umm… (After 7-second pause) now, if we take π/3, it isn’t −√3/2. We have 8
to obtain negative… (Constructing a unit circle and angles, respectively, –π/3 in 9
the fourth quadrant, π/3 in the first quadrant and 2π/3 in the second quadrant) I 10
methinks 2π/3 is the lowest positive real value. 11
Researcher: Is the value of sine for 2π/3 is negative? 12
Zafer: Well, sine changes as cosine after π/2 (pointing the intersection point of the unit 13
circle with the positive y-axis), and cosine is negative in the second quadrant.14
To sum up, students’ inabilities to dissociate the ranges of trigonometric
functions’ basic forms from those of their general forms, the content of the
trigonometric functions’ graphs in the general form and those in the basic form, as well
as students’ inabilities to associate the meanings of trigonometric value and
trigonometric identities both between and within different representational registers
were cognitive obstacles in students’ concept images on trigonometric functions.
4.1.6. On periodicity
When trying to convert the function within the graphical register to the
symbolic register in Q8, although all of the students reasoned about the function
(which was given by the graph in Q8) to be repeating within the graphical register
(lines 1-5 in [Cemre] Protocol 6; lines 1-4 in [Defne] Protocol 5; line 6 in [Ebru]
Protocol 6; and line 55 in [Zafer] Protocol 7), none of them was able to reason about
the period of the function truly in the symbolic register. Initially, Cemre got confused
about the meaning of the period in the symbolic register as a consequence of her
reasoning about the period as the number of repetitions (lines 5-8 in [Cemre] Protocol
6). Secondly, Defne got confused about the period of the function concerning whether
the period of a function with respect to sine (or cosine) could be different from 2π as
a consequence of her transformation of her reasoning about the period of the basic
forms of the sine (or cosine) functions as 2π onto her reasoning about that of their
general forms within the graphical register (lines 5-15 in [Defne] Protocol 5). Next,
Ebru got confused about the meaning of the period in the graphical register as a
consequence of her reasoning about the period in the symbolic register as the abscissa
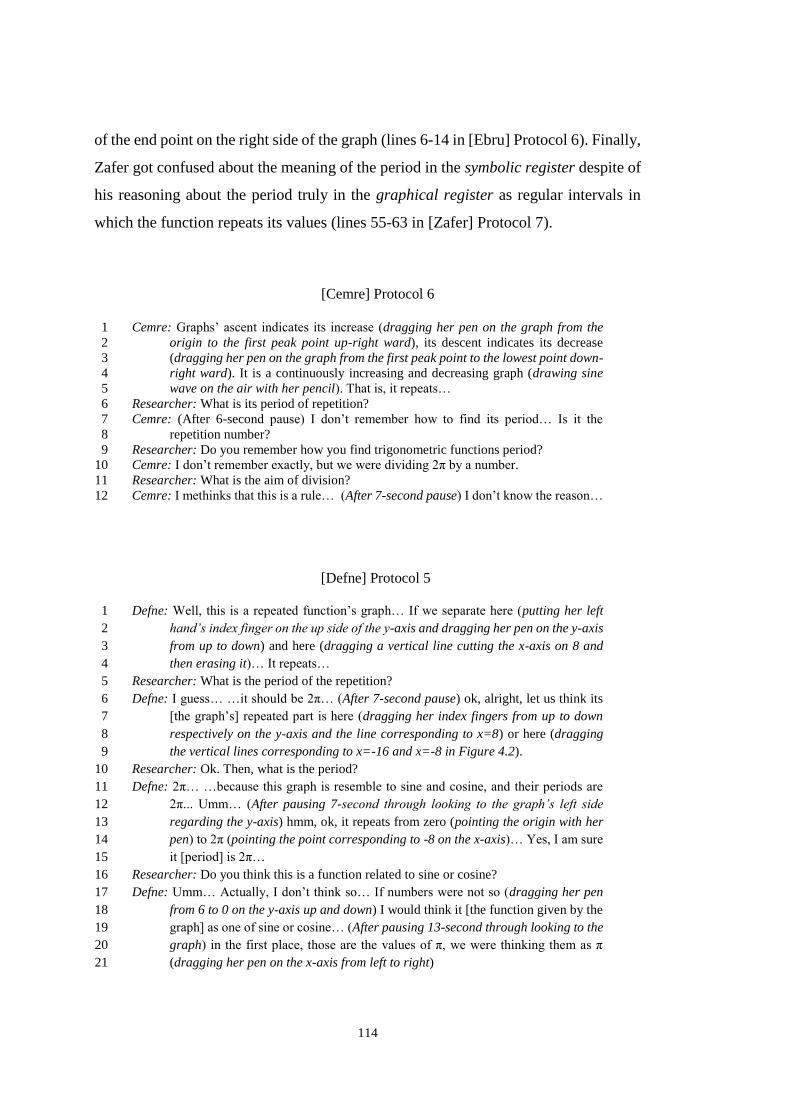
114
of the end point on the right side of the graph (lines 6-14 in [Ebru] Protocol 6). Finally,
Zafer got confused about the meaning of the period in the symbolic register despite of
his reasoning about the period truly in the graphical register as regular intervals in
which the function repeats its values (lines 55-63 in [Zafer] Protocol 7).
[Cemre] Protocol 6
Cemre: Graphs’ ascent indicates its increase (dragging her pen on the graph from the 1
origin to the first peak point up-right ward), its descent indicates its decrease 2
(dragging her pen on the graph from the first peak point to the lowest point down-3
right ward). It is a continuously increasing and decreasing graph (drawing sine 4
wave on the air with her pencil). That is, it repeats… 5
Researcher: What is its period of repetition? 6
Cemre: (After 6-second pause) I don’t remember how to find its period… Is it the 7
repetition number? 8
Researcher: Do you remember how you find trigonometric functions period? 9
Cemre: I don’t remember exactly, but we were dividing 2π by a number. 10
Researcher: What is the aim of division? 11
Cemre: I methinks that this is a rule… (After 7-second pause) I don’t know the reason… 12
[Defne] Protocol 5
Defne: Well, this is a repeated function’s graph… If we separate here (putting her left 1
hand’s index finger on the up side of the y-axis and dragging her pen on the y-axis 2
from up to down) and here (dragging a vertical line cutting the x-axis on 8 and 3
then erasing it)… It repeats… 4
Researcher: What is the period of the repetition? 5
Defne: I guess… …it should be 2π… (After 7-second pause) ok, alright, let us think its 6
[the graph’s] repeated part is here (dragging her index fingers from up to down 7
respectively on the y-axis and the line corresponding to x=8) or here (dragging 8
the vertical lines corresponding to x=-16 and x=-8 in Figure 4.2). 9
Researcher: Ok. Then, what is the period? 10
Defne: 2π… …because this graph is resemble to sine and cosine, and their periods are 11
2π... Umm… (After pausing 7-second through looking to the graph’s left side 12
regarding the y-axis) hmm, ok, it repeats from zero (pointing the origin with her 13
pen) to 2π (pointing the point corresponding to -8 on the x-axis)… Yes, I am sure 14
it [period] is 2π… 15
Researcher: Do you think this is a function related to sine or cosine? 16
Defne: Umm… Actually, I don’t think so… If numbers were not so (dragging her pen 17
from 6 to 0 on the y-axis up and down) I would think it [the function given by the 18
graph] as one of sine or cosine… (After pausing 13-second through looking to the 19
graph) in the first place, those are the values of π, we were thinking them as π 20
(dragging her pen on the x-axis from left to right) 21
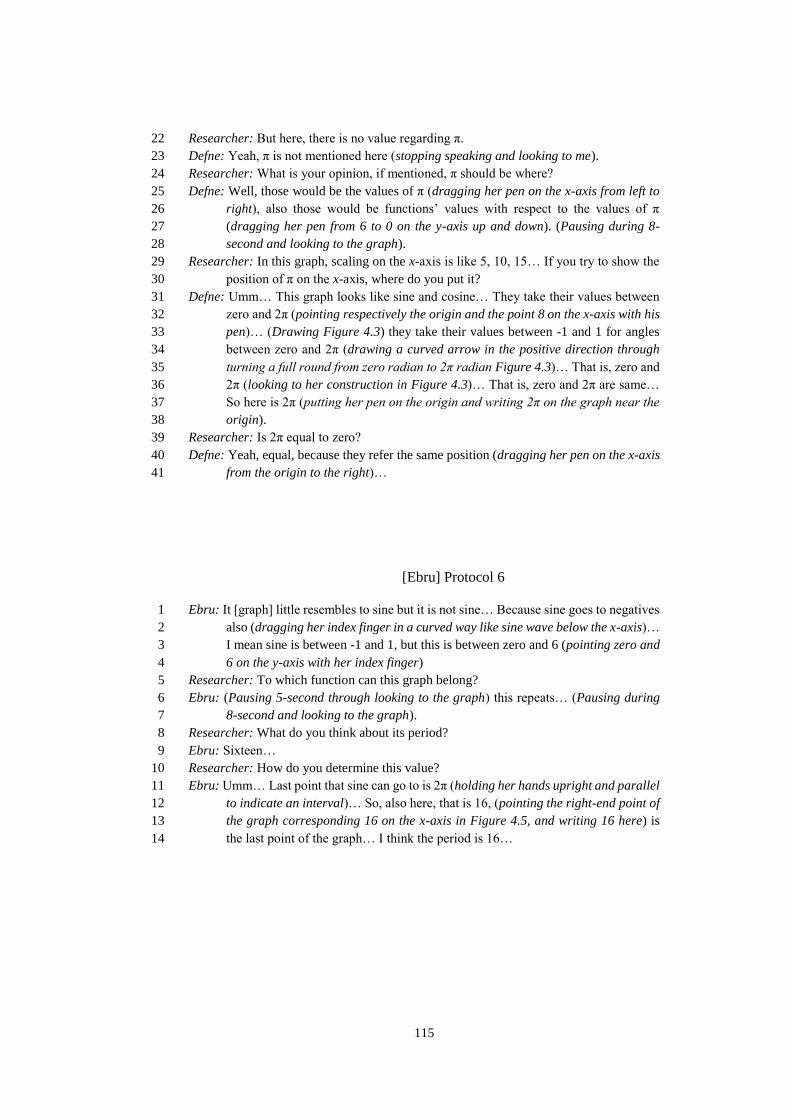
115
Researcher: But here, there is no value regarding π. 22
Defne: Yeah, π is not mentioned here (stopping speaking and looking to me). 23
Researcher: What is your opinion, if mentioned, π should be where? 24
Defne: Well, those would be the values of π (dragging her pen on the x-axis from left to 25
right), also those would be functions’ values with respect to the values of π 26
(dragging her pen from 6 to 0 on the y-axis up and down). (Pausing during 8-27
second and looking to the graph). 28
Researcher: In this graph, scaling on the x-axis is like 5, 10, 15… If you try to show the 29
position of π on the x-axis, where do you put it? 30
Defne: Umm… This graph looks like sine and cosine… They take their values between 31
zero and 2π (pointing respectively the origin and the point 8 on the x-axis with his 32
pen)… (Drawing Figure 4.3) they take their values between -1 and 1 for angles 33
between zero and 2π (drawing a curved arrow in the positive direction through 34
turning a full round from zero radian to 2π radian Figure 4.3)… That is, zero and 35
2π (looking to her construction in Figure 4.3)… That is, zero and 2π are same… 36
So here is 2π (putting her pen on the origin and writing 2π on the graph near the 37
origin). 38
Researcher: Is 2π equal to zero? 39
Defne: Yeah, equal, because they refer the same position (dragging her pen on the x-axis 40
from the origin to the right)… 41
[Ebru] Protocol 6
Ebru: It [graph] little resembles to sine but it is not sine… Because sine goes to negatives 1
also (dragging her index finger in a curved way like sine wave below the x-axis)… 2
I mean sine is between -1 and 1, but this is between zero and 6 (pointing zero and 3
6 on the y-axis with her index finger) 4
Researcher: To which function can this graph belong? 5
Ebru: (Pausing 5-second through looking to the graph) this repeats… (Pausing during 6
8-second and looking to the graph). 7
Researcher: What do you think about its period? 8
Ebru: Sixteen… 9
Researcher: How do you determine this value? 10
Ebru: Umm… Last point that sine can go to is 2π (holding her hands upright and parallel 11
to indicate an interval)… So, also here, that is 16, (pointing the right-end point of 12
the graph corresponding 16 on the x-axis in Figure 4.5, and writing 16 here) is 13
the last point of the graph… I think the period is 16… 14

116
[Zafer] Protocol 7
Zafer: (Writing as ordered pairs maximum and minimum points of the graph’s right side 1
with respect to the y-axis in Figure 4.6, and pausing 7 seconds) 2
Researcher: Does it familiar to you? 3
Zafer: In fact, it resembles sine or cosine… but it is not sine or cosine because they take 4
negative values also. (Stopping to speak and looking to the graph during 14 5
seconds) 6
Researcher: Can you draw sine graph for me? 7
Zafer: Ok. (Constructing a table like in Figure 4.7) Because period of sine is 2π, we take 8
these values up to 2 π (creating x values). sin(0) is zero, sin(π/2) is 1, sin(π) is 0, 9
sin(3π/2) is minus 1, and sin(2π) is zero (filling the first raw in Figure 4.7) I can 10
draw it like that (constructing the coordinate plane and showing ordered (x, sin(x)) 11
pairs from the table on it, and then, combining them with a curve like in Figure 12
4.8). 13
Researcher: Does this give you a clue about the graph in the question? 14
Zafer: Here (pointing the table) we gave values for x and obtained corresponding sine 15
values with respect to them. Here also (pointing the graph), in this function, we 16
write 4 for x, it [function] give us 6, f(12) is equal to 6, and f(8) is equal to zero 17
(writing f(4)=6, f(12)=6 and f(8)=0 below the graph like Figure 4.9) 18
Researcher: What does sine function give for 4? 19
Zafer: (Waiting without speaking 5 seconds) 20
Researcher: Where is the position of 4 here (pointing his constructed x-axis in Figure 21
4.8)? 22
Zafer: 4 is out of the unit circle, so it may be around here (pointing a position right side 23
of the 2π on the x-axis) 24
Researcher: Well, what value does sine function take for 4? 25
Zafer: It takes zero? 26
Researcher: How? 27
Zafer: If we extend the line like that (extending positive x-axis towards right side), around 28
here (concretizing a point on the x-axis which is approximately same distance but 29
opposite direction with the origin to the point corresponding 2π, and writing 4π 30
below this point like in Figure 4.8) is 4π, that is, 4, therefore, sin(4π) is zero. 31
Researcher: Is 4 is equal to 4π? 32
Zafer: I thought 4π as 4. 33
Researcher: Instead of thinking 4π as 4, do you think about exact position of 4? 34
Zafer: Umm, how can I think? Because 2π corresponds to 1 on the x-axis (pointing the 35
intersection point of the unit circle with the x-axis’s positive side which he 36
constructed like in Table 4.3), then, I methinks 4 is around here (pointing a point 37
on the x-axis between 2π and 4π and writing 4 below the point). 38
Researcher: Is 2π equal to 1? 39
Zafer: If we take π as 180… (After 5-second pause) but, on the unit circle, 2π corresponds 40
to 1… It seems to me that where [on the x-axis] 180 is very big… So, 4 should be 41
around here (pointing again 4 on the x-axis)… 42
Researcher: Ok. Now, just for you maybe catch a hint to solve the question. You can 43
draw y=sin(x) function’s graph. Can you draw y=2sin(x) function’s graph for me? 44
Zafer: Ok. Then, we get these values twice. So, zero, two, zero, minus two and zero 45
(filling the second raw of the table in Figure 4.7). I can draw it like that (showing 46

117
new ordered pairs corresponding to (x, 2sin(x)), and then, combining them with a 47
curve like in Figure 4.8 by navy blue color). 48
Researcher: Does it give you an idea about how can you change a form of the graph 49
related to sine? 50
Zafer: Well, we extend twice the graph for y values but x values are still same. But it is 51
not give me a hint about this graph. 52
Researcher: Ok. When constructing the x values on the table, you said that the period of 53
sine is 2π. Do you think about this graph belongs to a periodic function? 54
Zafer: In fact, it repeats. So, a period exists. 55
Researcher: What is it? 56
Zafer: Its period is… Here is the repeated part (circling the first wave of the graph 57
between [0,8]). That is it repeats between zero and eight (pointing his pen these 58
points on the x-axis). 59
Researcher: Then, what is its period? 60
Zafer: Between zero and eight. 61
Researcher: Period is a number or an interval? 62
Zafer: An interval like that (writing closed interval [0,8] like in Figure 4.9). 63
Figure 4.5. Ebru’s reasoning about the repetition of the graph in Q8
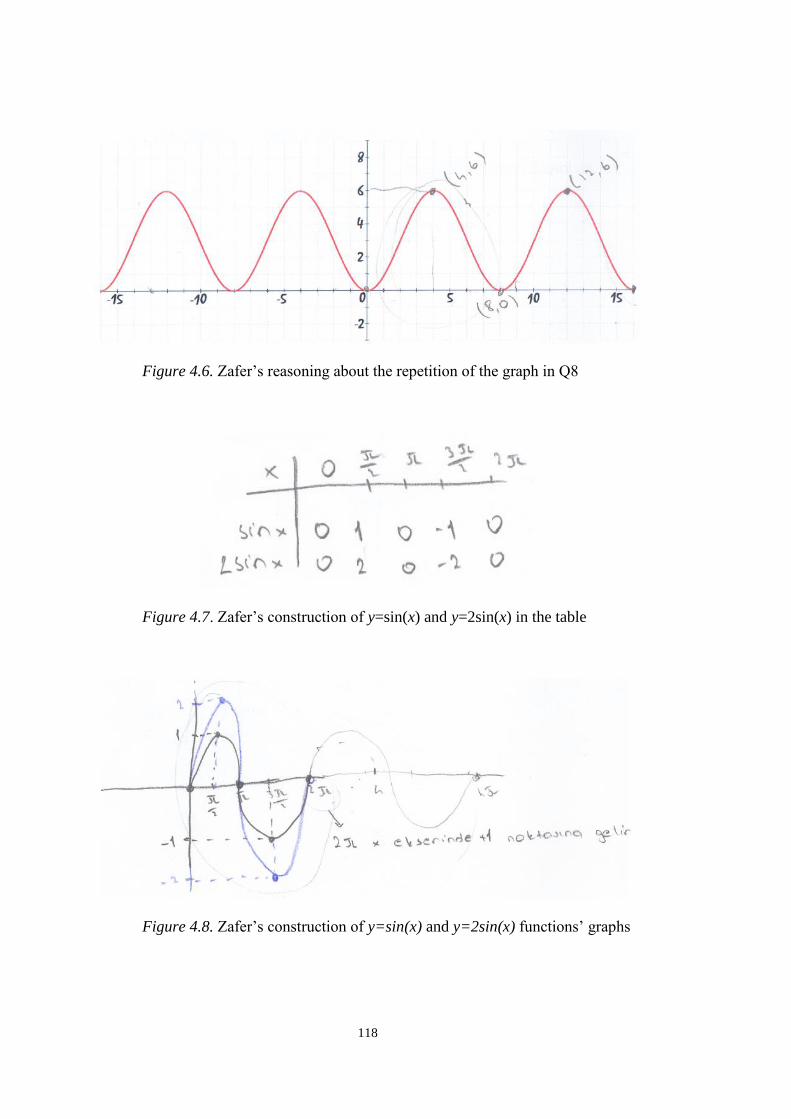
118
Figure 4.6. Zafer’s reasoning about the repetition of the graph in Q8
Figure 4.7. Zafer’s construction of y=sin(x) and y=2sin(x) in the table
Figure 4.8. Zafer’s construction of y=sin(x) and y=2sin(x) functions’ graphs

119
Figure 4.9. Zafer’s reasoning in the symbolic register about the function in Q8
4.2. Summary of Students’ Initial Concept Images
Cognitive analyses of the initial interviews revealed that students’ concept
images included critical troubles on foundational concepts related to trigonometric
functions. To begin with, their concept [definition] images on functionality were
restricted to being polynomial functions in the symbolic register, as well as their
mental images on functions’ visual representations were dominated by the graphical
register.
In addition, students’ concept definition images on angles included an intuitive
relation between openness and measure of an angle. However, they also included a
trouble on what was the measured part to determine an angle’s measure. That is to say,
in spite of their circular constructions inside of an angle [such as arcs and arc sectors],
they were unable to associate these circular constructions with angle measure.
Nevertheless, they reasoned about angle measure intuitively not to vary with respect
to variations of radii of these circular constructions. Except Defne, other students’
mental images on angles were static instead of dynamic turning.
Another trouble on students’ concept images related to angle measure was
based on radian measure unit. None of the students was able to reason about the
meaning of radian apart from degree measures. That is to say, the meaning of radian
measure was dominated by degree meaning and restricted only into transformations
between degree and radian measures within the symbolic register. Their
120
transformations between degree and radian implied that students’ understanding of the
relation between degree and radian was as if a computational equality without the
degree and radian notations [such as π=180 and 𝜋
6= 30] instead of a proportional
equality with degree and radian notations [such as πR=180ᵒ and 𝜋
6 R=30ᵒ]. As a
consequence of this understanding, π became a source of troubles on students’ concept
images.
On the one hand, it was observed that in spite of their reasoning that the same
π notation must be refer to the same object within the symbolic register, all students
dissociated π in and out of the trigonometry context in terms of its real value. In other
words, they treated π in the symbolic register as if it had two different real values; i.e.,
“180” in the trigonometry context and about 3.14 out of the trigonometry context.
Therefore, within the symbolic register, “π” had a potential to become a cognitive
conflict factor in and out of the trigonometry context when considered simultaneously.
On the other hand, many other troubles of students were observed based on π
as a consequence of the change of the source register from symbolic to graphical and
as a consequence of the variation on the scaling of the x-axis from numbers regarding
π to the real values. All students’ reasoning on π in the graphical register was
constrained by the trigonometry context. In making sense of π within the graphical
register, Cemre and Defne preferred to transfer their reasoning on π within the
symbolic register in the trigonometry context (i.e., π as equal to 180) to that out of the
trigonometry context. That is, they located π in the graphical register on 180 on the x-
axis. Conversely, Ebru and Zafer preferred to transfer their reasoning on π within the
(unit) circle register and considered respectively π=-1 and 2π=1 in the graphical
register, respectively. That is to say, they were unable to dissociate two meanings of
the intersection points of the unit circle with the x-axis [i.e., the points (-1,0) and (1,0)]
as an abscissa corresponding to these points within the graphical register and as an
angle in radians corresponding to these points within the unit circle register. This arose
from their mental images on angles as points on the unit circle instead of corresponding
arcs. Besides, when trying to convert her reasoning on π within the (unit) circle register
into the graphical register, Defne considered origin as 2π on the x-axis based on their

121
same positions when referring to angles in radians within the (unit) circle register. It
means that she was unable to dissociate the meaning of the equivalence between “zero”
and 2π in radians from the equality between them within the graphical register, which
arose from her dominated concept image on principal angles despite of her mental
image on angles as dynamic turning. Consequently, students’ reasoning on π in
different representational registers indicates that “coordinate plane” became a
cognitive conflict factor when the position of π on the x-axis is considered
simultaneously within the graphical register and the (unit) circle register.
Students’ initial attempts to define sine [cosine] were based on the right triangle
context. They defined sine [cosine] as ratio of opposite [adjacent] side to hypotenuse.
However, none of the students was aware that this ratio for an angle in a right triangle
were the same as that in all similar right triangles. This unawareness arose from their
reasoning about sine and cosine within the right triangle context as calculations instead
of ratios obtained from proportions in the similar right triangles.
Next, when trying to define sine [cosine] in the (unit) circle register, they
preferred to stay in the first quadrant and define by a set of geometric procedures
including drawing an angle in the first quadrant, concretizing its reference point on the
unit circle, drawing a dashed-perpendicular line segment from this point to the y-axis
[x-axis], and concretizing the intersection point of this segment with the y-axis [x-axis].
However, Cemre had a trouble to transfer these geometric procedures to sine and
cosine for the angles corresponding to the axes such as π/2 and 3π/2 in radians. It may
arise from their mental images related to sine [cosine] of an angle that were the point
on the y-axis [x-axis] instead of the reference right triangle’s opposite leg [adjacent
leg] within the (unit) circle register. Furthermore, Ebru preferred to convert her
definition of sine [cosine] as a set of geometric procedures within the (unit) circle
register into the symbolic register as ordinate [abscissa] of a point on the unit circle.
Unfortunately, she thought an arbitrary ordered-pair’s ordinate [abscissa] as sine
[cosine] through making an overgeneralization of the ordered-pair definitions of sine
and cosine. It may due to their consideration of the whole x-axis [y-axis] as the cosine
[sine] axis without awareness of the correlation between the x-axis [y-axis] and cosine
122
[sine]. Students’ mental images on sine [cosine] as a point on the y-axis [x-axis] as
well as their consideration of whole y-axis [x-axis] as sine [cosine] axis led them to
encounter troubles in reasoning about ordinate [abscissa] of a point on a non-unit circle
as sine [cosine].
Finally, students had troubles in reasoning about angles with the same principal
measure through positive and negative equivalent measures as a consequence of their
reasoning about negative angles based solely on the memorized-rules without any
reasons within the symbolic register as well as their restricted concept images on angle
measures only to principal measures. Moreover, their concept images on trigonometric
functions were based only on their basic forms. They had troubles on reasoning about
the general forms of trigonometric functions based on their ranges and values
especially within the (unit) circle register and the graphical register. That is to say,
they were unable to dissociate, for examples, a sinusoidal graph from the graph of
y=sin(x) within the graphical register, as well as the ordinate [abscissa] of a point on
the non-unit circle from the ordinate [abscissa] of a point on the unit circle in terms of
sine [cosine] within the (unit) circle register. Furthermore, students’ concept images
on the period concept included crucial troubles within the different representational
registers as a consequence of their problematic concept definition images on the
periodicity. None of the students was able to appropriately associate the meaning of
the repetition in the graphical register with the meaning of the period in the symbolic
register.

123
CHAPTER 5
5. RESULTS FROM TEACHING EXPERIMENT: PART 1
In this chapter, developments of students’ understanding on foundational
concepts related to trigonometric functions (see Chapter 4) is presented from cognitive
analyses results of the teaching experiment’s first part from each pair [Cemre&Zafer
and Defne&Ebru] so as to show the variation of students’ concept images related to
trigonometric functions’ basic forms with respect to their prior ones as a result of the
instruction in the GSP environment. The aim of this chapter is to provide the living
models of students’ concept images on trigonometric functions’ basic forms during the
first part of the teaching experiment (see Instructional Design of This Study sub-
heading in Chapter 3 for detailed description of first part of the designed-instruction).
This part of the study represents trigonometry of students during the first 7 episodes of
the teaching experiment in terms of the effect of the dynamically-linked conversions
of trigonometric functions between representational registers on students’ recognition,
students’ cognitive obstacles during the experimentation of recognition tasks of the
designed-instruction, as well as the role of the dynamic and linked representations on
students’ overcome cognitive conflict factors and obstacles.

124
5.1. Development of Students’ Concept Images on Trigonometric
Functions (Basic Forms28) throughout Teaching Experiment
5.1.1. Development of students’ concept definition images
Regarding the initial interview results, the researcher determined that students’
concept definition images related to trigonometric functions were included two major
troubles. First of all was on trigonometric functions’ definitions. Students’ concept
definition images on trigonometric functions had compartmentalized in the unit circle
context and right triangle context, as well as troubled in terms of their well-defined-
ness in each context. Second major trouble was on angle definition. While students’
concept definition images on angles included an intuitive relation between angles’
openness and measure, they also included some troubles arising from unawareness
about what were the measured part of an angle and the unit of measurement in
determination of its measure. Therefore, the first four tasks were designed to provide
students with integrated and well-defined concept definition images on trigonometric
functions in both contexts, as well as to provide meaningful objects and units to
measure an angle but after the awareness about the importance of angles for
trigonometric functions.
5.1.1.1. On trigonometric functions
In the first task, after provided with familiarity on GSP usage, the major focus
in terms of trigonometric functions was to provide students with well-defined concept
definition images on sine and cosine in the right triangle context through considering
trigonometric ratios on the similar right triangles. For this reason, initially, it was
spoken about “similarity” on the similar right triangles (Figure 5.1) in order to observe
(if exist) students’ troubles on it because their concept images on similarity were not
investigated throughout the initial interviews. When discussing the similar right
28 See Definitions of Terms heading at the end of Introduction chapter.

125
triangles, students correctly associated their equal angles and proportional
corresponding sides in the language register (e.g., lines 1-15 in [Defne & Ebru]
Protocol 1), as well as truly expressed in the symbolic register three ratios between
proportional corresponding side lengths so that these ratios were equal to the similarity
ratio (e.g., lines 17-30 in [Defne & Ebru] Protocol 1). Moreover, they generated these
ratios in GSP environment, and reasoned coherently about them under the variation of
the similar right triangles’ acute angles and side lengths (e.g., lines 37-54 in [Defne &
Ebru] Protocol 1). However, none of the students mentioned the equality between the
ratio of two arbitrary sides from one right triangle and the ratio of their corresponding
sides from the other [in other words, the equality of trigonometric ratios between the
similar right triangles] (e.g., lines 1-11 in [Cemre & Zafer] Protocol 1) until the
researcher’s recommendation for them to consider the ratios of two arbitrary sides and
that of their correspondences between similar right triangles (e.g., lines 12-14 in
[Cemre & Zafer] Protocol 1). When having calculated with GSP an arbitrary ratio of
two sides of one of the similar right triangles and that of their corresponding sides of
the other triangle, all students realized the equalities of these both (e.g., lines 15-19
and 27-30 in [Cemre & Zafer] Protocol 1). Besides, it was not difficult for them by the
aid of the drag-and-drop option of GSP to realize both remaining equal to each other
under the variations, as well as their remaining equal to the corresponding ratio of any
similar right triangle under all variations except for angle measures (e.g., lines 20-26
in [Cemre & Zafer] Protocol 1). However, none of the students associated these ratios
with trigonometric ratios unless the researcher’s recommendation for them to
investigate such ratios on the similar right triangles whose side lengths were labeled
as opposite, adjacent and hypotenuse regarding a specified angle (e.g., lines 31-37 in
[Cemre & Zafer] Protocol 1). When the ratios appeared on the screen with labels such
as adjacent/hypotenuse, hypotenuse/adjacent, adjacent/opposite, etc. all students
associated these ratios with trigonometric counterparts (e.g., lines 38-48 in [Cemre &
Zafer] Protocol 1). Moreover, when investigating the trigonometric ratios via making
dynamic manipulations on similar right triangles by the aid of the drag-and-drop option
of GSP, it was observed that all of the students were able to reason coherently about
the variation of trigonometric ratios (e.g., lines 49-59 in [Cemre & Zafer] Protocol 1).
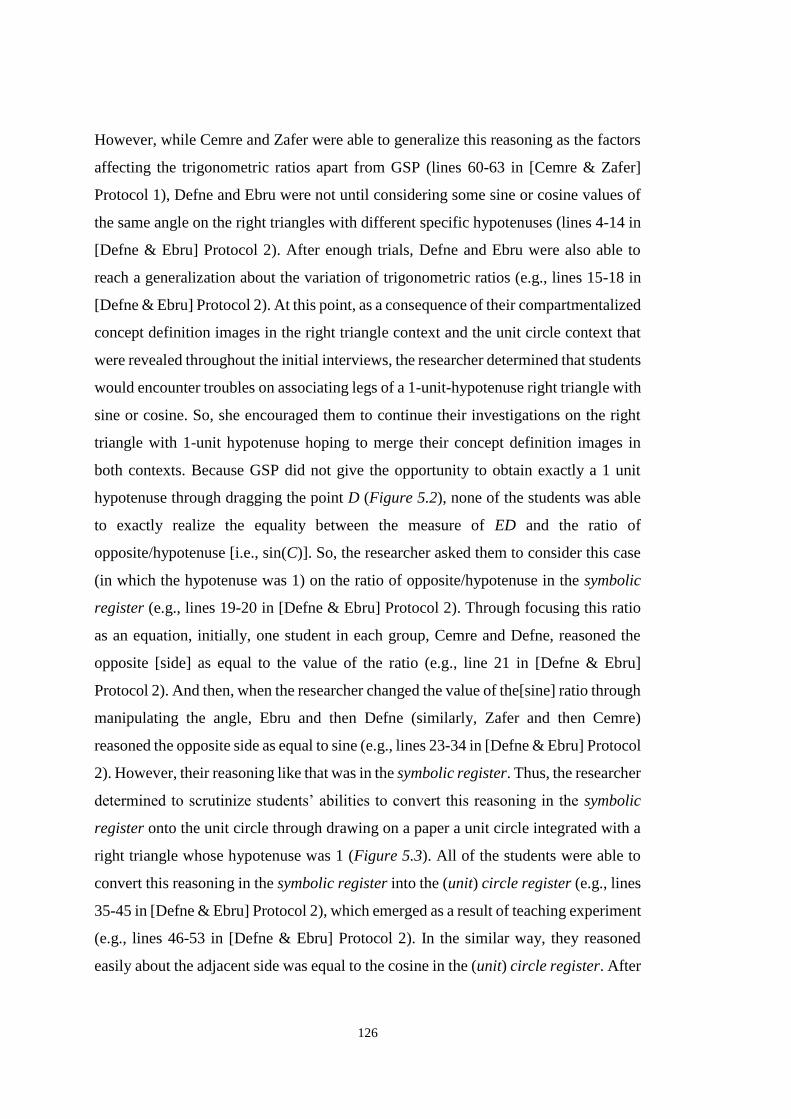
126
However, while Cemre and Zafer were able to generalize this reasoning as the factors
affecting the trigonometric ratios apart from GSP (lines 60-63 in [Cemre & Zafer]
Protocol 1), Defne and Ebru were not until considering some sine or cosine values of
the same angle on the right triangles with different specific hypotenuses (lines 4-14 in
[Defne & Ebru] Protocol 2). After enough trials, Defne and Ebru were also able to
reach a generalization about the variation of trigonometric ratios (e.g., lines 15-18 in
[Defne & Ebru] Protocol 2). At this point, as a consequence of their compartmentalized
concept definition images in the right triangle context and the unit circle context that
were revealed throughout the initial interviews, the researcher determined that students
would encounter troubles on associating legs of a 1-unit-hypotenuse right triangle with
sine or cosine. So, she encouraged them to continue their investigations on the right
triangle with 1-unit hypotenuse hoping to merge their concept definition images in
both contexts. Because GSP did not give the opportunity to obtain exactly a 1 unit
hypotenuse through dragging the point D (Figure 5.2), none of the students was able
to exactly realize the equality between the measure of ED and the ratio of
opposite/hypotenuse [i.e., sin(C)]. So, the researcher asked them to consider this case
(in which the hypotenuse was 1) on the ratio of opposite/hypotenuse in the symbolic
register (e.g., lines 19-20 in [Defne & Ebru] Protocol 2). Through focusing this ratio
as an equation, initially, one student in each group, Cemre and Defne, reasoned the
opposite [side] as equal to the value of the ratio (e.g., line 21 in [Defne & Ebru]
Protocol 2). And then, when the researcher changed the value of the[sine] ratio through
manipulating the angle, Ebru and then Defne (similarly, Zafer and then Cemre)
reasoned the opposite side as equal to sine (e.g., lines 23-34 in [Defne & Ebru] Protocol
2). However, their reasoning like that was in the symbolic register. Thus, the researcher
determined to scrutinize students’ abilities to convert this reasoning in the symbolic
register onto the unit circle through drawing on a paper a unit circle integrated with a
right triangle whose hypotenuse was 1 (Figure 5.3). All of the students were able to
convert this reasoning in the symbolic register into the (unit) circle register (e.g., lines
35-45 in [Defne & Ebru] Protocol 2), which emerged as a result of teaching experiment
(e.g., lines 46-53 in [Defne & Ebru] Protocol 2). In the similar way, they reasoned
easily about the adjacent side was equal to the cosine in the (unit) circle register. After

127
then, the researcher predicted that students would encounter troubles on giving
meaning trigonometric ratios as a transition from an angle measure to its corresponding
trigonometric value. So, at the end of Task 1, she encouraged students to interpret sine
and cosine for both acute angles of the same right triangle hoping to fortify their
perceptions about trigonometric ratios as relations between angles (as inputs) and
trigonometric ratios (as outputs). Where, initially, students interpreted sine of the angle
C (Figure 5.4) as “sine is ratio of opposite to hypotenuse… …that is, AB divided by
AC”. And then, when asked them to interpret “AB divided by AC” in terms of angle A,
they interpreted that “…AB is adjacent to angle A... …so, it is cosine of [angle] A”.
Where, students’ language implies that they started thinking about sine and cosine of
an angle algebraically rather than arithmetically. At this point, the researcher
determined that all of the students were able to correctly define sine and cosine of an
acute angle in both contexts (right triangle and unit circle), as well as merge their
compartmentalized concept definition images on sine [cosine] value of an angle in the
first quadrant within the (unit) circle register. Henceforward, the subsequent progress
of students’ concept images on sine and cosine that emerged as a result of the teaching
experiment was presented in terms of the different representational registers under the
following respective headings.
[Defne & Ebru] Protocol 1
Researcher: What do you think about these two triangles (dragging her index finger on 1
the right triangles ABC and EDC on the screen like in Figure 5.1)? 2
Defne: They are right… and similar… 3
Researcher: Why? 4
Ebru: Their angles are same (pointing angles A and E, and then B and D respectively 5
from big and small right triangles)… 6
Defne: Uh-huh (nodding her head up and down). 7
Researcher: Well, what does similar mean? 8
Defne: That is, this side (pointing the AC segment) is similar to this side (pointing the EC 9
segment)… this side (pointing the BC segment) is similar to this (pointing the DC 10
segment)… …and this (pointing the AB segment) is similar to this (pointing the 11
DE segment) 12
Ebru: Well, in the big triangle and in the small triangle, sides, opposite to equal angles, 13
are proportional to each other… 14
Defne: Uh-huh (nodding her head up and down). 15
Researcher: What does “proportionality” mean? 16

128
Ebru: Well… …when they are similar, a similarity ratio exists… 17
Researcher: What is similarity ratio? 18
Ebru: For example, the ratio of… …the opposite side of this angle (pointing the angle A 19
in the big triangle, and then dragging her index finger on BC segment)… to this 20
angle’s opposite side (pointing the angle E in the small triangle, and then dragging 21
her index finger on DC segment)… 22
Defne: When considering these ratios, we are starting always from, for example, big 23
triangle… That is, AC divided by EC is equal to BC divided by DC… as well as 24
equal to AB divided by ED (pointing the corresponding sides on the screen). 25
Ebru: Uh-huh (nodding her head up and down). We can consider them also in the reverse 26
direction… 27
Defne: Ok. In which order we start [to find the similarity ratio]… …others should be 28
taken in the same order... 29
Ebru: Yeah… 30
Researcher: Can you calculate these ratios by GSP? 31
Defne: Ok. The ratio of EC to (pointing the EC line segment through mouse movement 32
on the figure like in Figure 5.1)… 33
Ebru: …to AC… 34
Defne: Yeah. That is, EC divided by AC… …is equal to ED divided by AB… …and also 35
equal to DC divided by BC… 36
(They calculated these ratios after measuring the right triangles side lengths in GSP, 37
respectively.) 38
Defne: Yes, it is true. All these ratios are same... 39
Ebru: Uh-huh… 40
Researcher: What are the changing components when you are dragging the point D? 41
Defne: (Dragging the point D left and right) in small triangle, side lengths are changing 42
and these ratios are changing (pointing these measures on the screen)…. 43
Ebru: Yeah, similarity ratios… 44
Researcher: Ok. What about the points A and C? 45
Defne: Now (dragging the point A up and down), in both triangles, because this line 46
segment does not move, its measure doesn’t change (pointing the BC line segment 47
through mouse movement) and right angles don’t change… …other than these, all 48
measures change. 49
Ebru: Similarity ratios don’t change also… 50
Defne: Yes. Now (dragging the point C left and right), measures of AB and ED don’t 51
change (pointing the measures of AB and ED line segments), so, similarity ratios 52
(pointing ratios) don’t change… …other than these, all measures change. 53
Ebru: (Nodding her head up and down). 54
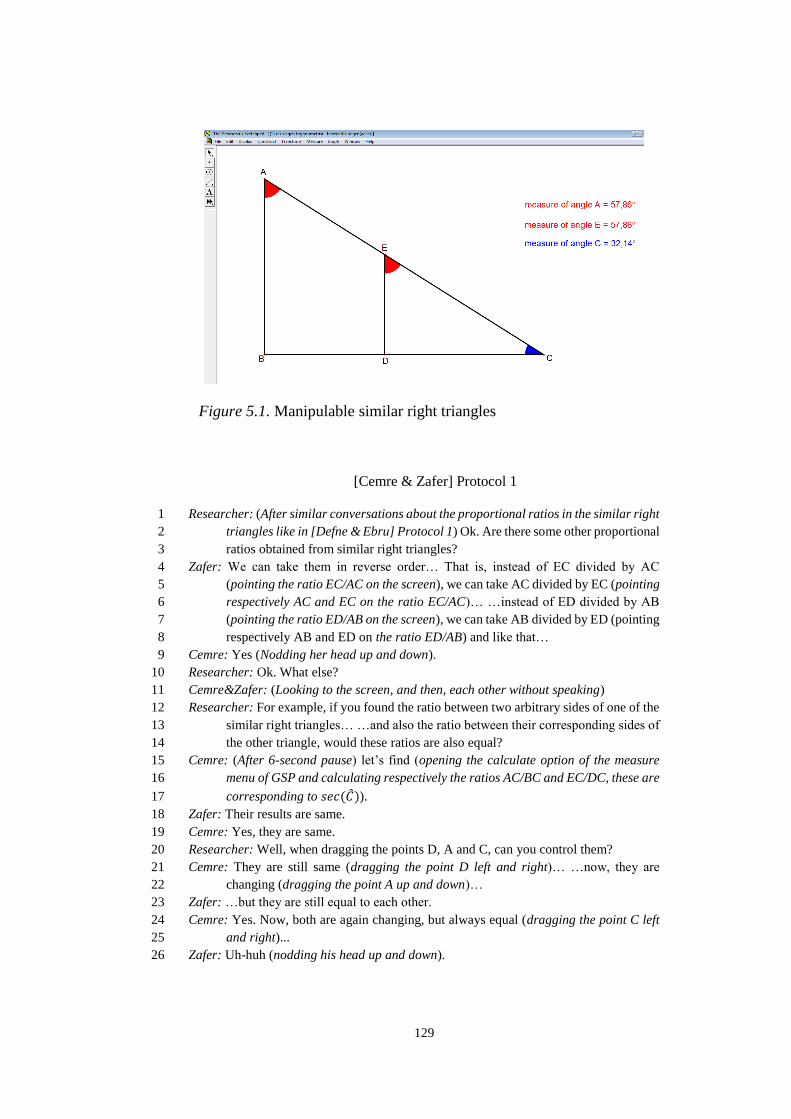
129
Figure 5.1. Manipulable similar right triangles
[Cemre & Zafer] Protocol 1
Researcher: (After similar conversations about the proportional ratios in the similar right 1
triangles like in [Defne & Ebru] Protocol 1) Ok. Are there some other proportional 2
ratios obtained from similar right triangles? 3
Zafer: We can take them in reverse order… That is, instead of EC divided by AC 4
(pointing the ratio EC/AC on the screen), we can take AC divided by EC (pointing 5
respectively AC and EC on the ratio EC/AC)… …instead of ED divided by AB 6
(pointing the ratio ED/AB on the screen), we can take AB divided by ED (pointing 7
respectively AB and ED on the ratio ED/AB) and like that… 8
Cemre: Yes (Nodding her head up and down). 9
Researcher: Ok. What else? 10
Cemre&Zafer: (Looking to the screen, and then, each other without speaking) 11
Researcher: For example, if you found the ratio between two arbitrary sides of one of the 12
similar right triangles… …and also the ratio between their corresponding sides of 13
the other triangle, would these ratios are also equal? 14
Cemre: (After 6-second pause) let’s find (opening the calculate option of the measure 15
menu of GSP and calculating respectively the ratios AC/BC and EC/DC, these are 16
corresponding to 𝑠𝑒𝑐(��)). 17
Zafer: Their results are same. 18
Cemre: Yes, they are same. 19
Researcher: Well, when dragging the points D, A and C, can you control them? 20
Cemre: They are still same (dragging the point D left and right)… …now, they are 21
changing (dragging the point A up and down)… 22
Zafer: …but they are still equal to each other. 23
Cemre: Yes. Now, both are again changing, but always equal (dragging the point C left 24
and right)... 25
Zafer: Uh-huh (nodding his head up and down). 26

130
Researcher: Zafer, can you calculate some other proportional ratios different from these 27
(pointing the ratios Cemre calculated)? 28
Zafer: Ok (calculating respectively the ratios AB/BC and ED/DC, these are 29
corresponding to 𝑡𝑎𝑛(��)). These are also equal to each other. 30
Cemre: Our similarity ratios were same (pointing the results of the ratios EC/AC, ED/AB 31
and DC/BC)… …but these ratios are different (pointing on the screen her and 32
Zafer’s results –which were corresponded to 𝑠𝑒𝑐(��) and 𝑡𝑎𝑛(��), respectively), 33
why it happened? Third [ratio] would be different from them also. 34
Zafer: (Looking to the screen without speaking) 35
Researcher: Ok. Let’s discuss this issue on another GSP file (opening the GSP file whose 36
static version was like in Figure 5.2)… 37
(They calculated some ratios on both triangles such as adjacent/hypotenuse, 38
hypotenuse/adjacent, adjacent/opposite, etc.) 39
Cemre: (After ratios appeared on the screen with labels such as adjacent/hypotenuse, 40
hypotenuse/adjacent, adjacent/opposite) ah! Adjacent divided by hypotenuse is 41
cosine (pointing the label of the ratio and looking to Zafer). 42
Zafer: (Nodding his head up and down). 43
Researcher: Well, was cosine in small triangle equal to cosine in big triangle for the angle 44
C (figuring respectively the small and big right triangles on the screen)? 45
Cemre: Yes, we found this from small triangle and this from big triangle (pointing two 46
ratios labelled as adjacent/hypotenuse on the screen)… They are same. 47
Zafer: Yes. 48
Researcher: Ok. What are the changing components when you are dragging the point D? 49
Cemre: (Dragging the point D left and right) lengths of small triangle changed… 50
…similarity ratios changed… …but these ratios didn’t change (pointing 51
trigonometric ratios). 52
Zafer: Yes. 53
Researcher: Well, what about the points A and C? 54
Zafer: (Dragging the point A up and down and the point C left and right) then these ratios 55
changed (pointing trigonometric ratios) but they are still equal to each other 56
(pointing two ratios adjacent/hypotenuse [hypotenuse/adjacent and 57
adjacent/opposite] obtained from two similar right triangles). 58
Cemre: Uh-huh (nodding her head up and down). 59
Zafer: That is, their changes are dependent only on [the angle] C. 60
Cemre: Yes. That is, they don’t change when lengths change, they change only when 61
angle changes. 62
Zafer: Yes. 63
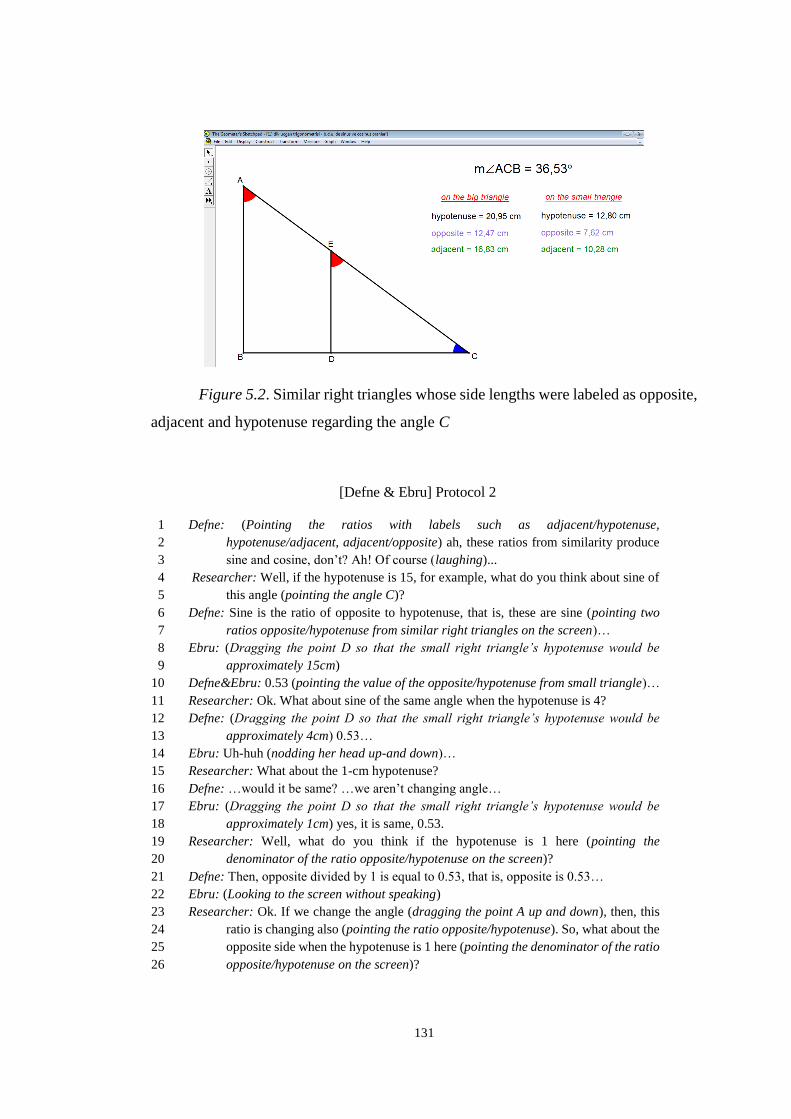
131
Figure 5.2. Similar right triangles whose side lengths were labeled as opposite,
adjacent and hypotenuse regarding the angle C
[Defne & Ebru] Protocol 2
Defne: (Pointing the ratios with labels such as adjacent/hypotenuse, 1
hypotenuse/adjacent, adjacent/opposite) ah, these ratios from similarity produce 2
sine and cosine, don’t? Ah! Of course (laughing)... 3
Researcher: Well, if the hypotenuse is 15, for example, what do you think about sine of 4
this angle (pointing the angle C)? 5
Defne: Sine is the ratio of opposite to hypotenuse, that is, these are sine (pointing two 6
ratios opposite/hypotenuse from similar right triangles on the screen)… 7
Ebru: (Dragging the point D so that the small right triangle’s hypotenuse would be 8
approximately 15cm) 9
Defne&Ebru: 0.53 (pointing the value of the opposite/hypotenuse from small triangle)… 10
Researcher: Ok. What about sine of the same angle when the hypotenuse is 4? 11
Defne: (Dragging the point D so that the small right triangle’s hypotenuse would be 12
approximately 4cm) 0.53… 13
Ebru: Uh-huh (nodding her head up-and down)… 14
Researcher: What about the 1-cm hypotenuse? 15
Defne: …would it be same? …we aren’t changing angle… 16
Ebru: (Dragging the point D so that the small right triangle’s hypotenuse would be 17
approximately 1cm) yes, it is same, 0.53. 18
Researcher: Well, what do you think if the hypotenuse is 1 here (pointing the 19
denominator of the ratio opposite/hypotenuse on the screen)? 20
Defne: Then, opposite divided by 1 is equal to 0.53, that is, opposite is 0.53… 21
Ebru: (Looking to the screen without speaking) 22
Researcher: Ok. If we change the angle (dragging the point A up and down), then, this 23
ratio is changing also (pointing the ratio opposite/hypotenuse). So, what about the 24
opposite side when the hypotenuse is 1 here (pointing the denominator of the ratio 25
opposite/hypotenuse on the screen)? 26

132
Ebru: Is it sine? 27
Defne: Hang on… …is it always like that? When here is 1, this ratio is equal to opposite 28
(pointing denominator and numerator of the ratio opposite/hypotenuse 29
respectively), then, this (pointing “opposite” in the ratio opposite/hypotenuse) is 30
equal to this (pointing the numeric value of the ratio opposite/hypotenuse)… 31
…this is sine (pointing the numeric value of the ratio opposite/hypotenuse)… so, 32
opposite is sine… Ah, yes! 33
Ebru: Uh-huh (nodding her head up and down). 34
Researcher: Well. If we construct a right triangle on the unit circle like that (figuring a 35
unit circle with a right triangle on its first quadrant like in Figure 5.3), since this 36
right triangle’s hypotenuse is 1, what should the opposite side be? 37
Ebru: Yes, it should be sine (nodding her head up and down). 38
Defne: Ah! It must be sine (pointing the line segment AB on Figure 5.3)… …yes… 39
Ebru: That is, it [the relation between y-component and sine] comes from here 40
(smiling)… 41
Defne: Yes… …because if hypotenuse is 1, then this opposite (circling the AB line 42
segment on Figure 5.3) is sine… …ah, yes! 43
Ebru: Then, here on y-axis (figuring with her index finger the projection of the point A 44
on the y-axis) gives sine. 45
Defne: I had known here is 1 (pointing the AC line segment on Figure 5.3) here is sine 46
(pointing the AB line segment on Figure 5.3) but I hadn’t known about their 47
relation (pointing the AB and AC line segments)… 48
Ebru: Me too… I had never thought so… 49
Defne: Especially, I had never thought to associate sine with similarity… 50
Ebru: Me too… 51
Defne: I surprised that this 1 was such interesting thing (pointing the hypotenuse on 52
Figure 5.3)… I had never thought like that… 53
Figure 5.3. Teacher-researcher’s construction on paper to associate the
definition of “sine” on the right triangle with that on the unit circle

133
Figure 5.4. Right triangle to discuss the relation between sine and cosine ratios
of complementary angles
5.1.1.2. On angles
In the second task, students were introduced “angle” as the figure formed by
two rays with the common initial point through drawing on a paper (Figure 5.5 (a)),
and then, were explained the definition of “angle measure” in degrees as the number
of equal arcs in the angle when the circumference of the circle (centered at the vertex
of the angle) is divided into 360 equal arcs by rays (Figure 5.5 (b and c)).
(a) (b) (c)
Figure 5.5. Teacher-researcher’s constructions to articulate “angle” and “angle
measure in degrees” on paper

134
After introducing “angle” and “angle measure in degrees” like mentioned
above, it was observed that students reasoned on Figure 5.5 (c) about sameness of the
number of equal-arcs remaining in an angle regarding circles with different radii (e.g.,
[Cemre & Zafer] Protocol 2). However, the researcher predicted that in determination
of the angle measure, students would encounter troubles on selecting the appropriate
arc from two ones of circles separated by the angle. Thus, in the second task, she
encouraged them to investigate the variation in the angle measure when manipulating
its openness in GSP hoping to observe these troubles.
[Cemre & Zafer] Protocol 2
Researcher: Do you think the number of equal arcs of all circles for this angle would be 1
same (pointing Figure 5.5(c))? 2
Zafer: Yes, because those (pointing the rays in the angle) separate each arc (pointing the 3
arcs in the angle from three different circles) into the same number [equal] arcs. 4
Cemre: Yes, they [the number of equal arcs in the angle] are same… …actually, we had 5
done in our elementary school when learning fractions… All those [rays in the 6
angle] get away from center (dragging her pen on the rays in the angle through 7
starting the vertex point). So, they [rays] separate them (rotating her pencil around 8
three arc sectors in the angle) into equal pieces in the same number (rotating her 9
pen around sub-arc sectors of the biggest arc sector in the angle). 10
When investigating the variation on angle’s measure through manipulating its
openness in GSP environment under “degrees” preferences as the angle measure unit,
it was observed that while Defne focused coherently on the same up-part from two
ones of the plane separated by the angle (lines 11-19 in [Defne & Ebru] Protocol 3),
others changed their focuses from one part to the other when their focused-part turned
from the obtuse angle to the reflex angle (e.g., lines 20-22 and 34-38 in [Defne & Ebru]
Protocol 3). These actions imply that while Defne’s seeing of an angle was as a
dynamic turning, others’ seeing of an angle was as a static interior region separated by
its rays. However, none of them considered an angle’s measure through paying
attention on the direction (lines 3-10 in [Defne & Ebru] Protocol 3). So, the researcher
predicted that students would encounter troubles when dealing with directed angles.
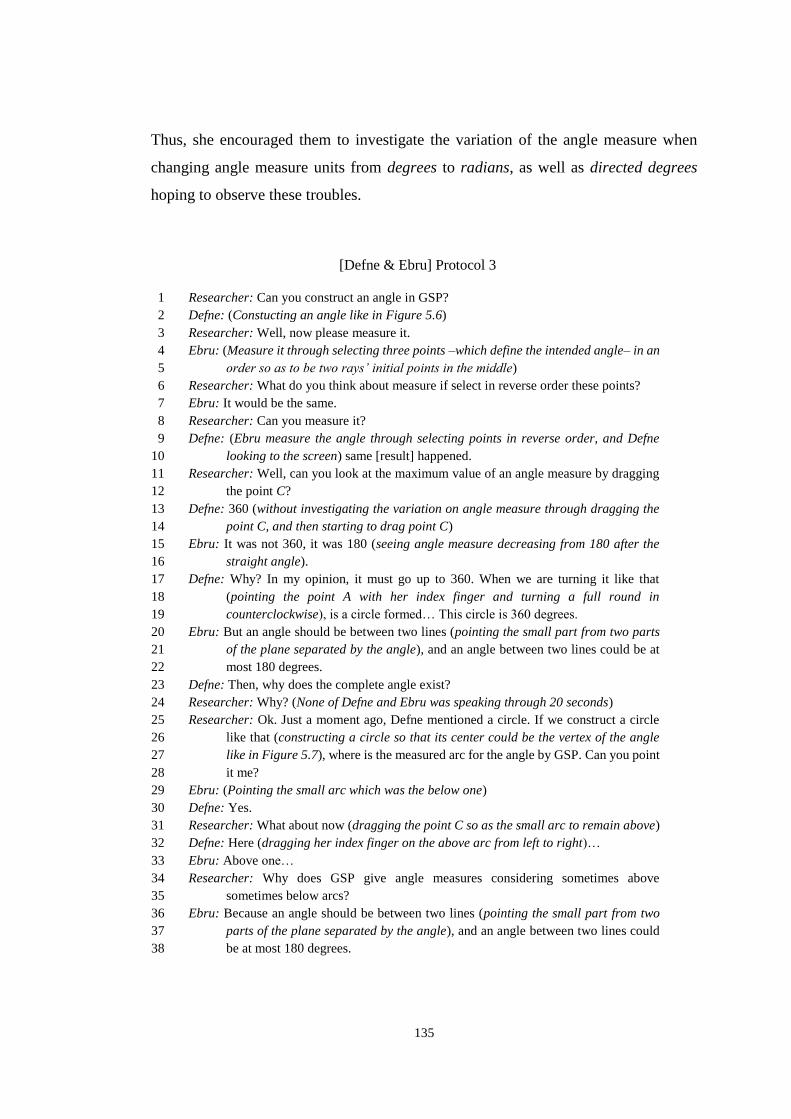
135
Thus, she encouraged them to investigate the variation of the angle measure when
changing angle measure units from degrees to radians, as well as directed degrees
hoping to observe these troubles.
[Defne & Ebru] Protocol 3
Researcher: Can you construct an angle in GSP? 1
Defne: (Constucting an angle like in Figure 5.6) 2
Researcher: Well, now please measure it. 3
Ebru: (Measure it through selecting three points –which define the intended angle– in an 4
order so as to be two rays’ initial points in the middle) 5
Researcher: What do you think about measure if select in reverse order these points? 6
Ebru: It would be the same. 7
Researcher: Can you measure it? 8
Defne: (Ebru measure the angle through selecting points in reverse order, and Defne 9
looking to the screen) same [result] happened. 10
Researcher: Well, can you look at the maximum value of an angle measure by dragging 11
the point C? 12
Defne: 360 (without investigating the variation on angle measure through dragging the 13
point C, and then starting to drag point C) 14
Ebru: It was not 360, it was 180 (seeing angle measure decreasing from 180 after the 15
straight angle). 16
Defne: Why? In my opinion, it must go up to 360. When we are turning it like that 17
(pointing the point A with her index finger and turning a full round in 18
counterclockwise), is a circle formed… This circle is 360 degrees. 19
Ebru: But an angle should be between two lines (pointing the small part from two parts 20
of the plane separated by the angle), and an angle between two lines could be at 21
most 180 degrees. 22
Defne: Then, why does the complete angle exist? 23
Researcher: Why? (None of Defne and Ebru was speaking through 20 seconds) 24
Researcher: Ok. Just a moment ago, Defne mentioned a circle. If we construct a circle 25
like that (constructing a circle so that its center could be the vertex of the angle 26
like in Figure 5.7), where is the measured arc for the angle by GSP. Can you point 27
it me? 28
Ebru: (Pointing the small arc which was the below one) 29
Defne: Yes. 30
Researcher: What about now (dragging the point C so as the small arc to remain above) 31
Defne: Here (dragging her index finger on the above arc from left to right)… 32
Ebru: Above one… 33
Researcher: Why does GSP give angle measures considering sometimes above 34
sometimes below arcs? 35
Ebru: Because an angle should be between two lines (pointing the small part from two 36
parts of the plane separated by the angle), and an angle between two lines could 37
be at most 180 degrees. 38
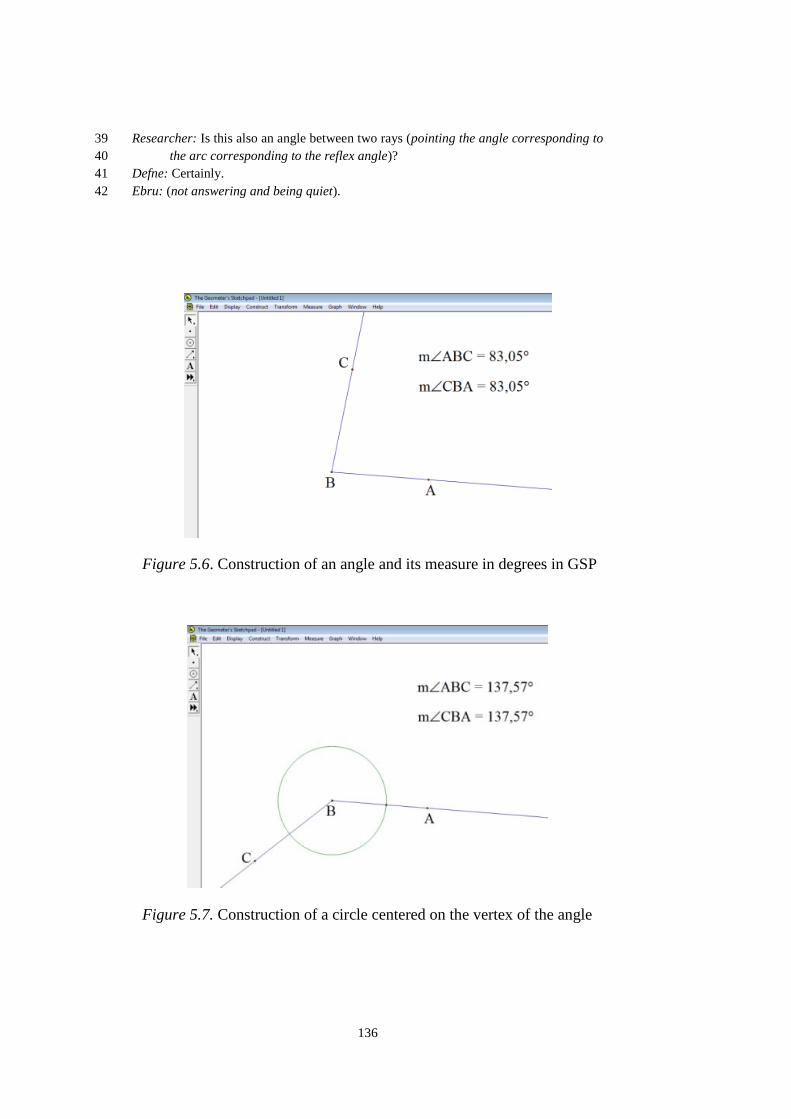
136
Researcher: Is this also an angle between two rays (pointing the angle corresponding to 39
the arc corresponding to the reflex angle)? 40
Defne: Certainly. 41
Ebru: (not answering and being quiet). 42
Figure 5.6. Construction of an angle and its measure in degrees in GSP
Figure 5.7. Construction of a circle centered on the vertex of the angle
137
When investigating the variation on angle’s measure through manipulating its
openness in GSP environment29 under “radians” and then “directed degrees” as the
angle measure unit, it was observed that initially, none of the students could explain
any reason why the angle measure changed from positive to negative (e.g., lines 3-13
in [Cemre & Zafer] Protocol 3). After then, according to their investigations in GSP,
they reasoned about the sign of the angle measure as negative [positive] if the position
of the angle’s interior region was down [up] regarding the horizontal straight angle
without mentioning direction (e.g., lines 12-17 in [Cemre & Zafer] Protocol 3). While
this reasoning prompted Cemre to associate signs of angle measures with the y-axis of
the coordinate plane (lines 18-25 in [Cemre & Zafer] Protocol 3) instead of mentioning
direction, it prompted other students to associate negative measure of an angle with
the direction. Although they considered the counterclockwise direction as positive and
the clockwise direction as negative, two different points of view having emerged when
articulating the direction. While Zafer and Ebru fixed the initial side of the angle as
the starting point of rotation and changed the direction of rotation (lines 26-34 in
[Cemre & Zafer] Protocol 3; lines 8-13 in [Defne & Ebru] Protocol 4), Defne fixed her
focus on the same up-arc but changed the initial side of the angle as the starting point
of rotation (lines 2-6 in [Defne & Ebru] Protocol 4). Defne’s actions imply that she
could consider the same angle as both negative and positive but only through focusing
on the same [up] arc between the angle’s sides and changing her point of view between
its initial side and terminal side. Ebru’s actions imply that her seeing of an angle was
either as negative or as positive through focusing on both the angle’s same initial side
and its interior region (lines 8-13 in [Defne & Ebru] Protocol 4). Zafer’s actions imply
that despite of his seeing the same angle as both negative and positive, his
consideration of them was only for those in the fourth quadrant of the unit circle as if
a prototypical example of angles with negative measures (lines 31-35 in [Cemre &
Zafer] Protocol 3). The researcher determined that all students had troubles on seeing
an arbitrary angle with four possible directed-angle measures (i.e., m<ABC in
counter/clockwise direction, m<CBA in counter/clockwise direction) as a
29 GSP’s angle measure defaults give the measure of the angle’s interior region regarding three angle
measure units (degrees, radians and directed degrees) unless measuring an arc’s angle.
138
consequence of their unawareness of three key components defining an angle: initial
side, terminal side and direction. So, she encouraged them to investigate the variation
in the angle measures through considering the angle measures of the circle’s two arcs
separated by the angle hoping them recognize these key components.
[Defne & Ebru] Protocol 4
Researcher: When would an angle be negative? 1
Defne: When we were going from here (pointing the point A in Figure 5.8) to here 2
(turning her pen on the screen up to the point C in the counterclockwise direction), 3
it [angle measure] would be positive… and from here (pointing the point C) to 4
here (turning her pen on the screen up to the point A in the clockwise direction), 5
it would be negative, would not be like that? 6
Researcher: Would not be like that Ebru? 7
Ebru: An angle was positive when we were going through starting from here (pointing 8
the point A in Figure 5.8) and continuing like that (turning her pencil on the screen 9
up to the point C in the counterclockwise direction)… …and negative when going 10
through like that (dragging the point C down in the counterclockwise direction 11
like in Figure 5.9 and turning her pencil on the screen from the point A to the point 12
C in the clockwise direction). 13
[Cemre & Zafer] Protocol 3
Researcher: (After change of the angle measure unit preference from degrees to radians) 1
well, now we can discuss about change of angle measure in radians. 2
Cemre: (Looking to the screen when dragging the point C to see the variation on the angle 3
measure) Ah (dragging the point C up [like in Figure 5.8] and down [like in Figure 4
5.9] regarding the position in which the angle measure turned from positive to 5
negative)! When going there, it [angle measure] happens positive (dragging the 6
point C upward), there, negative (dragging the point C downward). Why is it 7
happening (looking at Zafer)? 8
Zafer: (Nodding his head up and down) 9
Cemre: Why is it happening? 10
Zafer: (Looking to the screen without speaking) 11
Cemre: Here is the negative region (bringing down the point C through dragging), here 12
is positive region (bringing up the point C through dragging). 13
Researcher: What does the negative region for angles mean? 14
Zafer: Negative region for angles means… …after 180 degrees, that is, below part of 180 15
(indicating a horizontal line with his right hand and then reflecting his hand from 16
up to down regarding this line without drawing)… 17
Cemre: When we think with respect to the coordinate plane, there are quadrants, third 18
and fourth ones called as negative quadrants. So, angles’ measures in these 19
quadrants are negative 20
Researcher: Why? 21
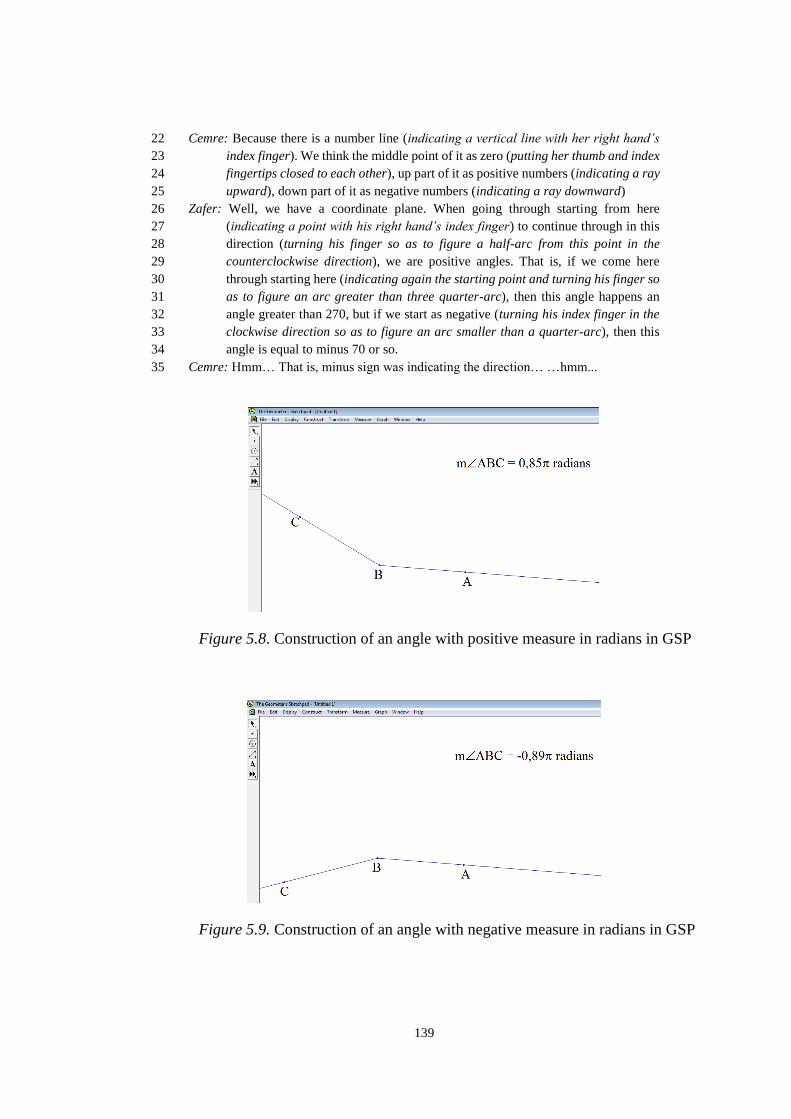
139
Cemre: Because there is a number line (indicating a vertical line with her right hand’s 22
index finger). We think the middle point of it as zero (putting her thumb and index 23
fingertips closed to each other), up part of it as positive numbers (indicating a ray 24
upward), down part of it as negative numbers (indicating a ray downward) 25
Zafer: Well, we have a coordinate plane. When going through starting from here 26
(indicating a point with his right hand’s index finger) to continue through in this 27
direction (turning his finger so as to figure a half-arc from this point in the 28
counterclockwise direction), we are positive angles. That is, if we come here 29
through starting here (indicating again the starting point and turning his finger so 30
as to figure an arc greater than three quarter-arc), then this angle happens an 31
angle greater than 270, but if we start as negative (turning his index finger in the 32
clockwise direction so as to figure an arc smaller than a quarter-arc), then this 33
angle is equal to minus 70 or so. 34
Cemre: Hmm… That is, minus sign was indicating the direction… …hmm... 35
Figure 5.8. Construction of an angle with positive measure in radians in GSP
Figure 5.9. Construction of an angle with negative measure in radians in GSP
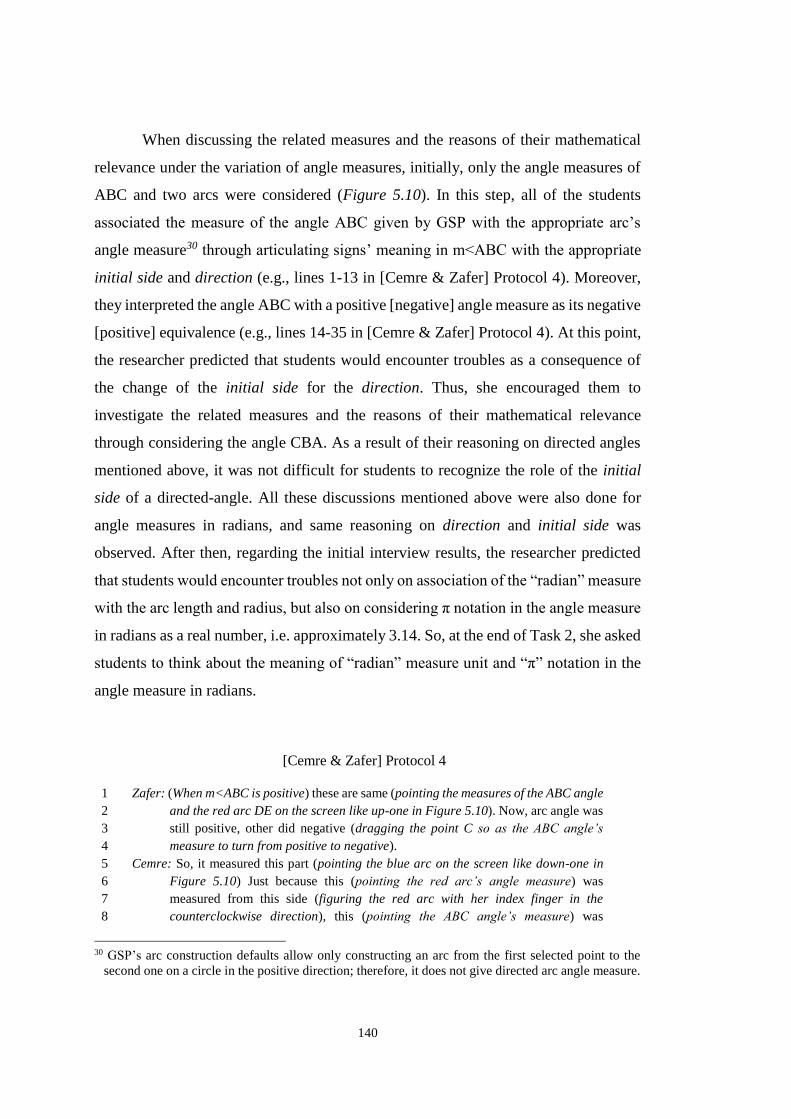
140
When discussing the related measures and the reasons of their mathematical
relevance under the variation of angle measures, initially, only the angle measures of
ABC and two arcs were considered (Figure 5.10). In this step, all of the students
associated the measure of the angle ABC given by GSP with the appropriate arc’s
angle measure30 through articulating signs’ meaning in m<ABC with the appropriate
initial side and direction (e.g., lines 1-13 in [Cemre & Zafer] Protocol 4). Moreover,
they interpreted the angle ABC with a positive [negative] angle measure as its negative
[positive] equivalence (e.g., lines 14-35 in [Cemre & Zafer] Protocol 4). At this point,
the researcher predicted that students would encounter troubles as a consequence of
the change of the initial side for the direction. Thus, she encouraged them to
investigate the related measures and the reasons of their mathematical relevance
through considering the angle CBA. As a result of their reasoning on directed angles
mentioned above, it was not difficult for students to recognize the role of the initial
side of a directed-angle. All these discussions mentioned above were also done for
angle measures in radians, and same reasoning on direction and initial side was
observed. After then, regarding the initial interview results, the researcher predicted
that students would encounter troubles not only on association of the “radian” measure
with the arc length and radius, but also on considering π notation in the angle measure
in radians as a real number, i.e. approximately 3.14. So, at the end of Task 2, she asked
students to think about the meaning of “radian” measure unit and “π” notation in the
angle measure in radians.
[Cemre & Zafer] Protocol 4
Zafer: (When m<ABC is positive) these are same (pointing the measures of the ABC angle 1
and the red arc DE on the screen like up-one in Figure 5.10). Now, arc angle was 2
still positive, other did negative (dragging the point C so as the ABC angle’s 3
measure to turn from positive to negative). 4
Cemre: So, it measured this part (pointing the blue arc on the screen like down-one in 5
Figure 5.10) Just because this (pointing the red arc’s angle measure) was 6
measured from this side (figuring the red arc with her index finger in the 7
counterclockwise direction), this (pointing the ABC angle’s measure) was 8
30 GSP’s arc construction defaults allow only constructing an arc from the first selected point to the
second one on a circle in the positive direction; therefore, it does not give directed arc angle measure.
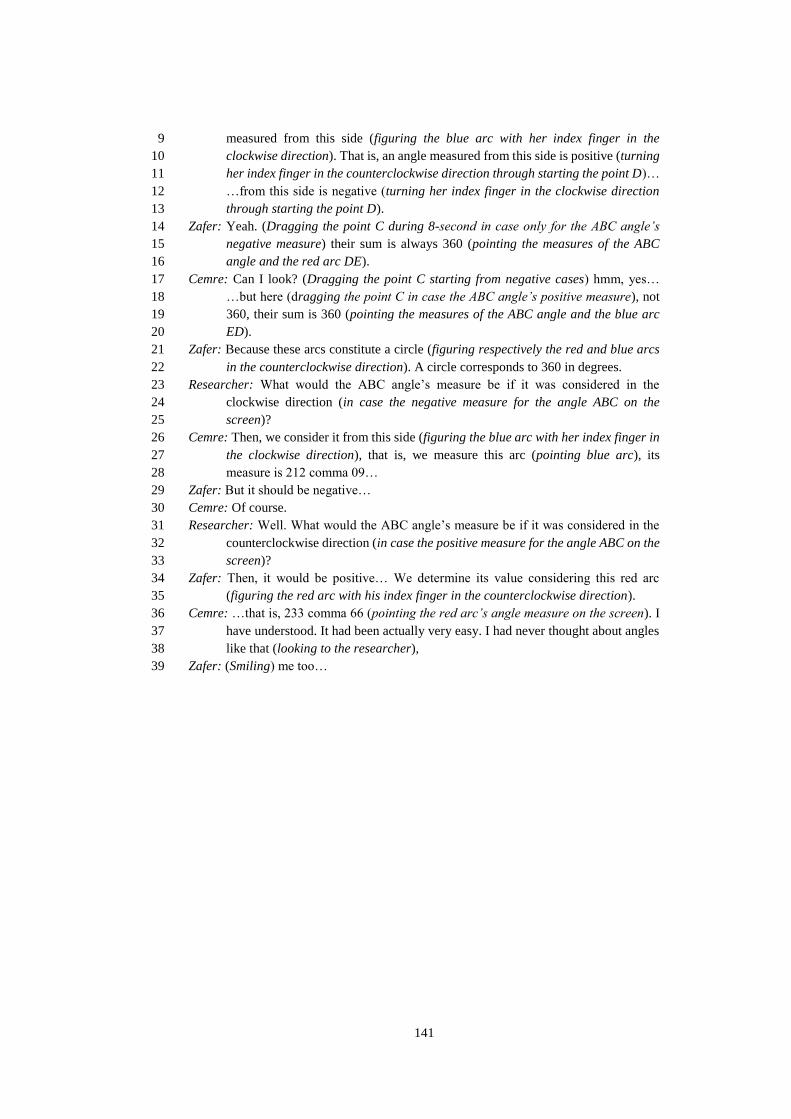
141
measured from this side (figuring the blue arc with her index finger in the 9
clockwise direction). That is, an angle measured from this side is positive (turning 10
her index finger in the counterclockwise direction through starting the point D)… 11
…from this side is negative (turning her index finger in the clockwise direction 12
through starting the point D). 13
Zafer: Yeah. (Dragging the point C during 8-second in case only for the ABC angle’s 14
negative measure) their sum is always 360 (pointing the measures of the ABC 15
angle and the red arc DE). 16
Cemre: Can I look? (Dragging the point C starting from negative cases) hmm, yes… 17
…but here (dragging the point C in case the ABC angle’s positive measure), not 18
360, their sum is 360 (pointing the measures of the ABC angle and the blue arc 19
ED). 20
Zafer: Because these arcs constitute a circle (figuring respectively the red and blue arcs 21
in the counterclockwise direction). A circle corresponds to 360 in degrees. 22
Researcher: What would the ABC angle’s measure be if it was considered in the 23
clockwise direction (in case the negative measure for the angle ABC on the 24
screen)? 25
Cemre: Then, we consider it from this side (figuring the blue arc with her index finger in 26
the clockwise direction), that is, we measure this arc (pointing blue arc), its 27
measure is 212 comma 09… 28
Zafer: But it should be negative… 29
Cemre: Of course. 30
Researcher: Well. What would the ABC angle’s measure be if it was considered in the 31
counterclockwise direction (in case the positive measure for the angle ABC on the 32
screen)? 33
Zafer: Then, it would be positive… We determine its value considering this red arc 34
(figuring the red arc with his index finger in the counterclockwise direction). 35
Cemre: …that is, 233 comma 66 (pointing the red arc’s angle measure on the screen). I 36
have understood. It had been actually very easy. I had never thought about angles 37
like that (looking to the researcher), 38
Zafer: (Smiling) me too… 39
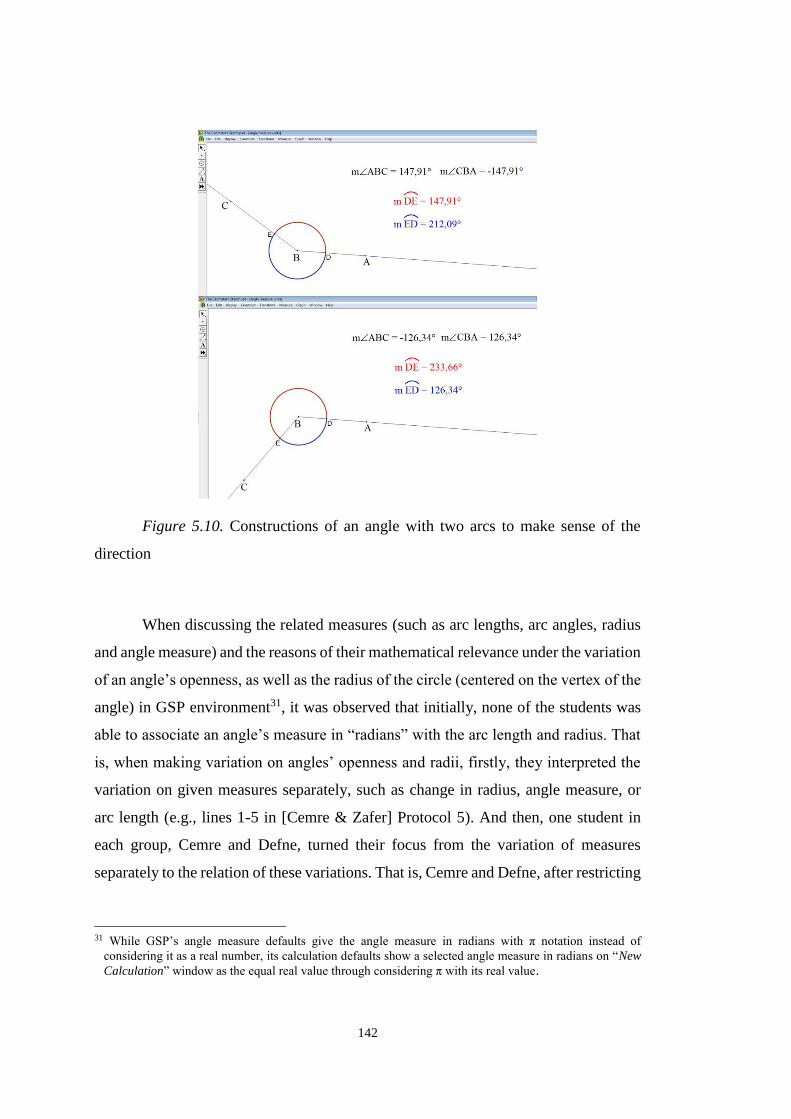
142
Figure 5.10. Constructions of an angle with two arcs to make sense of the
direction
When discussing the related measures (such as arc lengths, arc angles, radius
and angle measure) and the reasons of their mathematical relevance under the variation
of an angle’s openness, as well as the radius of the circle (centered on the vertex of the
angle) in GSP environment31, it was observed that initially, none of the students was
able to associate an angle’s measure in “radians” with the arc length and radius. That
is, when making variation on angles’ openness and radii, firstly, they interpreted the
variation on given measures separately, such as change in radius, angle measure, or
arc length (e.g., lines 1-5 in [Cemre & Zafer] Protocol 5). And then, one student in
each group, Cemre and Defne, turned their focus from the variation of measures
separately to the relation of these variations. That is, Cemre and Defne, after restricting
31 While GSP’s angle measure defaults give the angle measure in radians with π notation instead of
considering it as a real number, its calculation defaults show a selected angle measure in radians on “New
Calculation” window as the equal real value through considering π with its real value.

143
the variation into the case in which the angle measure was fixed, focused on the
relation between variations of two measures [arc length and radius] through specified
radii by natural numbers, and then, reasoned their proportionality (e.g., lines 5-18 in
[Cemre & Zafer] Protocol 5). However, none of the students was able to associate
these ratios with the angle measure in radians (e.g., lines 19-33 in [Cemre & Zafer]
Protocol 5) until the researcher’s recommendation for them to consider π in the angle
measure (e.g., lines 34-37 in [Cemre & Zafer] Protocol 5). Where, because of students’
problematic reasoning about the real value of π in and out the trigonometry context
that was revealed throughout the initial interviews, the researcher encouraged them to
use GSP’s calculate option when considering π in the angle measure (e.g., lines 36-39
in [Cemre & Zafer] Protocol 5). And then, all students noticed that the angle measure
in radians corresponded to the ratio of the (appropriate) arc length by the radius (e.g.,
lines 40-63 in [Cemre & Zafer] Protocol 5). At this point, it was observed a distinct
shift on students’ reasoning about the radian measure unit. That is to say, students had
just started to associate arc lengths [when the radius was 1] with the angle measures
(e.g., lines 64-76 in [Cemre & Zafer] Protocol 5), as well as associated π as the angle
measure in radians with its meaning as a real number (i.e., approximately 3.14) and its
meaning as an angle in degrees (i.e., 180 in degrees) (e.g., lines 40-50 and 72-78 in
[Cemre & Zafer] Protocol 5). However, only Zafer associated these critiques on the
angle measure in radians with the unit circle. Therefore, at the beginning of Task 332,
the researcher determined to scrutinize their reasoning on the radian measure unit on
the unit circle, but it was not difficult for students to transfer their reasoning onto the
unit circle. Since students’ this reasoning about the radian measure unit and π was
inconsistent with their prior ones revealed throughout the initial interviews, the
researcher scrutinized their reasoning also in some following tasks, for example in
Task 6, 7, 8 and 13; and observed again students’ coherent reasoning about the radian
measure unit and π like mentioned above (e.g., lines 47-76 in [Cemre & Zafer]
32 From this point forward, throughout the teaching experiment, angles were represented on the (unit)
circle located on the perpendicular coordinate system or its translated form which was the parallel
displacement system. Where, the angle’s vertex was the center and its initial side was the ray in the
positive horizontal direction. We called this multi-functional and non-discursive representational
register as the (unit) circle register.

144
Protocol 11; lines 18-44 in [Defne & Ebru] Protocol 11; lines 79-95 in [Cemre & Zafer]
Protocol 13). At this point, the researcher determined that all of the students were able
to define an angle with two measures (i.e., with the highest negative and the lowest
positive values) in each angle measure units within the (unit) circle register.
Henceforward, the subsequent progress of students’ concept images on angles that
emerged as a result of the teaching experiment was presented in terms of the different
representational registers under the following respective headings.
[Cemre & Zafer] Protocol 5
Researcher: Well, if we return to our starting point, to what is the angle measure related? 1
Cemre: Is it arc length? 2
Zafer: But now it is changing (dragging the point D in Figure 5.11). 3
Cemre: Uh-huh… …radius is also changing (pointing the measure r with her index 4
finger), but angle [measure] did not change (pointing m<ABC). (Dragging the 5
point D so as to obtain the radius measures with natural numbers like in Figure 6
5.11 and try to calculate ratios of the length of arc DE to radius) about 5 [length 7
of arc DE] and 2 [radius] (looking to the screen like in Figure 5.11(b) and 8
calculating the ratio of 5 to 2), that is, approximately, two and half… …now, 10 9
and 4 (looking to the screen like in Figure 5.11(c) and calculating the ratio of 10 10
to 4), again two and half… Ok, the ratio of this (pointing the length of the arc DE) 11
to this (pointing the radius) are always approximately 2.5, are there (looking to 12
Zafer)? 13
Zafer: How? 14
Cemre: Look, for example, the ratio of 2.57 to 1 (dragging the point D so as to obtain the 15
measures like in Figure 5.11(a), and pointing the arc length of DE and radius on 16
the screen), or of 5.13 to 2 (dragging the point D so as to obtain the measures like 17
in Figure 5.11(b), and pointing the arc length of DE and radius on the screen). 18
Zafer: Yeah (Calculating the ratios (length DE)/r and (length ED)/r like in Figure 5.12). 19
Cemre: This (pointing the ratio (length DE)/r) did not change, and this (pointing the ratio 20
(length ED)/r) also did not change (changing the radius through dragging the 21
point D)… 22
Zafer: (Nodding his head up and down). So, change the angle [‘s openness]. 23
Cemre: Ok (changing the angle’s openness through dragging point C), both [ratios] are 24
changing now. 25
Zafer: Yes, but now again they are same (changing the radius through dragging the point 26
D). 27
Researcher: In this case, is there any other stable measure? 28
Cemre: Yes, this is also stable (pointing angle measure)… 29
Zafer: (Nodding his head up and down). 30
Researcher: Is there any relation of this angle measure with these ratios (pointing with 31
her index finger these measures on the screen)? 32
Cemre&Zafer: (Looking to the screen without speaking) 33

145
Researcher: Well, you can consider π in the angle measure. 34
Cemre&Zafer: (Looking to the screen without speaking) 35
Researcher: There is π here (pointing π notation in the angle measure), there is not π here 36
(pointing ratios of arc lengths to radius). 37
Cemre: We multiply 0.88 with π… 38
Researcher: Can you multiple them by the GSP’s calculate option? 39
Cemre: (Calculating this multiplication) ah, result comes out the same as this (pointing 40
the ratio lengthDE/r on the screen like up-one in Figure 5.12). …but, as what does 41
it [GSP] take π? If we accept this (pointing the numeric part of the angle measure) 42
about 0.9… …this (pointing the ratio lengthDE/r) is about its three times… 43
Zafer: (Opening the calculate option of GSP and selecting only π value) ok, it takes π as 44
3.14… 45
Cemre: Ah!… This π (pointing the π notation in the angle measure) was 3.14… 46
Zafer: Uh-huh… (After 6-second pause) then, the division of this (pointing the ratio 47
lengthDE/r) by π or 3.14 should give this (pointing the numeric value of the angle 48
measure)… (Calculating this division like in Figure 5.12) yes... 49
Cemre: (Dragging the point C to manipulate the angle’s measure) yes… 50
Researcher: What about now (dragging the point C so as the given angle measure to be 51
negative)? 52
Cemre: Then, the division of this (pointing the ratio lengthED/r) by π should be 84 53
(pointing the numeric value of the angle measure on the screen like down-one in 54
Figure 5.12)… (Calculating this division), yes... 55
Zafer: (Smiling and nodding his head up and down). Then, an angle’s radian measure 56
is… …of the division of arc length inside of an angle by radius… …the value with 57
respect to π… 58
Cemre: (Nodding her head up and down)… 59
Researcher: Well, what can you say about these ratios if the radius is 1 (pointing them on 60
the screen)? 61
Cemre: Then, these ratios are equal to arc lengths. So, angle’s measure is equal to arc 62
length. 63
Zafer: (Dragging the point D to obtain the radius with 1 cm length) uh-huh (nodding his 64
head up and down). That is, on the unit circle, arc length is the angle measure in 65
radians… 66
Cemre: It is interesting… I have never thought angle measure in radians is related to arc 67
length… 68
Zafer: …but of the circle whose radius is 1… 69
Cemre: Of course, because it [radian measure] corresponds to these ratios (pointing them 70
on the screen). 71
Zafer: (After 4-second pause) that is to say, it is the reason of π is 180 in degrees… I had 72
memorized π as equal to 180… I had thought this π (pointing the π notation of the 73
angle measure in radians) was different from π we had learned as 3.14 before. 74
However, they have been equal to each other… …π has referred to 180 degrees 75
because straight line imply half-circumference. 76
Cemre: Exactly. I hadn’t thought the relation of π with half arc length of a circle with 1 77
radius. 78
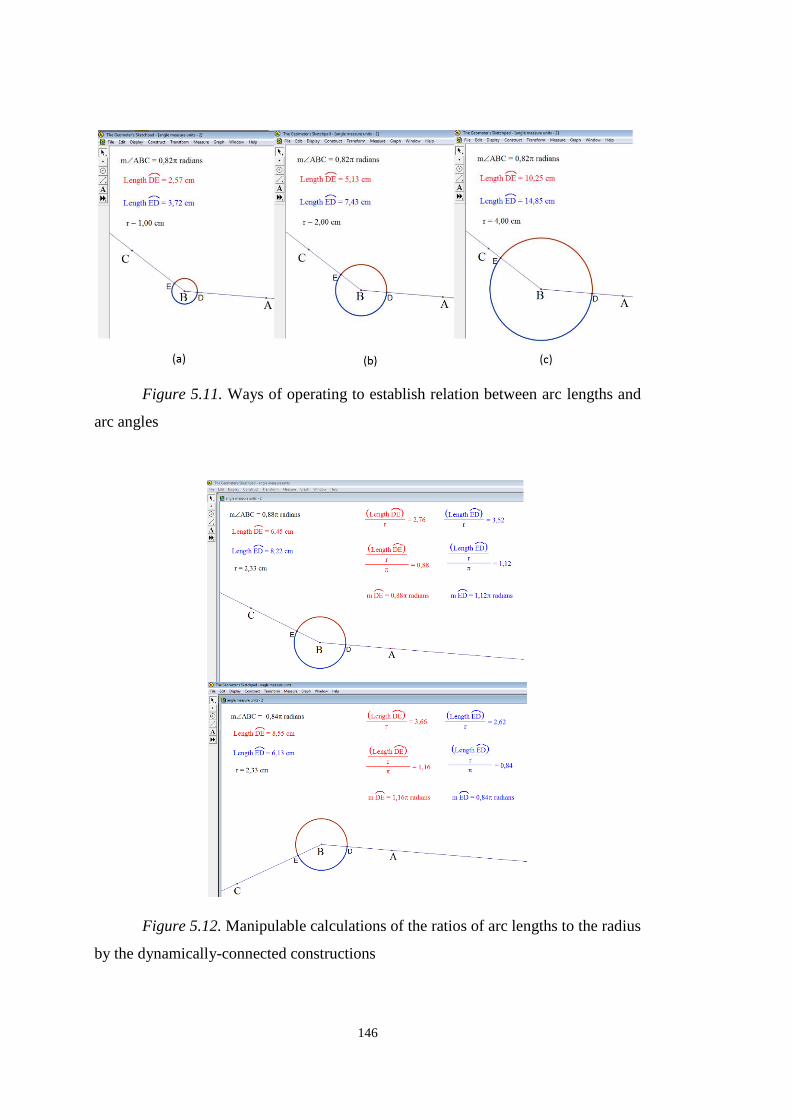
146
Figure 5.11. Ways of operating to establish relation between arc lengths and
arc angles
Figure 5.12. Manipulable calculations of the ratios of arc lengths to the radius
by the dynamically-connected constructions
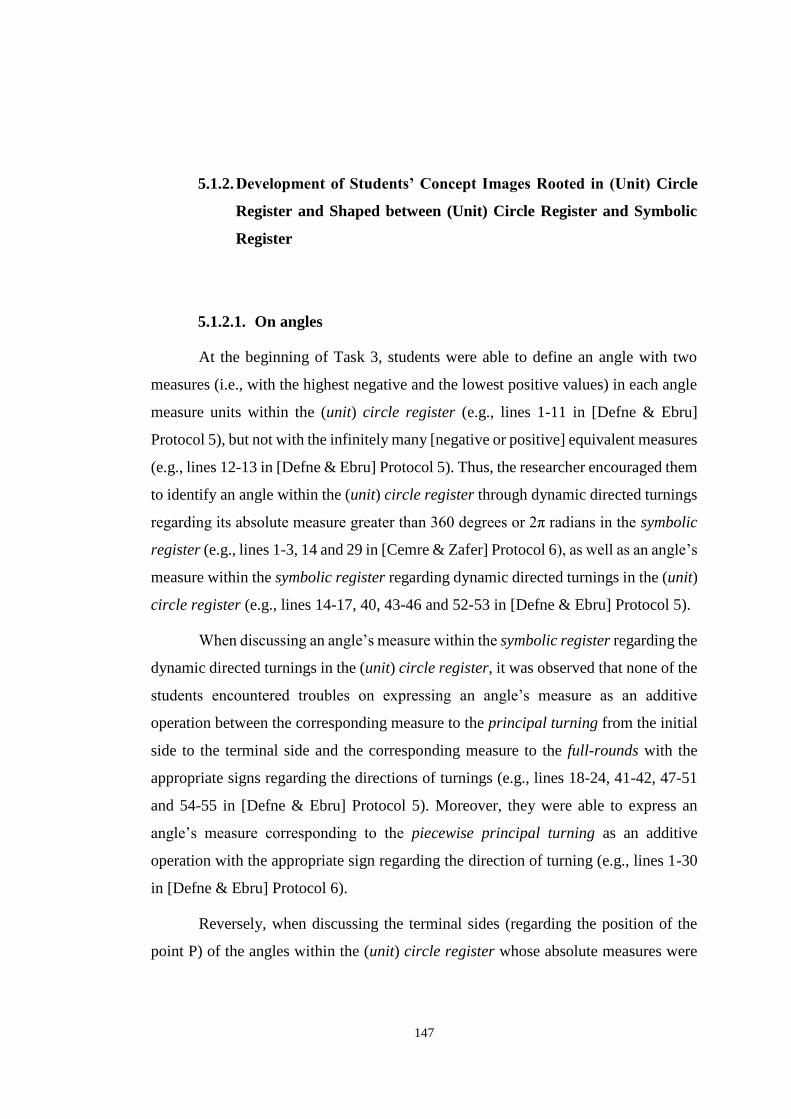
147
5.1.2. Development of Students’ Concept Images Rooted in (Unit) Circle
Register and Shaped between (Unit) Circle Register and Symbolic
Register
5.1.2.1. On angles
At the beginning of Task 3, students were able to define an angle with two
measures (i.e., with the highest negative and the lowest positive values) in each angle
measure units within the (unit) circle register (e.g., lines 1-11 in [Defne & Ebru]
Protocol 5), but not with the infinitely many [negative or positive] equivalent measures
(e.g., lines 12-13 in [Defne & Ebru] Protocol 5). Thus, the researcher encouraged them
to identify an angle within the (unit) circle register through dynamic directed turnings
regarding its absolute measure greater than 360 degrees or 2π radians in the symbolic
register (e.g., lines 1-3, 14 and 29 in [Cemre & Zafer] Protocol 6), as well as an angle’s
measure within the symbolic register regarding dynamic directed turnings in the (unit)
circle register (e.g., lines 14-17, 40, 43-46 and 52-53 in [Defne & Ebru] Protocol 5).
When discussing an angle’s measure within the symbolic register regarding the
dynamic directed turnings in the (unit) circle register, it was observed that none of the
students encountered troubles on expressing an angle’s measure as an additive
operation between the corresponding measure to the principal turning from the initial
side to the terminal side and the corresponding measure to the full-rounds with the
appropriate signs regarding the directions of turnings (e.g., lines 18-24, 41-42, 47-51
and 54-55 in [Defne & Ebru] Protocol 5). Moreover, they were able to express an
angle’s measure corresponding to the piecewise principal turning as an additive
operation with the appropriate sign regarding the direction of turning (e.g., lines 1-30
in [Defne & Ebru] Protocol 6).
Reversely, when discussing the terminal sides (regarding the position of the
point P) of the angles within the (unit) circle register whose absolute measures were
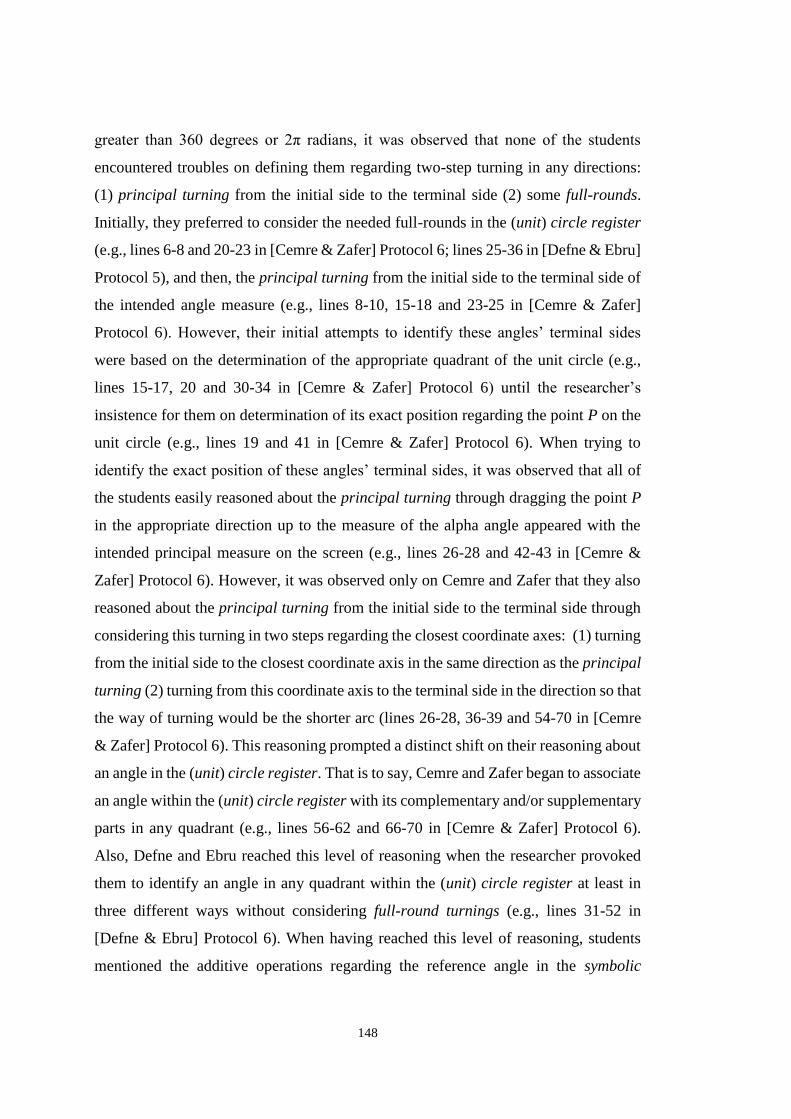
148
greater than 360 degrees or 2π radians, it was observed that none of the students
encountered troubles on defining them regarding two-step turning in any directions:
(1) principal turning from the initial side to the terminal side (2) some full-rounds.
Initially, they preferred to consider the needed full-rounds in the (unit) circle register
(e.g., lines 6-8 and 20-23 in [Cemre & Zafer] Protocol 6; lines 25-36 in [Defne & Ebru]
Protocol 5), and then, the principal turning from the initial side to the terminal side of
the intended angle measure (e.g., lines 8-10, 15-18 and 23-25 in [Cemre & Zafer]
Protocol 6). However, their initial attempts to identify these angles’ terminal sides
were based on the determination of the appropriate quadrant of the unit circle (e.g.,
lines 15-17, 20 and 30-34 in [Cemre & Zafer] Protocol 6) until the researcher’s
insistence for them on determination of its exact position regarding the point P on the
unit circle (e.g., lines 19 and 41 in [Cemre & Zafer] Protocol 6). When trying to
identify the exact position of these angles’ terminal sides, it was observed that all of
the students easily reasoned about the principal turning through dragging the point P
in the appropriate direction up to the measure of the alpha angle appeared with the
intended principal measure on the screen (e.g., lines 26-28 and 42-43 in [Cemre &
Zafer] Protocol 6). However, it was observed only on Cemre and Zafer that they also
reasoned about the principal turning from the initial side to the terminal side through
considering this turning in two steps regarding the closest coordinate axes: (1) turning
from the initial side to the closest coordinate axis in the same direction as the principal
turning (2) turning from this coordinate axis to the terminal side in the direction so that
the way of turning would be the shorter arc (lines 26-28, 36-39 and 54-70 in [Cemre
& Zafer] Protocol 6). This reasoning prompted a distinct shift on their reasoning about
an angle in the (unit) circle register. That is to say, Cemre and Zafer began to associate
an angle within the (unit) circle register with its complementary and/or supplementary
parts in any quadrant (e.g., lines 56-62 and 66-70 in [Cemre & Zafer] Protocol 6).
Also, Defne and Ebru reached this level of reasoning when the researcher provoked
them to identify an angle in any quadrant within the (unit) circle register at least in
three different ways without considering full-round turnings (e.g., lines 31-52 in
[Defne & Ebru] Protocol 6). When having reached this level of reasoning, students
mentioned the additive operations regarding the reference angle in the symbolic

149
register [i.e., π±α and ±α] as the most convenient forms to consider an angle in the
(unit) circle register (e.g., lines 53-58 in [Defne & Ebru] Protocol 6). However, their
articulations revealed that none of the students preferred them according to their
awareness on the reference angle’s role. Instead, their preferences were based on the
problematic part of their concept images on the angle measures [in the form π/2±α and
3π/2±α] in terms of the memorized-rules without any reasons within the symbolic
register (e.g., lines 59-64 in [Defne & Ebru] Protocol 6) that were revealed also
throughout the initial interviews. Despite of their unawareness on the reference angle’s
role, all students were able to identify an angle via not only the two-step principal
turning regarding the reference angle in the (unit) circle register but also the additive
operations regarding the reference angle in the symbolic register. Since students’ this
level of reasoning on angles was inconsistent with their prior ones revealed throughout
the initial interviews, all these discussions mentioned above were also done on the
another GSP page whose static version was like in Figure 5.16, and same reasoning
was observed.
At the end of Task 3, all students were able to reason easily about an angle in
the (unit) circle register with the infinitely many negative and positive equivalent
measures in the symbolic register [including the highest negative and lowest positive
measures, coterminal measures greater than 360 degrees or 2π radians, as well as
additive operations regarding its reference angle] but also infinitely many equivalent
measures in the symbolic register as the same structure in the (unit) circle register.
Moreover, they were able to associate an angle in any quadrant within the (unit) circle
register with its complementary and/or supplementary parts. This kind of reasoning
about angles was vital for trigonometric functions’ coherent conceptions in the (unit)
circle register through leading for students to (a) extent trigonometric functions’
domain from the acute angles over the obtuse and reflex angles in the (unit) circle
register, and then, to the real number set (R) in the symbolic register, (b) transfer their
integrated conceptions on trigonometric functions in the first quadrant in the (unit)
circle register with the right triangle context into the any other quadrants by means of
the reference right triangle, (c) associate sine [cosine] of an angle in any quadrant with

150
sine [cosine] of this angle’s reference angle in the first quadrant, (d) reason about
periodic nature of trigonometric functions.
At this point, the researcher predicted that students would encounter troubles
on transferring their integrated concept definition images on sine and cosine [in the
right triangle context and the unit circle context] within the first quadrant of the (unit)
circle register into the any other quadrant of the (unit) circle register as an again
merged concept definition images in both contexts. So, the following task, Task 4, was
designed to observe students these troubles.
[Defne & Ebru] Protocol 5
Researcher: How can you identify this angle’s measure (dragging her index finger on the 1
positive x-axis from right to left, and then, from the origin to the point P on the 2
screen like in Figure 5.13(b))? 3
Defne: We come 159 degrees from here to here in positive direction (dragging an arc in 4
the counterclockwise direction with her index finger from the intersection point of 5
the unit circle with the positive x-axis to the point P), but comes from here to here 6
in negative direction (dragging an arc in the clockwise direction with her index 7
finger from the intersection point of the unit circle with the positive x-axis to the 8
point P), that is, 159 minus 360… what is it… 9
Ebru: …minus 201 10
Defne: Yes. 11
Researcher: Ok. What else? 12
Defne&Ebru: (Looking to the screen without speaking) 13
Researcher: Well, if I turned from here to here (dragging an arc on the unit circle in the 14
counterclockwise direction with her index finger from the point 1on the x-axis to 15
the point P), and then, a full-round like that (dragging a circle through beginning 16
from the point P in the counterclockwise direction), what degrees would I turn? 17
Defne&Ebru: 360 plus 159 (figuring with their index fingers a full-round from the 18
intersection point of the unit circle with the positive x-axis, and then, an arc from 19
the intersection point to the point P in counterclockwise direction)… 20
Ebru: 519 degrees… 21
Researcher: Why do you think of 360? 22
Defne: Because one full-round refers to 360 degrees. 23
Ebru: Uh-huh (nodding her head up and down). 24
Researcher: Ok. Where would the new position of the point P on the unit circle be for the 25
519-degree angle? 26
Defne: Isn’t it the same position (pointing the point P on the unit circle, and looking to 27
Ebru)? 28
Ebru: Yes. 29
Researcher: Why? 30
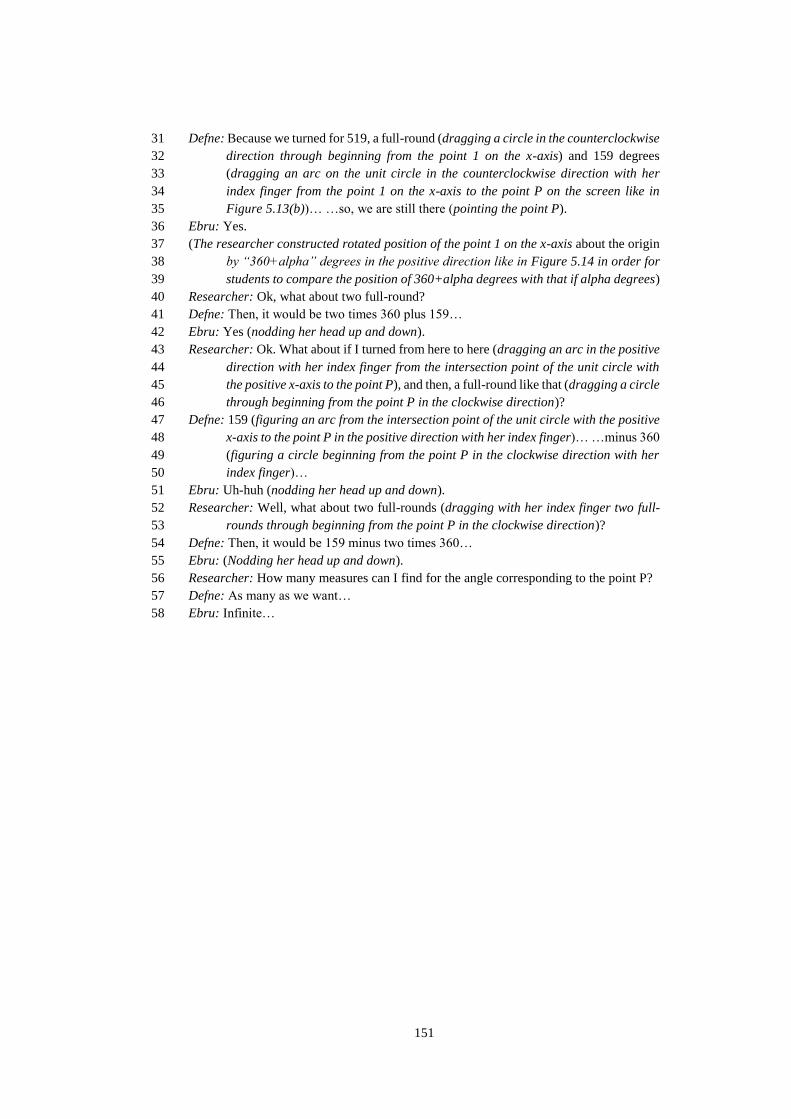
151
Defne: Because we turned for 519, a full-round (dragging a circle in the counterclockwise 31
direction through beginning from the point 1 on the x-axis) and 159 degrees 32
(dragging an arc on the unit circle in the counterclockwise direction with her 33
index finger from the point 1 on the x-axis to the point P on the screen like in 34
Figure 5.13(b))… …so, we are still there (pointing the point P). 35
Ebru: Yes. 36
(The researcher constructed rotated position of the point 1 on the x-axis about the origin 37
by “360+alpha” degrees in the positive direction like in Figure 5.14 in order for 38
students to compare the position of 360+alpha degrees with that if alpha degrees) 39
Researcher: Ok, what about two full-round? 40
Defne: Then, it would be two times 360 plus 159… 41
Ebru: Yes (nodding her head up and down). 42
Researcher: Ok. What about if I turned from here to here (dragging an arc in the positive 43
direction with her index finger from the intersection point of the unit circle with 44
the positive x-axis to the point P), and then, a full-round like that (dragging a circle 45
through beginning from the point P in the clockwise direction)? 46
Defne: 159 (figuring an arc from the intersection point of the unit circle with the positive 47
x-axis to the point P in the positive direction with her index finger)… …minus 360 48
(figuring a circle beginning from the point P in the clockwise direction with her 49
index finger)… 50
Ebru: Uh-huh (nodding her head up and down). 51
Researcher: Well, what about two full-rounds (dragging with her index finger two full-52
rounds through beginning from the point P in the clockwise direction)? 53
Defne: Then, it would be 159 minus two times 360… 54
Ebru: (Nodding her head up and down). 55
Researcher: How many measures can I find for the angle corresponding to the point P? 56
Defne: As many as we want… 57
Ebru: Infinite… 58

152
Figure 5.13. An angle on the (unit) circle register and its principal measure in
the symbolic register
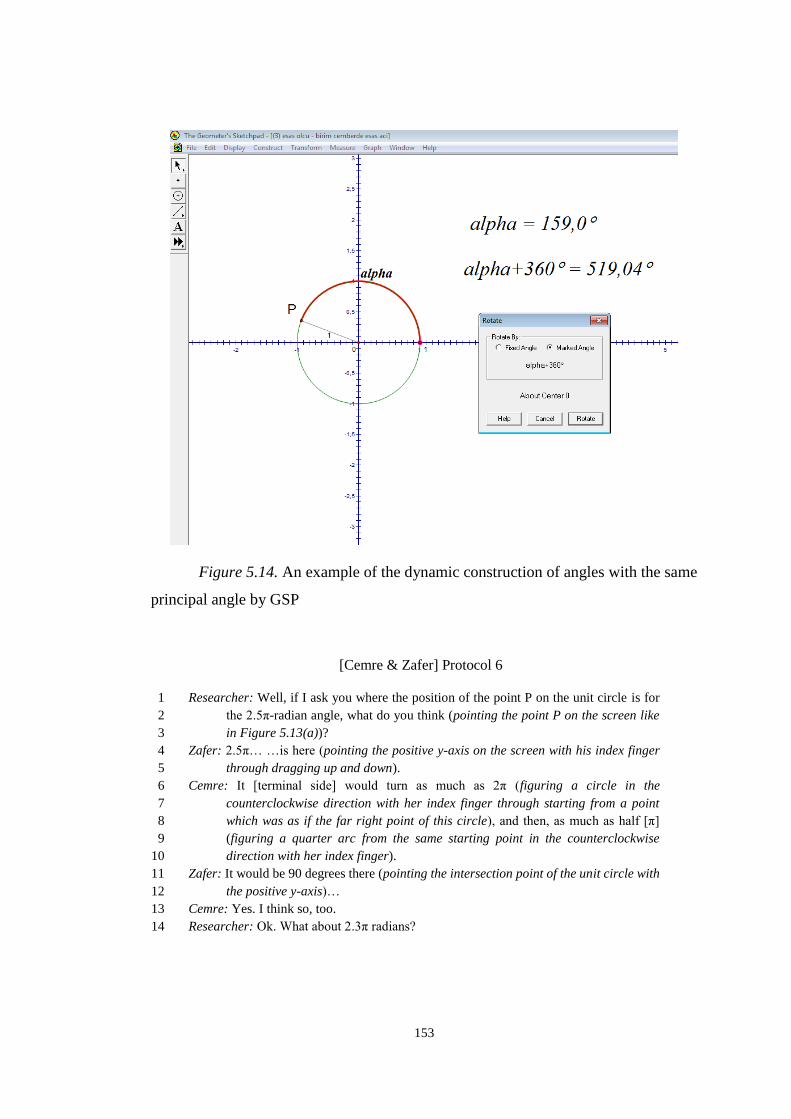
153
Figure 5.14. An example of the dynamic construction of angles with the same
principal angle by GSP
[Cemre & Zafer] Protocol 6
Researcher: Well, if I ask you where the position of the point P on the unit circle is for 1
the 2.5π-radian angle, what do you think (pointing the point P on the screen like 2
in Figure 5.13(a))? 3
Zafer: 2.5π… …is here (pointing the positive y-axis on the screen with his index finger 4
through dragging up and down). 5
Cemre: It [terminal side] would turn as much as 2π (figuring a circle in the 6
counterclockwise direction with her index finger through starting from a point 7
which was as if the far right point of this circle), and then, as much as half [π] 8
(figuring a quarter arc from the same starting point in the counterclockwise 9
direction with her index finger). 10
Zafer: It would be 90 degrees there (pointing the intersection point of the unit circle with 11
the positive y-axis)… 12
Cemre: Yes. I think so, too. 13
Researcher: Ok. What about 2.3π radians? 14

154
Zafer: It would be between these two (pointing simultaneously on the screen the point 1 15
on the y-axis with his right hands index finger and the point 1 on the x-axis with 16
his right hands middle finger). 17
Cemre: Uh-huh. 18
Researcher: Ok. But I want you to show 2.3π radians’ exact position on the unit circle. 19
Cemre: It would be smaller than 90 degrees… 20
Zafer: Now, it [the measure] became 2π up to here (dragging the point P so as to complete 21
exactly one full round in the counterclockwise direction starting from 0 radians)… 22
…and 0.3 [π] is happening in here (continuing to drag the point P in the 23
counterclockwise direction and dropping it when the measure of the alpha angle 24
appeared as 0.3π radians on the screen). 25
Cemre: When we think here as 0.5 [π] (bringing the point P on the positive y-axis), 0.3 26
[π] is here somewhere (dragging it in the clockwise direction up to the measure of 27
the alpha angle appeared as 0.3π radians on the screen). 28
Researcher: Ok. What about 5.3π radians? 29
Cemre: 1.3 [π], so it would be here somewhere (pointing the third quadrant of the unit 30
circle with the cursor). 31
Zafer: It would be between these two (pointing simultaneously on the screen the point -1 32
on the x-axis with his right hands index finger and the point -1 on the y-axis with 33
his right hands middle finger). 34
Researcher: How did you determine? 35
Zafer: Firstly, we subtract 4π, and then, it would be 1.3π… Up to here (pointing the point 36
-1 on the x-axis), it [the angle measure] is π, therefore, it [1.3π] would be between 37
these two (pointing with his index finger on the screen respectively the point -1 on 38
the x-axis and the point -1 on the y-axis). 39
Cemre: Yes. 40
Researcher: Ok. But I want you to show again its exact position on the unit circle. 41
Cemre: (Bringing the point P in the third quadrant through dragging so as the alpha 42
measure to be approximately 1.3π radians) it is there. 43
Zafer: Yes. 44
Cemre: They [5.3π radians and 1.3π radians] mean same thing [position] on the unit 45
circle. 46
Zafer: Yes. 47
Researcher: Well. We determined that two different angle measures, that is, 5.3π and 48
1.3π in radians corresponded to the same position on the unit circle. Are there such 49
any other measures corresponding to the point P? 50
Zafer: We can consider negatively, that is, from here to here (figuring an arc with his 51
index finger in clockwise direction from the point 1 on the x-axis to the point P on 52
the screen). 53
Cemre: …through the opposite direction… 54
Researcher: So, what is the measure? 55
Zafer: If we think starting from here (pointing the point 1 on the x-axis with the cursor), 56
up to here it [arc length] is 0.5 [π] (figuring a quarter arc with the cursor in the 57
clockwise direction in the fourth guardant on the unit circle), and then here is 58
approximately 0.6, 0.7 [π] (figuring an arc in the clockwise direction from the 59
point -1 on the y-axis to the point P on the screen)… …it would be 0.7 [π] because 60
when adding 0.3 [π] more, it would be here (figuring an arc in the clockwise 61
direction from the point P to the point -1 on the x-axis on the screen). 62
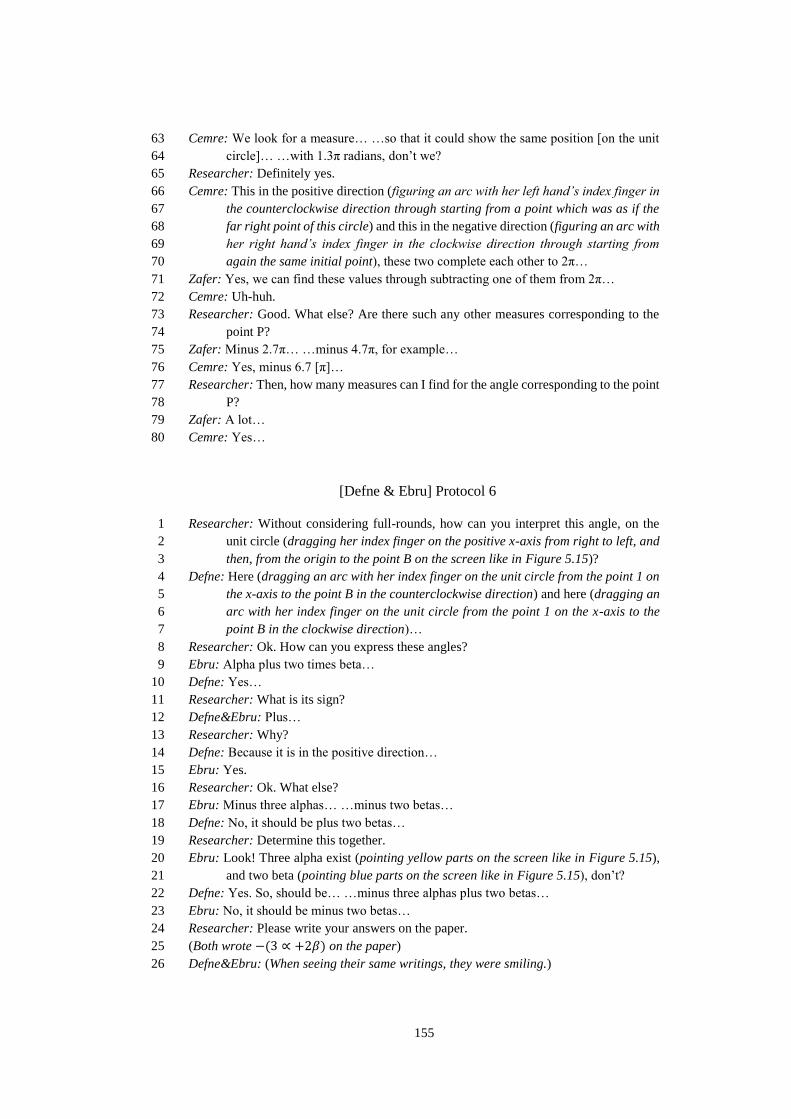
155
Cemre: We look for a measure… …so that it could show the same position [on the unit 63
circle]… …with 1.3π radians, don’t we? 64
Researcher: Definitely yes. 65
Cemre: This in the positive direction (figuring an arc with her left hand’s index finger in 66
the counterclockwise direction through starting from a point which was as if the 67
far right point of this circle) and this in the negative direction (figuring an arc with 68
her right hand’s index finger in the clockwise direction through starting from 69
again the same initial point), these two complete each other to 2π… 70
Zafer: Yes, we can find these values through subtracting one of them from 2π… 71
Cemre: Uh-huh. 72
Researcher: Good. What else? Are there such any other measures corresponding to the 73
point P? 74
Zafer: Minus 2.7π… …minus 4.7π, for example… 75
Cemre: Yes, minus 6.7 [π]… 76
Researcher: Then, how many measures can I find for the angle corresponding to the point 77
P? 78
Zafer: A lot… 79
Cemre: Yes… 80
[Defne & Ebru] Protocol 6
Researcher: Without considering full-rounds, how can you interpret this angle, on the 1
unit circle (dragging her index finger on the positive x-axis from right to left, and 2
then, from the origin to the point B on the screen like in Figure 5.15)? 3
Defne: Here (dragging an arc with her index finger on the unit circle from the point 1 on 4
the x-axis to the point B in the counterclockwise direction) and here (dragging an 5
arc with her index finger on the unit circle from the point 1 on the x-axis to the 6
point B in the clockwise direction)… 7
Researcher: Ok. How can you express these angles? 8
Ebru: Alpha plus two times beta… 9
Defne: Yes… 10
Researcher: What is its sign? 11
Defne&Ebru: Plus… 12
Researcher: Why? 13
Defne: Because it is in the positive direction… 14
Ebru: Yes. 15
Researcher: Ok. What else? 16
Ebru: Minus three alphas… …minus two betas… 17
Defne: No, it should be plus two betas… 18
Researcher: Determine this together. 19
Ebru: Look! Three alpha exist (pointing yellow parts on the screen like in Figure 5.15), 20
and two beta (pointing blue parts on the screen like in Figure 5.15), don’t? 21
Defne: Yes. So, should be… …minus three alphas plus two betas… 22
Ebru: No, it should be minus two betas… 23
Researcher: Please write your answers on the paper. 24
(Both wrote −(3 ∝ +2𝛽) on the paper) 25
Defne&Ebru: (When seeing their same writings, they were smiling.) 26
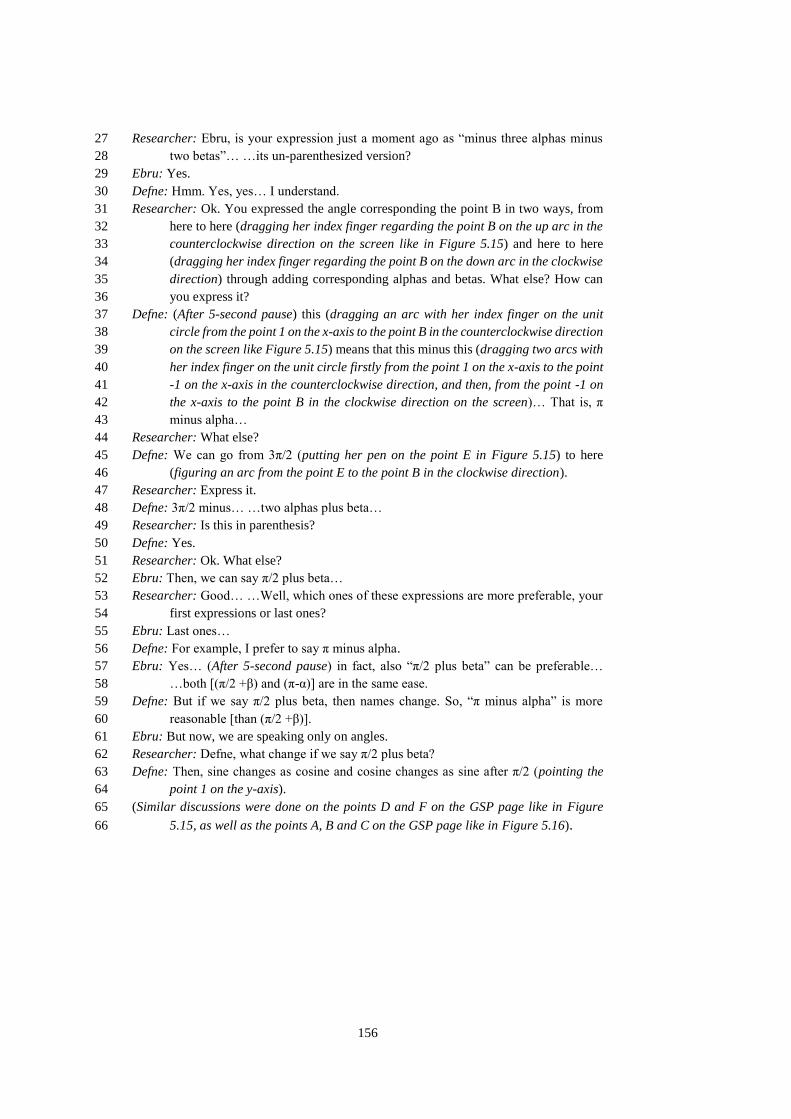
156
Researcher: Ebru, is your expression just a moment ago as “minus three alphas minus 27
two betas”… …its un-parenthesized version? 28
Ebru: Yes. 29
Defne: Hmm. Yes, yes… I understand. 30
Researcher: Ok. You expressed the angle corresponding the point B in two ways, from 31
here to here (dragging her index finger regarding the point B on the up arc in the 32
counterclockwise direction on the screen like in Figure 5.15) and here to here 33
(dragging her index finger regarding the point B on the down arc in the clockwise 34
direction) through adding corresponding alphas and betas. What else? How can 35
you express it? 36
Defne: (After 5-second pause) this (dragging an arc with her index finger on the unit 37
circle from the point 1 on the x-axis to the point B in the counterclockwise direction 38
on the screen like Figure 5.15) means that this minus this (dragging two arcs with 39
her index finger on the unit circle firstly from the point 1 on the x-axis to the point 40
-1 on the x-axis in the counterclockwise direction, and then, from the point -1 on 41
the x-axis to the point B in the clockwise direction on the screen)… That is, π 42
minus alpha… 43
Researcher: What else? 44
Defne: We can go from 3π/2 (putting her pen on the point E in Figure 5.15) to here 45
(figuring an arc from the point E to the point B in the clockwise direction). 46
Researcher: Express it. 47
Defne: 3π/2 minus… …two alphas plus beta… 48
Researcher: Is this in parenthesis? 49
Defne: Yes. 50
Researcher: Ok. What else? 51
Ebru: Then, we can say π/2 plus beta… 52
Researcher: Good… …Well, which ones of these expressions are more preferable, your 53
first expressions or last ones? 54
Ebru: Last ones… 55
Defne: For example, I prefer to say π minus alpha. 56
Ebru: Yes… (After 5-second pause) in fact, also “π/2 plus beta” can be preferable… 57
…both [(π/2 +β) and (π-α)] are in the same ease. 58
Defne: But if we say π/2 plus beta, then names change. So, “π minus alpha” is more 59
reasonable [than (π/2 +β)]. 60
Ebru: But now, we are speaking only on angles. 61
Researcher: Defne, what change if we say π/2 plus beta? 62
Defne: Then, sine changes as cosine and cosine changes as sine after π/2 (pointing the 63
point 1 on the y-axis). 64
(Similar discussions were done on the points D and F on the GSP page like in Figure 65
5.15, as well as the points A, B and C on the GSP page like in Figure 5.16). 66
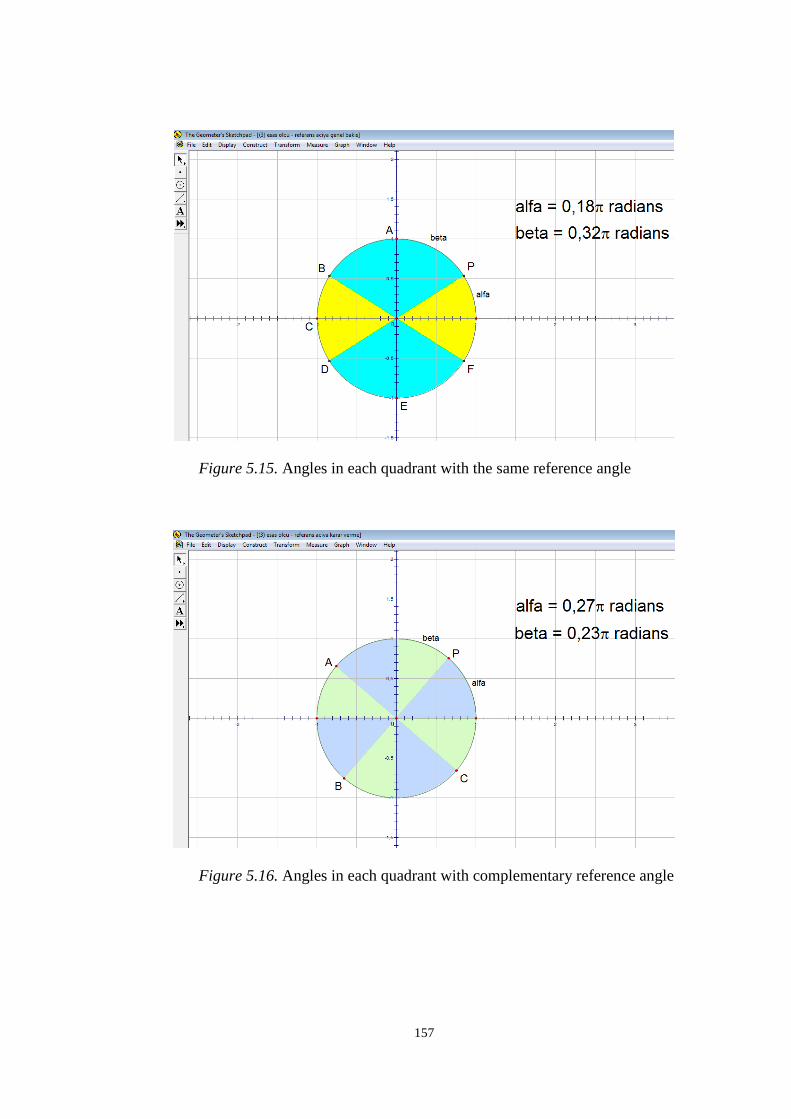
157
Figure 5.15. Angles in each quadrant with the same reference angle
Figure 5.16. Angles in each quadrant with complementary reference angle

158
5.1.2.2. On trigonometric functions
As a result of students’ problematic concept images on functionality that were
revealed throughout the initial interviews, at the beginning of Task 4, the researcher
defined the function concept as a relation between two sets (i.e., domain and range)
with the property that each input in the domain must be related to exactly one output
in the range. Then, she asked students to discuss whether the relation mapping the
green arc into the red [blue] line segment was a function or not (Figure 5.17) without
mentioning the sine [cosine] term. Where, it was observed that all of the students were
able to reason about the functionality of this visual relation between the green arc and
the red [blue] line segment in the (unit) circle register through investigating the
variation on these two visual objects (e.g., [Defne & Ebru] Protocol 7) by the aid of
the drag-and-drop option of GSP.
At this point, the researcher predicted that students would associate the
measure of the red [blue] segment with some of three measures: length of the red [blue]
segment, sine [cosine] of the alpha, and ordinate [abscissa] of the point P (Figure
5.17). Where, to provide students’ concentration only on the directed-measure idea,
the researcher preferred to measure length of the red [blue] segment in the unit of
coordinate system on preconstructed GSP page (Figure 5.17). Before mentioning the
definition of sine [cosine] as a function, she encouraged students to investigate the
variation among these three measures when manipulating the position of the point P
regarding the quadrants (e.g., lines 1-12, 20-21, 31 and 38 in [Cemre & Zafer] Protocol
7) hoping for students to construct well-structured cognitive networks among them.
Initially, it was observed that when the point P was in the first quadrant, students
reasoned about the equality of these three measures (e.g., lines 1-19 in [Cemre &
Zafer] Protocol 7). However, when manipulating the position of the point P from the
first quadrant to another quadrant, it was observed that all students focused only on the
variation of signs (e.g., lines 20-26, 31-43 in [Cemre & Zafer] Protocol 7) instead of
the relation between these three measures. Although considering dynamically linked
measures, all students were able to reason easily and truly about the signs of the sine
[cosine] values in each quadrant, they were unable to articulate why sine [cosine] took
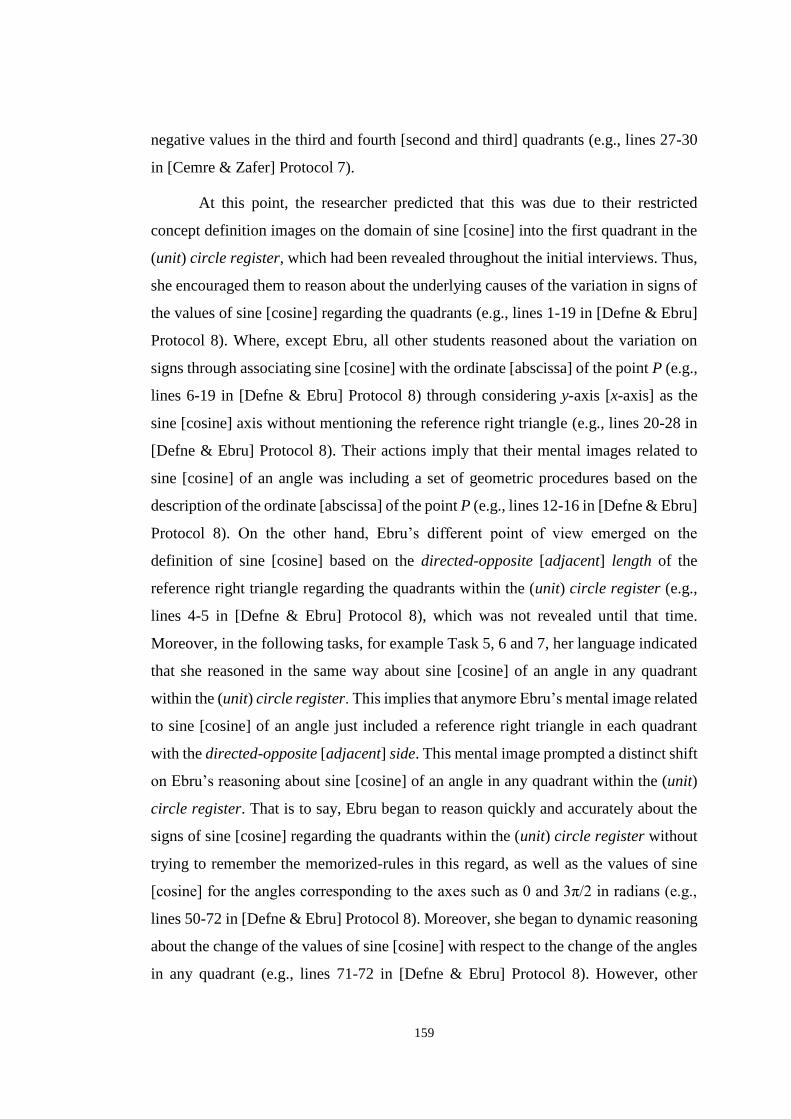
159
negative values in the third and fourth [second and third] quadrants (e.g., lines 27-30
in [Cemre & Zafer] Protocol 7).
At this point, the researcher predicted that this was due to their restricted
concept definition images on the domain of sine [cosine] into the first quadrant in the
(unit) circle register, which had been revealed throughout the initial interviews. Thus,
she encouraged them to reason about the underlying causes of the variation in signs of
the values of sine [cosine] regarding the quadrants (e.g., lines 1-19 in [Defne & Ebru]
Protocol 8). Where, except Ebru, all other students reasoned about the variation on
signs through associating sine [cosine] with the ordinate [abscissa] of the point P (e.g.,
lines 6-19 in [Defne & Ebru] Protocol 8) through considering y-axis [x-axis] as the
sine [cosine] axis without mentioning the reference right triangle (e.g., lines 20-28 in
[Defne & Ebru] Protocol 8). Their actions imply that their mental images related to
sine [cosine] of an angle was including a set of geometric procedures based on the
description of the ordinate [abscissa] of the point P (e.g., lines 12-16 in [Defne & Ebru]
Protocol 8). On the other hand, Ebru’s different point of view emerged on the
definition of sine [cosine] based on the directed-opposite [adjacent] length of the
reference right triangle regarding the quadrants within the (unit) circle register (e.g.,
lines 4-5 in [Defne & Ebru] Protocol 8), which was not revealed until that time.
Moreover, in the following tasks, for example Task 5, 6 and 7, her language indicated
that she reasoned in the same way about sine [cosine] of an angle in any quadrant
within the (unit) circle register. This implies that anymore Ebru’s mental image related
to sine [cosine] of an angle just included a reference right triangle in each quadrant
with the directed-opposite [adjacent] side. This mental image prompted a distinct shift
on Ebru’s reasoning about sine [cosine] of an angle in any quadrant within the (unit)
circle register. That is to say, Ebru began to reason quickly and accurately about the
signs of sine [cosine] regarding the quadrants within the (unit) circle register without
trying to remember the memorized-rules in this regard, as well as the values of sine
[cosine] for the angles corresponding to the axes such as 0 and 3π/2 in radians (e.g.,
lines 50-72 in [Defne & Ebru] Protocol 8). Moreover, she began to dynamic reasoning
about the change of the values of sine [cosine] with respect to the change of the angles
in any quadrant (e.g., lines 71-72 in [Defne & Ebru] Protocol 8). However, other

160
students did not rich this kind of mental image related to sine [cosine] of an angle
within the (unit) circle register throughout Task 4. Therefore, in order to ease for them
to develop such a mental image associating sine [cosine] of an angle with the directed-
opposite [adjacent] side of the reference right triangle in any quadrant within the (unit)
circle register, the researcher preferred in the following task, Task 5, to study on the
unit circle integrated with a reference right triangle whose opposite [adjacent] leg was
labeled as sine [cosine] (Figure 5.19).
At the beginning of Task 5, she asked students to interpret the value of sine
[cosine] of the alpha angle without seeing the dynamically linked sin(alpha)
[cos(alpha)] measure on the screen (e.g., lines 1-4 in [Cemre & Zafer] Protocol 8).
Where, up to that time even though all students were able to interpret sine [cosine] of
an angle as the ordinate [abscissa] of the point P both in the (unit) circle register and
in the language register, it was interestingly observed that they were unable to convert
their interpretations arithmetically into the symbolic register. That is, none of the
students was aware of the determination of the sine [cosine] value of an angle in the
symbolic register by using the coordinate axes as a signed-ruler in the (unit) circle
register (e.g., lines 5-10 in [Cemre & Zafer] Protocol 8). They were only able to
discuss the sine [cosine] values in terms of the upper and lower bounds based on the
memorized rules (e.g., lines 11-20 in [Cemre & Zafer] Protocol 8). Students’ language
implies that their concept images on the values of sine [cosine] in the symbolic register
were restricted to the memorized exact values of sine [cosine] at the special angles
without any reasons. At this point, the researcher determined to provoke students to
focus the red [blue] line segment in terms of its magnitude based on the unit of
coordinate axes. For this purpose, she encouraged them to compare two visual objects,
namely, the red line segment and the radius line segment on the positive y-axis in terms
of their magnitudes through modeling these two objects with the real-life situations
(e.g., lines 21-27 in [Cemre & Zafer] Protocol 8). Where, it was observed that all of
the students were able to quickly and accurately compare these two visual objects in
terms of their magnitudes (e.g., lines 21-44 in [Cemre & Zafer] Protocol 8) considering
their signs (e.g., lines 45-46 in [Cemre & Zafer] Protocol 8).

161
After then, the researcher asked students to estimate the exact value referring
to the directed-red line segment (e.g., line 47-48 in [Cemre & Zafer] Protocol 8).
Students’ estimations were almost same with the sine values of the mentioned angles
in any quadrant (e.g., lines 47-63 in [Cemre & Zafer] Protocol 8). When the researcher
unveiled the sin(alpha) measure on the screen which was given by GSP as the
dynamically linked measure to the alpha measure, all students were surprised and
excited (e.g., lines 64-68 in [Cemre & Zafer] Protocol 8). This implies that each student
had just been able to convert the geometric procedures in their concept definition
images on sine within the (unit) circle register into the values of sine within the
symbolic register. Furthermore, when similar discussions were done in each quadrant
for at least three different points, as well as for cosine, it was observed again that
students were able to make quite closed predictions to the signed values of sine and
cosine of the alpha angle which was constructed and measured in GSP so as to indicate
the principal angle and the principal measure in radians.
At that point, the researcher determined that all of the students were able to
transform the reference right triangle from the first quadrant into the other quadrants
within the (unit) circle register thereby associating its opposite [adjacent] side
regarding the reference angle with the sine [cosine] value of the principal angle.
Moreover, they were able to convert the opposite [adjacent] side of the reference right
triangle in any quadrant within the (unit) circle register into the value of sine [cosine]
corresponding to the principal angle within the symbolic register thereby associating
the directed-opposite [adjacent] side with the sign of the value of sine [cosine].
Besides, in the absence of the reference right triangle regarding the position of the
point P on the axes, they were able to reason about sine [cosine] of these angles again
as the limit case of the directed-opposite [adjacent] side; and they were able to convert
the existing {non-existing} directed-opposite [adjacent] side within the (unit) circle
register into ±1 {zero} as the value of sine [cosine] corresponding to these angles
within the symbolic register through considering directions (e.g., lines 55-72 in [Defne
& Ebru] Protocol 8). Furthermore, they started to reason about sine [cosine] as a
function of the (principal) angle within the (unit) circle register (e.g., lines 76-83 in

162
[Cemre & Zafer] Protocol 8) on the contrary to their initial reasoning prior to the
teaching experiment.
However, their reasoning like that was in the (unit) circle register. The
researcher predicted that they would encounter troubles on converting this reasoning
from the (unit) circle register into the symbolic register. Thus, hoping to observe these
troubles, she encouraged students to discuss the sine [cosine] function within the
symbolic register based on a sine [cosine] value for an arbitrary angle which was the
first one that came to their mind (e.g., lines 1-2 in [Cemre & Zafer] Protocol 9).
Although up to that time all discussions on the sine [cosine] function were done based
on the angles in “radians” in GSP environment, it was observed that all students
expressed a sine value of a real number, such as 30, as an angle in “degrees” that came
first to their mind but without stating clearly their “degree” preference as the angle
measure unit (e.g., lines 3-5 in [Cemre & Zafer] Protocol 9) as a consequence of their
dominated concept images on angle measure units by “degrees” and their restricted
concept images on sine [cosine] values by the memorized rules that was revealed
throughout the initial interviews. At that point, the researcher determined to scrutinize
students’ awareness of the differentiation between the angle measure units for the
domain of the sine [cosine] function in the symbolic register. So, she provoked
students to reason about the different output of GSP as the sine [cosine] value of this
real number when the angle measure preference of GSP in radians (e.g., lines 6-8 in
[Cemre & Zafer] Protocol 9). Where, although all students were aware that the
difference between two outputs (GSP’s and theirs) arose from the difference between
angle measure units (e.g., lines 9-37 in [Cemre & Zafer] Protocol 9), they did not
articulate how the sine [cosine] value of this real number corresponded to the appeared
output on the screen as a result of the calculation by GSP when the angle measure was
in radians (e.g., lines 9-10 and 38-45 in [Cemre & Zafer] Protocol 9). It may arise from
GSP’s angle measure defaults in radians which produce an angle measure with π
notation. So, the researcher encouraged them to reason about an angle’s measure in
radians both with and without π notation through taking the advantage of GSP’s
calculate option. Where, it was observed that all students were able to reason about a
real number without π notation, for example 30, as an angle measure in radians through

163
transforming it into the symbolic form with π notation (e.g., lines 46-80 in [Cemre &
Zafer] Protocol 9) as well as considering π with its approximate real value, i.e., 3.14.
It was the point that students had just started to reason about a real number as an angle
measure with two different ways through considering angle measure units. In other
words, they were able to convert a real number in the symbolic register into two
different angles within the (unit) circle register through considering two angle measure
units, i.e., degrees and radians. Conversely, they were able to convert a static angle
structure within the (unit) circle register into two different real numbers as its principal
measure in the symbolic register through considering different angle measure units.
This means that anymore all students were aware of the importance of the preference
of the angle measure unit33 for the real value of an angle measure, as well as for the
value of sine [cosine].
However, the researcher determined that students would encounter troubles on
extension of this reasoning between a real number in the symbolic register and a static
angle structure within the (unit) circle register into the reasoning between the real
number set (R) in the symbolic register and the dynamic angle structures in the (unit)
circle register. Thus, hoping to observe these troubles, she encouraged them to discuss
about the relation between measures of the angles with the same static structure but
different dynamic structures in the (unit) circle register. Where, based on these
angles’ same static structure producing the same sine [cosine] value within the (unit)
circle register, Defne and Ebru initially reasoned about their measures as if equal to
each other in the symbolic register (lines 1-15 in [Defne & Ebru] Protocol 9). After
the researcher’s provocation of them to discuss this equality as an equation on the
paper and pencil environment (lines 16-17 in [Defne & Ebru] Protocol 9), they tried
to focus on what was mathematically same in this respect; and reasoned about their
difference in terms of measures in the symbolic register, as well as their sameness in
terms of static angle structures in the (unit) circle register (lines 18-24 in [Defne &
Ebru] Protocol 9). On the other hand, it was observed that based on the corresponding
arc lengths to the angles with the same static structure but different dynamic
33 From this task forward, throughout the teaching experiment, the radian measure unit was used as the
angle measure unit.

164
structures in the (unit) circle register, Zafer reasoned that they produced different
angle measures in the symbolic register (lines 1-14 in [Cemre & Zafer] Protocol 10).
Where, Cemre’s language and actions imply that she also reasoned in the same way
but through being affected by Zafer’s reasoning (lines 10-22 in [Cemre & Zafer]
Protocol 10). It was the point that students had just started to reason about each
dynamic angle structure with the same static structure as a different angle in the (unit)
circle register with a different measure in the symbolic register thereby associating
them with the same sine [cosine] value. Moreover, they were aware of the repetition
of the sine [cosine] values regarding the equivalent but not equal angles.
This kind of reasoning on the equivalent but not equal angles was vital for the
recognition of the sine [cosine] function’s periodic nature in all representational
registers. It was because extending the domain set of the sine [cosine] function from
the principal measures into the real number set (R) and seeing the patterns among them
under the sine [cosine] function were the base of the periodicity. In other words, the
recognition of periodicity got easier through assigning different angles with the same
principal measure into the same sine [cosine] value rather than merging the equivalent
but not equal angles into the principal measure, and then assigning this principal
measure into its sine [cosine] value. Moreover, this kind of reasoning was also
important to convert sine [cosine] from the (unit) circle register into the graphical
register. So, in Task 6 [Task 7], the researcher preferred to encourage students to
discuss the sine [cosine] function in a more detailed way in the graphical register as
well. Henceforward, the subsequent progress of students’ concept images on the sine
and cosine functions that emerged as a result of the teaching experiment was presented
under the following respective headings in terms of all different representational
registers through considering students transformation abilities regarding angles as the
domain of trigonometric functions, trigonometric values as the ranges of trigonometric
functions and periodicity as the pattern based on behaviors of trigonometric functions
both between and within the registers.
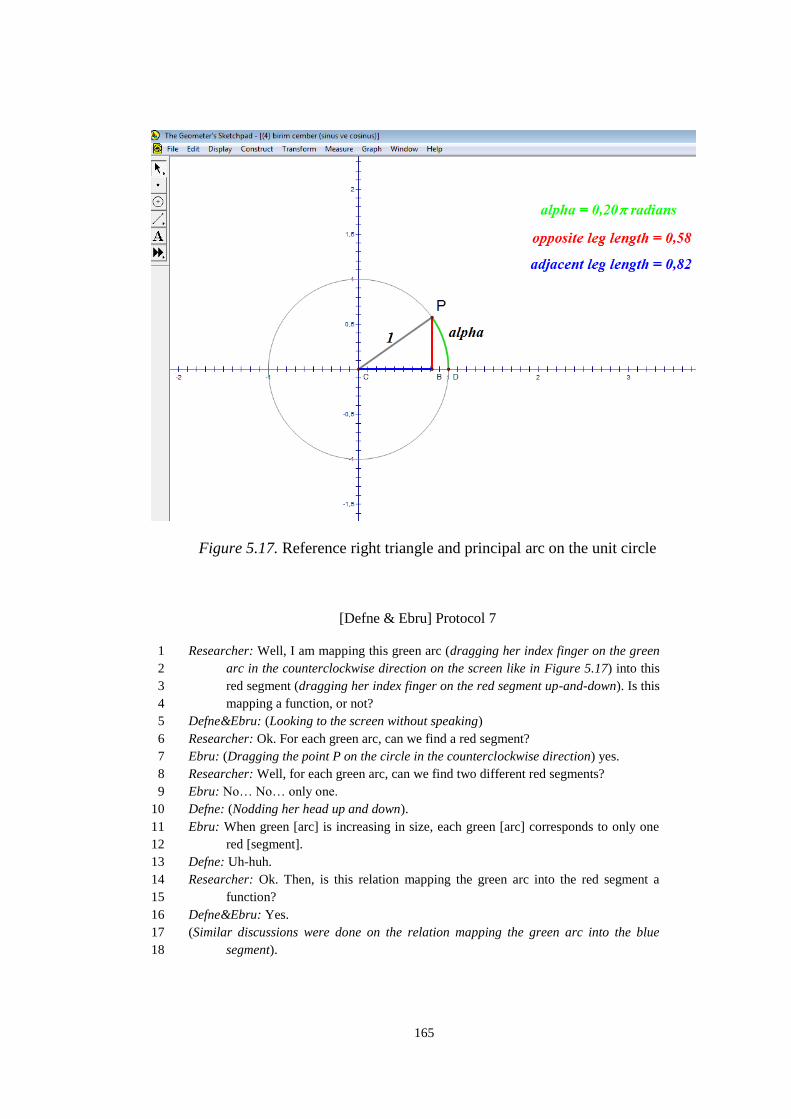
165
Figure 5.17. Reference right triangle and principal arc on the unit circle
[Defne & Ebru] Protocol 7
Researcher: Well, I am mapping this green arc (dragging her index finger on the green 1
arc in the counterclockwise direction on the screen like in Figure 5.17) into this 2
red segment (dragging her index finger on the red segment up-and-down). Is this 3
mapping a function, or not? 4
Defne&Ebru: (Looking to the screen without speaking) 5
Researcher: Ok. For each green arc, can we find a red segment? 6
Ebru: (Dragging the point P on the circle in the counterclockwise direction) yes. 7
Researcher: Well, for each green arc, can we find two different red segments? 8
Ebru: No… No… only one. 9
Defne: (Nodding her head up and down). 10
Ebru: When green [arc] is increasing in size, each green [arc] corresponds to only one 11
red [segment]. 12
Defne: Uh-huh. 13
Researcher: Ok. Then, is this relation mapping the green arc into the red segment a 14
function? 15
Defne&Ebru: Yes. 16
(Similar discussions were done on the relation mapping the green arc into the blue 17
segment). 18
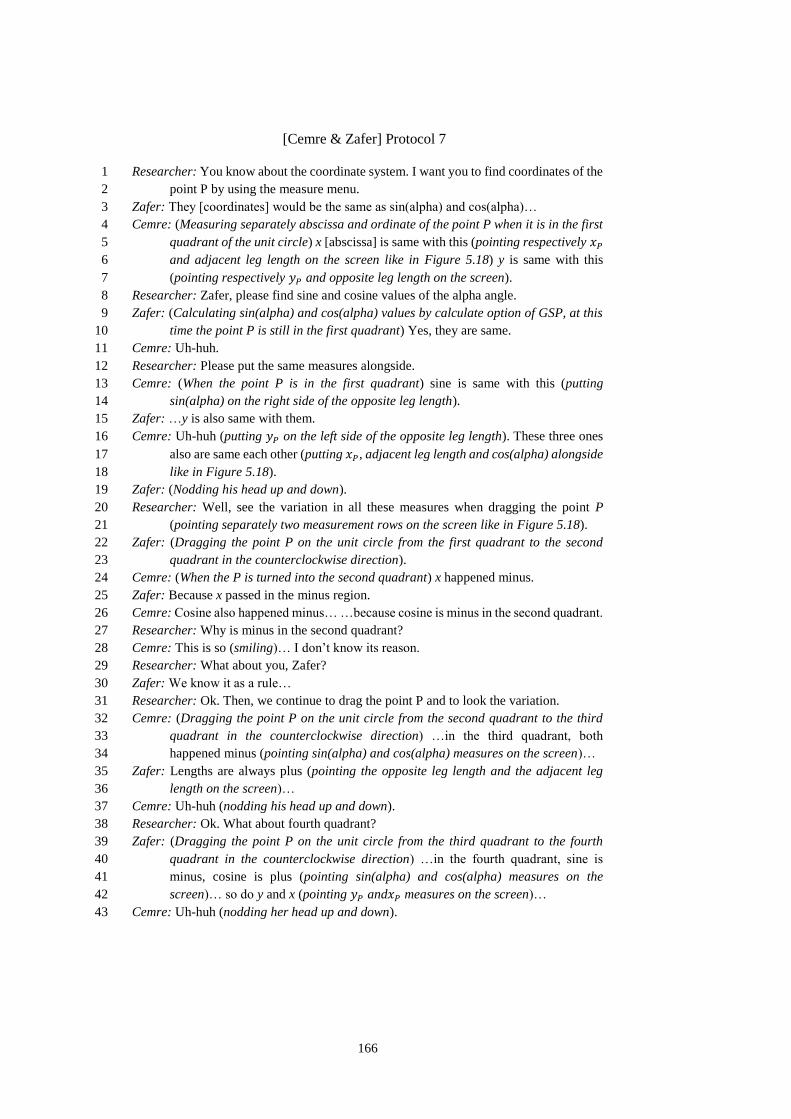
166
[Cemre & Zafer] Protocol 7
Researcher: You know about the coordinate system. I want you to find coordinates of the 1
point P by using the measure menu. 2
Zafer: They [coordinates] would be the same as sin(alpha) and cos(alpha)… 3
Cemre: (Measuring separately abscissa and ordinate of the point P when it is in the first 4
quadrant of the unit circle) x [abscissa] is same with this (pointing respectively 𝑥𝑃 5
and adjacent leg length on the screen like in Figure 5.18) y is same with this 6
(pointing respectively 𝑦𝑃 and opposite leg length on the screen). 7
Researcher: Zafer, please find sine and cosine values of the alpha angle. 8
Zafer: (Calculating sin(alpha) and cos(alpha) values by calculate option of GSP, at this 9
time the point P is still in the first quadrant) Yes, they are same. 10
Cemre: Uh-huh. 11
Researcher: Please put the same measures alongside. 12
Cemre: (When the point P is in the first quadrant) sine is same with this (putting 13
sin(alpha) on the right side of the opposite leg length). 14
Zafer: …y is also same with them. 15
Cemre: Uh-huh (putting 𝑦𝑃 on the left side of the opposite leg length). These three ones 16
also are same each other (putting 𝑥𝑃, adjacent leg length and cos(alpha) alongside 17
like in Figure 5.18). 18
Zafer: (Nodding his head up and down). 19
Researcher: Well, see the variation in all these measures when dragging the point P 20
(pointing separately two measurement rows on the screen like in Figure 5.18). 21
Zafer: (Dragging the point P on the unit circle from the first quadrant to the second 22
quadrant in the counterclockwise direction). 23
Cemre: (When the P is turned into the second quadrant) x happened minus. 24
Zafer: Because x passed in the minus region. 25
Cemre: Cosine also happened minus… …because cosine is minus in the second quadrant. 26
Researcher: Why is minus in the second quadrant? 27
Cemre: This is so (smiling)… I don’t know its reason. 28
Researcher: What about you, Zafer? 29
Zafer: We know it as a rule… 30
Researcher: Ok. Then, we continue to drag the point P and to look the variation. 31
Cemre: (Dragging the point P on the unit circle from the second quadrant to the third 32
quadrant in the counterclockwise direction) …in the third quadrant, both 33
happened minus (pointing sin(alpha) and cos(alpha) measures on the screen)… 34
Zafer: Lengths are always plus (pointing the opposite leg length and the adjacent leg 35
length on the screen)… 36
Cemre: Uh-huh (nodding his head up and down). 37
Researcher: Ok. What about fourth quadrant? 38
Zafer: (Dragging the point P on the unit circle from the third quadrant to the fourth 39
quadrant in the counterclockwise direction) …in the fourth quadrant, sine is 40
minus, cosine is plus (pointing sin(alpha) and cos(alpha) measures on the 41
screen)… so do y and x (pointing 𝑦𝑃 and𝑥𝑃 measures on the screen)… 42
Cemre: Uh-huh (nodding her head up and down). 43
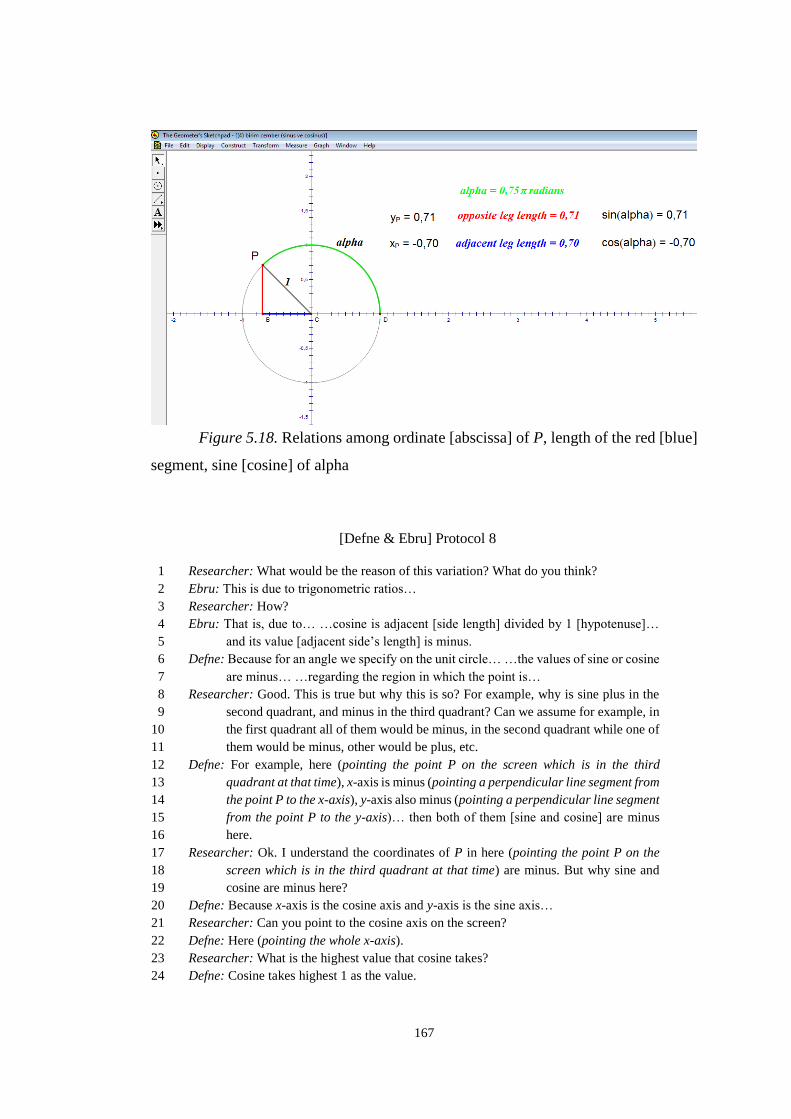
167
Figure 5.18. Relations among ordinate [abscissa] of P, length of the red [blue]
segment, sine [cosine] of alpha
[Defne & Ebru] Protocol 8
Researcher: What would be the reason of this variation? What do you think? 1
Ebru: This is due to trigonometric ratios… 2
Researcher: How? 3
Ebru: That is, due to… …cosine is adjacent [side length] divided by 1 [hypotenuse]… 4
and its value [adjacent side’s length] is minus. 5
Defne: Because for an angle we specify on the unit circle… …the values of sine or cosine 6
are minus… …regarding the region in which the point is… 7
Researcher: Good. This is true but why this is so? For example, why is sine plus in the 8
second quadrant, and minus in the third quadrant? Can we assume for example, in 9
the first quadrant all of them would be minus, in the second quadrant while one of 10
them would be minus, other would be plus, etc. 11
Defne: For example, here (pointing the point P on the screen which is in the third 12
quadrant at that time), x-axis is minus (pointing a perpendicular line segment from 13
the point P to the x-axis), y-axis also minus (pointing a perpendicular line segment 14
from the point P to the y-axis)… then both of them [sine and cosine] are minus 15
here. 16
Researcher: Ok. I understand the coordinates of P in here (pointing the point P on the 17
screen which is in the third quadrant at that time) are minus. But why sine and 18
cosine are minus here? 19
Defne: Because x-axis is the cosine axis and y-axis is the sine axis… 20
Researcher: Can you point to the cosine axis on the screen? 21
Defne: Here (pointing the whole x-axis). 22
Researcher: What is the highest value that cosine takes? 23
Defne: Cosine takes highest 1 as the value. 24
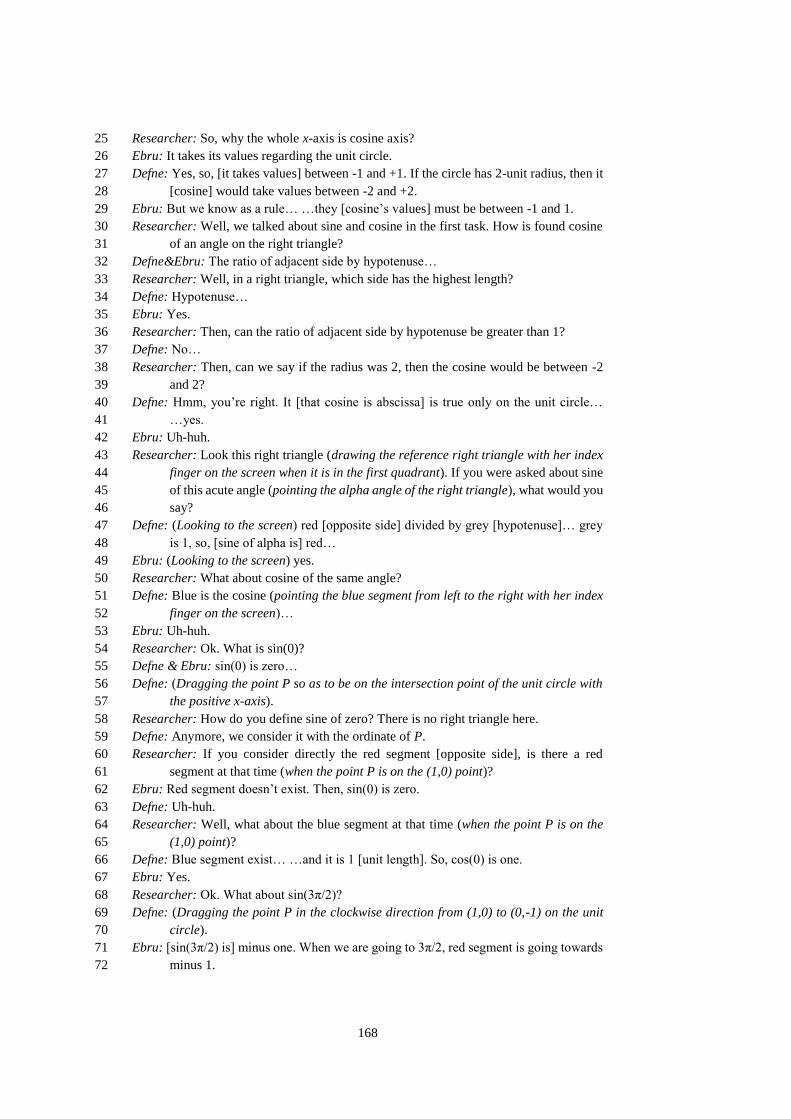
168
Researcher: So, why the whole x-axis is cosine axis? 25
Ebru: It takes its values regarding the unit circle. 26
Defne: Yes, so, [it takes values] between -1 and +1. If the circle has 2-unit radius, then it 27
[cosine] would take values between -2 and +2. 28
Ebru: But we know as a rule… …they [cosine’s values] must be between -1 and 1. 29
Researcher: Well, we talked about sine and cosine in the first task. How is found cosine 30
of an angle on the right triangle? 31
Defne&Ebru: The ratio of adjacent side by hypotenuse… 32
Researcher: Well, in a right triangle, which side has the highest length? 33
Defne: Hypotenuse… 34
Ebru: Yes. 35
Researcher: Then, can the ratio of adjacent side by hypotenuse be greater than 1? 36
Defne: No… 37
Researcher: Then, can we say if the radius was 2, then the cosine would be between -2 38
and 2? 39
Defne: Hmm, you’re right. It [that cosine is abscissa] is true only on the unit circle… 40
…yes. 41
Ebru: Uh-huh. 42
Researcher: Look this right triangle (drawing the reference right triangle with her index 43
finger on the screen when it is in the first quadrant). If you were asked about sine 44
of this acute angle (pointing the alpha angle of the right triangle), what would you 45
say? 46
Defne: (Looking to the screen) red [opposite side] divided by grey [hypotenuse]… grey 47
is 1, so, [sine of alpha is] red… 48
Ebru: (Looking to the screen) yes. 49
Researcher: What about cosine of the same angle? 50
Defne: Blue is the cosine (pointing the blue segment from left to the right with her index 51
finger on the screen)… 52
Ebru: Uh-huh. 53
Researcher: Ok. What is sin(0)? 54
Defne & Ebru: sin(0) is zero… 55
Defne: (Dragging the point P so as to be on the intersection point of the unit circle with 56
the positive x-axis). 57
Researcher: How do you define sine of zero? There is no right triangle here. 58
Defne: Anymore, we consider it with the ordinate of P. 59
Researcher: If you consider directly the red segment [opposite side], is there a red 60
segment at that time (when the point P is on the (1,0) point)? 61
Ebru: Red segment doesn’t exist. Then, sin(0) is zero. 62
Defne: Uh-huh. 63
Researcher: Well, what about the blue segment at that time (when the point P is on the 64
(1,0) point)? 65
Defne: Blue segment exist… …and it is 1 [unit length]. So, cos(0) is one. 66
Ebru: Yes. 67
Researcher: Ok. What about sin(3π/2)? 68
Defne: (Dragging the point P in the clockwise direction from (1,0) to (0,-1) on the unit 69
circle). 70
Ebru: [sin(3π/2) is] minus one. When we are going to 3π/2, red segment is going towards 71
minus 1. 72

169
Researcher: Ok. How do you determine sine value of an angle? 73
Defne: On the [reference] right triangle… …due to its correspondence to the opposite 74
side, we say red segment as sine (dragging her index finger on the red segment up 75
and down)… 76
Ebru: Since on the [reference] right triangle (pointing the reference right triangle on the 77
screen) red one indicates sine, when we bring it somewhere [in any quadrant] on 78
the unit circle… …we see that red segments’ length is plus or minus. 79
[Cemre & Zafer] Protocol 8
Researcher: I will hide sine and cosine values on the screen (hiding sin(alpha) and 1
cos(alpha) values with a serviette so as to appear only the unit circle on the 2
screenshot of the GSP page like in Figure 5.19). Now, I would want you to find 3
these values. 4
Zafer: Ah! That is, it… …zero point so and so would we find (looking to the researcher 5
when raising his eyebrows and smiling)? 6
Cemre: (Laughing) no… 7
Researcher: If I asked you to find a value of sine or cosine like zero point so and so… 8
…This would not be easy, wouldn’t it? 9
Cemre&Zafer: Yes, of course (smiling). 10
Researcher: So, I would not want you to do this. I want you to discuss only the sine value 11
for the alpha angle (pointing the green arc on the screen like in Figure 5.19)… 12
…greater or smaller than one, or equal to one? 13
Cemre&Zafer: Hmm… 14
Zafer: (Turning his view from the screen to the upward) it [sin(alpha)] is smaller than 1… 15
…because it could not be greater than 1. 16
Cemre: Exactly… 17
Researcher: Why? 18
Zafer: Because it is between minus 1 and plus 1. 19
Cemre: Uh-huh (nodding her head up and down). 20
Researcher: Ok. Well, we suppose that you stay in this building (pointing the radius line 21
segment on the positive y-axis on the screen with his index finger through dragging 22
up and down), and I stay in this one (pointing the red line segment on the screen 23
with his index finger through dragging up and down)… You are in a building with 24
this height (putting her thumb and index fingers respectively zero and 1 points on 25
the y-axis)… I am in one with this height (putting her thumb and index fingers end 26
points of the red line segment)… …which of them is higher? 27
Cemre&Zafer: (Immediately) ours… 28
Researcher: Then, how is mine regarding 1 (the point P in the first quadrant at that time)? 29
Cemre&Zafer: Smaller… 30
Researcher: Ok, what about now (dragging the point P in the counterclockwise direction 31
but at that time it is still in the first quadrant)? 32
Cemre&Zafer: Smaller [than 1]… 33
Researcher: Ok, what about now (dragging the point P in the counterclockwise direction 34
but at that time it is still in the first quadrant but too close to the y-axis)? 35
Cemre: Close to [1]… 36
Zafer: But still smaller [than 1]… 37

170
Researcher: Ok, what about now (dragging the point P in the counterclockwise direction 38
but at that time it is in the second quadrant)? 39
Cemre: Small… 40
Zafer: Still smaller [than 1]… 41
Researcher: Ok, what about now (dragging the point P in the counterclockwise direction 42
but at that time it is in the third quadrant)? 43
Cemre: Small (smiling)… 44
Zafer: Anymore, you are in minuses (smiling). 45
Cemre: Yes (smiling). 46
Researcher: Ok. I ask you (dragging the point P in the second quadrant)… What is the 47
height of the building I stay? 48
Cemre&Zafer: (Coming close to the screen) 49
Zafer: Zero point… 50
Cemre: …seven or so… 51
Zafer: Yes. 52
Cemre: If we do like that (pointing the point P and dragging a perpendicular line to the 53
y-axis)… 54
Researcher: Do you want to draw a perpendicular line to the y-axis? 55
Cemre: Yes. 56
Researcher: (Constructing the perpendicular line to the y-axis). 57
Zafer: It [the length of the red segment] is between 0.6 and 0.7… 58
Cemre: It is closer to the 0.6… 59
Researcher: What can be it? 60
Zafer: 0.63… 61
Cemre: (Smiling) I say 0.62… 62
Researcher: (Unveiling the sin(alpha) measure on the screen). 63
Cemre&Zafer: (When seeing that sin(alpha) value measured by GSP is too close to their 64
predictions) Ah (laughing)! 65
Cemre: Oh! I don’t believe! We said sine of zero point 78 [π radian] (smiling)! 66
Researcher: Yes. 67
Zafer: Great! 68
Researcher: Ok. If we want to write this, what do you write? 69
Zafer: (Looking to the screen) sine of… …zero point 78π… 70
Cemre: …is equal to zero point 62… 71
Zafer: Uh-huh. 72
(Similar discussions were done in each quadrant at least three different points, as well as 73
cosine; students made too closed predictions of sine and cosine.) 74
… 75
Researcher: Well, is this relation between the angle and corresponding sine… …a 76
function? 77
Cemre&Zafer: Yes. 78
Researcher: Why? 79
Cemre: Because each angle (dragging her index finger on the green arc in the 80
counterclockwise direction on the screen)… …gives [only] one sine (dragging her 81
index finger on the red segment up-and-down). 82
Zafer: Uh-huh (nodding his head up and down). 83

171
Figure 5.19. Reference right triangle with legs entitled by the related
trigonometric expression
[Cemre & Zafer] Protocol 9
Researcher: You defined sine and cosine as functions of the angle... Is there any sine 1
value for whatever an angle you remember? 2
Cemre: For example sine thirty [sin(30)]… is (turning her view from screen to the 3
upward) 1/2, isn’t it? 4
Zafer: Uh-huh. 5
Researcher: (When the angle measure preference of GSP was in radians, calculating the 6
sin(30)) is 1/2 equal to minus zero point 99 (pointing the calculation output on the 7
screen)… 8
Cemre: Just a minute! Sine thirty… …1/2… Then, this is in radians (pointing the 9
calculation result on the screen with her pencil)… If we say π/6… 10
Zafer: …then, sine happens 1/2. 11
Cemre: Uh-huh. 12
Zafer: Let’s we calculate and look (calculating sin(π/6) by GSP measure menu)! Yes. 13
Cemre: (Writing paper sin(30)=1/2 and sin(π/6)=1/2 alongside) Teacher! But, these are 14
in domain (pointing 30 and π/6 on her writing)… …but things they go [in the 15
range] are same (pointing both 1/2 on her writing), is that so? 16
Researcher: But look! The output of sin(30) is different from 1/2 (pointing the expression 17
𝑠𝑖𝑛(30) = −0.99 on the screen). 18
Cemre: But was not sin(30) 1/2! 19

172
Researcher: What could be the reason of this? 20
Zafer: It [GSP] accepts a different thing as sin(30)… …may consider π… …It [30] is not 21
in degrees we have known…. It is not 30 degrees (looking to the expression 22
𝑠𝑖𝑛(30) = −0.99 on the screen). 23
Researcher: Cemre, your 30 is in degrees (pointing 30 on her writing)? 24
Cemre: Yes, sine thirty degree (adding degree symbol to 30 on her writing)… 25
Researcher: Let’s we look our current angle measure preference in GSP (opening 26
“Preferences” window of GSP under the Edit menu). 27
Cemre&Zafer: … radians (when seeing the current angle measure preference of GSP as 28
radian). 29
Researcher: Let’s we change our angle measure preference as degrees (changing the 30
angle measure unit of GSP from radians to degrees). 31
Cemre: It [output of sin(30)] happened zero point fifty (pointing the expression 32
𝑠𝑖𝑛(30) = 0.50 on the screen which was dynamically changed regarding the 33
angle measure preference)… 34
Researcher: So, you have to identify your preference as angle measure unit… 35
Cemre: You are right… …yes. 36
Zafer: (Nodding his head up and down). 37
Researcher: Ok. Well (changing again the angle measure unit of GSP from degrees to 38
radians), how did sine thirty in radians mean minus zero point 99 (pointing the 39
expression 𝑠𝑖𝑛(30) = −0.99 on the screen). 40
Zafer: (After 4-second pause) if it was 30π… It would correspond to here (pointing the 41
intersection point of the unit circle and the positive x-axis)… so it shouldn’t be 42
30π… 43
Researcher: What else? 44
Cemre&Zafer: (Looking to the screen without speaking) 45
Researcher: Let’s we look how many times of π is 30 (opening calculate menu of GSP)… 46
30 divided by… 47
Zafer: π... (When the output of the calculation was appeared on the screen like in Figure 48
5.20) nine point fifty five… 49
Researcher: That is, 30 is equal to 9.55π, isn’t it (pointing respectively 30, 9.55 and π on 50
the expression 30/π=9.55)? 51
Cemre: Yes. 52
Zafer: Uh-huh (nodding his head up and down). 53
Researcher: Ok. Where is the position of the point P… …for the angle with the measure 54
9.55π radian on the unit circle? Please drag the point P on the true position. 55
Zafer: (Dragging the point P in the counterclockwise direction) 56
Cemre: Eight [π radian]… …1.55 [π radian]… …in the fourth quadrant. 57
Zafer: (Continuing to drag the point P until the measure of the alpha angle would appear 58
as 1.55π radian on the screen line in Figure 5.20) here it is. 59
Researcher: Looking to the unit circle, can you predict the sine value at that point 60
(pointing the point P on the screen)? 61
Cemre: It is much closed to 1… 62
Zafer: …minus one… 63
Cemre: Of course. (After 5-second pause) now, here (pointing 30 in the expression 64
𝑠𝑖𝑛(30) = −0.99 on the screen) 30 is in radians, isn’t it? 65
Researcher: Yes. 66
Cemre: But [sine] of 30 degree is 0.50, isn’t it! 67
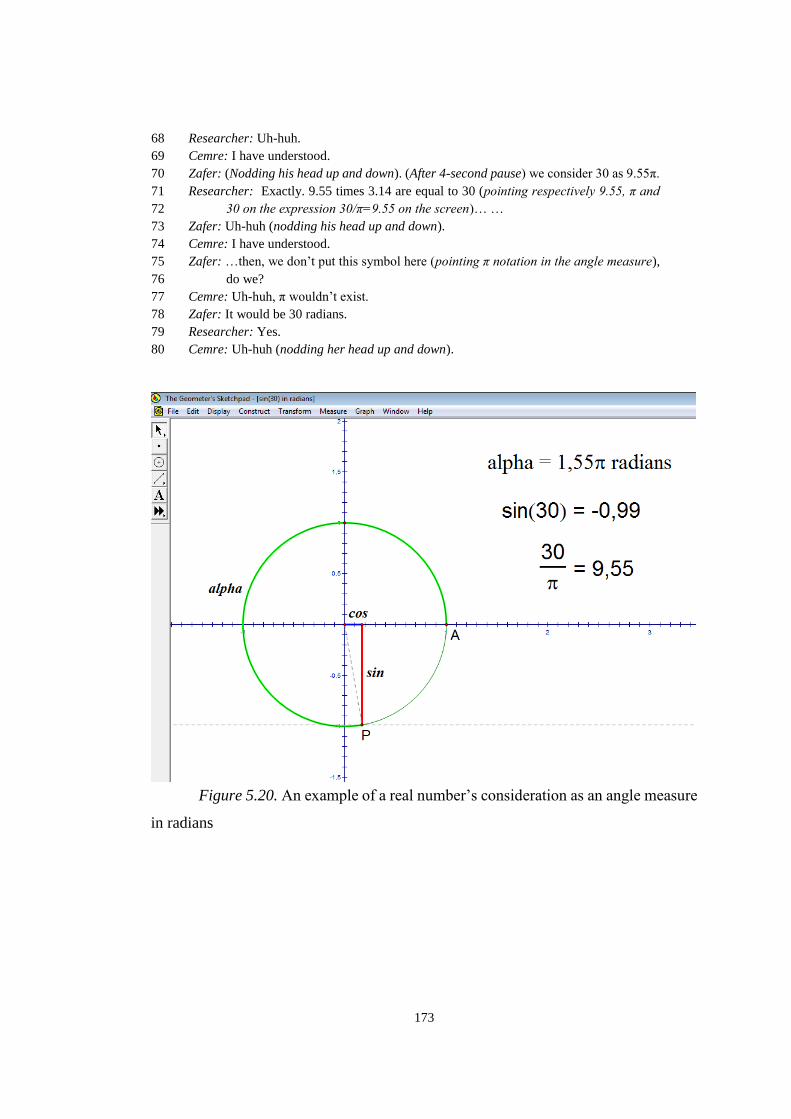
173
Researcher: Uh-huh. 68
Cemre: I have understood. 69
Zafer: (Nodding his head up and down). (After 4-second pause) we consider 30 as 9.55π. 70
Researcher: Exactly. 9.55 times 3.14 are equal to 30 (pointing respectively 9.55, π and 71
30 on the expression 30/π=9.55 on the screen)… … 72
Zafer: Uh-huh (nodding his head up and down). 73
Cemre: I have understood. 74
Zafer: …then, we don’t put this symbol here (pointing π notation in the angle measure), 75
do we? 76
Cemre: Uh-huh, π wouldn’t exist. 77
Zafer: It would be 30 radians. 78
Researcher: Yes. 79
Cemre: Uh-huh (nodding her head up and down). 80
Figure 5.20. An example of a real number’s consideration as an angle measure
in radians

174
[Defne & Ebru] Protocol 9
Researcher: Can you show me… …where is zero π radian-angle? 1
Defne: Here (dragging point P on the positive x-axis). 2
Researcher: Well, what about 2π radian-angle? 3
Ebru: Same where again… 4
Researcher: Then, are zero π radian and 2π radian same? 5
Ebru: Yes. 6
Defne: (Nodding her head up and down). 7
Ebru: Their things are same… that is, their cosine lengths are same… …their sines values 8
also are same… 9
Researcher: I don’t ask you their sine and cosine. I ask only that as an angle measure, 10
two are same. Are zero π radian and 2π radian same? 11
Defne&Ebru: Yes, they are same… 12
Researcher: What about 4π radian? 13
Defne: It is also same. 14
Ebru: Yes. 15
Researcher: Look (Writing 2𝜋 = 0𝜋 on a paper)! Then, if we divide two sides by π, 2 16
must be equal to zero. 17
Defne: Thus, they are not same! 18
Ebru: Then, we would say that… …they are angles corresponding to the same point on 19
the unit circle. 20
Defne: Ah yes! None of them is equal, but they show the same place [on the unit circle]. 21
In second, third rounds… …again they aren’t equal to each other but due to 22
pointing same where [on the unit circle], we assume them as equivalent. 23
Ebru: Uh-huh (nodding her head up and down). 24
[Cemre & Zafer] Protocol 10
Researcher: Because we are working in the unit circle, you know 0.26π radian (pointing 1
the alpha measure on the screen) is this arc’s length (drawing the principal arc in 2
the counterclockwise direction on the screen with her index finger). 3
Cemre: Yes. 4
Zafer: Uh-huh (nodding her head up and down). 5
Researcher: If I ask you to 2.26π radian, what would you say? 6
Zafer: One full-round more (pointing a full round with his index finger on the screen in 7
the counterclockwise direction through starting from the point P)… 8
Cemre: Uh-huh (nodding her head up and down). Their sines are same… 9
Researcher: What about these two angles? 10
Zafer: They are different things. 11
Cemre: (Listening without speaking). 12
Researcher: Why? 13
Zafer: …because their lengths are different. 14
Cemre: Hmm, yes… 15

175
Researcher: That is, 0.26π and 2.26π are different two elements in the domain of sine and 16
cosine, aren’t they? 17
Zafer: Uh-huh (nodding his head up and down). 18
Cemre: …as well as 4.26π, 6 [.26π], 8 [.26π] are like that… 19
Zafer: (Nodding his head up and down) …also 0.26π minus 2π… 20
Cemre: (Nodding her head up and down)…minus 4[π], minus 6[π]… Uh-huh… I 21
understand.22
5.1.3. Development of Students’ Concept Images Rooted in (Unit) Circle
Register and Shaped between Graphical Register and Others
5.1.3.1. Regarding angles
At the end of Task 3, all students were able to associate a static angle structure
in the (unit) circle register with the infinitely many [negative or positive] equivalent
measures in the symbolic register through considering dynamic directed turnings.
Inversely, they were able to associate the infinitely many equivalent measures in the
symbolic register with the same static structure in the (unit) circle register.
Afterwards, at the end of Task 5, they had just started to differentiate angles with the
same static structure but different dynamic structures in the (unit) circle register, as
well as angles with the equivalent but not equal measures in the symbolic register.
However, the researcher determined that students’ this differentiation would need
these angles’ differentiated visual representation. So, in order to support students’
differentiation of the equivalent but not equal angles, in Task 6 [Task 7], the researcher
encouraged students to interpret angles on the sine [cosine] graph in the graphical
register, as well.
Since Task 6 [Task 7] was the first introduction of the sine [cosine] function in
the graphical register, in order to provide for students with the smooth transitions
among the (unit) circle register, symbolic register and graphical register, the
researcher preferred to start with discussions thereby restricting angles into the
principal angles. So, she encouraged them to interpret angles in the graphical register
176
initially as the x-component of the ordered pair (alpha, sin(alpha)) [(alpha,
cos(alpha))] that was constructed as dynamically-linked to the alpha principal angle
in the (unit) circle register, as well as dynamically-linked to the alpha principal
measure in the symbolic register (e.g., lines 1-15 in [Cemre & Zafer] Protocol 11).
Where, it was observed that only Zafer had a trouble in making sense of the x-
component as the angle measure due to his confusion between the angle measure and
its sine value in the graphical register (lines 27-45 in [Cemre & Zafer] Protocol 11)
until the researcher’s recommendation to investigate the variation of the ordered pair
(lines 46-47 in [Cemre & Zafer] Protocol 11). When investigating the variation of the
ordered pair, he determined the x-component as the angle through focusing on (i) the
π-radian angle in the (unit) circle register, (ii) the corresponding abscissa to about 3.14
in the graphical register, and (iii) the meaning of π as the angle measure in radians
with its meaning as a real number (i.e., approximately 3.14) in the symbolic register
(lines 48-55 in [Cemre & Zafer] Protocol 11). This implies that on the contrary to the
initial interview results anymore “coordinate plane” was not a cognitive conflict factor
when the position of π on the x-axis is considered simultaneously within the graphical
register and the (unit) circle register. Moreover, it was observed that all students
reasoned on an arbitrary angle in the same way within each representational register
(e.g., lines 50-76 in [Cemre & Zafer] Protocol 11; lines 11-30 in [Defne & Ebru]
Protocol 11). In other words, they were able to convert a principal angle in one register
into its correspondence in another register (e.g., lines 86-90 in [Cemre & Zafer]
Protocol 11). For example, when asked them to reason about the sine [cosine] value of
a real number smaller than 2π in the symbolic register, students were able to convert
this real number as an angle measure in radians within the symbolic register into the
same real number on the x-axis as the corresponding angle within the graphical
register (e.g., lines 31-41 in [Defne & Ebru] Protocol 11).
But, when asked to reason about the sine value of a real number greater than
2π in the symbolic register, they initially preferred to reason about the corresponding
angle to this real number by its principal measure (e.g., lines 42-48 in [Defne & Ebru]
Protocol 11). And then, when the researcher asked them to reason about the positions
of this real number and its principal measure on the x-axis in the graphical register

177
(e.g., lines 49-50 in [Defne & Ebru] Protocol 11), students’ actions imply that they
were able to differentiate the equivalent but not equal angles’ positions on the x-axis
with the 2π-length intervals in the graphical register based on their ability to convert
the continuously-repeated full-round turnings in the counterclockwise [clockwise]
direction in the (unit) circle register into the continuously-repeated regular intervals
on the x-axis in the positive [negative] direction in the graphical register (e.g., lines
51-83 in [Defne & Ebru] Protocol 11; lines 32-89 in [Cemre & Zafer] Protocol 12). In
addition, they were able to differentiate the equivalent but not equal angles’ measures
in the symbolic register through reasoning either from the graphical register (e.g.,
lines 69-83 and 100-106 in [Defne & Ebru] Protocol 11) or from the (unit) circle
register (e.g., lines 44-76 in [Cemre & Zafer] Protocol 12). It was the point that
students started to reason about the real number set (R) in the symbolic register as the
domain set of the sine [cosine] function via thinking the angle concept in the graphical
register as a continuous and repeated variable on the x-axis. Moreover, they started to
reason about the angles through converting the dynamic directed arcs in the (unit)
circle register into the dynamic directed line segments in the graphical register (e.g.,
lines 86-90 in [Cemre & Zafer] Protocol 11). This reasoning prompted a distinct shift
on their reasoning about x-axis as the domain set of the sine [cosine] function in the
graphical register. That is to say, they began to distinguish the parts of the sine
[cosine] graph regarding the quadrants on the x-axis in the graphical register (e.g.,
lines 11-23 in [Defne & Ebru] Protocol 11).
Besides, they had just started to ascribe the role of the reference angle to the
right cause on the sine [cosine] values in any quadrants. In other words, they had just
started to compare two different principal angles with the same sine [cosine] value
through considering the angles as a continuous and independent variable of the sine
[cosine] function (e.g., lines 84-92 in [Defne & Ebru] Protocol 11). Moreover, they
extended their ability to express an angle in any quadrant in terms of its reference angle
which was observed initially at the end of Task 3 through comparing its sine [cosine]
value with that of the reference angle (e.g., lines 93-106 in [Defne & Ebru] Protocol
11). Henceforward, the subsequent progress of students’ concept images on angles that
emerged as a result of the teaching experiment was presented under the following

178
respective headings in terms of students’ discrimination of angles represented within
any representational register from the respective representational registers’ contents.
5.1.3.2. Regarding trigonometric values
At the end of Task 5, all students were able to associate the directed-opposite
[adjacent] side of the reference right triangle with the sine [cosine] value of the
corresponding angle not only inside of the quadrants but also in the limit cases within
the (unit) circle register. Moreover, they were able to convert the opposite [adjacent]
side of the reference right triangle in any quadrant within the (unit) circle register into
the sine [cosine] value of the corresponding angle within the symbolic register thereby
associating the direction of the opposite [adjacent] side with the sign of the value of
sine [cosine]. Furthermore, they were able to associate the y-component [x-
component] of the point on the unit circle with the sine [cosine] value of the
corresponding angle within the (unit) circle register. However, throughout the initial
interviews, since the “coordinate plane” was observed as a cognitive conflict factor
when the graphical register and the (unit) circle register were considered
simultaneously, the researcher predicted that students would encounter troubles on
conversions of the sine and cosine functions between the (unit) circle register and the
graphical register. So, she determined to discuss these two functions in separate tasks
in order to support students’ differentiation of the contents of the coordinate planes in
the (unit) circle register and the graphical register.
On the one hand, in Task 6, she encouraged students to interpret the sine value
in the graphical register as the y-component of the ordered pair (alpha, sin(alpha))
that was constructed as dynamically-linked to the directed-opposite side of the
reference right triangle in the (unit) circle register, as well as dynamically-linked to
the sine value of the alpha angle in the symbolic register. Where, it was observed that
since the sine value was represented with the ordinate in both of the (unit) circle
register and the graphical register, none of the students had troubles about converting
the sine value between the registers (e.g., lines 77-85 in [Cemre & Zafer] Protocol 11;
179
lines 31-48 in [Defne & Ebru] Protocol 11). Students’ actions and language imply that
they were able to quickly and accurately interpret the variation of the sine values in
both registers based on the variations in the visually-same-direction of the y-
components of the point P in the (unit) circle register and the point P' in the graphical
register (Figure 5.22) (e.g., lines 27-33 in [Cemre & Zafer] Protocol 11; lines 11-23
in [Defne & Ebru] Protocol 11).
On the other hand, in Task 7, when asked students to interpret the cosine value
in the graphical register as the y-component of the ordered pair (alpha, cos(alpha))
which was constructed as dynamically-linked to cosine in the (unit) circle register,
students were able to again accurately interpret the variation of the cosine values but
initially through focusing only on the variation in one register. That is, they interpreted
the variation of the cosine values either based only on the variation of the x-component
of the point P in the (unit) circle register or based only on the variation of the y-
component of the point P' in the graphical register (Figure 5.23). Moreover, each
student felt the need at least once to be confirmed about his/her understanding about
the conversion of the cosine value as from the x-component of the point P in the (unit)
circle register as to the y-component of the point P' in the graphical register through
expressing, for example, that “…in here (pointing the point P on the screen like in
Figure 5.23) x is cosine… …and in here (pointing the point P') y is cosine, isn’t it?”.
At that point, the researcher constructed two line segments with the blue color
corresponding to the x-component of the point P and the y-component of the point P'
like in Figure 5.23 in order to ease for students to associate the variation of the cosine
values between the (unit) circle register and the graphical register. At that point,
students started to compare the variations of these two constructions within the (unit)
circle register and the graphical register, and to reason about their variations in the
same way in terms of their signed-magnitudes and their variations in the different way
in terms of their directions. From this point forward, they were able to differentiate
exactly the contents of the coordinate planes in the (unit) circle register and the
graphical register under the consideration of the sine and cosine functions. Moreover,
they were able to reason about the content of the coordinate plane in the graphical
register through considering the x-axis as the domain set of the sine [cosine] function

180
(e.g., lines 16-20 in [Cemre & Zafer] Protocol 12) and the range set of the sine [cosine]
function as a part of the y-axis which was formed dependently by the x-values under
the sine [cosine] function (e.g., lines 77-85 in [Cemre & Zafer] Protocol 11; lines 31-
48 in [Defne & Ebru] Protocol 11).
After students’ differentiation of the contents of the coordinate planes in the
(unit) circle register and the graphical register, throughout Task 6 [Task 7], the
researcher encouraged them to reason in detail about the behavior of the sine [cosine]
function through provoking them to convert their reasoning in a representational
register into another one. Firstly, she encouraged them to interpret the shape of the sine
[cosine] graph as the static representation of the dynamic variation of the sine [cosine]
values regarding the angles (e.g., lines 12-13 in [Defne & Ebru] Protocol 10). Although
one student in each group, Defne and Zafer, intuitively attributed the shape of the sine
[cosine] graph to the cause of the circle shape of the unit circle, none of the students
was able to articulate the cause clearly (e.g., lines 14-18 in [Defne & Ebru] Protocol
10). So, the researcher encouraged them to compare the rates of change of the sine
[cosine] values in three consecutive equal partitions of the first quarter arc on the unit
circle (e.g., lines 19-50 in [Defne & Ebru] Protocol 10) through constructing these
equal arcs and corresponding change on sine [cosine] values visually by GSP (e.g.,
Figure 5.25). Where, it was observed that based on these visual parts’ magnitudes, all
students interpreted that the same amounts of change in angles would not cause the
same amounts of change in the sine [cosine] values (e.g., lines 51-77 in [Defne & Ebru]
Protocol 10).
After then, the researcher provoked them to reason about the change of the sine
[cosine] values regarding the change of the angle in each quadrant without these visual
constructions referring to the rate of change (e.g., lines 1,6 and 8 in [Defne & Ebru]
Protocol 11) when studying on the GSP page like in Figure 5.24. Where, it was
observed that all students were able to interpret the change of the sine [cosine] values
regarding the angle change in each quadrant easily and truly (e.g., lines 1-11 in [Defne
& Ebru] Protocol 11) not only through focusing on the (unit) circle register but also
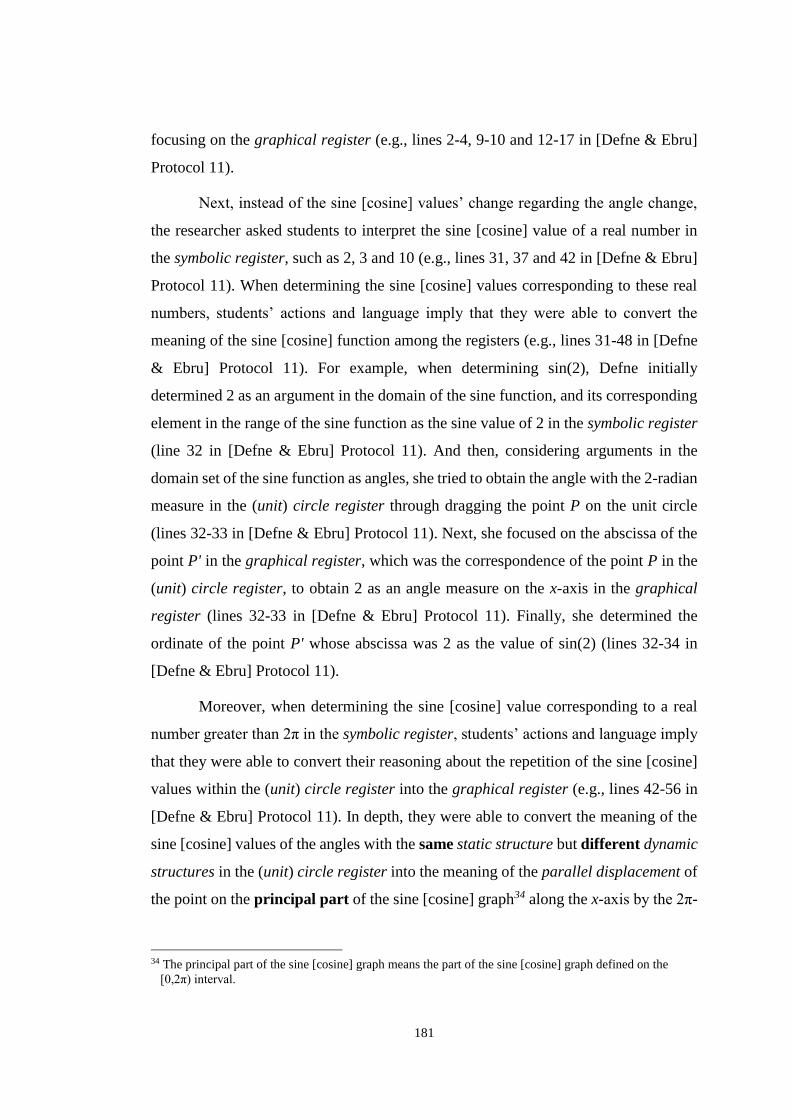
181
focusing on the graphical register (e.g., lines 2-4, 9-10 and 12-17 in [Defne & Ebru]
Protocol 11).
Next, instead of the sine [cosine] values’ change regarding the angle change,
the researcher asked students to interpret the sine [cosine] value of a real number in
the symbolic register, such as 2, 3 and 10 (e.g., lines 31, 37 and 42 in [Defne & Ebru]
Protocol 11). When determining the sine [cosine] values corresponding to these real
numbers, students’ actions and language imply that they were able to convert the
meaning of the sine [cosine] function among the registers (e.g., lines 31-48 in [Defne
& Ebru] Protocol 11). For example, when determining sin(2), Defne initially
determined 2 as an argument in the domain of the sine function, and its corresponding
element in the range of the sine function as the sine value of 2 in the symbolic register
(line 32 in [Defne & Ebru] Protocol 11). And then, considering arguments in the
domain set of the sine function as angles, she tried to obtain the angle with the 2-radian
measure in the (unit) circle register through dragging the point P on the unit circle
(lines 32-33 in [Defne & Ebru] Protocol 11). Next, she focused on the abscissa of the
point P' in the graphical register, which was the correspondence of the point P in the
(unit) circle register, to obtain 2 as an angle measure on the x-axis in the graphical
register (lines 32-33 in [Defne & Ebru] Protocol 11). Finally, she determined the
ordinate of the point P' whose abscissa was 2 as the value of sin(2) (lines 32-34 in
[Defne & Ebru] Protocol 11).
Moreover, when determining the sine [cosine] value corresponding to a real
number greater than 2π in the symbolic register, students’ actions and language imply
that they were able to convert their reasoning about the repetition of the sine [cosine]
values within the (unit) circle register into the graphical register (e.g., lines 42-56 in
[Defne & Ebru] Protocol 11). In depth, they were able to convert the meaning of the
sine [cosine] values of the angles with the same static structure but different dynamic
structures in the (unit) circle register into the meaning of the parallel displacement of
the point on the principal part of the sine [cosine] graph34 along the x-axis by the 2π-
34 The principal part of the sine [cosine] graph means the part of the sine [cosine] graph defined on the
[0,2π) interval.
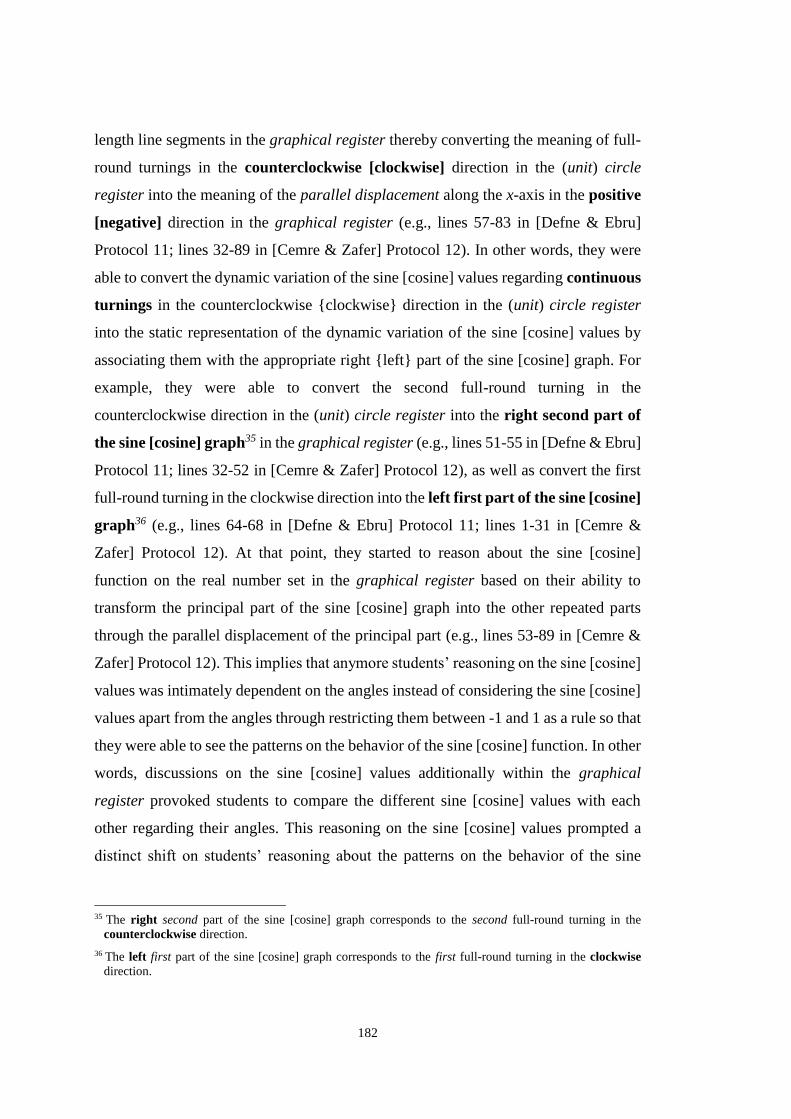
182
length line segments in the graphical register thereby converting the meaning of full-
round turnings in the counterclockwise [clockwise] direction in the (unit) circle
register into the meaning of the parallel displacement along the x-axis in the positive
[negative] direction in the graphical register (e.g., lines 57-83 in [Defne & Ebru]
Protocol 11; lines 32-89 in [Cemre & Zafer] Protocol 12). In other words, they were
able to convert the dynamic variation of the sine [cosine] values regarding continuous
turnings in the counterclockwise {clockwise} direction in the (unit) circle register
into the static representation of the dynamic variation of the sine [cosine] values by
associating them with the appropriate right {left} part of the sine [cosine] graph. For
example, they were able to convert the second full-round turning in the
counterclockwise direction in the (unit) circle register into the right second part of
the sine [cosine] graph35 in the graphical register (e.g., lines 51-55 in [Defne & Ebru]
Protocol 11; lines 32-52 in [Cemre & Zafer] Protocol 12), as well as convert the first
full-round turning in the clockwise direction into the left first part of the sine [cosine]
graph36 (e.g., lines 64-68 in [Defne & Ebru] Protocol 11; lines 1-31 in [Cemre &
Zafer] Protocol 12). At that point, they started to reason about the sine [cosine]
function on the real number set in the graphical register based on their ability to
transform the principal part of the sine [cosine] graph into the other repeated parts
through the parallel displacement of the principal part (e.g., lines 53-89 in [Cemre &
Zafer] Protocol 12). This implies that anymore students’ reasoning on the sine [cosine]
values was intimately dependent on the angles instead of considering the sine [cosine]
values apart from the angles through restricting them between -1 and 1 as a rule so that
they were able to see the patterns on the behavior of the sine [cosine] function. In other
words, discussions on the sine [cosine] values additionally within the graphical
register provoked students to compare the different sine [cosine] values with each
other regarding their angles. This reasoning on the sine [cosine] values prompted a
distinct shift on students’ reasoning about the patterns on the behavior of the sine
35 The right second part of the sine [cosine] graph corresponds to the second full-round turning in the
counterclockwise direction.
36 The left first part of the sine [cosine] graph corresponds to the first full-round turning in the clockwise
direction.

183
[cosine] function. For example, they had just started to reason about the role of the
reference angle on the sine [cosine] values regarding the quadrants. In other words,
students had just started to reason about the same sine [cosine] value in the range set
with two different principal angles of the domain set (e.g., lines 84-106 in [Defne &
Ebru] Protocol 11). Up to that time, sine and cosine were considered with their basic
forms. Henceforward, when they were considered with their general forms, or when
the representational contents (such as radius of the circle, position of the center,
positions of the reference points on the circle referring to trigonometric value) were
systematically varied, the subsequent progress of students’ concept images that
emerged as a result of the teaching experiment was presented in terms of students’
discrimination of trigonometric functions represented within any register from the
respective representational content under the heading: Development of Students’
Concept Images Rooted in (Unit) Circle Register and Shaped between Graphical
Register and Others.
5.1.3.3. Regarding periodicity as pattern based on behaviors of
trigonometric functions
According to the initial interview results, the researcher determined that
students’ concept images on the period concept included crucial troubles within the
different representational registers as a consequence of their problematic concept
definition images on the periodicity. For example, none of the students was able to
appropriately associate the meaning of the repetition in the graphical register with the
meaning of the period in the symbolic register (see On periodicity sub-heading for
detailed information in Chapter 4). Therefore, in Task 6 [Task 7], before mentioning
the period concept, the researcher determined to scrutinize students’ abilities to convert
their reasoning in Task 5 about the repetition of the sine [cosine] values regarding the
equivalent but not equal angles in the (unit) circle register into the other
representational registers.

184
When discussing the variation of the sine [cosine] values regarding the
variation of the angles under their dynamic-simultaneous manipulations in the (unit)
circle register, the graphical register and the symbolic register, it was observed that
students were able to reason about the repetition of the sine [cosine] values within the
(unit) circle register as a consequence of full-round turnings (e.g., lines 32-52 in
[Cemre & Zafer] Protocol 12). Moreover, they were able to convert the meaning of the
repetition within the (unit) circle register into the graphical register (e.g., lines 32-52
in [Cemre & Zafer] Protocol 12), as well as within the symbolic register via the (unit)
circle register into the graphical register (e.g., lines 42-56 in [Defne & Ebru] Protocol
11) as a pattern on the behavior of the sine [cosine] function. Where, students’
language and actions imply that their preferences to express the critical points of the
repetition of the sine [cosine] values were based on the angles, i.e., the domain set of
the sine [cosine] function (e.g., lines 34-43 in [Cemre & Zafer] Protocol 12; lines 51-
56 in [Defne & Ebru] Protocol 11). This preference prompted a distinct shift on
students’ reasoning about the repetition on the sine [cosine] function in the graphical
register. That is to say, they began to transform the principal part of the sine [cosine]
graph (Footnote 34) into the other repeated parts through the parallel displacement of
the principal part along the x-axis by the 2π-length line segments in the graphical
register (e.g., lines 57-83 in [Defne & Ebru] Protocol 11; lines 32-89 in [Cemre &
Zafer] Protocol 12). It was the point that all students started to reason about the
repetition of sine [cosine] function’s basic form clearly in each representational
registers.
At this point, the researcher asked students to reason about the meaning of the
period concept under the consideration of the sine [cosine] function (e.g., lines 1-24 in
[Defne & Ebru] Protocol 12). Where, it was observed that none of the students was
able to make clear what the period means (e.g., lines 24-37 in [Defne & Ebru] Protocol
12). At that point, after emphasizing the repetition of the sine values on the regular
intervals with different magnitudes (e.g., lines 12-21 and 38-46 in [Defne & Ebru]
Protocol 12), the researcher defined the period concept not going into detail as the
regular intervals of the domain set in which a function repeats its values in the
graphical register and as the lengths of these regular intervals in the symbolic register
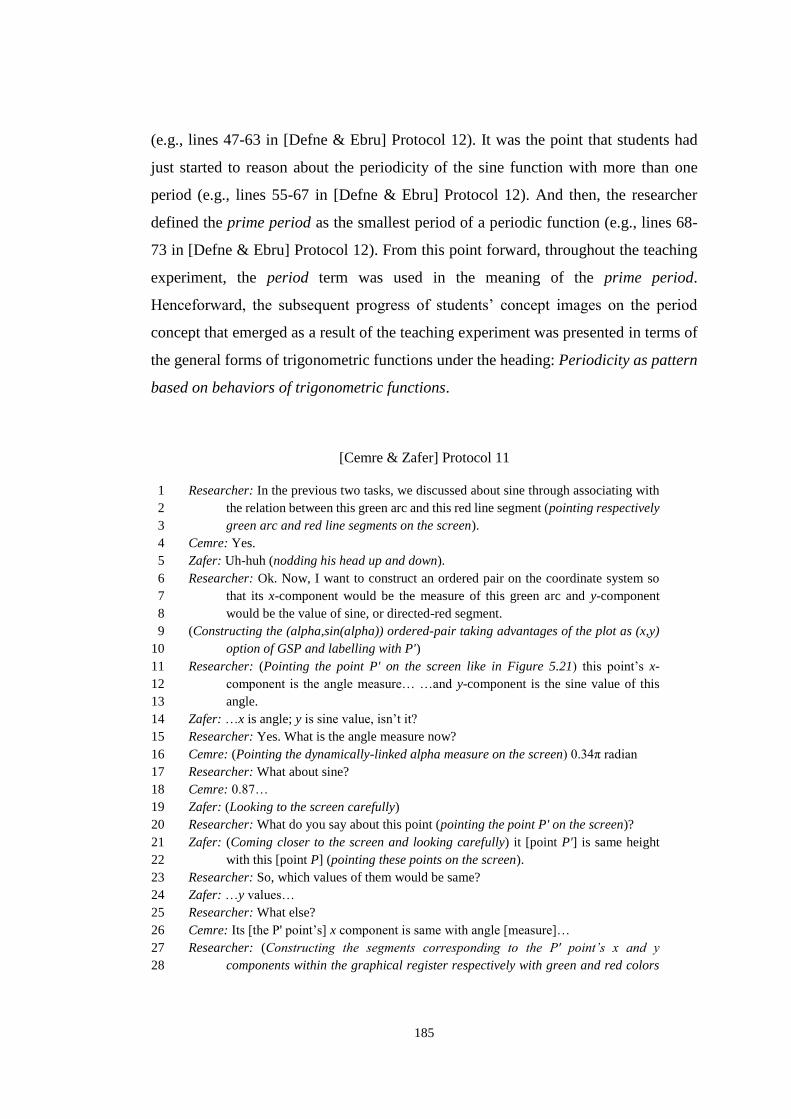
185
(e.g., lines 47-63 in [Defne & Ebru] Protocol 12). It was the point that students had
just started to reason about the periodicity of the sine function with more than one
period (e.g., lines 55-67 in [Defne & Ebru] Protocol 12). And then, the researcher
defined the prime period as the smallest period of a periodic function (e.g., lines 68-
73 in [Defne & Ebru] Protocol 12). From this point forward, throughout the teaching
experiment, the period term was used in the meaning of the prime period.
Henceforward, the subsequent progress of students’ concept images on the period
concept that emerged as a result of the teaching experiment was presented in terms of
the general forms of trigonometric functions under the heading: Periodicity as pattern
based on behaviors of trigonometric functions.
[Cemre & Zafer] Protocol 11
Researcher: In the previous two tasks, we discussed about sine through associating with 1
the relation between this green arc and this red line segment (pointing respectively 2
green arc and red line segments on the screen). 3
Cemre: Yes. 4
Zafer: Uh-huh (nodding his head up and down). 5
Researcher: Ok. Now, I want to construct an ordered pair on the coordinate system so 6
that its x-component would be the measure of this green arc and y-component 7
would be the value of sine, or directed-red segment. 8
(Constructing the (alpha,sin(alpha)) ordered-pair taking advantages of the plot as (x,y) 9
option of GSP and labelling with P') 10
Researcher: (Pointing the point P' on the screen like in Figure 5.21) this point’s x-11
component is the angle measure… …and y-component is the sine value of this 12
angle. 13
Zafer: …x is angle; y is sine value, isn’t it? 14
Researcher: Yes. What is the angle measure now? 15
Cemre: (Pointing the dynamically-linked alpha measure on the screen) 0.34π radian 16
Researcher: What about sine? 17
Cemre: 0.87… 18
Zafer: (Looking to the screen carefully) 19
Researcher: What do you say about this point (pointing the point P' on the screen)? 20
Zafer: (Coming closer to the screen and looking carefully) it [point P'] is same height 21
with this [point P] (pointing these points on the screen). 22
Researcher: So, which values of them would be same? 23
Zafer: …y values… 24
Researcher: What else? 25
Cemre: Its [the P' point’s] x component is same with angle [measure]… 26
Researcher: (Constructing the segments corresponding to the P' point’s x and y 27
components within the graphical register respectively with green and red colors 28
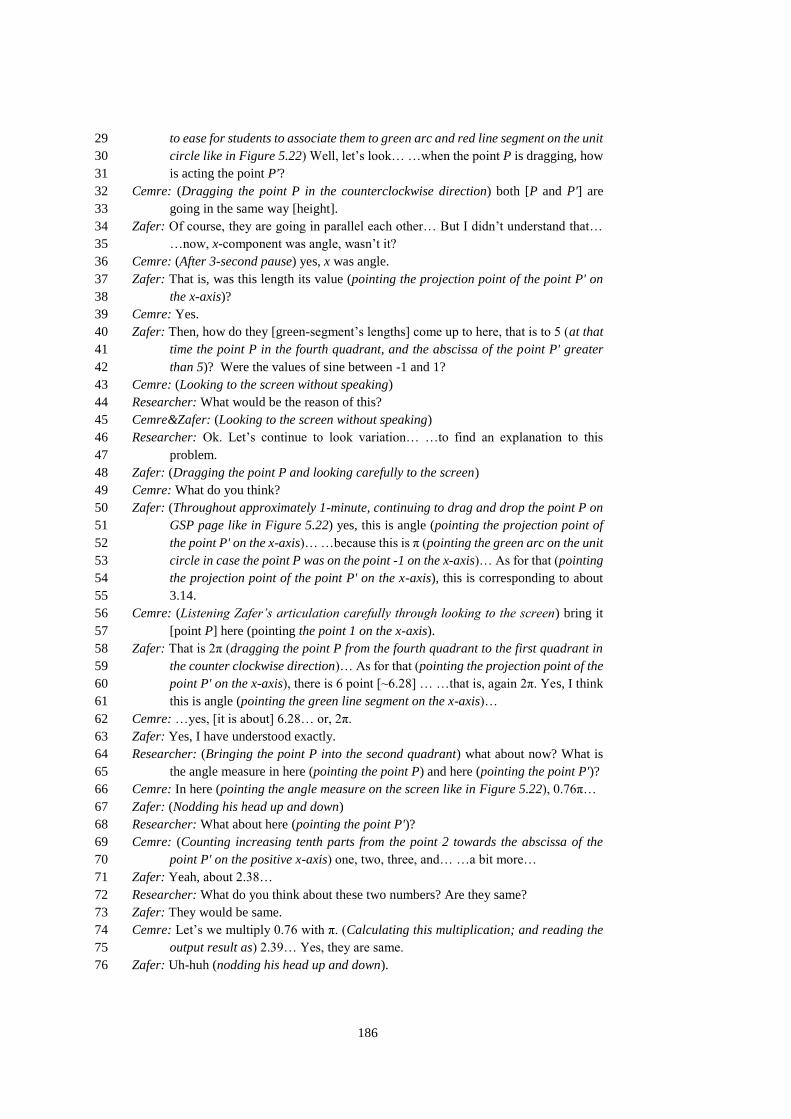
186
to ease for students to associate them to green arc and red line segment on the unit 29
circle like in Figure 5.22) Well, let’s look… …when the point P is dragging, how 30
is acting the point P'? 31
Cemre: (Dragging the point P in the counterclockwise direction) both [P and P'] are 32
going in the same way [height]. 33
Zafer: Of course, they are going in parallel each other… But I didn’t understand that… 34
…now, x-component was angle, wasn’t it? 35
Cemre: (After 3-second pause) yes, x was angle. 36
Zafer: That is, was this length its value (pointing the projection point of the point P' on 37
the x-axis)? 38
Cemre: Yes. 39
Zafer: Then, how do they [green-segment’s lengths] come up to here, that is to 5 (at that 40
time the point P in the fourth quadrant, and the abscissa of the point P' greater 41
than 5)? Were the values of sine between -1 and 1? 42
Cemre: (Looking to the screen without speaking) 43
Researcher: What would be the reason of this? 44
Cemre&Zafer: (Looking to the screen without speaking) 45
Researcher: Ok. Let’s continue to look variation… …to find an explanation to this 46
problem. 47
Zafer: (Dragging the point P and looking carefully to the screen) 48
Cemre: What do you think? 49
Zafer: (Throughout approximately 1-minute, continuing to drag and drop the point P on 50
GSP page like in Figure 5.22) yes, this is angle (pointing the projection point of 51
the point P' on the x-axis)… …because this is π (pointing the green arc on the unit 52
circle in case the point P was on the point -1 on the x-axis)… As for that (pointing 53
the projection point of the point P' on the x-axis), this is corresponding to about 54
3.14. 55
Cemre: (Listening Zafer’s articulation carefully through looking to the screen) bring it 56
[point P] here (pointing the point 1 on the x-axis). 57
Zafer: That is 2π (dragging the point P from the fourth quadrant to the first quadrant in 58
the counter clockwise direction)… As for that (pointing the projection point of the 59
point P' on the x-axis), there is 6 point [~6.28] … …that is, again 2π. Yes, I think 60
this is angle (pointing the green line segment on the x-axis)… 61
Cemre: …yes, [it is about] 6.28… or, 2π. 62
Zafer: Yes, I have understood exactly. 63
Researcher: (Bringing the point P into the second quadrant) what about now? What is 64
the angle measure in here (pointing the point P) and here (pointing the point P')? 65
Cemre: In here (pointing the angle measure on the screen like in Figure 5.22), 0.76π… 66
Zafer: (Nodding his head up and down) 67
Researcher: What about here (pointing the point P')? 68
Cemre: (Counting increasing tenth parts from the point 2 towards the abscissa of the 69
point P' on the positive x-axis) one, two, three, and… …a bit more… 70
Zafer: Yeah, about 2.38… 71
Researcher: What do you think about these two numbers? Are they same? 72
Zafer: They would be same. 73
Cemre: Let’s we multiply 0.76 with π. (Calculating this multiplication; and reading the 74
output result as) 2.39… Yes, they are same. 75
Zafer: Uh-huh (nodding his head up and down). 76
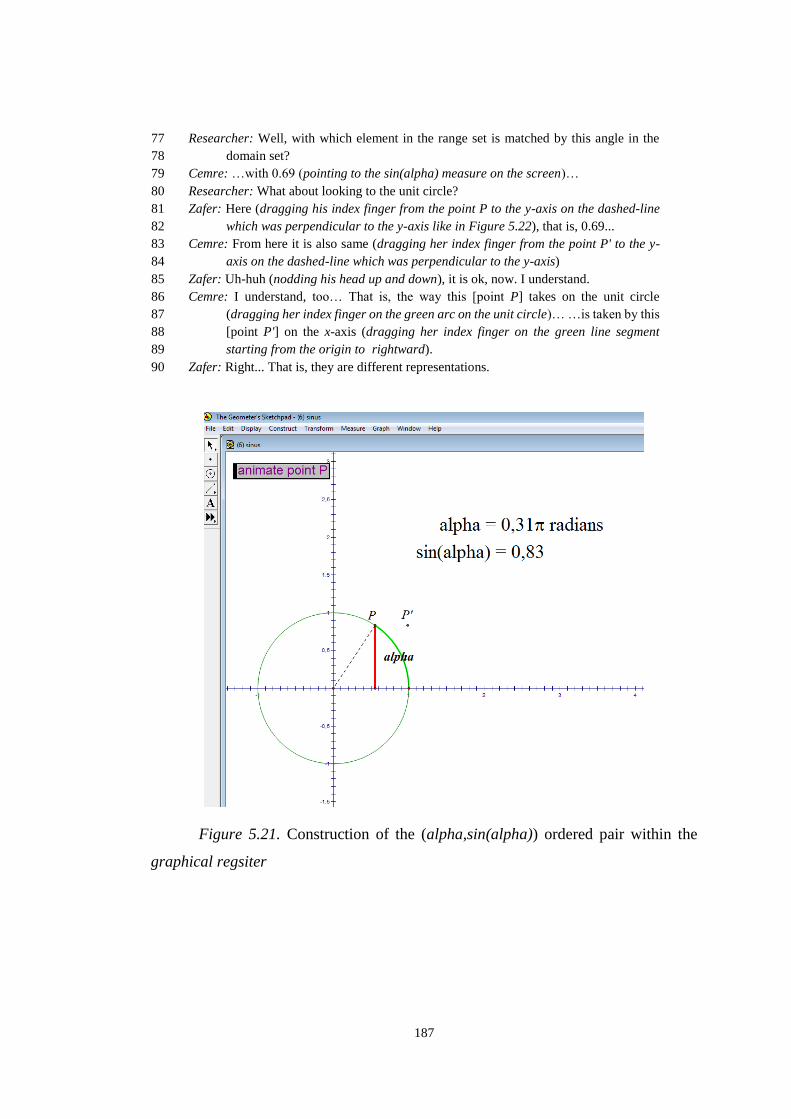
187
Researcher: Well, with which element in the range set is matched by this angle in the 77
domain set? 78
Cemre: …with 0.69 (pointing to the sin(alpha) measure on the screen)… 79
Researcher: What about looking to the unit circle? 80
Zafer: Here (dragging his index finger from the point P to the y-axis on the dashed-line 81
which was perpendicular to the y-axis like in Figure 5.22), that is, 0.69... 82
Cemre: From here it is also same (dragging her index finger from the point P' to the y-83
axis on the dashed-line which was perpendicular to the y-axis) 84
Zafer: Uh-huh (nodding his head up and down), it is ok, now. I understand. 85
Cemre: I understand, too… That is, the way this [point P] takes on the unit circle 86
(dragging her index finger on the green arc on the unit circle)… …is taken by this 87
[point P'] on the x-axis (dragging her index finger on the green line segment 88
starting from the origin to rightward). 89
Zafer: Right... That is, they are different representations. 90
Figure 5.21. Construction of the (alpha,sin(alpha)) ordered pair within the
graphical regsiter
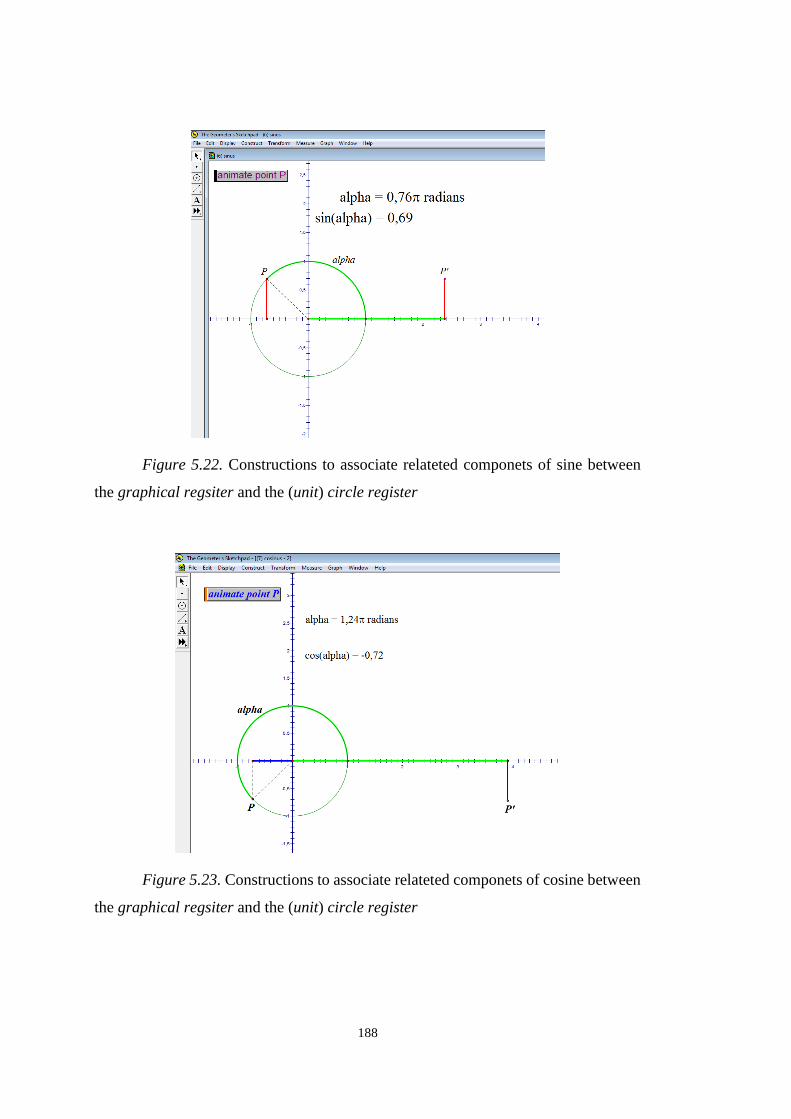
188
Figure 5.22. Constructions to associate relateted componets of sine between
the graphical regsiter and the (unit) circle register
Figure 5.23. Constructions to associate relateted componets of cosine between
the graphical regsiter and the (unit) circle register
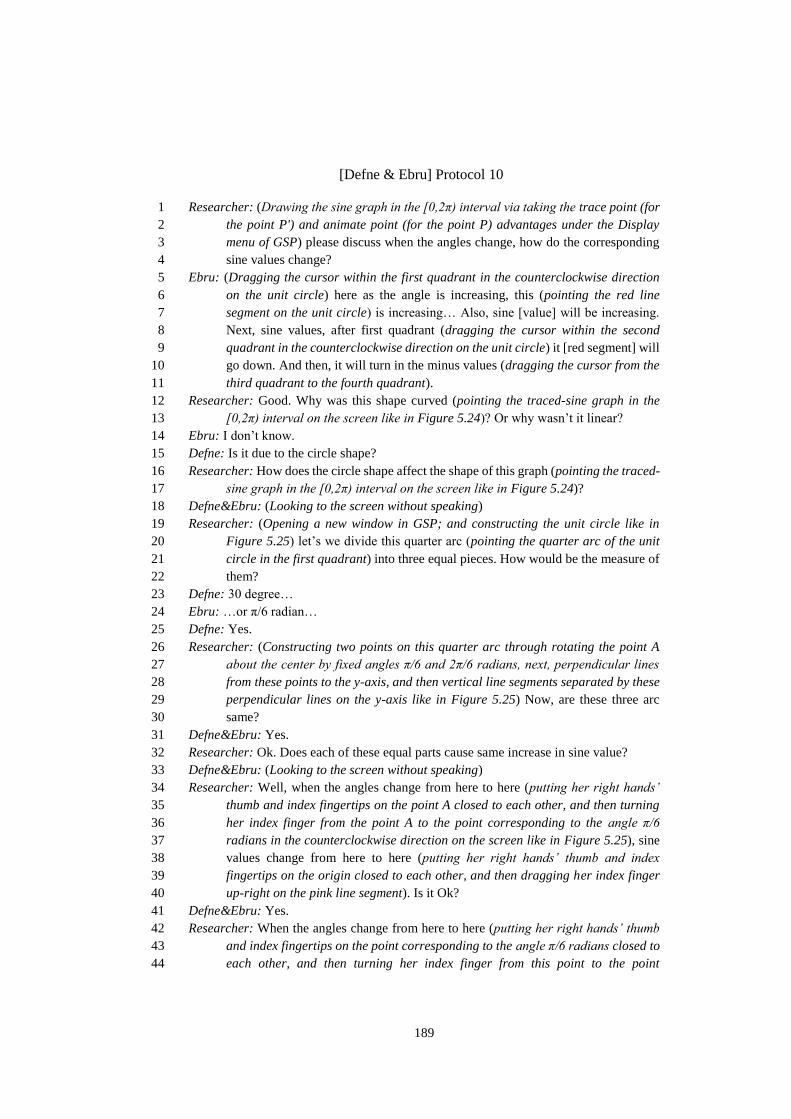
189
[Defne & Ebru] Protocol 10
Researcher: (Drawing the sine graph in the [0,2π) interval via taking the trace point (for 1
the point P') and animate point (for the point P) advantages under the Display 2
menu of GSP) please discuss when the angles change, how do the corresponding 3
sine values change? 4
Ebru: (Dragging the cursor within the first quadrant in the counterclockwise direction 5
on the unit circle) here as the angle is increasing, this (pointing the red line 6
segment on the unit circle) is increasing… Also, sine [value] will be increasing. 7
Next, sine values, after first quadrant (dragging the cursor within the second 8
quadrant in the counterclockwise direction on the unit circle) it [red segment] will 9
go down. And then, it will turn in the minus values (dragging the cursor from the 10
third quadrant to the fourth quadrant). 11
Researcher: Good. Why was this shape curved (pointing the traced-sine graph in the 12
[0,2π) interval on the screen like in Figure 5.24)? Or why wasn’t it linear? 13
Ebru: I don’t know. 14
Defne: Is it due to the circle shape? 15
Researcher: How does the circle shape affect the shape of this graph (pointing the traced-16
sine graph in the [0,2π) interval on the screen like in Figure 5.24)? 17
Defne&Ebru: (Looking to the screen without speaking) 18
Researcher: (Opening a new window in GSP; and constructing the unit circle like in 19
Figure 5.25) let’s we divide this quarter arc (pointing the quarter arc of the unit 20
circle in the first quadrant) into three equal pieces. How would be the measure of 21
them? 22
Defne: 30 degree… 23
Ebru: …or π/6 radian… 24
Defne: Yes. 25
Researcher: (Constructing two points on this quarter arc through rotating the point A 26
about the center by fixed angles π/6 and 2π/6 radians, next, perpendicular lines 27
from these points to the y-axis, and then vertical line segments separated by these 28
perpendicular lines on the y-axis like in Figure 5.25) Now, are these three arc 29
same? 30
Defne&Ebru: Yes. 31
Researcher: Ok. Does each of these equal parts cause same increase in sine value? 32
Defne&Ebru: (Looking to the screen without speaking) 33
Researcher: Well, when the angles change from here to here (putting her right hands’ 34
thumb and index fingertips on the point A closed to each other, and then turning 35
her index finger from the point A to the point corresponding to the angle π/6 36
radians in the counterclockwise direction on the screen like in Figure 5.25), sine 37
values change from here to here (putting her right hands’ thumb and index 38
fingertips on the origin closed to each other, and then dragging her index finger 39
up-right on the pink line segment). Is it Ok? 40
Defne&Ebru: Yes. 41
Researcher: When the angles change from here to here (putting her right hands’ thumb 42
and index fingertips on the point corresponding to the angle π/6 radians closed to 43
each other, and then turning her index finger from this point to the point 44

190
corresponding to the angle 2π/6 radians in the counterclockwise direction), sine 45
values change from here to here (putting her right hands’ thumb and index 46
fingertips on the down edge point of the red line segment on the y-axis, and then 47
dragging her index finger up-right on the red line segment). Which of two π/6-48
radian arcs (pointing first two arcs on the screen) causes greater increase in sine? 49
Defne: First one… 50
Ebru: This (pointing the pink line segment on the y-axis)… (After 3-second pause) then, 51
this would be the least [increase in sine] (pointing the green line segment on the 52
y-axis in Figure 5.25)… 53
Defne: Uh-huh (nodding her head up and down). 54
Researcher: Then, changes in sine values regarding angles are not proportional… I mean 55
that… …the same amount of changes in angles don’t cause the same change in 56
sine values… 57
Defne: Uh-huh (nodding their heads up and down). 58
Ebru: Yes. 59
Researcher: So, shape of the graph isn’t linear due to… 60
Defne: …circle shape (smiling)… 61
Ebru: (Nodding her head up and down) 62
Researcher: Look! As angles are increasing in the first quadrant, sine values are 63
increasing (putting her right hand’s thumb and index fingertips on the point A; 64
and then dragging her index finger on the circle within the first quadrant in the 65
counterclockwise direction and her thumb finger on the x-axis as if her index 66
fingers’ projection point on the x-axis on the screen like in Figure 5.25) but the 67
increased amounts are decreasing (pointing respectively pink, red and green line 68
segments on the y-axis). 69
Defne&Ebru: Yes. 70
Researcher: That is, in the first quadrant sine is increasing, but decreasing the increased 71
amount. 72
Defne&Ebru: Yes. 73
(In the similar way, the researcher explained the variation of sine regarding angles in the 74
second quadrant. After then, she asked students to interpret the variation on sine 75
regarding angles when manipulating the point P on the GSP page like in Figure 76
5.24). 77

191
Figure 5.24. Construction of sine graph in the [0,2π) interval via taking the
trace point (for the point P') and animate point (for the point P) advantages of GSP
Figure 5.25. Construction the rate of change for the sine function within the
(unit) circle register

192
[Defne & Ebru] Protocol 11
Researcher: Ok, now. How does sine change in the first quadrant? 1
Defne: (Dragging the quarter arc in the first quadrant with her index finger in the 2
counterclockwise direction on the screen like in Figure 5.24) as going to the up-3
right, it [sine] is increasing, but increased amount is decreasing. 4
Ebru: That is, decreasingly increase… 5
Researcher: What about in the second quadrant Ebru? 6
Ebru: Decreasing… …but increasingly decrease… 7
Researcher: In the third quadrant Defne? 8
Defne: Decreasing… but decreased amount is decreasing… In fourth quadrant, an 9
increased graph is there and increased amount is increased… 10
Ebru: [In the fourth quadrant, sine] increasingly increase. 11
Researcher: Where do you look to determine… …unit circle or graph? 12
Defne: We can say through looking to both. (Pointing the last endpoints of the quadrants 13
on the x-axis through focusing on the graph on the screen like in Figure 5.24) first 14
quadrant, second, third and fourth… 15
Ebru: Yes, I understand, too, from each of both [unit circle, graph]… But unit circle is as 16
if crosschecking… 17
Researcher: How do you determine, Defne, the quadrants on the graph? 18
Defne: (Dragging the point P in the counterclockwise direction through waiting a while 19
on the points in which the quadrants change) first quadrant, second quadrant, third 20
and fourth (pointing the projection of the point P' on the x-axis for her waiting 21
points)… 22
Ebru: (Nodding her head up and down) 23
Researcher: So, what is the value of here (pointing the middle intersection point of the 24
traced-sine graph with the x-axis on the screen like in Figure 5.24)? 25
Defne: π… 26
Researcher: What do you see here instead of π (pointing the middle intersection point of 27
the traced-sine graph with the x-axis on the screen)? 28
Ebru: …about 3.1 (coming closer and looking carefully to the screen). 29
Defne: Uh-huh, π is about 3.14… 30
Researcher: Good. Well, if I ask you that what is sin(2)? How do you think? 31
Defne: Then, we will find the y value… …for x=2… (And then, dragging the point P so 32
that the abscissa of the dynamically linked point P' would be 2; and dragging her 33
index finger from the point P' to the y-axis on the dashed-line) is it 0.9? 34
Ebru: Let’s we look with calculator (opening the calculate option of the measure menu 35
of GSP and calculating sin(2) as 0.91) yes… …that is, about 0.9. 36
Researcher: Well, what about sin(3)? 37
Defne: That means… …it is closed to 3.14, but smaller than 3.14, so it [sin(3)] is very 38
close to zero. 39
Researcher: Why? 40
Ebru: …because sin(π) is zero. 41
Researcher: Ok. What about sin(10)? 42
Defne: We assume 2π as about 6… 43
Ebru: …4 remain. It [4] is in the third quadrant. 44
Defne: (Putting her index finger on 4 on the x-axis on the screen; figuring a parallel 45
segment to the y-axis from here up to the traced-sine graph; and then figuring a 46

193
parallel segment to the x-axis from this intersection point to the y-axis) here… 47
…that is, close to minus 1. 48
Researcher: But 10 must be above and beyond here (figuring a ray on the positive x-axis 49
starting from the last intersection point of the traced-sine graph with the x-axis). 50
Defne: After 2π, it turns second tour… …and it [graph] would repeat in the same way 51
like that (figuring with her index finger on the screen a sine-curve through adding 52
it to the end point of the traced-sine graph so as to indicate the right second part 53
of the sine graph corresponding to the second full-round turning in the 54
counterclockwise direction). 55
Ebru: Yes. 56
Researcher: Let’s we construct the sine graph through GSP automatically (constructing 57
the graph of y=sin(x) by the aid of plot new function option of GSP like in Figure 58
5.26). This part of the graph (putting her thumb and index fingers on the endpoints 59
of the right second part of the sine graph corresponding to the second full-round 60
turning in the counterclockwise direction) means the second tour, you said shortly 61
before. 62
Defne&Ebru: Yes. 63
Researcher: Well, what does this part mean (putting her thumb and index fingers on the 64
endpoints of the left first part of the sine graph corresponding to the first full-65
round turning in the clockwise direction)? 66
Defne: It means turning in the reverse direction… …that is, angles are negative… 67
Ebru: Yes. 68
Researcher: Well. In this part (putting her thumb and index fingers on the endpoints of 69
the right first part of the sine graph corresponding to the first full-round turning 70
in the counterclockwise direction on the screen like in Figure 5.26), for which 71
angle does sine take the value 1? 72
Defne: π/2. 73
Researcher: What about in this part (putting her thumb and index fingers on the endpoints 74
of the right second part of the sine graph corresponding to the second full-round 75
turning in the counterclockwise direction)? 76
Ebru: 2π plus π/2. 77
Defne: Yes. 78
Researcher: What about in this part (putting her thumb and index fingers on the endpoints 79
of the left first part of the sine graph corresponding to the first full-round turning 80
in the clockwise direction)? 81
Defne: π/2 minus 2π. 82
Ebru: (Nodding her head up and down) 83
Researcher: Well. Considering the unit circle, how many angles are there with the 0.5 84
sine value? 85
Ebru: Two. 86
Defne: One when going up (figuring an arc in the first quadrant on the unit circle starting 87
from the point 1 on the x-axis up to the intersection point with the dashed line in 88
the counterclockwise direction in Figure 5.26)… …one when going down 89
(figuring an arc in the second quadrant on the unit circle starting from the point 90
1 on the y-axis up to the intersection point with the dashed line in the 91
counterclockwise direction in Figure 5.26)… Yes, two. 92
Researcher: What can you say about these two angles? 93
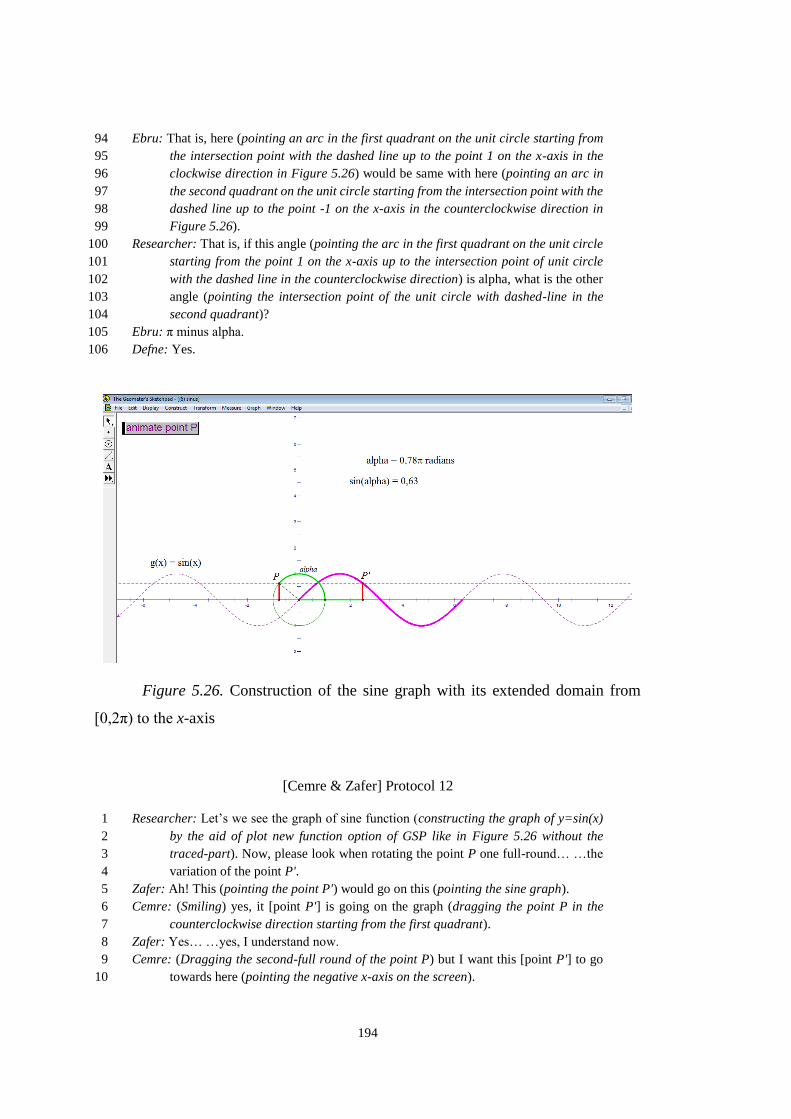
194
Ebru: That is, here (pointing an arc in the first quadrant on the unit circle starting from 94
the intersection point with the dashed line up to the point 1 on the x-axis in the 95
clockwise direction in Figure 5.26) would be same with here (pointing an arc in 96
the second quadrant on the unit circle starting from the intersection point with the 97
dashed line up to the point -1 on the x-axis in the counterclockwise direction in 98
Figure 5.26). 99
Researcher: That is, if this angle (pointing the arc in the first quadrant on the unit circle 100
starting from the point 1 on the x-axis up to the intersection point of unit circle 101
with the dashed line in the counterclockwise direction) is alpha, what is the other 102
angle (pointing the intersection point of the unit circle with dashed-line in the 103
second quadrant)? 104
Ebru: π minus alpha. 105
Defne: Yes. 106
Figure 5.26. Construction of the sine graph with its extended domain from
[0,2π) to the x-axis
[Cemre & Zafer] Protocol 12
Researcher: Let’s we see the graph of sine function (constructing the graph of y=sin(x) 1
by the aid of plot new function option of GSP like in Figure 5.26 without the 2
traced-part). Now, please look when rotating the point P one full-round… …the 3
variation of the point P'. 4
Zafer: Ah! This (pointing the point P') would go on this (pointing the sine graph). 5
Cemre: (Smiling) yes, it [point P'] is going on the graph (dragging the point P in the 6
counterclockwise direction starting from the first quadrant). 7
Zafer: Yes… …yes, I understand now. 8
Cemre: (Dragging the second-full round of the point P) but I want this [point P'] to go 9
towards here (pointing the negative x-axis on the screen). 10
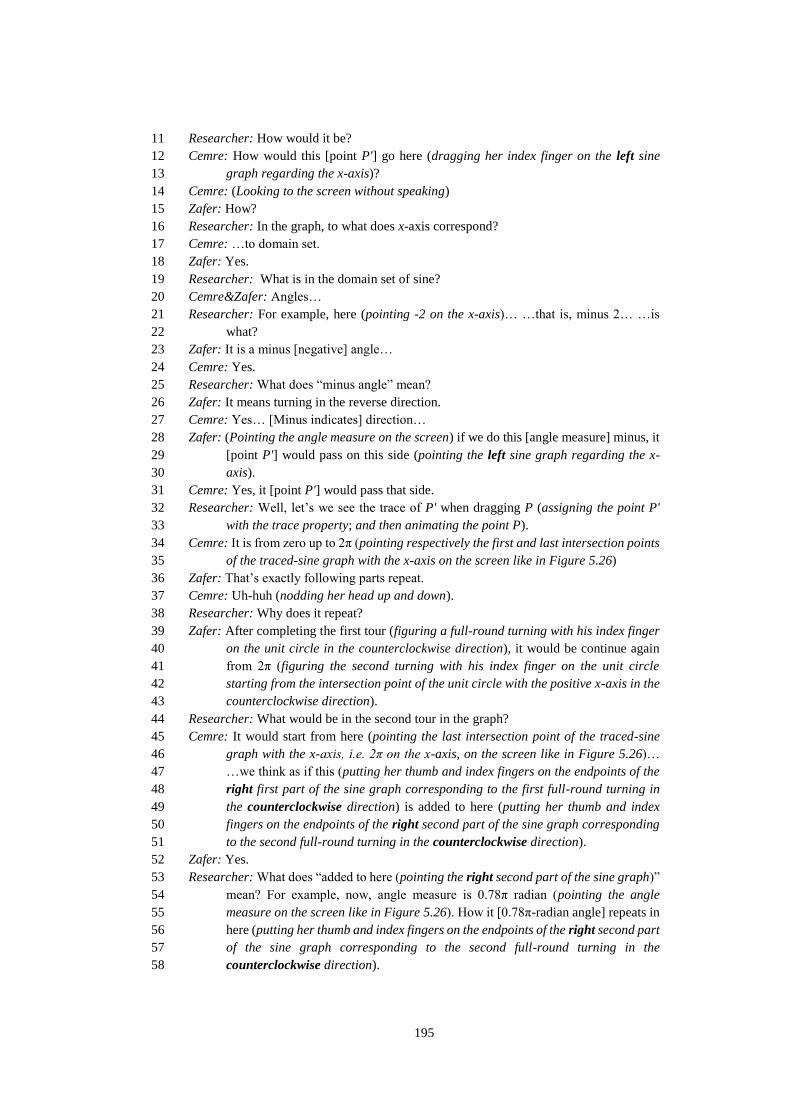
195
Researcher: How would it be? 11
Cemre: How would this [point P'] go here (dragging her index finger on the left sine 12
graph regarding the x-axis)? 13
Cemre: (Looking to the screen without speaking) 14
Zafer: How? 15
Researcher: In the graph, to what does x-axis correspond? 16
Cemre: …to domain set. 17
Zafer: Yes. 18
Researcher: What is in the domain set of sine? 19
Cemre&Zafer: Angles… 20
Researcher: For example, here (pointing -2 on the x-axis)… …that is, minus 2… …is 21
what? 22
Zafer: It is a minus [negative] angle… 23
Cemre: Yes. 24
Researcher: What does “minus angle” mean? 25
Zafer: It means turning in the reverse direction. 26
Cemre: Yes… [Minus indicates] direction… 27
Zafer: (Pointing the angle measure on the screen) if we do this [angle measure] minus, it 28
[point P'] would pass on this side (pointing the left sine graph regarding the x-29
axis). 30
Cemre: Yes, it [point P'] would pass that side. 31
Researcher: Well, let’s we see the trace of P' when dragging P (assigning the point P' 32
with the trace property; and then animating the point P). 33
Cemre: It is from zero up to 2π (pointing respectively the first and last intersection points 34
of the traced-sine graph with the x-axis on the screen like in Figure 5.26) 35
Zafer: That’s exactly following parts repeat. 36
Cemre: Uh-huh (nodding her head up and down). 37
Researcher: Why does it repeat? 38
Zafer: After completing the first tour (figuring a full-round turning with his index finger 39
on the unit circle in the counterclockwise direction), it would be continue again 40
from 2π (figuring the second turning with his index finger on the unit circle 41
starting from the intersection point of the unit circle with the positive x-axis in the 42
counterclockwise direction). 43
Researcher: What would be in the second tour in the graph? 44
Cemre: It would start from here (pointing the last intersection point of the traced-sine 45
graph with the x-axis, i.e. 2π on the x-axis, on the screen like in Figure 5.26)… 46
…we think as if this (putting her thumb and index fingers on the endpoints of the 47
right first part of the sine graph corresponding to the first full-round turning in 48
the counterclockwise direction) is added to here (putting her thumb and index 49
fingers on the endpoints of the right second part of the sine graph corresponding 50
to the second full-round turning in the counterclockwise direction). 51
Zafer: Yes. 52
Researcher: What does “added to here (pointing the right second part of the sine graph)” 53
mean? For example, now, angle measure is 0.78π radian (pointing the angle 54
measure on the screen like in Figure 5.26). How it [0.78π-radian angle] repeats in 55
here (putting her thumb and index fingers on the endpoints of the right second part 56
of the sine graph corresponding to the second full-round turning in the 57
counterclockwise direction). 58
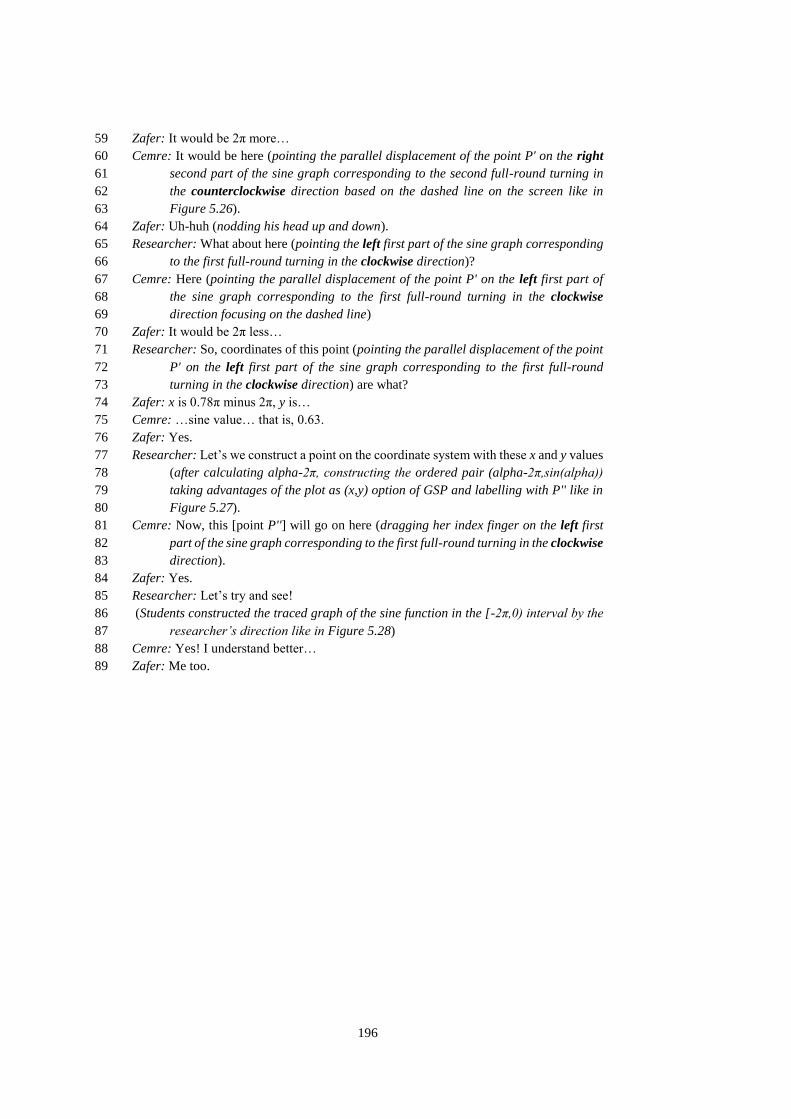
196
Zafer: It would be 2π more… 59
Cemre: It would be here (pointing the parallel displacement of the point P' on the right 60
second part of the sine graph corresponding to the second full-round turning in 61
the counterclockwise direction based on the dashed line on the screen like in 62
Figure 5.26). 63
Zafer: Uh-huh (nodding his head up and down). 64
Researcher: What about here (pointing the left first part of the sine graph corresponding 65
to the first full-round turning in the clockwise direction)? 66
Cemre: Here (pointing the parallel displacement of the point P' on the left first part of 67
the sine graph corresponding to the first full-round turning in the clockwise 68
direction focusing on the dashed line) 69
Zafer: It would be 2π less… 70
Researcher: So, coordinates of this point (pointing the parallel displacement of the point 71
P' on the left first part of the sine graph corresponding to the first full-round 72
turning in the clockwise direction) are what? 73
Zafer: x is 0.78π minus 2π, y is… 74
Cemre: …sine value… that is, 0.63. 75
Zafer: Yes. 76
Researcher: Let’s we construct a point on the coordinate system with these x and y values 77
(after calculating alpha-2π, constructing the ordered pair (alpha-2π,sin(alpha)) 78
taking advantages of the plot as (x,y) option of GSP and labelling with P'' like in 79
Figure 5.27). 80
Cemre: Now, this [point P''] will go on here (dragging her index finger on the left first 81
part of the sine graph corresponding to the first full-round turning in the clockwise 82
direction). 83
Zafer: Yes. 84
Researcher: Let’s try and see! 85
(Students constructed the traced graph of the sine function in the [-2π,0) interval by the 86
researcher’s direction like in Figure 5.28) 87
Cemre: Yes! I understand better… 88
Zafer: Me too. 89

197
Figure 5.27. Construction of the (alpha-2π,sin(alpha)) ordered pair within the
graphical regsiter
Figure 5.28. Construction of the sine graph’s left and right first parts in the
graphical register corresponding to the first full-round turnings, respectively, in the
clockwise and counterclockwise directions in the (unit) circle register

198
[Defne & Ebru] Protocol 12
Researcher: Where does sine function repeat? 1
Defne: Here (pointing the endpoints of the right first part of the sine graph corresponding 2
to the first full-round turning in the counterclockwise direction on the screen like 3
in Figure 5.26)… …at 2π. 4
Ebru: Of course, 2π. 5
Researcher: How did you determine this? 6
Ebru: Because when this [point P] full-turned around the circle (dragging her index finger 7
on the unit circle so as to figure a circle starting from the point 1 on the x-axis), 8
this [point P'] comes to here (pointing the right-endpoint of the right first part of 9
the sine graph corresponding to the first full-round turning in the 10
counterclockwise direction). 11
Defne: Uh-huh (nodding her head up and down). 12
Ebru: It [sine] takes all values in here (pointing the right-endpoint of the right first part 13
of the sine graph corresponding to the first full-round turning in the 14
counterclockwise direction)… …that may take anywhere… 15
Defne: Yes. 16
Researcher: If we consider this interval (pointing with her right hands thumb and index 17
fingers respectively the origin and the right-endpoint of the right second part of 18
the sine graph corresponding to the second full-round turning in the 19
counterclockwise direction), wouldn’t sine values repeat? 20
Defne: It [sine] would repeat… …but period of sine was 2π. 21
Researcher: Why is the period of sine 2π… …why not 4π? 22
Defne: I guess it was assumed (smiling). 23
Researcher: Well, what does period mean? 24
Defne: Period… ….it is values that a function takes. For example, for sine it is part from 25
its highest value up to its lowest value… 26
Researcher: What do you think Ebru? 27
Ebru: Frankly speaking, I don’t know it [period] as a definition. 28
Researcher: There is no need to give its mathematical definition. What do you remember 29
about period? 30
Ebru: (Waiting without speaking). 31
Researcher: Do you agree with Defne about period’s meaning? 32
Ebru: I didn’t understand what Defne meant? 33
Researcher: Can you explain again the meaning of period Defne? 34
Defne: Period, for example, for sine is part from its highest value up to its lowest value… 35
Researcher: Is that so Ebru? 36
Ebru: I don’t think so… …but frankly speaking, I don’t know what it is [period]. 37
Researcher: Ok. What do you think about this part (pointing the 2π-length interval from 38
–π to π on the x-axis)? Would sine take all values in here that may take anywhere? 39
Defne&Ebru: Yes. 40
Researcher: Well, can you show me an interval smaller than 2π length… …so that sine 41
could take all values? 42
Defne&Ebru: (Shaking their heads right and left). 43
Researcher: Then, what was the smallest length of those intervals? 44
Defne: Is that 2π! 45
Ebru: Yes, 2π… 46
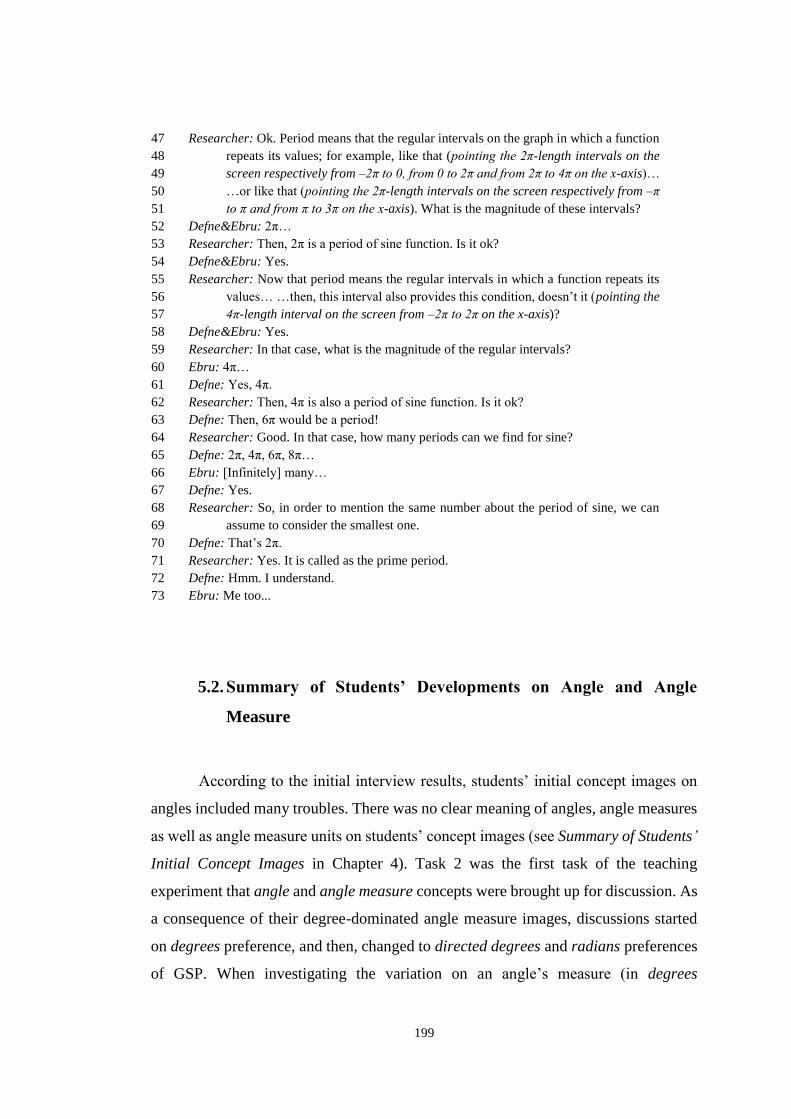
199
Researcher: Ok. Period means that the regular intervals on the graph in which a function 47
repeats its values; for example, like that (pointing the 2π-length intervals on the 48
screen respectively from –2π to 0, from 0 to 2π and from 2π to 4π on the x-axis)… 49
…or like that (pointing the 2π-length intervals on the screen respectively from –π 50
to π and from π to 3π on the x-axis). What is the magnitude of these intervals? 51
Defne&Ebru: 2π… 52
Researcher: Then, 2π is a period of sine function. Is it ok? 53
Defne&Ebru: Yes. 54
Researcher: Now that period means the regular intervals in which a function repeats its 55
values… …then, this interval also provides this condition, doesn’t it (pointing the 56
4π-length interval on the screen from –2π to 2π on the x-axis)? 57
Defne&Ebru: Yes. 58
Researcher: In that case, what is the magnitude of the regular intervals? 59
Ebru: 4π… 60
Defne: Yes, 4π. 61
Researcher: Then, 4π is also a period of sine function. Is it ok? 62
Defne: Then, 6π would be a period! 63
Researcher: Good. In that case, how many periods can we find for sine? 64
Defne: 2π, 4π, 6π, 8π… 65
Ebru: [Infinitely] many… 66
Defne: Yes. 67
Researcher: So, in order to mention the same number about the period of sine, we can 68
assume to consider the smallest one. 69
Defne: That’s 2π. 70
Researcher: Yes. It is called as the prime period. 71
Defne: Hmm. I understand. 72
Ebru: Me too... 73
5.2. Summary of Students’ Developments on Angle and Angle
Measure
According to the initial interview results, students’ initial concept images on
angles included many troubles. There was no clear meaning of angles, angle measures
as well as angle measure units on students’ concept images (see Summary of Students’
Initial Concept Images in Chapter 4). Task 2 was the first task of the teaching
experiment that angle and angle measure concepts were brought up for discussion. As
a consequence of their degree-dominated angle measure images, discussions started
on degrees preference, and then, changed to directed degrees and radians preferences
of GSP. When investigating the variation on an angle’s measure (in degrees

200
preference) through dynamic manipulations of its openness in GSP environment (see
Figure 5.7), students’ two different focuses were observed regarding angle measure.
While Defne focused coherently on the same up-part from two ones of the plane
separated by the angle, others changed their focuses from one part to the other when
their focused-part turned from the obtuse angle to the reflex angle. The researcher
inferred that while Defne’s seeing of an angle was as a dynamic turning, others’ seeing
of an angle was as a static interior region separated by its rays.
When the angle measure preference of GSP was changed from degrees to
radian, it was observed that initially, none of the students could explain any reason
why the angle measure changed from positive to negative. After then, according to
their investigations in GSP, they reasoned about the sign of the angle measure as
negative [positive] if the position of the angle’s interior region was down [up]
regarding the horizontal straight angle without mentioning direction. This reasoning
prompted Cemre to associate signs of angle measures with the y-axis of the coordinate
plane, it prompted other students to associate negative measure of an angle with the
direction. When direction idea was brought up for discussion, students started to
mention the visual variation as rotation.
Although they considered the counterclockwise direction as positive and the
clockwise direction as negative, two different points of view having emerged when
articulating the direction. When reasoning about angle measures’ change from positive
to negative, while Zafer and Ebru fixed the initial side of the angle as the starting point
of the rotation and changed the direction of the rotation, Defne fixed her focus on the
same up-arc but changed the initial side of the angle as the starting point of rotation.
Defne’s considered the same angle as both negative and positive but only through
focusing on the same arc between the angle’s sides and changing her point of view
between its initial side and terminal side. At that time, Ebru’s seeing of an angle was
either as negative or as positive through focusing on both the angle’s same initial side
and its interior region.
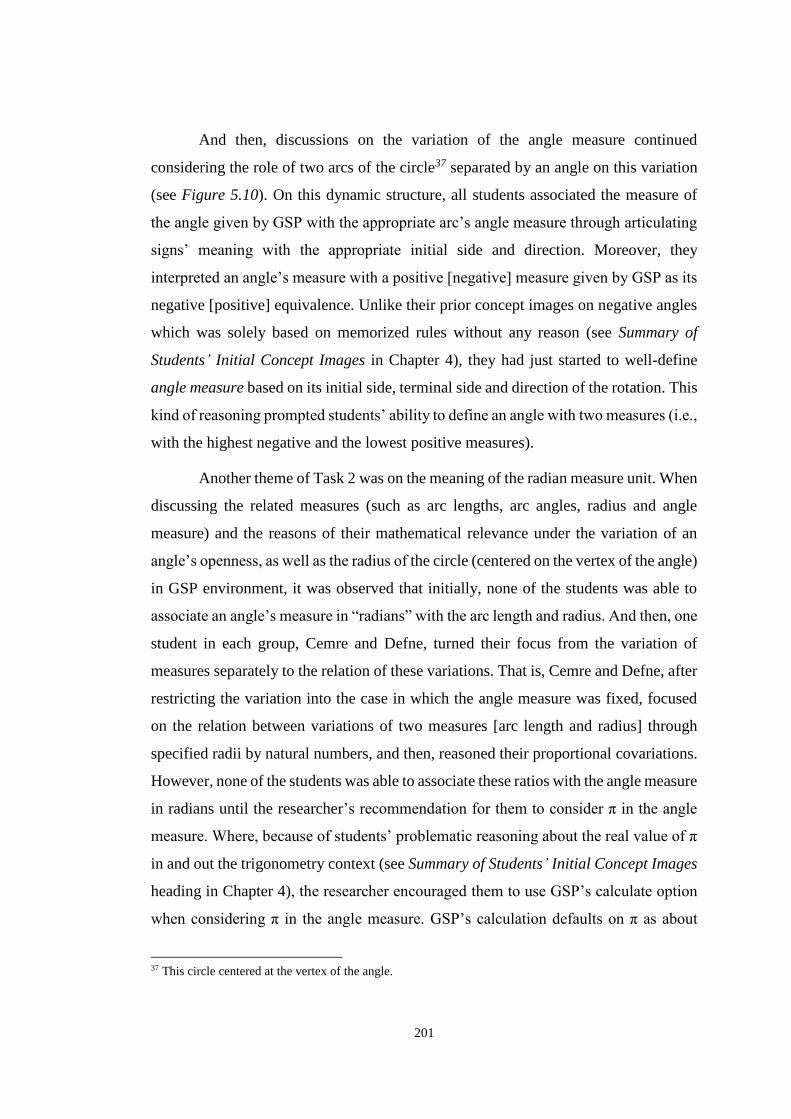
201
And then, discussions on the variation of the angle measure continued
considering the role of two arcs of the circle37 separated by an angle on this variation
(see Figure 5.10). On this dynamic structure, all students associated the measure of
the angle given by GSP with the appropriate arc’s angle measure through articulating
signs’ meaning with the appropriate initial side and direction. Moreover, they
interpreted an angle’s measure with a positive [negative] measure given by GSP as its
negative [positive] equivalence. Unlike their prior concept images on negative angles
which was solely based on memorized rules without any reason (see Summary of
Students’ Initial Concept Images in Chapter 4), they had just started to well-define
angle measure based on its initial side, terminal side and direction of the rotation. This
kind of reasoning prompted students’ ability to define an angle with two measures (i.e.,
with the highest negative and the lowest positive measures).
Another theme of Task 2 was on the meaning of the radian measure unit. When
discussing the related measures (such as arc lengths, arc angles, radius and angle
measure) and the reasons of their mathematical relevance under the variation of an
angle’s openness, as well as the radius of the circle (centered on the vertex of the angle)
in GSP environment, it was observed that initially, none of the students was able to
associate an angle’s measure in “radians” with the arc length and radius. And then, one
student in each group, Cemre and Defne, turned their focus from the variation of
measures separately to the relation of these variations. That is, Cemre and Defne, after
restricting the variation into the case in which the angle measure was fixed, focused
on the relation between variations of two measures [arc length and radius] through
specified radii by natural numbers, and then, reasoned their proportional covariations.
However, none of the students was able to associate these ratios with the angle measure
in radians until the researcher’s recommendation for them to consider π in the angle
measure. Where, because of students’ problematic reasoning about the real value of π
in and out the trigonometry context (see Summary of Students’ Initial Concept Images
heading in Chapter 4), the researcher encouraged them to use GSP’s calculate option
when considering π in the angle measure. GSP’s calculation defaults on π as about
37 This circle centered at the vertex of the angle.

202
3.14 prompted students’ reasoning about π notation in an angle measure in radians
with its meaning as a real number. In addition, dynamically-manipulated calculation
result of the ratio between (arc length/radius) and (π) prompted a distinct shift on their
reasoning about angle measure in radians. That is to say, students had just started to
associate arc lengths [when the radius was 1] with the angle measures. Moreover, at
the beginning of Task 3, angles were constructed in the unit circle context (see Figure
5.13). It was observed that students easily transferred their reasoning mentioned above
onto the unit circle.
Students’ consideration of angles as dynamic-directed turnings promoted
students’ advance reasoning about definition of angle measure in the (unit) circle
register. All students started to be able to identify an angle within the (unit) circle
register whose absolute measure was greater than 360 degrees or 2π radians regarding
two-step turning in any directions: (1) principal turning from the initial side to the
terminal side (2) some full-rounds. Beside, when identifying angle measures
corresponding to the reference points in different quadrants (see Figure 5.15 and
Figure 5.16), Cemre and Zafer also reasoned about the principal turning from the
initial side to the terminal side through considering this turning in two steps regarding
the closest coordinate axes: (1) turning from the initial side to the closest coordinate
axis in the same direction as the principal turning (2) turning from this coordinate axis
to the terminal side in the direction so that the way of turning would be the shorter arc.
This reasoning prompted a distinct shift on their reasoning about an angle in the (unit)
circle register. That is to say, Cemre and Zafer began to associate an angle within the
(unit) circle register with its complementary and/or supplementary parts in any
quadrant. On the other hand, Defne and Ebru reached this level of reasoning when the
researcher provoked them to identify an angle in any quadrant within the (unit) circle
register at least in three different ways without considering full-round turnings.
Students’ this level of reasoning on angles was inconsistent with their prior ones
revealed throughout the initial interviews.
At the end of Task 3, all students were able to associate a static angle structure
in the (unit) circle register with the infinitely many [negative or positive] equivalent
203
measures in the symbolic register through considering dynamic directed turnings.
Inversely, they were able to associate the infinitely many equivalent measures in the
symbolic register with the same static structure in the (unit) circle register.
During Task 5, when angle measures were brought up for discussions together
with trigonometric values, students started to reason about a real number as an angle
measure with two different ways through considering angle measure unit either in
degrees or in radians (see Summary of Students’ Developments on Basic Trigonometric
Functions heading in Chapter 5). When discussing the relation between measures of
the angles with the same static structure but different dynamic structures in the (unit)
circle register based on trigonometric values, Defne and Ebru initially reasoned about
their measures as if equal to each other in the symbolic register. After the researcher’s
provocation of them to discuss this equality as an equation on the paper and pencil
environment, they tried to focus on what was mathematically same in this respect; and
reasoned about their difference in terms of measures in the symbolic register, as well
as their sameness in terms of static angle structures in the (unit) circle register. On the
other hand, based on the corresponding arc lengths to the angles with the same static
structure but different dynamic structures in the (unit) circle register, Zafer and
Cemre reasoned that they produced different angle measures in the symbolic register.
At the end of Task 5, all students had just started to differentiate angles with the same
static structure but different dynamic structures in the (unit) circle register, as well
as angles with the equivalent but not equal measures in the symbolic register.
In Task 6 [Task 7], angles and angle measures were discussed on the dynamic-
and-linked simultaneous visual representations of sine [cosine] on the same coordinate
plane (i.e., its graph and unit circle representations) (see Regarding angles heading in
Chapter 5). Dynamic-and-linked manipulations of the point on the unit circle and its
correspondence on the sine [cosine] graph fortified students’ concept images on the
meaning of π, contrary to their initial concept images, through merging its meaning as
the angle measure in radians and as a real number (i.e., approximately 3.14) as a
consequence of their reasoning about π based on the correspondence of π-radian angle
in the (unit) circle register to about 3.14 on the x-axis in the graphical register.
204
Furthermore, on the contrary to the initial interview results, anymore “coordinate
plane” was not a cognitive conflict factor when the position of π on the x-axis is
considered simultaneously within the graphical register and the (unit) circle register.
Besides, when reasoning about the sine [cosine] value of a real number smaller than
2π in the symbolic register, students were able to convert this real number as an angle
measure in radians within the symbolic register into the same real number on the x-
axis as the corresponding angle within the graphical register, as well as its
correspondence arc in the (unit) circle register. In addition, when reasoning about a
sine value of a real number greater than 2π in the symbolic register, students were able
to differentiate the equivalent but not equal angles’ positions on the x-axis with the 2π-
length intervals in the graphical register based on their ability to convert the
continuously-repeated full-round turnings in the counterclockwise [clockwise]
direction in the (unit) circle register into the continuously-repeated regular intervals
on the x-axis in the positive [negative] direction in the graphical register (see
Regarding angles heading in Chapter 5). It was the point that students started to reason
about the real number set (R) in the symbolic register as the domain set of the sine
[cosine] function via thinking of the angle concept in the graphical register as a
continuous and repeated variable on the x-axis.
5.3. Summary of Students’ Developments on Basic Trigonometric
Functions
According to the initial interview results, students’ reasoning about
trigonometric ratios was not based on the angle measure rather than lengths of sides.
Although they were able to define sine [cosine] as the ratio of opposite [adjacent] side
to hypotenuse in the right triangle context, they did not aware sine [cosine] ratio’s
independence from lengths of sides upon entering the teaching experiment. During the
first task of the teaching experiment, when discussing this issue under the dynamic-
and-simultaneous manipulations on the similar right triangles and their corresponding
trigonometric ratios in GSP environment (Figure 5.1), all students constructed a new

205
concept definition image on trigonometric ratios as dependent only on angle measure
and independent from side lengths.
Moreover, prior to the teaching experiment, students’ conceptions of
trigonometric values in the unit circle context were unrelated to those in the right
triangle context. That is to say, their concept definition images, for example, on sine
in the unit circle context did not include any related-part of their concept definition
images on sine in the right triangle context. At the end of the first task of the teaching
experiment, their conceptions on trigonometric ratios’ independence from length
brought forth their reasoning about the opposite [adjacent] side of a right triangle with
1-unit hypotenuse as sine [cosine]. It was the first step of their associations of the right
triangle context with the unit circle context.
Cognitive analysis of the initial interviews indicated critical troubles on
students’ conceptions on function concept that were restricted to the polynomial
functions in the symbolic register, as well as dominated visual representations by the
graphical register. Therefore, Task 4, started with the definition of the function
concept, and continued through discussions of whether the relation mapping the
principal arc into the corresponding perpendicular line segment from the reference
point of this arc to the x-axis was a function or not (Figure 5.17). And then, three
different measures (i.e., length of this line segment, sine [cosine] of this principal
measure, and ordinate [abscissa] of the reference point) were compared and contrasted
with each other in four quadrants of the unit circle through taking GSP’s dynamically-
linked structures. During this process, Ebru’s different point of view emerged on the
definition of sine based on the directed-opposite length of the reference right triangle
regarding the quadrants within the (unit) circle register. This implies that Ebru’s
mental image related to sine of an angle just included a reference right triangle in each
quadrant with the directed-opposite side rather than a set of geometric procedures (see
Summary of Students’ Initial Concept Images heading in Chapter 4). This mental
image prompted a distinct shift on Ebru’s reasoning about sine of an angle in any
quadrant within the (unit) circle register. That is to say, Ebru began to reason quickly
and accurately about the signs of sine regarding the quadrants within the (unit) circle

206
register without trying to remember the memorized-rules in this regard, as well as the
values of sine [cosine] for the angles corresponding to the axes such as 0 and 3π/2 in
radians. However, other students did not rich this kind of mental image related to sine
[cosine] of an angle within the (unit) circle register throughout Task 4.
At the beginning of Task 5, it was observed that none of the students was aware
of the determination of the sine [cosine] value of an angle in the symbolic register by
using the coordinate axes as a signed-ruler in the (unit) circle register despite of their
interpretations of sine [cosine] as the ordinate [abscissa] of a point on the unit circle.
Therefore, the researcher provoked them to compare two visual objects, namely, the
opposite line segment and the radius line segment on the positive y-axis in terms of
their magnitudes, and then, estimate the exact value referring to the directed-opposite
line segment. Students were able to quickly and accurately compare these two visual
objects in terms of their magnitudes considering their signs, and their estimations were
almost same with the sine values of the mentioned angles in any quadrant. It was Task
5 that students had just been able to convert the geometric procedures in their concept
definition images on sine within the (unit) circle register into the values of sine within
the symbolic register. Besides, in the absence of the reference right triangle regarding
the position of the reference point on unit circle, they were able to reason about sine
[cosine] of these angles again as the limit case of the directed-opposite [adjacent] side;
and they were able to convert the existing {non-existing} directed-opposite [adjacent]
side within the (unit) circle register into ±1 {zero} as the value of sine [cosine]
corresponding to these angles within the symbolic register through considering
directions. Therefore, at the end of task 5, all students developed a concept image on
sine [cosine] values through determination process of the directed-opposite [adjacent]
length of the dynamically-varied reference right triangle in the (unit) circle register,
as well as for its the limit cases, unlike their prior concept images based on the
memorized exact values of sine [cosine] at the special angles without any reasons.
However, students these concept images developed in the (unit) circle register.
Therefore, the researcher asked students to reason about a sine value that came first to
their mind in order to provoke them to discuss about sine value in the symbolic register.

207
All students expressed a sine value of a real number, such as 30, as an angle in
“degrees” that came first to their mind but without stating clearly their “degree”
preference as the angle measure unit. Calculation of sin(30) by GSP when the angle
measure preference of GSP in radians that produced different output from 1/2
provoked students to reason a real number without π notation as an angle measure.
Where, although all students were aware that the difference between two outputs
(GSP’s and theirs) arose from the difference between angle measure units, they could
not articulate how the sine [cosine] value of this real number corresponded to the
appeared output on the screen. When reasoning about an angle’s measure in radians
both with and without π notation, students recognized a real number without π
notation, for example 30, as an angle measure in radians through transforming it into
the symbolic form with π notation by the aid of GSP’s calculate option, and then,
locating the reference point on the unit circle through dragging and dropping so as to
indicate this angle, and comparing the calculation result of sin(30) with the
dynamically-linked sine measure of the angle corresponding to this reference point.
Moreover, during this process, they considered π with its approximate real value, i.e.,
3.14. Unlike their prior conceptions, students had just started to reason about a real
number as an angle measure with two different ways through considering angle
measure units. In other words, they were able to convert a real number in the symbolic
register into two different angles within the (unit) circle register through considering
two angle measure units, i.e., degrees and radians.
Cognitive analysis of students’ initial concept images prior to the teaching
experiment indicated “coordinate plane” as a cognitive conflict factor when the
graphical register and the (unit) circle register were considered simultaneously (see
Summary of Students’ Initial Concept Images heading in Chapter 4). Visual
representations of sine [cosine] on the same coordinate plane both in the (unit) circle
register and the graphical register, a theme of Task 6 [Task 7], provided students with
the opportunity to compare and contrast the dynamic and simultaneous variations of
the reference point on the unit circle and its converted form in the graphical register.
This opportunity prompted a distinct shift on students’ recognition of the same object
(i.e., sine or cosine) represented in different representational registers, as well as their

208
discrimination of what is/is not mathematically relevant in terms of the coordinate
plane both in the (unit) circle register and graphical register. That is to say, they were
able to differentiate contents of the coordinate planes in the (unit) circle register and
the graphical register. For example, they differentiated the meaning of the abscissa
[ordinate] of a point in the unit circle from the meaning of the abscissa [ordinate] of a
point on the sine [cosine] graph. Moreover, in Task 6 [Task 7], it was observed students
were able to convert the meaning of the sine [cosine] function among the registers
when interpreting the sine [cosine] value of a real number in the symbolic register,
such as 2, 3 and 10. For example, when determining sin(2), Defne initially determined
2 as an argument in the domain of the sine function, and its corresponding element in
the range of the sine function as the sine value of 2 in the symbolic register. And then,
considering arguments in the domain set of the sine function as angles, she tried to
obtain the angle with the 2-radian measure in the (unit) circle register through
dragging the point P on the unit circle (Figure 5.26). Next, she focused on the abscissa
of the point P' in the graphical register, which was the correspondence of the point P
in the (unit) circle register, to obtain 2 as an angle measure on the x-axis in the
graphical register. Finally, she determined the ordinate of the point P' whose abscissa
was 2 as the value of sin(2).
Discussions in GSP environment on trigonometric functions within the (unit)
circle register and graphical register simultaneously resulted in students’ ability to
convert the dynamic variation of the sine [cosine] values regarding continuous
turnings in the counterclockwise {clockwise} direction in the (unit) circle register
into the static representation of the dynamic variation of the sine [cosine] values by
associating them with the appropriate right {left} part of the sine [cosine] graph. In
other words, they were able to convert the meaning of the sine [cosine] values of the
angles with the same static structure but different dynamic structures in the (unit)
circle register into the meaning of the parallel displacement of the point on the
principal part of the sine [cosine] graph along the x-axis by the 2π-length line
segments in the graphical register thereby converting the meaning of full-round
turnings in the counterclockwise [clockwise] direction in the (unit) circle register into
the meaning of the parallel displacement along the x-axis in the positive [negative]
209
direction in the graphical register (see Regarding trigonometric values heading in
Chapter 5). At that point, they started to reason about the sine [cosine] function on the
real number set in the graphical register based on their ability to transform the
principal part of the sine [cosine] graph into the other repeated parts through the
parallel displacement of the principal part. This implies that unlike their prior
reasoning, anymore students’ reasoning on the sine [cosine] values was intimately
dependent on the angles instead of considering the sine [cosine] values apart from the
angles through restricting them between -1 and 1 as a rule.
5.4. Summary of Students’ Developments on Periodicity
According to the initial interview results, the researcher determined that
students’ concept images on the period concept included crucial troubles within the
different representational registers as a consequence of their problematic concept
definition images on the periodicity (see On periodicity sub-heading for detailed
information in Chapter 4).
Task 6 [Task 7] was the first task that the period concept was brought up for
discussion based on the variation of the sine [cosine] values regarding the variation of
angle measures under their dynamic-simultaneous manipulations of different
representations in GSP environment. Dynamic-and-linked manipulations resulted in
students’ reasoning about the repetition of the sine [cosine] values within the (unit)
circle register as a consequence of full-round turnings, and the repetition of the
principal part of the sine [cosine] graph (see Footnote 34) into the other repeated parts
through the parallel displacement of the principal part along the x-axis by the 2π-length
line segments in the graphical register. However, when asked students to reason about
the meaning of the period concept under the consideration of the sine [cosine] function,
none of the students was able to make clear what the period means. At that point, after
emphasizing the repetition of the sine values on the regular intervals with different
magnitudes, the researcher defined the period concept not going into detail as the
regular intervals of the domain set in which a function repeats its values in the

210
graphical register and as the lengths of these regular intervals in the symbolic register.
It was the point that students had just started to reason about the periodicity of the sine
function with more than one period. And then, the researcher defined the prime period
as the smallest period of a periodic function. From this point forward, throughout the
teaching experiment, the period term was used in the meaning of the prime period.

211
CHAPTER 6
6. RESULTS FROM TEACHING EXPERIMENT: PART 2
In this chapter, developments of students’ understanding on trigonometric
functions’ general forms is presented from cognitive analyses results of the teaching
experiment’s second part from each pair [Cemre&Zafer and Defne&Ebru] (see
Instructional Design of This Study sub-heading in Chapter 3 for detailed description
of second part of the designed-instruction). The aim of this chapter is to provide the
living models of students’ ability to discriminate the visual features’ oppositions in
any representational register in terms of their mathematically relevancies or
mathematically differences when dealing with the representation discrimination tasks
integrated into the conversion tasks.
We defined four main visual features whose oppositions were corresponding
to the choice presence/absence of the coefficients (a, b, c and d) in the general form of
sine [cosine] function in the symbolic register for discrimination tasks of the teaching
experiment. These visual feature oppositions were called as A, B, C and D in harmony
with a, b, c and d coefficients in the general forms of sine and cosine; i.e.,
y=asin(bx+c)+d and y=acos(bx+c)+d.
Under the following headings, students’ abilities to discriminate these visual
feature oppositions were presented regarding the (unit) circle register and graphical
register in order to answer the research question related to the effect of the
dynamically-changed visual components referring to the trigonometric functions on
students’ discrimination ability.
212
6.1. Development of Students’ Concept Images on Trigonometric
Functions (General Forms38) throughout Teaching Experiment
6.1.1. Visual Feature Opposition A
Visual Feature (A) corresponds to changed-radius in the (unit) circle register
and changed-magnitude in the graphical register so that these visual features’
opposition corresponds to the choice presence/absence of a coefficient of sine and
cosine in the symbolic register.
6.1.1.1. Changed-radius in (unit) circle register
Considering students’ troubles on the non-unit circle revealed in the initial
interviews (see On Definition of Trigonometric Functions sub-heading for detailed
information in Chapter 4) as well as in the teaching experiment’s Task 4 (see lines 20-
28 in [Defne & Ebru] Protocol 8), the researcher encouraged students in Task 8 [Task
13] to compare and contrast the principal arcs and the opposite [adjacent] sides of the
reference right triangles on the unit circle and non-unit circle (e.g. lines 1-21 in
[Cemre & Zafer] Protocol 13; lines 1-19 in [Defne & Ebru] Protocol 13), as well as
the functions mapping the arc angle into the y-component [x-component] of the point
on the unit circle and non-unit circle in order to see students’ abilities to discriminate
the role of the radius as a visual feature opposition (A) in the (unit) circle register.
In Task 8, initially, the researcher asked students to compare and contrast their
current conceptions on the unit circle with those prior to the teaching experiment (e.g.,
lines 1-4 in [Cemre & Zafer] Protocol 13). Where, it was observed that all of the
students were aware of the role of one-unit radius in the meaning of the opposite side
as sine (e.g., lines 5-11 in [Cemre & Zafer] Protocol 13) and in the meaning of the arc
length as the angle measure in radians (e.g., lines 19-39 in [Cemre & Zafer] Protocol
13). At that point, the researcher encouraged students to reason about the meaning of
the arc length (e.g., lines 19-24 in [Cemre & Zafer] Protocol 13) and the opposite side
38 See Definitions of Terms heading at the end of Introduction chapter.

213
on the non-unit circle (e.g., lines 1-19 in [Defne & Ebru] Protocol 13) through
comparing and contrasting with those on the unit circle.
On the one hand, when reasoning about the arc lengths, initially, students
interpreted the proportional change of the arc lengths regarding the radius in the
language register (e.g., lines 19-39 in [Cemre & Zafer] Protocol 13). However, when
the researcher asked them to test this proportional relation through taking GSP’s
“measure” and “calculate” advantages (e.g., lines 40-44 in [Cemre & Zafer] Protocol
13), students encountered a trouble arising from the difference between the distance-
measure-unit preference of GSP as centimeter and the visual distance-measure-unit of
the coordinate axes (e.g., lines 45-49 in [Cemre & Zafer] Protocol 13). At that point,
the researcher provoked students to reason what they called as the “unit” through
recommending them to measure it by GSP (e.g., lines 50-57 in [Cemre & Zafer]
Protocol 13). It was the point that students had just started to reason about a number
different from 1 as a unit (e.g., lines 58-66 in [Cemre & Zafer] Protocol 13). In other
words, they had just considered a non-unit circle regarding the centimeter distance-
measure-unit as a unit circle regarding the visual distance-measure-unit of the
coordinate axes. This reasoning prompted a distinct shift on their association of the arc
lengths with the angle measure in radians. That is to say, they began to be able to
determine the angle measure in radians corresponding to an arc on a non-unit circle by
means of this arc’s length through defining their own unit for the distance-measure
(e.g., lines 24-39 and 67-102 in [Cemre & Zafer] Protocol 13). In addition, they were
able to correctly convert the relation between the arc lengths corresponding to the same
angle on the unit circle and non-unit circle in the (unit) circle register into the
proportional relation of their measures with respect to the radii in the symbolic register
(e.g., lines 24-39 and 100-102 in [Cemre & Zafer] Protocol 13). Furthermore, not only
in Task 8 but also in Task 13, when similar discussions were done in each quadrant
under the manipulation of the angle’s openness as well as under the manipulation of
the radius, students’ reasoning in the same way was observed that the changing the
radius did not cause the changing the angle measure, but caused the proportional
change of the arc lengths in the (unit) circle register.
214
On the other hand, in Task 8, when reasoning about the opposite sides of the
reference right triangles on the unit circle and the non-unit circle in terms of sine,
students’ initial way of reasoning were based on the equality of sine ratios for these
similar reference right triangles (e.g., lines 8-11 in [Cemre & Zafer] Protocol 13; lines
1-12 in [Defne & Ebru] Protocol 13). Where, students’ language implies that their
visual focus on the structure of the unit circle and the non-unit circle together with
their reference right triangles in the (unit) circle register (Figure 6.1) was the similar
[reference] right triangles related to sine instead of the ordinates of the points on the
circles. So, considering the changed-radius as the similarity ratio, they were able to
determine the proportional relation between opposite sides of the reference right
triangles on the non-unit circle and the unit circle (e.g., lines 13-38 in [Defne & Ebru]
Protocol 13). In order to ease students’ generalization of this reasoning for any radius,
the researcher encouraged them to control this proportional relation through taking
GSP’s “measure”, “calculate” and “drag-drop” advantages (e.g., lines 39-52 in [Defne
& Ebru] Protocol 13). When students confirmed the GSP’s outputs to their reasoning
on the proportional relation between the opposite sides and the radii (e.g., lines 53-62
in [Defne & Ebru] Protocol 13), the researcher encouraged them to investigate the
variation of this relation under the dynamic-simultaneous manipulations of the angle
measure (e.g., lines 63-64 in [Defne & Ebru] Protocol 13) and the radius of the non-
unit circle (e.g., line 67 in [Defne & Ebru] Protocol 13) in the (unit) circle register.
Where, it was observed that students were able to reason about the co-equally variation
of the radius and the ratio of the opposite side on the non-unit circle to the opposite
side on the unit circle (e.g., line 65-66 and 68-71 in [Defne & Ebru] Protocol 13). At
this point, the researcher encouraged them to reason about the opposite side of the
reference right triangle on the non-unit circle with respect to sin(x) as the opposite side
of the reference right triangle on the unit circle (e.g., line 72-79 in [Defne & Ebru]
Protocol 13). Where, students were able to accurately reason about the opposite side
on the non-unit circle as the multiplication of sin(x) with the radius of the non-unit
circle in the symbolic register (e.g., lines 80-94 in [Defne & Ebru] Protocol 13). In
addition, they were able to generalize this reasoning when investigating the variation
of the dynamically-linked-measures yR and (changed radius).sin(x) (Figure 6.6.4)

215
through manipulating the angle’s openness and the radius of the non-unit circle in GSP
environment (e.g., lines 95-106 in [Defne & Ebru] Protocol 13). Furthermore, when
similar discussions were done in Task 13 for the adjacent sides of the reference right
triangles on the unit circle and the non-unit circle in terms of cosine, it was observed
that students reasoned in the same way about the adjacent side of the reference right
triangle on the non-unit circle as the multiplication of cos(x) with the radius of the non-
unit circle in the symbolic register.
From this point forward of Task 8 [Task 13], the researcher preferred to
scrutinize students’ reasoning about the functions mapping the arc angle to the
corresponding opposite [adjacent] side of the reference right triangle on the unit circle
and non-unit circle in a more detailed way in the graphical register as well.
Henceforward, the subsequent progress of students’ concept images on the changed-
radius in the (unit) circle register was presented together with its effect on the changed-
magnitude in the graphical register under the following sub-heading Changed-
magnitude in graphical register.
[Cemre & Zafer] Protocol 13
Researcher: You had discussed on the unit circle in your class period before. That’s our 1
eight meeting… …and we had also discussed on the unit circle up to now. What 2
do you think about the unit circle? Are there changed things in your minds about 3
the unit circle comparing to the old ones? 4
Zafer: Of course! We found an answer to why the unit circle is used. 5
Cemre: Yes, unit circle… 6
Researcher: Why? 7
Zafer: Because its radius is one. And in case the radius is one, sine… …or division of 8
opposite [side] to hypotenuse is equal to opposite [side]. 9
Cemre: That’s, it [opposite side] is directly equal to sine itself… 10
Zafer: If the radius were 2, then we would divide it [opposite side] by 2… 11
Researcher: Let’s we construct and see what happens with two-unit radius (giving 12
directions for students to construct the non-unit circle and the unit circle together 13
with their reference right triangles in in the (unit) circle register in GSP 14
environment so as the radius of the non-unit circle to be manipulable like in Figure 15
6.1)… 16
(Cemre and Zafer cooperatively constructed GSP page like in Figure 6.1 with respect to 17
the researcher’s directions.) 18

216
Researcher: This is unit circle (pointing the unit circle on the screen). What do you know 19
about this length (dragging her index finger up and down on the opposite side of 20
the reference right triangle of the unit circle on the screen like in Figure 6.1)? 21
Zafer: It is sine… 22
Cemre: …sin(x)… 23
Researcher: What is x in here? 24
Cemre: Angle… 25
Zafer: Here (drawing the green arc on the unit circle with his index finger in the 26
counterclockwise direction on the screen like in Figure 6.1). 27
Cemre: …also here (drawing the green arc on the non-unit circle with her index finger 28
in the counterclockwise direction on the screen) because two arcs refer the same 29
angle. 30
Zafer: But, it [angle measure] would be half of its length [arc on the non-unit circle] (at 31
that time the radius of the non-unit circle was about 2-unit length). 32
Cemre: Yes, it [angle measure] would be half of this length (pointing the green arc on 33
the non-unit circle). 34
Zafer: (Nodding his head up and down). 35
Researcher: Why did you think to divide it [arc length on the non-unit circle] by 2? 36
Zafer: …due to radius. 37
Cemre: …it is 2… 38
Zafer: Uh-huh. 39
Researcher: Ok. Let’s we calculate it and see. 40
Cemre: Oops! I’m so excited… 41
Researcher: We can measure initially the radius of the big circle (pointing the non-unit 42
circle on the screen, at that time radius of the non-unit circle was about 2-unit 43
length). 44
Cemre: (Measuring the distance between the origin and the intersection point of the non-45
unit circle with the positive x-axis by the aid of GSP’s measuring option. When 46
the result appeared on the screen as 5.58cm like in Figure 6.2) five point fifty 47
eight… it [radius] must have been 2… 48
Zafer: (Looking to the screen without speaking) 49
Researcher: What do you see as the measure unit near 5.58? 50
Zafer: Centimeter… 51
Cemre: Yes, centimeter. 52
Researcher: Ok. Where do you mean as 1 unit? Or where is the 1-unit length? 53
Cemre: Here (pointing the hypotenuse segment of the reference right triangle on the unit 54
circle). 55
Zafer: Uh-huh (nodding his head up and down). 56
Researcher: Please measure it. 57
Cemre: (Measuring the radius of the unit circle. When the result appeared on the screen 58
as 2.78 like in Figure 6.2) hmm… that’s, one unit is two point seventy five 59
centimeter. 60
Zafer: Then, we would transform this from centimeter to unit [length] (pointing the radius 61
measure on the screen like in Figure 6.2). 62
Cemre: Then, we will divide this (pointing the radius measure on the screen) by this 63
(pointing the unit measure on the screen). (Calculating the division of “radius” 64
by “unit” as in Figure 6.2) yes, it is 2-unit (smiling). 65
Zafer: Uh-huh (smiling). 66
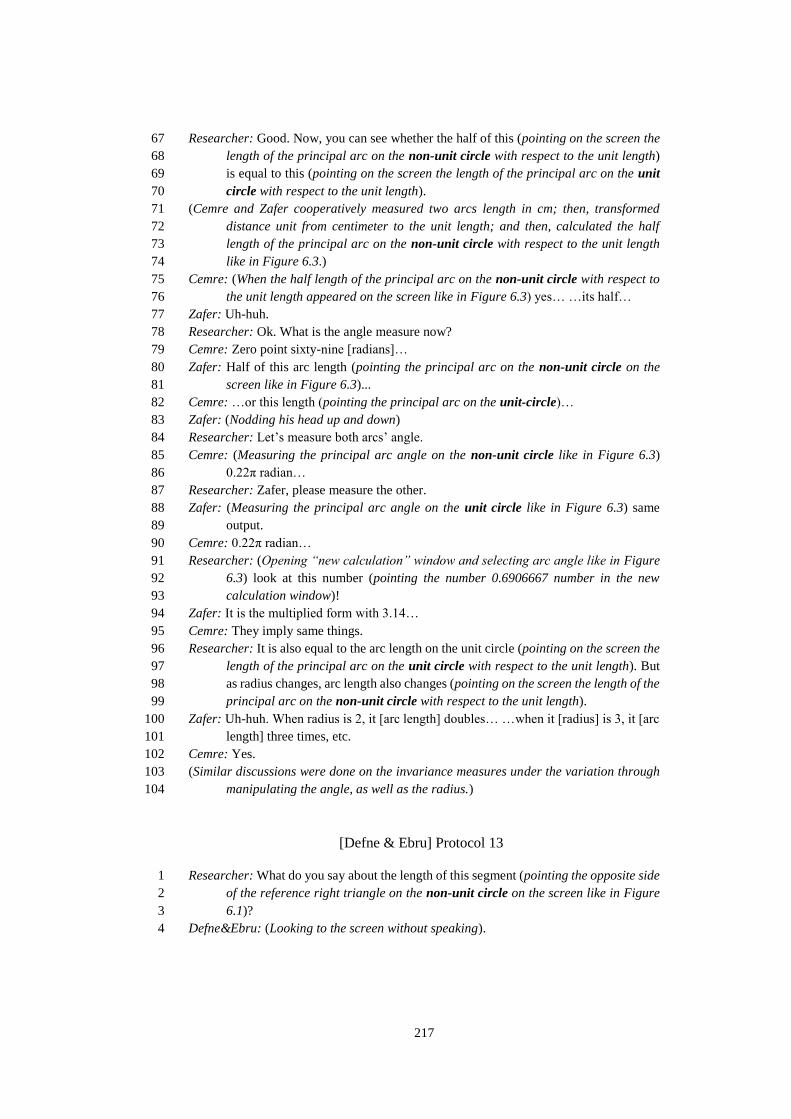
217
Researcher: Good. Now, you can see whether the half of this (pointing on the screen the 67
length of the principal arc on the non-unit circle with respect to the unit length) 68
is equal to this (pointing on the screen the length of the principal arc on the unit 69
circle with respect to the unit length). 70
(Cemre and Zafer cooperatively measured two arcs length in cm; then, transformed 71
distance unit from centimeter to the unit length; and then, calculated the half 72
length of the principal arc on the non-unit circle with respect to the unit length 73
like in Figure 6.3.) 74
Cemre: (When the half length of the principal arc on the non-unit circle with respect to 75
the unit length appeared on the screen like in Figure 6.3) yes… …its half… 76
Zafer: Uh-huh. 77
Researcher: Ok. What is the angle measure now? 78
Cemre: Zero point sixty-nine [radians]… 79
Zafer: Half of this arc length (pointing the principal arc on the non-unit circle on the 80
screen like in Figure 6.3)... 81
Cemre: …or this length (pointing the principal arc on the unit-circle)… 82
Zafer: (Nodding his head up and down) 83
Researcher: Let’s measure both arcs’ angle. 84
Cemre: (Measuring the principal arc angle on the non-unit circle like in Figure 6.3) 85
0.22π radian… 86
Researcher: Zafer, please measure the other. 87
Zafer: (Measuring the principal arc angle on the unit circle like in Figure 6.3) same 88
output. 89
Cemre: 0.22π radian… 90
Researcher: (Opening “new calculation” window and selecting arc angle like in Figure 91
6.3) look at this number (pointing the number 0.6906667 number in the new 92
calculation window)! 93
Zafer: It is the multiplied form with 3.14… 94
Cemre: They imply same things. 95
Researcher: It is also equal to the arc length on the unit circle (pointing on the screen the 96
length of the principal arc on the unit circle with respect to the unit length). But 97
as radius changes, arc length also changes (pointing on the screen the length of the 98
principal arc on the non-unit circle with respect to the unit length). 99
Zafer: Uh-huh. When radius is 2, it [arc length] doubles… …when it [radius] is 3, it [arc 100
length] three times, etc. 101
Cemre: Yes. 102
(Similar discussions were done on the invariance measures under the variation through 103
manipulating the angle, as well as the radius.) 104
[Defne & Ebru] Protocol 13
Researcher: What do you say about the length of this segment (pointing the opposite side 1
of the reference right triangle on the non-unit circle on the screen like in Figure 2
6.1)? 3
Defne&Ebru: (Looking to the screen without speaking). 4
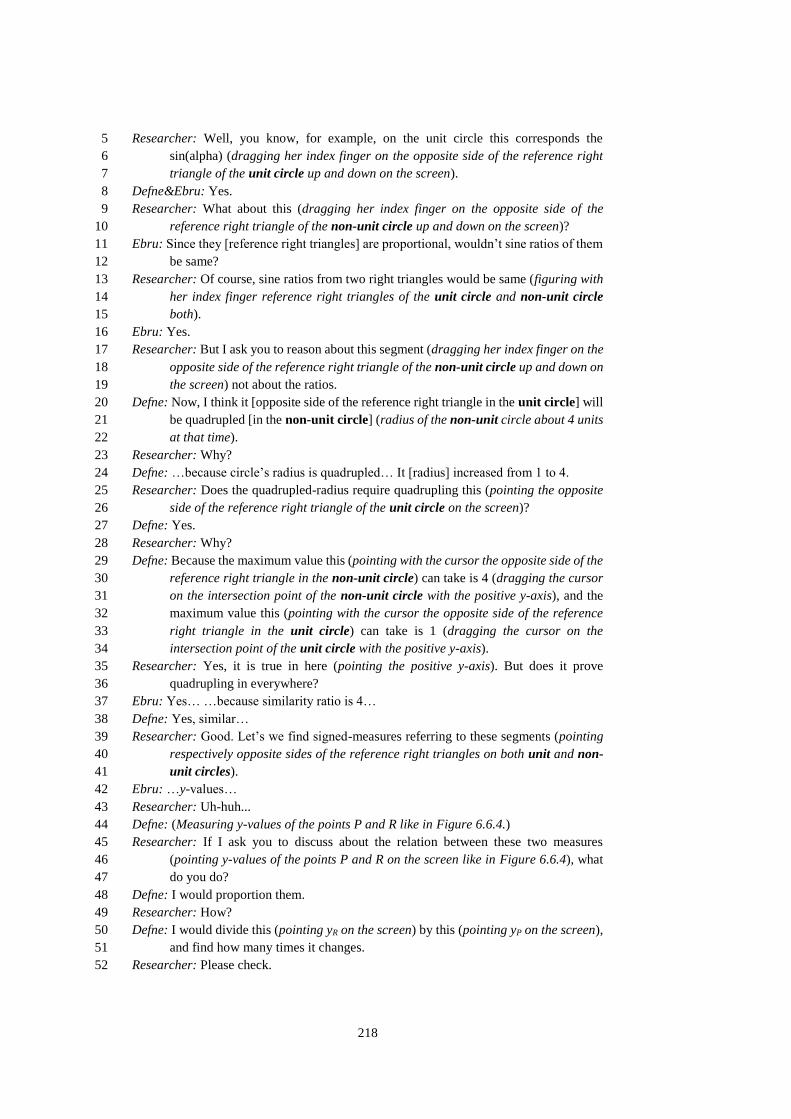
218
Researcher: Well, you know, for example, on the unit circle this corresponds the 5
sin(alpha) (dragging her index finger on the opposite side of the reference right 6
triangle of the unit circle up and down on the screen). 7
Defne&Ebru: Yes. 8
Researcher: What about this (dragging her index finger on the opposite side of the 9
reference right triangle of the non-unit circle up and down on the screen)? 10
Ebru: Since they [reference right triangles] are proportional, wouldn’t sine ratios of them 11
be same? 12
Researcher: Of course, sine ratios from two right triangles would be same (figuring with 13
her index finger reference right triangles of the unit circle and non-unit circle 14
both). 15
Ebru: Yes. 16
Researcher: But I ask you to reason about this segment (dragging her index finger on the 17
opposite side of the reference right triangle of the non-unit circle up and down on 18
the screen) not about the ratios. 19
Defne: Now, I think it [opposite side of the reference right triangle in the unit circle] will 20
be quadrupled [in the non-unit circle] (radius of the non-unit circle about 4 units 21
at that time). 22
Researcher: Why? 23
Defne: …because circle’s radius is quadrupled… It [radius] increased from 1 to 4. 24
Researcher: Does the quadrupled-radius require quadrupling this (pointing the opposite 25
side of the reference right triangle of the unit circle on the screen)? 26
Defne: Yes. 27
Researcher: Why? 28
Defne: Because the maximum value this (pointing with the cursor the opposite side of the 29
reference right triangle in the non-unit circle) can take is 4 (dragging the cursor 30
on the intersection point of the non-unit circle with the positive y-axis), and the 31
maximum value this (pointing with the cursor the opposite side of the reference 32
right triangle in the unit circle) can take is 1 (dragging the cursor on the 33
intersection point of the unit circle with the positive y-axis). 34
Researcher: Yes, it is true in here (pointing the positive y-axis). But does it prove 35
quadrupling in everywhere? 36
Ebru: Yes… …because similarity ratio is 4… 37
Defne: Yes, similar… 38
Researcher: Good. Let’s we find signed-measures referring to these segments (pointing 39
respectively opposite sides of the reference right triangles on both unit and non-40
unit circles). 41
Ebru: …y-values… 42
Researcher: Uh-huh... 43
Defne: (Measuring y-values of the points P and R like in Figure 6.6.4.) 44
Researcher: If I ask you to discuss about the relation between these two measures 45
(pointing y-values of the points P and R on the screen like in Figure 6.6.4), what 46
do you do? 47
Defne: I would proportion them. 48
Researcher: How? 49
Defne: I would divide this (pointing yR on the screen) by this (pointing yP on the screen), 50
and find how many times it changes. 51
Researcher: Please check. 52
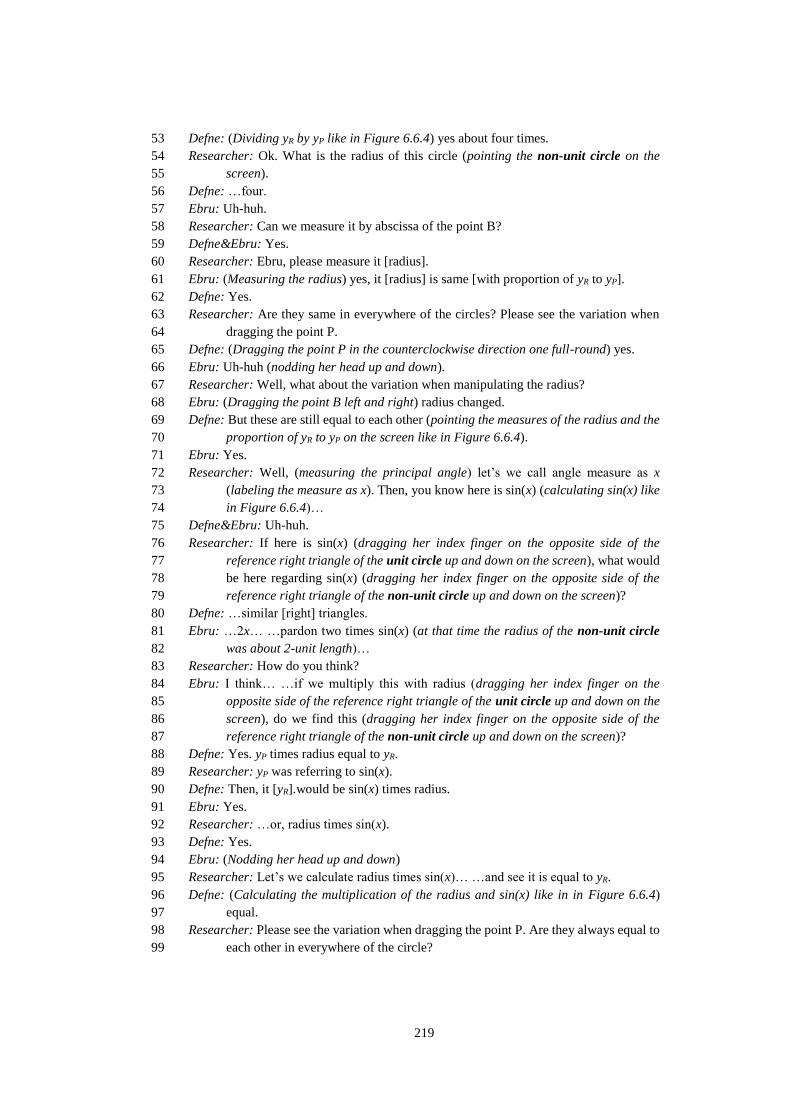
219
Defne: (Dividing yR by yP like in Figure 6.6.4) yes about four times. 53
Researcher: Ok. What is the radius of this circle (pointing the non-unit circle on the 54
screen). 55
Defne: …four. 56
Ebru: Uh-huh. 57
Researcher: Can we measure it by abscissa of the point B? 58
Defne&Ebru: Yes. 59
Researcher: Ebru, please measure it [radius]. 60
Ebru: (Measuring the radius) yes, it [radius] is same [with proportion of yR to yP]. 61
Defne: Yes. 62
Researcher: Are they same in everywhere of the circles? Please see the variation when 63
dragging the point P. 64
Defne: (Dragging the point P in the counterclockwise direction one full-round) yes. 65
Ebru: Uh-huh (nodding her head up and down). 66
Researcher: Well, what about the variation when manipulating the radius? 67
Ebru: (Dragging the point B left and right) radius changed. 68
Defne: But these are still equal to each other (pointing the measures of the radius and the 69
proportion of yR to yP on the screen like in Figure 6.6.4). 70
Ebru: Yes. 71
Researcher: Well, (measuring the principal angle) let’s we call angle measure as x 72
(labeling the measure as x). Then, you know here is sin(x) (calculating sin(x) like 73
in Figure 6.6.4)… 74
Defne&Ebru: Uh-huh. 75
Researcher: If here is sin(x) (dragging her index finger on the opposite side of the 76
reference right triangle of the unit circle up and down on the screen), what would 77
be here regarding sin(x) (dragging her index finger on the opposite side of the 78
reference right triangle of the non-unit circle up and down on the screen)? 79
Defne: …similar [right] triangles. 80
Ebru: …2x… …pardon two times sin(x) (at that time the radius of the non-unit circle 81
was about 2-unit length)… 82
Researcher: How do you think? 83
Ebru: I think… …if we multiply this with radius (dragging her index finger on the 84
opposite side of the reference right triangle of the unit circle up and down on the 85
screen), do we find this (dragging her index finger on the opposite side of the 86
reference right triangle of the non-unit circle up and down on the screen)? 87
Defne: Yes. yP times radius equal to yR. 88
Researcher: yP was referring to sin(x). 89
Defne: Then, it [yR].would be sin(x) times radius. 90
Ebru: Yes. 91
Researcher: …or, radius times sin(x). 92
Defne: Yes. 93
Ebru: (Nodding her head up and down) 94
Researcher: Let’s we calculate radius times sin(x)… …and see it is equal to yR. 95
Defne: (Calculating the multiplication of the radius and sin(x) like in in Figure 6.6.4) 96
equal. 97
Researcher: Please see the variation when dragging the point P. Are they always equal to 98
each other in everywhere of the circle? 99
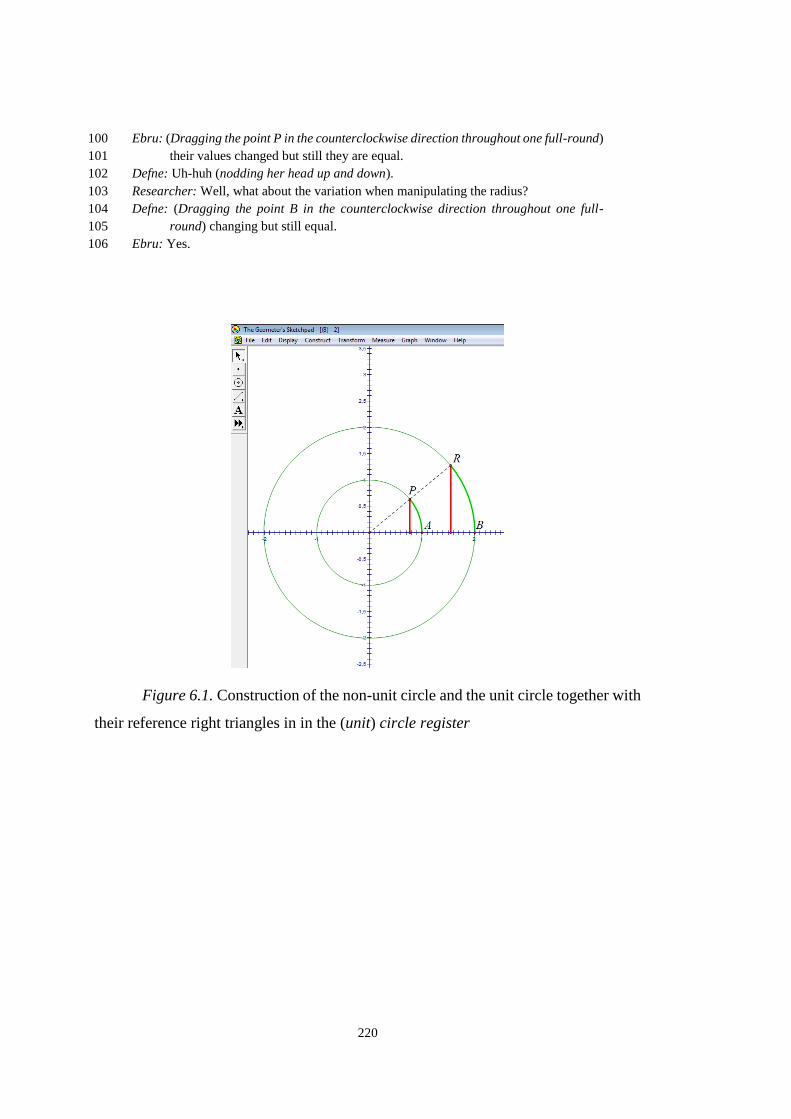
220
Ebru: (Dragging the point P in the counterclockwise direction throughout one full-round) 100
their values changed but still they are equal. 101
Defne: Uh-huh (nodding her head up and down). 102
Researcher: Well, what about the variation when manipulating the radius? 103
Defne: (Dragging the point B in the counterclockwise direction throughout one full-104
round) changing but still equal. 105
Ebru: Yes. 106
Figure 6.1. Construction of the non-unit circle and the unit circle together with
their reference right triangles in in the (unit) circle register

221
Figure 6.2. Assigning a distance different from 1cm as the unit length in the
symbolic register by the aid of the coordinate plane in the (unit) circle register
Figure 6.3. Conversion of the arcs remaining in an angle regarding circles with
different radii in the (unit) circle register into this angle’s measure in radians in the
symbolic register

222
Figure 6.6.4. Generalization of the y-values of the points referring to the same
angle on circles with different radii with respect to sine of this angle in the (unit) circle
register
6.1.1.2. Changed-magnitude in graphical register
In Task 8 [Task 13], after students’ awareness of the variation on the arc angle
and the opposite [adjacent] side of the reference right triangle on the non-unit circle
with respect to their correspondences on the unit circle (see Changed-radius in (unit)
circle register heading), the researcher determined to scrutinize students’ ability to
discriminate the functions mapping the arc angle to the corresponding opposite
[adjacent] side of the reference right triangle on the unit circle and non-unit circle when
dealing simultaneously with their conversions from the (unit) circle register into the
223
graphical register. For this purpose, she provoked them to convert these two functions
[corresponding to sine and r.sine functions] in the (unit) circle register into their
dynamically-linked correspondences in the graphical register via taking “plot as (x,y)”
and “trace point” advantages of GSP; and then, encouraged them to compare and
contrast these functions with each other in a more detailed way in the graphical
register as well (e.g., lines 1-29 in [Cemre & Zafer] Protocol 14).
In Task 8, when the traced r.sine graph in the [0,2π) interval appeared on the
screen, without going into details, Cemre associated this traced graph with the right
first part of the sine graph –corresponding to the first full-round turning in the
counterclockwise direction in the (unit) circle register (lines 1-11 in [Cemre & Zafer]
Protocol 14). But, when reasoning about this traced-graph comparing to that of sine,
all students dissociated it from the sine graph in terms of their magnitudes (e.g., lines
11-35 in [Cemre & Zafer] Protocol 14). Where, while Defne’s and Ebru’s reasoning
in the graphical register was based on the peak points and intersection points of the
graphs, Cemre’s and Zafer’s reasoning was based on the points P' and R' which were
constructed in the graphical register as the dynamically-linked correspondences of the
points P and R in the (unit) circle register (Figure 6.6). Cemre’s and Zafer’s different
focus on reasoning caused Zafer’s consideration of “angle” as the unchanging
component and “corresponding y-values” as the changing components of two
functions in the graphical register (lines 30-34 in [Cemre & Zafer] Protocol 14), as
well as caused Cemre’s attribution of the changed-magnitudes regarding points P' and
R' in the graphical register to the changed-radii regarding these points’ parents in the
(unit) circle register in GSP environment –i.e., points P and R (e.g., lines 30-35 in
[Cemre & Zafer] Protocol 14). While Zafer’s this consideration prompted him to
establish the proportional –sixfold– relation between the y-values of the points P' and
R' in the symbolic register (lines 42-50 in [Cemre & Zafer] Protocol 14), Cemre’s this
attribution prompted her to attribute the coefficient of the 6.sine function in the
symbolic register to the radius of the six-unit circle in the (unit) circle register (lines
51-52 in [Cemre & Zafer] Protocol 14). On the other hand, Defne and Ebru did not
independently contribute to the discussion with their reasoning about these kinds of
relations including conversions of the changed-components in different
224
representational registers until researcher’s provocation of them to reason about these
aspects. When the researcher asked them to reason about the relations both between
and within the registers, Defne and Ebru were able to establish these relations, as well.
However, unlike Cemre’s directly association of the coefficient of the 6.sine
function in the symbolic register with the radius of the six-unit circle in the (unit) circle
register (lines 51-52 in [Cemre & Zafer] Protocol 14), all other students’ indirectly
association was observed. That is, they attributed the coefficient of a.sine function in
the symbolic register primarily to the magnitude in the graphical register (e.g., 51-54
in [Cemre & Zafer] Protocol 14) secondarily to the radius of the non-unit circle in the
(unit) circle register (e.g., 51-56 in [Cemre & Zafer] Protocol 14). At this point, in
order to ease students’ direct-association between the (unit) circle register and the
symbolic register, the researcher encouraged them to reason about the symbolic
expression of the visual function on the non-unit circle mapping the principal arc to
the corresponding y-value (e.g., lines 58-62 in [Cemre & Zafer] Protocol 14). Where,
it was observed that none of the students had trouble on expressing this function
symbolically (e.g., lines 63-67 in [Cemre & Zafer] Protocol 14). However, in here,
except Cemre, none of the other students mentioned the relation between the radius of
the non-unit circle and the coefficient of the function, yet. So, the researcher
encouraged them to reason about these aspects under the manipulation of the radius of
the non-unit circle hoping to provide students with awareness of the role of the radius
in the symbolic expression (e.g., lines 1-19 in [Cemre & Zafer] Protocol 15). Where,
it was observed that students were able to correctly revise the function’s symbolic
expression regarding the changed-radius (e.g., lines 18-21 in [Cemre & Zafer] Protocol
15). Moreover, they were aware of this revised-function’s correspondence in the
graphical register (e.g., lines 22-25 in [Cemre & Zafer] Protocol 15). Furthermore,
they were able to express this function’s symbolic form regarding the radius (e.g., lines
26-28 in [Cemre & Zafer] Protocol 15). And then, when investigating the dynamically-
linked components in different registers under the manipulation of the radius and the
angle’s openness, they were able to generalize their reasoning about the relations
among “changed-radius” in the (unit) circle register, “changed-magnitudes” in the

225
graphical register and “changed-coefficient r of the r.sine function” in the symbolic
register (e.g., lines 29-36 and 62-71 in [Cemre & Zafer] Protocol 15).
At that point of Task 8, Cemre and Zafer showed more advanced reasoning
about these general relations (among radius, magnitude and coefficient a) than the
reasoning of Defne and Ebru through extending their reasoning over the patterns of
the changes. In the first instance, when investigating the variation of the r.sine graph
under the manipulation of the radius, Zafer was concerned about the limit case of the
radius –i.e., r=0 condition. That is, through focusing on the pattern of the dynamically-
changed graph of the function in the graphical register, he considered the graph in this
case as the line-shaped (lines 32-39 in [Cemre & Zafer] Protocol 15). However, Cemre
objected to Zafer’s this reasoning through focusing on the pattern of the dynamically-
changed visual representation of the function in the (unit) circle register (lines 40-45
in [Cemre & Zafer] Protocol 15). At that point, the researcher encouraged them to
consider the symbolic expression of the function (lines 46-47 in [Cemre & Zafer]
Protocol 15). Where, both Cemre and Zafer were able to interpret the function in the
limit case of the changed-radius in the (unit) circle register as the zero-function in
the symbolic register and as the x-axis in the graphical register based on the symbolic
expression of the function (lines 46-54 and 72-75 in [Cemre & Zafer] Protocol 15).
In the second instance, when the researcher encouraged them to reason about
the negative coefficient of “–sine” function (lines 74-75 in [Cemre & Zafer] Protocol
15), Cemre’s different point of view emerged in the graphical register. After reasoning
about the shape of “–sine” function’s graph as the reflection of the sine graph regarding
the x-axis (lines 76-86 in [Cemre & Zafer] Protocol 15), she considered “–sine”
function in the graphical register as the parallel displacement of the sine graph along
the x-axis by the π-length in the positive direction (lines 90-103 in [Cemre & Zafer]
Protocol 15). On the other hand, Zafer’s reasoning was observed again based on the
pattern of the dynamically-changed graph of the function in the graphical register
regarding the coefficient-decrease (lines 87-89 in [Cemre & Zafer] Protocol 15). That
is, his actions imply that he reasoned about the negative coefficient of the sine function
in the graphical register through extending the decreasing-pattern of the y-value of the

226
graph’s peak point on π/2 regarding the decreasing-positive-coefficient of sine into the
decreasing-negative coefficient of sine. In addition, Zafer also reasoned in the same
way with Cemre but through being affected by her reasoning (lines 90-104 in [Cemre
& Zafer] Protocol 15). At that point, the researcher constructed a parallel line from the
point P' to the x-axis in order to discuss the parallel displacement of the graphs based
on transformations between the sine and –sine functions in a more detailed way in the
symbolic register as well (Figure 6.9). And then, she encouraged them to establish
relations between the coordinates of the point P' and its parallel displacement along
the x-axis by the π-length in the negative direction (lines 105-114 in [Cemre & Zafer]
Protocol 15). Where, it was observed that both Cemre and Zafer were able to express
these points’ abscissas with respect to each other, as well as the equality of their
ordinates in the symbolic register (lines 105-133 and 176-186 in [Cemre & Zafer]
Protocol 15). Moreover, they were able to correctly reason in the graphical register
about the positions of the points defined in the symbolic register through taking the
abscissa of the point P' or its parallel displacement point P'' as the reference (Figure
6.10); such as the position of (x-π, sin(x)) considering the abscissa of the point P' as x,
and the position of (x+π, –sin(x)) considering the abscissa of the point P'' as x (lines
140-146 in [Cemre & Zafer] Protocol 15). Where, they were able to easily determine
that the position of the ordered pair (x-π, sin(x)) [(x+π, –sin(x))] was the point P'' [P']
which was a point on the –sine [sine] graph. At this point, it was observed a distinct
shift on their reasoning about the relation between the sine and –sine functions through
seeing the point P' [P''] on the sine [–sine] graph as a point on the –sine [sine]
function’s parallel displacement along the x-axis by the π-length in the positive
[negative] direction. That is to say, they had just started to reason about the equality
between sin(x) and –sin(x-π) (lines 140-165 in [Cemre & Zafer] Protocol 15), as well
as the equality between –sin(x) and sin(x+π) (lines 176-191 in [Cemre & Zafer]
Protocol 15) in the symbolic register.
On the other hand, due to their unwillingness to participate the discussions
towards the end of Task 8, the researcher determined to postpone the discussions with
Defne and Ebru about the non-positive coefficients of sine to the following episode.
At the beginning of Task 9, the researcher encouraged them to interpret a.sine function
227
in terms of the effect of the coefficient a in the symbolic register on the shape of the
graph in the graphical register (lines 1-16 in [Defne & Ebru] Protocol 14). When
investigating the dynamic-variation of the a.sine graph under the manipulation of the
coefficient a by a slider (Figure 6.13), it was observed that Defne and Ebru were able
to reason about the changing pattern of the a.sine graph regarding the variation of the
positive coefficient a through focusing on the peak points (lines 17-29 in [Defne &
Ebru] Protocol 14). On the other hand, despite of their interpretations about the
changed-direction of the peak points of the graph for the negative coefficient (lines 30-
38 in [Defne & Ebru] Protocol 14), none of them was able to reason about the cause
of this variation (lines 39-40 in [Defne & Ebru] Protocol 14). So, the researcher
encouraged them to consider the negative coefficient on “–sine” function (lines 41-43
in [Defne & Ebru] Protocol 14). Where, both Defne and Ebru interpreted “–sine”
function as the opposite of the sine function based on their symmetrical graphs
regarding the x-axis (lines 44-47 in [Defne & Ebru] Protocol 14). However, unlike
Cemre and Zafer, Defne and Ebru did not consider the graphs of –sine and sine as the
parallel displacement of each other along the x-axis by the π-length. But, they were
able to interpret, for example, -3.sine function in the graphical register based on two
steps: (i) considering 3 as the magnitude of the graph, and (ii) considering the minus
sign as the opposite direction of the peak points to those of 3.sine regarding the x-axis
(lines 48-55 in [Defne & Ebru] Protocol 14). Moreover, by the aid of the slider, they
were able to interpret the a.sine function in case of the zero-coefficient as the x-axis
in the graphical register and as the zero-function in the symbolic register (lines 56-
64 in [Defne & Ebru] Protocol 14).
Where, the researcher preferred not to discuss about the meaning of the non-
positive coefficients of sine in the (unit) circle register until students’ awareness of
defining a new function related to sine regarding all possible visual-changes in the
(unit) circle register; in addition to the changed-radius (theme of Task 8); the
changed-center (theme of Task 9), and the changed-arc referring to the input of sine
[cosine] (themes of Task 10 and Task 11). So, the subsequent progress of students’
concept images on the non-positive coefficients of sine in the (unit) circle register was

228
presented under the sub-headings Changed-arc with a constant difference in (unit)
circle register and Changed-arc through folding angle in (unit) circle register.
[Cemre & Zafer] Protocol 14
(Students constructed (x,r.sin(x)) ordered-pair taking advantages of the plot as (x,y) 1
option of GSP and labelled as R'; and then, constructed perpendicular lines from 2
this point to the coordinate axes; finally, constructed r.sine graphs in the [0,2π) 3
interval through tracing the point R' like in Figure 6.5 by the researcher’s 4
directions.) 5
Researcher: Let’s we drag the point P. 6
Zafer: (Dragging the point P about 15-second without speaking) yes, these two are equal 7
to each other (pointing the red segments corresponding to the opposite side of the 8
reference right triangle on the non-unit circle and the perpendicular segment 9
from the point R' on the r.sin(x) graph to the x-axis). 10
Cemre: Wasn’t this [traced graph] first period of sine? 11
Zafer: No. (After 4-second pause) it’s not that of sine… …it’s that of six times of sine (at 12
that time the radius of the non-unit circle was about 6-unit). 13
Cemre: Oh yeah, it is first period of sine’s six times… 14
Researcher: If we drew it for sine, how would be the graph? 15
Zafer: Then, from one… …it would be like that (figuring with his index finger the right-16
first part of the sine graph corresponding to the first full-round turning in the 17
counterclockwise direction). 18
Cemre: It [a y-value on the graph] would be between minus one and plus one, but in here, 19
due to six times of sine, it [GSP] drew regarding that. 20
Zafer: Uh-huh. 21
Researcher: Let’s we draw it [sine]. 22
(Students constructed (x,sin(x)) ordered-pair taking advantages of the plot as (x,y) option 23
of GSP and labelled it as P'; and then, constructed perpendicular lines from this 24
point to the coordinate axes; finally, constructed sine graph in the [0,2π) interval 25
through tracing the point P' like in Figure 6.6 by the researcher’s directions.) 26
Researcher: Let’s we drag the point P. 27
Zafer: It would be at most one… 28
Cemre: (Dragging the point P and looking to the screen without speaking) 29
Researcher: How was changed the sine graph? 30
Zafer: Angle didn’t change… …only values that sine took (indicating a magnitude 31
through putting with his right and left hands horizontally parallel to each other) 32
increased six-times (indicating a larger magnitude through horizontally moving 33
his hands away from each other). 34
Cemre: …as a result of radius… 35
Researcher: Ok. What else? 36
Cemre: Period didn’t change. 37
Zafer: Yes. 38
Researcher: What is the period? 39
Zafer: Again 2π… 40
Cemre: 2π. 41
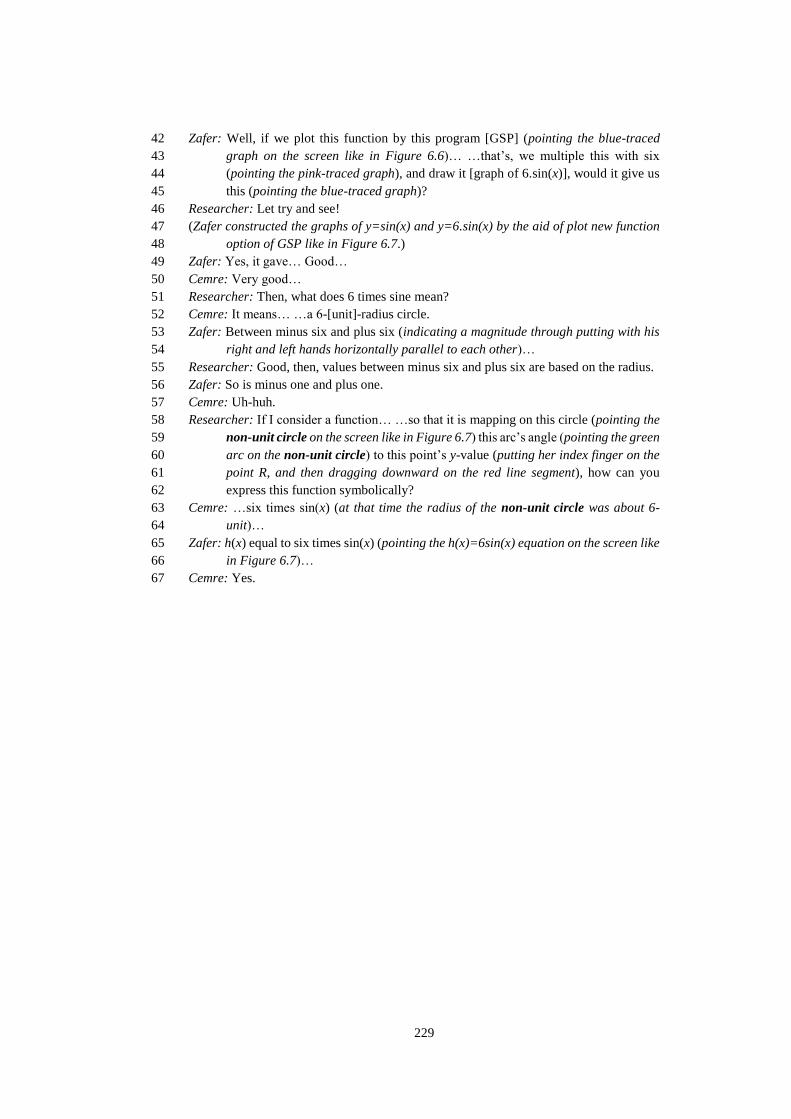
229
Zafer: Well, if we plot this function by this program [GSP] (pointing the blue-traced 42
graph on the screen like in Figure 6.6)… …that’s, we multiple this with six 43
(pointing the pink-traced graph), and draw it [graph of 6.sin(x)], would it give us 44
this (pointing the blue-traced graph)? 45
Researcher: Let try and see! 46
(Zafer constructed the graphs of y=sin(x) and y=6.sin(x) by the aid of plot new function 47
option of GSP like in Figure 6.7.) 48
Zafer: Yes, it gave… Good… 49
Cemre: Very good… 50
Researcher: Then, what does 6 times sine mean? 51
Cemre: It means… …a 6-[unit]-radius circle. 52
Zafer: Between minus six and plus six (indicating a magnitude through putting with his 53
right and left hands horizontally parallel to each other)… 54
Researcher: Good, then, values between minus six and plus six are based on the radius. 55
Zafer: So is minus one and plus one. 56
Cemre: Uh-huh. 57
Researcher: If I consider a function… …so that it is mapping on this circle (pointing the 58
non-unit circle on the screen like in Figure 6.7) this arc’s angle (pointing the green 59
arc on the non-unit circle) to this point’s y-value (putting her index finger on the 60
point R, and then dragging downward on the red line segment), how can you 61
express this function symbolically? 62
Cemre: …six times sin(x) (at that time the radius of the non-unit circle was about 6-63
unit)… 64
Zafer: h(x) equal to six times sin(x) (pointing the h(x)=6sin(x) equation on the screen like 65
in Figure 6.7)… 66
Cemre: Yes. 67
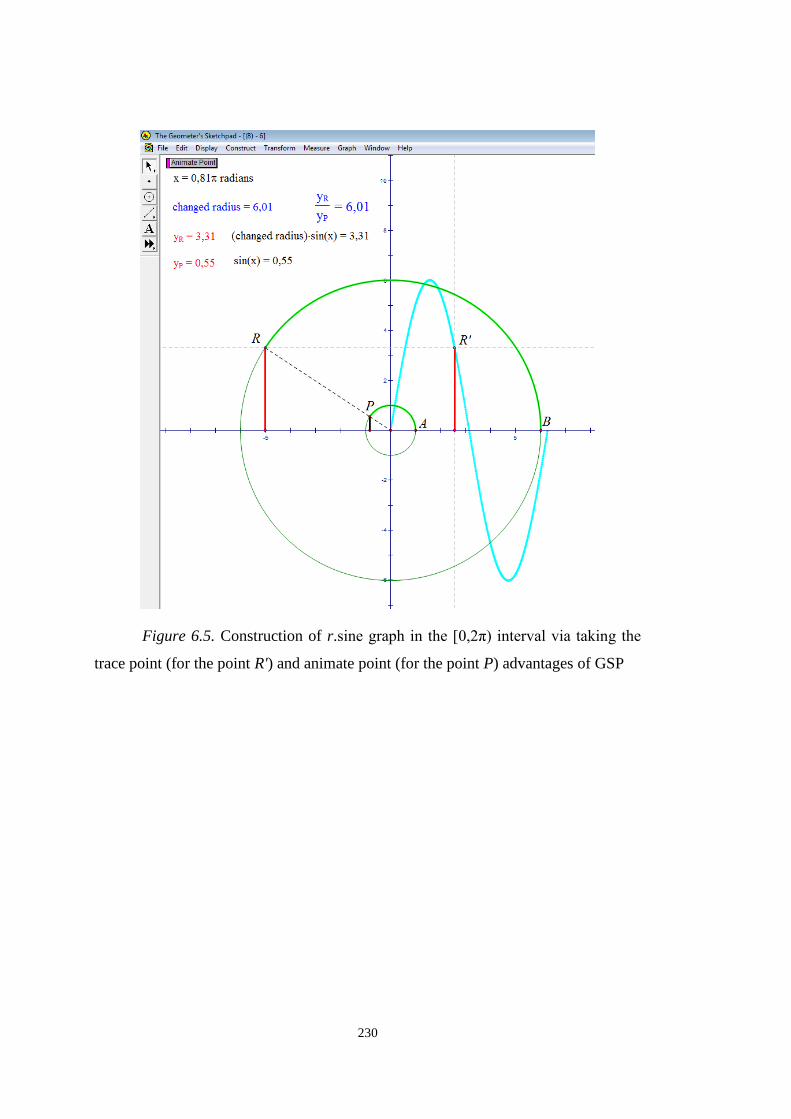
230
Figure 6.5. Construction of r.sine graph in the [0,2π) interval via taking the
trace point (for the point R') and animate point (for the point P) advantages of GSP
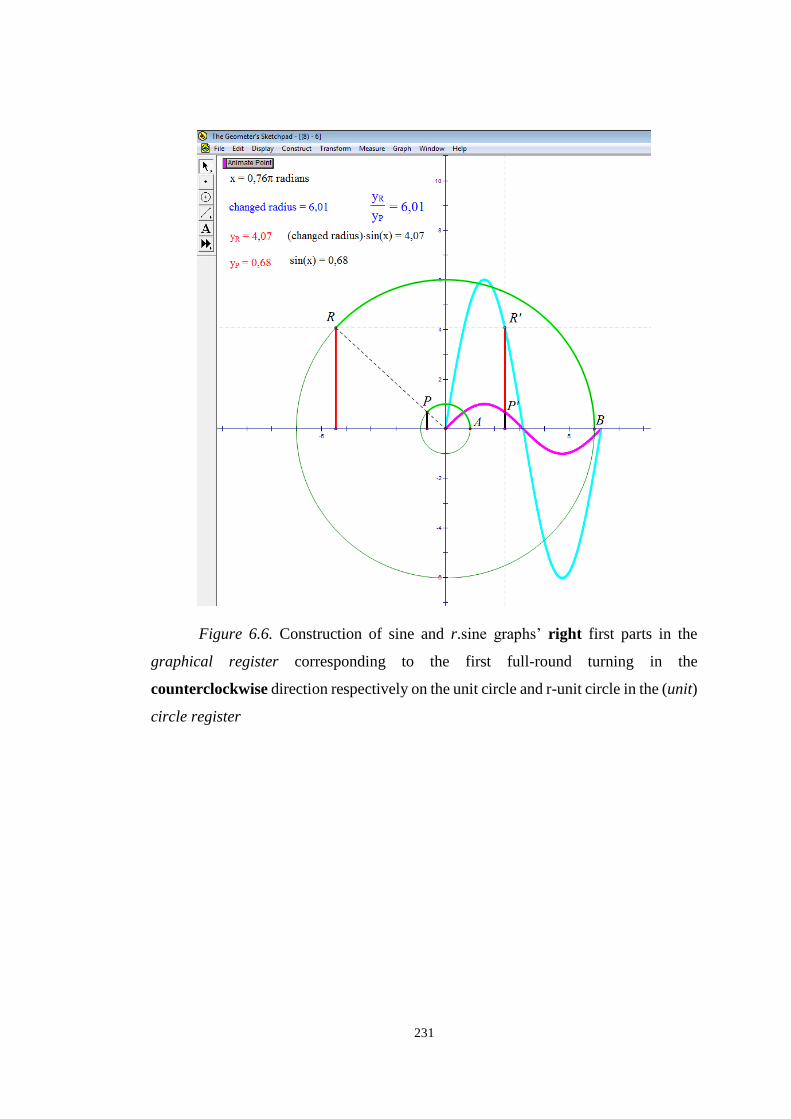
231
Figure 6.6. Construction of sine and r.sine graphs’ right first parts in the
graphical register corresponding to the first full-round turning in the
counterclockwise direction respectively on the unit circle and r-unit circle in the (unit)
circle register

232
Figure 6.7. Construction of the sine and 6.sine graphs with their extended
domains from [0,2π) to the x-axis
[Cemre & Zafer] Protocol 15
Researcher: Let’s we change the radius of this circle (pointing the non-unit circle on the 1
screen, and changing the radius as about 3 like in Figure 6.8). I am erasing all 2
traces (erasing all traces). 3
Cemre: [points P' and R'] re-trace… 4
Researcher: Yes (animating the point P and constructing the new-traces like in Figure 5
6.8 in case the radius of the non-unit circle was about 3). Look! How was changed 6
our graph? Its magnitude decreased from 6. 7
Cemre&Zafer: Yes. 8
Researcher: What is its maximum value? 9
Cemre: About 3… 10
Researcher: What is radius? 11

233
Cemre: 2.98… 12
Zafer: Uh-huh (nodding his head up and down). 13
Researcher: So, this graph was shaped as a result of the circle. How was it? Whose radius 14
was…? 15
Cemre: 2.98… 16
Zafer: (Nodding his head up and down). 17
Researcher: Zafer’s function in here (pointing on the screen h(x)=6sin(x))… What would 18
it be now (in that time the radius was about 3)? 19
Cemre: Instead of six [times sin(x)], it would be 3 [times sin(x)]. 20
Zafer: …radius (nodding his head up and down)… 21
Researcher: Will 3.sin(x) overlap with our traced graph part? 22
Cemre&Zafer: Yes. 23
Researcher: (Editing h(x)=6sin(x) function as h(x)=3sin(x) like in Figure 6.8). 24
Cemre&Zafer: …overlapped. 25
Researcher: Well, how do you express this function regarding radius? 26
Zafer: …radius times sin(x). 27
Cemre: Yes. 28
Researcher: (Plotting new function g(x)=(changed radius)sin(x)). 29
Cemre: Yes. 30
Zafer: Uh-huh (nodding his head up and down). 31
Researcher: (After 4-second pause) now, I will change the radius? Please look how would 32
change the graph? 33
Zafer: (When the researcher changed the radius through dragging the point B, looking 34
to the dynamically-linked-change of the r.sin(x) graph) wow! 35
Cemre: (Smiling). 36
Zafer: (When the radius decreasing up to zero, or the point B coming closer to the origin, 37
looking to the dynamically-linked change of the r.sin(x) graph in terms of the 38
magnitude) in here, is it [graph of r.sin(x)] linear… …or, very straight… 39
Researcher: (Stopping to drag the point B so that the radius of the non-unit circle could 40
very close to zero) how would it be? 41
Cemre&Zafer: (Looking to the screen without speaking) 42
Researcher: What is the radius at that time? 43
Zafer: Zero… 44
Cemre: …but radius mustn’t zero! Then, it isn’t a circle… …it would be a point. 45
Researcher: Yes. How did we define the function g (pointing the g function’s symbolic 46
expression on the screen)? 47
Zafer: Radius times sin(x)… 48
Cemre: Yes. 49
Researcher: What was the radius at that time? 50
Cemre: Zero… 51
Researcher: If I use zero for the radius, then what would be the multiplication of sin(x) 52
with zero? 53
Cemre&Zafer: Zero. 54
Researcher: Good. Then, our function would be g(x) equal to zero, doesn’t it? 55
Cemre&Zafer: Yes. 56
Researcher: In that time, this graph would be the y=0 line (dragging her index finger on 57
the x-axis left and right). 58
Zafer: If radius differs from zero, then it [graph of r.sin(x)] isn’t linear. 59
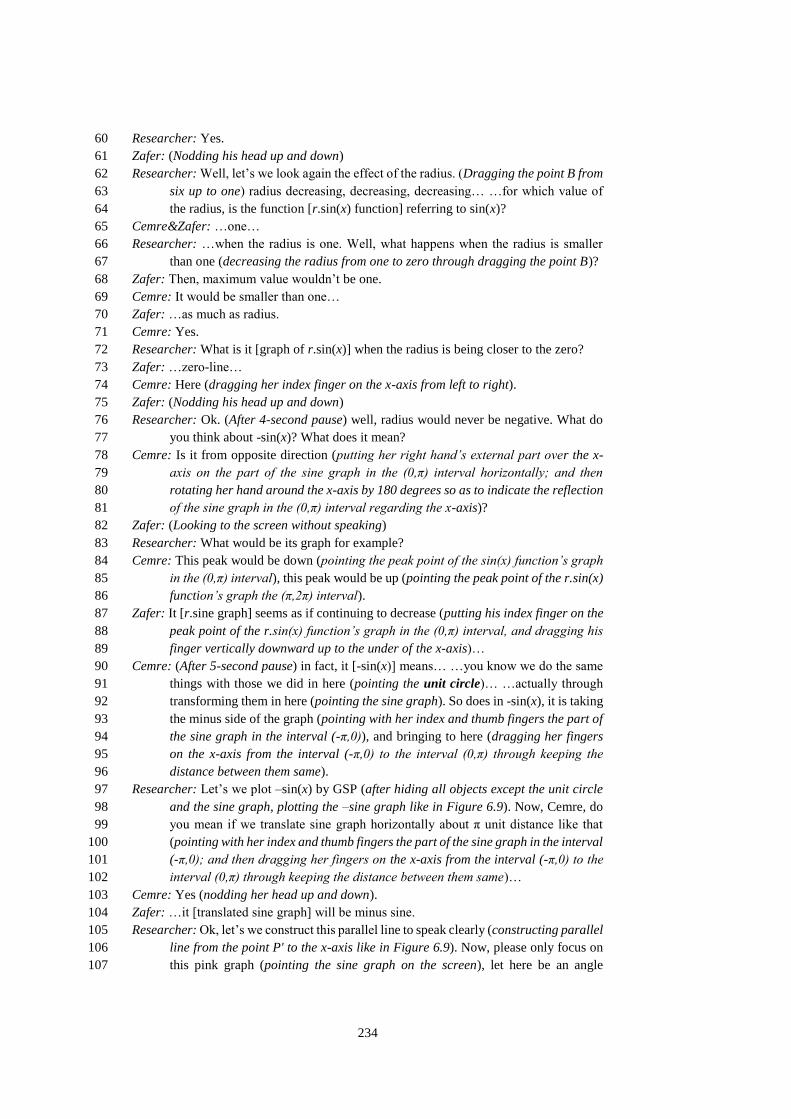
234
Researcher: Yes. 60
Zafer: (Nodding his head up and down) 61
Researcher: Well, let’s we look again the effect of the radius. (Dragging the point B from 62
six up to one) radius decreasing, decreasing, decreasing… …for which value of 63
the radius, is the function [r.sin(x) function] referring to sin(x)? 64
Cemre&Zafer: …one… 65
Researcher: …when the radius is one. Well, what happens when the radius is smaller 66
than one (decreasing the radius from one to zero through dragging the point B)? 67
Zafer: Then, maximum value wouldn’t be one. 68
Cemre: It would be smaller than one… 69
Zafer: …as much as radius. 70
Cemre: Yes. 71
Researcher: What is it [graph of r.sin(x)] when the radius is being closer to the zero? 72
Zafer: …zero-line… 73
Cemre: Here (dragging her index finger on the x-axis from left to right). 74
Zafer: (Nodding his head up and down) 75
Researcher: Ok. (After 4-second pause) well, radius would never be negative. What do 76
you think about -sin(x)? What does it mean? 77
Cemre: Is it from opposite direction (putting her right hand’s external part over the x-78
axis on the part of the sine graph in the (0,π) interval horizontally; and then 79
rotating her hand around the x-axis by 180 degrees so as to indicate the reflection 80
of the sine graph in the (0,π) interval regarding the x-axis)? 81
Zafer: (Looking to the screen without speaking) 82
Researcher: What would be its graph for example? 83
Cemre: This peak would be down (pointing the peak point of the sin(x) function’s graph 84
in the (0,π) interval), this peak would be up (pointing the peak point of the r.sin(x) 85
function’s graph the (π,2π) interval). 86
Zafer: It [r.sine graph] seems as if continuing to decrease (putting his index finger on the 87
peak point of the r.sin(x) function’s graph in the (0,π) interval, and dragging his 88
finger vertically downward up to the under of the x-axis)… 89
Cemre: (After 5-second pause) in fact, it [-sin(x)] means… …you know we do the same 90
things with those we did in here (pointing the unit circle)… …actually through 91
transforming them in here (pointing the sine graph). So does in -sin(x), it is taking 92
the minus side of the graph (pointing with her index and thumb fingers the part of 93
the sine graph in the interval (-π,0)), and bringing to here (dragging her fingers 94
on the x-axis from the interval (-π,0) to the interval (0,π) through keeping the 95
distance between them same). 96
Researcher: Let’s we plot –sin(x) by GSP (after hiding all objects except the unit circle 97
and the sine graph, plotting the –sine graph like in Figure 6.9). Now, Cemre, do 98
you mean if we translate sine graph horizontally about π unit distance like that 99
(pointing with her index and thumb fingers the part of the sine graph in the interval 100
(-π,0); and then dragging her fingers on the x-axis from the interval (-π,0) to the 101
interval (0,π) through keeping the distance between them same)… 102
Cemre: Yes (nodding her head up and down). 103
Zafer: …it [translated sine graph] will be minus sine. 104
Researcher: Ok, let’s we construct this parallel line to speak clearly (constructing parallel 105
line from the point P' to the x-axis like in Figure 6.9). Now, please only focus on 106
this pink graph (pointing the sine graph on the screen), let here be an angle 107

235
(dragging the point P on the unit circle so as the dynamically-linked point P' to 108
be in the (0,π) interval; and then putting her index finger on the projection point 109
of P on the x-axis)… …then, its sine (pointing the perpendicular line segment from 110
the point P' to the x-axis through putting her index and thumb fingers on its 111
endpoints), will be same with what on this blue graph (translating her fingers 112
simultaneously along the x-axis by the π-length line segment in the negative 113
direction)? 114
Cemre: π less than [it]… 115
Zafer: π less… 116
Researcher: So, what would this point’s coordinates be (pointing the point on the –sine 117
graph which is the parallel displacement of the point P' on the sine graph along 118
the x-axis by the π-length line segment in the negative direction on the screen like 119
in Figure 6.9)? What is its abscissa? 120
Zafer: …its π less (putting his index finger on the projection point of the point P' on the 121
x-axis; and then, dragging his finger on the x-axis in the negative direction up to 122
the projection of the point on the –sine graph which is the parallel displacement 123
of the point P' on the sine graph along the x-axis by the π-length line segment in 124
the negative direction). 125
Cemre: …angle minus π… 126
Researcher: If we call this angle as x (putting her index finger on the projection point of 127
the point P' on the x-axis), how do you express this one symbolically (pointing the 128
projection point of the parallel displacement of the point P' along the x-axis by –129
π on the screen like in Figure 6.9)? 130
Cemre&Zafer: …x minus π… 131
Researcher: (Calculating x- π like in Figure 6.9) ok. What about the y-value of this point 132
(pointing the parallel displacement of the point P' along the x-axis by –π which is 133
on the –sine graph)? 134
Zafer: Same with this (pointing the perpendicular line segment from the point P' to the 135
x-axis). 136
Cemre: Yes. 137
Researcher: How do you express it as symbolically? 138
Cemre&Zafer: …sin(x)… 139
Researcher: Then, if I construct a point so as its abscissa to be (x-π) and ordinate to be 140
sin(x), is it here (pointing the parallel displacement of the point P' along the x-axis 141
by –π)? 142
Cemre&Zafer: Yes. 143
Researcher: (Constructing the (x-π,sin(x)) ordered-pair taking advantages of the plot as 144
(x,y) option of GSP and labelling with P'' like in Figure 6.10). 145
Cemre&Zafer: Yes (smiling). 146
Researcher: Ok. This pink graph (pointing the sine graph on the screen like in Figure 147
6.10) was the graph of whom? 148
Cemre&Zafer: …sine… 149
Researcher: Sine graph. Then, how do you express this value (pointing the perpendicular 150
line segment from the point P' to the x-axis)? 151
Cemre: This angle’s sine value (pointing the projection of the point P' on the x-axis)… 152
Zafer: …sin(x)… 153
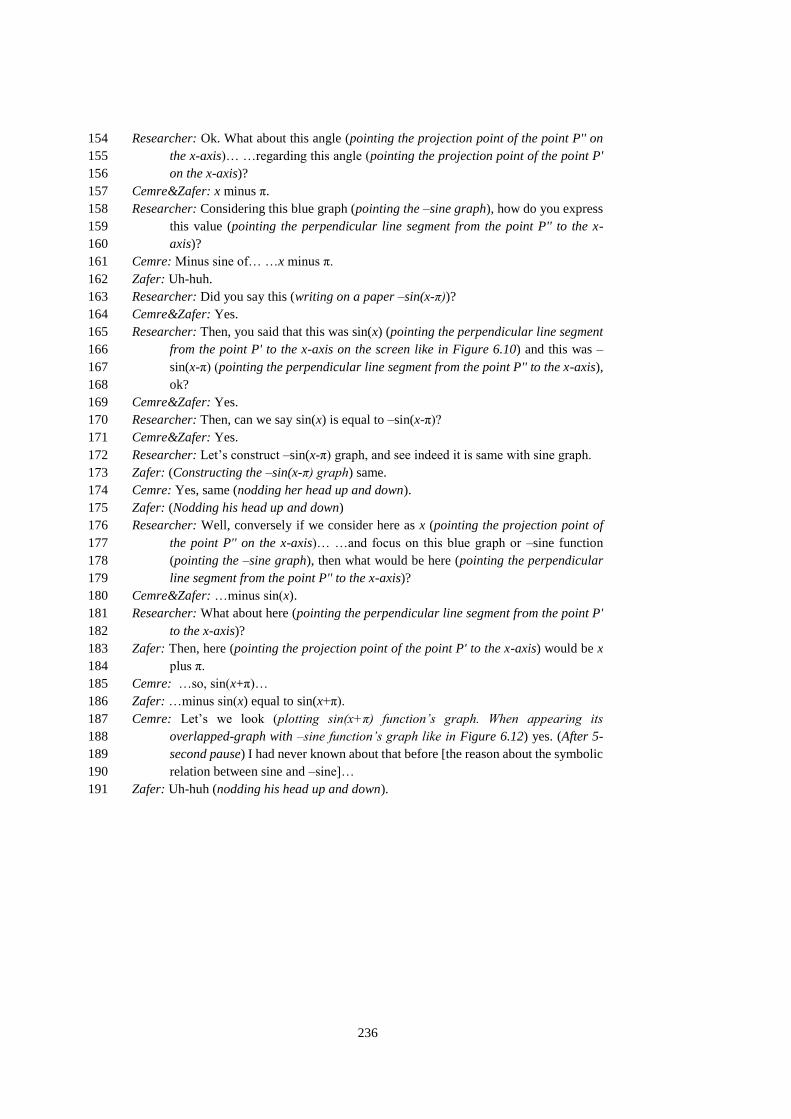
236
Researcher: Ok. What about this angle (pointing the projection point of the point P'' on 154
the x-axis)… …regarding this angle (pointing the projection point of the point P' 155
on the x-axis)? 156
Cemre&Zafer: x minus π. 157
Researcher: Considering this blue graph (pointing the –sine graph), how do you express 158
this value (pointing the perpendicular line segment from the point P'' to the x-159
axis)? 160
Cemre: Minus sine of… …x minus π. 161
Zafer: Uh-huh. 162
Researcher: Did you say this (writing on a paper –sin(x-π))? 163
Cemre&Zafer: Yes. 164
Researcher: Then, you said that this was sin(x) (pointing the perpendicular line segment 165
from the point P' to the x-axis on the screen like in Figure 6.10) and this was –166
sin(x-π) (pointing the perpendicular line segment from the point P'' to the x-axis), 167
ok? 168
Cemre&Zafer: Yes. 169
Researcher: Then, can we say sin(x) is equal to –sin(x-π)? 170
Cemre&Zafer: Yes. 171
Researcher: Let’s construct –sin(x-π) graph, and see indeed it is same with sine graph. 172
Zafer: (Constructing the –sin(x-π) graph) same. 173
Cemre: Yes, same (nodding her head up and down). 174
Zafer: (Nodding his head up and down) 175
Researcher: Well, conversely if we consider here as x (pointing the projection point of 176
the point P'' on the x-axis)… …and focus on this blue graph or –sine function 177
(pointing the –sine graph), then what would be here (pointing the perpendicular 178
line segment from the point P'' to the x-axis)? 179
Cemre&Zafer: …minus sin(x). 180
Researcher: What about here (pointing the perpendicular line segment from the point P' 181
to the x-axis)? 182
Zafer: Then, here (pointing the projection point of the point P' to the x-axis) would be x 183
plus π. 184
Cemre: …so, sin(x+π)… 185
Zafer: …minus sin(x) equal to sin(x+π). 186
Cemre: Let’s we look (plotting sin(x+π) function’s graph. When appearing its 187
overlapped-graph with –sine function’s graph like in Figure 6.12) yes. (After 5-188
second pause) I had never known about that before [the reason about the symbolic 189
relation between sine and –sine]… 190
Zafer: Uh-huh (nodding his head up and down). 191

237
Figure 6.8. Construction of the generalized r.sine graph together with its
aritmetic form (e.g., h(x)=3.sin(x) in case the radius was about 3) in order to ease the
conversion of the sine and r.sine functions between the (unit) circle register and the
graphical register
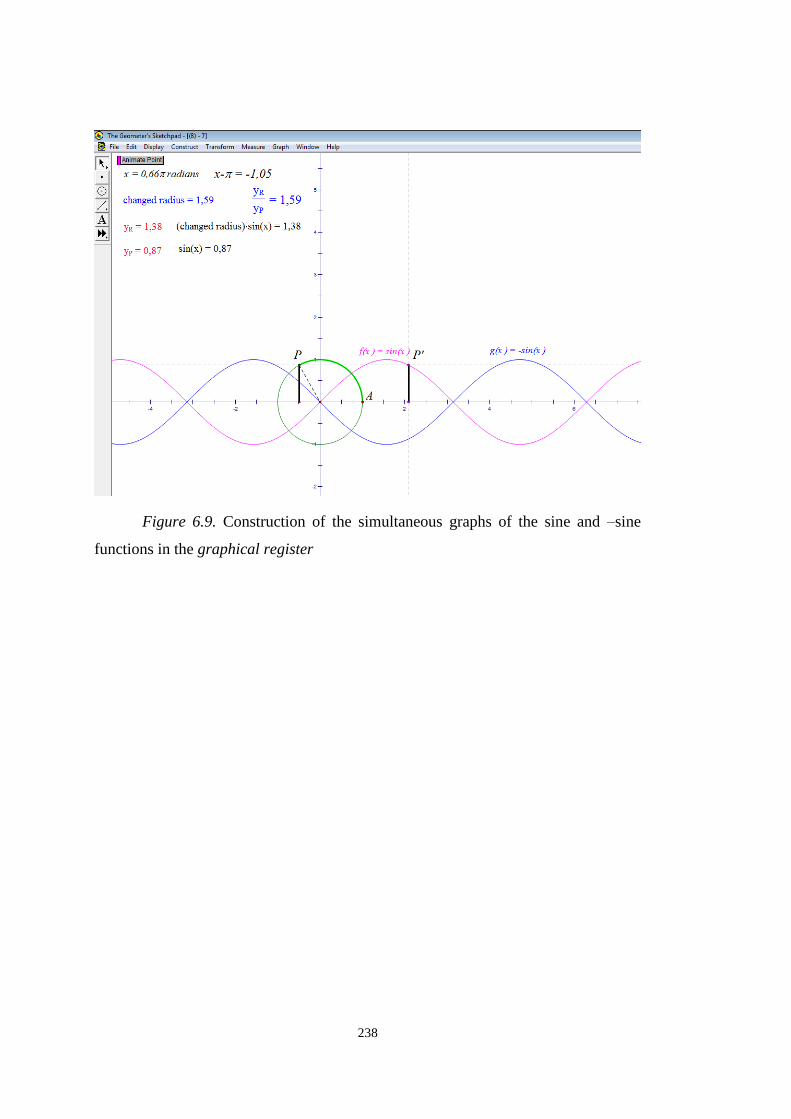
238
Figure 6.9. Construction of the simultaneous graphs of the sine and –sine
functions in the graphical register

239
Figure 6.10. Construction of the parallel displacement of the point P' in the
graphical register along the x-axis by π in the negative direction

240
Figure 6.11. Construction of an equavalence of the sine function in the
graphical register via the parallel displacement of the –sine function along the x-axis
by π in the positive direction

241
Figure 6.12. Construction of an equavalence of the –sine function in the
graphical register via the parallel displacement of the sine function along the x-axis
by π in the negative direction
[Defne & Ebru] Protocol 14
Researcher: Last week, we have discussed about functions, for example, like 3.sine. What 1
do you remember? What does coefficient 3 mean? 2
Defne: Radius was 3 (figuring a circle through indicating arcs with her right and left 3
hands’ index and thumb fingers, and then a bit more dilating this circle through 4
taking her hands away from each other). 5
Ebru: Uh-huh. 6
Researcher: What else? 7
Ebru: Magnitude was 3 (figuring a shape with her index finger as the first peak of the 8
sine in the (0,π) interval). 9
Defne: Yes. 10
Researcher: Well, let’s we discuss about coefficient of sine in a bit more detail 11
(constructing a slider to manipulate the coefficient of a.sine function so as to take 12
values between -5 and 5, and then a.sine function’s graph like in Figure 6.13). 13
… 14
Researcher: Please investigate the variation of this blue graph compared to the sine graph 15
(pointing to the g(x)=a.sin(x) functions graph on the screen like in Figure 6.13). 16
Defne: (Dragging the slider in the positive direction) it’s going up. 17
Ebru: Can I look (taking the manipulation control of the slider to her)! (Dragging the 18
slider in the negative direction until the 1) now it’s going down. 19
Defne: Yes. 20
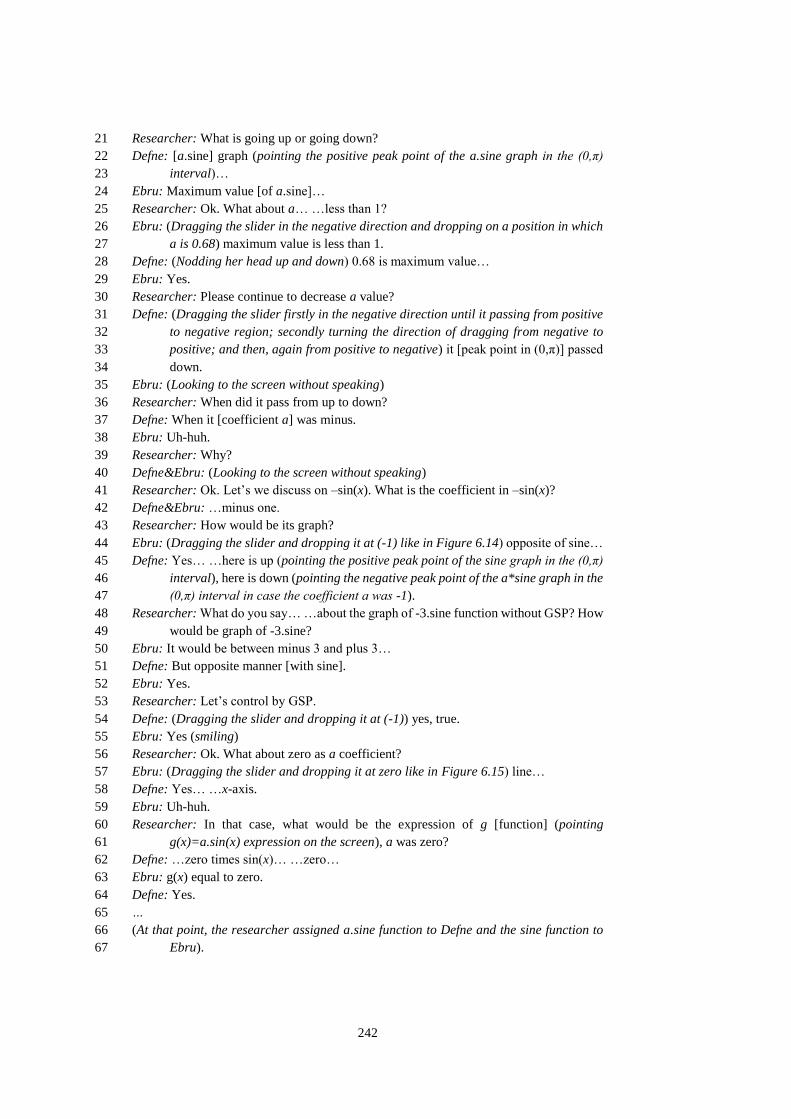
242
Researcher: What is going up or going down? 21
Defne: [a.sine] graph (pointing the positive peak point of the a.sine graph in the (0,π) 22
interval)… 23
Ebru: Maximum value [of a.sine]… 24
Researcher: Ok. What about a… …less than 1? 25
Ebru: (Dragging the slider in the negative direction and dropping on a position in which 26
a is 0.68) maximum value is less than 1. 27
Defne: (Nodding her head up and down) 0.68 is maximum value… 28
Ebru: Yes. 29
Researcher: Please continue to decrease a value? 30
Defne: (Dragging the slider firstly in the negative direction until it passing from positive 31
to negative region; secondly turning the direction of dragging from negative to 32
positive; and then, again from positive to negative) it [peak point in (0,π)] passed 33
down. 34
Ebru: (Looking to the screen without speaking) 35
Researcher: When did it pass from up to down? 36
Defne: When it [coefficient a] was minus. 37
Ebru: Uh-huh. 38
Researcher: Why? 39
Defne&Ebru: (Looking to the screen without speaking) 40
Researcher: Ok. Let’s we discuss on –sin(x). What is the coefficient in –sin(x)? 41
Defne&Ebru: …minus one. 42
Researcher: How would be its graph? 43
Ebru: (Dragging the slider and dropping it at (-1) like in Figure 6.14) opposite of sine… 44
Defne: Yes… …here is up (pointing the positive peak point of the sine graph in the (0,π) 45
interval), here is down (pointing the negative peak point of the a*sine graph in the 46
(0,π) interval in case the coefficient a was -1). 47
Researcher: What do you say… …about the graph of -3.sine function without GSP? How 48
would be graph of -3.sine? 49
Ebru: It would be between minus 3 and plus 3… 50
Defne: But opposite manner [with sine]. 51
Ebru: Yes. 52
Researcher: Let’s control by GSP. 53
Defne: (Dragging the slider and dropping it at (-1)) yes, true. 54
Ebru: Yes (smiling) 55
Researcher: Ok. What about zero as a coefficient? 56
Ebru: (Dragging the slider and dropping it at zero like in Figure 6.15) line… 57
Defne: Yes… …x-axis. 58
Ebru: Uh-huh. 59
Researcher: In that case, what would be the expression of g [function] (pointing 60
g(x)=a.sin(x) expression on the screen), a was zero? 61
Defne: …zero times sin(x)… …zero… 62
Ebru: g(x) equal to zero. 63
Defne: Yes. 64
… 65
(At that point, the researcher assigned a.sine function to Defne and the sine function to 66
Ebru). 67
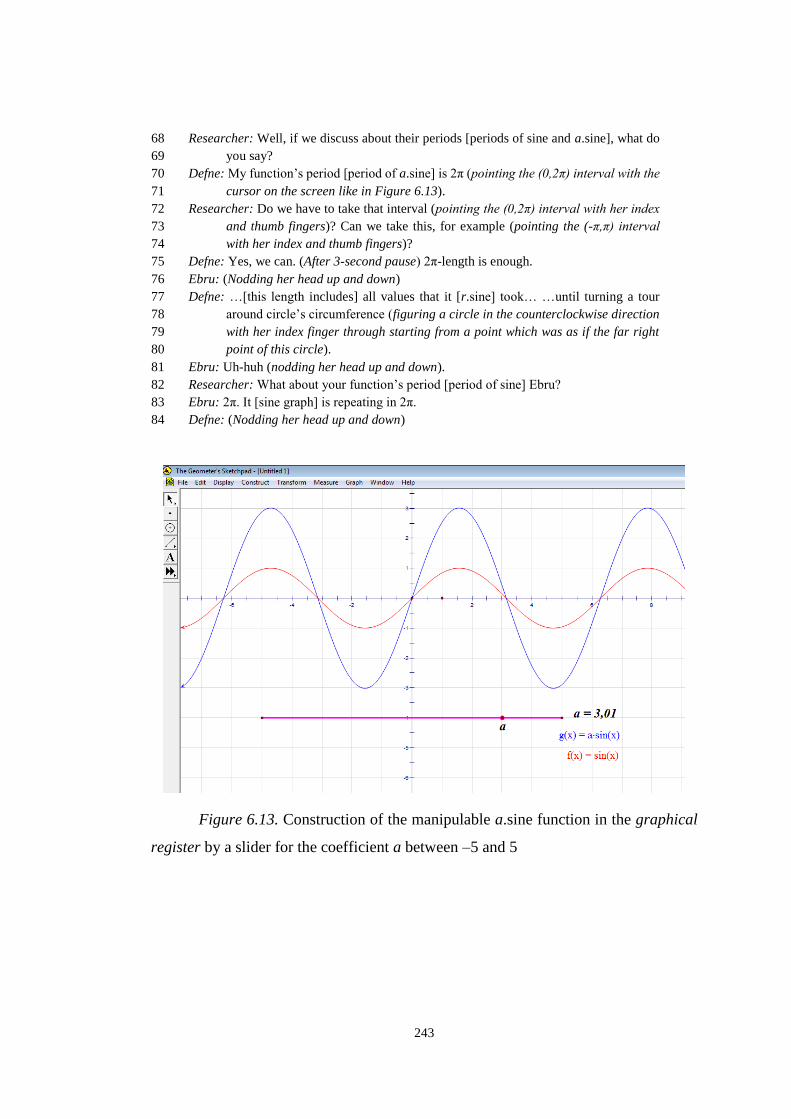
243
Researcher: Well, if we discuss about their periods [periods of sine and a.sine], what do 68
you say? 69
Defne: My function’s period [period of a.sine] is 2π (pointing the (0,2π) interval with the 70
cursor on the screen like in Figure 6.13). 71
Researcher: Do we have to take that interval (pointing the (0,2π) interval with her index 72
and thumb fingers)? Can we take this, for example (pointing the (-π,π) interval 73
with her index and thumb fingers)? 74
Defne: Yes, we can. (After 3-second pause) 2π-length is enough. 75
Ebru: (Nodding her head up and down) 76
Defne: …[this length includes] all values that it [r.sine] took… …until turning a tour 77
around circle’s circumference (figuring a circle in the counterclockwise direction 78
with her index finger through starting from a point which was as if the far right 79
point of this circle). 80
Ebru: Uh-huh (nodding her head up and down). 81
Researcher: What about your function’s period [period of sine] Ebru? 82
Ebru: 2π. It [sine graph] is repeating in 2π. 83
Defne: (Nodding her head up and down) 84
Figure 6.13. Construction of the manipulable a.sine function in the graphical
register by a slider for the coefficient a between –5 and 5

244
Figure 6.14. Shape of the a.sine graph in case of the slider’s (–1) position for
the coefficient a
Figure 6.15. Shape of the a.sine graph in case of the slider’s zero-position for
the coefficient a

245
6.1.2. Visual Feature Opposition D
Visual Feature (D) corresponds to changed-center in the (unit) circle register
and parallel-displacement along the y-axis in the graphical register so that these visual
features’ opposition corresponds to the choice presence/absence of a constant of sine
and cosine in the symbolic register.
6.1.2.1. Changed-center in (unit) circle register
In Task 9 [Task 14], students were encouraged to reason about the function
mapping the principal arc into the y-component [x-component] of the point on a unit
circle with a manipulable-center on the coordinate system (Figure 6.16) through
comparing and contrasting with that on the unit circle whose center was located on the
origin (e.g., lines 1-8 in [Defne & Ebru] Protocol 15; lines 1-19 in [Cemre & Zafer]
Protocol 16).
Initially, the researcher asked students to reason about whether this visual
relation was a function or not on the unit circle with a different center from the origin
–e.g., a point in the second quadrant of the coordinate system. Where, all students
interpreted this relation as a function based on its property that each arc (i.e., input in
the domain) must be related to exactly one y-component [x-component] (i.e., output in
the range) (e.g., lines 6-12 in [Defne & Ebru] Protocol 15; lines 17-22 in [Cemre &
Zafer] Protocol 16). And then, each group of students reasoned about this function on
a unit circle with a manipulable-center on the coordinate system through comparing
and contrasting with that on the unit circle with the origin-center –i.e., sine [cosine].
In task 9, on the one hand, the group of Cemre and Zafer started the comparison
of this function with the sine function by means of Zafer’s concern about its
differentiation from sine (lines 17-23 in [Cemre & Zafer] Protocol 16). On the other
hand, Defne and Ebru did not concern about this comparison by themselves. So, the
researcher dragged the center onto the origin; and then, asked them to reason about the
same visual relation in that case (lines 13-15 in [Defne & Ebru] Protocol 15). In case
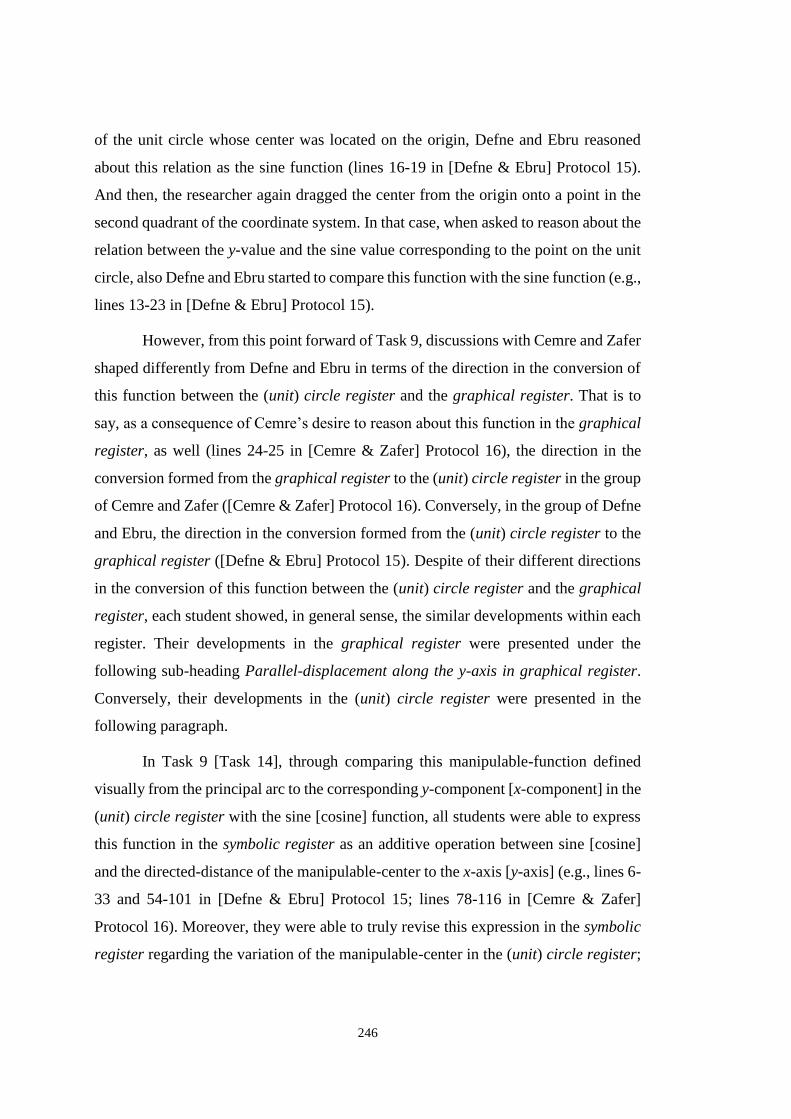
246
of the unit circle whose center was located on the origin, Defne and Ebru reasoned
about this relation as the sine function (lines 16-19 in [Defne & Ebru] Protocol 15).
And then, the researcher again dragged the center from the origin onto a point in the
second quadrant of the coordinate system. In that case, when asked to reason about the
relation between the y-value and the sine value corresponding to the point on the unit
circle, also Defne and Ebru started to compare this function with the sine function (e.g.,
lines 13-23 in [Defne & Ebru] Protocol 15).
However, from this point forward of Task 9, discussions with Cemre and Zafer
shaped differently from Defne and Ebru in terms of the direction in the conversion of
this function between the (unit) circle register and the graphical register. That is to
say, as a consequence of Cemre’s desire to reason about this function in the graphical
register, as well (lines 24-25 in [Cemre & Zafer] Protocol 16), the direction in the
conversion formed from the graphical register to the (unit) circle register in the group
of Cemre and Zafer ([Cemre & Zafer] Protocol 16). Conversely, in the group of Defne
and Ebru, the direction in the conversion formed from the (unit) circle register to the
graphical register ([Defne & Ebru] Protocol 15). Despite of their different directions
in the conversion of this function between the (unit) circle register and the graphical
register, each student showed, in general sense, the similar developments within each
register. Their developments in the graphical register were presented under the
following sub-heading Parallel-displacement along the y-axis in graphical register.
Conversely, their developments in the (unit) circle register were presented in the
following paragraph.
In Task 9 [Task 14], through comparing this manipulable-function defined
visually from the principal arc to the corresponding y-component [x-component] in the
(unit) circle register with the sine [cosine] function, all students were able to express
this function in the symbolic register as an additive operation between sine [cosine]
and the directed-distance of the manipulable-center to the x-axis [y-axis] (e.g., lines 6-
33 and 54-101 in [Defne & Ebru] Protocol 15; lines 78-116 in [Cemre & Zafer]
Protocol 16). Moreover, they were able to truly revise this expression in the symbolic
register regarding the variation of the manipulable-center in the (unit) circle register;
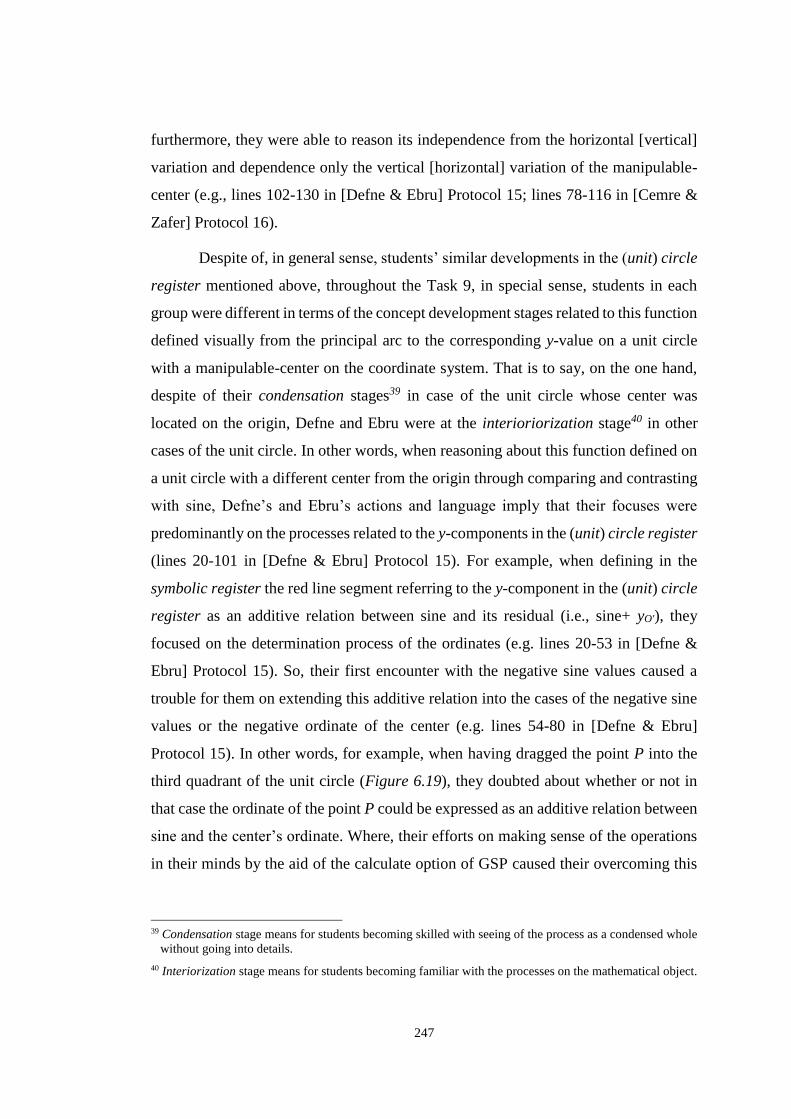
247
furthermore, they were able to reason its independence from the horizontal [vertical]
variation and dependence only the vertical [horizontal] variation of the manipulable-
center (e.g., lines 102-130 in [Defne & Ebru] Protocol 15; lines 78-116 in [Cemre &
Zafer] Protocol 16).
Despite of, in general sense, students’ similar developments in the (unit) circle
register mentioned above, throughout the Task 9, in special sense, students in each
group were different in terms of the concept development stages related to this function
defined visually from the principal arc to the corresponding y-value on a unit circle
with a manipulable-center on the coordinate system. That is to say, on the one hand,
despite of their condensation stages39 in case of the unit circle whose center was
located on the origin, Defne and Ebru were at the interioriorization stage40 in other
cases of the unit circle. In other words, when reasoning about this function defined on
a unit circle with a different center from the origin through comparing and contrasting
with sine, Defne’s and Ebru’s actions and language imply that their focuses were
predominantly on the processes related to the y-components in the (unit) circle register
(lines 20-101 in [Defne & Ebru] Protocol 15). For example, when defining in the
symbolic register the red line segment referring to the y-component in the (unit) circle
register as an additive relation between sine and its residual (i.e., sine+ yO'), they
focused on the determination process of the ordinates (e.g. lines 20-53 in [Defne &
Ebru] Protocol 15). So, their first encounter with the negative sine values caused a
trouble for them on extending this additive relation into the cases of the negative sine
values or the negative ordinate of the center (e.g. lines 54-80 in [Defne & Ebru]
Protocol 15). In other words, for example, when having dragged the point P into the
third quadrant of the unit circle (Figure 6.19), they doubted about whether or not in
that case the ordinate of the point P could be expressed as an additive relation between
sine and the center’s ordinate. Where, their efforts on making sense of the operations
in their minds by the aid of the calculate option of GSP caused their overcoming this
39 Condensation stage means for students becoming skilled with seeing of the process as a condensed whole
without going into details.
40 Interiorization stage means for students becoming familiar with the processes on the mathematical object.
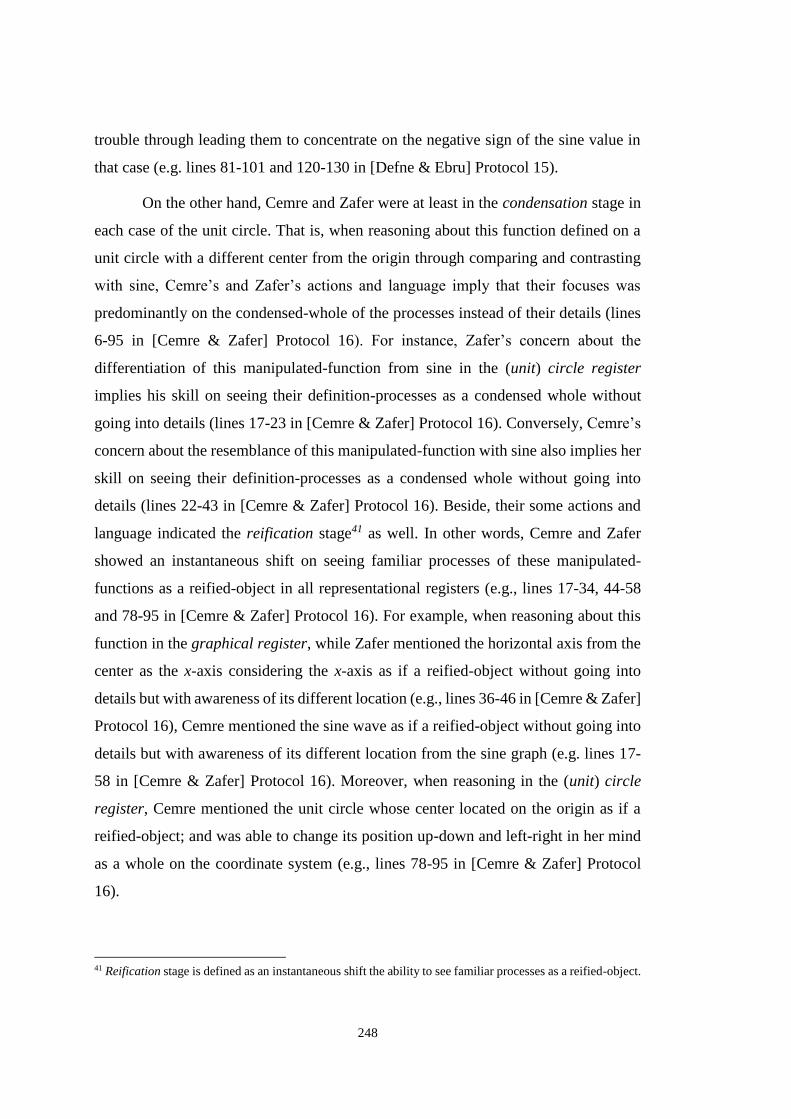
248
trouble through leading them to concentrate on the negative sign of the sine value in
that case (e.g. lines 81-101 and 120-130 in [Defne & Ebru] Protocol 15).
On the other hand, Cemre and Zafer were at least in the condensation stage in
each case of the unit circle. That is, when reasoning about this function defined on a
unit circle with a different center from the origin through comparing and contrasting
with sine, Cemre’s and Zafer’s actions and language imply that their focuses was
predominantly on the condensed-whole of the processes instead of their details (lines
6-95 in [Cemre & Zafer] Protocol 16). For instance, Zafer’s concern about the
differentiation of this manipulated-function from sine in the (unit) circle register
implies his skill on seeing their definition-processes as a condensed whole without
going into details (lines 17-23 in [Cemre & Zafer] Protocol 16). Conversely, Cemre’s
concern about the resemblance of this manipulated-function with sine also implies her
skill on seeing their definition-processes as a condensed whole without going into
details (lines 22-43 in [Cemre & Zafer] Protocol 16). Beside, their some actions and
language indicated the reification stage41 as well. In other words, Cemre and Zafer
showed an instantaneous shift on seeing familiar processes of these manipulated-
functions as a reified-object in all representational registers (e.g., lines 17-34, 44-58
and 78-95 in [Cemre & Zafer] Protocol 16). For example, when reasoning about this
function in the graphical register, while Zafer mentioned the horizontal axis from the
center as the x-axis considering the x-axis as if a reified-object without going into
details but with awareness of its different location (e.g., lines 36-46 in [Cemre & Zafer]
Protocol 16), Cemre mentioned the sine wave as if a reified-object without going into
details but with awareness of its different location from the sine graph (e.g. lines 17-
58 in [Cemre & Zafer] Protocol 16). Moreover, when reasoning in the (unit) circle
register, Cemre mentioned the unit circle whose center located on the origin as if a
reified-object; and was able to change its position up-down and left-right in her mind
as a whole on the coordinate system (e.g., lines 78-95 in [Cemre & Zafer] Protocol
16).
41 Reification stage is defined as an instantaneous shift the ability to see familiar processes as a reified-object.

249
Unfortunately, Defne and Ebru did not rich this level of conception in the (unit)
circle register throughout Task 9. As a cause of this, the researcher hypothesized that
students’ differentiation on the level of conception arose from their preferences of the
direction in the conversion of this function between the (unit) circle register and the
graphical register. Therefore, henceforward, she determined to encourage also Defne
and Ebru to reason about the considered-functions in the following tasks
simultaneously in the (unit) circle register and the graphical register in order to ease
for them to develop such a skill in seeing these processes as a condensed whole without
going into details, or better a skill in seeing the familiar processes within the registers
as a reified-object. Specifically, in Task 14, the researcher encouraged them to discuss
about the role of the changed-location of the unit circle based on the function defined
in the (unit) circle register from the principal arc to the corresponding x-value
simultaneously with its graphical representation (e.g., lines 1-36 in [Defne & Ebru]
Protocol 16). Henceforward, the subsequent variation of students’ conception-levels
on the changed-center in the (unit) circle register was presented together with its effect
on the changed-location in the graphical register under the following sub-heading
Parallel-displacement along the y-axis in graphical register.
[Defne & Ebru] Protocol 15
Researcher: (Giving directions for students to construct a unit circle in GSP environment 1
whose center can be manipulable and the parallel axes from its center to the 2
coordinate axes in the (unit) circle register like in Figure 6.16)… 3
(Defne and Ebru cooperatively constructed GSP page like in Figure 6.16 with respect to 4
the researcher’s directions.) 5
Researcher: Well, if we define a relation… …that is mapping this green arc to this y-6
value (pointing the green arc and red line segment on the screen like in Figure 7
6.16)… Is it a function? 8
Defne: Yes, it is. 9
Researcher: Why? 10
Defne: Each one [green arc] is going to only one [y-value]… 11
Ebru: Yes. 12
Researcher: Ok. (Dragging the center of the unit circle and dropping on the origin) now, 13
what do you say about the same function… …that is again mapping this green arc 14
the corresponding y-value… 15
Defne&Ebru: Sine… 16
Researcher: Please find y-value and sine corresponding to the point P. 17

250
Ebru: (Measuring 𝑦𝑃 and calculating sin(x) by GSP) they are same. 18
Defne: Uh-huh. 19
Researcher: (Dragging the center of the unit circle from the origin to the position in the 20
second quadrant of the coordinate system like in Figure 6.17) what about now? 21
Are they [𝑦𝑃 and sin(x)] still same? 22
Ebru: No. they are different. 23
Defne: (After 4-second pause) because there is an extra (pointing the red line segment’s 24
downward regarding the horizontal axis constructed from the manipulable-25
center). 26
Researcher: Where is the extra? 27
Defne: Here (pointing with her index finger the red line segment’s downward regarding 28
the horizontal axis constructed from the manipulable-center on the screen like in 29
Figure 6.17)… 30
Ebru: …from here to here (pointing with her pen the intersection points of the red line 31
segment respectively with the manipulable-horizontal axis and the x-axis). 32
Defne: Yes. 33
Ebru: …about 2.20 or like that (dragging her pen on the manipulable-horizontal axis 34
from the intersection point with the red line segment to the y-axis on the screen 35
like in Figure 6.17)… 36
Defne: 2.30 may be… 37
Researcher: How do you determine this measure? 38
Ebru: …like that (dragging her pen on the manipulable-horizontal axis from the 39
intersection point with the red line segment to the y-axis). 40
Defne: Yes. So, it is between 2.20 or 2.30. 41
Ebru: Uh-huh. 42
Researcher: Do you mean this point’s y-value (pointing the intersection point of the red 43
line segment with the manipulable-horizontal axis)? 44
Defne&Ebru: Yes. 45
Researcher: What about center’s y-value (pointing the point O')? 46
Defne: Same with this (pointing the intersection point of the red line segment with the 47
manipulable-horizontal axis)… 48
Ebru: Yes, same. 49
Researcher: Let’s measure of center’s y-value. 50
Defne: (Measuring the ordinate of the point O' by GSP, when the result was appeared on 51
the screen like in Figure 6.18) 2.26… 52
Ebru: (Smiling) 53
Researcher: You said before, this part was an extra from sine, wasn’t it? 54
Defne&Ebru: Yes. 55
Researcher: Then, what do you say about this red part (dragging her index finger from 56
up to down on the red segment, at that time the point P was in the second quadrant 57
like in Figure 6.18)… …considering it as two parts like that (dragging her index 58
finger on the red line segment from up to down through dropping for a while on 59
the intersection point of the red line segment and the manipulable-horizontal 60
axis)? 61
Defne: We add them. 62
Ebru: (Looking to the screen without speaking). 63
Researcher: Let’s add and see. Measures you need are there (pointing the measures on 64
the screen). 65

251
Defne: (Calculating sin(x)+𝑦𝑂′) yes… 66
Ebru: But in here (dragging the point P in the counterclockwise direction and dropping 67
it in the third quadrant like in Figure 6.19), don’t we obtain this (pointing the red 68
segment) through subtracting this (pointing the opposite side of the reference right 69
triangle) from 2.26 (indicating the distance between the manipulable-horizontal 70
axis and the x-axis through figuring a perpendicular segment to both so that the 71
point P was on it)… 72
Defne: (Looking to the screen without speaking) 73
Ebru: (After 4-second pause) actually, you know here (figuring the distance segment 74
between the manipulable-horizontal axis and the x-axis from the point P) is same 75
with between O' and x [axis] (figuring the perpendicular segment from the point 76
O' to the x-axis), that is 2.26… … here (dragging her index finger on the red 77
segment) is y-value of P [point]… …and here (pointing the opposite side of the 78
reference right triangle) is sine as well. 79
Defne: (Looking to the screen without speaking) 80
Researcher: Ebru, do this operation you have expressed. 81
Ebru: (Calculating the difference between the ordinates of the point O' and the point P 82
like in Figure 6.20) it is opposite sign with sine… …of course, sine is negative in 83
third quadrant. I understand. 84
Defne: (Nodding her head up and down) 85
Researcher: So, which operation is conducted in third quadrant… …subtraction or 86
addition? 87
Defne&Ebru: Addition. 88
Researcher: Why? 89
Ebru: Because sine is negative in third quadrant… 90
Defne: Uh-huh… …but as if subtraction of this length (putting her right hand’s index 91
and thumb fingers on the endpoints of the opposite side of the reference right 92
triangle on the screen like in Figure 6.20). 93
Researcher: Good, that is, when thinking about sine it means addition… …and thinking 94
about lengths it means subtraction. 95
Defne&Ebru: Yes. 96
Researcher: Please control… …are these same (pointing 𝑦𝑃 and sin(x)+𝑦𝑂′ measures on 97
the screen like in Figure 6.20) in everywhere on the circle? 98
Ebru: (Dragging the point P in the counterclockwise direction until completing a full 99
round) yes, same. 100
Defne: Uh-huh. 101
Researcher: Ok. Let’s we drag the circle throughout this way without changing its 102
distance from the x-axis (dragging the point O' by using the right and left arrows 103
of the keyboard like in Figure 6.21). (After 6-second pause) which measures are 104
changing on the screen? 105
Defne&Ebru: None. 106
Researcher: Ok. Now, I want to drag the circle throughout this way without changing its 107
distance from the y-axis (dragging the point O' by using the up and down arrows 108
of the keyboard like in Figure 6.22). (After 6-second pause) which measures are 109
changing on the screen? 110
Defne: Now, they changed… 111
Ebru: Yes. 112
Researcher: Which ones changed? 113

252
Defne: (Dragging the point O' toward downward by using the down arrow of the 114
keyboard and dropping in the third quadrant of the coordinate system like in 115
Figure 6.22) these changed (pointing 𝑦𝑃 and sin(x)+𝑦𝑂′ measures on the 116
screen)… 117
Ebru: These also changed (pointing 𝑦𝑂′ − 𝑦𝑃 and 𝑦𝑂′ measures on the screen). 118
Defne: Yes. 119
Researcher: These measures changed (pointing 𝑦𝑃 and sin(x)+𝑦𝑂′ measures on the 120
screen like in Figure 6.22)… …but still equal to each other, is that right? 121
Defne&Ebru: Yes. 122
Researcher: How this y-value (pointing 𝑦𝑃 measure on the screen at that time the unit 123
circle was in the third quadrant of the coordinate system like in Figure 6.22) is 124
equal to again this addition of sin(x) and 𝑦𝑂′ (pointing sin(x)+𝑦𝑂′ measure on the 125
screen)? Did we do a subtraction? 126
Ebru: No… Due to minus [sign of 𝑦𝑂′] and plus [sign of sin(x)] we should add (at that 127
time the unit circle was in the third quadrant of the coordinate system like in 128
Figure 6.22)… 129
Defne: (Nodding her head up and down) 130
(Similar discussions were done on the equality between 𝑦𝑃 and sin(x)+𝑦𝑂′ measures 131
under the manipulation of the angle’s openness in the third quadrant, as well as 132
in the fourth quadrant of the coordinate system). 133
Figure 6.16. Construction of the unit circle with a manipulable-center in terms
of sine in the (unit) circle register

253
Figure 6.17. The ordinate and sine value corresponding to the point P on the
unit circle with the manipulable-center
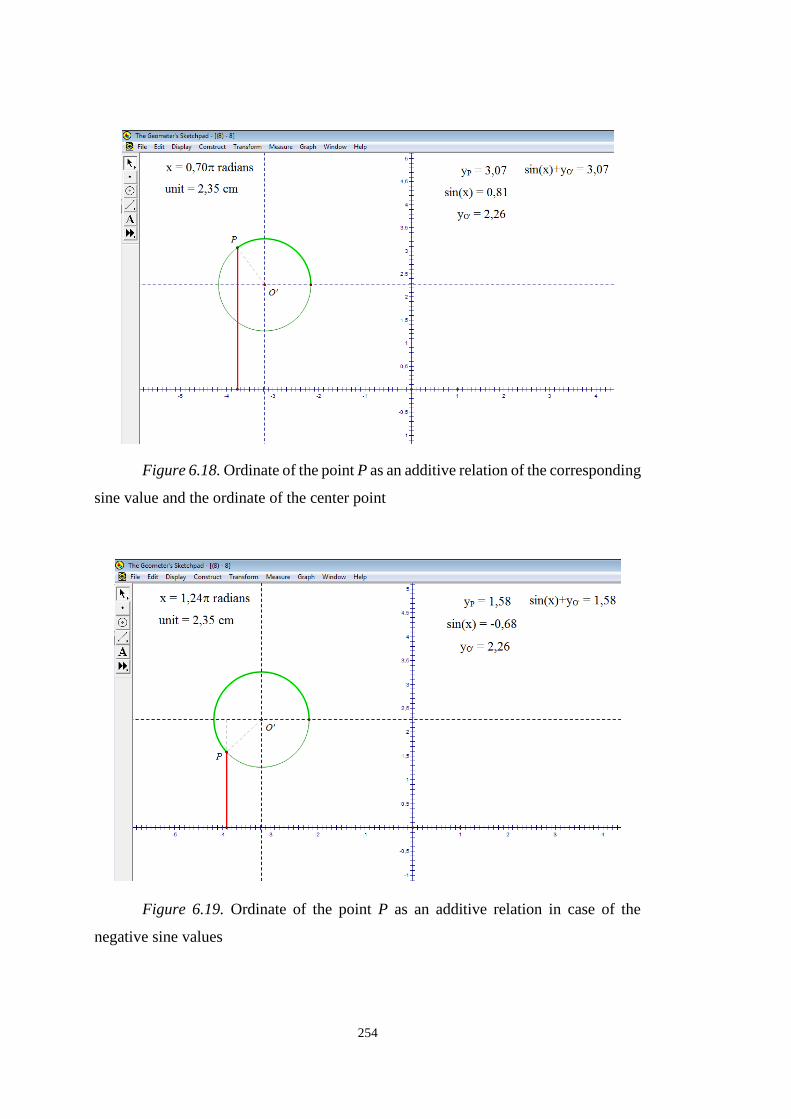
254
Figure 6.18. Ordinate of the point P as an additive relation of the corresponding
sine value and the ordinate of the center point
Figure 6.19. Ordinate of the point P as an additive relation in case of the
negative sine values

255
Figure 6.20. Role of the directed-opposite side in the (unit) circle register on
the additive relation indicating the ordinate of the point P
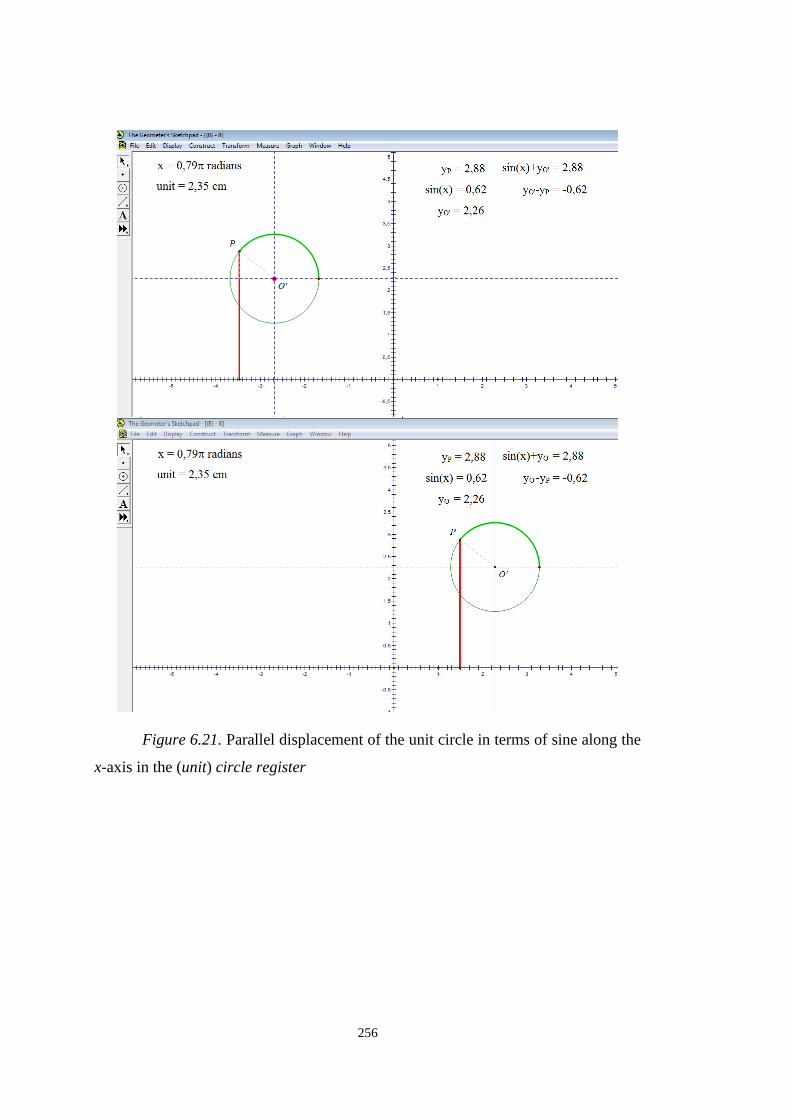
256
Figure 6.21. Parallel displacement of the unit circle in terms of sine along the
x-axis in the (unit) circle register
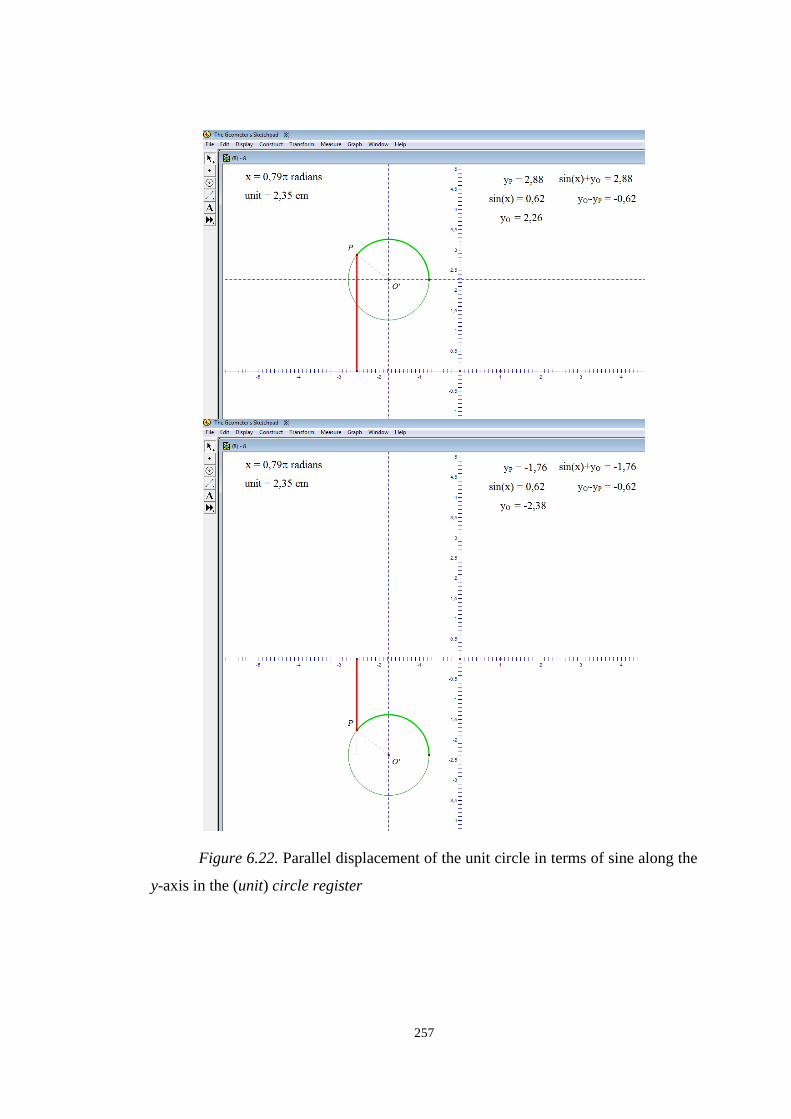
257
Figure 6.22. Parallel displacement of the unit circle in terms of sine along the
y-axis in the (unit) circle register

258
6.1.2.2. Parallel-displacement along the y-axis in graphical register
In addition to the role of the changed-location of the unit circle on the
coordinate system, its conversion into the graphical register was another important
focus in Task 9 [Task 14] by means of the functions defined in the (unit) circle register
from the principal arc to the y-component [x-component] of the reference point of this
arc on a unit circle with a manipulable-center on the coordinate system (Figure 6.16
and Figure 6.26). Where, the researcher encouraged students to interpret the variation
of these functions in the graphical register under the manipulation of the unit circle’s
location through comparing and contrasting with that on the unit circle whose center
was located on the origin.
When the traced-graph of the mentioned-function was appeared on the screen,
all students were able to associate this function with the sine [cosine] function in the
graphical register based on its visual-shape (e.g., lines 27-58 in [Cemre & Zafer]
Protocol 16; lines 33-39 in [Defne & Ebru] Protocol 16). Moreover, they were able to
reason about this traced graph as a parallel displacement of the sine [cosine] graph
along the y-axis in the positive/negative direction but initially without considering the
displacement amount (e.g., lines 36-55 in [Cemre & Zafer] Protocol 16; lines 37-45 in
[Defne & Ebru] Protocol 16). At that point, the researcher encouraged them to compare
and contrast this traced graph with the sine [cosine] graph in a more detailed way (e.g.,
lines 59-62 in [Cemre & Zafer] Protocol 16; line 46 in [Defne & Ebru] Protocol 16).
Where, it was observed that students were able to reason about the parallel
displacement amount through focusing on the intersection points with the y-axis of the
traced graph and the sine [cosine] graph (e.g., lines 59-77 and 96-116 in [Cemre &
Zafer] Protocol 16; lines 43-48 in [Defne & Ebru] Protocol 16). Moreover, their
actions and language imply that they associated this (directed) amount of the parallel
displacement of the sine [cosine] graph with the center’s (directed) distance from the
x-axis [y-axis] (e.g., lines 67-74 and 96-116 in [Cemre & Zafer] Protocol 16; lines 46-
71 in [Defne & Ebru] Protocol 16), as well as with the (signed) constant of the sine
[cosine] function in the symbolic register (e.g., lines 96-116 in [Cemre & Zafer]
Protocol 16).
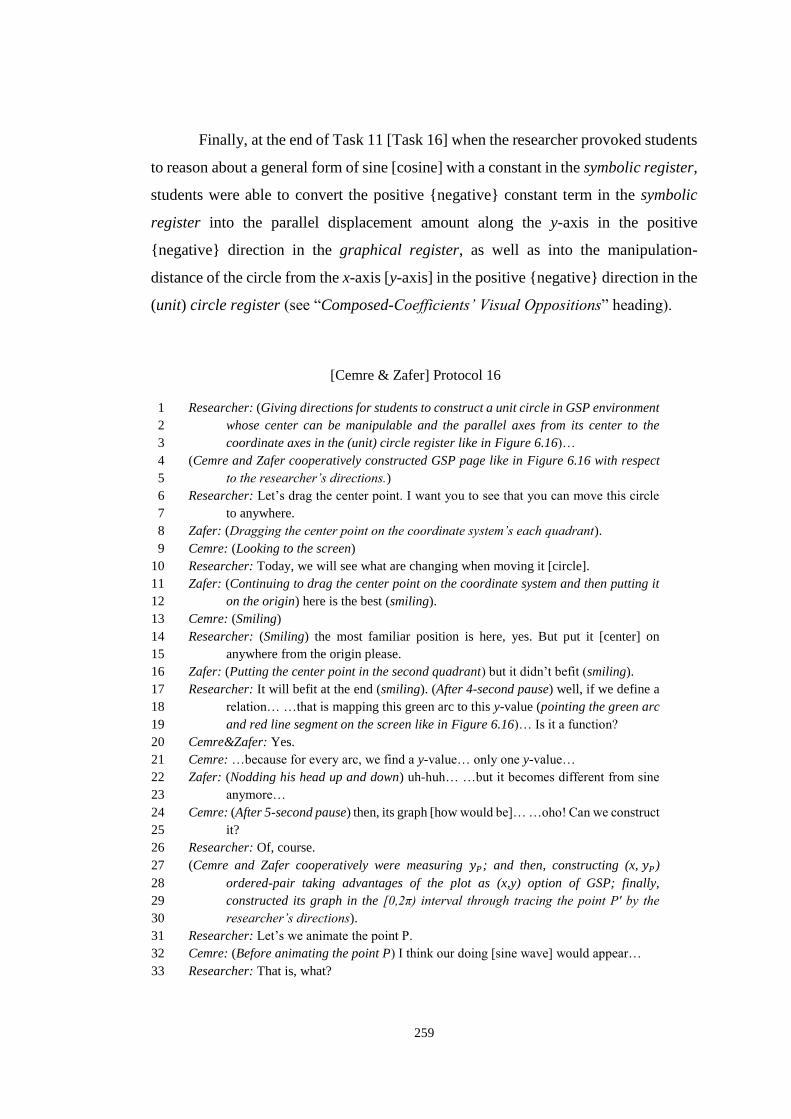
259
Finally, at the end of Task 11 [Task 16] when the researcher provoked students
to reason about a general form of sine [cosine] with a constant in the symbolic register,
students were able to convert the positive {negative} constant term in the symbolic
register into the parallel displacement amount along the y-axis in the positive
{negative} direction in the graphical register, as well as into the manipulation-
distance of the circle from the x-axis [y-axis] in the positive {negative} direction in the
(unit) circle register (see “Composed-Coefficients’ Visual Oppositions” heading).
[Cemre & Zafer] Protocol 16
Researcher: (Giving directions for students to construct a unit circle in GSP environment 1
whose center can be manipulable and the parallel axes from its center to the 2
coordinate axes in the (unit) circle register like in Figure 6.16)… 3
(Cemre and Zafer cooperatively constructed GSP page like in Figure 6.16 with respect 4
to the researcher’s directions.) 5
Researcher: Let’s drag the center point. I want you to see that you can move this circle 6
to anywhere. 7
Zafer: (Dragging the center point on the coordinate system’s each quadrant). 8
Cemre: (Looking to the screen) 9
Researcher: Today, we will see what are changing when moving it [circle]. 10
Zafer: (Continuing to drag the center point on the coordinate system and then putting it 11
on the origin) here is the best (smiling). 12
Cemre: (Smiling) 13
Researcher: (Smiling) the most familiar position is here, yes. But put it [center] on 14
anywhere from the origin please. 15
Zafer: (Putting the center point in the second quadrant) but it didn’t befit (smiling). 16
Researcher: It will befit at the end (smiling). (After 4-second pause) well, if we define a 17
relation… …that is mapping this green arc to this y-value (pointing the green arc 18
and red line segment on the screen like in Figure 6.16)… Is it a function? 19
Cemre&Zafer: Yes. 20
Cemre: …because for every arc, we find a y-value… only one y-value… 21
Zafer: (Nodding his head up and down) uh-huh… …but it becomes different from sine 22
anymore… 23
Cemre: (After 5-second pause) then, its graph [how would be]… …oho! Can we construct 24
it? 25
Researcher: Of, course. 26
(Cemre and Zafer cooperatively were measuring 𝑦𝑃; and then, constructing (x,𝑦𝑃) 27
ordered-pair taking advantages of the plot as (x,y) option of GSP; finally, 28
constructed its graph in the [0,2π) interval through tracing the point P' by the 29
researcher’s directions). 30
Researcher: Let’s we animate the point P. 31
Cemre: (Before animating the point P) I think our doing [sine wave] would appear… 32
Researcher: That is, what? 33
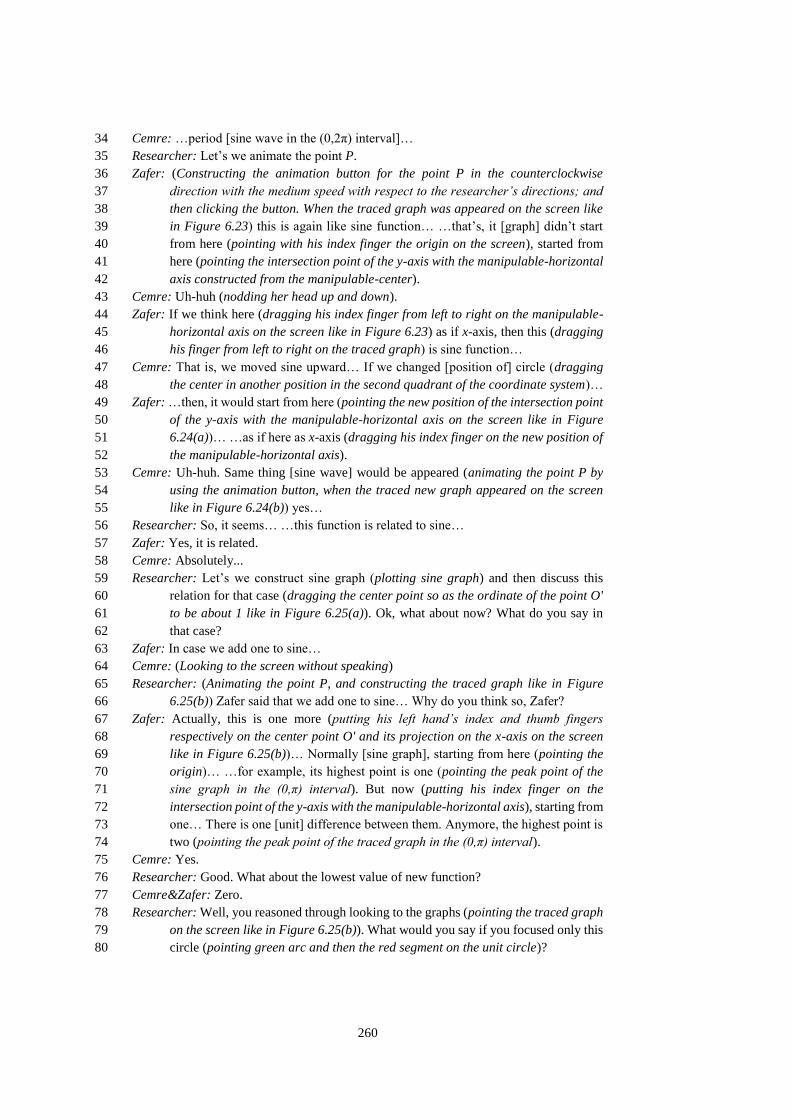
260
Cemre: …period [sine wave in the (0,2π) interval]… 34
Researcher: Let’s we animate the point P. 35
Zafer: (Constructing the animation button for the point P in the counterclockwise 36
direction with the medium speed with respect to the researcher’s directions; and 37
then clicking the button. When the traced graph was appeared on the screen like 38
in Figure 6.23) this is again like sine function… …that’s, it [graph] didn’t start 39
from here (pointing with his index finger the origin on the screen), started from 40
here (pointing the intersection point of the y-axis with the manipulable-horizontal 41
axis constructed from the manipulable-center). 42
Cemre: Uh-huh (nodding her head up and down). 43
Zafer: If we think here (dragging his index finger from left to right on the manipulable-44
horizontal axis on the screen like in Figure 6.23) as if x-axis, then this (dragging 45
his finger from left to right on the traced graph) is sine function… 46
Cemre: That is, we moved sine upward… If we changed [position of] circle (dragging 47
the center in another position in the second quadrant of the coordinate system)… 48
Zafer: …then, it would start from here (pointing the new position of the intersection point 49
of the y-axis with the manipulable-horizontal axis on the screen like in Figure 50
6.24(a))… …as if here as x-axis (dragging his index finger on the new position of 51
the manipulable-horizontal axis). 52
Cemre: Uh-huh. Same thing [sine wave] would be appeared (animating the point P by 53
using the animation button, when the traced new graph appeared on the screen 54
like in Figure 6.24(b)) yes… 55
Researcher: So, it seems… …this function is related to sine… 56
Zafer: Yes, it is related. 57
Cemre: Absolutely... 58
Researcher: Let’s we construct sine graph (plotting sine graph) and then discuss this 59
relation for that case (dragging the center point so as the ordinate of the point O' 60
to be about 1 like in Figure 6.25(a)). Ok, what about now? What do you say in 61
that case? 62
Zafer: In case we add one to sine… 63
Cemre: (Looking to the screen without speaking) 64
Researcher: (Animating the point P, and constructing the traced graph like in Figure 65
6.25(b)) Zafer said that we add one to sine… Why do you think so, Zafer? 66
Zafer: Actually, this is one more (putting his left hand’s index and thumb fingers 67
respectively on the center point O' and its projection on the x-axis on the screen 68
like in Figure 6.25(b))… Normally [sine graph], starting from here (pointing the 69
origin)… …for example, its highest point is one (pointing the peak point of the 70
sine graph in the (0,π) interval). But now (putting his index finger on the 71
intersection point of the y-axis with the manipulable-horizontal axis), starting from 72
one… There is one [unit] difference between them. Anymore, the highest point is 73
two (pointing the peak point of the traced graph in the (0,π) interval). 74
Cemre: Yes. 75
Researcher: Good. What about the lowest value of new function? 76
Cemre&Zafer: Zero. 77
Researcher: Well, you reasoned through looking to the graphs (pointing the traced graph 78
on the screen like in Figure 6.25(b)). What would you say if you focused only this 79
circle (pointing green arc and then the red segment on the unit circle)? 80

261
Zafer: Then, If we consider y-value (figuring the perpendicular line segment from the 81
point P to the y-axis) regarding this (figuring perpendicular line segment from the 82
center point O' to the y-axis)… …as well as we add this (pointing the opposite 83
side of the reference right triangle on the unit circle through putting his right 84
hand’s index and thumb fingers on its endpoints), then it is same… …sine plus 85
one… …same thing… 86
Cemre: Yes. I would think so that… …if we take this part (pointing the opposite side of 87
the reference right triangle on the unit circle through putting her right hand’s 88
index and thumb fingers on its endpoints, at that time the unit circle was in the 89
second quadrant of the coordinate system like in Figure 6.25(b)) and move it up 90
one unit (through keeping the distance between her index and thumb fingers same, 91
moving her fingers initially downward until her thumb finger on the x-axis; and 92
then, upward until her index finger on the point P), then same thing will continue 93
again here (moving her index finger horizontally from the point P to the y-axis 94
rightward; and then from the y-axis to the point P leftward). 95
Researcher: Good. You were able to reason truly both on graph and unit circle… What 96
about its symbolic form? 97
Zafer: …from x to sine x plus one… 98
Cemre: Uh-huh (nodding her head up and down)… 99
Researcher: With sine x plus one, do you mean this (writing on a paper sin(x+1))? 100
Zafer: No, this’s not. 101
Cemre: No. One should be outside of the parenthesis… 102
Zafer: This adding one to angle... …we add one to sine x. 103
Cemre: Yes. 104
Researcher: Please plot this function’s graph. 105
Cemre: (Plotting the h(x)=sin(x)+1 graph) yes. 106
Zafer: Uh-huh (nodding his head up and down). 107
Researcher: Ok. What about now (dragging the unit circle in the third quadrant of the 108
coordinate axis so as its center’s ordinate to be about -2). 109
Zafer: Then, it would be from x to sine x minus two… 110
Cemre: Now, we moved down two units (putting her index finger on the intersection 111
point of the manipulable-vertical axis with the x-axis; and then, dragging her 112
finger downward up to the center point). 113
Zafer: Yes. 114
Cemre: So, sine x minus two… 115
Zafer: (Nodding his head up and down) 116

262
Figure 6.23. Construction of the traced graph of the ordered-pair (x,yP) in the
graphical register as dynamically-linked to the point P on the unit circle whose center
is located on the different point from the origin in the (unit) circle register

263
Figure 6.24. Construction of the manipulated-traced graph of the ordered-pair
(x,yP) in the graphical register by the manipulation of the center in the (unit) circle
register

264
Figure 6.25. Construction of the traced graph of the ordered-pair (x,yP) in the
graphical register together with the sine graph
[Defne & Ebru] Protocol 16
Researcher: In the previous week, we discussed about unit circle’s different positions on 1
the coordinate system in terms of sine… 2
Defne&Ebru: Uh-huh. 3
(Defne and Ebru constructed a unit circle and the principal arc on it in GSP so as its 4
position on the coordinate system to be changeable by the researcher’s 5
directions.) 6
… 7
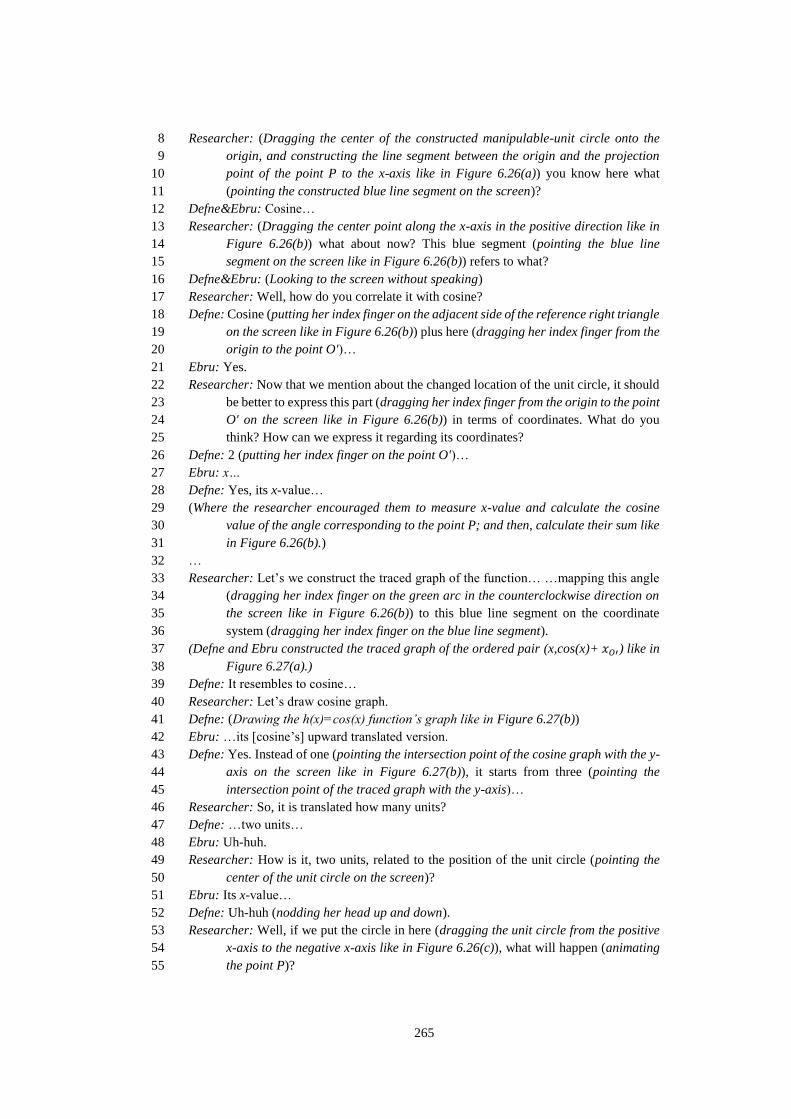
265
Researcher: (Dragging the center of the constructed manipulable-unit circle onto the 8
origin, and constructing the line segment between the origin and the projection 9
point of the point P to the x-axis like in Figure 6.26(a)) you know here what 10
(pointing the constructed blue line segment on the screen)? 11
Defne&Ebru: Cosine… 12
Researcher: (Dragging the center point along the x-axis in the positive direction like in 13
Figure 6.26(b)) what about now? This blue segment (pointing the blue line 14
segment on the screen like in Figure 6.26(b)) refers to what? 15
Defne&Ebru: (Looking to the screen without speaking) 16
Researcher: Well, how do you correlate it with cosine? 17
Defne: Cosine (putting her index finger on the adjacent side of the reference right triangle 18
on the screen like in Figure 6.26(b)) plus here (dragging her index finger from the 19
origin to the point O')… 20
Ebru: Yes. 21
Researcher: Now that we mention about the changed location of the unit circle, it should 22
be better to express this part (dragging her index finger from the origin to the point 23
O' on the screen like in Figure 6.26(b)) in terms of coordinates. What do you 24
think? How can we express it regarding its coordinates? 25
Defne: 2 (putting her index finger on the point O')… 26
Ebru: x… 27
Defne: Yes, its x-value… 28
(Where the researcher encouraged them to measure x-value and calculate the cosine 29
value of the angle corresponding to the point P; and then, calculate their sum like 30
in Figure 6.26(b).) 31
… 32
Researcher: Let’s we construct the traced graph of the function… …mapping this angle 33
(dragging her index finger on the green arc in the counterclockwise direction on 34
the screen like in Figure 6.26(b)) to this blue line segment on the coordinate 35
system (dragging her index finger on the blue line segment). 36
(Defne and Ebru constructed the traced graph of the ordered pair (x,cos(x)+𝑥𝑂′) like in 37
Figure 6.27(a).) 38
Defne: It resembles to cosine… 39
Researcher: Let’s draw cosine graph. 40
Defne: (Drawing the h(x)=cos(x) function’s graph like in Figure 6.27(b)) 41
Ebru: …its [cosine’s] upward translated version. 42
Defne: Yes. Instead of one (pointing the intersection point of the cosine graph with the y-43
axis on the screen like in Figure 6.27(b)), it starts from three (pointing the 44
intersection point of the traced graph with the y-axis)… 45
Researcher: So, it is translated how many units? 46
Defne: …two units… 47
Ebru: Uh-huh. 48
Researcher: How is it, two units, related to the position of the unit circle (pointing the 49
center of the unit circle on the screen)? 50
Ebru: Its x-value… 51
Defne: Uh-huh (nodding her head up and down). 52
Researcher: Well, if we put the circle in here (dragging the unit circle from the positive 53
x-axis to the negative x-axis like in Figure 6.26(c)), what will happen (animating 54
the point P)? 55
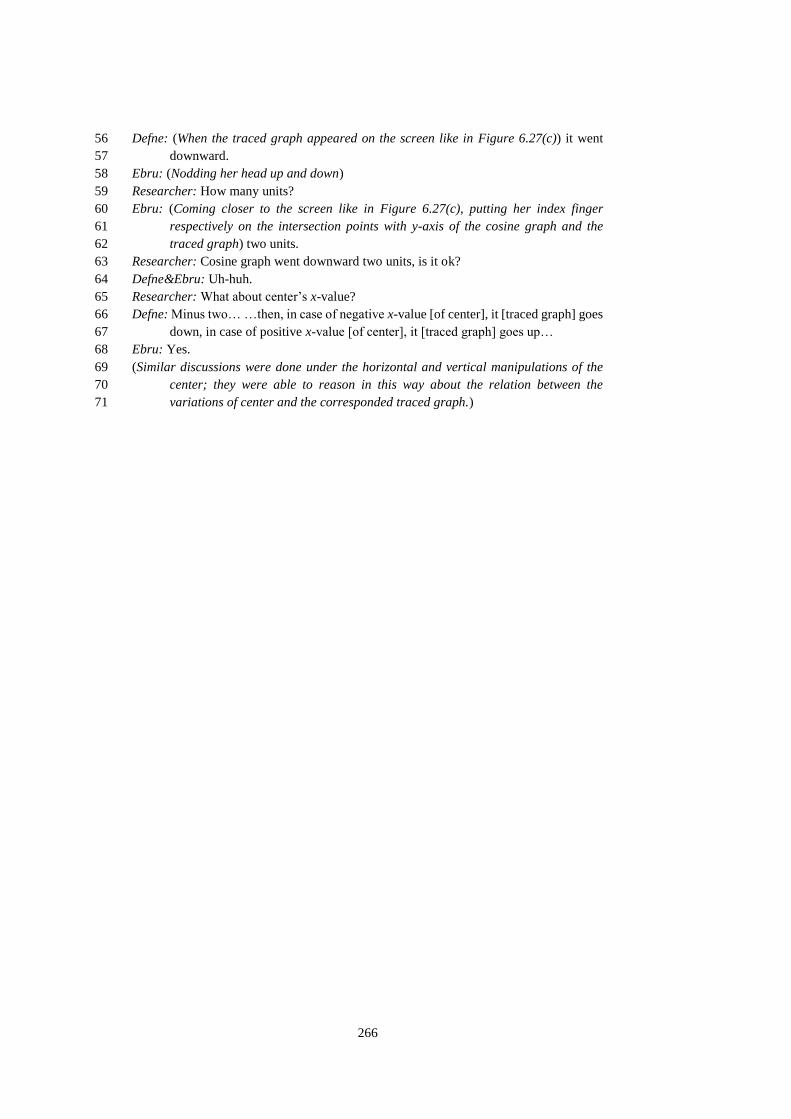
266
Defne: (When the traced graph appeared on the screen like in Figure 6.27(c)) it went 56
downward. 57
Ebru: (Nodding her head up and down) 58
Researcher: How many units? 59
Ebru: (Coming closer to the screen like in Figure 6.27(c), putting her index finger 60
respectively on the intersection points with y-axis of the cosine graph and the 61
traced graph) two units. 62
Researcher: Cosine graph went downward two units, is it ok? 63
Defne&Ebru: Uh-huh. 64
Researcher: What about center’s x-value? 65
Defne: Minus two… …then, in case of negative x-value [of center], it [traced graph] goes 66
down, in case of positive x-value [of center], it [traced graph] goes up… 67
Ebru: Yes. 68
(Similar discussions were done under the horizontal and vertical manipulations of the 69
center; they were able to reason in this way about the relation between the 70
variations of center and the corresponded traced graph.) 71
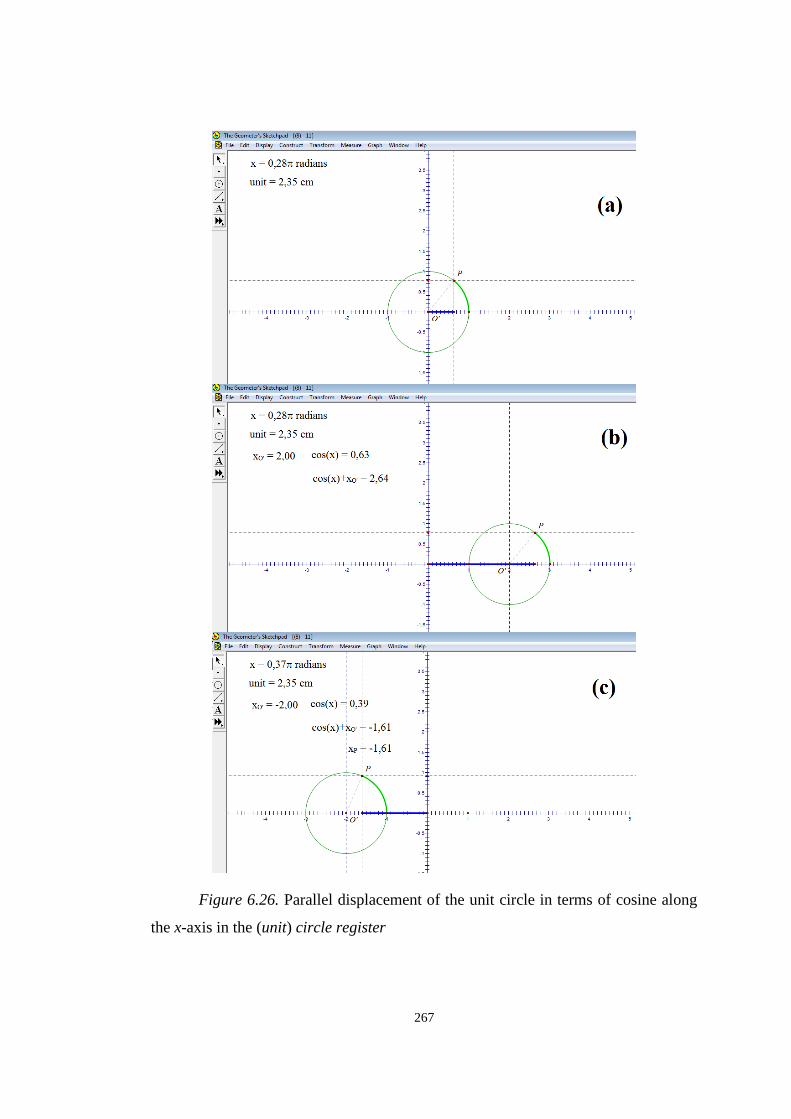
267
Figure 6.26. Parallel displacement of the unit circle in terms of cosine along
the x-axis in the (unit) circle register
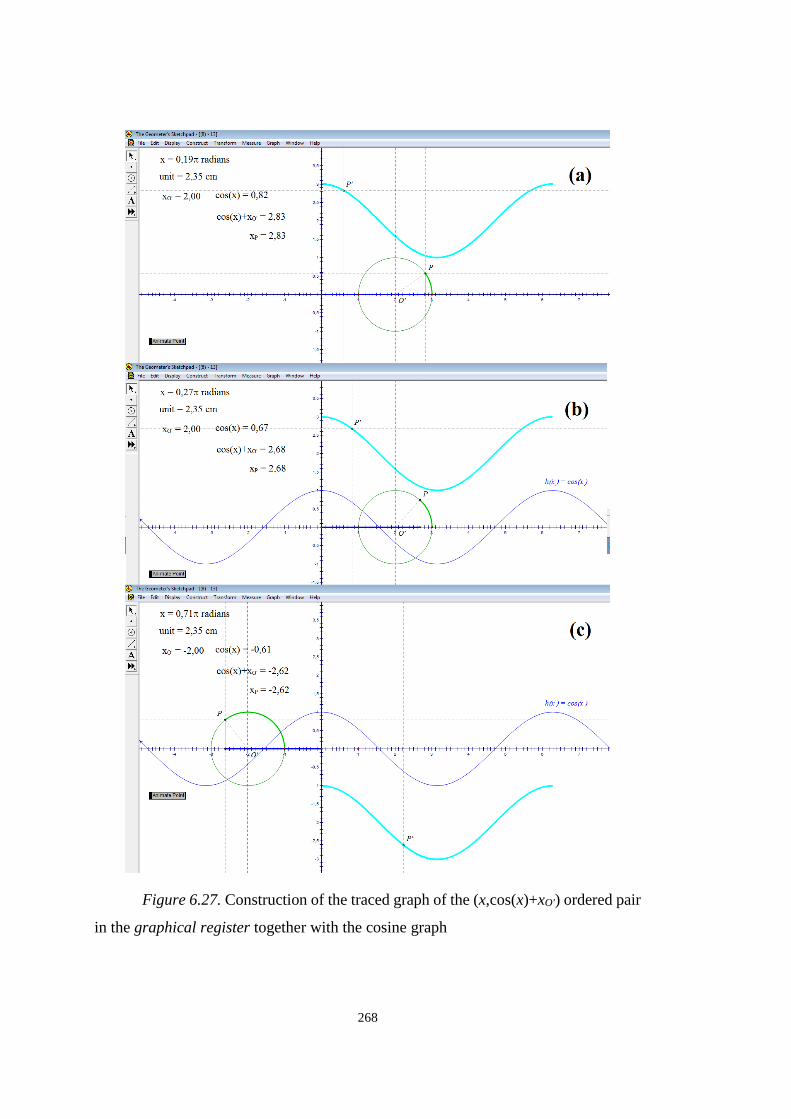
268
Figure 6.27. Construction of the traced graph of the (x,cos(x)+xO') ordered pair
in the graphical register together with the cosine graph
269
6.1.3. Visual Feature Opposition C
Visual Feature (C) corresponds to changed-arc with a constant (angular)
difference in the (unit) circle register and parallel-displacement along the x-axis in the
graphical register so that these visual features’ opposition corresponds to the choice
presence/absence of a constant of the input of sine and cosine in the symbolic register.
6.1.3.1. Changed-arc with a constant difference in (unit) circle register
At the beginning of Task 10, the researcher asked students in each group to
construct a transformed-position of the point P on the unit circle through rotating about
the origin by a fixed-measure based on their choice (e.g., lines 1-22 in [Cemre & Zafer]
Protocol 17). As a fixed rotation measure, while Cemre and Zafer preferred 4 (radian),
Defne and Ebru preferred π+4 (radian). Where, it was observed that none of the
students in each group encountered a trouble about the rotated-position of the point P
on the unit circle (e.g., lines 23-29 in [Cemre & Zafer] Protocol 17; lines 69-83 in
[Defne & Ebru] Protocol 17). However, as a consequence of groups’ different choices
as the rotation amount, their different reasoning emerged based on their same focuses
on the principal-rotation path referring to the principal-arc in the counterclockwise
direction from the point P to its rotated position.
On the one hand, the choice of Group 1 [Cemre&Zafer] was a principal
measure as the rotation amount. Therefore, in their construction, the rotation-path was
the principal arc from the point P to its rotated position (Figure 6.28). This structure
caused for Cemre and Zafer to directly reason about the rotation amount through
focusing on the principal-rotation path. Moreover, this structure caused Cemre’s
association of this principal-rotation path by 4-radian with the rotation by 2.28-radian
in the reverse direction through considering these two rotation paths as complements
of each other to a full round (e.g., lines 25-29 in [Cemre & Zafer] Protocol 17). By this
way, when the new function mapping the angle of the point P to the ordinate of its
rotated position in the (unit) circle register was converted into the graphical register,
they reasoned about the differentiation of the new graph from the sine graph based on
these two rotation amounts (4 and about 2.3) (e.g., [Cemre & Zafer] Protocol 17). That

270
is to say, they considered either 4 or 2.3 as the parallel displacement amount in order
to coincide the new graph with the sine graph (see following sub-heading Parallel-
displacement along the x-axis in graphical register). Thus, they were able to attribute
the variation of the new graph from the sine graph to directly the rotation amount.
On the other hand, the choice of Group 2 [Defne&Ebru] as the rotation amount
was not a principal measure, i.e., (π+4)-radian. Therefore, in their construction (Figure
6.32), the principal arc from the point P to its rotated-position did not refer to the
rotation path; instead, referred to the principal-rotation path with a measure
approximately 0.86-radian. This structure obstructed Defne and Ebru to directly reason
about the rotation amount; instead, they reasoned about the rotation based on the
principal-rotation path but without considering its measure as about 0.86 in radians
(e.g., lines 75-83 in [Defne & Ebru] Protocol 17). Therefore, when the new function
mapping the angle of the point P to the ordinate of its rotated position in the (unit)
circle register was converted into the graphical register, they reasoned about the
variation of the new graph from the sine graph based only on the graphs’ visual
differences without associating this variation with the rotation amount in the (unit)
circle register (e.g., [Defne & Ebru] Protocol 17). In other words, they were unable to
associate the differentiation of the new function from sine in the graphical register
with the rotation in the (unit) circle register (see following sub-heading Parallel-
displacement along the x-axis in graphical register). So, the researcher determined to
specify in Task 15 the rotation amount herself so as to refer a principal-rotation path
in the (unit) circle register (lines 1-10 in [Defne & Ebru] Protocol 19).
When investigating the variation of these two points on the unit circle under
the manipulation of the point P, all students recognized that the arcs between the point
P and its rotated-position remained invariant in the (unit) circle register (e.g., lines 30-
37 in [Cemre & Zafer] Protocol 17). At that point, the researcher introduced the new
function to the students so that it could map the angle of the point P to the ordinate of
its rotated-position (e.g., lines 38-41 in [Cemre & Zafer] Protocol 17). Except Zafer,
none of the other students associated this function with sine until the construction of
its graphical representation (e.g., lines 42-49 in [Cemre & Zafer] Protocol 17; lines 7-

271
12 in [Defne & Ebru] Protocol 17). Although Zafer associated this function with sine
based on its visual definition on the unit circle (line 42 in [Cemre & Zafer] Protocol
17), he did not reason about its symbolic representation in the (unit) circle register;
instead, he tried to reason in the symbolic register based only on the construction of its
graphical representation (lines 72-122 in [Cemre & Zafer] Protocol 17). In other
words, throughout Task 10, none of the students reasoned in the (unit) circle register
about the ordinate of the rotated-position of the point P as the sine value of the angle
corresponding to the rotated-position through combining the angle of the point P and
the angle of the rotation. So, in the following tasks (Tasks 11, 12, 15 and 16), the
researcher determined to provoke students to identify the abscissa/ordinate of the
rotated-position of the point P in the (unit) circle register in terms of cosine/sine in
accordance with the tasks’ themes (e.g., lines 1-29 in [Defne & Ebru] Protocol 18;
lines 1-15 in [Defne & Ebru] Protocol 19).
For example, in Task 11, the researcher provoked students to identify the
ordinate of the rotated position42 of the point P in terms of sine of the new angle (e.g.,
lines 22-31 in [Cemre & Zafer] Protocol 18; lines 1-22 in [Defne & Ebru] Protocol
20). Where, all students were able to identify (i) the principal arc corresponding to the
rotated position of the point P as 2x, and then, (ii) its ordinate as sine of 2x through
considering the definition of sine (from the arc corresponding to a point on the unit
circle into its ordinate) (e.g., lines 23-33 in [Cemre & Zafer] Protocol 18; lines 1-33 in
[Defne & Ebru] Protocol 20). It was the point that students had just started to reason
about a general form of the sine function from an arc, i.e., x, to the ordinate of another
arc defined dependently on x in the (unit) circle register. It was observed that in Task
12, 15 and 16, they were able to extend this reasoning into a general form of the cosine
function from an arc, i.e., x, to the abscissa of another arc defined dependently on x in
the (unit) circle register (e.g., lines 1-50 in [Defne & Ebru] Protocol 18; lines 1-19 in
[Defne & Ebru] Protocol 19).
42 It was a point on the unit circle that was constructed through rotating the point P by a marked angle, e.g.,
by marking the x angle corresponding to the point P.
272
In Task 1243, this reasoning prompted a distinct shift on their reasoning about
the relation between sine and cosine in the (unit) circle register. That is to say, they
were able to convert the relation between the directed measures of the adjacent
[opposite] side of the reference right triangle and the opposite [adjacent] side of its
rotated-counterpart by π/2 radian about the center in the (unit) circle register into the
equality between cos(x) [sin(x)] and sin(x+π/2) [-cos(x+π/2)] in the symbolic register
(e.g. lines 52-87 in [Defne & Ebru] Protocol 18). Moreover, they were able to extend
this reasoning based on the structure obtained through rotation by π/2 radian in the
counterclockwise direction into the reasoning on the structures obtained through
rotations by the integer multiples of π/2 radian in any directions (e.g., lines 89-117 in
[Defne & Ebru] Protocol 18), which emerged as a result of the teaching experiment
(e.g., lines 119-122 in [Defne & Ebru] Protocol 18). In special sense, Task 12 was the
first task that students made sense of the negative coefficient of –sine [–cosine]
function in the (unit) circle register through considering it as a function from the x
angle to the perpendicular line segment from the point corresponding to the (x±π) angle
to the x-axis [y-axis]. Furthermore, Task 12 was the first task that students had an
alternative visual focus referring to sine [cosine] in the (unit) circle register instead of
the opposite [adjacent] side of the reference right triangle. That is to say, students’
actions imply that they started to reason about sine [cosine] in the (unit) circle register
through exchanging their focuses between the opposite [adjacent] side of the reference
right triangle and its facing-side of the reference-rectangle44 (e.g., lines 104-115 in
[Defne & Ebru] Protocol 18). This point of view prompted in Modeling Task of the
teaching experiment, Task 17, students’ easily and truly modeling of the distance to
the point gotten in the car on the Ferris wheel throughout the turning (see Modeling
Task with Ferris Wheel: Modeling Process heading in Chapter 7).
43 In this task, after constructing the rotated-version of the reference right triangle about the origin by π/2
radian (Figure 6.33-Figure 6.35), discussions were done on their related legs in terms of sine and cosine.
44 We call a rectangle in the (unit) circle register as the “reference rectangle” that is restricted by the
coordinate axes and the perpendicular lines from a point on the (unit) circle to the axes (Figure 6.34).

273
[Cemre & Zafer] Protocol 17
(Cemre and Zafer cooperatively constructed a unit circle located on the origin with the 1
principal arc with respect to the researcher’s directions.) 2
Researcher: Today, we will discuss about a function… …mapping the angle (dragging 3
her index finger on the principal arc in the counterclockwise direction) to… …the 4
ordinate of another point on the circle… …you will construct after a while 5
regarding my directions… 6
Zafer: (Smiling) 7
Researcher: Ok. We will find a new point on this circle… …but it would not be an 8
arbitrary point… …it would be a point so that as you could animate the 9
representation point of the angle (pointing the point P on the screen), it would be 10
act equidistantly to this point (putting her right hand’s index finger on the point P 11
and thumb finger another point on the unit circle, and then, dragging her fingers 12
on the circle in the counterclockwise direction in the same speed)… 13
Cemre: Hmm… 14
Zafer: (After 4-second pause) how do we construct it [new point]? 15
(Cemre and Zafer cooperatively constructed a point on the unit circle, the point P+4, 16
through rotating the point P in the positive direction by a 4-radian fixed angle and 17
its corresponding y-component like in Figure 6.28 with respect to the researcher’s 18
directions. Where, 4-radian was preferred by Cemre and Zafer as a fixed rotation 19
measure on the unit circle.) 20
Researcher: How it is located here (pointing the point P+4 on the screen like in Figure 21
6.28)? 22
Zafer: Because it rotated by 4 radian (dragging his index finger on the unit circle in the 23
counterclockwise direction from the point P to the point P+4). 24
Cemre: Then, whole [circumference] is 6.28… …in the reverse direction (putting her 25
index finger on the point P and dragging in the clockwise direction), here is 2.28 26
(dragging her index finger from the point P to the point P' in the clockwise 27
direction). 28
Zafer: Uh-huh (nodding his head up and down). 29
Researcher: Ok. Now, please drag the point P. 30
Cemre: This part exists invariably between them [points P and P+4] (pointing the arc 31
from point P to the point P+4 in the counterclockwise direction on the screen like 32
in Figure 6.28). 33
Zafer: That’s to say, between them there’s a fixed distance… 34
Researcher: Yes, this distance is our rotation amount (pointing the arc from point P to 35
the point P' in the counterclockwise direction)… …that’s 4. 36
Cemre&Zafer: Uh-huh (nodding their heads up and down). 37
Researcher: Well… …now we will discuss about the function… …so that it is mapping 38
this green arc (dragging her index finger on the green arc in the counterclockwise 39
direction on the screen like in Figure 6.28) into this red line segment (dragging 40
her index finger on the red line segment up and down)… 41
Zafer: Its [new point’s] sine would be… 42
Cemre: Let’s we construct its traced graph. 43

274
(Cemre and Zafer cooperatively constructed the (x,𝑦𝑃) ordered-pair and its trace under 44
the animation of the point P like in Figure 6.29(a) with respect to the researcher’s 45
directions.) 46
Zafer: (Dragging the point P) 47
Cemre: Hmm… Here it is alike sine wave! 48
Zafer: But its start is a bit more different from sine… 49
Researcher: Yeah, it [traced-graph] resembles to sine… 50
Zafer: But it isn’t sine… 51
Cemre: Wait a minute! Yes, it isn’t [sine]. 52
Zafer: It is different. 53
Researcher: It is not y=sin(x) function. How do you determine this? 54
Zafer: From their starts for my part (putting his index finger on the intersection point of 55
the traced graph with the y-axis)… 56
Cemre: Hmm… …ok, why did it [traced graph] start from here (pointing the intersection 57
point of the traced graph with the y-axis on the screen like in Figure 6.29(a))? 58
Cemre&Zafer: (Looking to the screen without speaking throughout 11-second) 59
Researcher: Well, you mentioned the difference of this [traced] graph from sine (pointing 60
the traced graph on the screen). Now, I want you to plot sine graph, as well. 61
Cemre: (Plotting f(x)=sin(x) function’s graph. When the sine graph appeared on the 62
screen like in Figure 6.29(b)) aha! We move this [sine graph] there (putting her 63
index finger on the peak point of the sine graph in the (0,π) interval, and then 64
dragging in the positive direction horizontally rightward up to the positive peak 65
point of the traced graph). 66
Zafer: We move the black graph (putting his index finger on the positive peak point of the 67
traced graph) toward here (dragging his index finger horizontally leftward up to 68
the peak point of the sine graph in the (0,π) interval) or [sine graph] toward here 69
(dragging his index finger horizontally rightward from the peak point of the sine 70
graph in the (0,π) interval up to the positive peak point of the traced graph). 71
Researcher: So, how do you express this function (pointing the traced graph)? 72
Cemre: Just a moment! Let’s we think about it (coming closer to the screen like in Figure 73
6.29(b))! (After 6-second pause) here (pointing the first intersection of the traced 74
graph with the x-axis) is 2.3, is that so? 75
Zafer: Yeah, something like that... We should do something about its angle… That is, for 76
example, the angle of this (pointing the first intersection point of the traced graph 77
with the x-axis) in here (putting his index finger on the first intersection of the 78
traced graph with the x-axis)… …in order to bring there (dragging his index finger 79
leftward up to the origin), we subtract this amount of distance (dragging his index 80
finger left and right between the origin and the first intersection of the traced 81
graph with the x-axis) from this (putting his index finger on the first intersection 82
of the traced graph with the x-axis, and then dragging leftward on the x-axis up to 83
the origin)… 84
Cemre: In my part, you know here is 2.3 (putting her index finger on the first intersection 85
of the traced graph with the x-axis) if it was π, or about 3.14… …that is, here was 86
3.14 (putting her index finger on the intersection point of the sine graph with the 87
x-axis on π)… …that’s, if to sin(x), we added π (holding vertically her right hand 88
and then moving it rightward without changing its vertical stance), black [traced 89
graph] would start from here (putting her index finger on the intersection point of 90
the sine graph with the x-axis on π)… 91
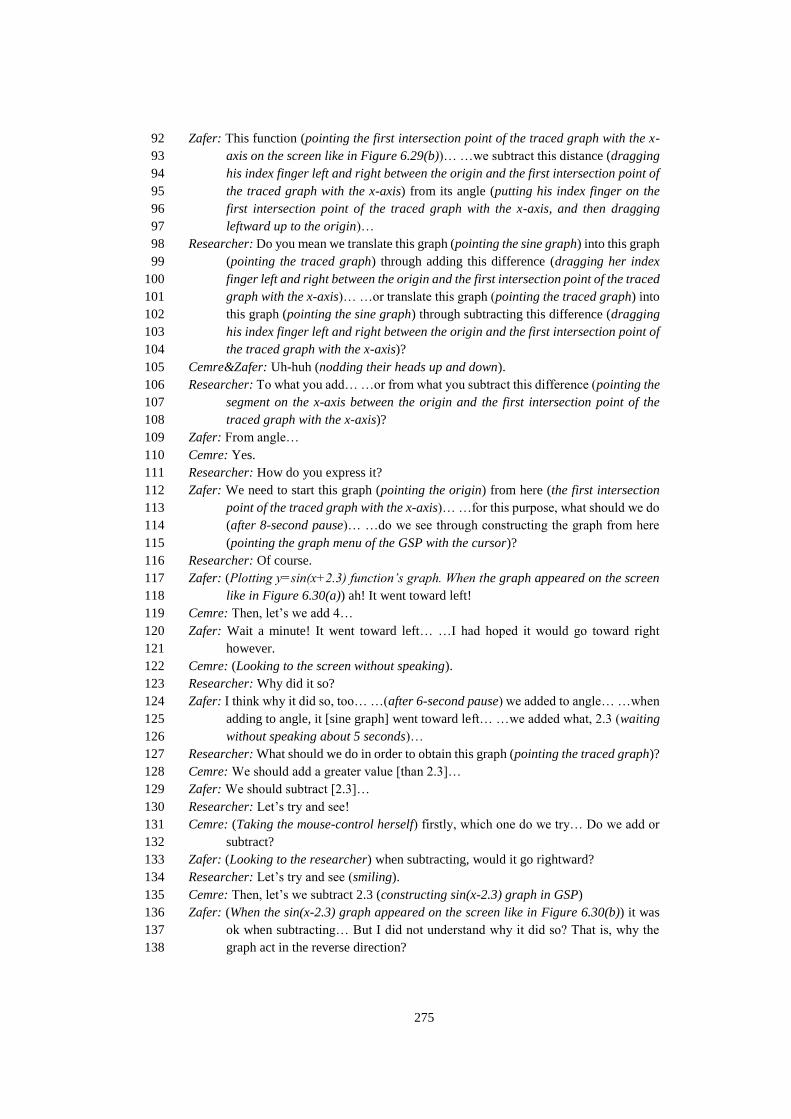
275
Zafer: This function (pointing the first intersection point of the traced graph with the x-92
axis on the screen like in Figure 6.29(b))… …we subtract this distance (dragging 93
his index finger left and right between the origin and the first intersection point of 94
the traced graph with the x-axis) from its angle (putting his index finger on the 95
first intersection point of the traced graph with the x-axis, and then dragging 96
leftward up to the origin)… 97
Researcher: Do you mean we translate this graph (pointing the sine graph) into this graph 98
(pointing the traced graph) through adding this difference (dragging her index 99
finger left and right between the origin and the first intersection point of the traced 100
graph with the x-axis)… …or translate this graph (pointing the traced graph) into 101
this graph (pointing the sine graph) through subtracting this difference (dragging 102
his index finger left and right between the origin and the first intersection point of 103
the traced graph with the x-axis)? 104
Cemre&Zafer: Uh-huh (nodding their heads up and down). 105
Researcher: To what you add… …or from what you subtract this difference (pointing the 106
segment on the x-axis between the origin and the first intersection point of the 107
traced graph with the x-axis)? 108
Zafer: From angle… 109
Cemre: Yes. 110
Researcher: How do you express it? 111
Zafer: We need to start this graph (pointing the origin) from here (the first intersection 112
point of the traced graph with the x-axis)… …for this purpose, what should we do 113
(after 8-second pause)… …do we see through constructing the graph from here 114
(pointing the graph menu of the GSP with the cursor)? 115
Researcher: Of course. 116
Zafer: (Plotting y=sin(x+2.3) function’s graph. When the graph appeared on the screen 117
like in Figure 6.30(a)) ah! It went toward left! 118
Cemre: Then, let’s we add 4… 119
Zafer: Wait a minute! It went toward left… …I had hoped it would go toward right 120
however. 121
Cemre: (Looking to the screen without speaking). 122
Researcher: Why did it so? 123
Zafer: I think why it did so, too… …(after 6-second pause) we added to angle… …when 124
adding to angle, it [sine graph] went toward left… …we added what, 2.3 (waiting 125
without speaking about 5 seconds)… 126
Researcher: What should we do in order to obtain this graph (pointing the traced graph)? 127
Cemre: We should add a greater value [than 2.3]… 128
Zafer: We should subtract [2.3]… 129
Researcher: Let’s try and see! 130
Cemre: (Taking the mouse-control herself) firstly, which one do we try… Do we add or 131
subtract? 132
Zafer: (Looking to the researcher) when subtracting, would it go rightward? 133
Researcher: Let’s try and see (smiling). 134
Cemre: Then, let’s we subtract 2.3 (constructing sin(x-2.3) graph in GSP) 135
Zafer: (When the sin(x-2.3) graph appeared on the screen like in Figure 6.30(b)) it was 136
ok when subtracting… But I did not understand why it did so? That is, why the 137
graph act in the reverse direction? 138
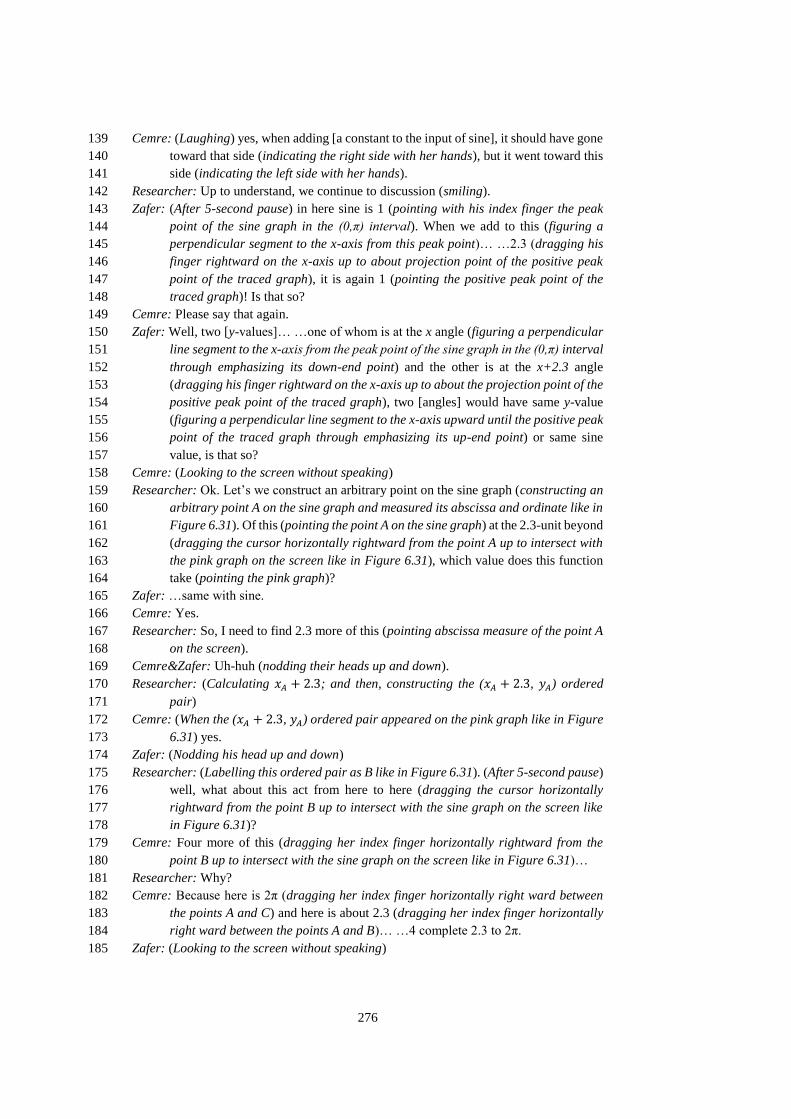
276
Cemre: (Laughing) yes, when adding [a constant to the input of sine], it should have gone 139
toward that side (indicating the right side with her hands), but it went toward this 140
side (indicating the left side with her hands). 141
Researcher: Up to understand, we continue to discussion (smiling). 142
Zafer: (After 5-second pause) in here sine is 1 (pointing with his index finger the peak 143
point of the sine graph in the (0,π) interval). When we add to this (figuring a 144
perpendicular segment to the x-axis from this peak point)… …2.3 (dragging his 145
finger rightward on the x-axis up to about projection point of the positive peak 146
point of the traced graph), it is again 1 (pointing the positive peak point of the 147
traced graph)! Is that so? 148
Cemre: Please say that again. 149
Zafer: Well, two [y-values]… …one of whom is at the x angle (figuring a perpendicular 150
line segment to the x-axis from the peak point of the sine graph in the (0,π) interval 151
through emphasizing its down-end point) and the other is at the x+2.3 angle 152
(dragging his finger rightward on the x-axis up to about the projection point of the 153
positive peak point of the traced graph), two [angles] would have same y-value 154
(figuring a perpendicular line segment to the x-axis upward until the positive peak 155
point of the traced graph through emphasizing its up-end point) or same sine 156
value, is that so? 157
Cemre: (Looking to the screen without speaking) 158
Researcher: Ok. Let’s we construct an arbitrary point on the sine graph (constructing an 159
arbitrary point A on the sine graph and measured its abscissa and ordinate like in 160
Figure 6.31). Of this (pointing the point A on the sine graph) at the 2.3-unit beyond 161
(dragging the cursor horizontally rightward from the point A up to intersect with 162
the pink graph on the screen like in Figure 6.31), which value does this function 163
take (pointing the pink graph)? 164
Zafer: …same with sine. 165
Cemre: Yes. 166
Researcher: So, I need to find 2.3 more of this (pointing abscissa measure of the point A 167
on the screen). 168
Cemre&Zafer: Uh-huh (nodding their heads up and down). 169
Researcher: (Calculating 𝑥𝐴 + 2.3; and then, constructing the (𝑥𝐴 + 2.3, 𝑦𝐴) ordered 170
pair) 171
Cemre: (When the (𝑥𝐴 + 2.3, 𝑦𝐴) ordered pair appeared on the pink graph like in Figure 172
6.31) yes. 173
Zafer: (Nodding his head up and down) 174
Researcher: (Labelling this ordered pair as B like in Figure 6.31). (After 5-second pause) 175
well, what about this act from here to here (dragging the cursor horizontally 176
rightward from the point B up to intersect with the sine graph on the screen like 177
in Figure 6.31)? 178
Cemre: Four more of this (dragging her index finger horizontally rightward from the 179
point B up to intersect with the sine graph on the screen like in Figure 6.31)… 180
Researcher: Why? 181
Cemre: Because here is 2π (dragging her index finger horizontally right ward between 182
the points A and C) and here is about 2.3 (dragging her index finger horizontally 183
right ward between the points A and B)… …4 complete 2.3 to 2π. 184
Zafer: (Looking to the screen without speaking) 185

277
Researcher: Let’s we see (calculating 𝑥𝐵 + 4; and then, constructing the (𝑥𝐵 + 4, 𝑦𝐴) 186
ordered pair as a point labelled as C). 187
Cemre: (When the (𝑥𝐵 + 4, 𝑦𝐴) ordered pair appeared on the screen like in Figure 6.31) 188
yes. 189
Zafer: Uh-huh (nodding his head up and down). 190
Researcher: If I drag the point A (dragging the point A on the sine graph), what do points 191
B and C do? 192
Zafer: Same thing [with point A]… 193
Cemre: They also act in the same way. 194
Zafer: Uh-huh (nodding his head up and down). 195
Researcher: Ok. Now, I want you not to lose your focus. There are three different points 196
on two different graphs (pointing the points A, B and C on the screen like in Figure 197
6.31). But I want you to concentrate on your focus. I am looking for this function’s 198
rule (pointing the pink graph) in terms of sine (pointing the blue graph). 199
Cemre&Zafer: Uh-huh (nodding their heads up and down). 200
Researcher: Let abscissa of this point be x (pointing the projection point of the point B 201
on the x-axis). Then, what do you say about here (pointing the projection point of 202
the point A on the x-axis)? 203
Cemre&Zafer: x minus 2.3… 204
Researcher: Ok. What about here (dragging her index finger on the perpendicular line 205
segment from the point A to the x-axis)? 206
Cemre: Sine of… 207
Zafer: …x minus 2.3. 208
Cemre: Yes, sin(x-2.3). 209
Zafer: (Nodding his head up and down) 210
Researcher: Is here (dragging her index finger on the perpendicular line segment from 211
the point A to the x-axis) same as here (dragging her index finger on the 212
perpendicular line segment from the point B to the x-axis)? 213
Zafer: Same. 214
Cemre: Yes. 215
Researcher: Then, the pink graph is mapping x angle (pointing the projection point of the 216
point B on the x-axis) into sin(x-2.3), isn’t it? 217
Cemre: Yes. 218
Zafer: (Nodding his head up and down) 219
Researcher: (After 4-second pause) well, here is x (pointing the projection point of the 220
point B on the x-axis). What about here (pointing the projection point of the point 221
C on the x-axis)? 222
Cemre: x plus four. 223
Zafer: (Looking to the screen without speaking) 224
Researcher: Is it ok, Zafer? 225
Zafer: Uh-huh (nodding his head up and down). 226
Researcher: When here is x plus four (pointing the projection point of the point C on the 227
x-axis), what do you say about here (dragging her index finger on the 228
perpendicular line segment from the point C to the x-axis)? 229
Zafer: sin(x+4) 230
Cemre: Yes. 231
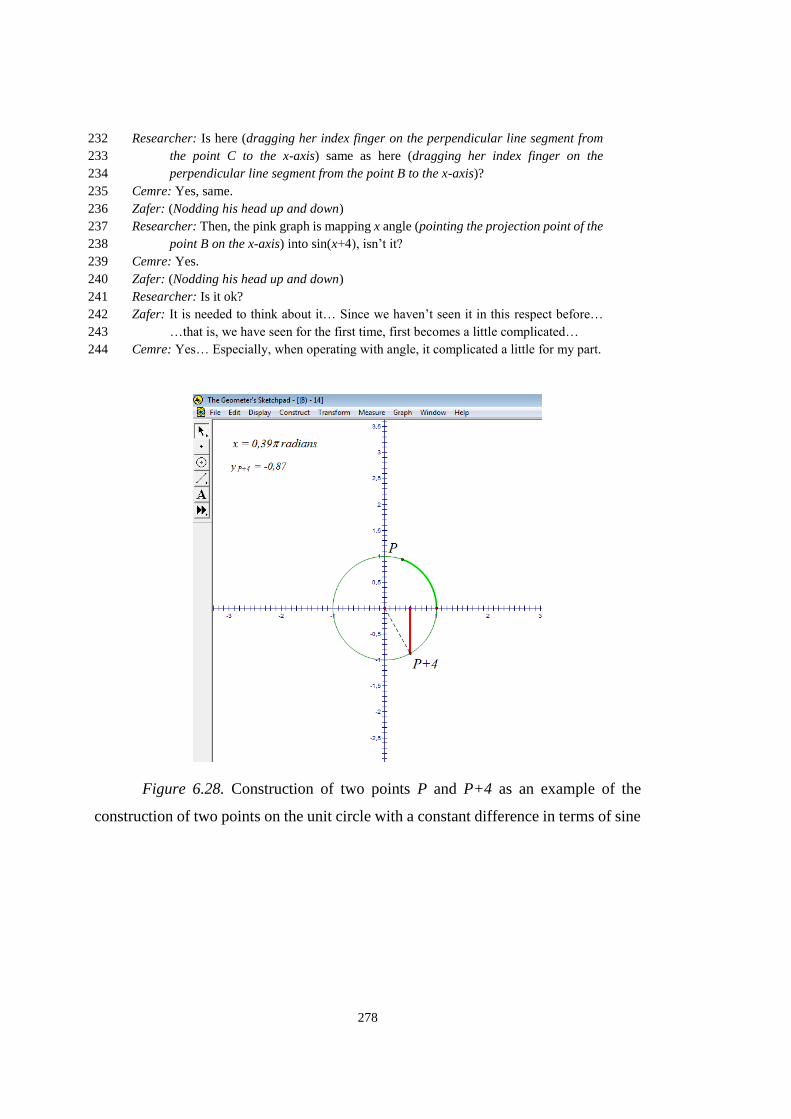
278
Researcher: Is here (dragging her index finger on the perpendicular line segment from 232
the point C to the x-axis) same as here (dragging her index finger on the 233
perpendicular line segment from the point B to the x-axis)? 234
Cemre: Yes, same. 235
Zafer: (Nodding his head up and down) 236
Researcher: Then, the pink graph is mapping x angle (pointing the projection point of the 237
point B on the x-axis) into sin(x+4), isn’t it? 238
Cemre: Yes. 239
Zafer: (Nodding his head up and down) 240
Researcher: Is it ok? 241
Zafer: It is needed to think about it… Since we haven’t seen it in this respect before… 242
…that is, we have seen for the first time, first becomes a little complicated… 243
Cemre: Yes… Especially, when operating with angle, it complicated a little for my part. 244
Figure 6.28. Construction of two points P and P+4 as an example of the
construction of two points on the unit circle with a constant difference in terms of sine

279
Figure 6.29. An example of the construction of the traced graph of the ordered-
pair (x, yP+4) in the graphical register so that yP+4 would refer to sin(x+4)
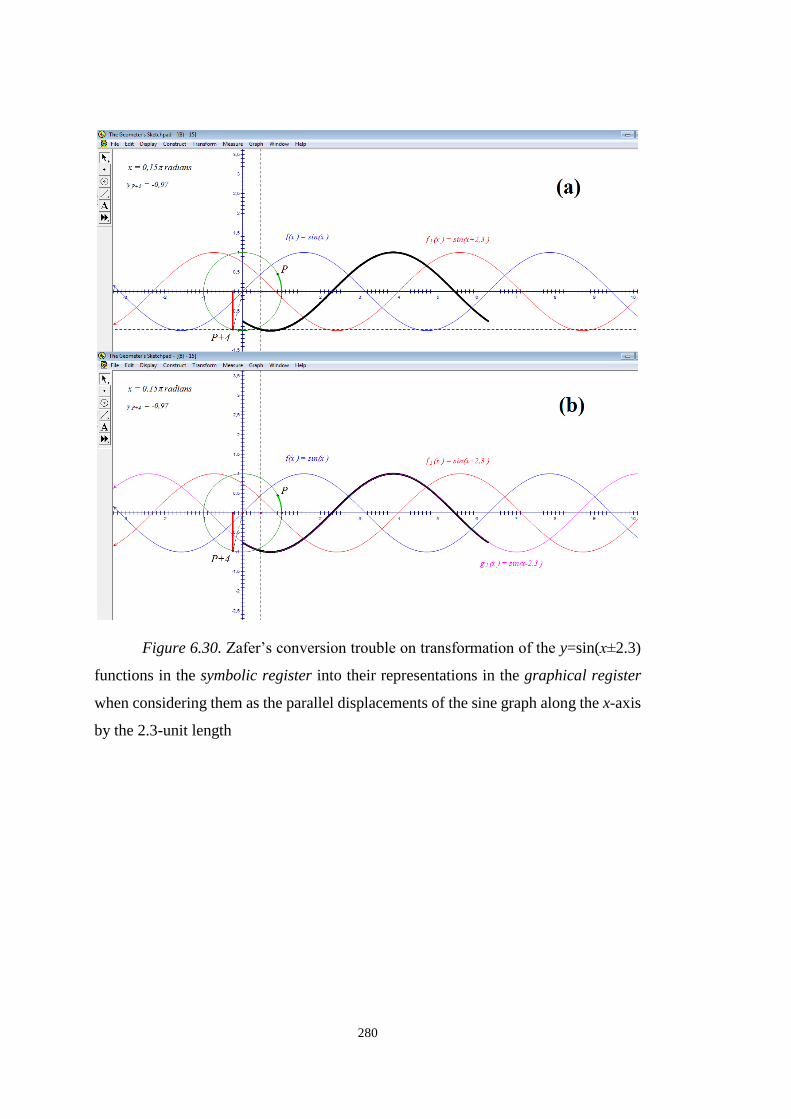
280
Figure 6.30. Zafer’s conversion trouble on transformation of the y=sin(x±2.3)
functions in the symbolic register into their representations in the graphical register
when considering them as the parallel displacements of the sine graph along the x-axis
by the 2.3-unit length

281
Figure 6.31. Construction of the parallel displacement of an arbitrary point A
on the sine graph along the x-axis by a constant value –e.g., 2.3– in the positive
direction; and then the new point’s parallel displacement along the x-axis by the
complement of this constant value into 2π –e.g., about 4.
[Defne & Ebru] Protocol 17
(Defne and Ebru cooperatively constructed a unit circle located on the origin with the 1
principal arc represented by the point P with respect to the researcher’s 2
directions; and then, rotated position of the point P in the positive direction by a 3
(π+4)-radian fixed angle, labelled as P'. Where, (π+4)-radian was preferred by 4
Defne and Ebru as a fixed rotation measure. Next, they were constructed traced 5
graph of the (principal angle,𝑦𝑃′) ordered-pair.) 6
Ebru: It [traced graph] resemble to sine. 7
Defne: Uh-huh… Differently, it [traced graph] started on the y-axis from a bit more above 8
(pointing with her pen the intersection point of the traced graph with the y-axis on 9
the screen like in Figure 6.32(a)) instead of zero (pointing the origin). That is, it 10
starts from above of this amount (dragging her pen up and down between the 11
origin and the intersection point of the traced graph with the y-axis). 12
Researcher: From graph menu, can you plot the sine graph. 13
Defne: (Plotting the f(x)= sin(x) graph like in Figure 6.32(b)) 14
Researcher: Is there a relation between this graph (pointing the sine graph on the screen 15
like in Figure 6.32(b)) and this graph (pointing the traced graph)? 16
Ebru: It is translated toward a bit more this side (indicating an interval through holding 17
her hands vertically parallel to each other; and then, moving her hands 18
horizontally rightward through keeping the interval between them same). 19
Researcher: Which one is translated? 20
Ebru: This one (pointing the traced graph on the screen like in like in Figure 6.32(b)). 21
Researcher: How do you think? 22
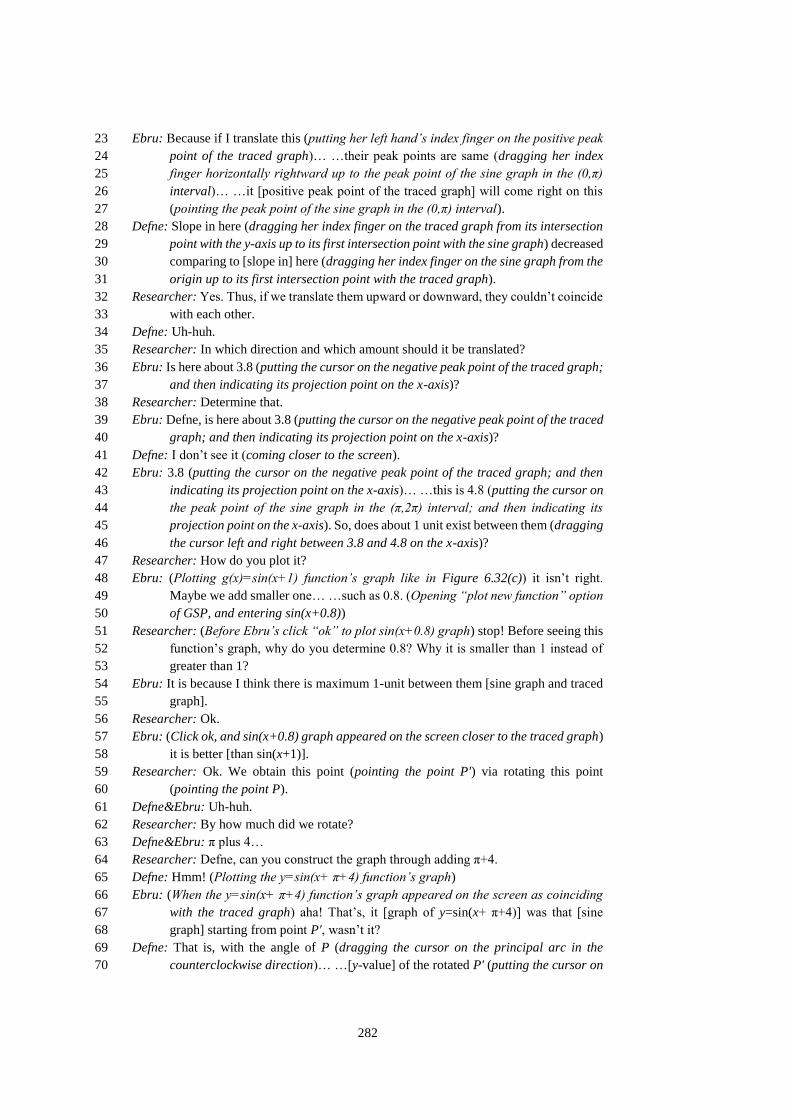
282
Ebru: Because if I translate this (putting her left hand’s index finger on the positive peak 23
point of the traced graph)… …their peak points are same (dragging her index 24
finger horizontally rightward up to the peak point of the sine graph in the (0,π) 25
interval)… …it [positive peak point of the traced graph] will come right on this 26
(pointing the peak point of the sine graph in the (0,π) interval). 27
Defne: Slope in here (dragging her index finger on the traced graph from its intersection 28
point with the y-axis up to its first intersection point with the sine graph) decreased 29
comparing to [slope in] here (dragging her index finger on the sine graph from the 30
origin up to its first intersection point with the traced graph). 31
Researcher: Yes. Thus, if we translate them upward or downward, they couldn’t coincide 32
with each other. 33
Defne: Uh-huh. 34
Researcher: In which direction and which amount should it be translated? 35
Ebru: Is here about 3.8 (putting the cursor on the negative peak point of the traced graph; 36
and then indicating its projection point on the x-axis)? 37
Researcher: Determine that. 38
Ebru: Defne, is here about 3.8 (putting the cursor on the negative peak point of the traced 39
graph; and then indicating its projection point on the x-axis)? 40
Defne: I don’t see it (coming closer to the screen). 41
Ebru: 3.8 (putting the cursor on the negative peak point of the traced graph; and then 42
indicating its projection point on the x-axis)… …this is 4.8 (putting the cursor on 43
the peak point of the sine graph in the (π,2π) interval; and then indicating its 44
projection point on the x-axis). So, does about 1 unit exist between them (dragging 45
the cursor left and right between 3.8 and 4.8 on the x-axis)? 46
Researcher: How do you plot it? 47
Ebru: (Plotting g(x)=sin(x+1) function’s graph like in Figure 6.32(c)) it isn’t right. 48
Maybe we add smaller one… …such as 0.8. (Opening “plot new function” option 49
of GSP, and entering sin(x+0.8)) 50
Researcher: (Before Ebru’s click “ok” to plot sin(x+0.8) graph) stop! Before seeing this 51
function’s graph, why do you determine 0.8? Why it is smaller than 1 instead of 52
greater than 1? 53
Ebru: It is because I think there is maximum 1-unit between them [sine graph and traced 54
graph]. 55
Researcher: Ok. 56
Ebru: (Click ok, and sin(x+0.8) graph appeared on the screen closer to the traced graph) 57
it is better [than sin(x+1)]. 58
Researcher: Ok. We obtain this point (pointing the point P') via rotating this point 59
(pointing the point P). 60
Defne&Ebru: Uh-huh. 61
Researcher: By how much did we rotate? 62
Defne&Ebru: π plus 4… 63
Researcher: Defne, can you construct the graph through adding π+4. 64
Defne: Hmm! (Plotting the y=sin(x+ π+4) function’s graph) 65
Ebru: (When the y=sin(x+ π+4) function’s graph appeared on the screen as coinciding 66
with the traced graph) aha! That’s, it [graph of y=sin(x+ π+4)] was that [sine 67
graph] starting from point P', wasn’t it? 68
Defne: That is, with the angle of P (dragging the cursor on the principal arc in the 69
counterclockwise direction)… …[y-value] of the rotated P' (putting the cursor on 70
283
the point P')… …by rotation amount (dragging the cursor from the point P to P' 71
in the counterclockwise direction)… …that is, π+4, when we add it [rotation 72
amount] with the angle of P… …then it [sin(x+π+4)] give us this graph (pointing 73
the traced graph). 74
Researcher: Is here π+4 (dragging her pen on the circle from the point P to P' in the 75
counterclockwise direction)? 76
Defne: No… But it [arc from the point P to the point P' in the counterclockwise direction] 77
implies same where. That is, it [point P] went in this way (dragging the cursor on 78
the arc from the point P to P' in the counterclockwise direction), or in this way 79
(figuring with the cursor initially a full round, and then the principal arc from the 80
point P to the point P' in the counterclockwise direction)… …these are same 81
things. 82
Ebru: Uh-huh. 83

284
Figure 6.32. An example of the construction of the traced graph of the ordered-
pair (x, yP') in the graphical register so that yP' would refer to sin(x+π+4)
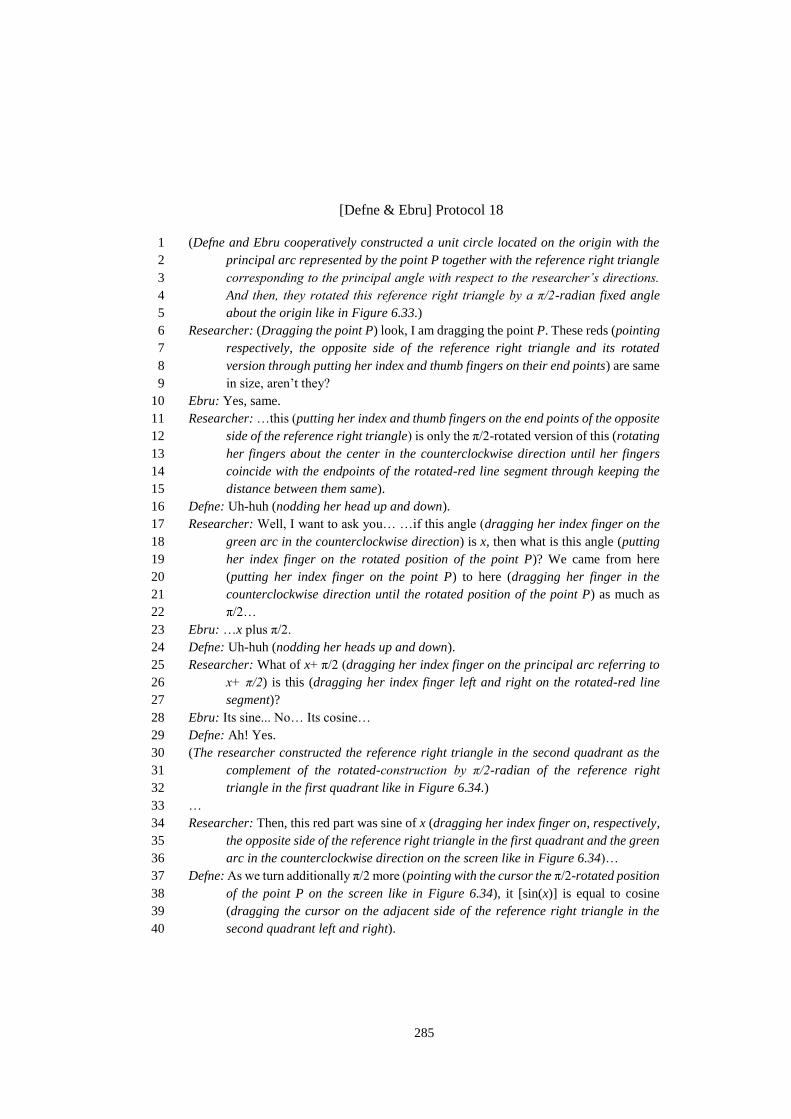
285
[Defne & Ebru] Protocol 18
(Defne and Ebru cooperatively constructed a unit circle located on the origin with the 1
principal arc represented by the point P together with the reference right triangle 2
corresponding to the principal angle with respect to the researcher’s directions. 3
And then, they rotated this reference right triangle by a π/2-radian fixed angle 4
about the origin like in Figure 6.33.) 5
Researcher: (Dragging the point P) look, I am dragging the point P. These reds (pointing 6
respectively, the opposite side of the reference right triangle and its rotated 7
version through putting her index and thumb fingers on their end points) are same 8
in size, aren’t they? 9
Ebru: Yes, same. 10
Researcher: …this (putting her index and thumb fingers on the end points of the opposite 11
side of the reference right triangle) is only the π/2-rotated version of this (rotating 12
her fingers about the center in the counterclockwise direction until her fingers 13
coincide with the endpoints of the rotated-red line segment through keeping the 14
distance between them same). 15
Defne: Uh-huh (nodding her head up and down). 16
Researcher: Well, I want to ask you… …if this angle (dragging her index finger on the 17
green arc in the counterclockwise direction) is x, then what is this angle (putting 18
her index finger on the rotated position of the point P)? We came from here 19
(putting her index finger on the point P) to here (dragging her finger in the 20
counterclockwise direction until the rotated position of the point P) as much as 21
π/2… 22
Ebru: …x plus π/2. 23
Defne: Uh-huh (nodding her heads up and down). 24
Researcher: What of x+ π/2 (dragging her index finger on the principal arc referring to 25
x+ π/2) is this (dragging her index finger left and right on the rotated-red line 26
segment)? 27
Ebru: Its sine... No… Its cosine… 28
Defne: Ah! Yes. 29
(The researcher constructed the reference right triangle in the second quadrant as the 30
complement of the rotated-construction by π/2-radian of the reference right 31
triangle in the first quadrant like in Figure 6.34.) 32
… 33
Researcher: Then, this red part was sine of x (dragging her index finger on, respectively, 34
the opposite side of the reference right triangle in the first quadrant and the green 35
arc in the counterclockwise direction on the screen like in Figure 6.34)… 36
Defne: As we turn additionally π/2 more (pointing with the cursor the π/2-rotated position 37
of the point P on the screen like in Figure 6.34), it [sin(x)] is equal to cosine 38
(dragging the cursor on the adjacent side of the reference right triangle in the 39
second quadrant left and right). 40
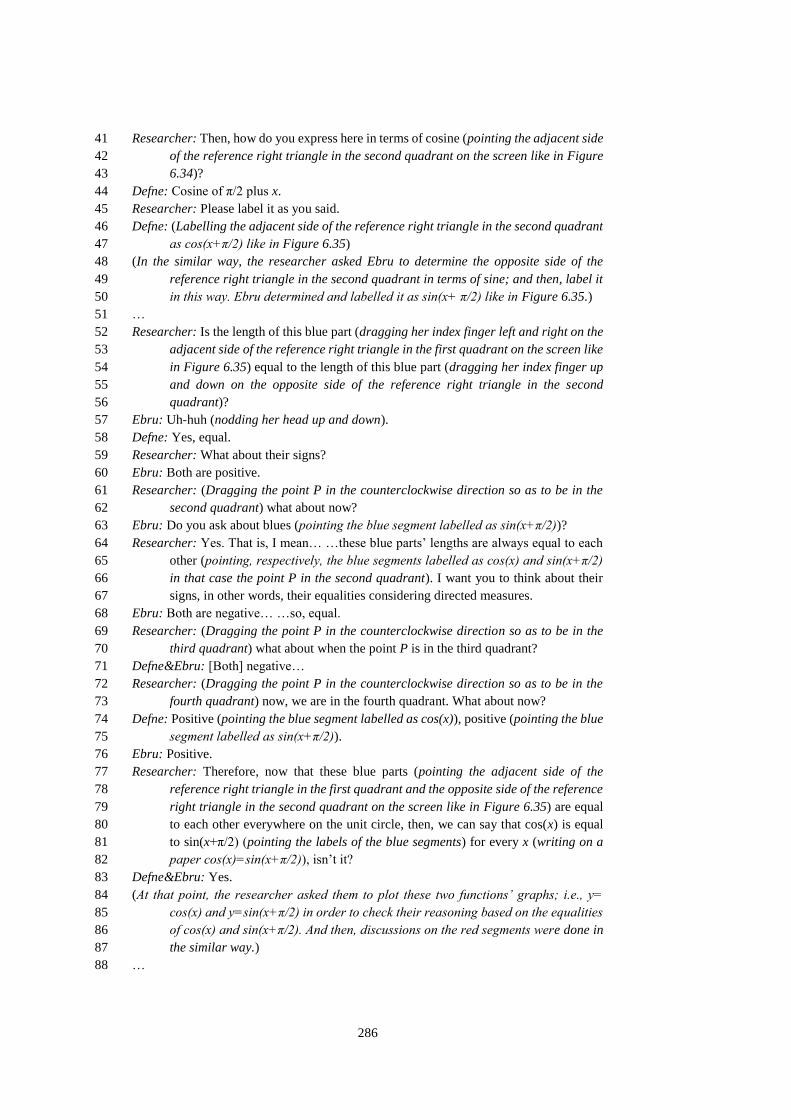
286
Researcher: Then, how do you express here in terms of cosine (pointing the adjacent side 41
of the reference right triangle in the second quadrant on the screen like in Figure 42
6.34)? 43
Defne: Cosine of π/2 plus x. 44
Researcher: Please label it as you said. 45
Defne: (Labelling the adjacent side of the reference right triangle in the second quadrant 46
as cos(x+π/2) like in Figure 6.35) 47
(In the similar way, the researcher asked Ebru to determine the opposite side of the 48
reference right triangle in the second quadrant in terms of sine; and then, label it 49
in this way. Ebru determined and labelled it as sin(x+ π/2) like in Figure 6.35.) 50
… 51
Researcher: Is the length of this blue part (dragging her index finger left and right on the 52
adjacent side of the reference right triangle in the first quadrant on the screen like 53
in Figure 6.35) equal to the length of this blue part (dragging her index finger up 54
and down on the opposite side of the reference right triangle in the second 55
quadrant)? 56
Ebru: Uh-huh (nodding her head up and down). 57
Defne: Yes, equal. 58
Researcher: What about their signs? 59
Ebru: Both are positive. 60
Researcher: (Dragging the point P in the counterclockwise direction so as to be in the 61
second quadrant) what about now? 62
Ebru: Do you ask about blues (pointing the blue segment labelled as sin(x+π/2))? 63
Researcher: Yes. That is, I mean… …these blue parts’ lengths are always equal to each 64
other (pointing, respectively, the blue segments labelled as cos(x) and sin(x+π/2) 65
in that case the point P in the second quadrant). I want you to think about their 66
signs, in other words, their equalities considering directed measures. 67
Ebru: Both are negative… …so, equal. 68
Researcher: (Dragging the point P in the counterclockwise direction so as to be in the 69
third quadrant) what about when the point P is in the third quadrant? 70
Defne&Ebru: [Both] negative… 71
Researcher: (Dragging the point P in the counterclockwise direction so as to be in the 72
fourth quadrant) now, we are in the fourth quadrant. What about now? 73
Defne: Positive (pointing the blue segment labelled as cos(x)), positive (pointing the blue 74
segment labelled as sin(x+π/2)). 75
Ebru: Positive. 76
Researcher: Therefore, now that these blue parts (pointing the adjacent side of the 77
reference right triangle in the first quadrant and the opposite side of the reference 78
right triangle in the second quadrant on the screen like in Figure 6.35) are equal 79
to each other everywhere on the unit circle, then, we can say that cos(x) is equal 80
to sin(x+π/2) (pointing the labels of the blue segments) for every x (writing on a 81
paper cos(x)=sin(x+π/2)), isn’t it? 82
Defne&Ebru: Yes. 83
(At that point, the researcher asked them to plot these two functions’ graphs; i.e., y= 84
cos(x) and y=sin(x+π/2) in order to check their reasoning based on the equalities 85
of cos(x) and sin(x+π/2). And then, discussions on the red segments were done in 86
the similar way.) 87
… 88

287
Researcher: If I turned from here (putting her right hand’s index and thumb fingers on 89
the end points of the adjacent side of the reference right triangle from the point P; 90
at that time, it was in the first quadrant like in Figure 6.35) to here (rotating her 91
thumb finger by π/2 in the clockwise direction about her index finger on the 92
origin), what would you express this (putting her fingers on the negative y-axis so 93
as to indicate the rotated-position of the adjacent side of the reference right 94
triangle from the point P)? 95
Defne: π/2… …minus [π/2]… …umm, minus sine of… …x minus π/2. 96
Researcher: Then, cos(x) is equal to what? 97
Defne: sin(x-π/2). 98
Ebru: (Nodding her head up and down) 99
(At that point, the researcher asked Defne to plot these two functions’ graphs; i.e., y= 100
cos(x) and y=-sin(x-π/2) in order to check their reasoning based on the equalities 101
of cos(x) and -sin(x-π/2).) 102
… 103
Researcher: Ebru, what about when I turned from here to here (putting her right hand’s 104
index and thumb fingers on the end points of the adjacent side of the reference 105
right triangle from the point P; and then, rotating them so as to indicate 3π/2-106
rotation in the counterclockwise direction by the center)? 107
Ebru: 3π/2… …plus 3π/2… …minus sine of… …x plus 3π/2. 108
Defne: cos(x) (lying her head on her right shoulder) is equal to minus sine… x plus 3π/2 109
(changing her head’s position from her right shoulder to her left shoulder as if 110
following the 3π/2-radian rotation path). 111
Ebru: Yes. 112
Researcher: Please check that by graphing. 113
Ebru: (Plotting y=-sin(x+3π/2). When its graph was appeared on the screen as 114
coinciding with y=cos(x) graph) uh-huh, true. 115
(Similar discussions on transformations of sine and cosine of (x±kπ/2) in to sine and 116
cosine of x symbolically were done.) 117
… 118
Defne: How easy it was! I had been always confused about them [transformations of sine 119
and cosine of (x±kπ/2) in terms of x symbolically]. 120
Ebru: Me too... (After 3-second pause) today was very useful. 121
Defne: Exactly! 122
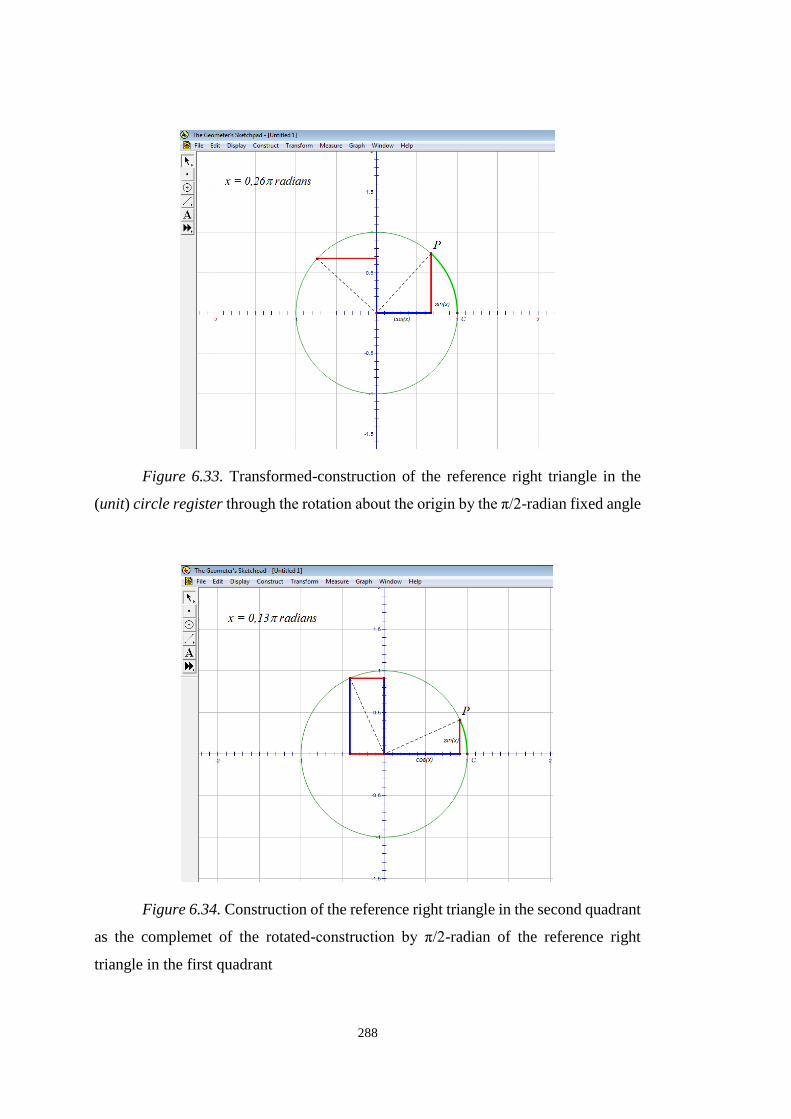
288
Figure 6.33. Transformed-construction of the reference right triangle in the
(unit) circle register through the rotation about the origin by the π/2-radian fixed angle
Figure 6.34. Construction of the reference right triangle in the second quadrant
as the complemet of the rotated-construction by π/2-radian of the reference right
triangle in the first quadrant
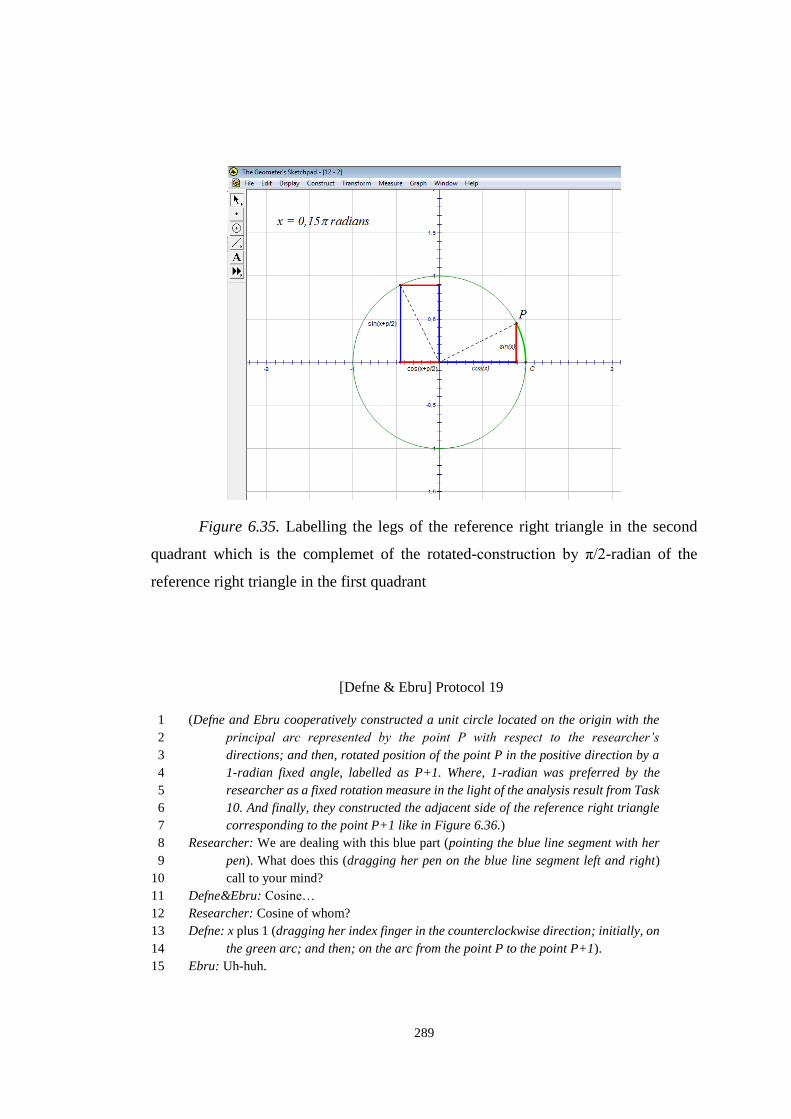
289
Figure 6.35. Labelling the legs of the reference right triangle in the second
quadrant which is the complemet of the rotated-construction by π/2-radian of the
reference right triangle in the first quadrant
[Defne & Ebru] Protocol 19
(Defne and Ebru cooperatively constructed a unit circle located on the origin with the 1
principal arc represented by the point P with respect to the researcher’s 2
directions; and then, rotated position of the point P in the positive direction by a 3
1-radian fixed angle, labelled as P+1. Where, 1-radian was preferred by the 4
researcher as a fixed rotation measure in the light of the analysis result from Task 5
10. And finally, they constructed the adjacent side of the reference right triangle 6
corresponding to the point P+1 like in Figure 6.36.) 7
Researcher: We are dealing with this blue part (pointing the blue line segment with her 8
pen). What does this (dragging her pen on the blue line segment left and right) 9
call to your mind? 10
Defne&Ebru: Cosine… 11
Researcher: Cosine of whom? 12
Defne: x plus 1 (dragging her index finger in the counterclockwise direction; initially, on 13
the green arc; and then; on the arc from the point P to the point P+1). 14
Ebru: Uh-huh. 15

290
(At that point, the researcher asked students to measure abscissa of the point P+1; and 16
then, to calculate cos(x+1); and finally, to control of these two measures under 17
the manipulation of the point P in order to foster their understanding about these 18
two measures’ equalities.) 19
… 20
Researcher: Cosine of x (pointing with the cursor the pink line segment on the screen like 21
in Figure 6.36) takes the values between whom? 22
Ebru: …minus one and plus one. 23
Defne: Yes. 24
Researcher: What about cosine of x+1 (pointing with the cursor the blue line segment)? 25
Defne: Same… …minus one and plus one… 26
Ebru: Uh-huh (nodding her head up and down). 27
Researcher: Ok. (When dragging the point P in the first quadrant of the unit circle in the 28
counterclockwise direction) at which point, P or P+1… …cosine reaches the 29
minus 1 value earlier than the other? 30
Defne&Ebru: P+1. 31
Researcher: Ok (dropping the point P so as the point P+1 to be on the negative x-axis). 32
After how much turning, will the point P reach here (dragging the cursor on the 33
arc from the point P to the point P+1 in the counterclockwise direction)? 34
Defne: After 1 unit [radian] turning (dragging her index finger on the arc from the point 35
P to the point P+1 in the counterclockwise direction). 36
Ebru: (Nodding her head up and down) 37
Researcher: Why? 38
Ebru: Because we constructed it [point P+1] via rotating [point P] by 1 [radian]… 39
(At that point, the researcher asked students to plot both y=cos(x) and y=cos(x+1) 40
functions’ graphs like in Figure 6.37.) 41
… 42
Researcher: Which graph … …reaches the minus 1 value earlier than the other? This one 43
or this one (pointing respectively cos(x) and cos(x+1) functions’ graphs on the 44
screen like in Figure 6.37)? 45
Ebru: This one (pointing the negative peak point of the blue graph in the (1,3) interval). 46
Defne: Yes, this reaches one unit later (pointing the negative peak point of the pink graph 47
in the (π/2,3π/2) interval; and then, the negative peak point of the blue graph in 48
the (1,3) interval on the screen like in Figure 6.37). 49
Ebru: Uh-huh (nodding her head up and down). 50
Researcher: What do you say if you compare cos(x+1) graph with cos(x) graph (pointing 51
respectively blue and pink graphs on the screen like in Figure 6.37)? 52
Defne: It [graph of cos(x+1)] went one-unit leftward. 53
Ebru: (Nodding her head up and down) 54
Researcher: Why? 55
Ebru: Because earlier blue reaches to -1 than the other (pointing -1 on the x-axis on the 56
screen like in Figure 6.37). Here also blue one reaches -1 earlier (pointing the 57
negative peak point of the blue graph in the (1,3) interval). 58
Defne: Uh-huh (nodding her head up and down). 59
… 60
Researcher: Well, cos(x) graph horizontally translated one-unit left (indicating an 61
interval through holding her hands vertically parallel to each other; and then, 62

291
moving her hands horizontally leftward through keeping the interval between them 63
same). 64
Defne&Ebru: (Nodding their heads up and down) 65
Researcher: Did its period change? 66
Defne: No. 67
Ebru: (Shaking her head right and left) 68
Defne: Again 2π. 69
Ebru: Uh-huh. 70
Figure 6.36. Construction of two points P and P+1 as an example of the
construction of two points on the unit circle with a constant difference in terms of
cosine
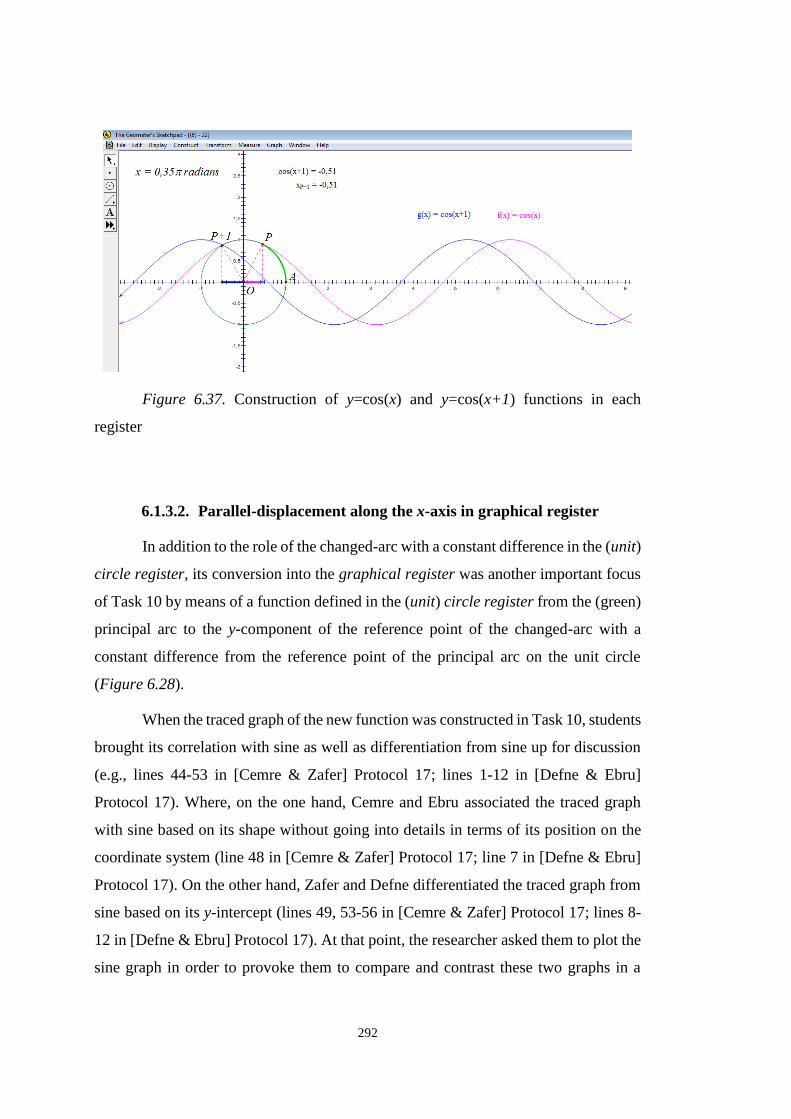
292
Figure 6.37. Construction of y=cos(x) and y=cos(x+1) functions in each
register
6.1.3.2. Parallel-displacement along the x-axis in graphical register
In addition to the role of the changed-arc with a constant difference in the (unit)
circle register, its conversion into the graphical register was another important focus
of Task 10 by means of a function defined in the (unit) circle register from the (green)
principal arc to the y-component of the reference point of the changed-arc with a
constant difference from the reference point of the principal arc on the unit circle
(Figure 6.28).
When the traced graph of the new function was constructed in Task 10, students
brought its correlation with sine as well as differentiation from sine up for discussion
(e.g., lines 44-53 in [Cemre & Zafer] Protocol 17; lines 1-12 in [Defne & Ebru]
Protocol 17). Where, on the one hand, Cemre and Ebru associated the traced graph
with sine based on its shape without going into details in terms of its position on the
coordinate system (line 48 in [Cemre & Zafer] Protocol 17; line 7 in [Defne & Ebru]
Protocol 17). On the other hand, Zafer and Defne differentiated the traced graph from
sine based on its y-intercept (lines 49, 53-56 in [Cemre & Zafer] Protocol 17; lines 8-
12 in [Defne & Ebru] Protocol 17). At that point, the researcher asked them to plot the
sine graph in order to provoke them to compare and contrast these two graphs in a
293
more detailed way (lines 60-61 in [Cemre & Zafer] Protocol 17; lines 13 in [Defne &
Ebru] Protocol 17).
When the sine graph appeared on the screen together with the traced graph
(Figure 6.29(b) and Figure 6.32(b)), except Defne, all other students reasoned about
these two graphs as the parallel displacement of each other along the x-axis (e.g., lines
62-71 in [Cemre & Zafer] Protocol 17; lines 14-31 in [Defne & Ebru] Protocol 17).
Where, their actions’ and language imply that Ebru reasoned about the sine graph
(Figure 6.32(b)) as the parallel displacement of the traced graph along the x-axis in the
positive direction (lines 23-27, 36-46 in [Defne & Ebru] Protocol 17); Cemre reasoned
about the traced graph (Figure 6.29(b)) as the parallel displacement of the sine graph
along the x-axis in the positive direction (e.g., lines 62-66 in [Cemre & Zafer] Protocol
17); and Zafer reasoned in two ways: (i) the traced graph (Figure 6.29(b)) as the
parallel displacement of the sine graph along the x-axis in the positive direction, as
well as (ii) the sine graph (Figure 6.29(b)) as the parallel displacement of the traced
graph along the x-axis in the negative direction (e.g. lines 67-71 in [Cemre & Zafer]
Protocol 17).
At that point, the researcher encouraged them to reason about the parallel
displacement idea in a more detailed way (e.g., line 72 in [Cemre & Zafer] Protocol
17; line 35 in [Defne & Ebru] Protocol 17). Their initial reasoning step was to
determine the parallel displacement amount through focusing on the distance between
the corresponding points of two graphs that were selected according to their
preferences. For example, while Cemre and Zafer determined the distance as about 2.3
unit through focusing on the distance between the origin45 and the first intersection
point of the traced graph with the x-axis (e.g. lines 73-105 in [Cemre & Zafer] Protocol
17), Ebru determined the distance as about 1 unit through focusing on the distance
between the negative peak points of the traced graph and the sine graph in the (0,2π)
interval (e.g. lines 36-46 in [Defne & Ebru] Protocol 17).
45 The origin is one of the intersection points of the sine graph with the x-axis.

294
Their next reasoning step was to define the function represented by the traced
graph regarding sine in the symbolic register. During that phase, they were aware that
these distances would affect the input of sine as a constant (e.g., lines 73-110 in [Cemre
& Zafer] Protocol 17; lines 35-50 in [Defne & Ebru] Protocol 17). When thinking on
the sign of this constant in the symbolic register, from students’ language and actions,
the researcher inferred that their concept images on the graphs’ parallel displacements
along the x-axis in the graphical register were including a conjecture on the conversion
of the positive [negative] direction of the parallel displacement along the x-axis in the
graphical register into the positive [negative] sign of the constant affecting the input
variable in the symbolic register (e.g., lines 76-122, 124-132, 136-166 in [Cemre &
Zafer] Protocol 17; lines 15-27, 35-50 in [Defne & Ebru] Protocol 17).
This wrong-conjecture, on the one hand, caused Cemre’s and Zafer’s confusion
on the conversion of the traced graph in the graphical register into its symbolic
representation in terms of sine (lines 124-129, 136-166 in [Cemre & Zafer] Protocol
17). In other words, they confused about the location of the graph of y=sin(x+2.3) on
the left with respect to the sine graph on the coordinate system. However, on the other
hand, this conjecture did not cause any confusion for Ebru as a consequence of her
incoherent-assumptions on the source-function of the transformation in the graphical
register and the symbolic register. That is to say, she assumed in the graphical register
the traced graph (Figure 6.32(b)) as the source-function by means of the parallel
displacement along the x-axis in the positive direction (lines 23-27, 35-46 in [Defne &
Ebru] Protocol 17); conversely, in the symbolic register, she manipulated the sine
function (i.e., target-function of transformation) through adding the parallel
displacement amount between two graphs to the input of sine as a constant so as to
express the traced-function (lines 15-27, 35-50 in [Defne & Ebru] Protocol 17). So,
her conjecture on the conversion of the positive direction of the parallel displacement
along the x-axis in the graphical register into the positive sign of the constant affecting
the input variable in the symbolic register did not bring forth any confusion as a
consequence of her failure to preserve her assumption on the source-function and
target-function of transformation coherently in the graphical register and the symbolic
register. Although the researcher was aware of Ebru’s this problematic reasoning, she

295
did not provoke Ebru to reason about this aspect in a more detailed way in the
discussion process of Task 10 as a consequence of her group friend’s, Defne’s,
inability to reason about these two graphs as the parallel displacement of each other
along the x-axis.
Throughout Task 10, differently from others, Defne reasoned about these two
graphs through comparing their slopes with each other but focusing only on their
restricted parts from their y-intercepts up to their first intersection points (lines 28-31
in [Defne & Ebru] Protocol 17). Despite of the researcher’s provocation her into the
reasoning based on translation (e.g. lines 32-35 in [Defne & Ebru] Protocol 17), she
made no interpretation about these two graphs as the parallel displacement of each
other along the x-axis throughout Task 10 even when Ebru was reasoning in that way
(lines 35-58 in [Defne & Ebru] Protocol 17). Based on her keeping silent, the
researcher inferred that she did not recognize that the traced graph had the same shape
with the sine graph. In other words, she did not aware that the traced graph and the
sine graph would coincide with each other if their positions on the coordinate plane
were changed horizontally in the appropriate amount and appropriate direction.
Therefore, the researcher asked Defne to explain on a paper her understandings from
the discussions of Task 10.
Initially, Defne wrote f(x)=sin(x+5) function symbolically (Figure 6.38(1));
and then, drew y=sin(x) function’s graph in the (0,2π) interval (Figure 6.38(2)); finally,
constructed another graph so as to refer the graph of f(x)=sin(x+5) in the same interval
(Figure 6.38(3)) through uttering “it [graph of sin(x+5)] would start a bit more above
(putting her pen on the y-axis a bit more above the origin but below 1)… …its slope
would decrease (drawing a curve starting from this point through decreasing its slope
comparing with sine) and it [graph of sin(x+5)] would go toward 1 like that (continuing
her drawing so as to coincide with the peak point of the sine graph in the (0,π)
interval).” Her constructions (Figure 6.38) and articulations imply that her reasoning
in the graphical register about a function defined symbolically as y=sin(x+c) was
including an over-generalization of her comparison between the traced graph and the
sine graph in GSP environment (Figure 6.32(b)). As it was mentioned before, her
296
comparison in GSP environment was a restricted-comparison of these two graphs
instead of comparing them as a whole. That is to say, she compared the traced graph
with the sine graph in terms of their slopes and y-intercepts but based only on their
restricted-parts from their y-intercepts up to their first intersection points with each
other; instead of comparing their graphs as a whole. At that point, the researcher
inferred that her restricted focus on these graphs prevented her from seeing these two
graphs as a parallel displacement of each other. So, considering Ebru’s and Defne’s
quite different reasoning focusses on comparison of two graphs (parallel displacement
versus their slopes and y-intercepts in a restricted interval), as well as their problematic
reasoning parts (regarding source and target functions of the parallel displacement
versus over generalization of slopes and y-intercepts) in the graphical register, the
researcher preferred to postpone discussions in a more detailed way on these aspects
to following episodes, namely, Task 12 and 15.

297
Figure 6.38. At the end of Task 10, Defne’s constructions on a paper when
reasoning about f(x)=sin(x+5) function’s graph
298
On the other hand, as a consequence of Cemre’s and Zafer’s confusion about
the location of the graph of y=sin(x+2.3) [y=sin(x-2.3)] on the left [right] with respect
to sine, the researcher provoked them to reason about corresponding points of two
graphs in a more detailed way. For this purpose, the researcher constructed an arbitrary
point on the sine graph, and then, its two purposively-determined parallel
displacements along the x-axis taking “measure”, “calculate” and “plot as (x,y)”
advantages of GSP so as one of them to be on the graph of y=sin(x-2.3) and the other
to be on the next periodic wave of the sine graph (see points A, B and C in Figure
6.31). Throughout this construction process, it was observed that neither Cemre nor
Zafer encountered a trouble with their conjecture that associated the positive [negative]
direction of the parallel displacement along the x-axis with the positive [negative] sign
of the constant term added to x in the symbolic register (lines 159-204 in [Cemre &
Zafer] Protocol 17). This was because this construction process was including the
parallel displacement of the points along the x-axis, which required only expressing
their abscissas as an additive structure with respect to the abscissa of the point A rather
than expressing their ordinates dependently on their abscissas in the symbolic register.
For example, when constructing the point B as the parallel displacement of the point
A along the x-axis by 2.3 unit in the positive direction (Figure 6.31), the abscissa of
the point B was expressed as xA+2.3, and its ordinate was considered as equal to yA
without reasoning about it dependently on xA or xB (lines 163-180 in [Cemre & Zafer]
Protocol 17).
However, conversion of the parallel displacement of these two graphs along
the x-axis in the graphical register into the symbolic register required identifying the
ordinate of the point B dependently on its abscissa with respect to sine (e.g. lines 205-
240 in [Cemre & Zafer] Protocol 17). In order to ease their identification process, the
researcher motivated Cemre and Zafer to consider the abscissa of the point B as x (lines
205-210 and 227-236 in [Cemre & Zafer] Protocol 17), and then, reason about the
ordinate of the point B with respect to sine dependent on x. In this reasoning process,
the researcher provoked them to reason through changing their attention-focus
hierarchically in a rectangular path among four points in the graphical register: (i) the
point B (Figure 6.31) (ii) its projection point on the x-axis, (iii) the projection point of

299
the point A [point C] on the x-axis (iv) the point A [point C] (v) the point B (lines 211-
208 and 215-228 in [Cemre & Zafer] Protocol 17). This hierarchical-rectangular path
of their attention-focuses caused their identification of the pink graph (Figure 6.31)
with respect to sine as y=sin(x-2.3) [y=sin(x+4)] in the symbolic register (lines 194-
226 and 232-240 in [Cemre & Zafer] Protocol 17). Although they were satisfied with
this identification process in the symbolic register, it seemed that they had not been
yet satisfied with the location of y=sin(x-2.3) [y=sin(x+4)] on the right [left] with
respect to sine in the graphical register (e.g., lines 241-244 in [Cemre & Zafer]
Protocol 17). Thus, in Task 12 [Task 15], the researcher determined to provoke
students to reason about the parallel displacements of the sine [cosine] graph along the
x-axis in the positive or negative direction in the graphical register together with its
meaning in the (unit) circle register.
From Task 11 forward in all tasks, it was observed that all students were able
to express the ordinate [abscissa] of an arc as sine [cosine] of this arc but considering
it dependently on another arc in the (unit) circle register (see the previous sub-heading
Changed-arc with a constant difference in (unit) circle register). This reasoning based
on making sense of the symbolic expressions in the form of sin(x+c) and cos(x+c) in
the (unit) circle register prompted a distinct shift on students’ reasoning about these
expressions in the graphical register. That is to say, for example in Task 15, Defne
was able to reason about the graph of cos(x+1) as the parallel displacement of the graph
of cos(x) by 1-unit along the x-axis in the negative direction (e.g. lines 51-59 in [Defne
& Ebru] Protocol 19) based on the patterns on their actions in the (unit) circle register
(e.g. lines 21-50 in [Defne & Ebru] Protocol 19). Moreover, both Defne and Ebru
interpreted the positive [negative] constant “c” as the c-unit length before arrival [after
arrival] in a value in the graphical register as a consequence of the c-radian rotation
in the counterclockwise [clockwise] direction in the (unit) circle register (e.g., 28-41,
43-59 in [Defne & Ebru] Protocol 19). In Task 12 and Task 15, Cemre and Zafer were
able to interpret the positive [negative] constant “c” in the same way with Defne and
Ebru. Giving “after arrival” [“before arrival”] meaning in the (unit) circle register to
the parallel displacement along the x-axis in the positive [negative] direction in the
graphical register led to Cemre’s and Zafer’s satisfaction with the negative [positive]
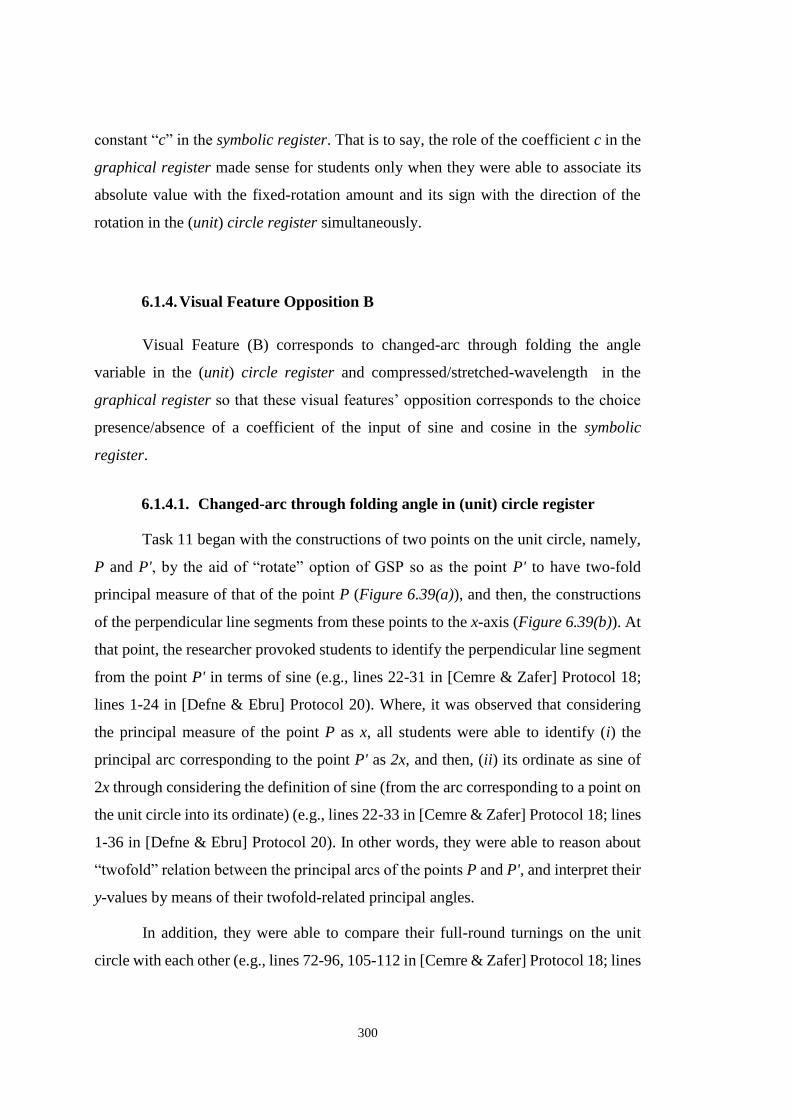
300
constant “c” in the symbolic register. That is to say, the role of the coefficient c in the
graphical register made sense for students only when they were able to associate its
absolute value with the fixed-rotation amount and its sign with the direction of the
rotation in the (unit) circle register simultaneously.
6.1.4. Visual Feature Opposition B
Visual Feature (B) corresponds to changed-arc through folding the angle
variable in the (unit) circle register and compressed/stretched-wavelength in the
graphical register so that these visual features’ opposition corresponds to the choice
presence/absence of a coefficient of the input of sine and cosine in the symbolic
register.
6.1.4.1. Changed-arc through folding angle in (unit) circle register
Task 11 began with the constructions of two points on the unit circle, namely,
P and P', by the aid of “rotate” option of GSP so as the point P' to have two-fold
principal measure of that of the point P (Figure 6.39(a)), and then, the constructions
of the perpendicular line segments from these points to the x-axis (Figure 6.39(b)). At
that point, the researcher provoked students to identify the perpendicular line segment
from the point P' in terms of sine (e.g., lines 22-31 in [Cemre & Zafer] Protocol 18;
lines 1-24 in [Defne & Ebru] Protocol 20). Where, it was observed that considering
the principal measure of the point P as x, all students were able to identify (i) the
principal arc corresponding to the point P' as 2x, and then, (ii) its ordinate as sine of
2x through considering the definition of sine (from the arc corresponding to a point on
the unit circle into its ordinate) (e.g., lines 22-33 in [Cemre & Zafer] Protocol 18; lines
1-36 in [Defne & Ebru] Protocol 20). In other words, they were able to reason about
“twofold” relation between the principal arcs of the points P and P', and interpret their
y-values by means of their twofold-related principal angles.
In addition, they were able to compare their full-round turnings on the unit
circle with each other (e.g., lines 72-96, 105-112 in [Cemre & Zafer] Protocol 18; lines

301
68-95 in [Defne & Ebru] Protocol 20). That is, they interpreted one full-round turning
of the point P [point P'] through associating with two full-round [a half-round] turning
of the point P' [point P]. Moreover, they were able to extend this comparison beyond
for the points with “twofold”-related principal arcs defined in the (unit) circle register
into the comparison of the full-rounds of the points referring to sine of x and sine of a
natural number multiple of x defined in the symbolic register. For example, when
reasoning about the meaning of sin(3x) [sin(5x)], students were able to convert sin(3x)
[sin(5x)] in the symbolic register into the reference point referring to 3x [5x] in the
(unit) circle register comparing with the point P referring to x (e.g., lines 95-102 in
[Defne & Ebru] Protocol 20). And then, they were able to compare its full-rounds with
the full-rounds of the reference point referring to x (e.g., lines 127-160, 182-185 in
[Defne & Ebru] Protocol 20).
In the same way, they were able to reason about sin(x/2). That is, they reasoned
that while the reference point referring to x completed a full-round, the reference point
referring to x/2 completed a half-round (e.g., lines 162-181 in [Cemre & Zafer]
Protocol 18), or reversely that while the reference point referring to x/2 completed a
full-round turning, the reference point referring to x completed two full-rounds (e.g.
lines 215-225 in [Defne & Ebru] Protocol 20). Moreover, in Task 11, Cemre and Zafer
were able to extend this reasoning onto the negative multiples of x through attributing
the meaning of the negative sign in the symbolic register to the clockwise direction of
the rotation in the (unit) circle register (e.g., lines 183-204 in [Cemre & Zafer]
Protocol 18). In other words, they had just defined y=sin(–x) in the (unit) circle register
as a function mapping the angle of a point on the unit circle to the ordinate of its
reflection point regarding the x-axis (lines 183-184, 193-197 in [Cemre & Zafer]
Protocol 18). Also, when trying to articulate this function in the graphical register,
they indicated that its graph would be with the same shape as the graph of y= –sin(x)
through considering it as the reflection of the graph of y=sin(x) regarding the x-axis
(lines 183-202 in [Cemre & Zafer] Protocol 18) in the same way as they had reasoned
in Task 8 about the graph of y= –sin(x) (e.g., lines 76-81 in [Cemre & Zafer] Protocol
15). Therefore, the researcher inferred that Cemre and Zafer combined y=sin(–x) with
y= –sin(x) in the graphical register. On the other hand, in Task 12, they had just

302
defined y= –sin(x) in the (unit) circle register as a function mapping the angle of a
point on the unit circle to the ordinate of its (±π)-rotated position around the origin
(see Changed-arc with a constant difference in (unit) circle register heading).
Therefore, while they combined y=sin(–x) with y= –sin(x) in the graphical register,
they were also be able to dissociate them in the (unit) circle register.
With the other group of students, Defne and Ebru, as a consequence of their
troubles on the period issue at the beginning of Task 11 (see Periodicity as pattern
based on behaviors of trigonometric functions heading), the researcher preferred to
postpone the discussions about the meaning of the negative coefficient of the input
variable in the (unit) circle register to Task 16. In task 16, when reasoning about
y=cos(–x) in the (unit) circle register, it was observed that all students were able to
attribute the meaning of the negative multiples of x in the symbolic register to the
clockwise direction of the rotation in the (unit) circle register in the similar manner
that Cemre and Zafer reasoned about y=sin(–x) in Task 11 (e.g., lines 183-184, 193-
197 in [Cemre & Zafer] Protocol 18).
Moreover, as a consequence of their developments throughout Task 12 in terms
of making sense of sine [cosine] as cosine [sine] (see Changed-arc with a constant
difference in (unit) circle register), all students were able to transfer their
interpretations made on sine in Tasks 8, 9, 10 and 11 onto cosine, respectively, in Tasks
13, 14, 15 and 16. Thus, all these reasoning mentioned above in Task 11 in the (unit)
circle register was observed in Task 16 in terms of cosine, as well. Henceforward, the
subsequent progress of students’ concept images on the visual feature opposition (B)
in the (unit) circle register was presented under “Composed-Coefficients’ Visual
Oppositions” heading.
6.1.4.2. Compressed/Stretched-wavelength in graphical register
In addition to the role of the changed-arc through folding the angle variable in
the (unit) circle register, its conversion into the graphical register was another
important focus of Task 11 [Task 16] by means of the function defined from the angle

303
of the initial-arc to the y-component [x-component] of the reference point of the
changed-arc (e.g., lines 34-37 in [Cemre & Zafer] Protocol 18).
For example, in Task 11, a new function from the angle of the point P to the y-
component of the point P' was considered as an initial example to model the changed-
arc as “twofold” (Figure 6.39(b)). Where, it was observed that students were able to
reason correctly about “twofold” situation in the (unit) circle register (see Changed-
arc through folding angle in (unit) circle register heading). At that point, the
researcher encouraged them to reason about the conversion of the “twofold” idea into
the graphical register. For this purpose, (x,sin(x)) and (x,sin(2x)) ordered pairs were
constructed in the graphical register as dynamically-linked to their correspondences
in the (unit) circle register and the symbolic register (lines 34-41 in [Cemre & Zafer]
Protocol 18; lines 37-38 in [Defne & Ebru] Protocol 20).
When these ordered pairs were appeared on the screen, unlike the group of
Defne and Ebru, Cemre and Zafer tried to associate their coordinates with their
correspondences on the unit circle before the construction of these ordered pairs’
traced graphs (lines 41-49 in [Cemre & Zafer] Protocol 18, lines 37-41 in [Defne &
Ebru] Protocol 20), as well as to estimate the functions indicated by these ordered pairs
in the graphical register (lines 48-71 in [Cemre & Zafer] Protocol 18). Moreover,
Cemre and Zafer tried to make sense of the appeared-position of (x,sin(2x)) ordered-
pair considering the position of (2x,sin(2x)) with respect to x and the graph of y=sin(x)
(lines 52-67 in [Cemre & Zafer] Protocol 18). That is to say, they reasoned about the
position of (x,sin(2x)) through changing their attention-focus hierarchically in a
rectangular path among four points in the graphical register: (i) the point (x,sin(2x))
(Figure 6.43) (ii) the point (x,0) (iii) the point (2x,0) (iv) the point (2x,sin(2x)), (v) the
point (x,sin(2x)) (lines 52-67 in [Cemre & Zafer] Protocol 18). This rectangular
reasoning path was indicating a compression of the act of y=sin(x) function in 2-unit-
length interval into one-unit-length interval. At that point, the researcher encouraged
them to construct their traced graphs in order to provoke them to reason about these
two functions in a more detailed way hoping to emerge the compression idea explicitly
(lines 68-73 in [Cemre & Zafer] Protocol 18).
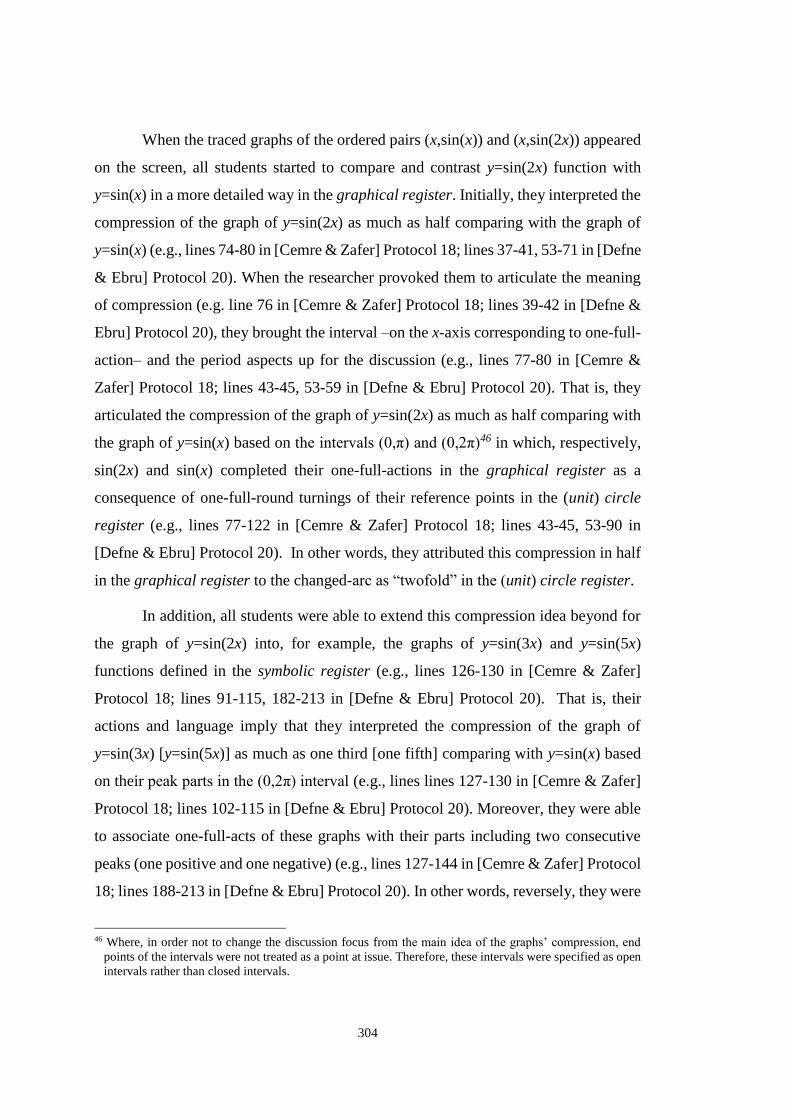
304
When the traced graphs of the ordered pairs (x,sin(x)) and (x,sin(2x)) appeared
on the screen, all students started to compare and contrast y=sin(2x) function with
y=sin(x) in a more detailed way in the graphical register. Initially, they interpreted the
compression of the graph of y=sin(2x) as much as half comparing with the graph of
y=sin(x) (e.g., lines 74-80 in [Cemre & Zafer] Protocol 18; lines 37-41, 53-71 in [Defne
& Ebru] Protocol 20). When the researcher provoked them to articulate the meaning
of compression (e.g. line 76 in [Cemre & Zafer] Protocol 18; lines 39-42 in [Defne &
Ebru] Protocol 20), they brought the interval –on the x-axis corresponding to one-full-
action– and the period aspects up for the discussion (e.g., lines 77-80 in [Cemre &
Zafer] Protocol 18; lines 43-45, 53-59 in [Defne & Ebru] Protocol 20). That is, they
articulated the compression of the graph of y=sin(2x) as much as half comparing with
the graph of y=sin(x) based on the intervals (0,π) and (0,2π)46 in which, respectively,
sin(2x) and sin(x) completed their one-full-actions in the graphical register as a
consequence of one-full-round turnings of their reference points in the (unit) circle
register (e.g., lines 77-122 in [Cemre & Zafer] Protocol 18; lines 43-45, 53-90 in
[Defne & Ebru] Protocol 20). In other words, they attributed this compression in half
in the graphical register to the changed-arc as “twofold” in the (unit) circle register.
In addition, all students were able to extend this compression idea beyond for
the graph of y=sin(2x) into, for example, the graphs of y=sin(3x) and y=sin(5x)
functions defined in the symbolic register (e.g., lines 126-130 in [Cemre & Zafer]
Protocol 18; lines 91-115, 182-213 in [Defne & Ebru] Protocol 20). That is, their
actions and language imply that they interpreted the compression of the graph of
y=sin(3x) [y=sin(5x)] as much as one third [one fifth] comparing with y=sin(x) based
on their peak parts in the (0,2π) interval (e.g., lines lines 127-130 in [Cemre & Zafer]
Protocol 18; lines 102-115 in [Defne & Ebru] Protocol 20). Moreover, they were able
to associate one-full-acts of these graphs with their parts including two consecutive
peaks (one positive and one negative) (e.g., lines 127-144 in [Cemre & Zafer] Protocol
18; lines 188-213 in [Defne & Ebru] Protocol 20). In other words, reversely, they were
46 Where, in order not to change the discussion focus from the main idea of the graphs’ compression, end
points of the intervals were not treated as a point at issue. Therefore, these intervals were specified as open
intervals rather than closed intervals.

305
able to dissociate the peaks of the graph from its repeated-full-acts (e.g., lines 188-203
in [Defne & Ebru] Protocol 20).
In the same way, they were able to reason about the stretched-graphs
comparing with y=sin(x). For example, when reasoning about the graph of y=sin(x/2),
they expressed its stretched-form as much as twofold comparing with the graph of
y=sin(x) through comparing their one-full-actions with each other in the graphical
register (e.g., lines 162-181 in [Cemre & Zafer] Protocol 18; lines 214-225 in [Defne
& Ebru] Protocol 20), as well as through associating their full actions in the graphical
register with one-full-round turnings of their reference points in the (unit) circle
register (e.g., lines 173-179 in [Cemre & Zafer] Protocol 18).
Moreover, Cemre and Zafer were able to extend this reasoning in Task 11 onto
the graph of sine for the negative multiples of x through attributing the meaning of the
negative sign of the coefficient of x in the symbolic register into the graphical register
as the reflection of the graph of y=sin(x) regarding the x-axis (lines 183-192 in [Cemre
& Zafer] Protocol 18), as well as regarding the y-axis (lines 193-204 in [Cemre &
Zafer] Protocol 18). The researcher inferred from their language and actions that their
reasoning about y=sin(–x) as the reflection of y=sin(x) regarding the y-axis arose from
their consideration of y=sin(–x) as a function from x to sin(–x) in the graphical register
(lines 193-204 in [Cemre & Zafer] Protocol 18); as for their reasoning as the reflection
regarding the x-axis, this arose from their consideration of y=sin(–x) as a function from
x to –sin(x) as the reflection of sin(x) regarding the x-axis in the (unit) circle register
(lines 183-196 in [Cemre & Zafer] Protocol 18).
On the other hand, with the other group of students, Defne and Ebru, as a
consequence of their troubles on the period issue at the beginning of Task 11 (see
Periodicity as pattern based on behaviors of trigonometric functions heading), the
researcher preferred to postpone the discussions about the meaning of the negative
coefficient of the input variable in the graphical register to Task 16. In task 16, when
reasoning about y=cos(–x) in the graphical register, it was observed that all students
were able to attribute the meaning of the negative multiples of x in the symbolic
register to the negative angles represented on the negative x-axis in the graphical

306
register. By this way, they interpreted the graph of y=cos(–x) as the reflection of
y=cos(x) regarding the y-axis through considering y=cos(–x) as a function from x to
cos(–x) in the graphical register in the similar manner that Cemre and Zafer reasoned
about y=sin(–x) in Task 11 (e.g., lines 193-204 in [Cemre & Zafer] Protocol 18).
Moreover, as a consequence of their developments throughout Task 12 in terms
of making sense of sine [cosine] as cosine [sine] (see the heading Changed-arc with a
constant difference in (unit) circle register), all students were able to transfer their
interpretations made on sine in Tasks 8, 9, 10 and 11 onto cosine, respectively, in Tasks
13, 14, 15 and 16. Thus, all these reasoning mentioned above in Task 11 in the (unit)
circle register was observed in Task 16 in terms of cosine, as well. Henceforward, the
subsequent progress of students’ concept images on the visual feature opposition (B)
in the graphical register was presented under “Composed-Coefficients’ Visual
Oppositions” heading.
6.2. Periodicity as pattern based on behaviors of trigonometric
functions
Task 6 [Task 7] was the first task that the period concept was brought up for
discussion on the basic form of the sine [cosine] function (see Regarding periodicity
as pattern based on behaviors of trigonometric functions heading in Chapter 5).
Where, it was observed that all students were able to reason about the repetition of the
sine [cosine] values as a consequence of the full-round turnings of the point P (Figure
5.21 and Figure 5.22) that was referring to both the input and output of the basic form
of the sine [cosine] function within the (unit) circle register; moreover, they were able
to reason about the repetition of the sine [cosine] values in the graphical register and
the symbolic register. At that point, the researcher had introduced the definition of the
period concept without going into details as the regular intervals of the domain set in
which a function repeats its values in the graphical register and as the lengths of these
regular intervals in the symbolic register. From this Task forward, in all tasks, the
period concept was brought up for discussion with the prime period meaning on a
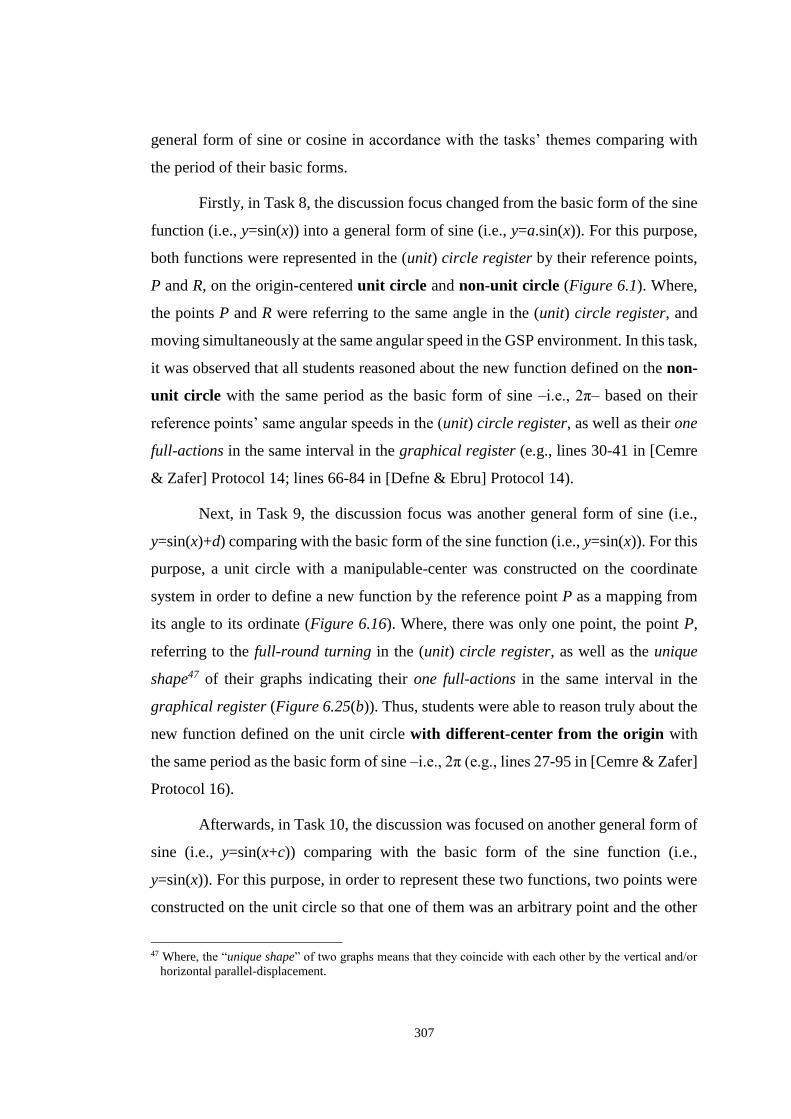
307
general form of sine or cosine in accordance with the tasks’ themes comparing with
the period of their basic forms.
Firstly, in Task 8, the discussion focus changed from the basic form of the sine
function (i.e., y=sin(x)) into a general form of sine (i.e., y=a.sin(x)). For this purpose,
both functions were represented in the (unit) circle register by their reference points,
P and R, on the origin-centered unit circle and non-unit circle (Figure 6.1). Where,
the points P and R were referring to the same angle in the (unit) circle register, and
moving simultaneously at the same angular speed in the GSP environment. In this task,
it was observed that all students reasoned about the new function defined on the non-
unit circle with the same period as the basic form of sine –i.e., 2π– based on their
reference points’ same angular speeds in the (unit) circle register, as well as their one
full-actions in the same interval in the graphical register (e.g., lines 30-41 in [Cemre
& Zafer] Protocol 14; lines 66-84 in [Defne & Ebru] Protocol 14).
Next, in Task 9, the discussion focus was another general form of sine (i.e.,
y=sin(x)+d) comparing with the basic form of the sine function (i.e., y=sin(x)). For this
purpose, a unit circle with a manipulable-center was constructed on the coordinate
system in order to define a new function by the reference point P as a mapping from
its angle to its ordinate (Figure 6.16). Where, there was only one point, the point P,
referring to the full-round turning in the (unit) circle register, as well as the unique
shape47 of their graphs indicating their one full-actions in the same interval in the
graphical register (Figure 6.25(b)). Thus, students were able to reason truly about the
new function defined on the unit circle with different-center from the origin with
the same period as the basic form of sine –i.e., 2π (e.g., lines 27-95 in [Cemre & Zafer]
Protocol 16).
Afterwards, in Task 10, the discussion was focused on another general form of
sine (i.e., y=sin(x+c)) comparing with the basic form of the sine function (i.e.,
y=sin(x)). For this purpose, in order to represent these two functions, two points were
constructed on the unit circle so that one of them was an arbitrary point and the other
47 Where, the “unique shape” of two graphs means that they coincide with each other by the vertical and/or
horizontal parallel-displacement.

308
was its rotated-position about the origin by a fixed-measure (Figure 6.28). Where, the
new function was defined from the angle of the point P to the ordinate of its rotated-
position. It was the first task that a function was defined based on two different points
on the unit circle so that one of them was referring to the input and the other was
referring to the output. However, these two points were moving in the same (angular)
speed on the unit circle. Thus, students were able to reason about the new function
defined by two points with the same (angular) speed in the (unit) circle register with
the same period as the basic form of sine –i.e., 2π– based on their full-round turnings
as they reasoned in Task 8 (e.g., lines 77-84 in [Defne & Ebru] Protocol 14); as well
as based on the unique shape of their graphs (Footnote 47) indicating their one full-
actions in the horizontally-translated-intervals in the graphical register (e.g., lines 62-
71 in [Cemre & Zafer] Protocol 17; lines 17-27 in [Defne & Ebru] Protocol 17).
Lastly, in Task 11, this systematic variation of the general forms of sine was
pursued with the functions in the form y=sin(bx) as the discussion-focus. As an initial
example, y=sin(2x) was handled without mentioning its symbolic representation. For
this purpose, two points, the point P and P' (Figure 6.39(a)), and then, the
perpendicular segments from these points to the x-axis (Figure 6.39(b)) were
constructed in the (unit) circle register. Where, the point P was an arbitrary point on
the unit circle, and the point P' was its rotated-position about the origin by the principal
measure of the point P. Thus, the point P' was moving on the unit circle at the double
(angular) speed of the point P in the GSP environment. It was the first task that a new
function was defined by two points with the different (angular) speeds from the
angle of the point P to the ordinate of the point P' in the (unit) circle register.
Dynamically-linked conversion of this function from the (unit) circle register into the
graphical register together with the sine graph caused for students to bring the period
aspect up for discussion (e.g., lines 72-80 in [Cemre & Zafer] Protocol 18; lines 39-45
in [Defne & Ebru] Protocol 20).
On the one hand, Cemre and Zafer interpreted the period of y=sin(2x) as half
of the period of y=sin(x) through attributing its meaning to (i) the half-turning of the
point P (referring to the input of y=sin(2x)) so as to bring forth one full-round turning

309
of the point P' (referring to the output of y=sin(2x)) in the (unit) circle register, (ii)
(0,π) interval (Footnote 46) as the half of (0,2π) interval on the x-axis in which,
respectively, sin(2x) and sin(x) completed their one-full-actions in the graphical
register as a consequence of one-full-round turnings of the point P' and P (referring to
the outputs of y=sin(2x) and y=sin(x)) in the (unit) circle register (lines 79-122 in
[Cemre & Zafer] Protocol 18).
On the other hand, Defne and Ebru encountered a trouble on the period of
y=sin(2x) (lines 39-52 in [Defne & Ebru] Protocol 20). That is to say, while Defne
expressed the period of y=sin(2x) as 4π based on its two full-actions in the (0,2π)
interval in the graphical register (lines 39-65 in [Defne & Ebru] Protocol 20), Ebru
expressed its period as 2π through reasoning about the period as always 2π (lines 49-
52 in [Defne & Ebru] Protocol 20). When articulating their thoughts behind the
reasoning about the period of y=sin(2x) in this way, their actions and language imply
that both assumed its one-full-action in the graphical register as 2π through associating
one-full-action with the one-full-round turning of the point P' (referring to the output
of y=sin(2x)) in the (unit) circle register (lines 53-82 in [Defne & Ebru] Protocol 20).
At that point, the researcher inferred that their concept images on the period concept
included a deficient part in the (unit) circle register in terms of the interpretation of
the full-round turnings of two points referring to (i) the input variable and (ii) the
output variable. While Defne interpreted the period as 4π considering two full-rounds
of the point P' that was produced by one full-round of the point P, Ebru interpreted the
period as 2π considering one full-round turning of only the point P'. In other words,
they interpreted the period in the (unit) circle register based only on the full-round
turning of the reference point of the output variable rather than the turning of the
reference point of the input variable producing the full-round of the reference point of
the output variable.
Therefore, she encouraged them to reason about the full-round-turnings of the
point P' dependently on the turning of the point P (lines 83-85 in [Defne & Ebru]
Protocol 20). Where, they were able to attribute one-full-round turning of the point P'
to the π-radian turning of the point P in the (unit) circle register (lines 86-90 in [Defne
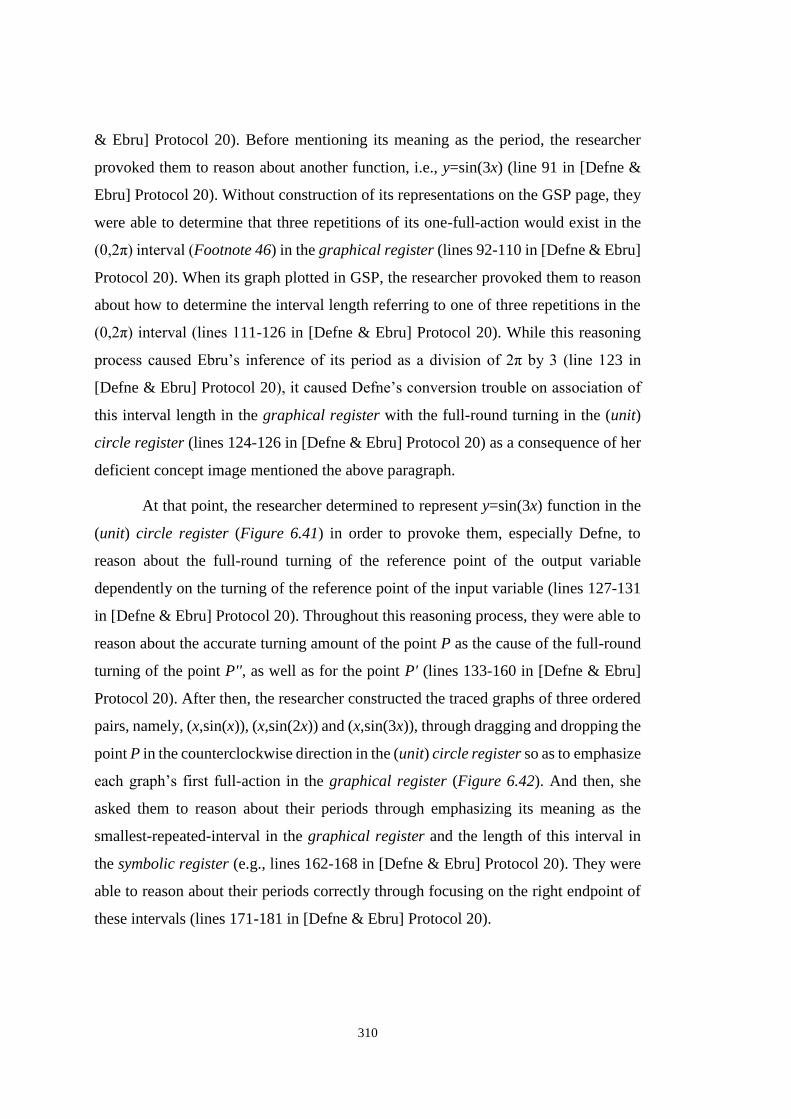
310
& Ebru] Protocol 20). Before mentioning its meaning as the period, the researcher
provoked them to reason about another function, i.e., y=sin(3x) (line 91 in [Defne &
Ebru] Protocol 20). Without construction of its representations on the GSP page, they
were able to determine that three repetitions of its one-full-action would exist in the
(0,2π) interval (Footnote 46) in the graphical register (lines 92-110 in [Defne & Ebru]
Protocol 20). When its graph plotted in GSP, the researcher provoked them to reason
about how to determine the interval length referring to one of three repetitions in the
(0,2π) interval (lines 111-126 in [Defne & Ebru] Protocol 20). While this reasoning
process caused Ebru’s inference of its period as a division of 2π by 3 (line 123 in
[Defne & Ebru] Protocol 20), it caused Defne’s conversion trouble on association of
this interval length in the graphical register with the full-round turning in the (unit)
circle register (lines 124-126 in [Defne & Ebru] Protocol 20) as a consequence of her
deficient concept image mentioned the above paragraph.
At that point, the researcher determined to represent y=sin(3x) function in the
(unit) circle register (Figure 6.41) in order to provoke them, especially Defne, to
reason about the full-round turning of the reference point of the output variable
dependently on the turning of the reference point of the input variable (lines 127-131
in [Defne & Ebru] Protocol 20). Throughout this reasoning process, they were able to
reason about the accurate turning amount of the point P as the cause of the full-round
turning of the point P'', as well as for the point P' (lines 133-160 in [Defne & Ebru]
Protocol 20). After then, the researcher constructed the traced graphs of three ordered
pairs, namely, (x,sin(x)), (x,sin(2x)) and (x,sin(3x)), through dragging and dropping the
point P in the counterclockwise direction in the (unit) circle register so as to emphasize
each graph’s first full-action in the graphical register (Figure 6.42). And then, she
asked them to reason about their periods through emphasizing its meaning as the
smallest-repeated-interval in the graphical register and the length of this interval in
the symbolic register (e.g., lines 162-168 in [Defne & Ebru] Protocol 20). They were
able to reason about their periods correctly through focusing on the right endpoint of
these intervals (lines 171-181 in [Defne & Ebru] Protocol 20).
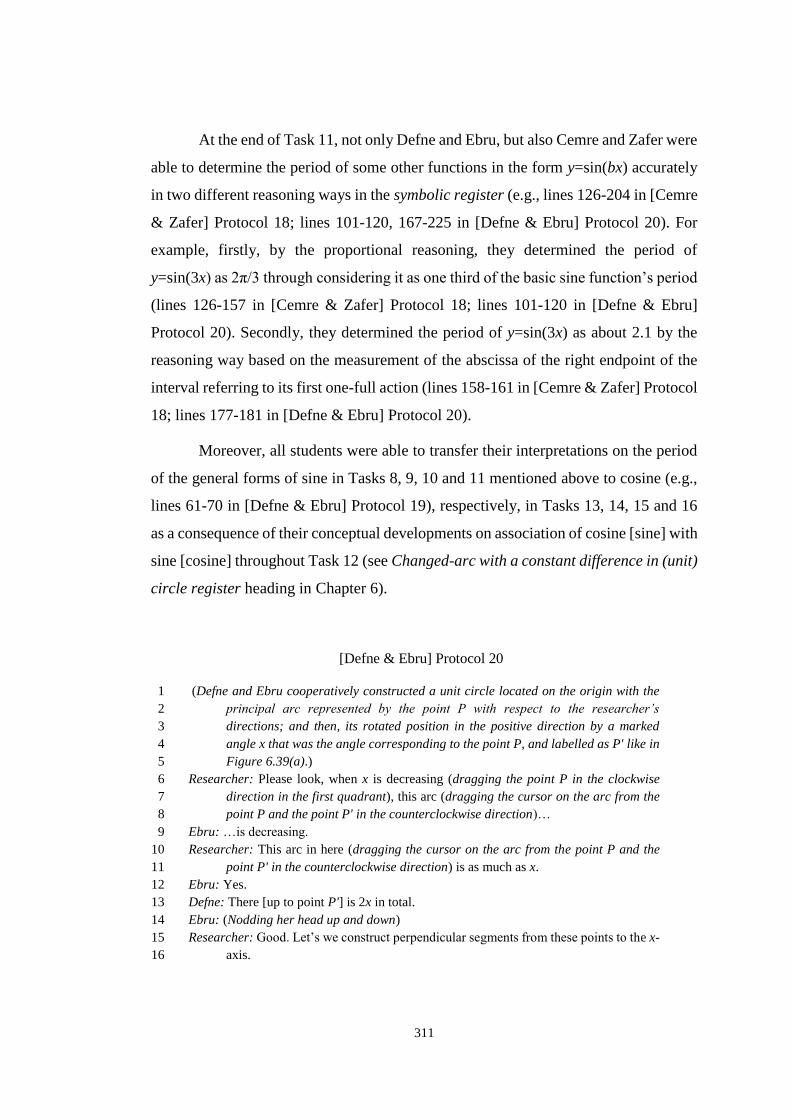
311
At the end of Task 11, not only Defne and Ebru, but also Cemre and Zafer were
able to determine the period of some other functions in the form y=sin(bx) accurately
in two different reasoning ways in the symbolic register (e.g., lines 126-204 in [Cemre
& Zafer] Protocol 18; lines 101-120, 167-225 in [Defne & Ebru] Protocol 20). For
example, firstly, by the proportional reasoning, they determined the period of
y=sin(3x) as 2π/3 through considering it as one third of the basic sine function’s period
(lines 126-157 in [Cemre & Zafer] Protocol 18; lines 101-120 in [Defne & Ebru]
Protocol 20). Secondly, they determined the period of y=sin(3x) as about 2.1 by the
reasoning way based on the measurement of the abscissa of the right endpoint of the
interval referring to its first one-full action (lines 158-161 in [Cemre & Zafer] Protocol
18; lines 177-181 in [Defne & Ebru] Protocol 20).
Moreover, all students were able to transfer their interpretations on the period
of the general forms of sine in Tasks 8, 9, 10 and 11 mentioned above to cosine (e.g.,
lines 61-70 in [Defne & Ebru] Protocol 19), respectively, in Tasks 13, 14, 15 and 16
as a consequence of their conceptual developments on association of cosine [sine] with
sine [cosine] throughout Task 12 (see Changed-arc with a constant difference in (unit)
circle register heading in Chapter 6).
[Defne & Ebru] Protocol 20
(Defne and Ebru cooperatively constructed a unit circle located on the origin with the 1
principal arc represented by the point P with respect to the researcher’s 2
directions; and then, its rotated position in the positive direction by a marked 3
angle x that was the angle corresponding to the point P, and labelled as P' like in 4
Figure 6.39(a).) 5
Researcher: Please look, when x is decreasing (dragging the point P in the clockwise 6
direction in the first quadrant), this arc (dragging the cursor on the arc from the 7
point P and the point P' in the counterclockwise direction)… 8
Ebru: …is decreasing. 9
Researcher: This arc in here (dragging the cursor on the arc from the point P and the 10
point P' in the counterclockwise direction) is as much as x. 11
Ebru: Yes. 12
Defne: There [up to point P'] is 2x in total. 13
Ebru: (Nodding her head up and down) 14
Researcher: Good. Let’s we construct perpendicular segments from these points to the x-15
axis. 16
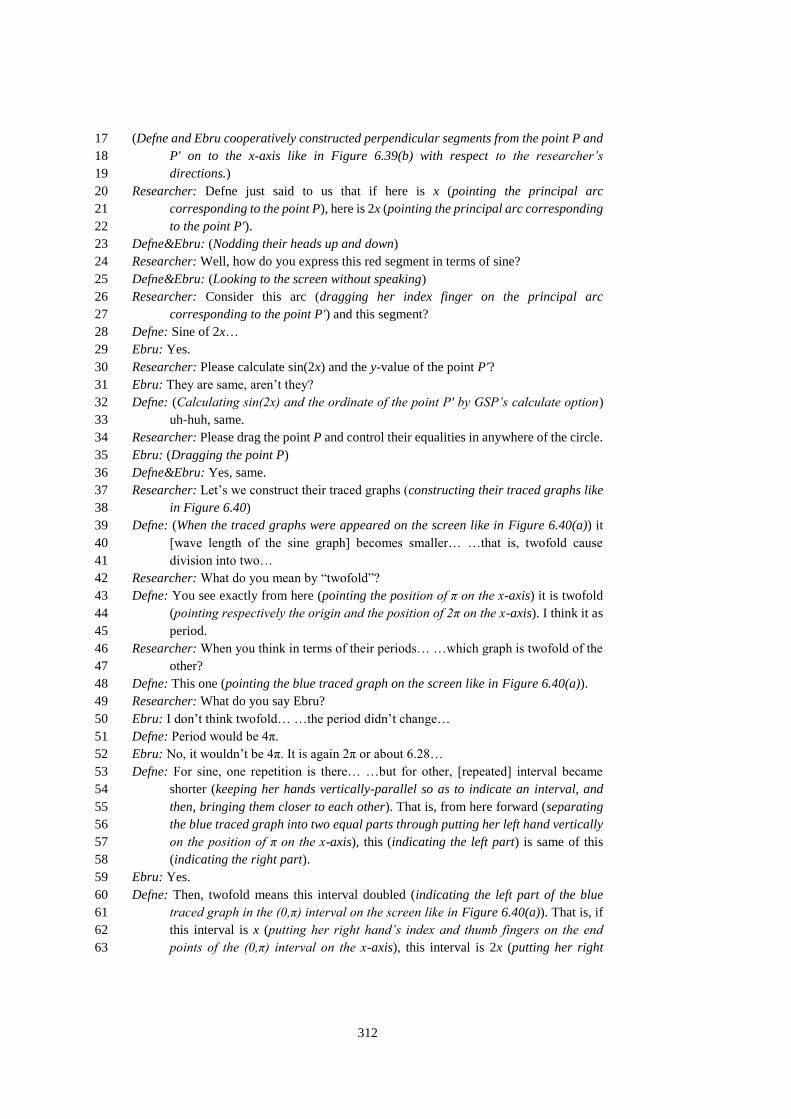
312
(Defne and Ebru cooperatively constructed perpendicular segments from the point P and 17
P' on to the x-axis like in Figure 6.39(b) with respect to the researcher’s 18
directions.) 19
Researcher: Defne just said to us that if here is x (pointing the principal arc 20
corresponding to the point P), here is 2x (pointing the principal arc corresponding 21
to the point P'). 22
Defne&Ebru: (Nodding their heads up and down) 23
Researcher: Well, how do you express this red segment in terms of sine? 24
Defne&Ebru: (Looking to the screen without speaking) 25
Researcher: Consider this arc (dragging her index finger on the principal arc 26
corresponding to the point P') and this segment? 27
Defne: Sine of 2x… 28
Ebru: Yes. 29
Researcher: Please calculate sin(2x) and the y-value of the point P'? 30
Ebru: They are same, aren’t they? 31
Defne: (Calculating sin(2x) and the ordinate of the point P' by GSP’s calculate option) 32
uh-huh, same. 33
Researcher: Please drag the point P and control their equalities in anywhere of the circle. 34
Ebru: (Dragging the point P) 35
Defne&Ebru: Yes, same. 36
Researcher: Let’s we construct their traced graphs (constructing their traced graphs like 37
in Figure 6.40) 38
Defne: (When the traced graphs were appeared on the screen like in Figure 6.40(a)) it 39
[wave length of the sine graph] becomes smaller… …that is, twofold cause 40
division into two… 41
Researcher: What do you mean by “twofold”? 42
Defne: You see exactly from here (pointing the position of π on the x-axis) it is twofold 43
(pointing respectively the origin and the position of 2π on the x-axis). I think it as 44
period. 45
Researcher: When you think in terms of their periods… …which graph is twofold of the 46
other? 47
Defne: This one (pointing the blue traced graph on the screen like in Figure 6.40(a)). 48
Researcher: What do you say Ebru? 49
Ebru: I don’t think twofold… …the period didn’t change… 50
Defne: Period would be 4π. 51
Ebru: No, it wouldn’t be 4π. It is again 2π or about 6.28… 52
Defne: For sine, one repetition is there… …but for other, [repeated] interval became 53
shorter (keeping her hands vertically-parallel so as to indicate an interval, and 54
then, bringing them closer to each other). That is, from here forward (separating 55
the blue traced graph into two equal parts through putting her left hand vertically 56
on the position of π on the x-axis), this (indicating the left part) is same of this 57
(indicating the right part). 58
Ebru: Yes. 59
Defne: Then, twofold means this interval doubled (indicating the left part of the blue 60
traced graph in the (0,π) interval on the screen like in Figure 6.40(a)). That is, if 61
this interval is x (putting her right hand’s index and thumb fingers on the end 62
points of the (0,π) interval on the x-axis), this interval is 2x (putting her right 63

313
hand’s index and thumb fingers on the end points of the (0,2π) interval on the x-64
axis). 65
Ebru: You know here is 2π (putting her left hand’s index finger on the origin and the 66
right hand’s index finger on the 2π on the x-axis) pink one [sin(x) graph] as well 67
as blue one [sin(2x) graph] is 2π. This is coming toward half (pointing the midpoint 68
of the (0,2π) interval on the x-axis), that is, this (pointing the point P on the unit 69
circle) is turning about the half (figuring the up-half circle in the counterclockwise 70
direction)… …while this comes to here (dragging her index finger on the pink 71
traced graph in the (0,π) interval), this will come to here (dragging her index 72
finger on the blue traced graph in the (0,π) interval). I mean x comes to half 73
(figuring the up-half circle in the counterclockwise direction)… …since this [point 74
P'] is turning more (figuring the down-half circle in the counterclockwise 75
direction), it [sin(2x) graph] repeats many more [than sin(x) graph], doesn’t it? 76
Defne: Yes. Number of full-rounds of it [point P'] increased [comparing with that of point 77
P]. 78
Ebru: That is, when P completed circle (figuring a circle in the counterclockwise 79
direction through starting from its far right point), that [point P'] completed many 80
more. 81
Defne: Uh-huh. 82
Researcher: Please concentrate on P'… …after how much turning of P… …does P' 83
complete a full-round (dragging the point P slowly in the counterclockwise 84
direction from first quadrant to the second quadrant)? 85
Ebru: (When the point P was coming closer to the negative x-axis) at π (smiles with 86
satisfaction). 87
Defne: Yes. At π, sin(2x) has been completed. 88
Ebru: At π, it [sin(2x)] completed one tour (figuring the sine wave), and then one more 89
(figuring the following sine wave). 90
Researcher: What do you say about sin(3x)? 91
Defne: Wait a minute! This was x (dragging her index finger on the principal arc 92
referring to the point P) to x (dragging her index finger on the arc from the point 93
P and P' in the counterclockwise direction), so 2x (dragging her index finger on 94
the principal arc referring to the point P'). Then it [3x] would be x (dragging her 95
index finger on the principal arc referring to the point P) to 2x (indicating an arc 96
from the point P to another point beyond the point P' in the counterclockwise 97
direction), so 3x (dragging her index finger on the principal arc referring to that 98
point). 99
Ebru: (Looking to the screen without speaking) 100
Researcher: Well, what do you say about the graph of sin(3x)? 101
Ebru: It would repeat many more [than sin(2x)]. That is, this point (pointing the position 102
of π on the x-axis on the screen like in Figure 6.40(a)) would be somewhere on 103
this side (indicating the left side regarding the position of π on the x-axis). 104
Defne: There would be three and three, that is, six peaks. 105
Ebru: Yes. Three would be at the top… …and three at the bottom. 106
Defne: Top bottom… …top bottom… …top bottom. 107
Researcher: So, in the (0,2π) interval (indicating (0,2π) interval on the x-axis), how many 108
times does it repeat? 109
Defne: Three. 110

314
Researcher: Please plot y=sin(3x) function’s graph in order to see indeed it is like you 111
imagine. 112
Defne: (Plotting y=sin(3x) function’s graph like in Figure 6.40(b)) yes, one (pointing 113
with the cursor the first smallest repeated part of the y=sin(3x) in the (0,2π) 114
interval) two (pointing the second one) and three (pointing the second one). 115
Researcher: If I know that here is 2π (putting her index fingers on the endpoints of the 116
(0,2π) interval), I know… …one… two… three (pointing respectively the first, 117
second and third sub-intervals of the (0,2π) interval on the x-axis, in which 118
y=sin(3x) repeats)… its three times is 2π. 119
Defne&Ebru: (Nodding their heads up and down) 120
Researcher: Then, how do you find this interval length (pointing the first smallest 121
repeated part of the y=sin(3x) in the (0,2π) interval)? 122
Ebru: We divide 2π by 3. 123
Defne: But period was 2π, wasn’t it! I mean here corresponds to one full-round (dragging 124
her index finger on the first smallest repeated part of y=sin(3x) function’s graph). 125
It doesn’t so. 126
Researcher: Ok. Let’s we construct its correspondence on the unit circle (constructing 127
rotated position of the point P' on the unit circle by a marked angle x in the 128
counterclockwise direction, and labelling it as P'' like in Figure 6.41(a)). Please 129
focus on the point P'' (pointing the point P'' on the unit circle). I will drag the point 130
P. You will say “stop” to me when P'' complete one full round. Is it ok? 131
Defne&Ebru: Ok. 132
Researcher: (Dragging the point P slowly in the counterclockwise direction starting from 133
the intersection point of the unit circle with the positive x-axis) 134
Ebru: (When the point P'' was nearly completing a full round like in Figure 6.41(b)) stop. 135
Defne: Wait a minute! I didn’t see. 136
Researcher: Ok. Let’s we look again. Look at P'' (pointing the point P'' on the screen like 137
in Figure 6.41(a), and then, dragging slowly in the counterclockwise direction the 138
point P starting from the intersection point of the unit circle with the positive x-139
axis). 140
Defne: (When the point P'' was nearly completing a full round like in Figure 6.41(b)) 141
[one full round for P''] almost completed. 142
Ebru: Uh-huh. 143
Researcher: I stopped (stopping dragging the point P when the point P'' on the positive 144
x-axis). How much did I turn (dragging her index finger on the principal arc 145
corresponding to the point P)? 146
Ebru: 0.66π radian. 147
Researcher: Its 3 fold is 2π (dragging her index finger on the whole circle so as to indicate 148
the principal arc of the point P''). 149
Defne&Ebru: Yes. 150
Defne: …because it [point P''] turns 3-fold faster [than point P]. 151
Researcher: Look again! Up to P point’s completion of a full-round, how many full-152
rounds are completed for P'' (dragging slowly in the counterclockwise direction 153
the point P starting from the intersection point of the unit circle with the positive 154
x-axis)? 155
Defne: (When the point P'' completed the first full-round) first tour, (when the point P'' 156
completed the second full-round) second tour, (when the point P'' completed the 157
third full-round) third tour is completed together. 158
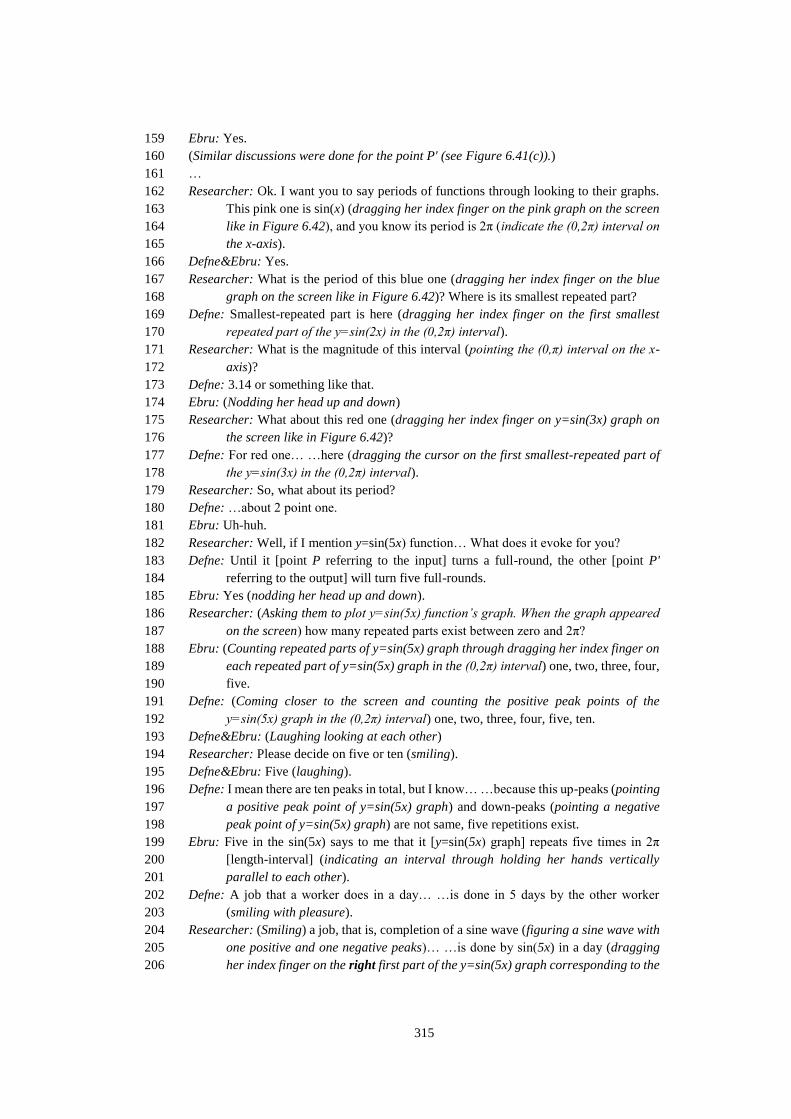
315
Ebru: Yes. 159
(Similar discussions were done for the point P' (see Figure 6.41(c)).) 160
… 161
Researcher: Ok. I want you to say periods of functions through looking to their graphs. 162
This pink one is sin(x) (dragging her index finger on the pink graph on the screen 163
like in Figure 6.42), and you know its period is 2π (indicate the (0,2π) interval on 164
the x-axis). 165
Defne&Ebru: Yes. 166
Researcher: What is the period of this blue one (dragging her index finger on the blue 167
graph on the screen like in Figure 6.42)? Where is its smallest repeated part? 168
Defne: Smallest-repeated part is here (dragging her index finger on the first smallest 169
repeated part of the y=sin(2x) in the (0,2π) interval). 170
Researcher: What is the magnitude of this interval (pointing the (0,π) interval on the x-171
axis)? 172
Defne: 3.14 or something like that. 173
Ebru: (Nodding her head up and down) 174
Researcher: What about this red one (dragging her index finger on y=sin(3x) graph on 175
the screen like in Figure 6.42)? 176
Defne: For red one… …here (dragging the cursor on the first smallest-repeated part of 177
the y=sin(3x) in the (0,2π) interval). 178
Researcher: So, what about its period? 179
Defne: …about 2 point one. 180
Ebru: Uh-huh. 181
Researcher: Well, if I mention y=sin(5x) function… What does it evoke for you? 182
Defne: Until it [point P referring to the input] turns a full-round, the other [point P' 183
referring to the output] will turn five full-rounds. 184
Ebru: Yes (nodding her head up and down). 185
Researcher: (Asking them to plot y=sin(5x) function’s graph. When the graph appeared 186
on the screen) how many repeated parts exist between zero and 2π? 187
Ebru: (Counting repeated parts of y=sin(5x) graph through dragging her index finger on 188
each repeated part of y=sin(5x) graph in the (0,2π) interval) one, two, three, four, 189
five. 190
Defne: (Coming closer to the screen and counting the positive peak points of the 191
y=sin(5x) graph in the (0,2π) interval) one, two, three, four, five, ten. 192
Defne&Ebru: (Laughing looking at each other) 193
Researcher: Please decide on five or ten (smiling). 194
Defne&Ebru: Five (laughing). 195
Defne: I mean there are ten peaks in total, but I know… …because this up-peaks (pointing 196
a positive peak point of y=sin(5x) graph) and down-peaks (pointing a negative 197
peak point of y=sin(5x) graph) are not same, five repetitions exist. 198
Ebru: Five in the sin(5x) says to me that it [y=sin(5x) graph] repeats five times in 2π 199
[length-interval] (indicating an interval through holding her hands vertically 200
parallel to each other). 201
Defne: A job that a worker does in a day… …is done in 5 days by the other worker 202
(smiling with pleasure). 203
Researcher: (Smiling) a job, that is, completion of a sine wave (figuring a sine wave with 204
one positive and one negative peaks)… …is done by sin(5x) in a day (dragging 205
her index finger on the right first part of the y=sin(5x) graph corresponding to the 206

316
first full-round turning in the counterclockwise direction of the reference point 207
referring to the output, and then, indicating its interval on the x-axis)… …and is 208
done by sin(x) in 5 days (dragging her index finger on the right first part of the 209
y=sin(x) graph corresponding to the first full-round turning in the 210
counterclockwise direction of the reference point referring to the output, and then, 211
indicating its interval on the x-axis) 212
Ebru&Defne: (Nodding their heads up and down when smiling with satisfaction). 213
Researcher: Ok. What about y=sin(x/2)? 214
Defne: This (putting her thumb and index fingers on the end points of the interval on the 215
x-axis so as to refer the first repeated part of the y=sin(5x) function) would expand 216
even more (pointing a larger interval on the x-axis that expands beyond 2π). 217
Ebru: (Nodding her head up and down) 218
Researcher: So, what would be its period? 219
Defne: Its period would be… …2π and 2π… …that is, 4π. 220
Ebru: Yes. 4π… 221
Defne: Because one full round of sin(x/2) requires two full-rounds of x… 222
Ebru: Uh-huh (nodding her head up and down). 223
(Similar discussions were done on y=sin(x/2) function in the GSP environment, and they 224
reasoned in the same way.) 225
Figure 6.39. Through folding the principal angle corresponding to a point, the
point P, on the unit circle, construction of another point, the point P'
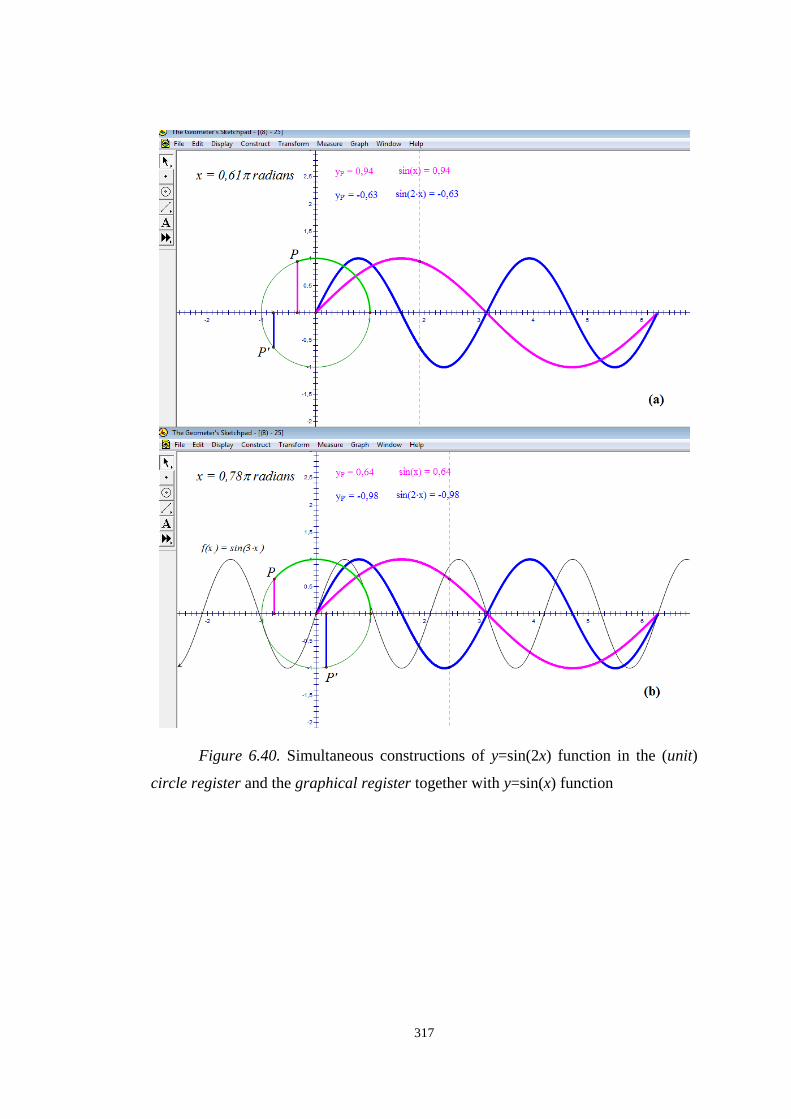
317
Figure 6.40. Simultaneous constructions of y=sin(2x) function in the (unit)
circle register and the graphical register together with y=sin(x) function

318
Figure 6.41. Construction of dynamically-linked three points, P, P' and P'', on
the unit circle with the principal measures, respectively, x, 2x and 3x

319
Figure 6.42. Construction of y=sin(3x) function’s graph together with y=sin(x)
and y=sin(2x)
[Cemre & Zafer] Protocol 18
Researcher: We discussed in the previous tasks about the periods. 1
Cemre&Zafer: (Nodding their heads up and down) 2
Researcher: You know that y is equal to sine x function’s period is 2π… …the period of 3
y is equal to sine x out of parenthesis plus something is… 4
Cemre: …again 2π. All of them [periods of the functions that were discussed in the 5
teaching experiment up to Task 11] were 2π. 6
Zafer: (Nodding his head up and down) period of 2 times sine x is 2π, too. 7
Researcher: …for the functions in the form like that… … y is equal to sine in the 8
parenthesis x plus or minus something… …period… 9
Cemre: In each case it [period] is 2π. 10
Researcher: In each case we mentioned up to this time, the period was 2π. 11
Cemre: It wouldn’t change (arching her eyebrows and looking to the researcher), huh? 12
Researcher: (Laughing) 13
Cemre&Zafer: (Laughing but looking worried) 14
Researcher: Let’s we discuss this issue at the end of this lesson. 15
(Cemre and Zafer cooperatively constructed a unit circle located on the origin with the 16
principal arc represented by the point P with respect to the researcher’s 17
directions; and then, its rotated position in the positive direction by a marked 18
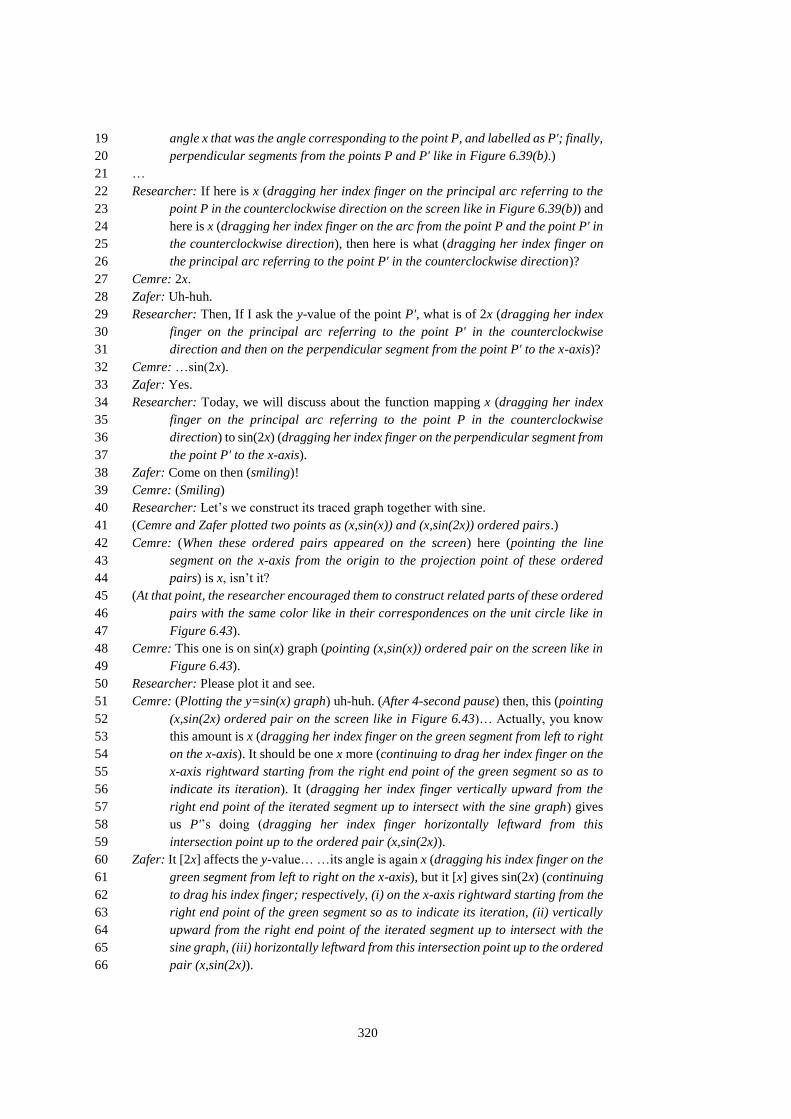
320
angle x that was the angle corresponding to the point P, and labelled as P'; finally, 19
perpendicular segments from the points P and P' like in Figure 6.39(b).) 20
… 21
Researcher: If here is x (dragging her index finger on the principal arc referring to the 22
point P in the counterclockwise direction on the screen like in Figure 6.39(b)) and 23
here is x (dragging her index finger on the arc from the point P and the point P' in 24
the counterclockwise direction), then here is what (dragging her index finger on 25
the principal arc referring to the point P' in the counterclockwise direction)? 26
Cemre: 2x. 27
Zafer: Uh-huh. 28
Researcher: Then, If I ask the y-value of the point P', what is of 2x (dragging her index 29
finger on the principal arc referring to the point P' in the counterclockwise 30
direction and then on the perpendicular segment from the point P' to the x-axis)? 31
Cemre: …sin(2x). 32
Zafer: Yes. 33
Researcher: Today, we will discuss about the function mapping x (dragging her index 34
finger on the principal arc referring to the point P in the counterclockwise 35
direction) to sin(2x) (dragging her index finger on the perpendicular segment from 36
the point P' to the x-axis). 37
Zafer: Come on then (smiling)! 38
Cemre: (Smiling) 39
Researcher: Let’s we construct its traced graph together with sine. 40
(Cemre and Zafer plotted two points as (x,sin(x)) and (x,sin(2x)) ordered pairs.) 41
Cemre: (When these ordered pairs appeared on the screen) here (pointing the line 42
segment on the x-axis from the origin to the projection point of these ordered 43
pairs) is x, isn’t it? 44
(At that point, the researcher encouraged them to construct related parts of these ordered 45
pairs with the same color like in their correspondences on the unit circle like in 46
Figure 6.43). 47
Cemre: This one is on sin(x) graph (pointing (x,sin(x)) ordered pair on the screen like in 48
Figure 6.43). 49
Researcher: Please plot it and see. 50
Cemre: (Plotting the y=sin(x) graph) uh-huh. (After 4-second pause) then, this (pointing 51
(x,sin(2x) ordered pair on the screen like in Figure 6.43)… Actually, you know 52
this amount is x (dragging her index finger on the green segment from left to right 53
on the x-axis). It should be one x more (continuing to drag her index finger on the 54
x-axis rightward starting from the right end point of the green segment so as to 55
indicate its iteration). It (dragging her index finger vertically upward from the 56
right end point of the iterated segment up to intersect with the sine graph) gives 57
us P'’s doing (dragging her index finger horizontally leftward from this 58
intersection point up to the ordered pair (x,sin(2x)). 59
Zafer: It [2x] affects the y-value… …its angle is again x (dragging his index finger on the 60
green segment from left to right on the x-axis), but it [x] gives sin(2x) (continuing 61
to drag his index finger; respectively, (i) on the x-axis rightward starting from the 62
right end point of the green segment so as to indicate its iteration, (ii) vertically 63
upward from the right end point of the iterated segment up to intersect with the 64
sine graph, (iii) horizontally leftward from this intersection point up to the ordered 65
pair (x,sin(2x)). 66

321
Cemre: Uh-huh. I said so. 67
Researcher: Let’s we see… …on how a graph this point (pointing the ordered pair 68
(x,sin(2x))) would be? 69
Zafer: It would be on sin(2x). 70
Cemre: Yes. 71
(At that point, the researcher encouraged them to construct traced graphs of both ordered 72
pairs (x,sin(x)) and (x,sin(2x)) like in Figure 6.44.) 73
Cemre&Zafer: (Looking to the screen without speaking until finishing the traced graphs) 74
Cemre: (After 8-second pause) it became smaller. 75
Researcher: What became smaller? 76
Cemre: This distance became smaller (putting her right hand’s thumb and index fingers 77
on the end point of the (0,π) interval on the x-axis). 78
Zafer: Period was reduced by half. 79
Cemre: Yes, because this was twofold (pointing the point P' on the unit circle) 80
Zafer: When it is twofold… 81
Cemre: Actually you know… …P' (pointing the point P' on the unit circle) was equal to 82
2x (dragging her index finger on the principal arc corresponding to the point P' 83
on the screen like in Figure 6.44). 84
Zafer: Since it was equal to 2x, the way it [point P] takes in π (figuring an up-half circle 85
in the counterclockwise direction)… …other [point P'] takes twice (figuring a 86
whole circle in the counterclockwise direction starting from its far right point). 87
That is, while this takes this path with one peak (dragging his index finger on 88
y=sin(x) graph’s part in the (0,π) interval), this takes with two peaks (dragging 89
his index finger on y=sin(2x) graph’s part in the (0,π) interval). 90
Cemre: Yes. The path that sin(x) takes in x (dragging her index finger on y=sin(x) 91
graph’s part in the (0,2π) interval)… …is taken twice by sin(2x) (dragging her 92
index finger on y=sin(2x) graph’s part in the (0,2π) interval). 93
Zafer: You see… when x completed a full-round (figuring a circle in the 94
counterclockwise direction starting from its far right point), 2x completed 2π and 95
further (figuring the same circle in the same way; and then, an arc). 96
Cemre: Actually, it happens so that… …in a full round [of x], it [y=sin(2x) graph] takes 97
this path (figuring a sine wave with one positive and one negative peaks) twice. 98
That is, it does this act (putting her index fingers on the endpoints of the (0,2π) 99
interval on the x-axis so as to indicate the sine wave in this interval) purely 100
between this hill (putting her index fingers on the endpoints of the (0,π) interval 101
on the x-axis so as to indicate the positive peak point of the sine wave in this 102
interval). 103
Zafer: Yes. 104
Researcher: Look! I am turning P (dragging the point P in the counterclockwise direction 105
from first quadrant to the second quadrant). 106
Zafer: (When the point P was a bit more beyond π-radian) P' passed to second tour. 107
Cemre: P'… …yes. 108
Zafer: That is, it completed 2π [radian turning], and passed second tour. 109
Cemre: Uh-huh (nodding her head up and down). Now, it will turn one 2π [radian] more. 110
Zafer: Actually, from here to here (pointing respectively the origin and 2π on the x-axis), 111
it [point P'] comes through rotating 4π. But its period is here (putting his thumb 112
and index fingers on the end points of the (0,π) interval so as to indicate the 113
smallest repeated part of y=sin(2x) graph), that is, π. 114
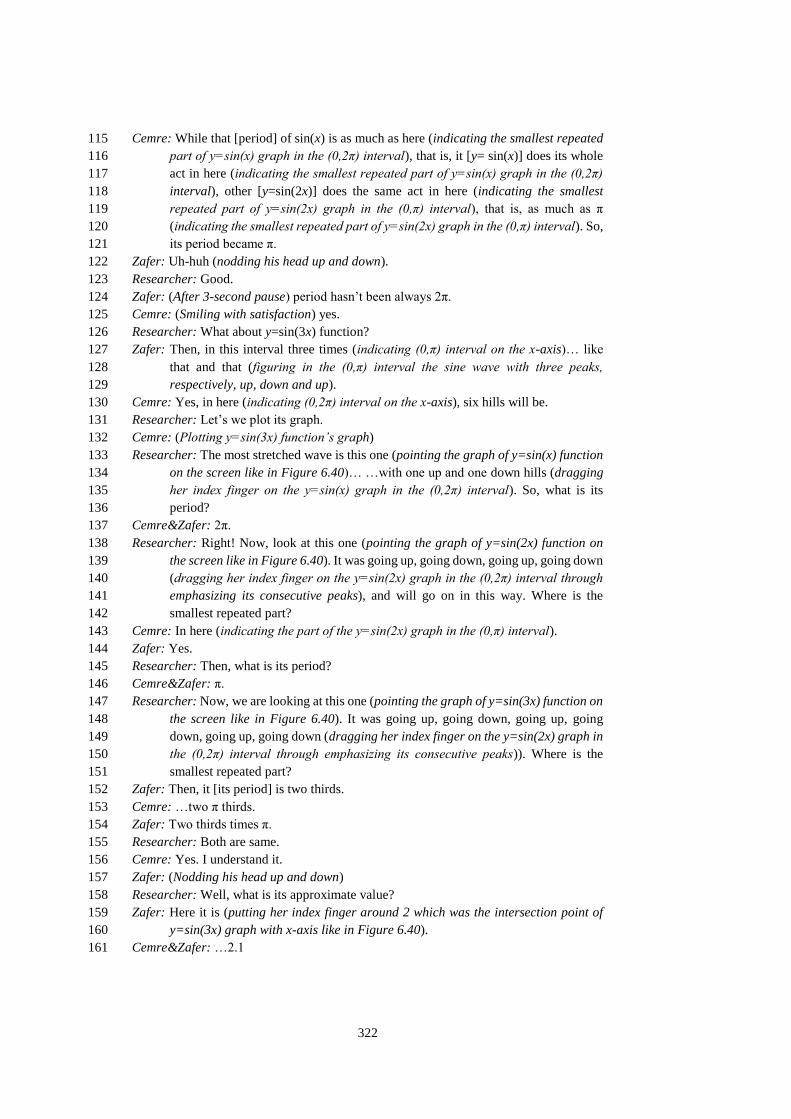
322
Cemre: While that [period] of sin(x) is as much as here (indicating the smallest repeated 115
part of y=sin(x) graph in the (0,2π) interval), that is, it [y= sin(x)] does its whole 116
act in here (indicating the smallest repeated part of y=sin(x) graph in the (0,2π) 117
interval), other [y=sin(2x)] does the same act in here (indicating the smallest 118
repeated part of y=sin(2x) graph in the (0,π) interval), that is, as much as π 119
(indicating the smallest repeated part of y=sin(2x) graph in the (0,π) interval). So, 120
its period became π. 121
Zafer: Uh-huh (nodding his head up and down). 122
Researcher: Good. 123
Zafer: (After 3-second pause) period hasn’t been always 2π. 124
Cemre: (Smiling with satisfaction) yes. 125
Researcher: What about y=sin(3x) function? 126
Zafer: Then, in this interval three times (indicating (0,π) interval on the x-axis)… like 127
that and that (figuring in the (0,π) interval the sine wave with three peaks, 128
respectively, up, down and up). 129
Cemre: Yes, in here (indicating (0,2π) interval on the x-axis), six hills will be. 130
Researcher: Let’s we plot its graph. 131
Cemre: (Plotting y=sin(3x) function’s graph) 132
Researcher: The most stretched wave is this one (pointing the graph of y=sin(x) function 133
on the screen like in Figure 6.40)… …with one up and one down hills (dragging 134
her index finger on the y=sin(x) graph in the (0,2π) interval). So, what is its 135
period? 136
Cemre&Zafer: 2π. 137
Researcher: Right! Now, look at this one (pointing the graph of y=sin(2x) function on 138
the screen like in Figure 6.40). It was going up, going down, going up, going down 139
(dragging her index finger on the y=sin(2x) graph in the (0,2π) interval through 140
emphasizing its consecutive peaks), and will go on in this way. Where is the 141
smallest repeated part? 142
Cemre: In here (indicating the part of the y=sin(2x) graph in the (0,π) interval). 143
Zafer: Yes. 144
Researcher: Then, what is its period? 145
Cemre&Zafer: π. 146
Researcher: Now, we are looking at this one (pointing the graph of y=sin(3x) function on 147
the screen like in Figure 6.40). It was going up, going down, going up, going 148
down, going up, going down (dragging her index finger on the y=sin(2x) graph in 149
the (0,2π) interval through emphasizing its consecutive peaks)). Where is the 150
smallest repeated part? 151
Zafer: Then, it [its period] is two thirds. 152
Cemre: …two π thirds. 153
Zafer: Two thirds times π. 154
Researcher: Both are same. 155
Cemre: Yes. I understand it. 156
Zafer: (Nodding his head up and down) 157
Researcher: Well, what is its approximate value? 158
Zafer: Here it is (putting her index finger around 2 which was the intersection point of 159
y=sin(3x) graph with x-axis like in Figure 6.40). 160
Cemre&Zafer: …2.1 161

323
Zafer: So, then… …if we consider sin(x/2), it will come from here to here like that 162
(figuring a positive peak of the sine wave through extending its interval from (0,π) 163
to (0,2π) on the screen like in Figure 6.40), and continue like that (continuing to 164
figure its consecutive part under the x-axis so as to indicate its negative peak in 165
the (2π,4π) interval). 166
Cemre: (Laughing with pleasure) yes. 167
Researcher: What about its period? 168
Zafer: Its period would be 4π. 169
Cemre: Yes (smiling with satisfaction). I think so. 170
Zafer: That is, the other [point P] completed 2π [a full-round], that [point P'] got behind, 171
that is, at π. 172
Cemre: Yes. (Smiling) heigh-ho! Too much! That is, when the other [point P] comes 173
whole [a full-round] (dragging her index finger on the unit circle in the 174
counterclockwise direction starting from the intersection point with the positive x-175
axis so as to indicate a full-round turning), x/2 [point P'] comes up to here 176
(dragging her index finger on the up-part of the unit circle in the counterclockwise 177
direction so as to indicate a half turning). 178
Zafer: Uh-huh. 179
(Similar discussions were done on y=sin(x/2) function in the GSP environment, and they 180
reasoned in the same way.) 181
… 182
Researcher: Well, what do you think about y=sin(-2x) (opening “plot new function” 183
option of GSP, and entering sin(-2x), but not clicking “ok”)? How would it be? 184
Cemre: It would come to this side (pointing a place under the x-axis so as to indicate the 185
reflection of the positive peak point of y=sin(2x) graph regarding the x-axis). That 186
is, it would be shaped… …as the opposite of this grey one (dragging her index 187
finger on the first smallest repeated part of y=sin(2x) graph on the screen like in 188
Figure 6.44)… …on this side (putting her right hand’s external part over the x-189
axis on the part of y=sin(2x) graph in the (0,π/2) interval horizontally; and then, 190
rotating her hand around the x-axis by 180 degrees so as to indicate its reflection 191
regarding the x-axis). 192
Zafer: You know minus means… …the angle’s start of the rotation in this way (putting 193
his index finger on the intersection point of the unit circle with the positive x-axis; 194
and then, dragging in the clockwise direction). 195
Cemre: Yes. It would go from here (figuring y=sin(2x) graph’s left part regarding to the 196
x-axis through starting from the origin). Minus indicates only direction. Because 197
the minus side is here (dragging her index finger leftward on the negative x-axis 198
starting from the origin), this will come to here (putting her right hand’s internal 199
part horizontally on the negative x-axis; and then, rotating her hand around the 200
y-axis by 180 degrees so as to indicate its reflection regarding the y-axis). 201
Zafer: Yes. As if a reflection [regarding the y-axis]… 202
(At that point, the researcher plotted y=sin(-2x) function’s graph, and students reasoned 203
in the similar way.) 204
… 205
Researcher: So, you recognize that period does not have to 2π. You see that… …when 206
the coefficient of x in the sine function changed, its period also changed. 207
Cemre&Zafer: Yes (nodding their heads up and down). 208
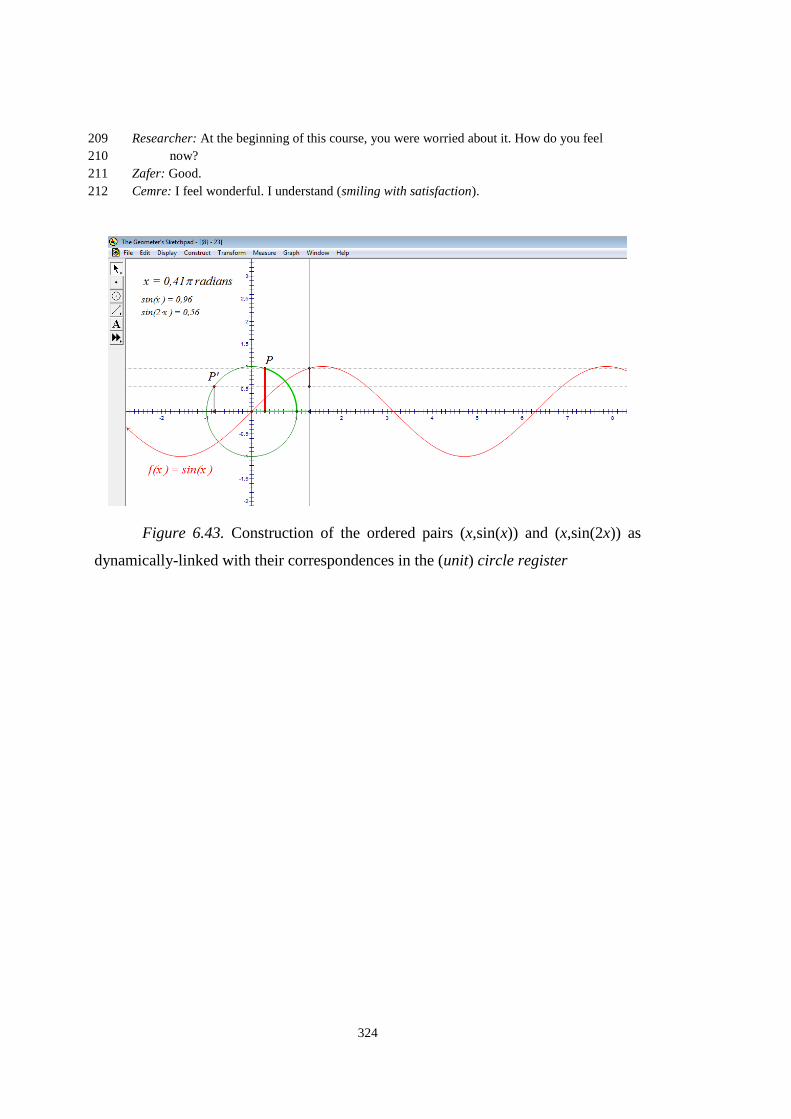
324
Researcher: At the beginning of this course, you were worried about it. How do you feel 209
now? 210
Zafer: Good. 211
Cemre: I feel wonderful. I understand (smiling with satisfaction). 212
Figure 6.43. Construction of the ordered pairs (x,sin(x)) and (x,sin(2x)) as
dynamically-linked with their correspondences in the (unit) circle register
325
Figure 6.44. Simultaneous constructions of y=sin(x) and y=sin(2x) functions in
the (unit) circle register and the graphical register through emphasizing the principal
arc’s conversion into the graphical register
6.3. Composed-Coefficients’ Visual Oppositions
The main themes of the episodes of the teaching experiment were the
conversion tasks based on the discrimination of the visual features’ oppositions in any
representational register. Therefore, while the (unit) circle register and the graphical
register were considered as both the source register and the target register, the
symbolic register was considered primarily as the target register of the conversion
tasks. Moreover, the visual features of each task between Task 8 and 11 [Task 13 and
16] were referring in the symbolic register to only one coefficient of the general form
of the sine [cosine] function. Therefore, at the end of Task 12 [Task 16], the researcher
provoked students to reason about the coefficients’ visual oppositions on a general
form of sine [cosine] stated by all coefficients in the symbolic register with two main
aims: (i) to reverse the role of the symbolic register in the conversion as the “source
register”, (ii) to bring the composed-coefficients’ composed-visual oppositions up for
discussion.
326
For this purpose, at the end of Task 12, a general form of sine function in the
form y=3sin(2x+4)-1 was considered as the first example. Initially, the researcher
asked students to reason about the visual opposition of the coefficient of sine; i.e., 3
(e.g., lines 1-2 in [Cemre & Zafer] Protocol 19; lines 1-3 in [Defne & Ebru] Protocol
21). Where, students expressions in the language register imply that all students were
able to associate this coefficient in the symbolic register with the tripled-radius in the
(unit) circle register, as well as the tripled-magnitude in the graphical register (e.g.,
lines 1-6 in [Cemre & Zafer] Protocol 19; lines 1-11 in [Defne & Ebru] Protocol 21).
Moreover, they expressed the composed-visual oppositions of the coefficient and
constant of sine; i.e., respectively 3 and -1, through articulating the upper and lower
bounds of the range set in the graphical register, as well as the 1-unit down location
of the circle in the (unit) circle register (e.g., lines 7-12 in [Cemre & Zafer] Protocol
19; lines 12-22 in [Defne & Ebru] Protocol 21).
When reasoning in the language register about the coefficient “2” and constant
“4” of the input of sine in y=3sin(2x+4)-1 function, it was observed that students
preferred to reason about “2” and “4” coefficients’ visual oppositions mainly in the
graphical register (e.g., lines 15-26 in [Cemre & Zafer] Protocol 19; lines 25-33 in
[Defne & Ebru] Protocol 21). They reasoned about the visual opposition of “4” as the
parallel displacement of the graph along the x-axis by 4 units in the negative direction
(e.g., lines 21-26 in [Cemre & Zafer] Protocol 19; lines 25-28 in [Defne & Ebru]
Protocol 21) and the visual opposition of “2” as the compression of the graph into half
(e.g., lines 15-20 in [Cemre & Zafer] Protocol 19; lines 29-33 in [Defne & Ebru]
Protocol 21). Where, the researcher inferred that they reasoned about the visual
oppositions of these two coefficients separately rather than their composed-visual
opposition. Therefore, in order to provoke them to think more deeply about these two
coefficients’ composed-visual oppositions in the graphical register, she asked them to
plot y=3sin(2x+4)-1 function’s graph in GSP environment (line 27 in [Cemre & Zafer]
Protocol 19; lines 34-35 in [Defne & Ebru] Protocol 21).
When the graph of y=3sin(2x+4)-1 appeared on the screen (Figure 6.45(a)),
students started to compare its visual features with their expectations. Their first focus

327
was the visual opposition of the coefficient “3”. They reasoned based on the upper and
lower bounds of the range set in the graphical register (lines 28-30 in [Cemre & Zafer]
Protocol 19; lines 36-38 in [Defne & Ebru] Protocol 21). However, next focusses of
the groups were different from each other. While the visual opposition of the
coefficient “-1” was brought up for discussion in the group of Defne and Ebru (lines
36-40 in [Defne & Ebru] Protocol 21), the visual opposition of the coefficient “4” was
mentioned in the group of Cemre and Zafer (lines 31-36 in [Cemre & Zafer] Protocol
19). Despite of their different second-step-reasoning-focuses, all students encountered
a major trouble on reasoning about the composed-visual-opposition of the coefficients
“2” and “4” in the graphical register.
On the one hand, in their reasoning process that resulted in this major trouble,
Ebru –and then, Defne– encountered an initial trouble on the y-intercept of the graph
as a consequence of their reasoning based only on the composed-effect of two
coefficients, i.e., 3 and -1, rather than reasoning based on all four coefficients of
y=3sin(2x+4)-1 function (lines 38-40 in [Defne & Ebru] Protocol 21). At that point,
the researcher provoked them to reason about the variation of y=sin(x) function’s graph
up to y=3sin(2x+4)-1 function’s graph through incorporating a new function into the
discussion; respectively, y=3sin(x), y=3sin(x)-1, y=3sin(2x)-1 (lines 41-42, 45-47, 51-
52, 57-60 in [Defne & Ebru] Protocol 21). Until the last step of this reasoning process,
they had no conflict between the variation of the graphs and their expectations about
them in the graphical register (lines 41-73 in [Defne & Ebru] Protocol 21). That is to
say, their actions and language imply that their concept images on the visual variation
in the graphical register between (i) sin(x) and 3sin(x), (ii) 3sin(x) and 3sin(x)-1, (iii)
3sin(x)-1 and 3sin(2x)-1 were coherent with the visual variation between these pairs
of graphs produced by GSP. However, they encountered the major trouble on the
visual variation between the graphs of y=3sin(2x)-1 and y=3sin(2x+4)-1 in terms of
the displacement amount between their graphs (lines 74-91 in [Defne & Ebru] Protocol
21) as a consequence of their reasoning about the visual oppositions of the coefficients
“2” and “4” separately rather than their composed-visual opposition.
328
On the other hand, in their reasoning process that resulted in this major trouble,
Cemre and Zafer encountered an initial trouble on the reference function when
reasoning about the visual opposition of the coefficient “4” as the parallel displacement
along the x-axis (lines 31-43 in [Cemre & Zafer] Protocol 19). When reasoning by the
aid of the researcher’s hint about the reference function of this displacement as
y=3sin(2x)-1 (lines 39-41, 44-45 in [Cemre & Zafer] Protocol 19), like Defne and
Ebru, they encountered the major trouble on the displacement amount between the
graphs of y=3sin(2x)-1 and y=3sin(2x+4)-1 as a consequence of their reasoning about
the visual opposition of the coefficient “4” separately from the visual opposition of the
coefficient “2” in the graphical register (lines 46-56 in [Cemre & Zafer] Protocol 19).
When this major trouble emerged, the researcher asked students to determine
the displacement amount between these two graphs (line 57 in [Cemre & Zafer]
Protocol 19; line 92 in [Defne & Ebru] Protocol 21). All students determined the
displacement amount as 2 –instead of 4– by the aid of GSP’s “zoom in” and “zoom
out” options for the scaled x-axis (lines 57-73 in [Cemre & Zafer] Protocol 19; lines
92-107 in [Defne & Ebru] Protocol 21). Next, except Zafer, all other students
associated this measure with the half of the constant of the input of sine in
y=3sin(2x+4)-1 function (line 73 in [Cemre & Zafer] Protocol 19; lines 103-110 in
[Defne & Ebru] Protocol 21). Moreover, Defne and Ebru attributed the cause of this
half-reduced-displacement-amount to the half-reduced-period (lines 103-110 in
[Defne & Ebru] Protocol 21).
However, Cemre and Zafer did not make any interpretation about the cause of
this half-reduced displacement amount (lines 69-74 in [Cemre & Zafer] Protocol 19).
Where, the researcher provoked them to reason about the displacement amount when
the constant of the input of sine in y=3sin(2x+4)-1 function was changed from 4 to 2
(lines 75-76 in [Cemre & Zafer] Protocol 19). When Cemre edited y=3sin(2x+4)-1 as
y=3sin(2x+2)-1, Zafer expressed the displacement amount as “almost 1 [unit]” but
Cemre expressed it as “exactly 1 [unit]” and associated it with again the half of the
constant of the input of sine in y=3sin(2x+2)-1 (lines 77-84 in [Cemre & Zafer]
Protocol 19). At that point, the researcher inferred that Zafer needed to know the exact
329
displacement amount (lines 80-84 in [Cemre & Zafer] Protocol 19). For this purpose,
she constructed an arbitrary point, A(xA,yA), on the graph of y=3sin(2x)-1; and then,
another point (xA-1,yA) by the aid of “plot as (x,y)” option of GSP (lines 85-87 in
[Cemre & Zafer] Protocol 19). When this plotted-point appeared on the graph of
y=3sin(2x+2)-1 as the correspondence of the point A on the graph of y=3sin(2x)-1,
Zafer ensured about the exact-displacement amount as 1 unit (lines 88-90 in [Cemre
& Zafer] Protocol 19). It was the point that Zafer had just started to reason that the
displacement amount was exactly the half of the constant of the input of sine in case
that the coefficient of the input of sine was 2 (lines 88-100 in [Cemre & Zafer] Protocol
19). When reasoning about the cause of this half-reduced displacement amount, like
Defne and Ebru, Zafer and Cemre attributed the cause of this half-reduced-
displacement-amount to the half-reduced-period (lines 101-113 in [Cemre & Zafer]
Protocol 19).
Students’ this attribution of the ratio between the changed-displacement
amounts48 to the ratio between the changed-periods prompted them to adapt the
operational-process of the determination of the period49 to the displacement amount.
That is to say, they started to reason about the displacement amount by an operational-
process as the division by the coefficient of x as in the case of the determination process
of the period (e.g., lines 114-117 in [Cemre & Zafer] Protocol 19; lines 121-133 in
[Defne & Ebru] Protocol 21). For example, they determined the displacement amount
between the graphs of y=3sin(3x+6)-1 and y=3sin(3x)-1 as 2 through dividing the
constant of x (i.e., 6) by the coefficient of x (i.e., 3) (e.g., lines 114-115 in [Cemre &
Zafer] Protocol 19; lines 121-133 in [Defne & Ebru] Protocol 21). Moreover, they
verified this determination in the graphical register based on the distance between the
correspondence points on the x-axis of these two functions through using the scaled x-
48 The same constant of the input of sine [cosine] causes the different displacement amounts along the x-axis
in consequence of the different coefficients of the input of sine [cosine]. Accordingly, the displacement
amounts change in cases (bx+c) and (x+c) as the input of sine [cosine], where b≠{0,1}. We mean by
“changed-displacement amounts” the displacement amounts in consequence of the same coefficient “c” on
two sine [cosine] functions with the inputs in the form (bx+c) and (x+c).
49 The operational-process of the period of a general form of sine and cosine is the division of 2π by the
coefficient of x.

330
axis of the GSP as a measuring-tool (e.g., lines 118-123 in [Cemre & Zafer] Protocol
19; lines 125-130 in [Defne & Ebru] Protocol 21). Furthermore, they reasoned in the
same way for the some other functions in GSP environment through manipulating the
coefficients in the symbolic register and observing their simultaneous effects in the
graphical register in terms of the changed-displacement amount –between two graphs
with and without the constant term of the input of sine (e.g., lines 116-117, 132-136 in
[Cemre & Zafer] Protocol 19).
Besides, in addition to the graphical register, students interpreted the cause of
the changed-displacement amount (Footnote 48) in the (unit) circle register as well.
Their actions and language imply that they converted the constant “c” of the input of
sine in the symbolic register into a c-radian fixed-arc in the (unit) circle register; and
then, interpreted this fixed-arc by means of two different, but dependent, (angular)
speeds referring to x and bx. For example, when reasoning about the cause of the half-
reduced displacement amount on the case of y=3sin(2x+6)-1, Cemre and Zafer
considered the constant “6” of the input of sine as a fixed-arc; and then, interpreted
that “6” [radian turning] was completed by the point referring to 2x in double speed of
the point referring to x; in other words, “6” [radian turning] was completed
dependently on 3-radian turning of the point referring to x (lines 101-110 in [Cemre &
Zafer] Protocol 19). In the same way, Defne and Ebru reasoned about the cause of the
changed-displacement amount on the case of y=3sin(3x+6)-1 in the (unit) circle
register (lines 134-148 in [Defne & Ebru] Protocol 21). That is to say, they attributed
the displacement amount in the graphical register to the (c/b)-radian turning of the
reference point of (x) that produced the c-radian arc as the path of the reference point
of (bx) so as to indicate (bx+c) in the (unit) circle register. It means that students
reasoned about the c-radian arc between the reference-points of (bx) and (bx+c) in a
dynamic-turning-structure through considering the turning-amount of (bx)
dependently on the turning amount of (x). The researcher inferred that students’ this
reasoning arose from their effort to determine how much turning of (x) caused the c-
radian “before arrival/after arrival” on a specific point between the reference points of
(bx) and (bx+c) in the (unit) circle register (for more detailed articulation about
“before arrival/after arrival” aspect, see the last paragraph of the heading Parallel-

331
displacement along the x-axis in graphical register). In the scope of teaching
experiment, the researcher preferred not to discuss this issue in the GSP environment
because the manipulation of the coefficients “b” and “c” for the functions in the form
y=asin(bx+c)+d in the (unit) circle register required time-consuming-constructions in
contrast to the “easy-manipulation” of these coefficients in the symbolic register and
“fast-observation” of their oppositions in the graphical register.
Finally, all these issues of Task 11 mentioned above on the general form of
sine were discussed at the end of Task 16 on the general form of cosine. It was
observed that students were able to transfer their final interpretations in Task 11 on the
composed-visual oppositions of the composed-coefficients for sine mentioned above
to those for cosine at the end of Task 16 as a consequence of their conceptual
developments on association of cosine [sine] with sine [cosine] throughout Task 12
(see Changed-arc with a constant difference in (unit) circle register heading in Chapter
6).
[Defne & Ebru] Protocol 21
Researcher: (Writing f(x)=3.sin(2x+4)-1 function by the aid of “new function” option 1
under the graph menu of GSP; and then, pointing the coefficient 3 on the screen) 2
this coefficient, three, is related to what? 3
Defne: To the radius… 4
Ebru: Radius tripled. 5
Defne: Yes. 6
Researcher: Radius tripled. Then, how a graph do you expect? 7
Ebru: …higher. 8
Defne: (Figuring a sine wave, and then, indicating its positive peak point) this will go up 9
more… …up to 3… 10
Ebru: (Nodding her head up and down) 11
Researcher: (Pointing f(x)=3.sin(2x+4)-1 function’s “-1” coefficient on the screen) what 12
about minus one? 13
Ebru: It will start from minus one (pointing the position of -1 on the y-axis). 14
Defne: Circle will go down one unit. 15
Researcher: Well, you say it would start from minus one (indicating the position of -1 on 16
the y-axis), 17
Ebru: …up to two. 18
Defne: Yes, because it would go up 3 units [from -1]. 19
Researcher: Well, what about down? 20

332
Defne: …minus one and minus three, it would be up to minus 4. 21
Ebru: Minus 4. 22
Researcher: Don’t forget your statements! In just a moment, we plot its graph. 23
Defne&Ebru: (Smiling) 24
Researcher: Well, what about four (pointing f(x)=3.sin(2x+4)-1 function’s “4” 25
coefficient on the screen)? 26
Ebru: It will slide four units leftward (holding her right hand vertically and then dragging 27
horizontally leftward). 28
Defne: (After 4-second pause) when multiplying by two (pointing f(x)=3.sin(2x+4)-1 29
function’s “2” coefficient on the screen), period will become smaller (putting her 30
hands vertically parallel; and then, bringing them closer to each other). 31
Ebru: There will be two repetitions [in (0,2π) interval]. 32
Defne: Yes. That is, the period will decrease in half [of 2π]. 33
Researcher: Now, I plot it (plotting the graph of f(x)=3.sin(2x+4)-1 function).Control 34
whether your expectations are true or not. 35
Defne: (When the graph appeared on the screen like in Figure 6.45(a)) it is from minus 36
four to two. 37
Ebru: Yes. (After 3-second pause) but it doesn’t start from minus one (pointing the 38
graph’s y-intercept on the screen like in Figure 6.45(a)). Why? 39
Defne: Yes. It would have started from minus one? 40
Researcher: Ok. Let’s we start with y=sin(x) (plotting y=sin(x) function’s graph like in 41
Figure 6.45(b)). 42
Defne&Ebru: (When y=sin(x) graph appeared screen, looking to the screen with 43
satisfaction) 44
Researcher: Now, let’s we consider the coefficient 3 (pointing f(x)=3.sin(2x+4)-1 45
function’s “3” coefficient on the screen; and then, entering “3sin(x)” in the box 46
of “plot new function” window under the graph menu of GSP). 47
Ebru: (Before its graph’s appearance on the screen like in Figure 6.46(a)) it will go up 48
3 and down -3. 49
Defne&Ebru: (When the graph of y=3sin(x) appeared on the screen) yes. 50
Researcher: Now, we mention the coefficient -1 as well (entering “3sin(x)-1” in the box 51
of “plot new function” window under the graph menu of GSP). 52
Defne: (Before its graph’s appearance on the screen like in Figure 6.46(a)) it [graph of 53
y=3sin(x)] will go down one unit, (after the graph appeared on the screen like in 54
Figure 6.46(b)) yes. 55
Ebru: (Nodding her head up and down) 56
Researcher: Ok, we consider what about addition of the coefficient 2 (entering 3sin(2x)-57
1 in the box of “plot new function” window under the graph menu of GSP). (Before 58
clicking the “ok” button) how will its graph be… …comparing this blue graph 59
(pointing the graph of y=3sin(x)-1 on the screen like in like in Figure 6.46(b))? 60
Defne: Its period will become smaller. 61
Ebru: (Nodding her head up and down) there will be two repetitions [in (0,2π) interval]. 62
Defne: Yes. Period will decrease in half [of 2π]. 63
Defne&Ebru: (When the graph of y=3sin(2x)-1 appeared on the screen like in Figure 64
6.47(a), looking to the screen without speaking) 65
Researcher: Let’s we delete some of them (deleting y=3sin(2x+4)-1, y=sin(x) and 66
y=3sin(x) functions’ graphs). Indeed, is this pink graph (pointing the graph of 67

333
y=3sin(2x)-1 on the screen like in Figure 6.47(b)) compressed into half comparing 68
to this blue graph (pointing the graph of y=3sin(x)-1)? 69
Defne: Yes, while blue does one repetition in here (dragging her index finger on the blue 70
traced graph in the (0,π) interval), this does two repetitions (dragging her index 71
finger on the blue traced graph in the (0,π) interval). 72
Ebru: Uh-huh (nodding her head up and down). 73
Researcher: Please look at this function (pointing y=3sin(2x+4)-1 function on the screen 74
like in Figure 6.47(b)). Only the coefficient 4 is there differently from this function 75
(pointing y=3sin(2x)-1 function), is it ok? 76
Defne&Ebru: Yes. 77
Researcher: So, how would their graphs differ (pointing y=3sin(2x+4)-1 and y=3sin(2x)-78
1 functions’ symbolic expressions simultaneously on the screen like in Figure 79
6.47(b))? How will this pink graph change (pointing the graph of y=3sin(2x)-1)? 80
Ebru: It will be translated four units leftward (moving her right hand horizontally 81
leftward). 82
Defne: (Looking to the screen without speaking) 83
Researcher: (Plotting the graph of y=3sin(2x+4)-1) 84
Ebru: (When the graph of y=3sin(2x+4)-1 appeared on the screen like in Figure 6.48(a)) 85
it [GSP] drew wrong, didn’t it? 86
Defne: Now, if we assume here as the reference (pointing the pink graph’s first 87
intersection point with the positive x-axis on the screen like in Figure 6.48(a)), 88
four is here (pointing -4 on the x-axis), but this is further back (pointing the dashed 89
graph’s intersection point with the negative x-axis nearest to -2). Yes, it [dashed-90
graph plotted by GSP] is wrong. 91
Researcher: What is the translation amount? 92
Defne&Ebru: (Coming closer to the screen so as to determine the horizontal 93
displacement amount between two graphs) 94
Researcher: (Zooming in the unit length through dragging the point 1 on the x-axis 95
rightward so as to provide with a more detailed scale for measuring like in Figure 96
6.48(b)) 97
Defne: (Pointing the line segment on the positive x-axis from the origin to the first 98
intersection point of the pink graph on the screen like in Figure 6.48(b)) here is 99
about zero point one and… …a half [0.15]… …and here is also 0.15 (pointing the 100
line segment on the negative x-axis from -2 to the nearest-intersection point of the 101
dashed-graph with the x-axis). 102
Defne&Ebru: It [translation amount of y=3sin(2x)-1 graph onto y=3sin(2x+4)-1] is two. 103
Defne: (After 4-second pause) it may be due to the changed period. 104
Ebru: Yes, for 2x [input variable of sine], period changed into half… …so, translation 105
amount also changed into half. 106
Defne: Yes. 107
Researcher: Do you mean if this coefficient is 6 rather then 4, then the translation amount 108
will be half of six? 109
Defne&Ebru: Yes. 110
Researcher: Let’s control. 111
Defne: (Editing y=3sin(2x+4)-1 function as y=3sin(2x+6)-1) here is again 0.15 (pointing 112
the first intersection point of the pink graph with the positive x-axis on the screen 113
like in Figure 6.49(a))… …3 (pointing -3 point on the x-axis, and then, dragging 114
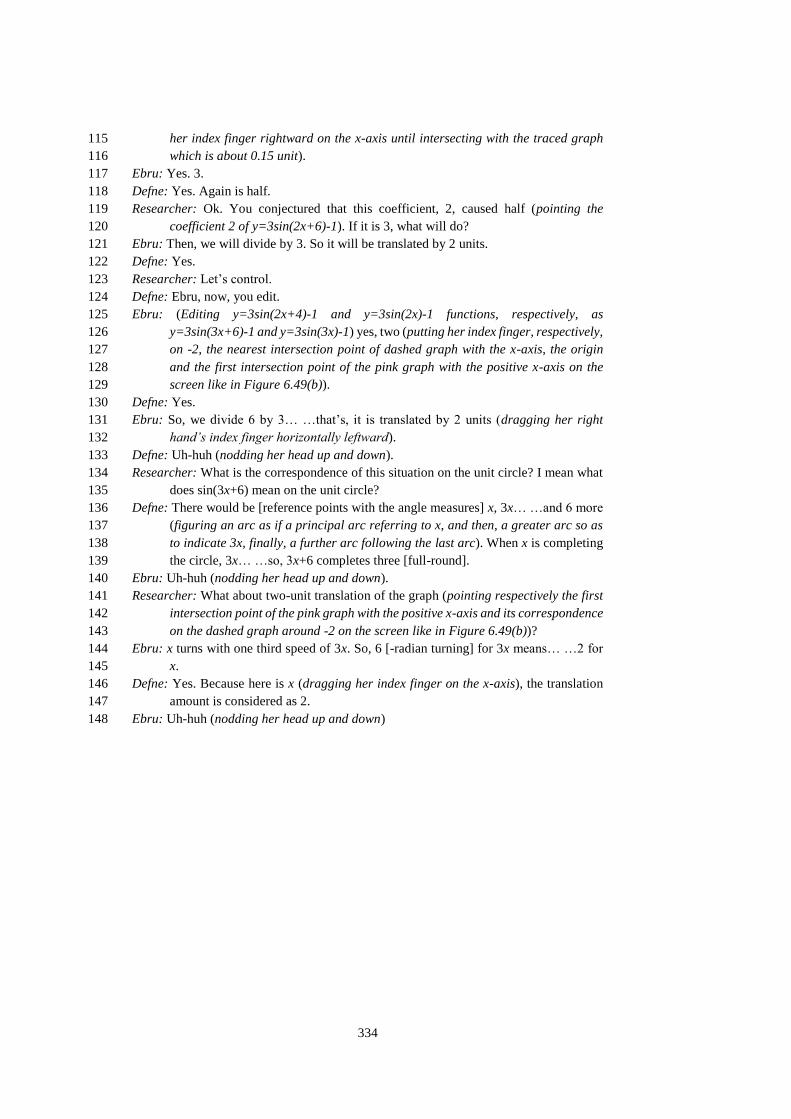
334
her index finger rightward on the x-axis until intersecting with the traced graph 115
which is about 0.15 unit). 116
Ebru: Yes. 3. 117
Defne: Yes. Again is half. 118
Researcher: Ok. You conjectured that this coefficient, 2, caused half (pointing the 119
coefficient 2 of y=3sin(2x+6)-1). If it is 3, what will do? 120
Ebru: Then, we will divide by 3. So it will be translated by 2 units. 121
Defne: Yes. 122
Researcher: Let’s control. 123
Defne: Ebru, now, you edit. 124
Ebru: (Editing y=3sin(2x+4)-1 and y=3sin(2x)-1 functions, respectively, as 125
y=3sin(3x+6)-1 and y=3sin(3x)-1) yes, two (putting her index finger, respectively, 126
on -2, the nearest intersection point of dashed graph with the x-axis, the origin 127
and the first intersection point of the pink graph with the positive x-axis on the 128
screen like in Figure 6.49(b)). 129
Defne: Yes. 130
Ebru: So, we divide 6 by 3… …that’s, it is translated by 2 units (dragging her right 131
hand’s index finger horizontally leftward). 132
Defne: Uh-huh (nodding her head up and down). 133
Researcher: What is the correspondence of this situation on the unit circle? I mean what 134
does sin(3x+6) mean on the unit circle? 135
Defne: There would be [reference points with the angle measures] x, 3x… …and 6 more 136
(figuring an arc as if a principal arc referring to x, and then, a greater arc so as 137
to indicate 3x, finally, a further arc following the last arc). When x is completing 138
the circle, 3x… …so, 3x+6 completes three [full-round]. 139
Ebru: Uh-huh (nodding her head up and down). 140
Researcher: What about two-unit translation of the graph (pointing respectively the first 141
intersection point of the pink graph with the positive x-axis and its correspondence 142
on the dashed graph around -2 on the screen like in Figure 6.49(b))? 143
Ebru: x turns with one third speed of 3x. So, 6 [-radian turning] for 3x means… …2 for 144
x. 145
Defne: Yes. Because here is x (dragging her index finger on the x-axis), the translation 146
amount is considered as 2. 147
Ebru: Uh-huh (nodding her head up and down) 148
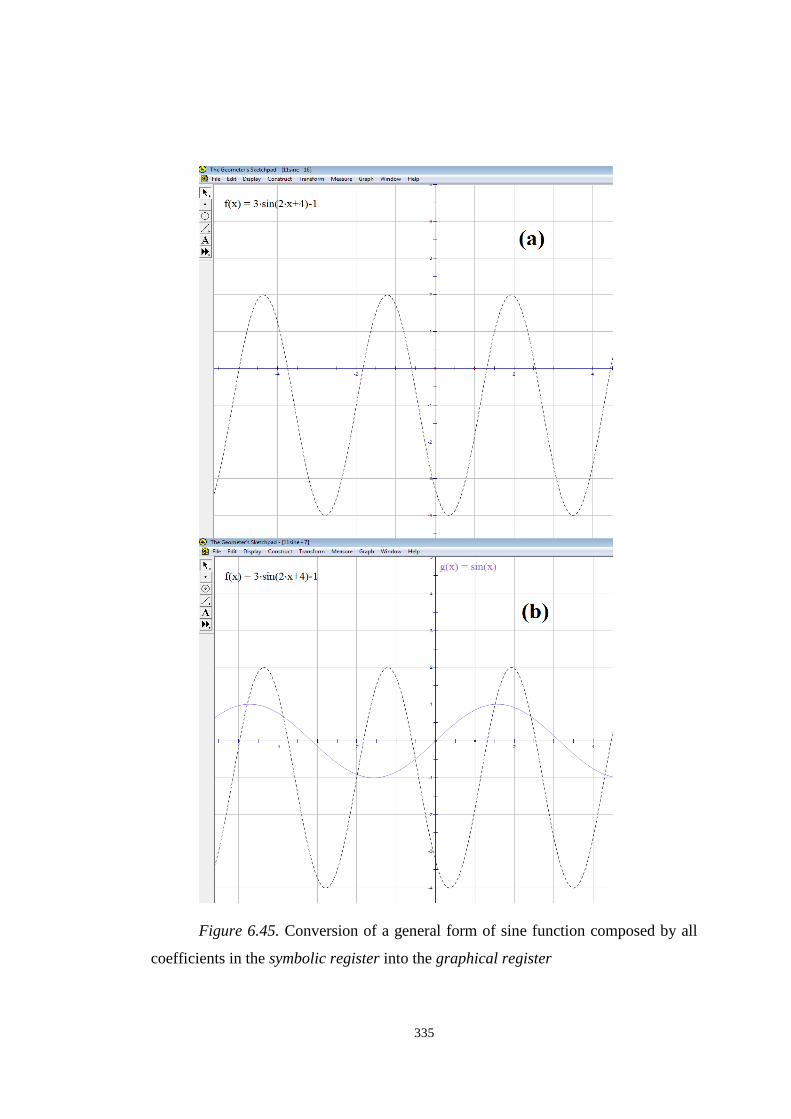
335
Figure 6.45. Conversion of a general form of sine function composed by all
coefficients in the symbolic register into the graphical register
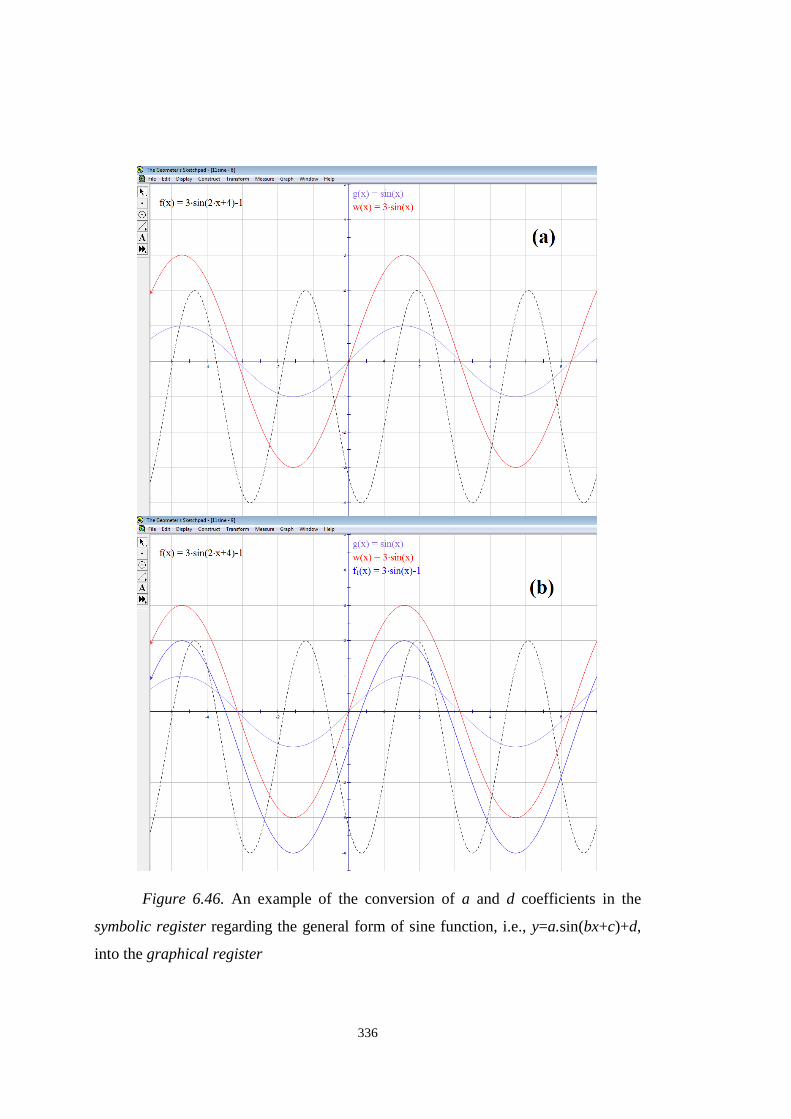
336
Figure 6.46. An example of the conversion of a and d coefficients in the
symbolic register regarding the general form of sine function, i.e., y=a.sin(bx+c)+d,
into the graphical register
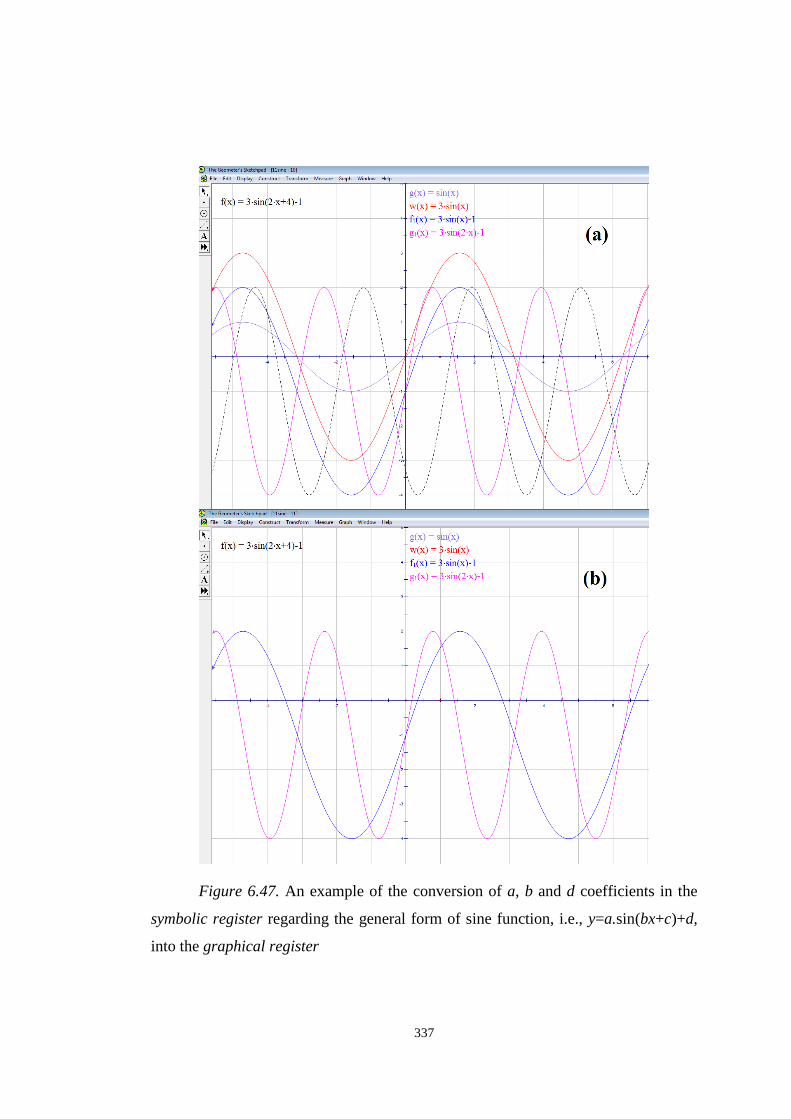
337
Figure 6.47. An example of the conversion of a, b and d coefficients in the
symbolic register regarding the general form of sine function, i.e., y=a.sin(bx+c)+d,
into the graphical register
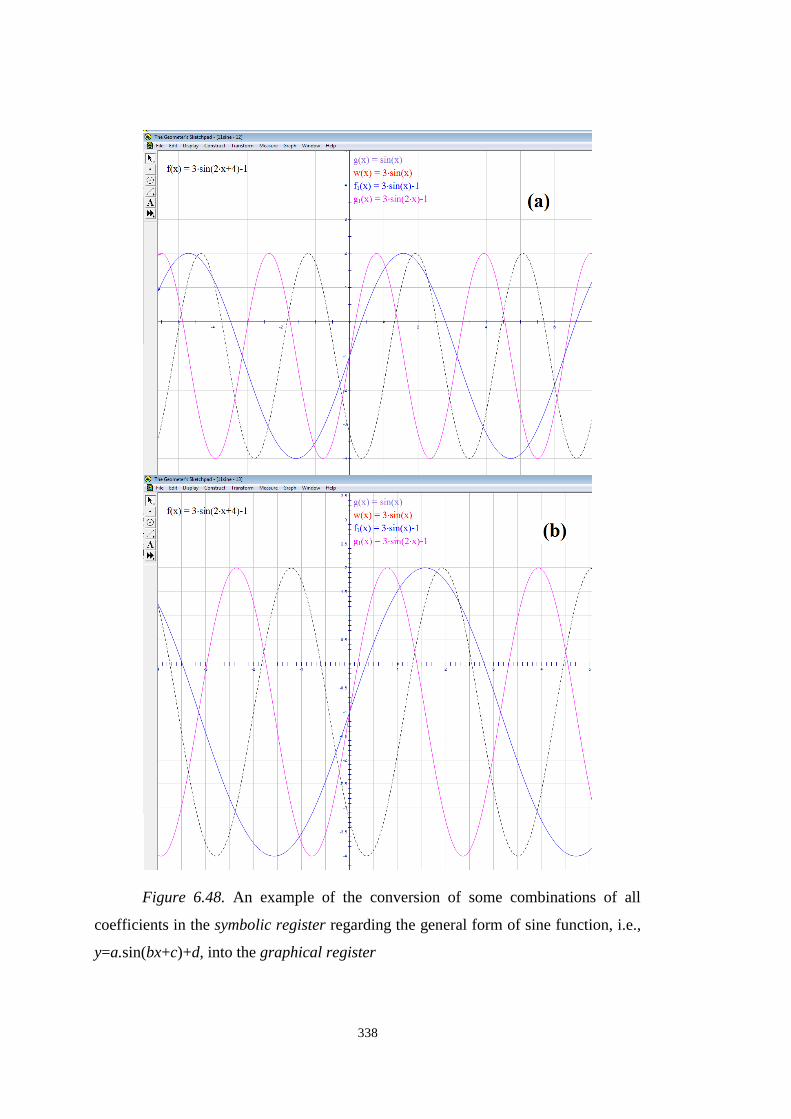
338
Figure 6.48. An example of the conversion of some combinations of all
coefficients in the symbolic register regarding the general form of sine function, i.e.,
y=a.sin(bx+c)+d, into the graphical register
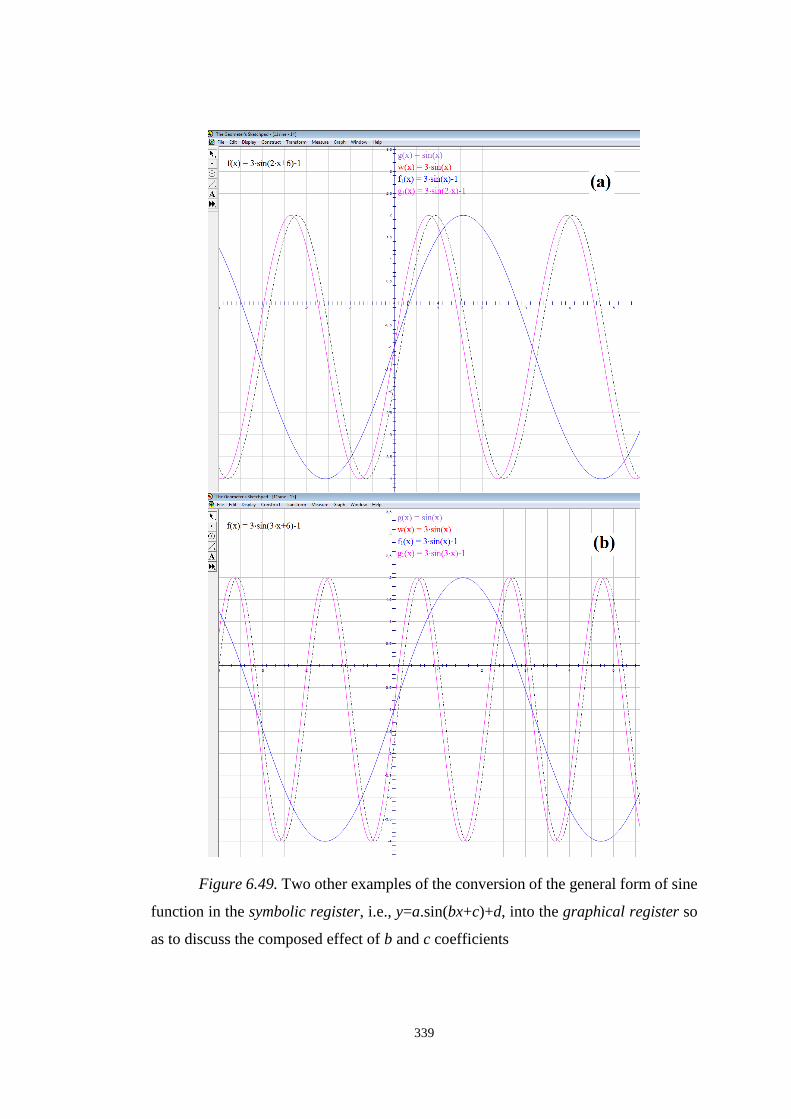
339
Figure 6.49. Two other examples of the conversion of the general form of sine
function in the symbolic register, i.e., y=a.sin(bx+c)+d, into the graphical register so
as to discuss the composed effect of b and c coefficients
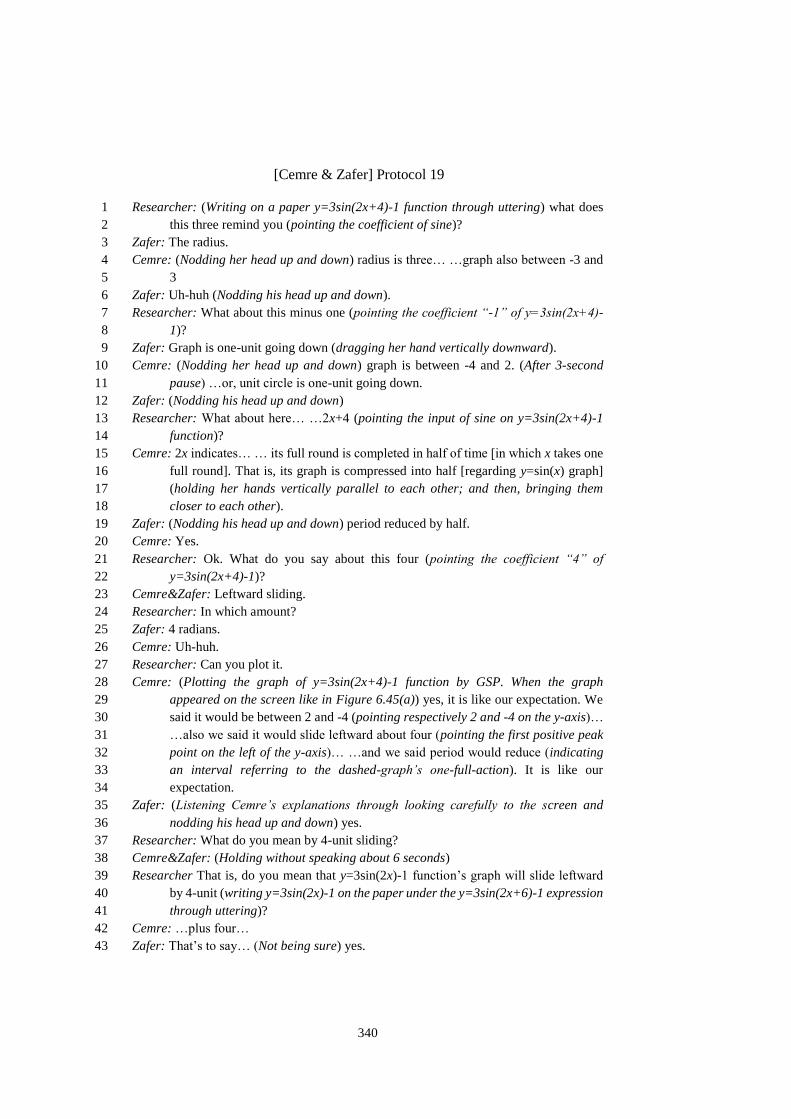
340
[Cemre & Zafer] Protocol 19
Researcher: (Writing on a paper y=3sin(2x+4)-1 function through uttering) what does 1
this three remind you (pointing the coefficient of sine)? 2
Zafer: The radius. 3
Cemre: (Nodding her head up and down) radius is three… …graph also between -3 and 4
3 5
Zafer: Uh-huh (Nodding his head up and down). 6
Researcher: What about this minus one (pointing the coefficient “-1” of y=3sin(2x+4)-7
1)? 8
Zafer: Graph is one-unit going down (dragging her hand vertically downward). 9
Cemre: (Nodding her head up and down) graph is between -4 and 2. (After 3-second 10
pause) …or, unit circle is one-unit going down. 11
Zafer: (Nodding his head up and down) 12
Researcher: What about here… …2x+4 (pointing the input of sine on y=3sin(2x+4)-1 13
function)? 14
Cemre: 2x indicates… … its full round is completed in half of time [in which x takes one 15
full round]. That is, its graph is compressed into half [regarding y=sin(x) graph] 16
(holding her hands vertically parallel to each other; and then, bringing them 17
closer to each other). 18
Zafer: (Nodding his head up and down) period reduced by half. 19
Cemre: Yes. 20
Researcher: Ok. What do you say about this four (pointing the coefficient “4” of 21
y=3sin(2x+4)-1)? 22
Cemre&Zafer: Leftward sliding. 23
Researcher: In which amount? 24
Zafer: 4 radians. 25
Cemre: Uh-huh. 26
Researcher: Can you plot it. 27
Cemre: (Plotting the graph of y=3sin(2x+4)-1 function by GSP. When the graph 28
appeared on the screen like in Figure 6.45(a)) yes, it is like our expectation. We 29
said it would be between 2 and -4 (pointing respectively 2 and -4 on the y-axis)… 30
…also we said it would slide leftward about four (pointing the first positive peak 31
point on the left of the y-axis)… …and we said period would reduce (indicating 32
an interval referring to the dashed-graph’s one-full-action). It is like our 33
expectation. 34
Zafer: (Listening Cemre’s explanations through looking carefully to the screen and 35
nodding his head up and down) yes. 36
Researcher: What do you mean by 4-unit sliding? 37
Cemre&Zafer: (Holding without speaking about 6 seconds) 38
Researcher That is, do you mean that y=3sin(2x)-1 function’s graph will slide leftward 39
by 4-unit (writing y=3sin(2x)-1 on the paper under the y=3sin(2x+6)-1 expression 40
through uttering)? 41
Cemre: …plus four… 42
Zafer: That’s to say… (Not being sure) yes. 43
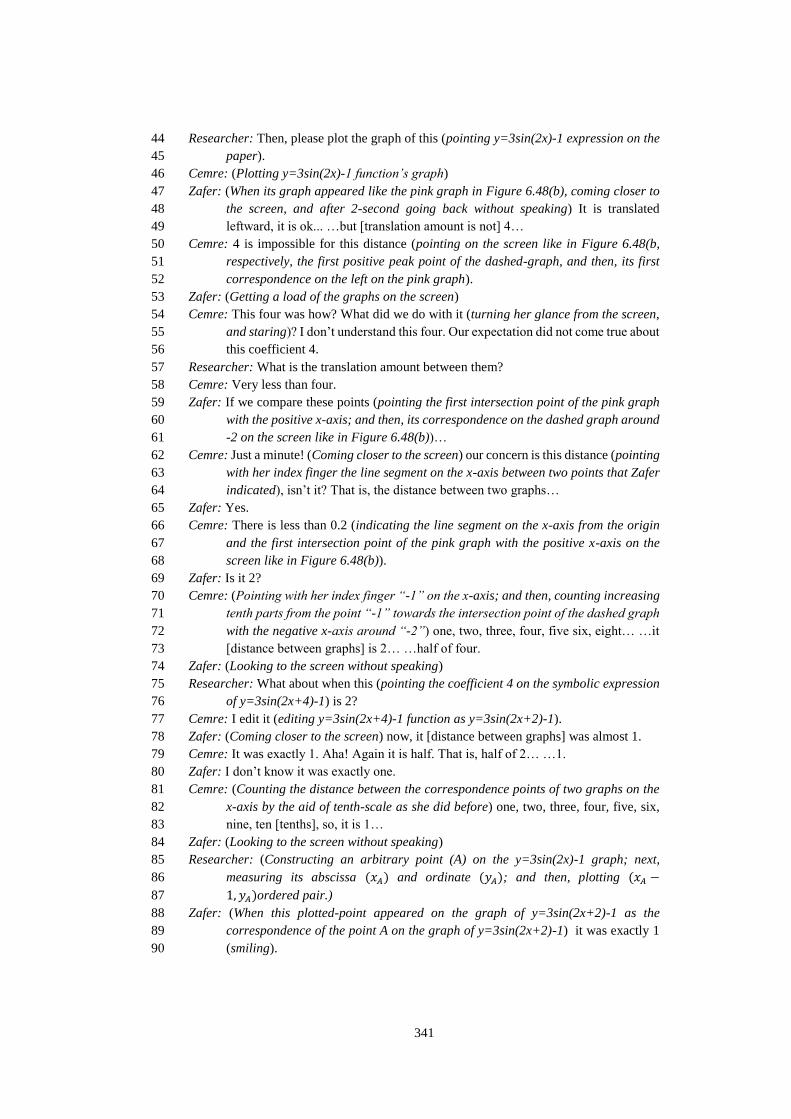
341
Researcher: Then, please plot the graph of this (pointing y=3sin(2x)-1 expression on the 44
paper). 45
Cemre: (Plotting y=3sin(2x)-1 function’s graph) 46
Zafer: (When its graph appeared like the pink graph in Figure 6.48(b), coming closer to 47
the screen, and after 2-second going back without speaking) It is translated 48
leftward, it is ok... …but [translation amount is not] 4… 49
Cemre: 4 is impossible for this distance (pointing on the screen like in Figure 6.48(b, 50
respectively, the first positive peak point of the dashed-graph, and then, its first 51
correspondence on the left on the pink graph). 52
Zafer: (Getting a load of the graphs on the screen) 53
Cemre: This four was how? What did we do with it (turning her glance from the screen, 54
and staring)? I don’t understand this four. Our expectation did not come true about 55
this coefficient 4. 56
Researcher: What is the translation amount between them? 57
Cemre: Very less than four. 58
Zafer: If we compare these points (pointing the first intersection point of the pink graph 59
with the positive x-axis; and then, its correspondence on the dashed graph around 60
-2 on the screen like in Figure 6.48(b))… 61
Cemre: Just a minute! (Coming closer to the screen) our concern is this distance (pointing 62
with her index finger the line segment on the x-axis between two points that Zafer 63
indicated), isn’t it? That is, the distance between two graphs… 64
Zafer: Yes. 65
Cemre: There is less than 0.2 (indicating the line segment on the x-axis from the origin 66
and the first intersection point of the pink graph with the positive x-axis on the 67
screen like in Figure 6.48(b)). 68
Zafer: Is it 2? 69
Cemre: (Pointing with her index finger “-1” on the x-axis; and then, counting increasing 70
tenth parts from the point “-1” towards the intersection point of the dashed graph 71
with the negative x-axis around “-2”) one, two, three, four, five six, eight… …it 72
[distance between graphs] is 2… …half of four. 73
Zafer: (Looking to the screen without speaking) 74
Researcher: What about when this (pointing the coefficient 4 on the symbolic expression 75
of y=3sin(2x+4)-1) is 2? 76
Cemre: I edit it (editing y=3sin(2x+4)-1 function as y=3sin(2x+2)-1). 77
Zafer: (Coming closer to the screen) now, it [distance between graphs] was almost 1. 78
Cemre: It was exactly 1. Aha! Again it is half. That is, half of 2… …1. 79
Zafer: I don’t know it was exactly one. 80
Cemre: (Counting the distance between the correspondence points of two graphs on the 81
x-axis by the aid of tenth-scale as she did before) one, two, three, four, five, six, 82
nine, ten [tenths], so, it is 1… 83
Zafer: (Looking to the screen without speaking) 84
Researcher: (Constructing an arbitrary point (A) on the y=3sin(2x)-1 graph; next, 85
measuring its abscissa (𝑥𝐴) and ordinate (𝑦𝐴); and then, plotting (𝑥𝐴 −86
1, 𝑦𝐴)ordered pair.) 87
Zafer: (When this plotted-point appeared on the graph of y=3sin(2x+2)-1 as the 88
correspondence of the point A on the graph of y=3sin(2x+2)-1) it was exactly 1 89
(smiling). 90
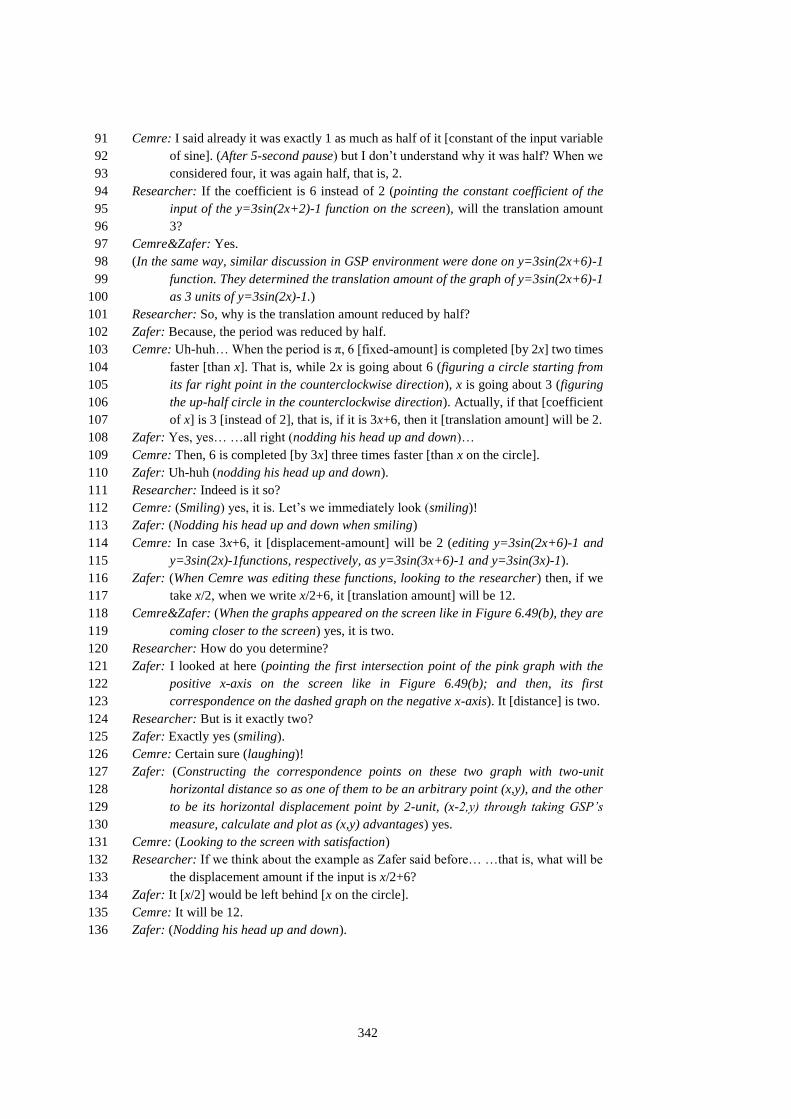
342
Cemre: I said already it was exactly 1 as much as half of it [constant of the input variable 91
of sine]. (After 5-second pause) but I don’t understand why it was half? When we 92
considered four, it was again half, that is, 2. 93
Researcher: If the coefficient is 6 instead of 2 (pointing the constant coefficient of the 94
input of the y=3sin(2x+2)-1 function on the screen), will the translation amount 95
3? 96
Cemre&Zafer: Yes. 97
(In the same way, similar discussion in GSP environment were done on y=3sin(2x+6)-1 98
function. They determined the translation amount of the graph of y=3sin(2x+6)-1 99
as 3 units of y=3sin(2x)-1.) 100
Researcher: So, why is the translation amount reduced by half? 101
Zafer: Because, the period was reduced by half. 102
Cemre: Uh-huh… When the period is π, 6 [fixed-amount] is completed [by 2x] two times 103
faster [than x]. That is, while 2x is going about 6 (figuring a circle starting from 104
its far right point in the counterclockwise direction), x is going about 3 (figuring 105
the up-half circle in the counterclockwise direction). Actually, if that [coefficient 106
of x] is 3 [instead of 2], that is, if it is 3x+6, then it [translation amount] will be 2. 107
Zafer: Yes, yes… …all right (nodding his head up and down)… 108
Cemre: Then, 6 is completed [by 3x] three times faster [than x on the circle]. 109
Zafer: Uh-huh (nodding his head up and down). 110
Researcher: Indeed is it so? 111
Cemre: (Smiling) yes, it is. Let’s we immediately look (smiling)! 112
Zafer: (Nodding his head up and down when smiling) 113
Cemre: In case 3x+6, it [displacement-amount] will be 2 (editing y=3sin(2x+6)-1 and 114
y=3sin(2x)-1functions, respectively, as y=3sin(3x+6)-1 and y=3sin(3x)-1). 115
Zafer: (When Cemre was editing these functions, looking to the researcher) then, if we 116
take x/2, when we write x/2+6, it [translation amount] will be 12. 117
Cemre&Zafer: (When the graphs appeared on the screen like in Figure 6.49(b), they are 118
coming closer to the screen) yes, it is two. 119
Researcher: How do you determine? 120
Zafer: I looked at here (pointing the first intersection point of the pink graph with the 121
positive x-axis on the screen like in Figure 6.49(b); and then, its first 122
correspondence on the dashed graph on the negative x-axis). It [distance] is two. 123
Researcher: But is it exactly two? 124
Zafer: Exactly yes (smiling). 125
Cemre: Certain sure (laughing)! 126
Zafer: (Constructing the correspondence points on these two graph with two-unit 127
horizontal distance so as one of them to be an arbitrary point (x,y), and the other 128
to be its horizontal displacement point by 2-unit, (x-2,y) through taking GSP’s 129
measure, calculate and plot as (x,y) advantages) yes. 130
Cemre: (Looking to the screen with satisfaction) 131
Researcher: If we think about the example as Zafer said before… …that is, what will be 132
the displacement amount if the input is x/2+6? 133
Zafer: It [x/2] would be left behind [x on the circle]. 134
Cemre: It will be 12. 135
Zafer: (Nodding his head up and down). 136

343
6.4. Summary of Students’ Developments on discrimination of
Trigonometric Functions from (Unit) Circle Register
During the first seven episodes of the teaching experiment, as a consequence
of their dynamically-linked conversions between representational registers, students
showed significant proggess on recognition of trigonometric functions’ basic forms in
each registers. They were able to interpret sine [cosine] as a function mapping from
arc angle to the corresponding opposite [adjacent] side of the reference right triangle
in the (unit) circle register as well as a function representing the coordinated-variations
of angle measures and corresponding sine [cosine] values in the graphical register (see
Summary of Students’ Developments on Basic Trigonometric Functions heading in
Chapter 5). Moreover, unlike their problematic initial concept images on angle and
angle measure, they were able to reason a static angle structure in the (unit) circle
register with the infinitely many [negative or positive] equivalent but not equal
measures in the symbolic register through considering dynamic directed turnings (see
Summary of Students’ Developments on Angle and Angle Measure in Chapter 5). All
these progresses emerged when students were reasoning about a mathematical object
(such as angle measure and sine [cosine] value) under the dynamic-and-linked
variations of a point on the unit circle referring to this object and its converted-
correspondence in the graphical register.
From the 8th episode forward, visual features of the different representations
of trigonometric functions (such as radius of the circle, position of the center, reference
point referring to trigonometric value in the (unit) circle register) were systematically
varied to provoke students to discuss on a new function what is mathematically
relevant or what is mathematically different when compared with trigonometric
functions’ basic forms in the (unit) circle register’s content.
In Task 8, the discussion focus changed from the basic form of the sine function
(i.e., y=sin(x)) into a general form of sine (i.e., y=a.sin(x)). For this purpose, both
functions were represented in the (unit) circle register by their reference points, P and
R, on the origin-centered unit circle and non-unit circle (see Figure 6.1). Throughout

344
this task, students developed significant understandings referring to the trigonometric
functions. On the one hand, when measuring the changed-radius by GSP, students
encountered a trouble arising from the difference between the distance-measure-unit
preference of GSP as centimeter and the visual distance-measure-unit of the coordinate
axes. At that point, the researcher provoked students to reason what they called as the
“unit” through recommending them to measure it by GSP. It was the point that students
had just started to reason about a number different from 1 as a unit. In other words,
they had just considered a non-unit circle regarding the centimeter distance-measure-
unit as a unit circle regarding the visual distance-measure-unit of the coordinate axes.
This reasoning prompted a distinct shift on their association of the arc lengths with the
angle measure in radians by means of this arc’s length through defining their own unit
(as radius) for the distance-measure. On the other hand, through taking GSP’s
“measure”, “calculate” and “drag-drop” advantages, students were able to discriminate
(i) the opposite side length of the reference right triangle on the non-unit circle from
that on the unit circle, and (ii) the principal arc length on the non-unit circle from that
on the unit circle, as well as recognize (i) the opposite side length of the reference right
triangle on the non-unit circle as the multiplication of sin(x) with the radius of the non-
unit circle in the symbolic register, and (ii) the equality between the principal arcs’
angle on the unit circle and non-unit circle (see Changed-radius in (unit) circle register
heading in Chapter 6). It was the point that students had just started to reason about a
general sine function in the form y=a.sin(x) in the (unit) circle register for positive
coefficients through associating the coefficient a with the changed-radius.
In Task 9, the discussion focus was another general form of sine (i.e.,
y=sin(x)+d) comparing with the basic form of the sine function (i.e., y=sin(x)). For this
purpose, a unit circle with a manipulable-center was constructed on the coordinate
system in order to define a new function by the reference point P as a mapping from
its angle to its ordinate (see Figure 6.16). Throughout this task, students developed
significant understandings referring to the trigonometric functions. When reasoning
about the new function through comparing and contrasting with sine, each student
showed, in general sense, the similar developments. That is, all students were able to
express this function in the symbolic register as an additive operation between sine

345
and the directed-distance of the manipulable-center to the x-axis. Moreover, they were
able to truly revise this expression in the symbolic register regarding the variation of
the manipulable-center in the (unit) circle register; furthermore, they were able to
reason its independence from the horizontal variation and dependence only the vertical
variation of the manipulable-center. However, in special sense, students in each group
were different in terms of the concept development stages related to the new function
defined on the unit circle with different-center from the origin. That is to say, on the
one hand, despite of their condensation stages in case of the unit circle whose center
was located on the origin, Defne and Ebru were at the interioriorization stage in other
cases of the unit circle. Defne’s and Ebru’s focuses were predominantly on the
processes related to the y-components in the (unit) circle register based on the
determination of the ordinates. On the other hand, Cemre and Zafer were at least in the
condensation stage in each case of the unit circle. Cemre’s and Zafer’s focuses were
predominantly on the condensed-whole of the processes instead of their details. They
focused direcly on the dissociation and association of this manipulated-function from
sine in the (unit) circle register instead of on operational processes. Beside, their some
actions and language indicated the reification stage as well. For example, Zafer
mentioned the horizontal axis from the center as the x-axis considering the x-axis as if
a reified-object without going into details but with awareness of its different location.
Cemre mentioned the unit circle whose center located on the origin as if a reified-
object; and was able to change its position up-down and left-right in her mind as a
whole on the coordinate system (see Changed-center in (unit) circle register heading
in Chapter 6).
In Task 10, the discussion was focused on another general form of sine (i.e.,
y=sin(x+c)) comparing with the basic form of the sine function (i.e., y=sin(x)). For this
purpose, in order to represent these two functions, two points were constructed on the
unit circle so that one of them was an arbitrary point and the other was its rotated-
position about the origin by a fixed-measure (see Figure 6.28). Where, the new
function was defined from the angle of the point P to the ordinate of its rotated-
position. It was the first task that a function was defined based on two different points
on the unit circle so that one of them was referring to the input and the other was
346
referring to the output. When investigating the variation of these two points on the unit
circle under the manipulation of the point P, all students recognized that the arcs
between the point P and its rotated-position remained invariant in the (unit) circle
register. Except Zafer, none of the other students associated this function with sine
until the construction of its graphical representation. Although Zafer associated this
function with sine based on its visual definition on the unit circle, he did not reason
about its symbolic representation based on its representation in the (unit) circle
register. In other words, throughout Task 10, none of the students reasoned in the (unit)
circle register about the ordinate of the rotated-position of the point P as the sine value
of the angle corresponding to the rotated-position through combining the angle of the
point P and the angle of the rotation. So, in the following tasks (Tasks 11, 12, 15 and
16), the researcher determined to provoke students to identify the abscissa/ordinate of
the rotated-position of the point P in the (unit) circle register in terms of sine/cosine
in accordance with the tasks’ themes.
In Task 11, this systematic variation of the general forms of sine was pursued
with the functions in the form y=sin(bx) as the discussion-focus. As an initial example,
y=sin(2x) was handled without mentioning its symbolic representation. For this
purpose, two points, the point P and P' (see Figure 6.39(a)), and then, the
perpendicular segments from these points to the x-axis (see Figure 6.39(b)) were
constructed in the (unit) circle register. Where, the point P was an arbitrary point on
the unit circle, and the point P' was its rotated-position about the origin by the principal
measure of the point P. When the researcher provoked students to identify the ordinate
of the rotated position of the point P in terms of sine of the new angle, all students
were able to identify (i) the principal arc corresponding to the rotated position of the
point P as 2x, and then, (ii) its ordinate as sine of 2x through considering the definition
of sine (from the arc corresponding to a point on the unit circle into its ordinate). It
was the point that students had just started to reason about a general form of the sine
function from an arc, i.e., x, to the ordinate of another arc defined dependently on x in
the (unit) circle register. In Task 12, this reasoning prompted a distinct shift on their
reasoning about the relation between sine and cosine in the (unit) circle register. That
is to say, they were able to convert the relation between the directed measures of the
347
adjacent [opposite] side of the reference right triangle and the opposite [adjacent] side
of its rotated-counterpart by π/2 radian about the center in the (unit) circle register into
the equality between cos(x) [sin(x)] and sin(x+π/2) [-cos(x+π/2)] in the symbolic
register. Moreover, they were able to extend this reasoning based on the structure
obtained through rotation by π/2 radian in the counterclockwise direction into the
reasoning on the structures obtained through rotations by the integer multiples of π/2
radian in any directions, which emerged as a result of the teaching experiment. In
special sense, Task 12 was the first task that students made sense of the negative
coefficient of –sine [–cosine] function in the (unit) circle register through considering
it as a function from the x angle to the perpendicular line segment from the point
corresponding to the (x±π) angle to the x-axis [y-axis]. Furthermore, Task 12 was the
first task that students had an alternative visual focus referring to sine [cosine] in the
(unit) circle register instead of the opposite [adjacent] side of the reference right
triangle. That is to say, students’ actions imply that they started to reason about sine
[cosine] in the (unit) circle register through exchanging their focuses between the
opposite [adjacent] side of the reference right triangle and its facing-side of the
reference-rectangle (see Footnote 44).
In Task 11, all students were able to easily and truly reason about functions,
for instance, sin(2x), sin(3x), sin(x/2), in the (unit) circle register through comparing
full-round turnings of their respective reference points on the unit circle with each
other by the aid of drag and drop option of GSP. Moreover, Cemre and Zafer were
able to extend this reasoning onto the negative multiples of x through attributing the
meaning of the negative sign in the symbolic register to the clockwise direction of the
rotation in the (unit) circle register. In other words, they had just defined y=sin(–x) in
the (unit) circle register as a function mapping the angle of a point on the unit circle
to the ordinate of its reflection point regarding the x-axis. With the other group of
students, Defne and Ebru, as a consequence of their troubles on the period issue at the
beginning of Task 11 (see Periodicity as pattern based on behaviors of trigonometric
functions heading in Chapter 6), the researcher preferred to postpone the discussions
about the meaning of the negative coefficient of the input variable in the (unit) circle
register to Task 16. In task 16, when reasoning about y=cos(–x) in the (unit) circle
348
register, it was observed that all students were able to attribute the meaning of the
negative multiples of x in the symbolic register to the clockwise direction of the
rotation in the (unit) circle register in the similar manner that Cemre and Zafer
reasoned about y=sin(–x) in Task 11.
Moreover, as a consequence of their developments throughout Task 12 in terms
of making sense of sine [cosine] as cosine [sine] (see Changed-arc with a constant
difference in (unit) circle register heading in Chapter 6), all students were able to
transfer their interpretations made on sine in Tasks 8, 9, 10 and 11 onto cosine,
respectively, in Tasks 13, 14, 15 and 16.
6.5. Summary of Students’ Developments on discrimination of
Trigonometric Functions from Graphical Register
Integration of the graphical representations in last two episodes of the teaching
experiment’s first part fortified students’ recognition of trigonometric functions in
each representational registers. Visual representations of sine [cosine] on the same
coordinate plane both in the (unit) circle register and the graphical register provided
students with the opportunity to compare and contrast the dynamic and simultaneous
variations of the reference point on the unit circle and its converted form in the
graphical register. This opportunity prompted a distinct shift on students’ recognition
of the same object (i.e., sine or cosine) represented in different representational
registers, as well as their discrimination of what is/is not mathematically relevant in
terms of the coordinate plane both in the (unit) circle register and graphical register.
For example, dynamic-and-linked manipulations of the point on the unit circle and its
correspondence on the sine [cosine] graph fortified students’ concept images on the
meaning of π. Anymore “coordinate plane” was not a cognitive conflict factor when
the position of π on the x-axis is considered simultaneously within the graphical
register and the (unit) circle register (see Summary of Students’ Developments on
Angle and Angle Measure heading in Chapter 5). In addition, they were able to
differentiate contents of the coordinate planes in the (unit) circle register and the

349
graphical register. For example, they differentiated the meaning of the abscissa
[ordinate] of a point on the unit circle from the meaning of the abscissa [ordinate] of a
point on the sine [cosine] graph (see Summary of Students’ Developments on Basic
Trigonometric Functions heading in Chapter 5).
In the second part of the teaching experiment, visual features of the different
representations of trigonometric functions (such as magnitude, parallel-displacement
along the y-axis, parallel-displacement along the x-axis and compressed/stretched
wavelength in the graphical register) were systematically varied to provoke students
to discuss on a new function what is mathematically relevant or what is mathematically
different when compared with trigonometric functions’ basic forms in the graphical
register’s content.
In Task 8, the discussion focus changed from the basic form of the sine function
(i.e., y=sin(x)) into a general form of sine (i.e., y=a.sin(x)). For this purpose, both
functions were represented initially in the (unit) circle register by their reference
points, P and R, on the origin-centered unit circle and non-unit circle (see Figure
6.1), and then, in the graphical register by their reference points P' and R' constructed
as dynamically linked to the point P and R (see Figure 6.6). When the traced graphs
by their reference points P' and R' appeared on the screen, students determined a
proportional relation between their magnitudes, i.e., the changed-visual features, and
expressed the new function in terms of sine (for example, 6.sin(x)). Initially, only
Cemre associated the changed-magnitude in the graphical register directly with the
changed-radius in the (unit) circle register. So, the researcher encouraged them to
reason about these functions under the manipulation of the radius of the non-unit circle.
All students were able to correctly revise the function’s symbolic expression regarding
the changed-radius. Furthermore, they were able to express this function’s symbolic
form regarding the radius. When investigating the dynamically-linked components in
different registers under the manipulation of the radius and the angle’s openness, they
were able to generalize their reasoning about the relations among “changed-radius” in
the (unit) circle register, “changed-magnitudes” in the graphical register and

350
“changed-coefficient r of the r.sine function” in the symbolic register (see Changed-
magnitude in graphical register heading in Chapter 6).
In Task 9, the discussion focus was based on another general form of sine (i.e.,
y= sin(x)+d) comparing with the basic form of the sine function (i.e., y=sin(x)). For
this purpose, a unit circle with a manipulable-center was constructed on the coordinate
system in order to define a new function by the reference point P as a mapping from
its angle to its ordinate (see Figure 6.16). When this function was constructed in the
graphical register as dynamically-linked to its representation in the (unit) circle
register, all students were able to associate this function with the sine [cosine] function
in the graphical register based on its visual-shape. Moreover, they were able to reason
about its graph as a parallel displacement of the sine [cosine] graph along the y-axis in
the positive/negative direction initially without considering the displacement amount.
Through reasoning about the variation of the graph under the manipulation of the unit
circle’s location, students started to reason considering displacement amount. In other
words, they associated this (directed) amount of the parallel displacement of the sine
graph with the center’s (directed) distance from the x-axis, as well as with the (signed)
constant of the sine function in the symbolic register (see Parallel-displacement along
the y-axis in graphical register heading in Chapter 6).
In Task 10, the discussion was focused on another general form of sine (i.e.,
y=sin(x+c)) comparing with the basic form of the sine function (i.e., y=sin(x)). For this
purpose, in order to represent these two functions, two points were constructed on the
unit circle so that one of them was an arbitrary point and the other was its rotated-
position about the origin by a fixed-measure (see Figure 6.28). Where, the new
function was defined from the angle of the point P to the ordinate of its rotated-
position. When this function was constructed in the graphical register as dynamically-
linked to its representation in the (unit) circle register, whereas Cemre and Ebru
associated this graph with sine based on its shape without going into details, Zafer and
Defne differentiated it from sine based on its y-intercept. When reasoning about this
graph in a more detailed way through comparing and contrasting with the sine graph,
except Defne, all other students reasoned about these two graphs as the parallel

351
displacement of each other along the x-axis. Their initial reasoning about the parallel
displacement idea was to determine the parallel displacement amount through focusing
on the distance between the corresponding points of two graphs that were selected
according to their preferences. Their next reasoning step was to define the function
represented in the graphical register regarding sine in the symbolic register. During
that phase, they were aware that the horizontal distance between corresponding points
of two graphs would affect the input of sine as a constant. However, their concept
images on the graphs’ parallel displacements along the x-axis in the graphical register
were including a conjecture on the conversion of the positive [negative] direction of
the parallel displacement along the x-axis in the graphical register into the positive
[negative] sign of the constant affecting the input variable in the symbolic register.
While this conjecture caused Cemre and Zafer’s confusion about the location of the
graph of y=sin(x+2.3) [y=sin(x-2.3)] on the left [right] with respect to sine, Ebru did
not encounter any confusion as a consequence of her failure to preserve her assumption
on the source-function and target-function of transformation coherently in the
graphical register and the symbolic register (see Parallel-displacement along the x-
axis in graphical register heading in Chapter 6). On the other hand, throughout Task
10, differently from others, Defne reasoned about these two graphs based on their
slopes with each other but focusing only on their restricted parts from their y-intercepts
up to their first intersection points. With the other group, Cemre and Zafer, discussions
were done based on three purposively constructed points, i.e., A, B and C (see Figure
6.31) in order to provoke them to reason through changing their attention-focus
hierarchically in a rectangular path among four points in the graphical register: (i) the
point B (Figure 6.31) (ii) its projection point on the x-axis, (iii) the projection point of
the point A on the x-axis (iv) the point A and (v) the point B. This hierarchical-
rectangular path of their attention-focuses caused their identification of the graph with
respect to sine. However, even though they were satisfied with this identification
process in the symbolic register, it seemed that they had not been yet satisfied with the
location of y=sin(x-2.3) on the right with respect to sine in the graphical register.
Considering Cemre’s and Zafer’s unsatisfuction and Ebru’s and Defne’s quite
different reasoning focusses on comparison of two graphs as well as their problematic

352
reasoning parts, the researcher preferred to postpone discussions on the parallel
displacement of the sine [cosine] graph along the x-axis in the graphical register in
Task 12 [Task 15] considering its meaning simultaneously in the (unit) circle register.
In Task 11, students’ making sense about a general form of the sine function from an
arc, i.e., x, to the ordinate of another arc defined dependently on x in the (unit) circle
register (see Summary of Students’ Developments on discrimination of Trigonometric
Functions from (Unit) Circle Register heading in Chapter 6) prompted a distinct shift
on their making sense of the symbolic expressions in the form of sin(x+c) and cos(x+c)
in the (unit) circle register. As a consequence, for example, in Task 15, Defne was
able to reason about the graph of cos(x+1) as the parallel displacement of the graph of
cos(x) by 1-unit along the x-axis in the negative direction based on the patterns on their
actions in the (unit) circle register. Moreover, all students interpreted the positive
[negative] constant “c” as the c-unit length before arrival [after arrival] in a value in
the graphical register as a consequence of the c-radian rotation in the
counterclockwise [clockwise] direction in the (unit) circle register in Task 12 and Task
15 (see Parallel-displacement along the x-axis in graphical register heading in
Chapter 6).
In Task 11, this systematic variation of the general forms of sine was pursued
with the functions in the form y=sin(bx) as the discussion-focus. As an initial example,
y=sin(2x) was handled without mentioning its symbolic representation. For this
purpose, two points, the point P and P' (see Figure 6.39(a)), and then, the
perpendicular segments from these points to the x-axis (Figure 6.39(b)) were
constructed in the (unit) circle register. Where, the point P was an arbitrary point on
the unit circle, and the point P' was its rotated-position about the origin by the principal
measure of the point P. When the function mapping from the angle of the point P to
the y-component of the point P' was constructed in the graphical register as
dynamically-linked to its representation in the (unit) circle register, all students
reasoned about the compression of the graph of y=sin(2x) as much as half comparing
with the graph of y=sin(x) based on the intervals (0,π) and (0,2π) in which,
respectively, sin(2x) and sin(x) completed their one-full-actions in the graphical
register as a consequence of one-full-round turnings of their reference points in the

353
(unit) circle register. In the same way, they were able to reason about the stretched-
graphs comparing with y=sin(x). Moreover, Cemre and Zafer were able to extend this
reasoning in Task 11 onto the graph of sine for the negative multiples of x through
attributing the meaning of the negative sign of the coefficient of x in the symbolic
register into the graphical register as the reflection of the graph of y=sin(x) regarding
the x-axis. On the other hand, with the other group of students, Defne and Ebru, as a
consequence of their troubles on the period issue at the beginning of Task 11 (see
Periodicity as pattern based on behaviors of trigonometric functions heading), the
researcher preferred to postpone the discussions about the meaning of the negative
coefficient of the input variable in the graphical register to Task 16. In task 16, when
reasoning about y=cos(–x) in the graphical register, it was observed that all students
were able to attribute the meaning of the negative multiples of x in the symbolic
register to the negative angles represented on the negative x-axis in the graphical
register. By this way, they interpreted the graph of y=cos(–x) as the reflection of
y=cos(x) regarding the y-axis through considering y=cos(–x) as a function from x to
cos(–x) in the graphical register in the similar manner that Cemre and Zafer reasoned
about y=sin(–x) in Task 11.
Moreover, as a consequence of their developments throughout Task 12 in terms
of making sense of sine [cosine] as cosine [sine] (see the heading Changed-arc with a
constant difference in (unit) circle register heading in Chapter 6), all students were
able to transfer their interpretations made on sine in Tasks 8, 9, 10 and 11 onto cosine,
respectively, in Tasks 13, 14, 15 and 16.
6.6. Summary of Students Developments on Periodicity
In last two episodes of the teaching experiment’s first part, dynamic-and-linked
manipulations of sine [cosine] between different registers promoted students’
reasoning about the repetition of the sine [cosine] values within the (unit) circle
register as a consequence of full-round turnings of the point P (see Figure 5.21), and
the repetition of the sine [cosine] values in the graphical register (see Summary of

354
Students’ Developments on Periodicity heading in Chapter 5). In these tasks, there was
only one point on the unit circle referring to the full-round turnings.
In the second part of the teaching experiment, visual features of the different
representations of trigonometric functions were systematically varied to provoke
students to discuss on a new function what is/is not mathematically relevant when
compared with trigonometric functions’ basic forms. Period was an important
discussion focus of each episode in this part of the teaching experiment.
Initially, in Task 8, definition of sine on the origin-centered unit circle was
transformed into a new definition on the origin-centered non-unit circle with the
same visual objects (a reference point on the circle referring to an arc and a
perpendicular line-segment to the x-axis). Reference points for both function (points P
and R) were constructed in GSP environment in a dynamically-linked way (see Figure
6.1). As a consequence of their simultaneous movements at the same angular speed in
the GSP environment in the (unit) circle register as well as their one full-actions in the
same interval in the graphical register, all students reasoned about the new function
defined on the non-unit circle with the same period as the basic form of sine –i.e., 2π.
Next, in Task 9, definition of sine on the origin-centered unit circle was
transformed into a new definition on the unit circle with different-center from the
origin with the same visual objects (a reference point on the circle referring to an arc
and a perpendicular line-segment to the x-axis) (see Figure 6.16). Where, there was
only one point, the point P, referring to the full-round turning in the (unit) circle
register, as well as the unique shape (see Footnote 47) of their graphs indicating their
one full-actions in the same interval in the graphical register (see Figure 6.25(b)).
Thus, students were able to reason truly about the new function defined on the unit
circle with different-center from the origin with the same period as the basic form
of sine –i.e., 2π.
Afterwards, in Task 10, definition of sine by only one reference point on the
unit circle was transformed into a new definition based on two different reference
points on the unit circle. These two points were constructed on the unit circle so that
one of them was an arbitrary point and the other was its rotated-position about the

355
origin by a fixed-measure (see Figure 6.28). These two points were moving in the
same (angular) speed on the unit circle under the manipulation of them in GSP
environment. Thus, students were able to reason about the new function defined by
two points with the same (angular) speed in the (unit) circle register with the same
period as the basic form of sine –i.e., 2π– based on their full-round turnings, as well
as based on the unique shape of their graphs (see Footnote 47) indicating their one
full-actions in the horizontally-translated-intervals in the graphical register.
Lastly, in Task 11, definition of sine by only one reference point on the unit
circle was transformed into a new definition based on two different reference points
on the unit circle with the different (angular) speeds in GSP environment. One of
these points was constructed on the unit circle in GSP environment as an arbitrary
point and the other as its rotated-position by a measure dependent on the principal
measure of the first point so as to be its integer multiples. As an initial examples, the
point P as an arbitrary point and the point P' as its rotated-position about the origin by
the principal measure of the point P were constructed in GSP environment. Thus, the
point P' was moving on the unit circle at the double (angular) speed of the point P in
the GSP environment (see Figure 6.39(a) and Figure 6.39 (b)). Dynamically-linked
conversion of the new function (mapping from the angle of the point P to the ordinate
of the point P') from the (unit) circle register into the graphical register together with
the sine graph caused for students to bring the period aspect up for discussion.
On the one hand, Cemre and Zafer interpreted the period of y=sin(2x) as half
of the period of y=sin(x) through attributing its meaning to (i) the half-turning of the
point P (referring to the input of y=sin(2x)) so as to bring forth one full-round turning
of the point P' (referring to the output of y=sin(2x)) in the (unit) circle register, (ii)
(0,π) interval (Footnote 46) as the half of (0,2π) interval on the x-axis in which,
respectively, sin(2x) and sin(x) completed their one-full-actions in the graphical
register as a consequence of one-full-round turnings of the point P' and P (referring to
the outputs of y=sin(2x) and y=sin(x)) in the (unit) circle register).
On the other hand, Defne and Ebru encountered a trouble based on the full-
round turnings of two points referring to (i) the input variable and (ii) the output

356
variable. While Defne interpreted the period of y=sin(2x) as 4π considering two full-
rounds of the point P' that was produced by one full-round of the point P, Ebru
interpreted the period as 2π considering one full-round turning of only the point P'. In
other words, they interpreted the period in the (unit) circle register based only on the
full-round turning of the reference point of the output variable rather than the turning
of the reference point of the input variable producing the full-round of the reference
point of the output variable. Therefore, the researcher encouraged them to reason about
the full-round-turnings of the point P' dependently on the turning of the point P.
Where, they were able to attribute one-full-round turning of the point P' to the π-radian
turning of the point P in the (unit) circle register. When similar discussion were done
on another function, i.e., y=sin(3x), based on its dynamic-and-linked representation
within and between the (unit) circle register and the graphical register, they were able
to reason about the full-round turning of the reference point of the output variable
dependently on the turning of the reference point of the input variable. When the
researcher asked them to reason about their periods through emphasizing its meaning
as the smallest-repeated-interval in the graphical register and the length of this interval
in the symbolic register, they were able to reason about these functions’ periods
correctly through using the x-axis as a measuring tool to determine the length of these
intervals.
At the end of Task 11, all students were able to determine the period of some
other functions in the form y=sin(bx) accurately in two different reasoning ways in the
symbolic register. For example, firstly, by the proportional reasoning, they determined
the period of y=sin(3x) as 2π/3 through considering it as one third of the basic sine
function’s period. Secondly, they determined the period of y=sin(3x) as about 2.1 by
the reasoning way based on the measurement of the abscissa of the right endpoint of
the interval referring to its first one-full action.
Moreover, all students were able to transfer their final interpretations on the
period of the general forms of sine in Tasks 8, 9, 10 and 11 mentioned above to cosine,
respectively, in Tasks 13, 14, 15 and 16 as a consequence of their conceptual
developments on association of cosine [sine] with sine [cosine] throughout Task 12
357
(see Changed-arc with a constant difference in (unit) circle register heading in Chapter
6).
6.7. Summary of Students’ Reasoning on Composed-Coefficients’
Visual Oppositions
The main themes of the episodes of the teaching experiment were the
conversion tasks based on the discrimination of the visual features’ oppositions in any
representational register. Therefore, while the (unit) circle register and the graphical
register were considered as both the source register and the target register, the
symbolic register was considered primarily as the target register of the conversion
tasks. Moreover, the visual features of each task between Task 8 and 11 [Task 13 and
16] were referring in the symbolic register to only one coefficient of the general form
of the sine [cosine] function. Therefore, at the end of Task 11 [Task 16], the researcher
provoked students to reason about the coefficients’ visual oppositions on a general
form of sine [cosine] stated by all coefficients in the symbolic register with two main
aims: (i) to reverse the role of the symbolic register in the conversion as the “source
register”, (ii) to bring the composed-coefficients’ composed-visual oppositions up for
discussion.
For this purpose, at the end of Task 12, a general form of sine function in the
form y=3sin(2x+4)-1 was considered as the first example. When reasoning in the
language register about the visual opposition of the coefficient of sine; i.e., 3, all
students associated this coefficient in the symbolic register with the tripled-radius in
the (unit) circle register, as well as the tripled-magnitude in the graphical register.
Moreover, they were able to expressed the composed-visual oppositions of the
coefficient and constant of sine; i.e., respectively 3 and -1, through articulating the
upper and lower bounds of the range set in the graphical register, as well as the 1-unit
down location of the circle in the (unit) circle register.

358
When reasoning in the language register about the coefficient “2” and constant
“4” of the input of sine, students preferred to reason about “2” and “4” coefficients’
visual oppositions mainly in the graphical register. They reasoned about the visual
opposition of “4” as the parallel displacement of the graph along the x-axis by 4 units
in the negative direction and and the visual opposition of “2” as the compression of
the graph into half. That is, they reasoned about the visual oppositions of these two
coefficients separately rather than their composed-visual opposition.
When the graph of this function was plotted in GSP environment, all students
encountered a major trouble on reasoning about the composed-visual-opposition of the
coefficients “2” and “4” in the graphical register. At that point, the researcher
provoked them to reason about the variation of y=sin(x) function’s graph up to
y=3sin(2x+4)-1 function’s graph through incorporating a new function into the
discussion; respectively, y=3sin(x), y=3sin(x)-1, y=3sin(2x)-1. Until the last step of this
reasoning process, they had no conflict between the variation of the graphs and their
expectations about them in the graphical register. That is to say, their concept images
on the visual variation in the graphical register between (i) sin(x) and 3sin(x), (ii)
3sin(x) and 3sin(x)-1, (iii) 3sin(x)-1 and 3sin(2x)-1 were coherent with the visual
variation between these pairs of graphs produced by GSP. However, they encountered
the major trouble on the visual variation between the graphs of y=3sin(2x)-1 and
y=3sin(2x+4)-1 in terms of the displacement amount between their graphs.
When this major trouble emerged, the researcher asked students to determine
the displacement amount between these two graphs. All students determined the
displacement amount as 2 –instead of 4– by the aid of GSP’s “zoom in” and “zoom
out” options for the scaled x-axis. Where, the researcher encouraged them to reason
about the displacement amount when the constant of the input of sine was changed
from 4 to 2. When students edited y=3sin(2x+4)-1 as y=3sin(2x+2)-1, they determined
displacement amount as 1 –instead of 4– based on dynamically-changed graphs, as
well as associated the displacement amount with the half of the constant of the input
of sine. When reasoning about the cause of this half-reduced displacement amount, all
students attributed the cause of this half-reduced-displacement-amount to the half-

359
reduced-period. At that point, the researcher encouraged them to reason about the
displacement amount when the coefficient of the input of sine was changed. Again,
students attributed the ratio between the changed-displacement amounts (see Footnote
48) to the ratio between the changed-periods. That is to say, they started to reason
about the displacement amount by an operational-process as the division (of the
constant) by the coefficient of x as in the case of the determination process of the
period. Moreover, they verified this determination in the graphical register based on
the distance between the correspondence points on the x-axis of these two functions
through using the scaled x-axis of the GSP as a measuring-tool. Furthermore, they
reasoned in the same way for the some other functions in GSP environment through
manipulating the coefficients in the symbolic register and observing their simultaneous
effects in the graphical register in terms of the changed-displacement amount –
between two graphs with and without the constant term of the input of sine.
Besides, in addition to the graphical register, students interpreted the cause of
the changed-displacement amount (Footnote 48) in the (unit) circle register as well.
They converted the constant “c” of the input of sine in the symbolic register into a c-
radian fixed-arc in the (unit) circle register; and then, interpreted this fixed-arc by
means of two different, but dependent, (angular) speeds referring to x and bx. That is
to say, they attributed the displacement amount in the graphical register to the (c/b)-
radian turning of the reference point of (x) that produced the c-radian arc as the path
of the reference point of (bx) so as to indicate (bx+c) in the (unit) circle register. It
means that students reasoned about the c-radian arc between the reference-points of
(bx) and (bx+c) in a dynamic-turning-structure through considering the turning-
amount of (bx) dependently on the turning amount of (x) (see Composed-Coefficients’
Visual Oppositions heading in Chapter 6). The researcher inferred that students’ this
reasoning arose from their effort to determine how much turning of (x) caused the c-
radian “before arrival/after arrival” on a specific point between the reference points of
(bx) and (bx+c) in the (unit) circle register (for more detailed articulation about
“before arrival/after arrival” aspect, see the last paragraph of the heading Parallel-
displacement along the x-axis in graphical register). In the scope of teaching
experiment, the researcher preferred not to discuss this issue in the GSP environment

360
because the manipulation of the coefficients “b” and “c” for the functions in the form
y=asin(bx+c)+d in the (unit) circle register required time-consuming-constructions in
contrast to the “easy-manipulation” of these coefficients in the symbolic register and
“fast-observation” of their oppositions in the graphical register.
Finally, all these issues of Task 11 mentioned above on the general form of
sine were discussed at the end of Task 16 on the general form of cosine. It was
observed that students were able to transfer their final interpretations in Task 11 on the
composed-visual oppositions of the composed-coefficients for sine mentioned above
to those for cosine at the end of Task 16 as a consequence of their conceptual
developments on association of cosine [sine] with sine [cosine] throughout Task 12
(see Changed-arc with a constant difference in (unit) circle register heading in Chapter
6).

361
CHAPTER 7
7. RESULTS FROM TEACHING EXPERIMENT: PART 3
In this chapter, students’ abilities to transform their understanding having
developed throughout the teaching experiment on trigonometric functions (see
summary parts in Chapter 5 and 6) as well as their conversion troubles in paper-and-
pencil environment when dealing with a mathematical modeling task on trigonometry
context are presentated.
The aim of this chapter is to provide the model of students’ trigonometry in
paper-and-pencil environment at the end of the teaching experiment conducted in GSP
environment through articulating their reasoning steps in the modeling process of the
ground clearance of a car on the Ferris wheel as well as the distance to the position
gotton in the car.
7.1. Modeling Task with Ferris Wheel: Modeling Process
Although students were studied previous tasks separately as two pairs,
throughout this task, all of four students were worked as a group on a mathematical
modeling task with Ferris wheel (Appendix C).
The first step of students’ reasoning on the modeling task was the visualization
of the task context. Initially, students focused on the positions of 36 cars on the Ferris
wheel with a 10-degree distance between two successive cars as if a static structure
instead of the dynamic structure of one car. Initially, Cemre and Defne started to draw
a circle and a base line so as to model this Ferris wheel (e.g., Figure 7.1). They put the

362
first car on the bottom and the following three cars on the right, top, and left of the
circle; and then, Defne reasoned that other cars located at a 10-degree interval (Figure
7.2); Cemre placed the other 32 cars on the circle so as to be 8 cars in each quadrant
(Figure 7.3). At that point, Ebru constructed her own drawing in that way; and then,
reasoned about the ground clearance on four positions, namely, bottom, right, top and
left as 4 meter, 74 meter, 144 meter and 74 meter respectively (Figure 7.5). After
observing others’ drawings, Zafer said that “we can consider it as an upward-translated
version of the unit circle (putting his right hand horizontally on the horizontal line
referring to the ground on the Ebru’s drawing like in Figure 7.5; and then, dragging
his hand vertically-upward until the center of the circle)”; and then, started to construct
his model for the Ferris wheel (Figure 7.6). Where, Defne objected to the unit meaning
through saying “but not unit, whose radius is 70”. Cemre responded her “we can
assume 70 meter as the unit length”. Zafer confirmed Cemre’s articulation; and wrote
-1 and 1 near the bottom and top intersection points of the circle with the vertical line
in his model (Figure 7.6). The researcher inferred that at the end of the teaching
experiment, Cemre and Zafer were able to reason about any non-unit circle as a unit
circle through considering a new measure unit as the units of another unit as they did
in Task 8 (see Changed-radius in (unit) circle register heading in Chapter 6).
When the unit circle idea was brought up for discussion, Cemre proposed to
discuss the ground clearance in the first quadrant in the (unit) circle register; which
was the second step of their reasoning on the modeling task. Where, Zafer asked Ebru
to calculate the value of sine of 10 degrees by GSP. After GSP gave 0.17 as the value
of sin(10) under “degrees” preference as the angle measure unit, Zafer wrote
f(x)=70sin(x)+74 function on his paper (Figure 7.6) through uttering “radius was 70”
when writing the coefficient of sine. And then, he articulated his reasoning way on this
function (lines 1-25 in [Modeling Task] Protocol 1). Where, his actions and language
(e.g., lines 1-10 in [Modeling Task] Protocol 1) imply that he was able to reason about
the length of the opposite side of the reference right triangle through considering the
same circle either as a unit circle or as a non-unit circle; respectively, as the sine value
and the multiplication of the sine value by the radius as he did in Task 8 (see Changed-
radius in (unit) circle register heading). Moreover, he was able to reason about a non-
363
unit circle’s changed-location through extending his reasoning about the unit circle’s
changed-location mentioned in Task 9 (see Changed-center in (unit) circle register
heading). Zafer’s reasoning in this way was confirmed by Cemre and Defne (lines 11-
21 in [Modeling Task] Protocol 1). And then, without going into details, Zafer asserted
that f(x)=70sin(x)+74 function gave the ground clearance of a car on the Ferris wheel
(lines 22-25 in [Modeling Task] Protocol 1).
At that point, Defne tried to reason about the ground clearance of the top
position arithmetically based on the nine 10-degree arcs between 10 cars in the first
quadrant, as well as the value of sin(10ᵒ). That is to say, she reasoned that each 10-
degree arc would cause the increase of the height as much as 11.9 [value of 70sin(10ᵒ)]
(lines 28-38 in [Modeling Task] Protocol 1). All other students objected to this idea as
a consequence of the circular shape (lines 35-45 in [Modeling Task] Protocol 1). Zafer
articulated for the sine function that the proportional increase of inputs did not give
proportional increase of outputs through giving the relation between sin(10ᵒ) and
sin(20ᵒ) as an example based on the curvilinear shape in the graphical register, as well
as the circular shape in the (unit) circle register (lines 36-43 in [Modeling Task]
Protocol 1). The researcher inferred that Defne’s concept image on the rate of change
of the sine values was including a trouble arising from her reasoning about “change”
idea predominantly in the symbolic register as if a constant rate of change exists
between angles and their sine values. In her construction in the (unit) circle register
(Figure 7.2), there were six perpendicular segments with the equal magnitude that
were located at equivalent-angular intervals in the first quadrant. These perpendicular
segments did not represent the increasing amount of the height regarding to the
previous one. Despite of this visualization by herself, she considered the sum of their
lengths as the same length with the up-vertical radius segment (lines 28-38 in
[Modeling Task] Protocol 1). This implies that she did not reason about the relation
between these perpendicular line segments in the first quadrant and the up-vertical
radius segment visually in the (unit) circle register. Instead, she reasoned algebraically
about the multiplication of the number of these perpendicular segments by their
magnitude as the radius predominantly in the symbolic register.
364
From this point forward, a 3-minute pause was observed. Then, the researcher
provoked them to think loudly (lines 1-2 in [Modeling Task] Protocol 2). Where, Zafer
expressed the ground clearance was found, and the distance to the position gotten in
the car was needed to be found (lines 3-7 in [Modeling Task] Protocol 2). Where the
researcher provoked them to think more deeply about f(x)=70sin(x)+74 function’s
suitability (lines 8-10 in [Modeling Task] Protocol 2). At that point, Ebru expressed
her dissatisfaction on this function’s modeling the ground clearance anywhere of the
circle (lines 11-14 in [Modeling Task] Protocol 2). Zafer claimed that this function
gave the ground clearance anywhere of the circle through attributing any position to
an angle measure (lines 15-21 in [Modeling Task] Protocol 2). And then, Defne agreed
with Zafer through articulating on two points referring to 10-degree and 20-degree
angles in the first quadrant (lines 23-35 in [Modeling Task] Protocol 2). Also, Cemre
approved this functions’ suitability (lines 36-38 in [Modeling Task] Protocol 2). Next,
Zafer confirmed the function’s suitability in case of the negative sine values, which
was approved by Cemre and Defne, through considering an arbitrary position in the
third quadrant, as well as the bottom position on the circle (lines 39-68 in [Modeling
Task] Protocol 2). However, Ebru again expressed her dissatisfaction about this
function in terms of the meaning of x in f(x); and brought “turning” up for the
discussion (lines 69-70 in [Modeling Task] Protocol 2). Zafer explained the meaning
of x in f(x) as the angle referring to the principal arc (lines 71-74 in [Modeling Task]
Protocol 2). At this point, the researcher provoked them to reason about the angle
through associating with the turning of the Ferris wheel (line 75 in [Modeling Task]
Protocol 2).
When reasoning about the changed-angle as a result of the Ferris wheel’s
turning (lines 69-78 in [Modeling Task] Protocol 2), “time” idea was brought up for
the discussion by Zafer (line 1 in [Modeling Task] Protocol 3). He reasoned that the
angle was changing at a constant speed so that one full-round (or 360 degrees) was
completed in 30 minutes (lines 1-5 in [Modeling Task] Protocol 3). It was the third
step of students’ reasoning on the modeling task that provoked students to determine
the angular speed of the Ferris wheel. They tried to make sense of the relation between
“time” and “angle” by the direct proportions considering the full-round of the Ferris
365
wheel at 30 minutes. Firstly, Cemre calculated the elapsed time to take a 10-degree
angular path as 50 seconds so as a car to reach the position of the next car (lines 6-15
in [Modeling Task] Protocol 3). Zafer calculated the elapsed time to take a 1-degree
angular path as 5 seconds (lines 16-17 in [Modeling Task] Protocol 3). And then, he
changed his reasoning focus on “time” based on “angle” into the reasoning on “angle”
based on “time”. That is to say, he calculated the angular path taken at 60 seconds as
12 degrees (lines 17-19 in [Modeling Task] Protocol 3). At that point,
Ebru proposed to determine the angular path taken at 1 second –which was referring
to the angular speed as degree/second (line 24 in [Modeling Task] Protocol 3).
Thereupon, Zafer and Cemre calculated the angular speed as 0.2 degree/second
without mentioning the angular speed term (lines 25-29 in [Modeling Task] Protocol
3). At that point, Defne proposed to determine the angular path taken at an arbitrary
time, i.e., “t” (line 30 in [Modeling Task] Protocol 3). However, they tried to determine
the angular path arithmetically for a specific time, i.e., 15 seconds, as 3 degrees, rather
than for an arbitrary time, i.e., “t” (lines 31-35 in [Modeling Task] Protocol 3). And
then, they mentioned whether or not they could find the ground clearance at 15th
second for 3 degrees (lines 36-38 in [Modeling Task] Protocol 3). This reasoning
process prompted a distinct shift on students reasoning about x in f(x)=70sin(x)+74,
which was their first model for the ground clearance in the symbolic register. That is
to say, they started to dissociate x in the f(x) from x in the sin(x) through attributing the
meaning of the former x as “time” and the latter as “angle” based on “time” in the
language register (e.g., lines 40, 73-74, 81-88 in [Modeling Task] Protocol 3).
However, they could not express the input of sine dependently on x in f(x) in the
symbolic register yet.
Their expression process of the input of sine dependently on “time” variable in
the symbolic register started by Defne’s reasoning about the angular path based on the
speeds of the points as they did in Task 11 and 16 on two points with different speeds
on the unit circle (lines 73-79 in [Modeling Task] Protocol 3). She propounded the
pattern of the relation between “time” and “angle” up for discussion through
articulating the first three angular paths respectively at the ends of the first, second and
third minutes of the turning (lines 81-87 in [Modeling Task] Protocol 3). Moreover,
366
she generalized this pattern at an arbitrary time in minutes as the multiplication of
“time” by 12 (which was the angular speed in degree/minute) but in the language
register without symbolizing it (line 88 in [Modeling Task] Protocol 3). Zafer
converted this generalization into the symbolic register as 12x through uttering (line
89-92 in [Modeling Task] Protocol 3). However, they did not symbolize it explicitly
on their model function (lines 105-120 in [Modeling Task] Protocol 3) until they
considered the importance of the boarding point on the angular position with respect
to the turning (lines 41-71, 93-108 in [Modeling Task] Protocol 3).
Their consideration of the boarding position started to Zafer’s mention about
the position of the car at the last-1-minute as 258 in degrees in the third quadrant in
the (unit) circle register (lines 41-46 in [Modeling Task] Protocol 3). He reasoned
about the position of a car at the last 1 minute as 258 in degrees through (i) assuming
the turning of the Ferris wheel in the counterclockwise direction, (ii) considering the
12-degree angular path at each 1-minute, (iii) assuming the boarding –bottom–
position as 270 degrees, (iv) considering the 12-degree turning from the boarding
position in the clockwise direction (lines 48-58 in [Modeling Task] Protocol 3). Cemre
accepted Zafer’s articulation (lines 59-62 in [Modeling Task] Protocol 3). Defne and
Ebru did not make any objection or confirmation to this articulation. Where, the
researcher asked students to reason about 258 and 12 degrees at the same time
considering the turning (lines 61-65 in [Modeling Task] Protocol 3). Their sum as 270
in degrees caused a trouble for Cemre as a consequence of her expectation on one-full-
round as 360 in degrees (line 67 in [Modeling Task] Protocol 3). However, Zafer did
not encounter any trouble about the difference between this addition (270 degrees) and
one-full-round turning (360 degrees) as a consequence of his ability to dissociate the
turning amount of a car from his definition of the angle corresponding to the position
of the car (lines 67-72 in [Modeling Task] Protocol 3). Zafer’s this ability prompted
another viewpoint to express the input of sine dependently on “time” as from the
boarding –bottom– position.
This viewpoint was the next step of students’ reasoning on the modeling task
that provoked students to consider the boarding position as an important idea for the
367
input of sine for modeling the ground clearance. Initially, Zafer tried to modify his
model function through considering the elapsed-time between the boarding position
and the far-right position as 7.5 minutes (lines 93-94 in [Modeling Task] Protocol 3).
Where, Cemre mentioned the angular path taken at the first 7.5 minutes as a constant
of the input of sine of the model function without specifying its sign (line 95 in
[Modeling Task] Protocol 3). At that point, Zafer tried to specify its sign. Initially, he
expressed that their model function gave the results after the first 7.5 minutes rather
than from the beginning (lines 96-99 in [Modeling Task] Protocol 3); and then,
determined that the first 7.5-minute turning affected the input of sine as a positive
constant (lines 98-99 in [Modeling Task] Protocol 3). Even though he was aware of
the far-right position as the position of a car at the first 7.5 minutes regarding the
turning from the boarding position in the counterclockwise direction, when
manipulating their model function so as to transform into the expected function, he
missed out the reference position between the boarding position and the far-right
position in terms of which position was transformed onto the other one. At that point,
Defne calculated the angular path taken at 7.5 minutes arithmetically as 90 degrees
(lines 100-104 in [Modeling Task] Protocol 3); and then, revised their model function
as f(x)=70sin(x+90)+74 through emphasizing x in f(x) as “time” and x+90 in sine as
“angle” (Figure 7.19). Next, Zafer revised their model function as f(t)=70sin(x+90)+74
through representing “time” variable by the letter “t” and correspondence “angle”
variable by the letter “x” (Figure 7.6); and then, reasoned in order to express x based
on “time” (lines 105-108 in [Modeling Task] Protocol 3). Defne again propounded x
in sin(x+90) as the multiplication of “time” (in minutes) by 12 (line 109 in [Modeling
Task] Protocol 3). Cemre and Zafer confirmed this; and then, Zafer revised verbally
the input of sine as 12x+90 through articulating the meaning of x in here as “time” in
minutes by an example for 1 minute [as a “time” value] and 12 degrees [as an “angle”
value taken at 1-minute] (lines 110-118 in [Modeling Task] Protocol 3). Then, Defne
revised in written the model function as f(x)=70sin(12x+90)+74 (Figure 7.19). At that
point, Zafer wanted to control this function’s suitability through calculating its value
for 1 minute (line 119-121 in [Modeling Task] Protocol 3). When Ebru calculated
70sin(12+90)+74 as 142.47 by GSP, they determined that this function did not model

368
the ground clearance from the beginning of the turning (lines 122-128 in [Modeling
Task] Protocol 3). The first cause of it that comes to their mind was the addition of 90
in the input of sine (lines 124-125, 129 in [Modeling Task] Protocol 3). They wanted
to consider 90 as a subtracted-term of the input of sine in f(x)=70sin(12x+90)+74
instead of the added-term (line 129 in [Modeling Task] Protocol 3). However, they
reasoned again based only on the calculation result of 70sin(12-90)+74 by GSP, they
could not ensure whether f(x)=70sin(12x-90)+74 models the ground clearance or not
(lines 129-133 in [Modeling Task] Protocol 3).
At that point, the researcher modeled in GSP environment a similar but not
same situation with the modeling Task (lines 1-5 in [Modeling Task] Protocol 4) by a
circle with the 7-unit radius whose center was located on the origin (Figure 7.20).
Where, it was observed that they were able to revise their last function modeling the
ground clearance (i.e., f(x)=70sin(12x-90)+74) into the function modeling the distance
of a point on the circle to y=-7 line in GSP environment (i.e., y=7sin(x-90)+7) (lines
6-26 in [Modeling Task] Protocol 4). They controlled this function’s suitability on two
angle measures (12 and 24 degrees) which corresponded to two positions at the first
and second minutes of the turning of the Ferris wheel. Initially, they calculated the
output for 12 degrees as 0.15 (lines 6-10 in [Modeling Task] Protocol 4); next,
arranged the point A on the circle so as to obtain approximately the 12-degree angle
(Figure 7.20(a)) from the point C to the point A in the counterclockwise direction
(lines 11-14 in [Modeling Task] Protocol 4); and finally, measured the distance
between the points D and A, as well as compared it with the output (lines 14-17 in
[Modeling Task] Protocol 4.) In the similar way, after controlling its suitability for 24
degrees in GSP environment, they determined that their model function (i.e.,
f(x)=70sin(12x-90)+74) was suitable for the ground clearance of a car during the
turning of the Ferris wheel (lines 17-26 in [Modeling Task] Protocol 4). When they
ensured its suitability, Zafer reasoned about the cause of subtracting 90 [degrees]
rather than adding it based on the zero-points50 of the sine function and the Ferris
50 “Zero-point” was used in the meaning of the “zero-degree” angles but from different initial sides in the
(unit) circle register (i.e., as from the positive x-axis) for sine and (i.e., as from the negative y-axis) for the
Ferris wheel.

369
wheel. That is to say, he expressed the position gotten in the car as the 90-degree before
of the far right position of the circle through assuming the counterclockwise direction
as the turning direction (lines 25-32 in [Modeling Task] Protocol 4). All other students
agreed on this reasoning (lines 33-38 in [Modeling Task] Protocol 4). They put the
function modeling the ground clearance with respect to time in minutes into the final
form as f(x)=70sin(12x-90)+74 (lines 39-44 in [Modeling Task] Protocol 4).
When reasoning in order to model the distance to the point gotten in the car
with respect to time, students’ initial constructions were in the fourth quadrant (Figure
7.4 and Figure 7.6). And then, they determined the distance from the bottom position
to the far right position as 70√2 by Pythagorean Theorem (lines 3-7 in [Modeling
Task] Protocol 2; lines 5-10 in [Modeling Task] Protocol 5). This reasoning provoked
students to reason on a right triangle by Pythagorean Theorem. When Ebru dragged
the point A in the first quadrant on GSP file (Figure 7.22), students started to reason
about the distance to the point gotten in the car in the first quadrant by Pythagorean
Theorem on a right triangle whose hypotenuse was referring to this distance (lines 11-
35 in [Modeling Task] Protocol 5). Initially, they constructed some rectangular
structures in the first quadrant on their drawings in order to specify the legs of this
right triangle in terms of sine and cosine (Figure 7.4, Figure 7.23, Figure 7.24).
Students’ drawings (Figure 7.23 and Figure 7.24), actions and language (e.g., lines
12-14, 39-43 in [Modeling Task] Protocol 5) imply that on this rectangular structures,
they were able to reason through exchanging their focuses between the opposite
[adjacent] side of the reference right triangle and its facing-side in the reference-
rectangle (see Footnote 44) in terms of sine [cosine].
Again, the symbolic expression of the model function for the distance to the
point gotten in the car was proposed by Zafer. He applied the Pythagorean Theorem
on a right triangle whose vertexes were the boarding –bottom– position, another
position in the first quadrant of the (unit) circle register, and its projection on the
vertical axis (Figure 7.23). His initial symbolization was f(x)2=(70+sinα)2+(cosα)2,
where α referring to the principal angle in the (unit) circle register (Figure 7.23). This
expression implies that he dissociated the independent (time) variable of the function
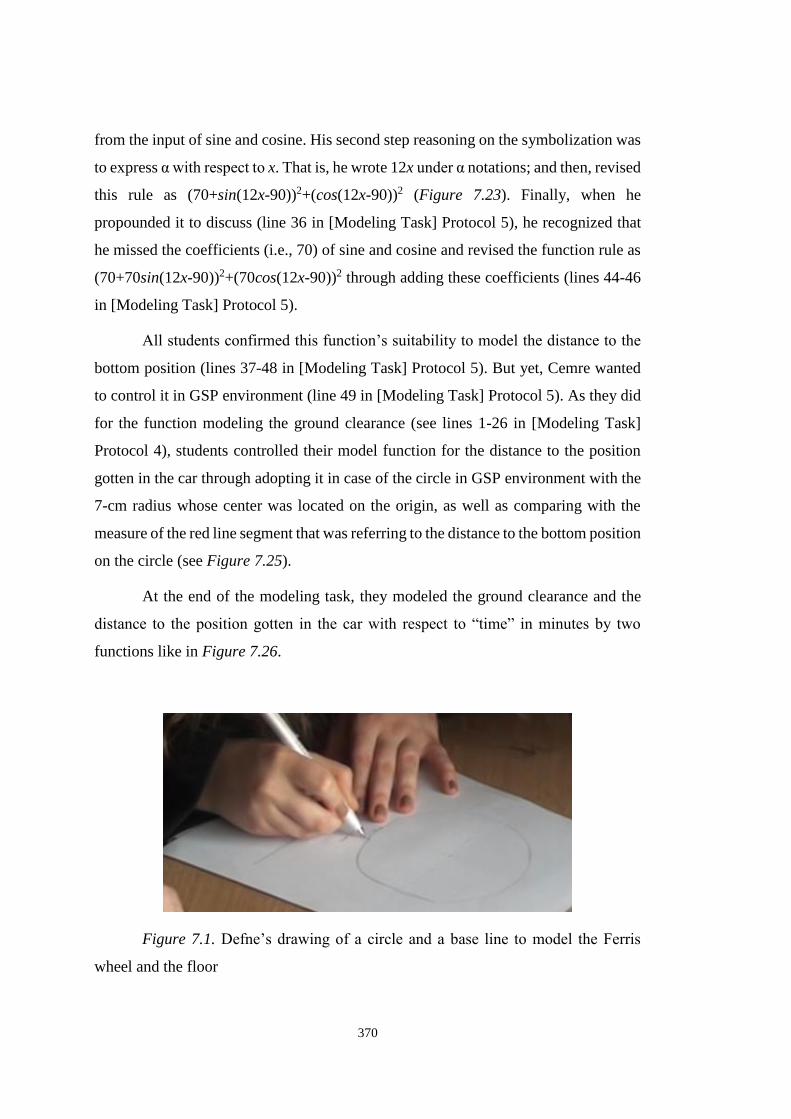
370
from the input of sine and cosine. His second step reasoning on the symbolization was
to express α with respect to x. That is, he wrote 12x under α notations; and then, revised
this rule as (70+sin(12x-90))2+(cos(12x-90))2 (Figure 7.23). Finally, when he
propounded it to discuss (line 36 in [Modeling Task] Protocol 5), he recognized that
he missed the coefficients (i.e., 70) of sine and cosine and revised the function rule as
(70+70sin(12x-90))2+(70cos(12x-90))2 through adding these coefficients (lines 44-46
in [Modeling Task] Protocol 5).
All students confirmed this function’s suitability to model the distance to the
bottom position (lines 37-48 in [Modeling Task] Protocol 5). But yet, Cemre wanted
to control it in GSP environment (line 49 in [Modeling Task] Protocol 5). As they did
for the function modeling the ground clearance (see lines 1-26 in [Modeling Task]
Protocol 4), students controlled their model function for the distance to the position
gotten in the car through adopting it in case of the circle in GSP environment with the
7-cm radius whose center was located on the origin, as well as comparing with the
measure of the red line segment that was referring to the distance to the bottom position
on the circle (see Figure 7.25).
At the end of the modeling task, they modeled the ground clearance and the
distance to the position gotten in the car with respect to “time” in minutes by two
functions like in Figure 7.26.
Figure 7.1. Defne’s drawing of a circle and a base line to model the Ferris
wheel and the floor
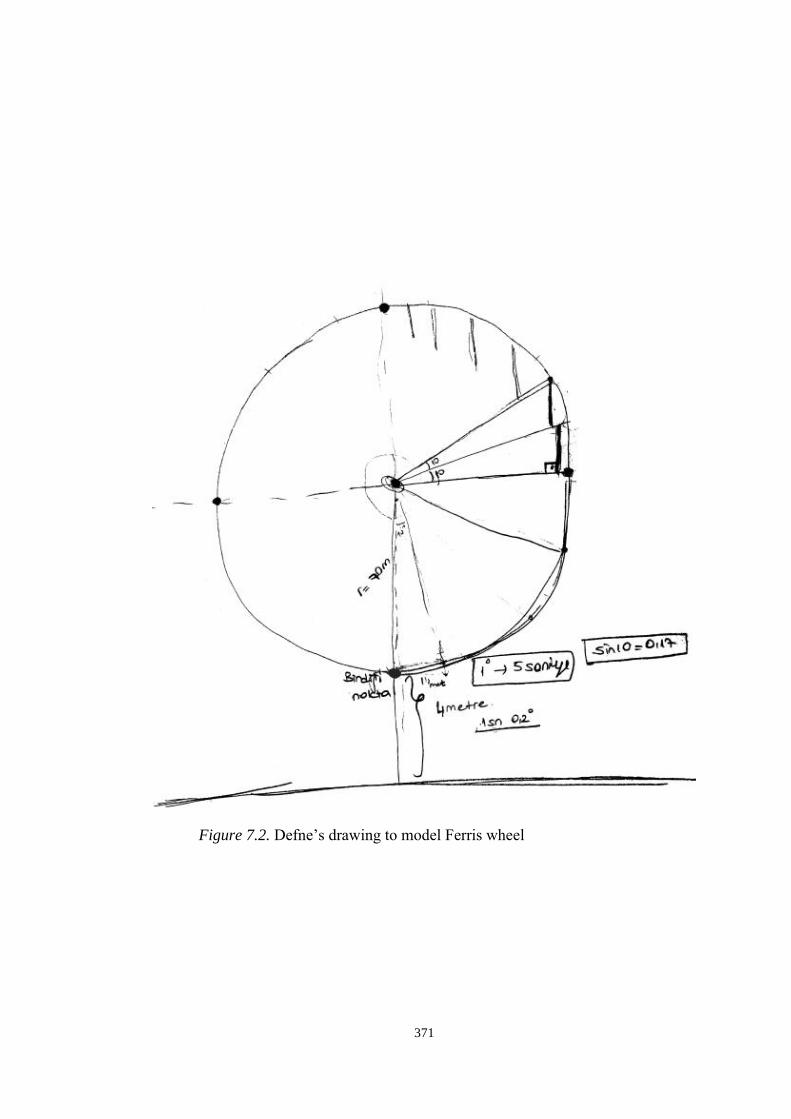
371
Figure 7.2. Defne’s drawing to model Ferris wheel

372
Figure 7.3. Cemre’s first drawing to model Ferris wheel
Figure 7.4. Cemre’s second drawing to model Ferris wheel
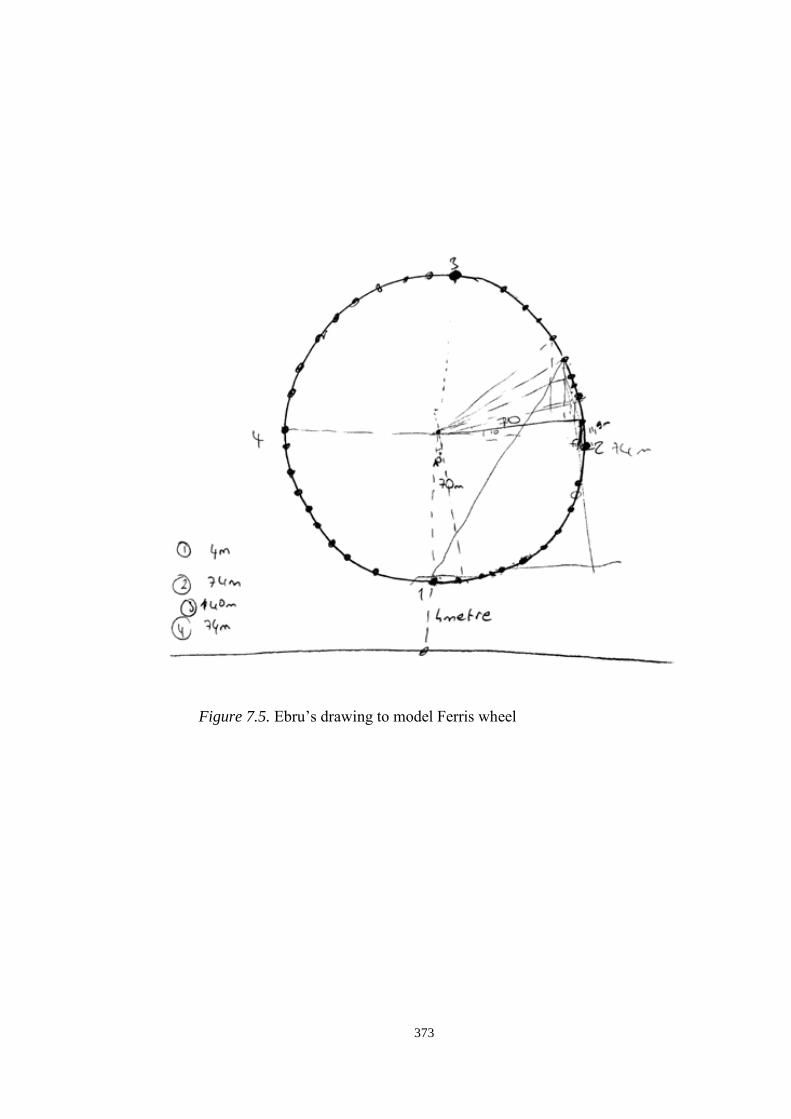
373
Figure 7.5. Ebru’s drawing to model Ferris wheel
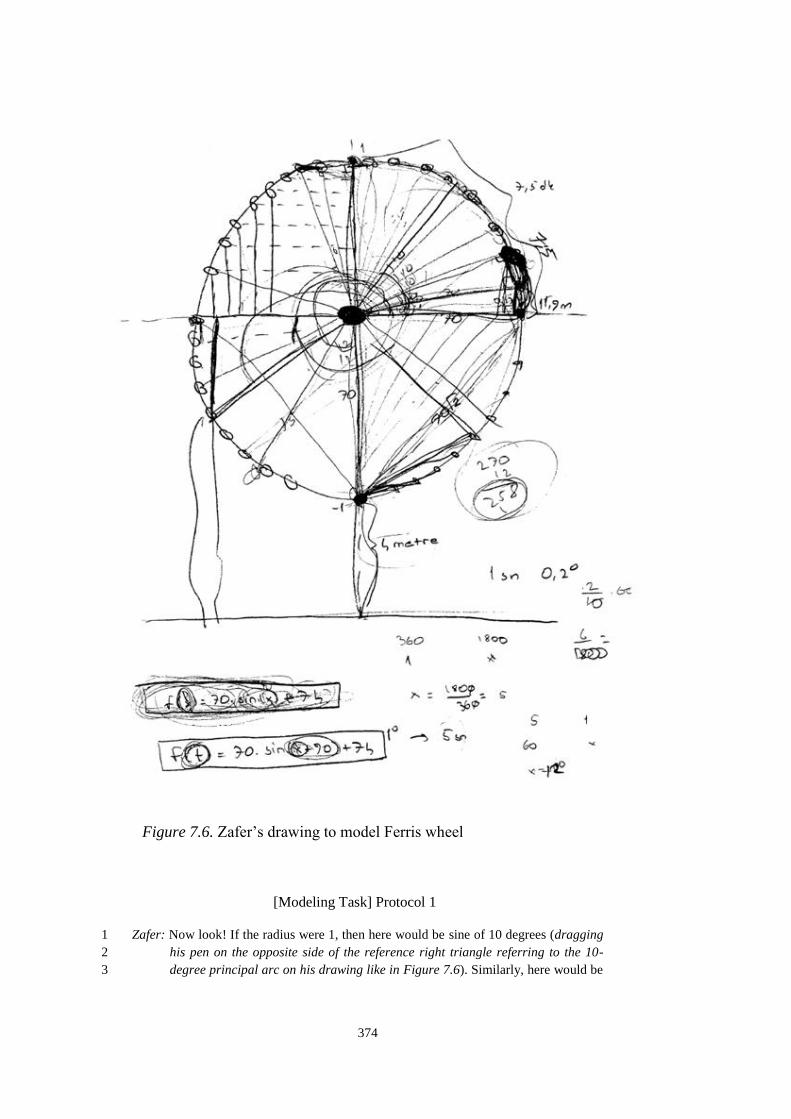
374
Figure 7.6. Zafer’s drawing to model Ferris wheel
[Modeling Task] Protocol 1
Zafer: Now look! If the radius were 1, then here would be sine of 10 degrees (dragging 1
his pen on the opposite side of the reference right triangle referring to the 10-2
degree principal arc on his drawing like in Figure 7.6). Similarly, here would be 3
375
sine of 20 degrees (dragging his pen on the opposite side of the reference right 4
triangle referring to the 20-degree principal arc). We multiple it [sin(20ᵒ)] by 70 5
in order to find this height (dragging his pen on the opposite side of the reference 6
right triangle referring to the 20-degree principal arc). And from here to here is 7
74 meters (pointing the distance between the horizontal line from the center and 8
the line referring to the ground). So, we add 74 [to 70sin(x)] (pointing 74 in 9
f(x)=70sin(x)+74 function on the paper like in Figure 7.6). 10
Cemre: Yes. We are going to do it… …and do it [for every positions] in that way 11
(pointing respectively third and fourth points in the first quadrant on Zafer’s 12
construction like in Figure 7.6). 13
Zafer: Let’s multiply 0.17 [the value of sin(10ᵒ)] by 70. 14
Ebru: (Calculated this multiplication by GSP) 15
Zafer: (When the result appeared on the screen as 11.9) 11.9… If here is 11.9 (dragging 16
his pen on the opposite side of the reference right triangle referring to the 10-17
degree principal arc; writing 11.9 on its right side like in Figure 7.6)... …this 18
(drawing on the opposite side of the reference right triangle to the 10-degree 19
principal arc) is the distance to here (drawing the horizontal line from the center). 20
Defne: Ok. I agree with you. 21
Zafer: Actually, it [car] is moving toward like that (dragging his pen on the first quarter 22
arc in the counterclockwise direction on the paper like in Figure 7.6). I think the 23
ground clearance can be found by this function (pointing f(x)=70sin(x)+74 24
function on the paper like in Figure 7.6). 25
Cemre: Zafer, make a trial (pointing f(x)=70sin(x)+74 function on the paper like in 26
Figure 7.6)! 27
Defne: Wait a minute! There are nine parts in here, because ten cars are there (dragging 28
her pen on the first quarter arc in the counterclockwise direction on the paper like 29
in Figure 7.2). So, 11.9, 11,9, like that and like that (drawing some vertical line 30
segments in the first quadrant from the points at approximately equal intervals so 31
as to refer each car of the Ferris wheel on her drawing like in Figure 7.2)… if 32
multiplying 11.9 by nine… ...it should be 70 (indicating the radius line segment 33
from the top point). Ebru, please multiply 11.9 by 9. 34
Cemre: No, it shouldn’t. 35
Defne: I mean… …in each car, it [height] increases 11.9 (drawing again same 36
perpendicular line segments in the first quadrant on her drawing like in Figure 37
7.2). 38
Zafer: No. In each car, it [height] doesn’t increase 11.9. Actually, sine is… …umm… 39
…you know remember its graph (figuring a sine wave)… For example, sin(20ᵒ) 40
isn’t double of sine (10ᵒ). When going upward (figuring the first-quarter-arc in 41
the counterclockwise direction), these values [sin(10ᵒ), sin(20ᵒ), sin(30ᵒ), etc.] is 42
increasing but decreasing the increased amount. 43
Cemre: Yes (nodding her head up and down), because of the circle shape. 44
Ebru: Yes. (Calculating (9)(11.9) as 107.1) 45
Defne: (Looking to her paper without speaking) 46
(Each of the students was looking their own paper without speaking during 3 minutes.). 47

376
[Modeling Task] Protocol 2
(Each of the students was looking their own paper without speaking during 3 minutes.) 1
Researcher: What do you think? Where did you encounter a trouble? 2
Zafer: We found the ground clearance (f(x)=70sin(x)+74 function on his paper like in 3
Figure 7.6) but we have to find the distance to here (pointing the bottom of the 4
circle on his paper). (Drawing some line segments to represent the distance to the 5
gotten point in the car; and then, drawing a specific line segment from the bottom 6
position to the far right position and determining its distance as 70√2). 7
Researcher: The thing that was asked from you is not to determine each car’s ground 8
clearance. Instead, it is to determine the ground clearance of a car that you are in 9
during the turning. 10
Ebru: Yes. When we are anywhere (pointing another point on the first quartile of the 11
circle from the points represent to the location of 36 cars on her paper like in 12
Figure 7.5), it should show us at how much height we are. We didn’t write this 13
function. 14
Cemre: (Reading the asked items loudly) 15
Zafer: We need to find so thing [function rule] that what we write in degrees [referring to 16
a position]… …it should give us the ground clearance. 17
Cemre: But in the question it [ground clearance] is asked as from the entrance (pointing 18
the bottom position on Zafer’s drawing like in Figure 7.6). 19
Zafer: I think ground clearance is found from here (pointing f(x)=70sin(x)+74 function 20
on his drawing like in Figure 7.6). What do you think? 21
Cemre: Let’s we try it. 22
Defne: On this function (circling f(x)=70sin(x)+74 function on Zafer’s drawing like in 23
Figure 7.6), for each position (pointing a position on the circle in the first quadrant 24
), when we put its angle, we find its sine (drawing the perpendicular segment from 25
this point to the horizontal line from the center). This point’s ground clearance is 26
obvious (indicating the distance between the horizontal line from the center and 27
the line referring to the ground clearance). Then, we add this height (again 28
indicating the line segment referring to the sine), and find the ground clearance. 29
Zafer: (Nodding his head up and down) 30
Defne: If we put 10 [degrees] for x (pointing x in 70sin(x)+74), we find here (figuring the 31
ground clearance of the position in the first quadrant referring to 10 degrees in 32
her drawing like in Figure 7.2). For 20 [degrees], we find here (figuring the ground 33
clearance of the position in the first quadrant referring to 20 degrees in her 34
drawing). 35
Cemre: Yes. This function is true I think (writing on a paper this function through 36
labelling it as “yerden yükseklik” like in Figure 7.7 which means the ground 37
clearance). 38
Zafer: Additionally, let’s think about the case that sine is negative in the third and fourth 39
quadrants… For example, when we look it [ground clearance] in here (drawing a 40
radius segment in the third quadrant like in Figure 7.8 so as to refer to the terminal 41
side of the angle), this angle is greater than 180 degrees (drawing an arc inside of 42
the circle from the initial side to the terminal side in the third quadrant like in 43
Figure 7.9). 44
Cemre: Yes. 45
377
Zafer: When we find its sine value, that is, here (drawing the opposite side of the 46
reference right triangle corresponding to the angle in the third quadrant like in 47
Figure 7.10) 48
Cemre: …negative. 49
Zafer: Negative, uh-huh. That is here (again drawing the opposite side of the reference 50
right triangle corresponding to the angle in the third quadrant like in Figure 7.10). 51
Cemre: Yes. 52
Zafer: When we distracted it [length of the opposite side] from 74, we find this length 53
(drawing the perpendicular line segment to the base line from the reference point 54
of the angle in the third quadrant like in Figure 7.11). 55
Defne: Yes. 56
Cemre: Ok. 57
Zafer: We can check it in here (indicating the bottom position on the circle like in Figure 58
7.12). If we look regarding this point (indicating the bottom position on the circle), 59
[angle is] 270 [degrees], sin(270) is minus one… 60
Defne: Yes. 61
Zafer: I wrote 270 (Pointing “x” in 70sin(x)+74 on Cemre’s paper like in Figure 7.7), it 62
gave minus one (underlining sin(x)), then plus seventy-four and minus seventy 63
(pointing respectively 74 and 70 on f(x)=70sin(x)+74 function), that is, 4. 64
Regarding here, the ground clearance is four (pointing the bottom position on the 65
circle like in Figure 7.12). 66
Cemre: …four. Then, it is true. 67
Zafer: Uh-huh. Consistent in itself. 68
Ebru: But where, x is what (pointing “x” in f(x) on Cemre’s writing in Figure 7.7)? It 69
should be related to our turning speed. 70
Zafer: x is angle… …for example, if it is in here (pointing a position on the circle in the 71
fourth quadrant; and then, drawing the radius segment from this point like in 72
Figure 7.13), x is its angle from here to here (drawing an arc inside of the circle 73
so as to indicate its principal arc like in Figure 7.14). 74
Researcher: Who calculates it? 75
Ebru: (Smiling) yes, that’s what I’m saying. 76
Zafer: (Laughing) let someone else calculate it. 77
Cemre: (Laughing) let computer calculate it. 78
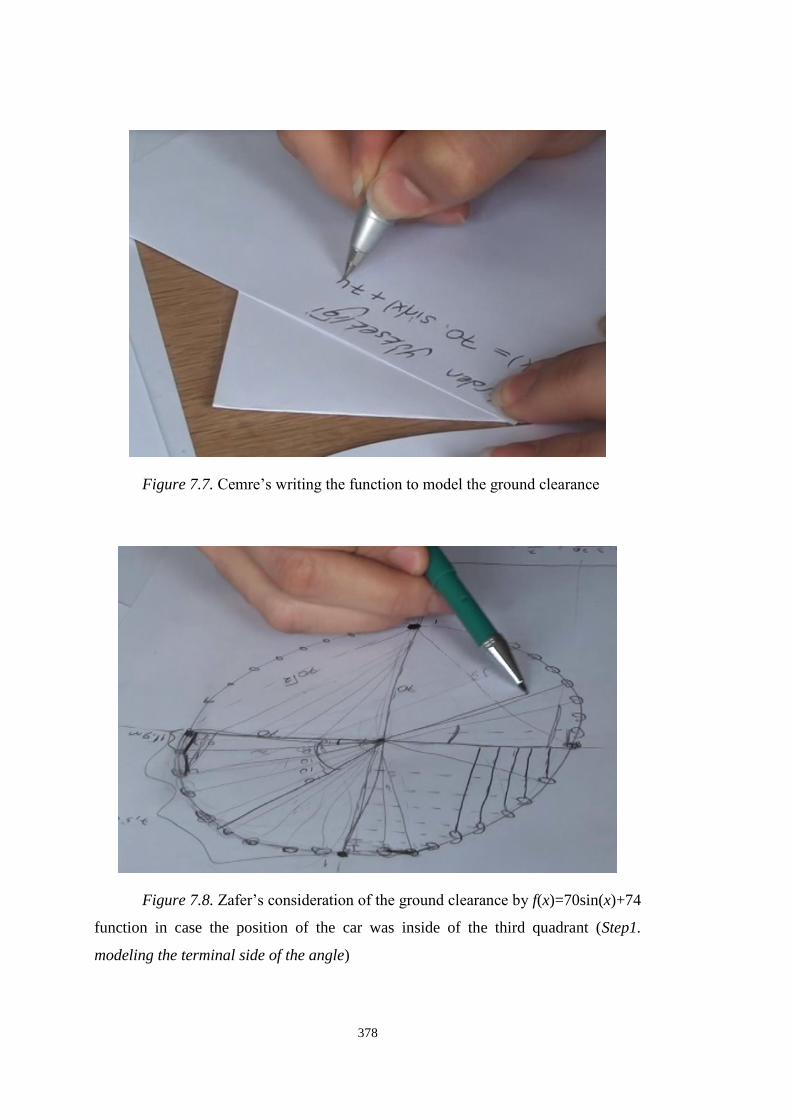
378
Figure 7.7. Cemre’s writing the function to model the ground clearance
Figure 7.8. Zafer’s consideration of the ground clearance by f(x)=70sin(x)+74
function in case the position of the car was inside of the third quadrant (Step1.
modeling the terminal side of the angle)

379
Figure 7.9. Zafer’s consideration of the ground clearance by f(x)=70sin(x)+74
function in case the position of the car was inside of the third quadrant (Step2.
modeling the angle as a dynamic turning by its principal arc in the (unit) circle
register)
Figure 7.10. Zafer’s consideration of the ground clearance by f(x)=70sin(x)+74
function in case the position of the car was inside of the third quadrant (Step3.
modeling the opposite side of the reference right triangle)
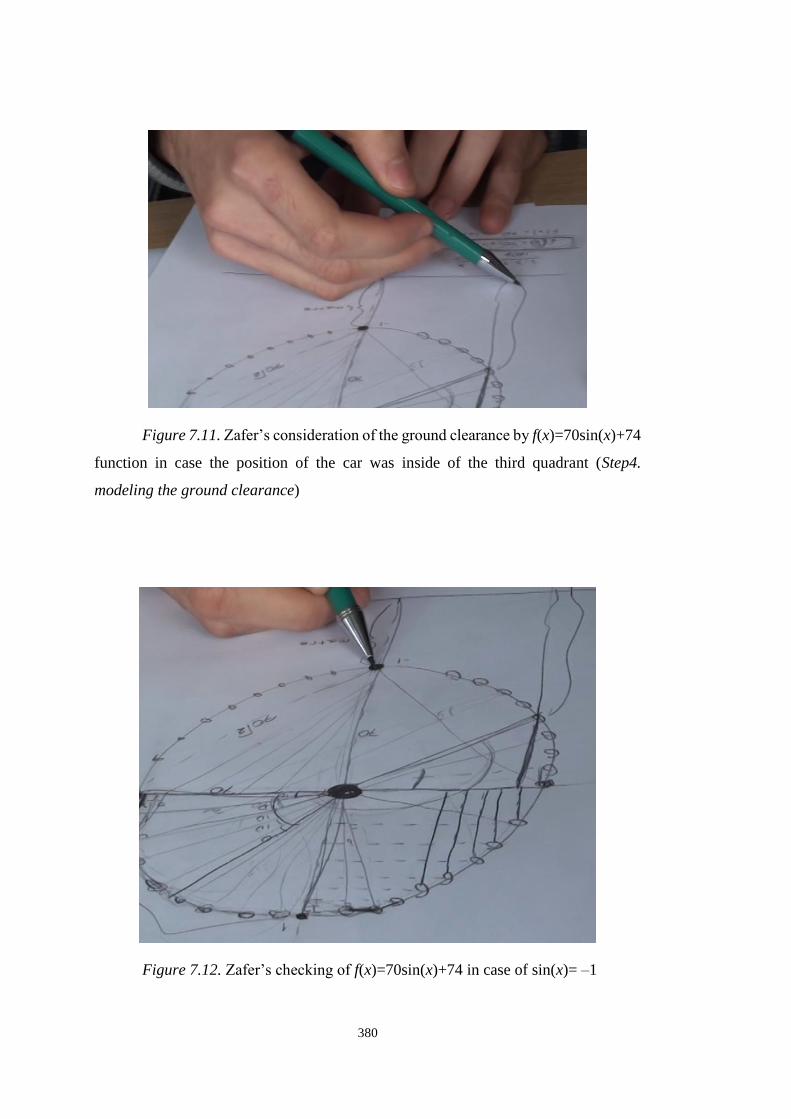
380
Figure 7.11. Zafer’s consideration of the ground clearance by f(x)=70sin(x)+74
function in case the position of the car was inside of the third quadrant (Step4.
modeling the ground clearance)
Figure 7.12. Zafer’s checking of f(x)=70sin(x)+74 in case of sin(x)= –1

381
Figure 7.13. Zafer’s drawing to articulate the meaning of x in f(x)=70sin(x)+74
(Step1. modeling the terminal side of the angle)
Figure 7.14. Zafer’s drawing to articulate the meaning of x in f(x)=70sin(x)+74
(Step2. modeling the angle as a dynamic turning by its principal arc in the (unit) circle
register)
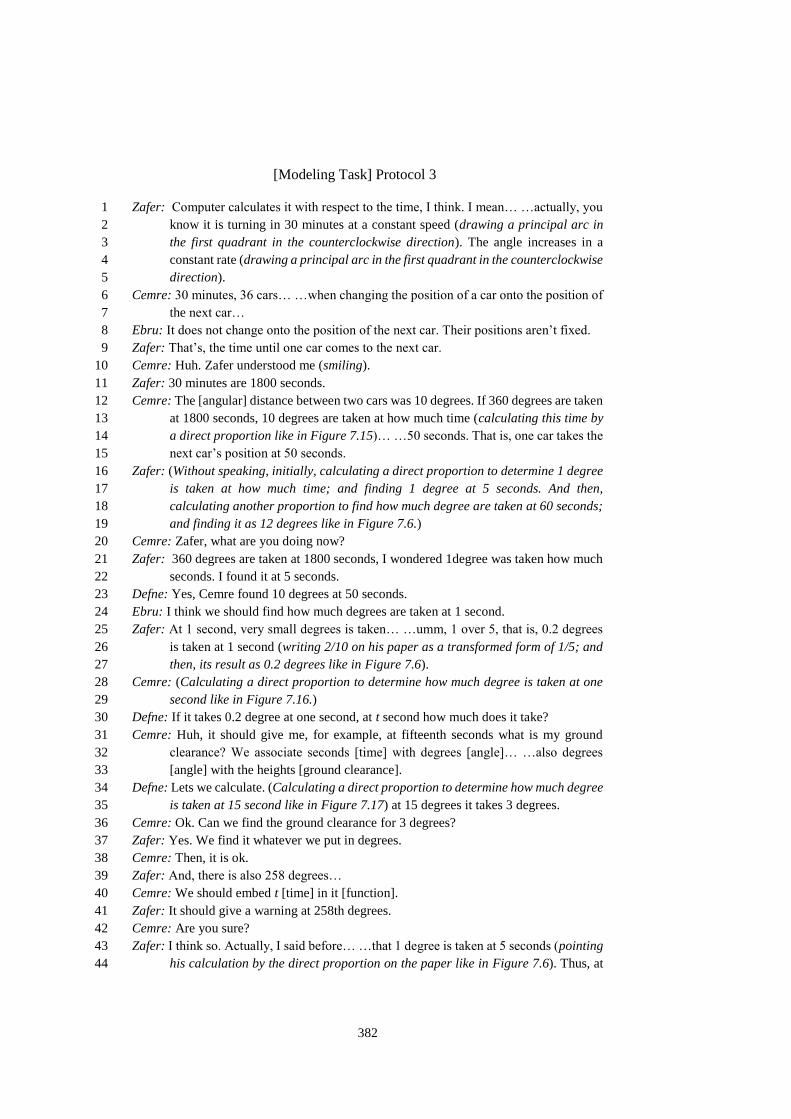
382
[Modeling Task] Protocol 3
Zafer: Computer calculates it with respect to the time, I think. I mean… …actually, you 1
know it is turning in 30 minutes at a constant speed (drawing a principal arc in 2
the first quadrant in the counterclockwise direction). The angle increases in a 3
constant rate (drawing a principal arc in the first quadrant in the counterclockwise 4
direction). 5
Cemre: 30 minutes, 36 cars… …when changing the position of a car onto the position of 6
the next car… 7
Ebru: It does not change onto the position of the next car. Their positions aren’t fixed. 8
Zafer: That’s, the time until one car comes to the next car. 9
Cemre: Huh. Zafer understood me (smiling). 10
Zafer: 30 minutes are 1800 seconds. 11
Cemre: The [angular] distance between two cars was 10 degrees. If 360 degrees are taken 12
at 1800 seconds, 10 degrees are taken at how much time (calculating this time by 13
a direct proportion like in Figure 7.15)… …50 seconds. That is, one car takes the 14
next car’s position at 50 seconds. 15
Zafer: (Without speaking, initially, calculating a direct proportion to determine 1 degree 16
is taken at how much time; and finding 1 degree at 5 seconds. And then, 17
calculating another proportion to find how much degree are taken at 60 seconds; 18
and finding it as 12 degrees like in Figure 7.6.) 19
Cemre: Zafer, what are you doing now? 20
Zafer: 360 degrees are taken at 1800 seconds, I wondered 1degree was taken how much 21
seconds. I found it at 5 seconds. 22
Defne: Yes, Cemre found 10 degrees at 50 seconds. 23
Ebru: I think we should find how much degrees are taken at 1 second. 24
Zafer: At 1 second, very small degrees is taken… …umm, 1 over 5, that is, 0.2 degrees 25
is taken at 1 second (writing 2/10 on his paper as a transformed form of 1/5; and 26
then, its result as 0.2 degrees like in Figure 7.6). 27
Cemre: (Calculating a direct proportion to determine how much degree is taken at one 28
second like in Figure 7.16.) 29
Defne: If it takes 0.2 degree at one second, at t second how much does it take? 30
Cemre: Huh, it should give me, for example, at fifteenth seconds what is my ground 31
clearance? We associate seconds [time] with degrees [angle]… …also degrees 32
[angle] with the heights [ground clearance]. 33
Defne: Lets we calculate. (Calculating a direct proportion to determine how much degree 34
is taken at 15 second like in Figure 7.17) at 15 degrees it takes 3 degrees. 35
Cemre: Ok. Can we find the ground clearance for 3 degrees? 36
Zafer: Yes. We find it whatever we put in degrees. 37
Cemre: Then, it is ok. 38
Zafer: And, there is also 258 degrees… 39
Cemre: We should embed t [time] in it [function]. 40
Zafer: It should give a warning at 258th degrees. 41
Cemre: Are you sure? 42
Zafer: I think so. Actually, I said before… …that 1 degree is taken at 5 seconds (pointing 43
his calculation by the direct proportion on the paper like in Figure 7.6). Thus, at 44
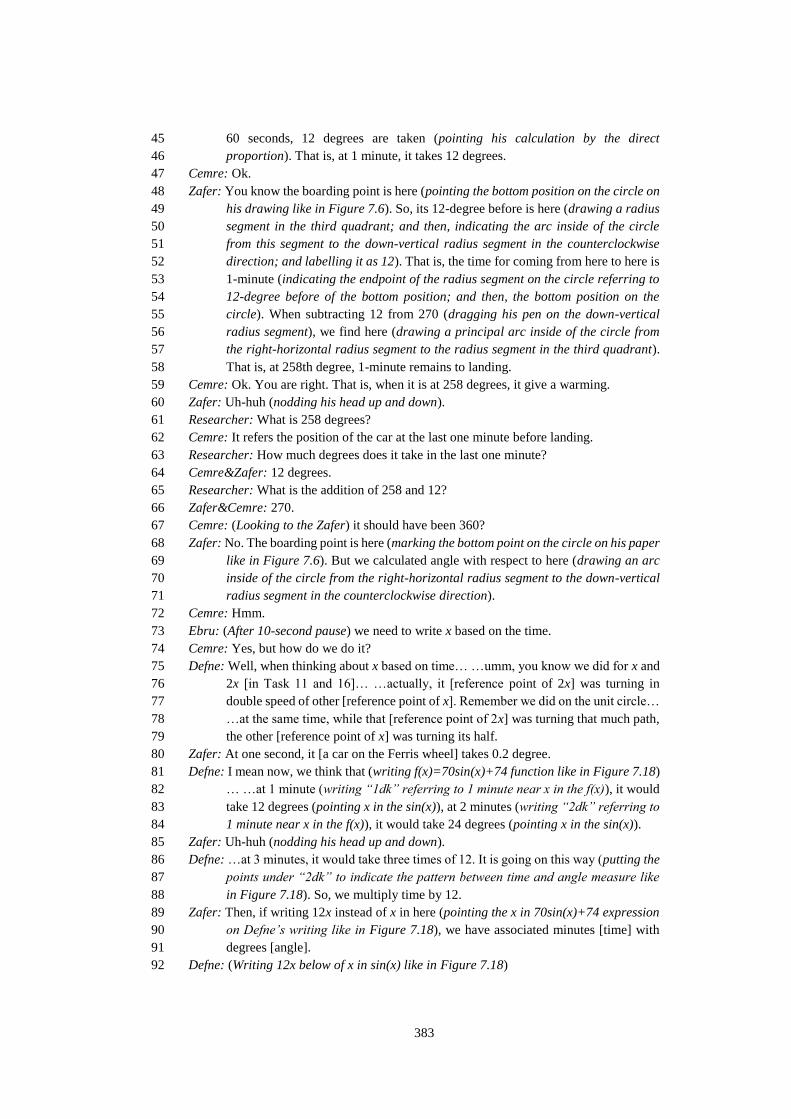
383
60 seconds, 12 degrees are taken (pointing his calculation by the direct 45
proportion). That is, at 1 minute, it takes 12 degrees. 46
Cemre: Ok. 47
Zafer: You know the boarding point is here (pointing the bottom position on the circle on 48
his drawing like in Figure 7.6). So, its 12-degree before is here (drawing a radius 49
segment in the third quadrant; and then, indicating the arc inside of the circle 50
from this segment to the down-vertical radius segment in the counterclockwise 51
direction; and labelling it as 12). That is, the time for coming from here to here is 52
1-minute (indicating the endpoint of the radius segment on the circle referring to 53
12-degree before of the bottom position; and then, the bottom position on the 54
circle). When subtracting 12 from 270 (dragging his pen on the down-vertical 55
radius segment), we find here (drawing a principal arc inside of the circle from 56
the right-horizontal radius segment to the radius segment in the third quadrant). 57
That is, at 258th degree, 1-minute remains to landing. 58
Cemre: Ok. You are right. That is, when it is at 258 degrees, it give a warming. 59
Zafer: Uh-huh (nodding his head up and down). 60
Researcher: What is 258 degrees? 61
Cemre: It refers the position of the car at the last one minute before landing. 62
Researcher: How much degrees does it take in the last one minute? 63
Cemre&Zafer: 12 degrees. 64
Researcher: What is the addition of 258 and 12? 65
Zafer&Cemre: 270. 66
Cemre: (Looking to the Zafer) it should have been 360? 67
Zafer: No. The boarding point is here (marking the bottom point on the circle on his paper 68
like in Figure 7.6). But we calculated angle with respect to here (drawing an arc 69
inside of the circle from the right-horizontal radius segment to the down-vertical 70
radius segment in the counterclockwise direction). 71
Cemre: Hmm. 72
Ebru: (After 10-second pause) we need to write x based on the time. 73
Cemre: Yes, but how do we do it? 74
Defne: Well, when thinking about x based on time… …umm, you know we did for x and 75
2x [in Task 11 and 16]… …actually, it [reference point of 2x] was turning in 76
double speed of other [reference point of x]. Remember we did on the unit circle… 77
…at the same time, while that [reference point of 2x] was turning that much path, 78
the other [reference point of x] was turning its half. 79
Zafer: At one second, it [a car on the Ferris wheel] takes 0.2 degree. 80
Defne: I mean now, we think that (writing f(x)=70sin(x)+74 function like in Figure 7.18) 81
… …at 1 minute (writing “1dk” referring to 1 minute near x in the f(x)), it would 82
take 12 degrees (pointing x in the sin(x)), at 2 minutes (writing “2dk” referring to 83
1 minute near x in the f(x)), it would take 24 degrees (pointing x in the sin(x)). 84
Zafer: Uh-huh (nodding his head up and down). 85
Defne: …at 3 minutes, it would take three times of 12. It is going on this way (putting the 86
points under “2dk” to indicate the pattern between time and angle measure like 87
in Figure 7.18). So, we multiply time by 12. 88
Zafer: Then, if writing 12x instead of x in here (pointing the x in 70sin(x)+74 expression 89
on Defne’s writing like in Figure 7.18), we have associated minutes [time] with 90
degrees [angle]. 91
Defne: (Writing 12x below of x in sin(x) like in Figure 7.18) 92

384
Zafer: Then, it should take in 1 minute… …umm… It will start from here (pointing the 93
bottom position on the circle). We should consider the first 7.5 minutes also. 94
Cemre: We add or subtract the angle of 7.5 minutes, in my opinion. 95
Zafer: Our function starts from here (pointing the far right position on the circle) as if 96
this part is passed over (dragging the quarter arc from the bottom position to the 97
far right position in the counterclockwise direction). Then, we should add 7.5 98
minutes. 99
Defne: If 1 minute refers to 12 degrees, 7.5 minutes refer to 90 degrees (writing a direct 100
proportion to determine the angular path taken at 7.5 minutes like in Figure 7.18). 101
Then we should add 90 to here (pointing the input of sine, and writing 102
f(x)=70sin(x+90)+74 through emphasizing x in f(x) as time and input of sine as 103
angle like in Figure 7.19). 104
Zafer: Yes of course (indicating the quarter arc from the bottom position to the far right 105
position in the counterclockwise direction)! (Writing f(t)=70sin(x+90)+74 on his 106
paper like in Figure 7.6). Now, if we put here 1 minute (circling t in f(t)), here is 107
ok. Where, x in degrees must be 12 (circling x in sin(x+90)). 108
Defne: It [x] should be 12 times of minutes [t]. 109
Cemre: Uh-huh. 110
Zafer: Then, it [input of sine] should be 12x +90. You know we want to have a thing in 111
degrees in here (circling the input of sine on f(t)=70sin(x+90)). I mean for example 112
for 1 minute, there must be in here 12 plus 90. Why? Because we cannot write 12 113
to here (circling t in f(t)), it [t] is the time. 114
Cemre: Ok. We write there [for t] 1. 115
Zafer: For being able to write 1 to here (circling t in f(t)), in order to have 12 in here 116
(circling x in sin(x+90)), we have to write 12x to here (circling x in sin(x+90). 117
You know for 1 it [12x] gives 12. 118
Defne: (Revising her writing as f(x)=70sin(12x+90)+74 like in Figure 7.19) 119
Cemre: Yes, it is ok. 120
Zafer: Let’s we control it for 1 [minute]. 121
Ebru: (Calculating 70sin(12+90)+74 as 142.47) 142.47. 122
Defne: It should have been smaller than 74. 123
Zafer: Why did it so? 124
Defne: Because we add 90. 125
Cemre: It didn’t give us our expected value. 126
Defne: (Crossing out of writing f(x)=70sin(12x+90)+74 like in Figure 7.19) 127
(All of the students were looking to their own papers without speaking during 5 minutes.) 128
Zafer: What about we subtract 90 instead of adding 90. 129
Cemre: Let’s we try through subtracting. (Calculating 70sin(12-90)+74 as 5.53) 5.53. Is 130
it possible for the ground clearance at 1 minute? 131
Zafer: I am not sure. 132
(Another pause was observed in that time.) 133

385
Figure 7.15. Cemre’s direct proportion to determine the time at which one car
replaced on the next car’s position

386
Figure 7.16. Cemre’s direct proportion to determine the turning amount in
degrees at 1 second
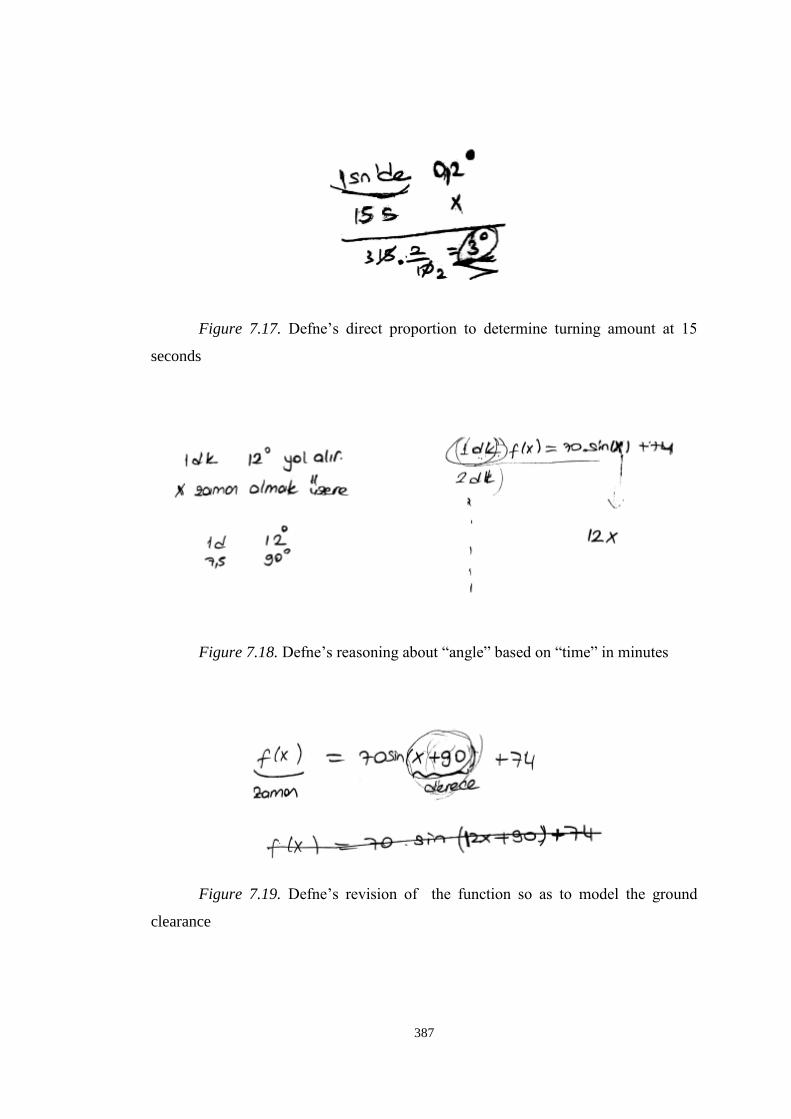
387
Figure 7.17. Defne’s direct proportion to determine turning amount at 15
seconds
Figure 7.18. Defne’s reasoning about “angle” based on “time” in minutes
Figure 7.19. Defne’s revision of the function so as to model the ground
clearance

388
[Modeling Task] Protocol 4
Researcher: (Constructing an origin-centered circle with 7-unit radius; as well as the 1
line segments referring to the ground clearance and the distance to the gotten in 2
the car through considering y= -7 line as the ground like in Figure 7.20. 3
Moreover, she measured the distance of DA line segment by GSP) let’s control 4
your model in case of this circle. 5
Cemre: Well, (opening the calculate menu of GSP and typing 7sin(12-90)+7 through 6
uttering) the radius is 7. It must be seven times sine 12 minus 90… …where I took 7
x as 1 minute… and out of parenthesis plus 7. 8
Defne: …zero point fifteen (uttering the result of 7sin(12-90)+7 by GSP under “degrees” 9
angle measure unit). 10
Zafer: Do this angle 12 degrees (pointing the point A on the circle). 11
Cemre: Firstly, I measure it (measuring <CBA angle) 12
Zafer: Now, bring it to 12 degrees. 13
Cemre: (Dragging the point A so as to obtain 12 degree as the measure of <CBA) now I 14
measure here (pointing the distance from the point A to D Figure 7.20(a)). (When 15
the distance measure of DA segment were appeared as 0.15cm like in Figure 16
7.20(a)) yes. But, let’s we control also for 24. 17
Zafer: Then, it for 2 minutes. 18
Cemre: (Editing 7sin(12-90)+7 as 7sin(24-90)+7; and then, dragging the point A so as 19
to obtain 24 degrees as the measure of <CBA. When the result of her calculation 20
and the distance measure of DA segment were appeared as the same output like 21
in Figure 7.20(b)) yes (laughing). 22
Zafer: True. 23
Defne: Then, our [model] function is true. 24
Cemre: (Laughing) I am very pleased. We do it. That is to say, we should have subtract 25
90 degrees. 26
Researcher: Why? 27
Zafer: I understand it. We start from here for the sine function (pointing the intersection 28
point of the circle with the positive x-axis on the screen like in Figure 7.20(b); and 29
then, dragging his index finger on the circle in the counterclockwise direction). 30
However, we start turning its 90 degrees before (dragging his index finger in the 31
clockwise direction on the quarter arc of the circle in the fourth quadrant). 32
Cemre: Yes. That is, we are going 90 degrees in the negative direction (figuring an arc 33
in the clockwise direction). 34
Ebru: Uh-huh (nodding her head up and down). 35
Defne: …as we mentioned earlier courses… …there were “before arrival”, “after arrival” 36
issues. 37
Zafer: Yes. 38
Cemre: Then, our function is f(x)=70sin(12x-90)+74 (writing f(x)=70sin(12x-90)+74 like 39
in Figure 7.21 and labelling it as “yerden yükseklik” which means the ground 40
clearance). 41
Defne&Ebru: Yes. 42
Zafer: Finally, we did (laughing). 43
Cemre: I am very happy (laughing). 44
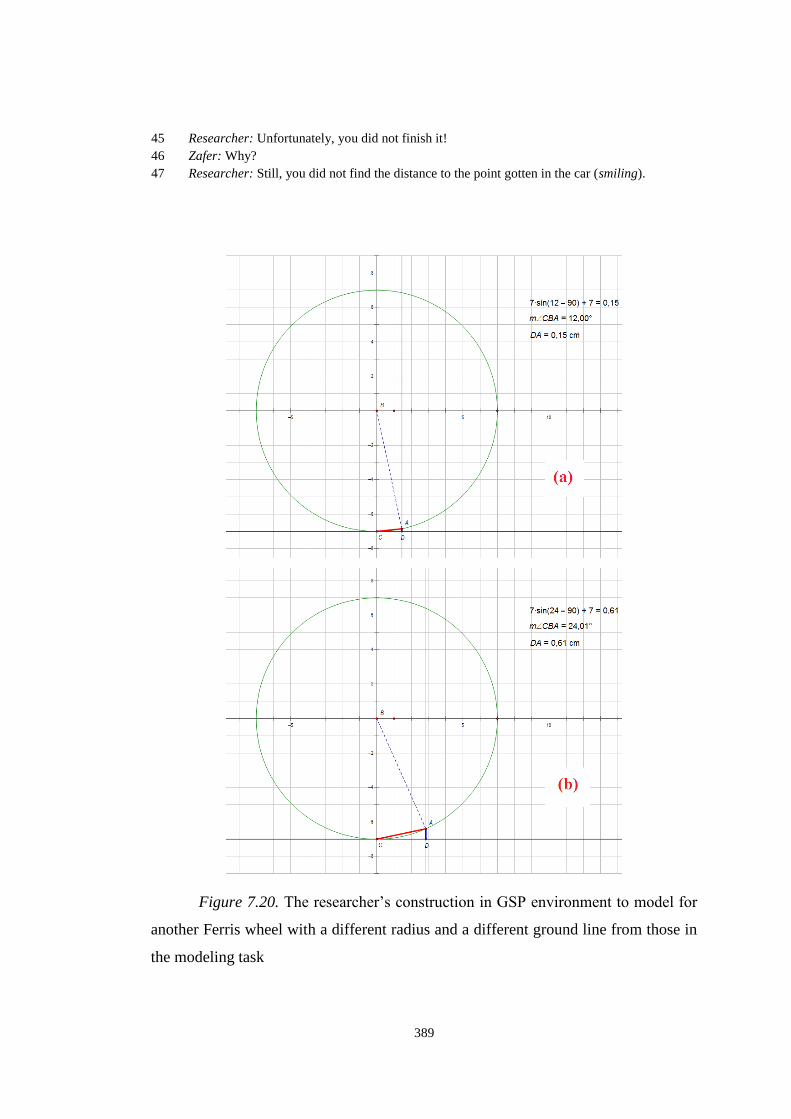
389
Researcher: Unfortunately, you did not finish it! 45
Zafer: Why? 46
Researcher: Still, you did not find the distance to the point gotten in the car (smiling). 47
Figure 7.20. The researcher’s construction in GSP environment to model for
another Ferris wheel with a different radius and a different ground line from those in
the modeling task
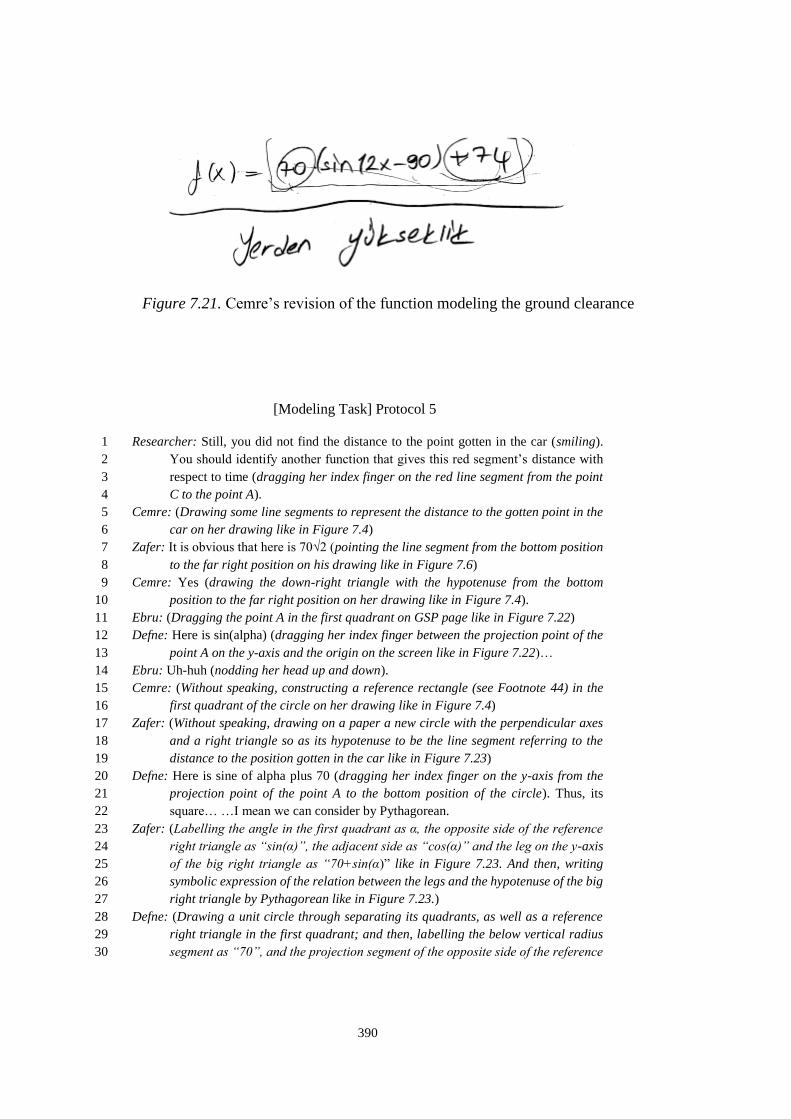
390
Figure 7.21. Cemre’s revision of the function modeling the ground clearance
[Modeling Task] Protocol 5
Researcher: Still, you did not find the distance to the point gotten in the car (smiling). 1
You should identify another function that gives this red segment’s distance with 2
respect to time (dragging her index finger on the red line segment from the point 3
C to the point A). 4
Cemre: (Drawing some line segments to represent the distance to the gotten point in the 5
car on her drawing like in Figure 7.4) 6
Zafer: It is obvious that here is 70√2 (pointing the line segment from the bottom position 7
to the far right position on his drawing like in Figure 7.6) 8
Cemre: Yes (drawing the down-right triangle with the hypotenuse from the bottom 9
position to the far right position on her drawing like in Figure 7.4). 10
Ebru: (Dragging the point A in the first quadrant on GSP page like in Figure 7.22) 11
Defne: Here is sin(alpha) (dragging her index finger between the projection point of the 12
point A on the y-axis and the origin on the screen like in Figure 7.22)… 13
Ebru: Uh-huh (nodding her head up and down). 14
Cemre: (Without speaking, constructing a reference rectangle (see Footnote 44) in the 15
first quadrant of the circle on her drawing like in Figure 7.4) 16
Zafer: (Without speaking, drawing on a paper a new circle with the perpendicular axes 17
and a right triangle so as its hypotenuse to be the line segment referring to the 18
distance to the position gotten in the car like in Figure 7.23) 19
Defne: Here is sine of alpha plus 70 (dragging her index finger on the y-axis from the 20
projection point of the point A to the bottom position of the circle). Thus, its 21
square… …I mean we can consider by Pythagorean. 22
Zafer: (Labelling the angle in the first quadrant as α, the opposite side of the reference 23
right triangle as “sin(α)”, the adjacent side as “cos(α)” and the leg on the y-axis 24
of the big right triangle as “70+sin(α)” like in Figure 7.23. And then, writing 25
symbolic expression of the relation between the legs and the hypotenuse of the big 26
right triangle by Pythagorean like in Figure 7.23.) 27
Defne: (Drawing a unit circle through separating its quadrants, as well as a reference 28
right triangle in the first quadrant; and then, labelling the below vertical radius 29
segment as “70”, and the projection segment of the opposite side of the reference 30

391
right triangle on the y-axis as “sin(α)” on a paper like in Figure 7.24). Here is 31
(pointing the opposite side of the reference right triangle)… 32
Ebru: It is cosine, isn’t it? 33
Defne: Yes, it is cosine of alpha (labelling the adjacent side of the reference right triangle 34
as “cos(α)” like in Figure 7.24). 35
Zafer: That is not (pointing his symbolic expressions on the paper like in Figure 7.23)? 36
Defne: (Writing Zafer’s symbolic expression like in Figure 7.23 on her own drawing like 37
in Figure 7.24) yes, it’s by Pythagorean. 38
Cemre: Can I look (looking to Zafer’s paper like in Figure 7.22). Yes, here is cosine 39
(dragging her index finger on the horizontal side of the big right triangle whose 40
hypotenuse was referring to the distance to the bottom point on Zafer’s drawing 41
like in Figure 7.22), here is 70 plus sine (dragging her index finger on its vertical 42
side), you did it by Pythagorean. Yes. 43
Zafer: Oops! There must be in here 70s (adding coefficient70 for sine and cosine on his 44
symbolic expression; and then, writing it on the next line in a more expanded 45
spacing like in Figure 7.23). 46
Defne: Yes. 47
Ebru: Uh-huh (nodding her head up and down). 48
Cemre: Let’s we control it. 49
(As they did for the function modeling the ground clearance (see lines 1-25 in [Modeling 50
Task] Protocol 4), students controlled their model function for the distance to the 51
position gotten in the car through adopting it in case of the circle in GSP 52
environment with the 7-cm radius whose center was located on the origin, as well 53
as comparing with the measure of the red line segment that was referring to the 54
distance to the bottom point on the circle (see Figure 7.25).) 55
Cemre: (Writing their final symbolizations to model respectively the ground clearance 56
and the distance to the position gotten in the car during the turning by two time-57
dependent functions like in Figure 7.26). 58

392
Figure 7.22. Students’ reasoning efforts on the distance to the position gotten
in the car by a simpler analogy in the first quadrant without loss of generality
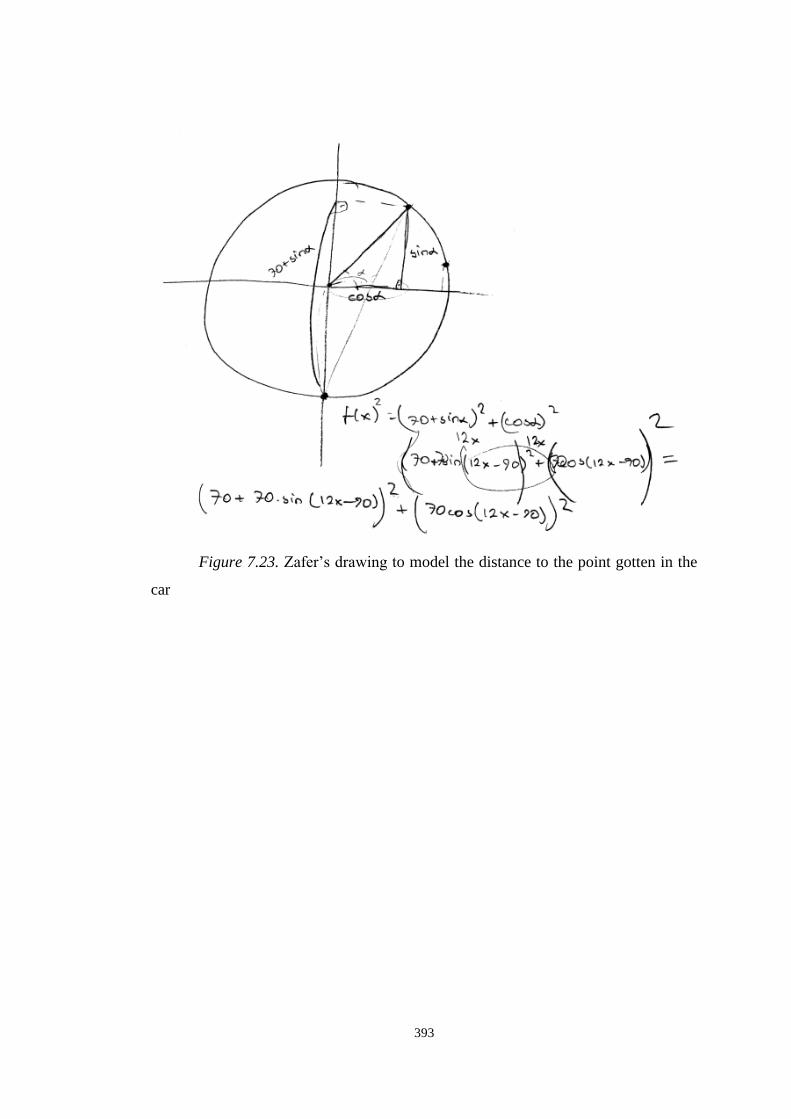
393
Figure 7.23. Zafer’s drawing to model the distance to the point gotten in the
car

394
Figure 7.24. Defne’s drawing to model the distance to the point gotten in the
car
Figure 7.25. Students’ controlling their model function for the distance to the
position gotton in the car through adopting it in case of the circle in GSP environment
with the 7-cm radius whose center was located on the origin

395
Figure 7.26. Final forms of two functions modelling respectively the ground
clearance and the distance to the position gotten in the car with respect to “time” in
minutes
7.2. Summary of Students’ Way of Reasoning in Modeling Task
Throughout the teaching experiment important developments on students’
concept images related to trigonometric functions were observed in GSP environment
(see summary parts in Chapter 4, 5 and 6). As the last episode of the teaching
experiment, a modeling task, Ferris wheel, was used to understand students’ abilities
to transform their progressed-concept images in GSP environment into reasoning in
paper-and-pencil environment. Although students were studied previous tasks
separately as two pairs, throughout this task, all of four students were worked as a
group on a mathematical modeling task with Ferris wheel (Appendix C).
Students started to visualize task context in the (unit) circle register. In this
visualization process, Zafer associated this visualization with the upward translated-
version of the unit circle. Defne dissociated it from unit circle based on the radius of
the Ferris wheel, i.e., 70 meter. Cemre mentioned a circle with 70-meter radius as a
396
unit circle through considering 70-meter as the unit length. Zafer confirmed this
reasoning. Cemre and Zafer were able to reason about any non-unit circle as a unit
circle through considering a new measure unit as the units of another unit as they did
in Task 8 and 13 (see Changed-radius in (unit) circle register heading in Chapter 6).
When the unit circle idea was brought up for discussion, Cemre proposed to
discuss the ground clearance in the first quadrant in the (unit) circle register. When
reasoning in the (unit) circle register, even though radian measure unit had been used
during the teaching experiment, during the modeling task students preferred to use
degree measure unit. When reasoning about the ground clearance of a car on the Ferris
wheel, Zafer was able to reason about the length of the opposite side of the reference
right triangle through considering the same circle either as a unit circle or as a non-
unit circle; respectively, as the sine value and the multiplication of the sine value by
the radius as he did in Task 8 (see Changed-radius in (unit) circle register heading).
Moreover, he was able to reason about a non-unit circle’s changed-location through
extending his reasoning about the unit circle’s changed-location mentioned in Task 9
(see Changed-center in (unit) circle register heading).
When reasoning about the ground clearance of the top position arithmetically
based on the nine 10-degree arcs between 10 cars in the first quadrant and the value of
sin(10ᵒ), Defne considered that the proportional increase of angle measure produced
the proportional increase of vertical distance. Zafer articulated for the sine function
that the proportional increase of inputs did not give proportional increase of outputs
through giving the relation between sin(10ᵒ) and sin(20ᵒ) as an example based on the
curvilinear shape in the graphical register, as well as the circular shape in the (unit)
circle register. The researcher inferred that Defne’s concept image on the rate of
change of the sine values was including a trouble arising from her reasoning about
“change” idea predominantly in the symbolic register as if a constant rate of change
exists between angles and their sine values. In her construction in the (unit) circle
register (Figure 7.2), there were six perpendicular segments with the equal magnitude
that were located at equivalent-angular intervals in the first quadrant. These
perpendicular segments did not represent the increasing amount of the height regarding
397
to the previous one. Despite of this visualization by herself, she considered the sum of
their lengths as the same length with the up-vertical radius segment. This implies that
she did not reason about the relation between these perpendicular line segments in the
first quadrant and the up-vertical radius segment visually in the (unit) circle register.
Instead, she reasoned algebraically about the multiplication of the number of these
perpendicular segments by their magnitude as the radius predominantly in the symbolic
register.
Zafer introduced his initial model of ground clearance as f(x)=70sin(x)+74, and
confirmed the function’s suitability for some case including the negative sine values.
Cemre and Defne approved this function’s suitability. However, Ebru expressed her
dissatisfaction about this function in terms of the meaning of x in f(x); and brought
“turning” up for the discussion. Zafer explained the meaning of x in f(x) as the angle
referring to the principal arc. When reasoning about the changed-angle as a result of
the Ferris wheel’s turning, “time” idea was brought up for the discussion by Zafer.
This provoked students to determine the angular speed of the Ferris wheel. Although
“angular speed” idea was not mentioned explicitly anywhere of the teaching
experiment, as a consequence of Defne’s reasoning about the angular path based on
the speeds of the points as they did in Task 11 and 16 on two points turning
dynamically with different speeds on the unit circle in GSP environment, they were
able to determine the angular speed of the Ferish wheel as 12x (where, x refers to time
in minutes).
When the boarding –bottom– position was mentioned, Zafer expressed that
their model function gave the results after far-right position of the Ferris wheel. They
were able to determine this situation affected their model function’s input variable as
a constant additive term. However, when revising their model function so as to
transform it into the expected function, they missed out the reference position between
the boarding position and the far-right position in terms of which position was
transformed onto the other one. That is, they revised it through adding 90 to the input
of sine. When they tested this function’s suitability by using GSP’s calculate option,
they were aware the error, and revised it through subtracting 90.
398
At that point, the researcher modeled in GSP environment a similar but not
same situation with the modeling Task by a circle with the 7-unit radius whose center
was located on the origin. When they ensured its suitability, Zafer reasoned about the
cause of subtracting 90 [degrees] rather than adding it based on the zero-points (see
Footnote 50) of the sine function and the Ferris wheel. That is to say, he expressed the
position gotten in the car as the 90-degree before of the far right position of the circle
through assuming the counterclockwise direction as the turning direction. All other
students agreed on this reasoning.
When reasoning the distance to the point gotten in the car with respect to time,
they constructed some rectangular structures in the first quadrant on their drawings in
order to specify the legs of this right triangle in terms of sine and cosine. On this
rectangular structures, they were able to reason through exchanging their focuses
between the opposite [adjacent] side of the reference right triangle and its facing-side
in the reference-rectangle (see Footnote 44) in terms of sine [cosine], which emerged
as a result of the teaching experiment in Task 12.
399
CHAPTER 8
8. DISCUSSIONS, IMPLICATIONS AND SUGGESTIONS
This chapter summarizes the four secondary students’ development in
understanding fundamental concepts of trigonometry during the teaching experiment.
Also, this chapter presents some conceptual frameworks that were grounded as a result
of the on-going design process of the instruction of the teaching experiment based on
the prospective and retrospective cognitive analysis of the data. Firstly, cognitive
concept maps on angles, sine [cosine] function and periodicity that were revealed as
foundational for students’ recognition of trigonometric functions are presented to
provide a lens for the reasoning ways of the students’ understanding fundamental
concepts of trigonometry when integrating a new concept and the related current
concepts into students’ cognitive knowledge structure. Secondly, cognitive networks
that were revealed as foundational for visual discrimination of the sine function both
in the (unit) circle register and the graphical register are presented. This chapter also
presents implications and suggestions for curriculum and instruction. Eventually,
limitations of the study and recommendations for future research are presented.
8.1. Students’ Initial Concept Images on Trigonometric Functions
Prior to the teaching experiment, the four students of the study (Cemre, Defne,
Ebru and Zafer) had just completed trigonometry course successfully. Under this
heading, their recognition and discrimination problems on foundational trigonometric
concepts (such as angle, angle measure, trigonometric value, trigonometric functions,
400
and periodicity) as well as potential conflict factors in their concept images are
summarized.
8.1.1. Students’ recognition problems
Cognitive analysis of the initial interviews revealed that the students’ concept
images included a lot of critical troubles on foundational concepts related to
trigonometric functions. Initially, as a consequence of their restricted concept
definition images on functions into the polynomial functions in the symbolic register,
they were unable to recognize trigonometric functions as functions (Weber, 2005). An
additional problem of students’ recognition of trigonometric functions as functions
was their dominated-mental images on functions’ visual representations by the
graphical register. It may be the result of their inability to associate the right triangle
definitions and unit circle definitions of trigonometric functions with functions.
Except Defne, other students’ mental images on angles were static instead of
dynamic turning. However, many of the studies in the literature emphasize the
importance of thinking about angles in terms of rotations (Brown, 2005; Fi, 2003;
Mitchelmore & White, 1996; Moore, 2010) which is critical in comprehension of
trigonometric functions in different representations, as well as using in the different
contexts.
Another trouble of the students was based on the angle concept. Although
students’ concept definition images on angles included an intuitive relation between
openness and measure of an angle, they also included a trouble consistent with the
literature (Thompson, 2008; Moore, 2010) that what was the measured part to
determine an angle’s measure. In spite of the students’ circular constructions inside of
an angle [such as arcs and arc sectors], they did not recognize the meaning of these
circular constructions in terms of angle measure. Nevertheless, they reasoned about
the angle measure intuitively not to vary with respect to variations of radii of these
circular constructions. Thompson (2008; 2011) mentioned the inner arc of an acute
angle of a right triangle only as a pointer in a diagram without associating with angle

401
measure. Thus, the students’ circular constructions were playing a part on their concept
images on angles only as a “pointer”.
Akkoç (2008) and Fi (2006) propose the presence of π in the radian measures
as a source of the students’ difficulty with the radian measure unit due to their
consideration of π as the unit for the radian measure instead of its real value. During
the initial interviews, when reasoning about transformations of π between different
representational registers, the students encountered many troubles based on π as a
consequence of the change of the source register from symbolic to graphical and as a
consequence of the variation on the scaling of the x-axis from numbers regarding π to
the real values. All students’ reasoning on π in the graphical register was constrained
by the trigonometry context. When reasoning about the location of π as the abscissa of
an ordered-pair within the graphical register, Cemre and Defne preferred to transfer
their reasoning on π within the symbolic register in the trigonometry context (i.e., π as
equal to 180) to that out of the trigonometry context. That is, they located π in the
graphical register on 180 on the x-axis. Conversely, Ebru and Zafer preferred to
transfer their reasoning on π within the (unit) circle register and considered
respectively π=-1 and 2π=1 in the graphical register, respectively. That is to say, they
were unable to dissociate two meanings of the intersection points of the unit circle with
the x-axis [i.e., the points (-1,0) and (1,0)] as an abscissa corresponding to these points
within the graphical register and as an angle in radians corresponding to these points
within the unit circle register. This arose from their mental images on angles as points
on the unit circle instead of corresponding arcs. Besides, when trying to convert her
reasoning on π within the (unit) circle register into the graphical register, Defne
considered origin (i.e., zero point on the x-axis) as 2π on the x-axis based on their same
positions when referring to angles in radians within the (unit) circle register. It means
that she was unable to dissociate the meaning of the equivalence between “zero” and
2π in radians from the equality between them within the graphical register, which
arose from her dominated concept image on principal angles despite of her mental
image on angles as dynamic turning. Therefore, the students did not recognize the
same mathematical object, i.e., π, within different representational registers.

402
Consequently, students’ reasoning on π in different
representational registers indicates that “coordinate plane”
became a cognitive conflict factor when the position of π on the
x-axis is considered simultaneously within the graphical
register and the (unit) circle register.
In comprehension of trigonometric functions, there is a need to associate them
properly with the appropriate geometric models (Brown, 2005; Weber, 2005). Two
common geometric representations exist to model trigonometric functions visually:
right triangle representation and unit circle representation. When asked the students
to define sine [cosine], their initial attempts were based on the right triangle context.
They defined sine [cosine] as ratio of opposite [adjacent] side to hypotenuse. However,
none of the students was aware that this ratio for an angle in a right triangle were the
same as that in all similar right triangles. This unawareness arose from their reasoning
about sine and cosine within the right triangle context as calculations instead of ratios
obtained from proportions in the similar right triangles. Thus, the students’ concept
definition images in right triangle trigonometry did not include similarity. Thompson
(2008) stresses similarity –that the similar right triangles have same trigonometric
ratios– as a fundamental starting point to reason about triangle trigonometry. On the
other hand, when trying to define sine [cosine] in the (unit) circle register, although
their constructions included a right triangle in the first quadrant, none of the students
associated this right triangle with the definition of sine[cosine] on the unit circle. That
is to say, they dissociated the definition of sine [cosine] on the unit circle from that on
the right triangle. They defined sine[cosine] on the unit circle by a set of geometric
procedures including drawing an angle in the first quadrant, concretizing its reference
point on the unit circle, drawing a dashed-perpendicular line segment from this point
to the y-axis [x-axis], and concretizing the intersection point of this segment with the
y-axis [x-axis]. Thus, none of the students recognized the relation between right

403
triangle trigonometry and unit circle trigonometry, which is mentioned in the literature
as a root of students’ difficulties in trigonometry (Thompson, 2008).
All recognition problems of the students mentioned above arise from their
problematic concept definition images. Tall and Vinner (1981) assert the weak
understanding of the concept definition as a source of students’ problems in
mathematics. First requirement of the ability to recognize same object represented in
different registers is to know this mathematical object’s definition.
8.1.2. Students’ discrimination problems
Consistent with the prior literature that indicates students’ troubles on making
sense of the radian measure unit apart from the degree measure unit (Akkoç, 2008; Fi,
2003; Topçu, Kertil, Akkoç, Yılmaz & Önder, 2006), none of the students was able to
reason about the meaning of radian apart from degree. That is to say, the meaning of
radian measure was dominated by degree meaning (Akkoç, 2008; Fi, 2003) and
restricted only into transformations between degree and radian measures (Topçu, et
al., 2006) within the symbolic register without any other meaning of the radian
measure. Topçu et al. (2006) characterize the equation 𝐷
180=
𝑅
𝜋 as a possible source of
this understanding. During the initial interviews, the students’ transformations
between degree and radian implied their discrimination problems in the symbolic
register on the meaning of the equal sign. In other words, they did not aware of the
existence a proportional equality with degree and radian notations [such as πR=180ᵒ
and 𝜋
6 R=30ᵒ] rather than a computational equality without degree and radian notations
[such as π=180 and 𝜋
6= 30].
Another discrimination problem was observed on π notation in the symbolic
regsiter. In spite of their reasoning that the same π notation must be refer to the same
object within the symbolic register, all students dissociated π in and out of the
trigonometry context in terms of its real value. In other words, they treated π in the
404
symbolic register as if it had two different real values; i.e., “180” in the trigonometry
context and about 3.14 out of the trigonometry context (Akkoç, 2008).
Therefore, within the symbolic register, “π” had a potential
to become a cognitive conflict factor in and out of the
trigonometry context when considered simultaneously.
During the initial interviews, it was observed that systematic variations of
situations in a representational register caused the students’ discrimination problems.
For example, despite of her definition on sine of an angle in the first quadrant by a set
of geometric procedures, Cemre was unable to reason about sine of angles
corresponding to the axes such as π/2 and 3π/2 in radians. Furthermore, Ebru converted
her definition of sine [cosine] within the (unit) circle register into the symbolic register
as ordinate [abscissa] of a point on the unit circle. Unfortunately, she reasoned an
arbitrary ordered-pair’s ordinate [abscissa] as sine [cosine] when reasoning about the
position on the coordinate plane of the ordered-pair whose ordinate was defined in
terms of cosine. She made an overgeneralization of the ordered-pair definitions of sine
and cosine. It may be due to the students’ consideration of the whole x-axis [y-axis] as
the cosine [sine] axis without awareness of the correlation between the x-axis [y-axis]
and cosine [sine].
Another discrimination problem of the students was based on reasoning about
angles with the same principal measure. Consistent with the literature reporting
students’ inadequate knowledge of coterminal angles (Fi, 2003), the students were
unable to discriminate coterminal angles (i.e., angles with the same principal measure)
in the (unit) circle register. That is to say, they were unable to generate a negative
equivalent meaure from a principal measure. It was due to their reasoning about
negative angles based solely on the memorized-rules without any reasons within the
symbolic register as well as their restricted concept images on angle measures only to
principal measures. However, coterminal angles are the related and necessary
405
knowledge to model periodic phenomena as well as generate angle measures other
than the principal ones (Fi, 2003).
In addition, concept images of the students indicated another discrimination
problem regarding trigonometric functions’ general forms in terms of their ranges and
values especially within the (unit) circle register and the graphical register. That is to
say, they were unable to dissociate, for examples, a sinusoidal graph from the graph of
y=sin(x) within the graphical register, as well as the ordinate [abscissa] of a point on
the non-unit circle from the ordinate [abscissa] of a point on the unit circle in terms of
sine [cosine] within the (unit) circle register. In the light of historical development of
trigonometry (Katz, 2009), discrimination of “what is mathematically relevant, and
what is not mathematically relevant” (Duval, 2006, p. 115) on the unit-circle and a
non-unit circle is an important cognitive ability for strong understanding of the
periodic functions’ trigonometry. Despite of difficulties in reasoning about
trigonometric functions on the non-unit circles (Moore, LaForest, & Kim, 2012), the
ability to use trigonometric functions in any circular context is crucial.
Finally, students’ concept images on the period concept included serious
troubles within the different representational registers as a consequence of their
problematic concept definition images on the periodicity. None of the students was
able to appropriately associate the meaning of the repetition in the graphical register
with the meaning of the period in the symbolic register. That is, when reasoning about
a function based on its sinusoidal graph, despite of their awarenss of its repetition
within the graphical register, none of the students was able to determine its period
truly as a consequence of their confusion about the meaning of the period. For
example, Defne got confused about the period of the function concerning whether the
period of a function with respect to sine (or cosine) could be different from 2π as a
consequence of her transformation of her reasoning about the period of the basic forms
of the sine (or cosine) functions as 2π onto her reasoning about that of their general
forms within the graphical register.
Once more, the students’ weak understanding of the concept definition
emerged as a source of the students’ problems (Tall & Vinner, 1981) in trigonometry

406
that prevented them from discrimination of a mathematical object from the content of
the representation (Duval, 2006).
8.2. Development of Students’ Concept Images on Trigonometric
Functions
Under this heading, the four students’ (Cemre, Defne, Ebru and Zafer)
developments during the teaching experiment are presented in accordance with the
research questions of the study. Initially, developments of students’ recognition that
emerged as a result of the dynamically-linked conversions between representational
registers are presented under three sub-heading based on foundational trigonometric
concepts (i.e., angle and angle measure, trigonometric functions, and periodicity).
And then, developments of students’ discrimination of trigonometric functions that
emerged as a result of the dynamically-changed visual components referring to the
trigonometric functions are presented in the (unit) circle register and the graphical
register.
8.2.1. Students’ recognition of angle and angle measure
When investigating the variation on an angle’s measure (in degrees, radians
and directed degrees preferences) through dynamic manipulations of its openness in
GSP environment, the students conceptualized angles as dynamic turnings [rather than
static structures] and started to well-define angle measure based on its initial side,
terminal side and direction of the rotation [rather than focusing on its interior
openness]. They constructed this conception when dynamically manipulating the
angle’s openness –that was constructed together with a circle centered at its vertex and
its two arcs separated by the angle (see Figure 5.10)– and observing dynamic-and-
linked changes of measures of angle and two arcs (in directed degrees preference) in
GSP environment. Moreover, they interpreted an angle measure given with a positive
407
[negative] measure by GSP as its negative [positive] equivalence. Unlike their prior
concept images on negative angles which was solely based on memorized rules
without any reason, the students had just started to well-define angle measure based
on its initial side, terminal side and direction of the rotation with two measures (i.e.,
with the highest negative and the lowest positive measures) (see Figure 8.1).
When investigating the relations among arc lengths, arc angles, radius and
angle measure (in radians preference) under the manipulation of the openness as well
as the radius of the circle (centered on the vertex of the angle) in GSP environment,
initially none of the students was able to establish any relation between them. When
reasoning about the relation between the changing-measures in a way through
restricting the variation into the cases in which the angle measure was fixed and the
radius was changed by natural numbers, they started to recognize the proportional
covariations of arc length and radius. At that point the researcher encouraged them to
calculate this proportion by GSP, and then, investigate variations and invariations
when manipulating the angle’s openness. Although they determined the simultaneous
variation of the angle measure and the ratio of the arc length to the radius, none of the
students was able to associate this ratio with the angle measure in radians. It was due
to their problematic prior concept definition images on radian measure based only on
transformations in the symbolic register and π notation in the radian measure, as
revealed in the literature (Akkoç, 2008; Fi, 2003; Topçu, et al., 2006). At that point,
the researcher provoked them to consider π in the angle measure by the aid of GSP’s
calculate option. GSP’s calculation defaults on π as about 3.14 prompted students’
reasoning about π notation in an angle measure in radians with its meaning as a real
number. In addition, dynamically-manipulated calculation result of the ratio between
(arc length/radius) and (π) prompted a distinct shift on their reasoning about angle
measure in radians. That is to say, students had just started to associate arc lengths
[when the radius was 1] with the angle measures in radians.
When the angles were constructed in the (unit) circle register, more advanced-
developments were observed in the students’ concept images on angle and angle
measure. As a consequence of their ability to consider angles as dynamic-directed

408
turnings, the students started to identify an angle within the (unit) circle register whose
absolute measure greater than 360 degrees or 2π radians regarding two-step turning in
any directions: (1) principal turning from the initial side to the terminal side and (2)
some full-rounds. Beside, when identifying angle measures corresponding to the
reference points in different quadrants (see Figure 5.15 and Figure 5.16), they
reasoned about the principal turning from the initial side to the terminal side through
considering this turning in two steps regarding the closest coordinate axes: (1) turning
from the initial side to the closest coordinate axis in the same direction as the principal
turning (2) turning from this coordinate axis to the terminal side in the direction so that
the way of turning would be the shorter arc. This reasoning prompted a distinct shift
on their reasoning about an angle in the (unit) circle register. That is to say, they began
to associate an angle within the (unit) circle register with its complementary and/or
supplementary parts in any quadrant, as well as its reference angle. Moreover, they
started to associate a static angle structure in the (unit) circle register with the
infinitely many [negative or positive] equivalent measures in the symbolic register
through considering dynamic directed turnings. Inversely, they were able to associate
the infinitely many equivalent angle measures in the symbolic register with the same
static structure in the (unit) circle register (see Figure 8.2).
Consideration of angle measures together with trigonometric functions
prompted the students to reason about angles in a more detailed way. On the one hand,
they recognized real numbers as angle measures with two different ways through
considering angle measure unit either in degrees or in radians. They constructed this
recognition when reasoning about a sine value that came first to their mind. Initially,
they expressed a sine value of a real number, for example 30, as an angle in “degrees”
that came first to their mind but without stating clearly their “degree” preference as the
angle measure unit. Calculation result of sin(30) by GSP in radians preference that
produced a different output from 1/2 provoked students to reason about a real number
without π notation as an angle measure. When reasoning about an angle’s measure in
radians both with and without π notation, the students recognized a real number
without π notation, for example 30, as an angle measure in radians through
transforming it into the symbolic form with π notation by the aid of GSP’s calculate
409
option, and then, locating the reference point on the unit circle through dragging and
dropping so as to indicate this angle, and comparing the calculation result of sin(30)
with the dynamically-linked sine measure of the angle corresponding to this reference
point. Moreover, during this process, they considered π with its real value, i.e., about
3.14. Unlike their prior conceptions, the students had just started to reason about a real
number as an angle measure with two different ways through considering two angle
measure units, i.e., degrees and radians.
On the other hand, consideration of angle measures together with trigonometric
functions within the dynamic-and-linked visual representations on the same coordinate
plane (i.e., their graphs and (unit) circle representations) promoted the students’
reasoning about angles. They recognized angle measures as real numbers based on
their simultaneous reasoning about the principal arc’s angle in the unit circle register
and its conversion on the x-axis scaled with real numbers in the graphical register. In
special sense, dynamic-and-linked manipulations of the point on the (unit) circle and
its correspondence on the sine [cosine] graph fortified students’ concept images on the
meaning of π, contrary to their initial concept images, through merging its meaning as
an angle measure in radians and as a real number (i.e., approximately 3.14) due to their
association of π-radian angle in the (unit) circle register with its conversion on the x-
axis in the graphical register. Furthermore, on the contrary to the initial interview
results, anymore “coordinate plane” was not a cognitive conflict factor when the
position of π on the x-axis is considered simultaneously within the graphical register
and the (unit) circle register. In addition, the students recognized angles in the
graphical register as a continuous and repeated variable on the x-axis. Their reasoning
based on dynamic-and-linked covariations of the point on the (unit) circle and its
correspondence on the sine [cosine] graph provided them with the ability to convert
the continuously-repeated full-round turnings in the counterclockwise [clockwise]
direction within the (unit) circle register into the continuously-repeated regular
intervals on the x-axis in the positive [negative] direction in the graphical register.
410
8.2.2. Students’ recognition of trigonometric functions
When reasoning on dynamic-and-simultaneous manipulations of the similar
right triangles and their corresponding trigonometric ratios in GSP environment (see
Figure 5.1), contrary to their prior conceptions, all students constructed a new concept
definition image on trigonometric ratios as dependent only on angle measure and
independent from side lengths, which is a fundamental starting point to reason about
triangle trigonometry (Thompson, 2008). In special sense, they constructed a right
triangle conception with 1-unit hypotenuse that included association of its opposite
[adjacent] side regarding an acute angle with sine [cosine] of this angle. This
conception led them to associate the meaning of the opposite [adjacent] side of the
reference right triangle in the unit circle with the corresponding sine [cosine] value. In
other words, they had just merged their unrelated concept images on sine [cosine] in
the right triangle context and the unit circle context (see Figure 8.3).
Consideration of the unit circle together with the reference right triangle that
was constructed as a dynamic structure in GSP environment (see Figure 5.1751)
promoted the students’ reasoning about the measures of the visual structures (such as
principal arc and legs of the reference right triangle) referring to sine [cosine] in the
(unit) circle register. In special sense, the students found a chance to observe three
different measures’ covariation (i.e., length of opposite [adjacent] side of the reference
right triangle, corresponding sine value to the principal angle, and ordinate of the
reference point of the principal arc on the unit circle) under the manipulation of the
reference point of the principal arc. This observation process prompted a distinct shift
on Ebru’s recognition of sine [cosine] in the (unit) circle register. She had just started
to reason about sine [cosine] as the directed-opposite [adjacent] side length of the
reference right triangle in any quadrant of the unit circle. However, the other students
did not rich this kind of reasoning during this task. Therefore, the researcher preferred
in the following task to study on the unit circle integrated with a reference right triangle
51 Until the 8th episode of the teaching experiment, the students studied on pre-constructed GSP pages by the
researcher. When measuring lengths of the reference right triangle’s legs (see Figure 5.17), the researcher
used the unit of the coordinate axes as the measurement unit.

411
whose opposite [adjacent] leg was labeled as sine [cosine] (Figure 5.19), and asked
the students to interpret the value of sine of the principal angle without seeing the
dynamically-linked sine measure on the screen. Up to that time even though all
students were able to interpret sine of an angle as the ordinate of the reference point
both in the (unit) circle register and in the language register, it was interestingly
observed that they were unable to convert their interpretations arithmetically into the
symbolic register. That is, none of the students was aware of the determination of the
sine [cosine] value of an angle in the symbolic register by using the y-axis [x-axis] as
a signed-ruler in the (unit) circle register. Their concept images on the values of sine
in the symbolic register were restricted to the memorized exact values of sine at the
special angles without any reasons. At that point, the researcher provoked students to
estimate the exact value referring to the directed-opposite [adjacent] line segment by
using the coordinate axes as a signed-ruler in the (unit) circle register. Their
estimations were almost same with the sine [cosine] values of the mentioned angles in
any quadrant. When the researcher unveiled sine [cosine] measure on the screen which
was given by GSP as the dynamically-linked measure to the principal angle measure,
all students were surprised and excited. This implies that each student had just been
able to convert the geometric procedures in their concept definition images on sine
[cosine] within the (unit) circle register into the values of sine within the symbolic
register. Unlike their prior concept images, the students recognized sine [cosine] in the
(unit) circle register as same with sine [cosine] in the symbolic register. Furthermore,
as a consequence of dynamic-manipulation of the reference right triangle, they were
able to reason about sine [cosine] of the angles in cases of the absence of the reference
right triangle regarding the position of the reference point on the axes. That is to say,
they constructed a dynamic-conception of the reference right triangle that enabled their
recognition of sine [cosine] in the limit case of the directed-opposite [adjacent] side
(see Figure 8.4).
Dynamic-and-linked visual representations of trigonometric functions on the
same coordinate plane within the (unit) circle register and the graphical register
promoted the students’ ability to convert the dynamic variation of the sine [cosine]
values regarding continuous turnings in the counterclockwise {clockwise} direction
412
in the (unit) circle register into the static representation of the dynamic variation of
the sine [cosine] values by associating them with the appropriate right {left} part of
the sine [cosine] graph. In other words, they were able to convert the meaning of the
sine [cosine] values of the angles with the same static structure but different dynamic
structures in the (unit) circle register into the meaning of the parallel displacement of
the point on the principal part of the sine [cosine] graph along the x-axis by the 2π-
length in the graphical register thereby converting the meaning of full-round turnings
in the counterclockwise [clockwise] direction in the (unit) circle register into the
meaning of the parallel displacement along the x-axis in the positive [negative]
direction in the graphical register. At that point, they started to reason about the sine
[cosine] function on the real number set in the graphical register based on their ability
to transform the principal part of the sine [cosine] graph into the other repeated parts
through the parallel displacement of the principal part. That is to say, all students
reconized the systematic variation of sine [cosine] both in the (unit) circle register and
the graphical register. The students’ reasoning about systematic covariation of
trigonometric functions based on systematic variation of the angle measure in GSP
environment is consistent with Kaput’s (1992) argument that making variation is
needed for understanding of invariance which is the very important aspect of
mathematical thinking.
8.2.3. Students’ recognition of periodicity
In last two episodes of the teaching experiment’s first part, observations of the
systematic covariations of angle measures and corresponding sine [cosine] values
between dynamic-and-linked different representational registers promoted students’
reasoning about (i) the repetition of the sine [cosine] values within the (unit) circle
register as a consequence of full-round turnings of the reference point on the unit circle
and (ii) the repetition of the sine [cosine] values in 2π-length intervals in the graphical
register.

413
In the second part of the teaching experiment, visual features of the different
representations of trigonometric functions were systematically varied to provoke the
students to discuss on a new function “what is mathematically relevant, and what is
not mathematically relevant” (Duval, 2006, p. 115) when compared with
trigonometric functions’ basic forms. Period was an important discussion focus of each
episode in this part of the teaching experiment.
Initially, when definition of sine on the origin-centered unit circle was
transformed into a new definition on the origin-centered non-unit circle with the
same visual objects (a reference point on the circle referring to an arc and a
perpendicular line-segment to the x-axis), two reference points’ simultaneous
movements at the same (angular) speed on the unit-circle and the non-unit circle in the
GSP environment supported the students’ recognition of the new function’s period52
–defined on the non-unit circle– as the same period with the basic form of sine –i.e.,
2π.
Next, definition of sine on the origin-centered unit circle was transformed
into a new definition on the unit circle with different-center from the origin with the
same visual objects (i.e., a reference point on the circle referring to an arc and a
perpendicular line-segment to the x-axis). As a consequence of existence of only one
point referring to the full-round turning in the (unit) circle register, as well as the
unique shape (see Footnote 47) of their graphs indicating their one full-actions in the
same interval in the graphical register, the students were able to reason truly about the
new function defined on the unit circle with different-center from the origin with
the same period as the basic form of sine –i.e., 2π.
Systematic variations of visual features of the representations continued the
transformation of the definition of sine by only one reference point on the unit circle
into a new definition based on two different reference points on the unit circle. These
two points were constructed on the unit circle so that one of them was an arbitrary
52 From 5th episode forward throughout the teaching experiment, the period term was used in the meaning of
the prime period (see Regarding periodicity as pattern based on behaviors of trigonometric functions
heading in Chapter 5).

414
point and the other was its rotated-position about the origin by a fixed-measure. These
two points were moving in the same (angular) speed on the unit circle under the
manipulation of them in GSP environment. Thus, students were able to reason about
the new function defined by two points with the same (angular) speed in the (unit)
circle register with the same period as the basic form of sine –i.e., 2π– based on their
full-round turnings, as well as based on the unique shape of their graphs (see Footnote
47) indicating their one full-actions in the horizontally-translated-intervals in the
graphical register.
Finally, definition of sine by only one reference point on the unit circle was
transformed into a new definition based on two different reference points on the unit
circle with the different (angular) speeds in GSP environment. One of these points
was constructed on the unit circle in GSP environment as an arbitrary point and the
other as its rotated-position by a measure dependent on the principal measure of the
first point so as to be its integer multiples. These two points were moving at different
(angular) speeds in GSP environment. Dynamically-linked conversion of the new
function (mapping from the angle of the arbitrary point to the ordinate of its rotated
position) from the (unit) circle register into the graphical register together with the
sine graph caused for students to bring the period aspect up for discussion.
On the one hand, Cemre and Zafer interpreted the new function’s period
through attributing its meaning to (i) the turning amount of the arbitrary point
(referring to the input of the new function) so as to bring forth one full-round turning
of the other (referring to the output of the new function) in the (unit) circle register
and (ii) the interval in which the new function completed one-full-action in the
graphical register as a consequence of one-full-round turning of the reference point
referring to the output.
On the other hand, Defne and Ebru encountered a trouble based on the full-
round turnings of two points referring to (i) the input variable and (ii) the output
variable. Emergence of Defne’s and Ebru’s this trouble on periodicity is consistent
with Duval’s (2006) argument that conversion troubles (or cognitive distances
between registers) are observed only when tasks –in which a representation within a
415
source register is systematically varied into its converted representation in the target
register– are given to students. They did not recognize the meaning of full-round
turnings in terms of periodicity. While Defne interpreted, for example, the period of
y=sin(2x) as 4π considering two full-rounds of the point P' that was produced by one
full-round of the point P, Ebru interpreted the period as 2π considering one full-round
turning of only the point P' (see Figure 6.40(a)). In other words, they interpreted the
period in the (unit) circle register based on the full-round turning of the reference point
of the output variable rather than the turning of the reference point of the input variable
producing the full-round of the reference point of the output variable. Therefore, the
researcher encouraged them to reason about the full-round-turnings of the point P'
dependently on the turning of the point P. Where, they were able to attribute one-full-
round turning of the point P' to the π-radian turning of the point P in the (unit) circle
register. When similar discussion were done on another function, i.e., y=sin(3x), based
on its dynamic-and-linked representation within and between the (unit) circle register
and the graphical register, they were able to reason about the full-round turning of the
reference point of the output variable dependently on the turning of the reference point
of the input variable. This finding supports Kaput’s (1992) argument that making
variation is needed for understanding of invariance which is the very important aspect
of mathematical thinking.When the researcher asked them to reason about their periods
through emphasizing its meaning as the smallest-repeated-interval in the graphical
register and the length of this interval in the symbolic register, they were able to reason
about these functions’ periods correctly through using the scaled x-axis of GSP as a
measuring tool to determine the length of these intervals (see Figure 8.5).
When all discussions on sine mentioned above were done on cosine in the
following episodes of the teaching experiment, they were able to reason in the same
way about the period of the new function –that was formed through systematically
varied-visual features of the different representations of the cosine function.

416
8.2.4. Students’ discrimination of trigonometric functions in (unit) circle
register
As mentioned in the previous heading (i.e., Students’ recognition of
periodicity), visual features of the different representations of sine [cosine] were
systematically varied during the second part of the teaching experiment to provoke the
students to discuss on a new function “what is mathematically relevant, and what is
not mathematically relevant” (Duval, 2006, p. 115) when compared with its basic
form.
From the 8th episode forward, in each task transformations of the circular
representation into the graphical representation were investigated in GSP environment
in order to support as well as understand the students’ ability to distinguish the
represented mathematical object (i.e., sine and cosine functions) from the
representational register’s content (Duval, 2006).
Initial visual feature of the systematic variation was the radius of the circle.
When the unit circle was changed into a non-unit circle, the students developed
significant understandings referring to trigonometric functions. To begin with, they
constructed “unit” meaning that enabled them to consider a unit circle as a non-unit
circle. They constructed this meaning when measuring the changed-radius by GSP as
a consequence of their troubles arising from the difference between the distance-
measure-unit preference of GSP as centimeter and the visual distance-measure-unit of
the coordinate axes. They had just considered the same circular structure in GSP
environment as both a unit circle and non-unit circle through reasoning about it (i) as
a unit circle according to the unit of the scaled-coordinate axes and (ii) as a non-unit
circle according to the centimeter distance measure unit. Reversely, in the modeling
task, Cemre and Zafer considered a non-unit circle as a unit circle through identifying
its radius as unit. This consideration promoted their reasoning about general forms of
trigonometric functions in the (unit) circle register. For example, in the modeling task,
they considered initially the Ferris wheel with 70-meter radius as a unit circle and
associated the vertical (directed) distance to the horizontal axis from its center with the
sine value of the corresponding angle. And then, they dissociated this vertical
417
(directed) distance from sine (or, associated this vertical distance with 70.sin(x))
through considering the Ferris wheel as a non-unit circle with 70-meter radius. Thus,
they were able to discriminate sine represented in the (unit) circle register from the
(unit) circle register’s content. This finding supports Moore, LaForest, and Kim’s
(2012) conclusion that provoking students to consider units with different measures
promoted their unit circle understandings from their restricted understanding of the
unit circle notion with “one” radius to any given circle through considering its radius
as “one” unit. On the other hand, through taking GSP’s “measure”, “calculate” and
“drag-drop” advantages, Defne and Ebru also discriminated the opposite side of the
reference right triangle on the non-unit circle from that on the unit circle, as well as
associated the (directed) length of the opposite side of the reference right triangle on
the non-unit circle with the multiplication of sin(x) with the radius of the non-unit
circle in the symbolic register. This reasoning generated a new conception that enabled
the students to reason about a general sine function in the form y=a.sin(x) in the (unit)
circle register but for only positive coefficients through associating the coefficient a
with the changed-radius.
Next visual feature of the systematic variation was the center of the unit circle.
When the location of the center of the unit circle was changed from the origin to any
other position on the coordinate plane, Cemre and Zafer showed more advanced
developments on the level of ability to reason about the basic properties of the unit
circle representation than Defne and Ebru. In general sense, each of the students
determined that the new function –from the angle measure to the corresponding
ordinate on the unit circle with different center from the origin– was expressed as an
additive operation in the symbolic register between sine and directed-distance of the
manipulable center to the x-axis. Moreover, based on the dynamic manipulations of
the center, they determined this additive expression’s independence from the
horizontal variation and dependence only the vertical variation. However, in special
sense, their reasoning processes indicated their different stages in terms of these
conceptions. On the one hand, Defne’s and Ebru’s focuses were predominantly on the
processes related to the y-components in the (unit) circle register based on the
determination of the ordinates. On the other hand, Cemre’s and Zafer’s focuses were
418
predominantly on the condensed-whole of the processes instead of their details. That
is to say, they focused direcly on the dissociation and association of this manipulated-
function from sine in the (unit) circle register instead of operational-processes. For
example, Zafer mentioned the horizontal axis from the center as the x-axis considering
the x-axis as if a reified-object without going into details but with awareness of its
different location. Cemre mentioned the unit circle whose center located on the origin
as if a reified-object; and was able to change its position up-down and left-right in her
mind as a whole on the coordinate system. Even though Cemre and Zafer reasoned
based on the visual objects’ basic properties and their significance for sine function,
Defne and Ebru reasoned based on the details of the processes. During this
mathematical activity, Cemre and Zafer performed at higher reasoning stage (i.e.,
condensation/reification) than Defne and Ebru (i.e., interiorization) considering
Sfard’s (1991) hierarchical stages of the concept development. This level of reasoning
promoted in the modeling task that Cemre and Zafer’s transformation abilities of the
basic properties within and between the (unit) circle register and the symbolic register,
which is consistent with Duval’s (2006) argumentation that transforming one semiotic
representation to another one is to be only at the level of grasping the basic properties
of semiotic representations and their significance for mathematics.
Final visual feature of the systematic variation was the reference point referring
to trigonometric value. That is to say, the only one reference point on the unit circle
referring to both angle and corresponding trigonometric value was varied from only
one point to two points so as one of them to refer the input and the other to refer the
output of the function. As a consequence of this variation, the students’ discrimination
problems were observed regarding the meaning of the reference points in the (unit)
circle register. Except Zafer, none of the other students associated the new function –
from the angle measure indicated by one point into the ordinate of the other point on
the unit circle– with the sine function until the construction of its graphical
representation. Although Zafer associated this function with sine based on its visual
definition on the unit circle, he was also unable to reason about this function in terms
of sine in the symbolic register. Only when the researcher provoked them to identify
this function in terms of sine in the symbolic register through (i) considering the

419
reference point referring to the sine value as well as (ii) defining its angle dependent
on the other reference point’s angle, the students started to be able to express this new
function symbolically in terms of the sine function through revising the input variable
of the basic form of the sine function. This conception prompted a distinct shift on
their reasoning about the relation between sine and cosine in the (unit) circle register.
For example, unlike their prior concept images on transformations between sine and
cosine that were based only on the memorized-rules in the symbolic register, they
started to be able to convert the relation between the directed-measures of the adjacent
[opposite] side of the reference right triangle and the opposite [adjacent] side of its
rotated-counterpart by π/2 radian about the center in the (unit) circle register into the
equality between cos(x) [sin(x)] and sin(x+π/2) [-cos(x+π/2)] in the symbolic register.
Moreover, they were able to extend this ability onto the structures obtained through
rotations by the integer multiples of π/2 radian in any directions. Therefore, in special
sense, they made sense of the negative coefficient of –sine [–cosine] function in the
(unit) circle register through considering it as a function from the x angle to the
perpendicular line segment from the point corresponding to the (x±π) angle to the x-
axis [y-axis]. Their ability to transform sine [cosine] into cosine [sine] in the (unit)
circle register made easier their reasoning about cosine in the following episodes of
the teaching experiment due to their conceptions on sine mentioned above.
8.2.5. Students’ discrimination of trigonometric functions in graphical
register
Integration of the graphical representations in episodes of the teaching
experiment fortified students’ understanding of trigonometric functions in each
representational registers. Initially, visual representations of sine [cosine] on the same
coordinate plane both in the (unit) circle register and the graphical register provided
the students with the opportunity to compare and contrast the dynamic-and-linked
variations of the reference point on the (unit) circle and its converted form in the
graphical register. This opportunity supported the students’ discrimination of the
420
coordinates of a point in the (unit) circle register and the graphical register. In other
words, unlike many trigonometry students’ troubles on the role of axes in a sine graph
(Brown, 2005), they constructed an ordered-pair conception so that it enabled them to
distinguish the meaning of the abscissa [ordinate] of a point on the (unit) circle from
the meaning of the abscissa [ordinate] of a point on the corresponding graph.
Moreover, this opportunity supported the students’ discrimination of the meaning of
the positive [negative] direction in the (unit) circle register and the graphical register
in terms of both angle measures and trigonometric measures. Furthermore, this
opportunity supported the students’ discrimination of the coterminal angles
represented by the same static structure but different dynamic structures in the (unit)
circle register and by the equivalent but not equal measures in the symbolic register.
That is to say, visual representations’ of the coterminal angles in the graphical register
provided the students with the ability to differentiate visually the equivalent but not
equal angles’ positions on the x-axis in the graphical register. This kind of reasoning
about the coterminal angles is the related and necessary knowledge to understand
periodicity (Fi, 2003).
As mentioned in the previous heading (i.e., Students’ discrimination of
trigonometric functions in (unit) circle register), visual features of the different
representations of sine [cosine] in the (unit) circle register were systematically varied,
we obtained the opportunities to discuss these visual features dynamically-linked
oppositions in the graphical register as well.
Initially, when the radius of the circle was changed, this visual feature’s
dynamic-and-linked opposition was constructed in the graphical register based on the
new function (defined in the same way with sine but on the non-unit circle) via taking
plot as (x,y), trace point and animate point advantages of GSP. When the changed-
magnitude of the graph appeared on the screen as a result of dynamic manipulation of
the point on the non-unit circle, all of the students were able to distinguish the traced-
graph from the sine graph regarding their magnitudes in the graphical register.
Moreover, through focusing on the proportional relation between their magnitudes,
they were able to convert the new function represented by its traced-graph into its

421
symbolic expression, e.g., as 6sin(x). Duval (2006) argues this ability as a deep
cognitive condition to be “able to discern how two graphs that seem visually alike are
mathematically different” (p. 124). However, initially, only Cemre attributed the
changed-magnitude in the graphical register directly to the changed-radius in the
(unit) circle register. As a consequence of seeing the systematic covariations between
the radius and magnitude, all of the students were able to reason about relations among
“changed-radius” in the (unit) circle register, “changed-magnitude” in the graphical
register and “changed-coefficient r of the r.sine function” in the symbolic register.
Coherent understanding and flexible use of trigonometric functions in different
representations are difficult for most students (Brown, 2005). This important ability
were constructed by the students as a result of their seeing for understanding of
invariance in dynamic-and-linked different representations when making variation,
which is consistent with Kaput’s (1992) idea that emphasizes this kind of activity as a
very important aspect of mathematical thinking.
Next, when the location of the center of the unit circle was changed on the
coordinate plane, this visual feature’s dynamic-and-linked opposition was constructed
in the graphical register based on the new function –from the angle measure to the
corresponding ordinate on the unit circle with different center from the origin. When
the traced-graph appeared on the screen as a result of dynamic manipulation of the
point on the unit circle, the students were able to associate this function with the sine
[cosine] function in the graphical register based on its visual-shape, as well as reason
about it as the parallel-displacement of the sine graph along the y-axis in the
positive/negative direction. Moreover, they converted this represented function in the
graphical register into the symbolic register considering the (directed) displacement
amount as the constant of the sine function.
And then, when the reference point referring to the sine value was changed
from the reference point referring to the input, this visual feature’s dynamic-and-linked
opposition was constructed in the graphical register based on a new function that was
defined on the unit circle but based on two points so as one of them to refer to the input
and the other to the output.

422
On the one hand, in 10th episode, these two points were constructed on the unit
circle so that one of them was an arbitrary point on the unit circle and the other was its
rotated version about the origin by a fixed-measure. When comparing and contrasting
the sine graph with the new function’s graph, except Defne, all other students
considered these two graphs as visually alike. However, they had difficulty in
recognition “how two graphs that seem visually alike are mathematically different”
(Duval, 2006, p. 124). In other words, they encountered a trouble when trying to reason
about the new function in terms of sine as a consequence of their conjecture about
conversion of the parallel-displacement along the x-axis in the graphical register into
the transformation of sine to the new function in the symbolic register. This conjecture
was the conversion of the positive [negative] direction of the parallel displacement
along the x-axis in the graphical register into the positive [negative] sign of the
constant affecting the input variable in the symbolic register. This wrong-conjecture
caused Cemre’s and Zafer’s confusion about the location of the graph, for example,
y=sin(x+2.3) on the left, with respect to the sine graph on the coordinate system.
However, this conjecture did not cause any confusion for Ebru as a consequence of
her incoherent-assumptions on the source-function of the transformation in the
graphical register and the symbolic register. Differently from others, Defne reasoned
about these two graphs through comparing their slopes with each other but focusing
only on their restricted parts from their y-intercepts up to their first intersection points.
That is to say, none of them were able to make sense of the parallel-displacement along
the x-axis idea during this episode. Even though this task was also including the unit
circle representation, as a consequence of the students’ difficulties in reasoning about
the new function (from the angle measure indicated by one point into the ordinate of
the other point on the unit circle) in terms of sine in the (unit) circle register (see the
previous heading), the researcher preferred to postpone detailed-discussions on the
meaning of the parallel-displacement of the graphs along the x-axis in the (unit) circle
register. Therefore, this problem was discussed in the episode on the relation between
sine and cosine (i.e., 12th episode) as well as in the corresponding episode on the
cosine function with same visual features (i.e., 15th episode) to make sense of the
graphs’ parallel-displacement along the x-axis in the (unit) circle register. From 12th

423
episode forward, their ability to make sense of the symbolic expressions in the form
of sin(x+c) and cos(x+c) in the (unit) circle register caused their interpretations about
the positive [negative] constant “c” as the c-unit length before arrival [after arrival] in
a value in the graphical register as a consequence of the c-radian rotation in the
counterclockwise [clockwise] direction in the (unit) circle register. It was the point
that the students had just constructed an ability to make sense of the parallel-
displacement of the graphs along the x-axis only when they considered its meaning
together with their conversions in the (unit) circle register. This finding supports
Duval’s (2006) recommendation that “in order to make students notice the basic visual
features oppositions that are mathematically relevant and cognitively significant, any
representation discrimination task has to be integrated into a conversion task” (p. 125).
On the other hand, in 11th episode, two points were constructed on the unit
circle so that one of them was an arbitrary point on the unit circle and the other was its
rotated version about the origin by a marked-angle (i.e., an integer multiple of the
principal measure of the angle indicated by the initial point). It was the first episode
that the students had to reason about a new function defined in the same way with sine
but based on two reference points in the (unit) circle register that were moving in the
different , but dependent, (angular) speeds on the unit circle under the manipulation of
them in GSP environment. When the traced-graph of the new function (from the angle
of the arbitrary point to the ordinate of its rotated position) appeared together with that
of sine, the students compared them based on their one-full-actions in the graphical
register that were formed as a consequence of one-full-round turnings of their
reference points referring to their outputs in the (unit) circle register. They interpreted
the new function’s graph as the compressed [stretched] form of the sine graph through
attributing the meaning of the compressed [stretched] wave in the graphical register
to the faster [slower] turning of its reference output point than the reference output
point of sine in the (unit) circle register. Moreover, they were able to express this
function in the symbolic register in the form y=sin(bx) considering the compression
[stretch] ratio in the graphical register as well as ratio between the reference output
points’ turnings at the same time in the (unit) circle register.

424
To sum up, until the end of 12th episode of the teaching experiment, the
students constructed some cognitive networks that enabled them to discriminate the
visual feature oppositions of (i) “changed-magnitude”, (ii) “parallel-displacement”
along the y-axis, (iii) “parallel-displacement” along the x-axis, and (iv)
“compressed/stretched” of graphs. Duval’s (2006) cognitive analysis emphasizes the
visual discrimination of graphs (i) as nothing obvious especially when their forms and
contents are seemed very similar, and (ii) that requires the construction of cognitive
networks so that visual feature oppositions are merged as if only one. Therefore, at the
end of 12th episode, composed-coefficient’s visual oppositions were handled so as to
observe as well as support the students’ mergense of these cognitive networks. For this
purpose, a general form of sine function, i.e., y=3sin(2x+4)-1, was considered as an
initial example. When reasoning about the variation of y=sin(x) function’s graph up to
y=3sin(2x+4)-1 function’s graph through incorporating a new function into the
discussion; respectively, y=3sin(x), y=3sin(x)-1, y=3sin(2x)-1 in GSP environment, it
was observed that all of the students encountered a major trouble on reasoning about
the composed-visual-opposition of the coefficients “2” and “4” in the graphical
register. Although until the last step of this reasoning process, they had no conflict
between the variation of the graphs produced by GSP and their expectations about
them in the graphical register, they encountered the major trouble on the visual
variation between the graphs of y=3sin(2x)-1 and y=3sin(2x+4)-1 in terms of the
displacement amount between their graphs. When the constant and coefficient of the
input of sine was systematically changed, they started to reason about the displacement
amount by an operational-process as the division of the constant by the coefficient of
x based on their determinations of the displacement amount between two graphs by
the aid of GSP’s “zoom in” and “zoom out” options for the scaled x-axis. In addition
to the graphical register, they interpreted the cause of the changed-displacement
amount (Footnote 48) in the (unit) circle register as well. They converted the constant
“c” of the input of sine in the symbolic register into a c-radian fixed-arc in the (unit)
circle register; and then, interpreted this fixed-arc by means of two different, but
dependent, (angular) speeds referring to x and bx. That is to say, they attributed the
displacement amount along the x-axis in the graphical register to the (c/b)-radian
425
turning of the reference point of (x) that produced the c-radian arc as the path of the
reference point of (bx) so as to indicate (bx+c) in the (unit) circle register. It means
that students reasoned about the c-radian arc between the reference-points of (bx) and
(bx+c) in a dynamic-turning-structure through considering the turning-amount of (bx)
dependently on the turning amount of (x). The researcher inferred that students’ this
reasoning arose from their effort to determine how much turning of (x) caused the c-
radian “before arrival/after arrival” on a specific point between the reference points of
(bx) and (bx+c) in the (unit) circle register.
8.3. Conceptual Frameworks of Trigonometry
Under this heading, some conceptual frameworks are presented that were
grounded as a result of the on-going design process of the instruction of the teaching
experiment based on the prospective and retrospective cognitive analysis of the data.
Firstly, cognitive concept maps on angles, sine [cosine] function and periodicity that
were revealed as foundational for students’ recognition of trigonometric functions are
presented to provide a lens for the reasoning ways of the students’ understanding
fundamental concepts of trigonometry when integrating a new concept and the related
current concepts into students’ cognitive knowledge structure. Secondly, cognitive
networks that were revealed as foundational for visual discrimination of the sine
function both in the (unit) circle register and the graphical register are presented.
8.3.1. Cognitive concept maps
Cognitive concept map on angles (Figure 8.1).
Development in the students’ concept definition images on angles and angle
measures revealed that angle and angle measure are two different concepts that is
needed to be dissociated from each other (Argün, Arıkan, Bulut, & Halıcıoğlu, 2014).
An angle is constructed by two rays with common initial point. An angle is defined by

426
its openness which means angle measure. However, for an angle, two different
openness; i.e., interior openness and exterior openness, can be considered. Without
specifying its initial side, terminal side and direction, a static angle structure produces
four different angle measures. Therefore, the well-defined angle measure requires to
specify its intial side, terminal side and direction. When angle measure units are
considered, for example, degree and radian, a static angle structure produces eight
different angle measures. Therefore, conception of angle measure is cognitively
complex process unless students construct well-defined concept definition images on
angle as summarized in Figure 8.1.
Cognitive concept map on angles in the (unit) circle register (Figure 8.2).
When the circular representations of trigonometric functions was brought up for
discussion in the teaching experiment, development in the students’ concept definition
images on angles and angle measures revealed a more complex process of angle and
angle measure conception. The positive horizontal axis and a ray from the center
constitude an angle in the (unit) circle register. However, its unique static structure
indicates infinite equivalent dynamic structures through considering dynamic-
directed-turnings from the positive horizontal axis to the terminal side in the (unit)
circle register. These dynamic-directed-turnings can be considered a combination of
(1) principal turning from the initial side (i.e., positive horizontal axis) to the terminal
side and (2) some full-rounds in any direction. Full-round turnings are critical in
comprehension of the meaning of coterminal angles that are the related and necessary
knowledge to understand periodicity, as well as to generate angle measures other than
the principal ones (Fi, 2003). Furthermore, a principal turning can be considered as a
piecewise principal turning in two steps regarding the closest coordinate axes: (1)
turning from the initial side to the closest (coordinate) axis in the same direction as the
principal turning, and (2) turning from this (coordinate) axis to the terminal side in the
direction so that the way of turning would be the shorter arc. Piecewise principal
turnings are critical in comprehension of the connection between a principal angle and
its reference angle. Therefore, conception of angle and angle measure in the (unit)
427
circle register is cognitively complex process unless students construct well-defined
concept definition images on angles as summarized in Figure 8.2.
Cognitive concept map on sine [cosine] (Figure 8.3).
Tall and Vinner (1981) assert the weak understanding of the concept definition
as a source of the students’ problems in mathematics. Thompson (2008) mentiones the
right triangle trigonometry and the periodic functions’ trigonometry as two unrelated
trigonometries of elementary and secondary school mathematics. Therefore, well-
structured concept definition images (Tall & Vinner, 1981) are critical in coherent
understanding and flexible use of trigonometric functions in different representations
(Brown, 2005; Thompson, 2008). The findings that emerged from this study support
Thompson’s (2008) suggestion that stresses similarity –that the similar right triangles
have same trigonometric ratios– as a fundamental starting point to reason about
triangle trigonometry. Indeed, it is important to start discussions on sine [cosine] on
the similar right triangles. Similar right triangles have proportional sides regarding
their corresponding interior angles. These proportional sides produce the same sine
[cosine] ratio for an acute angle in all similar right triangles. A sine [cosine] ratio is
dependent only on an acute angle and independent from side lengths. Specially, in case
the hypotenuse measure is equal to 1, opposite [adjacent] side length regarding the
acute angle corresponds to sine [cosine] value. Therefore, opposite [adjacent] side of
the reference right triangle corresponds to sine [cosine] in the first quadrant of the unit
circle. In other words, ordinate [abscissa] of the reference point on the unit circle
corresponds to sine [cosine] value of the reference angle in the first quadrant. This
conception is the first step in coherent understanding of the right triangle trigonometry
and the unit circle trigonometry.
Cognitive concept map on sine [cosine] as a function (Figure 8.4).
As revealed in the cognitive analysis of the initial interviews of this study,
because trigonometric functions cannot be expressed as algebraic formulas involving
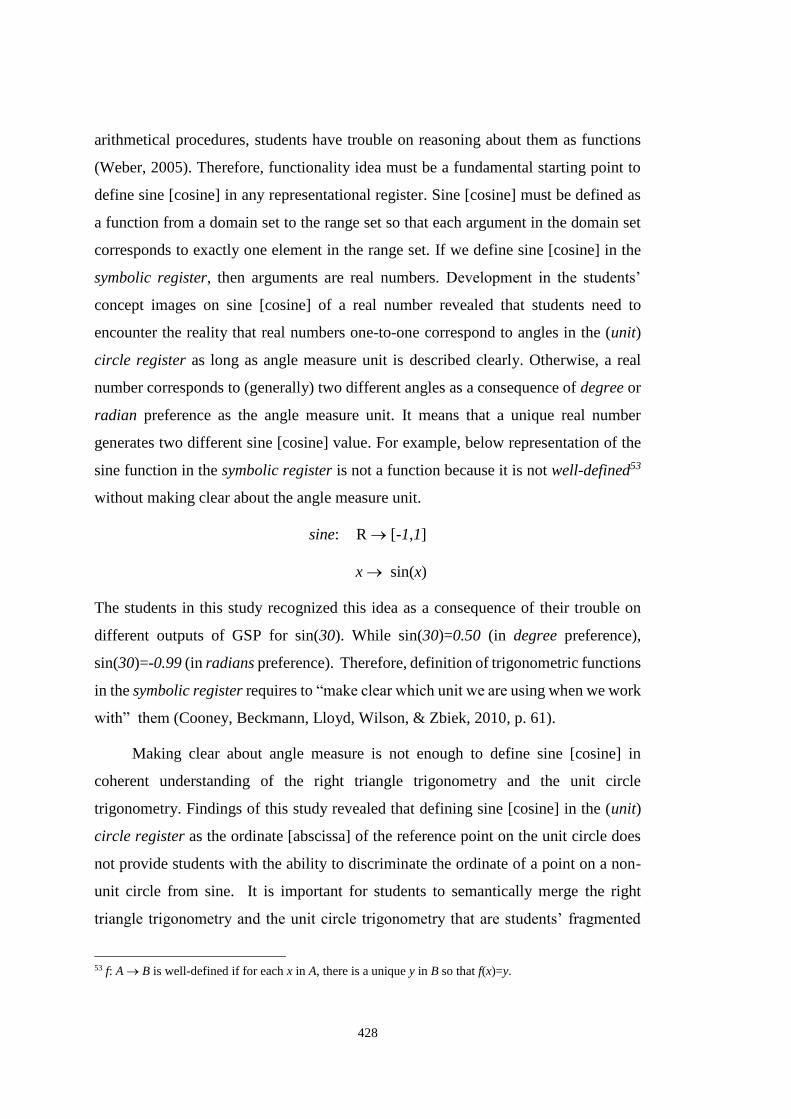
428
arithmetical procedures, students have trouble on reasoning about them as functions
(Weber, 2005). Therefore, functionality idea must be a fundamental starting point to
define sine [cosine] in any representational register. Sine [cosine] must be defined as
a function from a domain set to the range set so that each argument in the domain set
corresponds to exactly one element in the range set. If we define sine [cosine] in the
symbolic register, then arguments are real numbers. Development in the students’
concept images on sine [cosine] of a real number revealed that students need to
encounter the reality that real numbers one-to-one correspond to angles in the (unit)
circle register as long as angle measure unit is described clearly. Otherwise, a real
number corresponds to (generally) two different angles as a consequence of degree or
radian preference as the angle measure unit. It means that a unique real number
generates two different sine [cosine] value. For example, below representation of the
sine function in the symbolic register is not a function because it is not well-defined53
without making clear about the angle measure unit.
sine: R [-1,1]
x sin(x)
The students in this study recognized this idea as a consequence of their trouble on
different outputs of GSP for sin(30). While sin(30)=0.50 (in degree preference),
sin(30)=-0.99 (in radians preference). Therefore, definition of trigonometric functions
in the symbolic register requires to “make clear which unit we are using when we work
with” them (Cooney, Beckmann, Lloyd, Wilson, & Zbiek, 2010, p. 61).
Making clear about angle measure is not enough to define sine [cosine] in
coherent understanding of the right triangle trigonometry and the unit circle
trigonometry. Findings of this study revealed that defining sine [cosine] in the (unit)
circle register as the ordinate [abscissa] of the reference point on the unit circle does
not provide students with the ability to discriminate the ordinate of a point on a non-
unit circle from sine. It is important for students to semantically merge the right
triangle trigonometry and the unit circle trigonometry that are students’ fragmented
53 f: A B is well-defined if for each x in A, there is a unique y in B so that f(x)=y.

429
and unrelated comprehensions (Thompson, 2008). Thus, definition of sine [cosine]
should draw from the dynamic view of the reference right triangle integrated into the
circular representation in the (unit) circle register. In special sense, on the unit circle
after students’ recognition of the opposite [adjacent] side of the reference right triangle
as sine [cosine] from the similarity perspective (see Cognitive concept map on sine
[cosine] (Figure 8.3)), the meaning of the opposite [adjacent] side within each
quadrant as well as the limit cases54 of the reference right triangle must be discussed
through comparing with the corresponding sine [cosine] value. This activity is critical
in recognition of sine [cosine] as directed opposite [adjacent] side lengths of the
reference right triangle. The meaning of sine [cosine] as ordinate [abscissa] of the
reference point on the unit circle is the next step of the recognition tasks.
Final step of the recognition tasks of sine [cosine] function is to investigate its
systematic covariation with respect to the variation of angle measure in order to
distinguish the role of coterminal angles, principal angle and reference angle (Figure
8.4). This ability is constructed only at the level of grasping the angles as dynamic
turnings in the (unit) circle register (see Cognitive concept map on angles in the (unit)
circle register (Figure 8.2)).
Cognitive concept map on periodicity of core trigonometric functions (Figure 8.5).
Development in the students’ concept definition images on periodicity revealed
that recognition of periodicity requires students’ reasoning beyond the full-round
turning in the (unit) circle register. In fact, it requires reasoning about a turning amount
of the reference point referring of the input so as to generate full-rounds of the
reference point referring to the output.
On the one hand, for sine and cosine, periodicity is caused by full-round turnings
of the reference point referring to the output in the (unit) circle register. Full-round
turnings produce period which is generally represented by the prime period. Prime
54 The limit case of the reference right triangle means the absence of the reference right triangle regarding the
position of the reference point on unit circle; for example, its positions on the coordinate axes.
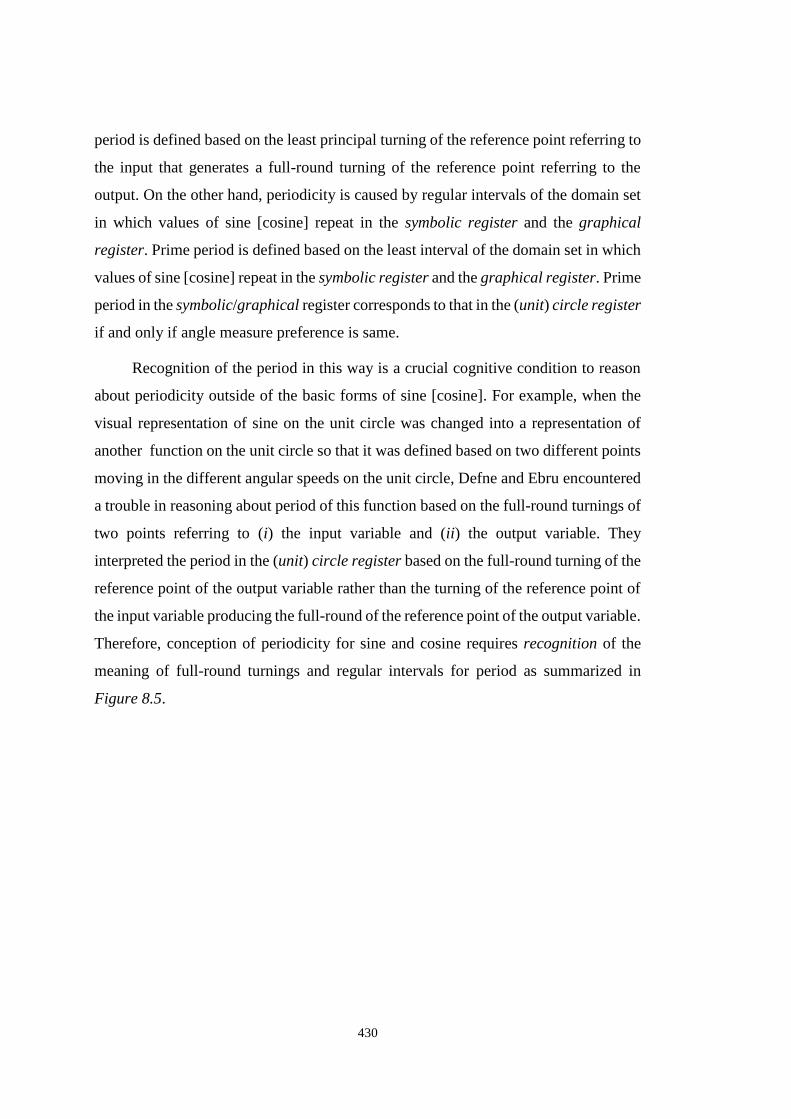
430
period is defined based on the least principal turning of the reference point referring to
the input that generates a full-round turning of the reference point referring to the
output. On the other hand, periodicity is caused by regular intervals of the domain set
in which values of sine [cosine] repeat in the symbolic register and the graphical
register. Prime period is defined based on the least interval of the domain set in which
values of sine [cosine] repeat in the symbolic register and the graphical register. Prime
period in the symbolic/graphical register corresponds to that in the (unit) circle register
if and only if angle measure preference is same.
Recognition of the period in this way is a crucial cognitive condition to reason
about periodicity outside of the basic forms of sine [cosine]. For example, when the
visual representation of sine on the unit circle was changed into a representation of
another function on the unit circle so that it was defined based on two different points
moving in the different angular speeds on the unit circle, Defne and Ebru encountered
a trouble in reasoning about period of this function based on the full-round turnings of
two points referring to (i) the input variable and (ii) the output variable. They
interpreted the period in the (unit) circle register based on the full-round turning of the
reference point of the output variable rather than the turning of the reference point of
the input variable producing the full-round of the reference point of the output variable.
Therefore, conception of periodicity for sine and cosine requires recognition of the
meaning of full-round turnings and regular intervals for period as summarized in
Figure 8.5.

431
Figure 8.1. Cognitive concept map on angles that models the integration of a new concept and the related current concepts into
students’ cognitive knowledge structure
43
1
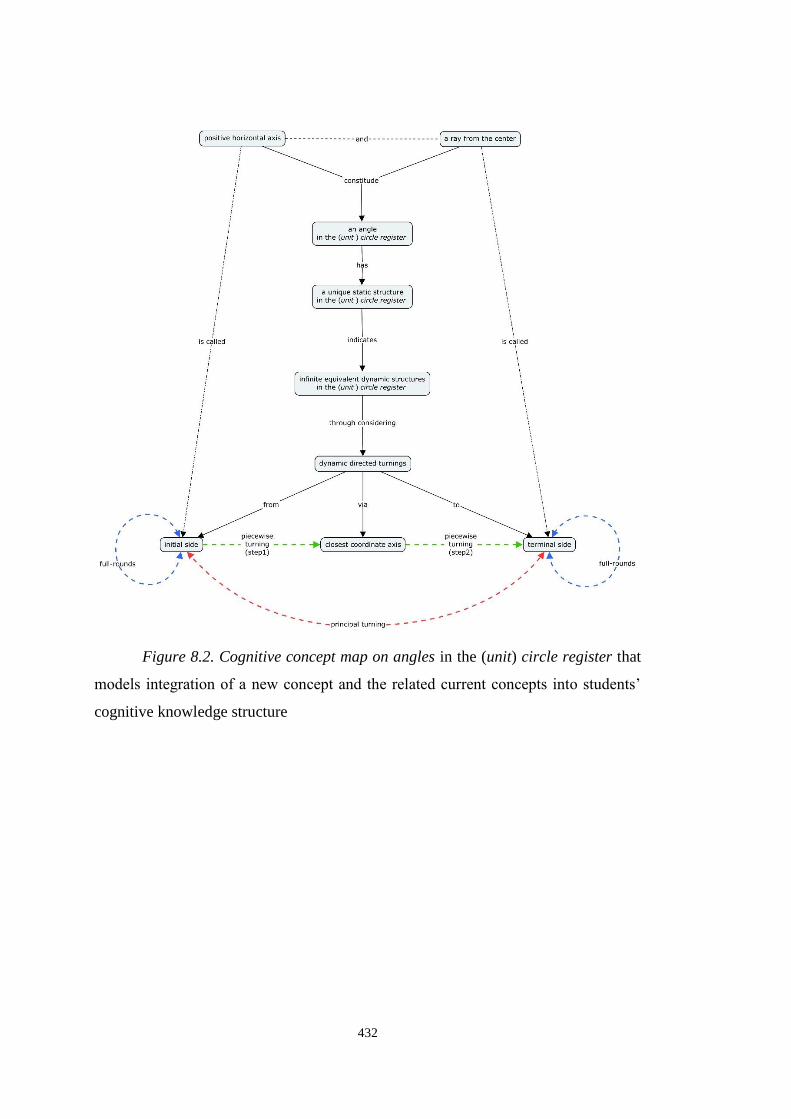
432
Figure 8.2. Cognitive concept map on angles in the (unit) circle register that
models integration of a new concept and the related current concepts into students’
cognitive knowledge structure

433
Figure 8.3. Cognitive concept map on sine [cosine] that models integration of
a new concept and the related current concepts into students’ cognitive knowledge
structure

434

435
Figure 8.4. Cognitive concept map on sine [cosine] as a function that models integration of a new concept and the related current concepts into students’ cognitive knowledge structure
435

436
436

437
Figure 8.5. Cognitive concept map on periodicity of core trigonometric
functions that models integration of a new concept and the related current concepts
into students’ cognitive knowledge structure
8.3.2. Cognitive networks
Duval (2006) articulates a cognitive network through exemplifying on linear
functions’ graphs (see Figure 2.4 in Chapter 2) as a cognitive condition referring to
the ability “to discern how two graphs that seem visually alike are mathematically
different” (p. 124). In realizing such a cognitive network, he stresses the importance
of making “students notice the basic visual features oppositions that are
mathematically relevant and cognitively significant” (p. 125) through investigating
representation variations in a conversion task both in the source register and in the

438
target register. Our instructional design was based on investigations of systematically
varied representations and their oppositions in the other representational registers.
Therefore, through inspiring from Duval’s (2006) cognitive network (see Figure 2.4),
we formed some cognitive networks based on mathematically relevant and cognitively
significant visual features in the (unit) circle register and the graphical register.
Visual feature opposition (A)
Visual Feature (A) corresponds to changed-radius in the (unit) circle register
(e.g., Figure 8.6-Figure 8.8, Figure 8.12) and changed-magnitude in the graphical
register (e.g., Figure 8.13-Figure 8.15, Figure 8.19). These visual features’ opposition
in the symbolic register corresponds to the choice presence/absence of the coefficient
(a) in a general form of sine [cosine] function, e.g., y=asin(x) [y=acos(x)]. These visual
features indicate only for a>0 the discrimination of a=1 or a≠1 in the symbolic register.
Discrimination of the coefficient a (for a<0) in the symbolic register needs
consideration of another visual feature, i.e., Visual Feature (C), together with Visual
Feature (A) in the (unit) circle register (see Figure 8.7) and the graphical register (see
Figure 8.14).
Visual feature opposition (B)
Visual Feature (B) corresponds to changed-arc through folding the angle
variable in the (unit) circle register (e.g., Figure 8.8, Figure 8.10, Figure 8.11) and
compressed/stretched-wavelength in the graphical register (e.g., Figure 8.15,
Figure 8.17, Figure 8.18). These visual features’ opposition in the symbolic register
corresponds to the choice presence/absence of a coefficient (b) of the input of a general
form of sine [cosine] function, e.g., y=sin(bx) [y=cos(bx)], in the symbolic register for
discrimination (the choice of b=1 or b≠1). Where, the negative coefficient b refers to
turning in the clockwise direction in the (unit) circle register and the reflection of the
graph regarding the y-axis in the graphical register.

439
Visual feature opposition (C)
Visual Feature (C) corresponds to changed-arc with a constant (angular)
difference in the (unit) circle register (e.g., Figure 8.7, Figure 8.9, Figure 8.11) and
parallel-displacement along the x-axis in the graphical register (e.g., Figure 8.14,
Figure 8.16, Figure 8.18). If we change our reasoning focus from one reference point
to two reference points with a constant angular difference in the (unit) circle register,
this visual feature’s opposition is parallel-displacement of graphs along the x-axis in
the graphical register. These visual features’ opposition in the symbolic register
corresponds to the choice presence/absence of a constant (c) of the input of a general
form of sine [cosine] function, e.g., y=sin(x+c) [y=cos(x+c)].
Visual feature opposition (D)
Visual Feature (D) corresponds to changed-center in the (unit) circle register
(e.g., Figure 8.6, Figure 8.9, Figure 8.10, Figure 8.12) and parallel-displacement
along the y-axis in the graphical register (e.g., Figure 8.13, Figure 8.16, Figure 8.17,
Figure 8.19). These visual features’ opposition in the symbolic register corresponds to
the choice presence/absence of a constant (d) in a general form of sine [cosine]
function, e.g., y=sin(x)+d [y=cos(x)+d].
Visual feature opposition (R)
Visual Feature (R) corresponds to the rotation of the reference right triangle
about the origin by an integer multiple of π/2-radian in the (unit) circle register.
Visual feature opposition (SRRT)
Visual Feature (SRRT) corresponds in the (unit) circle register to the selection
of the reference right triangle in the reference rectangle (see Footnote 44 in Chapter
6). As a consequence of the visual features (R) and (SRRT), we can transform sine
[cosine] into cosine [sine] in the symbolic register.
440
Visual feature opposition (S)
Visual Feature (S) corresponds in the graphical register to the separation of
the sine [cosine] graph into the parts referring the variation in the quadrants of the unit
circle.
Visual feature opposition (C*) [(C**)]
Visual Feature (C*) [(C**)] corresponds in the graphical register to the
parallel-displacement of sine or cosine graph defined in radians along the x-axis by
π/2-length in the positive [negative] direction. These visual features are special cases
of Visual Feature (C). As a consequence of the visual features (S) and (C*) [(C**)], we
can transform sine [cosine] into cosine [sine] in the symbolic register.
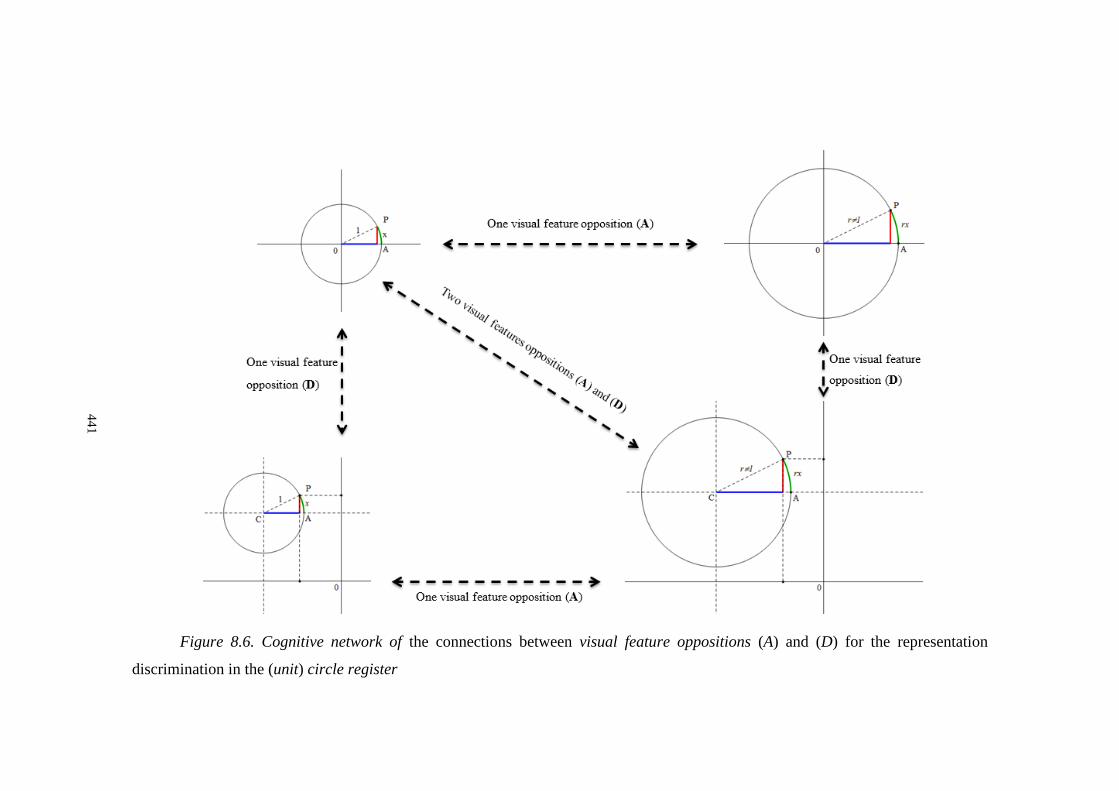
441
Figure 8.6. Cognitive network of the connections between visual feature oppositions (A) and (D) for the representation
discrimination in the (unit) circle register
44
1

442
Figure 8.7. Cognitive network of the connections between visual feature oppositions (A) and (C) for the representation
discrimination in the (unit) circle register
44
2
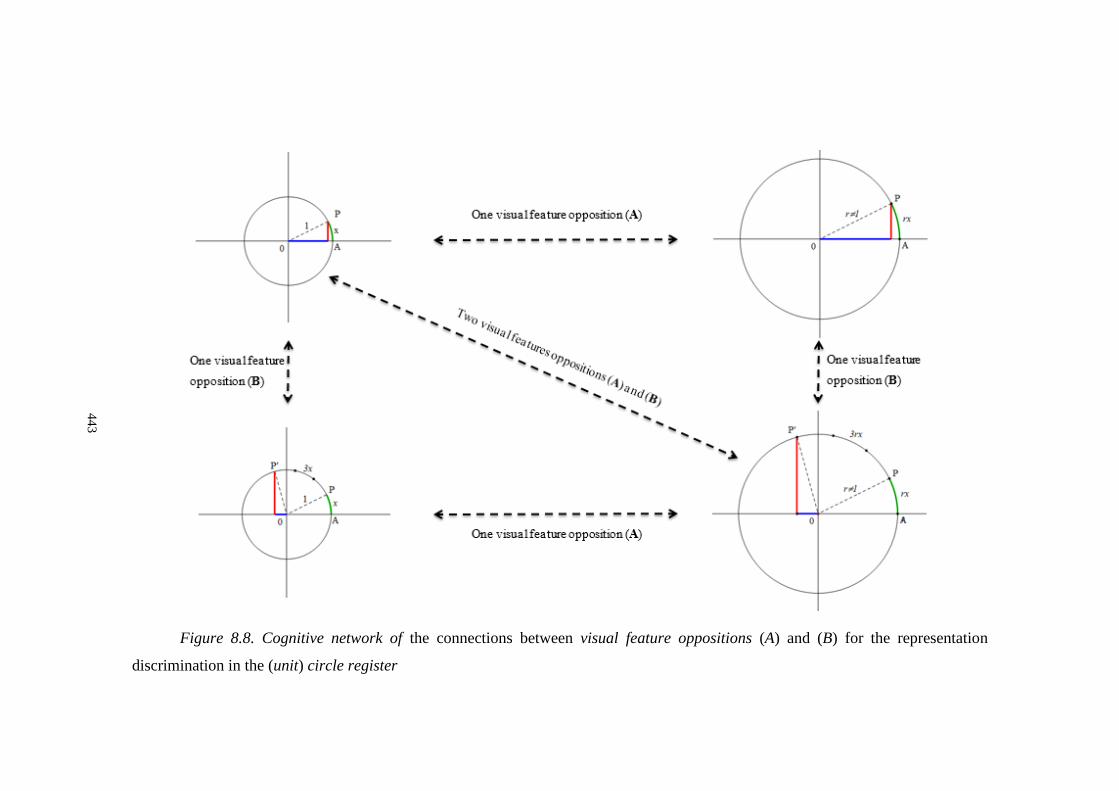
443
Figure 8.8. Cognitive network of the connections between visual feature oppositions (A) and (B) for the representation
discrimination in the (unit) circle register
44
3

444
Figure 8.9. Cognitive network of the connections between visual feature oppositions (C) and (D) for the representation
discrimination in the (unit) circle register
44
4
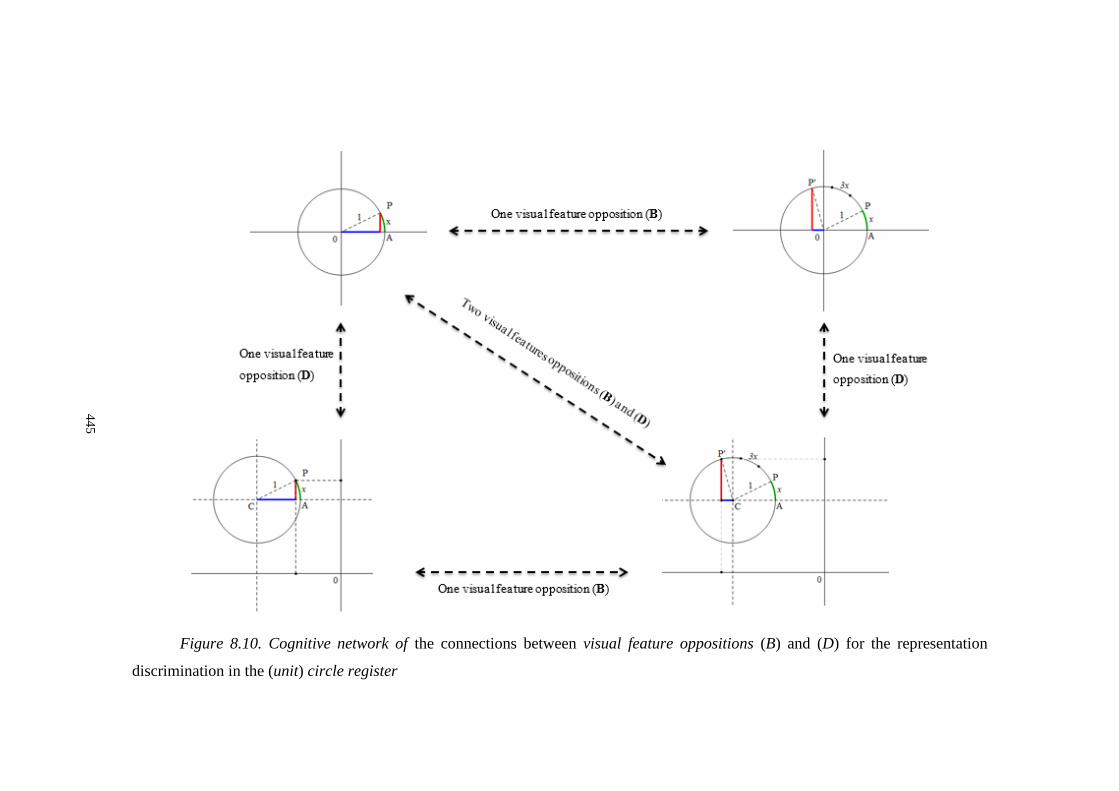
445
Figure 8.10. Cognitive network of the connections between visual feature oppositions (B) and (D) for the representation
discrimination in the (unit) circle register
44
5

446
Figure 8.11. Cognitive network of the connections between visual feature oppositions (B) and (C) for the representation
discrimination in the (unit) circle register
44
6
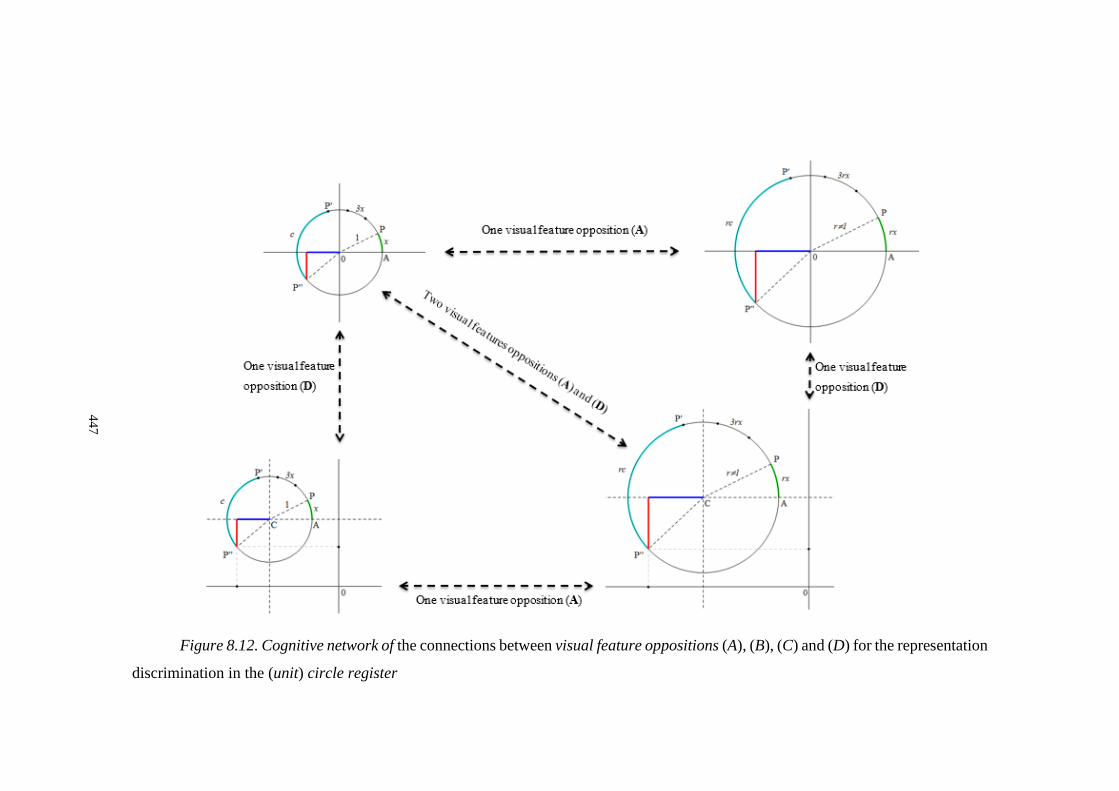
447
Figure 8.12. Cognitive network of the connections between visual feature oppositions (A), (B), (C) and (D) for the representation
discrimination in the (unit) circle register
44
7

448
Figure 8.13. Cognitive network of the connections between visual feature oppositions (A) and (D) for the representation
discrimination in the graphical register
44
8
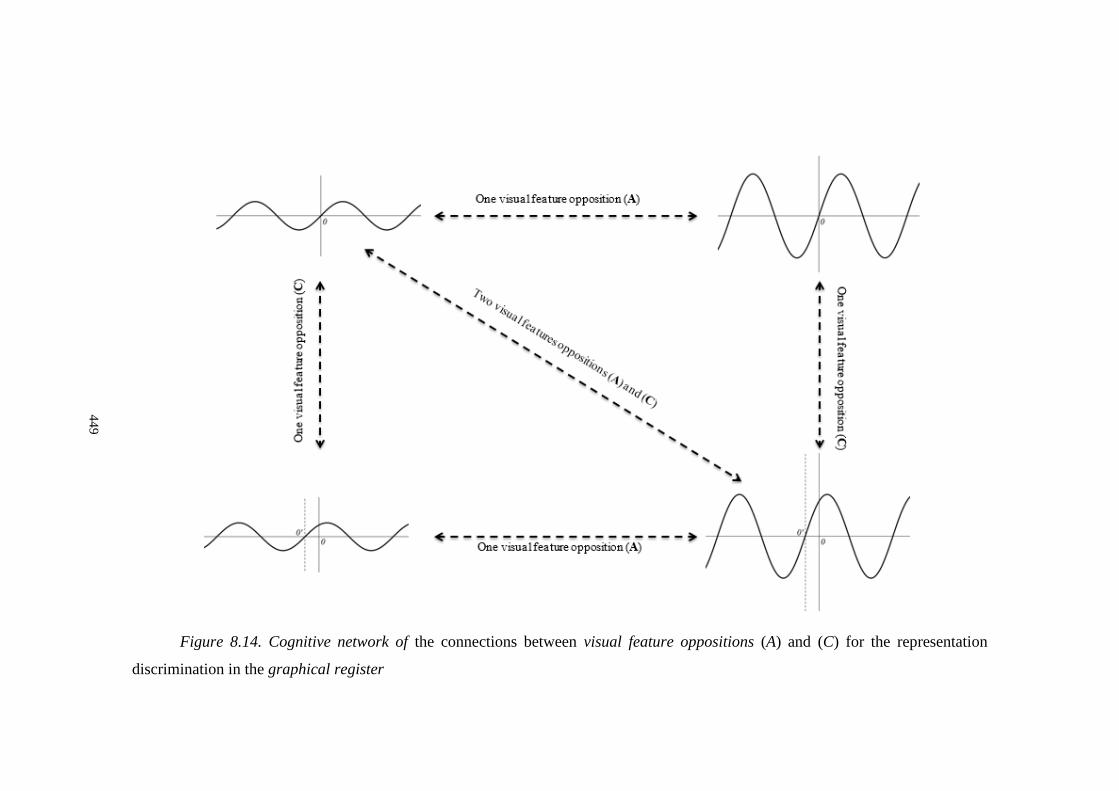
449
Figure 8.14. Cognitive network of the connections between visual feature oppositions (A) and (C) for the representation
discrimination in the graphical register
44
9
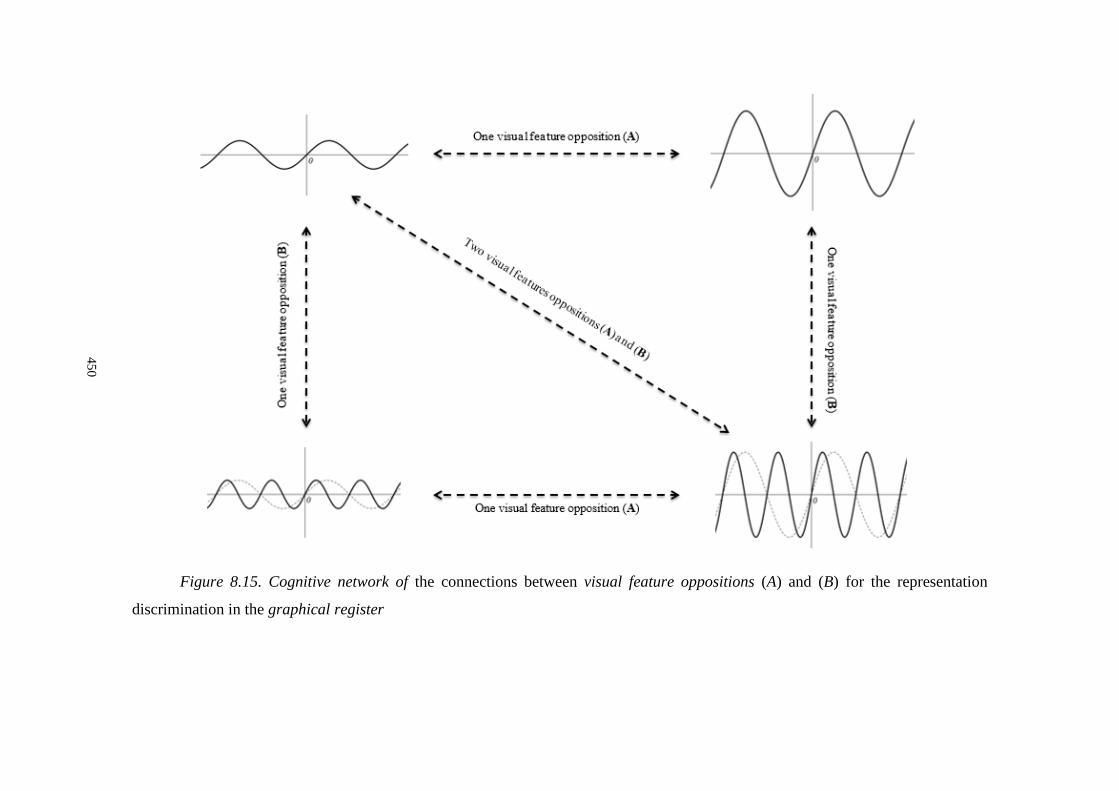
450
Figure 8.15. Cognitive network of the connections between visual feature oppositions (A) and (B) for the representation
discrimination in the graphical register
45
0
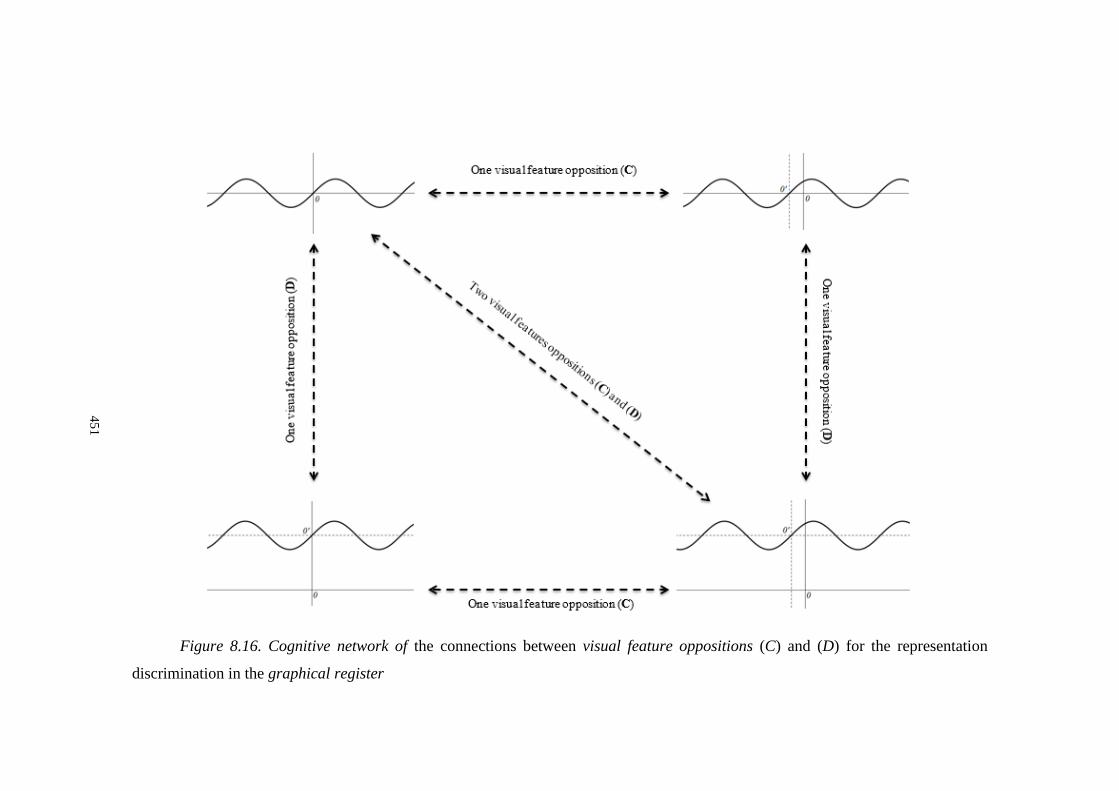
451
Figure 8.16. Cognitive network of the connections between visual feature oppositions (C) and (D) for the representation
discrimination in the graphical register
45
1
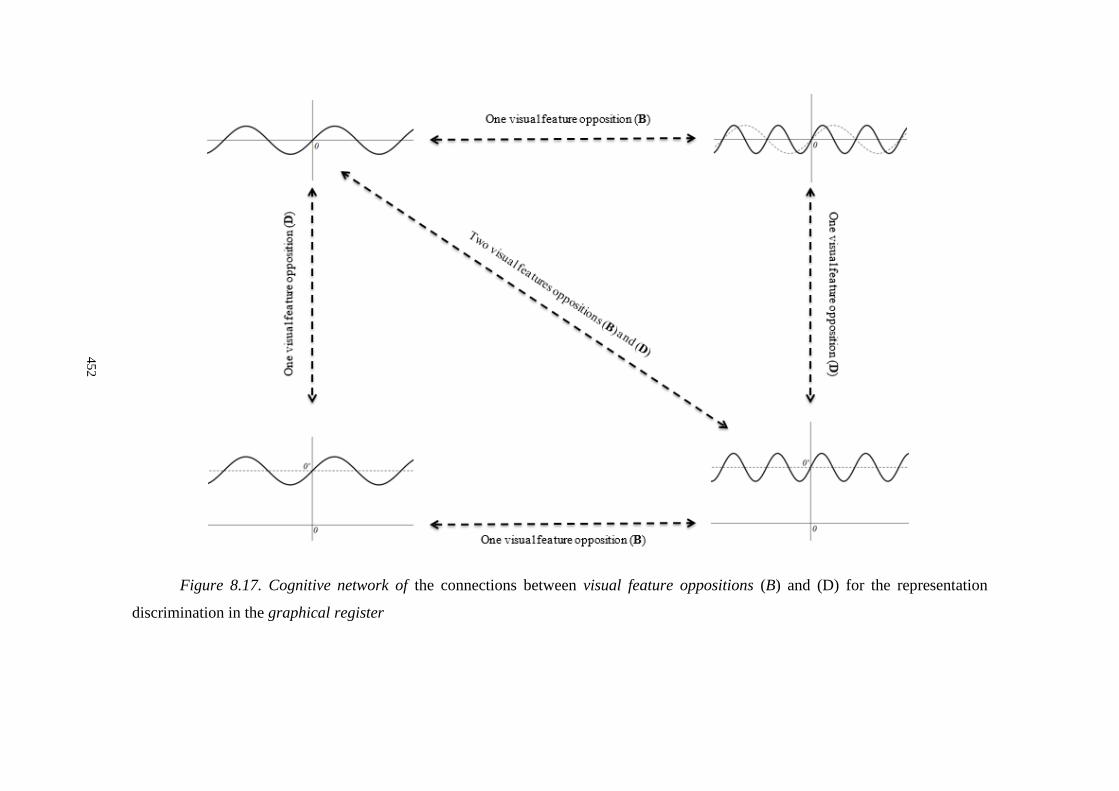
452
Figure 8.17. Cognitive network of the connections between visual feature oppositions (B) and (D) for the representation
discrimination in the graphical register
45
2

453
Figure 8.18. Cognitive network of the connections between visual feature oppositions (B) and (C) for the representation
discrimination in the graphical register
45
3
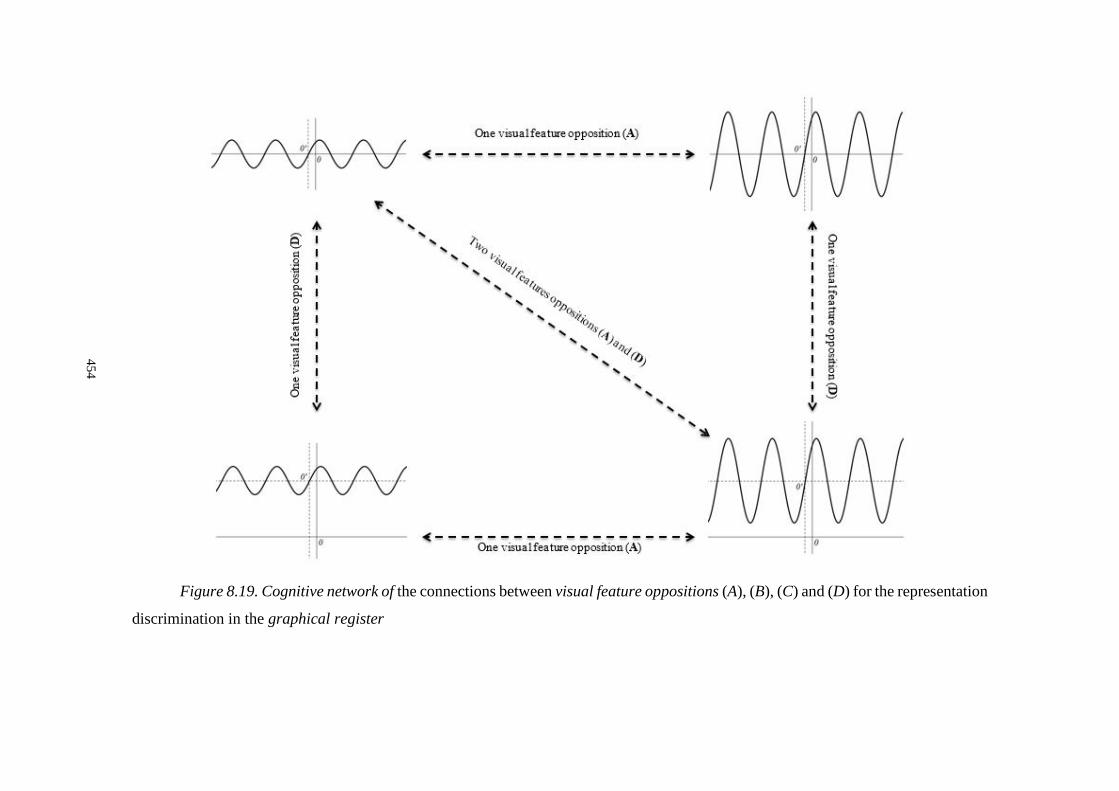
454
Figure 8.19. Cognitive network of the connections between visual feature oppositions (A), (B), (C) and (D) for the representation
discrimination in the graphical register
45
4

455
Figure 8.20. Cognitive network of the connections between sine and cosine in the (unit) circle register as a consequence of the
visual feature oppositions (R) and (SRRT)
45
5
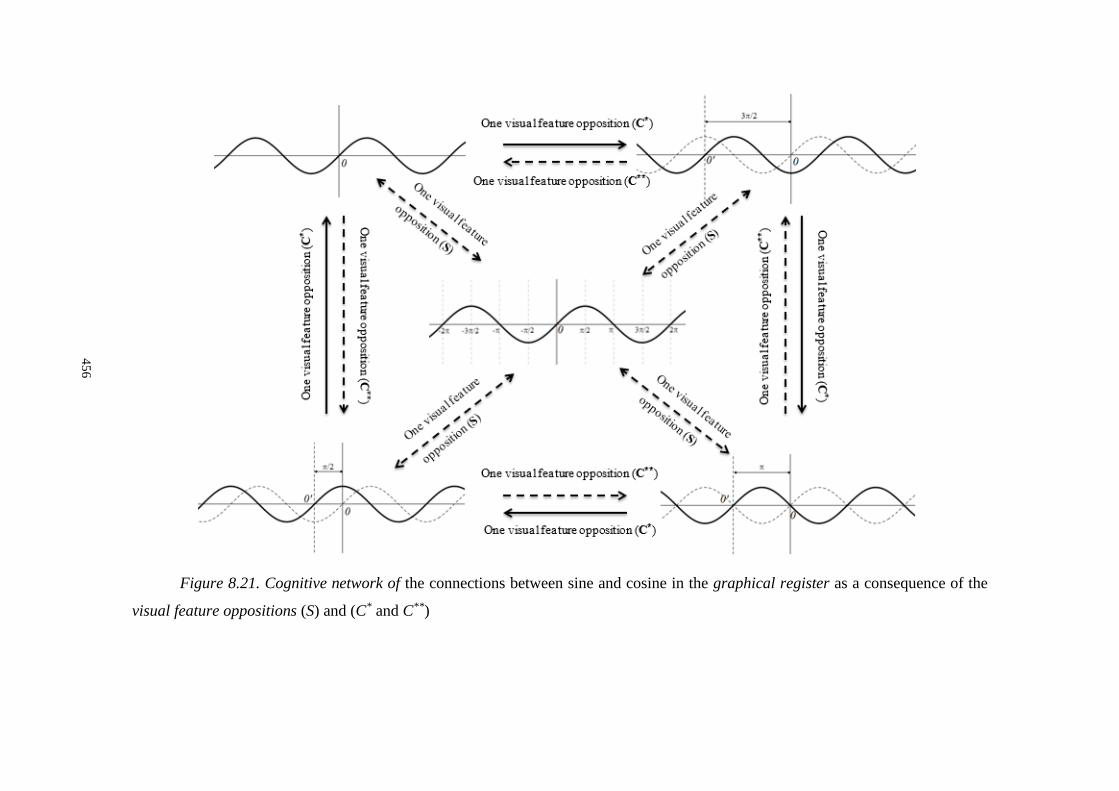
456
Figure 8.21. Cognitive network of the connections between sine and cosine in the graphical register as a consequence of the
visual feature oppositions (S) and (C* and C**)
45
6

457
8.4. Implications and Suggestions for Curriculum and Instruction
This study included a trigonometry instruction that was designed to support
students’ concept images on trigonometric functions in different representations (i.e.,
symbolic, circular, and graphic) through initially inspiring from research literature on
trigonometry, historical development of trigonometry, our exploratory teaching
experience, and initial interview results, and then, revising as a result of the on-going
prospective and retrospective cognitive analysis during the 17-week experimentation
process. We categorized semiotic representations of trigonometric functions into four:
(unit) circle register, graphical register, symbolic register and language register. Our
design was including a sequential recognition tasks (based on dynamically-linked
conversions of trigonometric functions between representational registers) and
discrimination tasks (based on dynamically-changed visual components referring to
trigonometric functions) in the dynamic geometry environment with GSP. In
conversions of trigonometric functions, the way followed was from the (unit) circle
register to the graphical register together with the symbolic register.
The cognitive analysis of the data revealed the students’ serious recognition
problems on foundational trigonometric concepts (i.e., angle, angle measure,
trigonometric value, trigonometric functions, and periodicity) based on their weak
concept definition images. As the study progressed, when reasoning about these
concepts in GSP environment, they constructed well-defined concept definition images
as summarized in cognitive concept maps that were grounded based on the result of
this study.
To begin with, when making variations of an angle constructed in GSP,
reasoning about its dynamically-changed measure in directed angles preference
produced the students’ recognition of the invariance components referring to the angle
measure (initial side, terminal side and direction of the rotation). Moreover, they
constructed dynamic-and-directed turning view on angles in the (unit) circle register
that enabled them to associate a unique static angle structure with infinitely many
equivalent dynamic structures. Thus, it is important that curriculum and instruction

458
promote students’ well-defined concept definition images on angles (see cognitive
concept maps on angle in Figure 8.1-Figure 8.2) including dynamic-turning view
through specifying the rotation’s initial side, terminal side and direction.
Secondly, the findings that emerged from this study emphasize similarity as a
fundamental starting point to reason about triangle trigonometry. When dynamically
manipulating similar right triangles, and observing corresponding changes of
trigonometric ratios between similar right triangles, the students recognized that a sine
[cosine] ratio is dependent only on an acute angle and independent from side lengths,
specially, in case the hypotenuse measure is equal to 1, opposite [adjacent] side length
regarding the acute angle corresponds to sine [cosine] value. This was the first step of
semantically mergence of their fragmented concept images on trigonometric functions
in the right triangle context and the unit circle context. Therefore, students’ well-
defined concept definition images on trigonometric functions in the right triangle
context (see cognitive concept maps on sine [cosine] in Figure 8.3) should arise from
similarity before defining them on the unit circle context.
On the other hand, as revealed in the cognitive analysis of the initial interviews
of this study, because trigonometric functions cannot be expressed as algebraic
formulas involving arithmetical procedures, students have trouble on reasoning about
them as functions. Therefore, functionality idea must be a fundamental starting point
to define sine [cosine] as a function in any representational register. Development in
the students’ concept images on sine [cosine] of a real number revealed that students
need to encounter the reality that real numbers one-to-one correspond to angles as long
as angle measure unit is described clearly. Otherwise, a real number corresponds to
(generally) two different angles as a consequence of degree or radian preference as
the angle measure unit. It means that a unique real number generates two different sine
[cosine] value. For example, below representation of the sine function in the symbolic
register is not a function because it is not well-defined (see Footnot 53) without making
clear about the angle measure unit.
sine: R [-1,1]
x sin(x)
459
The students in this study recognized this idea as a consequence of their trouble on
different outputs of GSP for sin(30). While sin(30)=0.50 (in degree preference),
sin(30)=-0.99 (in radians preference). Therefore, definition of trigonometric functions
in the symbolic register requires to make clear about the angle measure unit that is
used. Making clear about angle measure is not enough to define sine [cosine] in
coherent understanding of the right triangle trigonometry and the unit circle
trigonometry. Findings of this study revealed that defining sine [cosine] in the (unit)
circle register as the ordinate [abscissa] of the reference point on the unit circle does
not provide students with the ability to discriminate the ordinate of a point on a non-
unit circle from sine. Thus, definition of sine [cosine] should draw from the dynamic
view of the reference right triangle integrated into the circular representation in the
(unit) circle register. In special sense, on the unit circle after students’ recognition of
the opposite [adjacent] side of the reference right triangle as sine [cosine] from the
similarity perspective, the meaning of the opposite [adjacent] side within each
quadrant as well as the limit cases (see Footnote 54) of the reference right triangle
must be discussed through comparing with the corresponding sine value. The meaning
of sine [cosine] as ordinate [abscissa] of the reference point on the unit circle sould be
the next step of the recognition tasks. Final step of the recognition tasks of sine
[cosine] function sould be to investigate its systematic covariation with respect to the
variation of angle measure in order to distinguish the role of coterminal angles,
principal angle and reference angle (see cognitive concept maps on sine [cosine] as a
function in Figure 8.4). This ability is constructed only at the level of grasping the
angles as dynamic turnings in the (unit) circle register. Thus, it is important that
curriculum and instruction promote students’ well-defined concept definition images
on trigonometric functions in the (unit) circle register arising from the meaning of the
reference right triangle.
The importance of the basic visual features’ discrimination is also revealed in
this study. When the basic visual features referring to trigonometric functions (i.e.,
radius of the circle, position of the center, position of the reference point on the circle
referring to trigonometric value) were systematically varied in the (unit) circle
register, and their dynamic-and-linked oppositions in the graphical register were

460
constructed, the students developed significant understandings referring to
trigonometric functions.
Initially, when the unit circle was changed into a non-unit circle, they
constructed “unit” meaning that enabled them to consider a unit circle as a non-unit
circle. They constructed this meaning when measuring the changed-radius by GSP as
a consequence of their troubles arising from the difference between the distance-
measure-unit preference of GSP as centimeter and the visual distance-measure-unit of
the coordinate axes. This ability to reason about the same circular structure as both a
unit circle and non-unit circle is necessary to recognize general forms of trigonometric
functions in the (unit) circle register. When the radius changed from 1 to r≠1,
discrimination of trigonometrically relevant and cognitively significant visual features
(such as the reference point, arc length, arc angle, reference right triangle –see Visual
Feature Opposition (A) in Figure 8.6-Figure 8.8) is an important cognitive ability to
use trigonometric functions in any circular context. This discrimination requires to be
able to not only associate the opposite side of the reference right triangle in the r-unit
circle with sin(x) through considering r is the unit, but also associate it with r.sin(x)
through considering r≠1. This visual feature’s opposition is changed-magnitude in the
graphical register (see Visual Feature Opposition (A) in Figure 8.13-Figure 8.15).
Cognitive analysis of the data revealed that, seeing the systematic covariations
between the radius and magnitude is necessary condition of the ability to reason about
relations among “changed-radius” in the (unit) circle register, “changed-magnitude”
in the graphical register and “changed-coefficient r of the r.sine function” in the
symbolic register. However, these visual features by oneself indicate (for r>0) the
discrimination of r=1 or r≠1 in the symbolic register. Discrimination of the coefficient
a (for a<0) in the symbolic register needs consideration of another visual feature, i.e.,
Visual Feature (C), together with Visual Feature (A) in the (unit) circle register (see
Figure 8.7) and the graphical register (see Figure 8.14).
Next visual feature of the systematic variation was the center of the unit circle.
Changed-location of the center from the origin to any other position on the coordinate
plane revealed that the discrimination ability requires to focus on mathematically
461
relevant objects (e.g., reference right triangle, displacement amount and direction) in
reasoning about the new situation instead of processes (e.g., ordinate of a point,
procedural definition of sine or cosine). For example Zafer reasoned about the new
representation focusing on the horizontal axis from the center as the x-axis considering
the x-axis as if a reified-object without going into details but with awareness of its
different location. Cemre mentioned the unit circle whose center located on the origin
as if a reified-object; and was able to change its position up-down and left-right in her
mind as a whole on the coordinate system. On the other hand, Defne and Ebru focused
predominantly on the processes related to the y-components in the (unit) circle register
based on the determination of the ordinates. For this reason, Cemre and Zafer
performed at higher reasoning stage (i.e., condensation/reification) than Defne and
Ebru (i.e., interiorization) considering Sfard’s (1991) hierarchical stages of the
concept development. Thus, discrimination of trigonometric functions represented in
the (unit) circle register from this register’s content needs to reason about them based
on trigonometrically relevant and cognitively significant objects (such reference
point(s), as arcs, reference right triangle, horizontal axis from the center and radius)
rather than the detailed processes.
Final visual feature of the systematic variation was the reference point referring
to trigonometric value. That is to say, the only one reference point on the unit circle
referring to both angle and corresponding trigonometric value was varied from only
one point to two points so as one of them to refer the input and the other to refer the
output of the function (see Visual Feature Oppositions (B) and (C) in Figure 8.11).
Findings from these tasks of the study reveal the importance of students’ recognition
of sine [cosine] considering its angle dependent on another angle for discrimination
of, for example, y=sin(x), y=sin(x+1) and y=sin(2x) represented in the (unit) circle
register from each other. These visual features’ oppositions in the graphical register
(see Visual Feature Oppositions (B) and (C) in Figure 8.18) also reveal that (i)
students’ making sense of the parallel-displacement of the sinusoidal graphs along the
x-axis is possible only when they are interpreted together with their dynamic-and-
linked conversions in the (unit) circle register, (ii) for students’ construction of well-
defined concept definition images on periodicity (see cognitive concept maps on

462
periodicity of core trigonometric functions in Figure 8.5), it is crucial to reason about
trigonometric functions that are defined based on two points turning at different
(angular) speeds in the (unit) circle register.
Finally, this study reveals the importance of dynamic-and-linked conversions
of trigonometric structures between representational register in students’
discrimination of trigonometrically relevant and cognitively significant structures. For
example, visual representations of sine [cosine] on the same coordinate plane both in
the (unit) circle register and the graphical register are vital in promoting students’
discrimination of the coordinates of a point in the (unit) circle register and the
graphical register only when the opportunity to compare and contrast dynamic-and-
linked variations of the reference point on the (unit) circle and its converted form in
the graphical register is given to students. This opportunity is also important in
promoting students’ discrimination of the meaning of the positive [negative] direction
in the (unit) circle register and the graphical register in terms of both angle measures
and trigonometric measures. Furthermore, representing the coterminal angles in the
graphical register is the best way to differentiate visually the equivalent but not equal
angles’ positions on the x-axis unlike their unique static structures in the (unit) circle
register. In addition, simultaneous reasoning about the principal arc’s angle in the unit
circle register and its conversion on the x-axis scaled with real numbers in the
graphical register is an important opportunity for students to recognize angle measures
as real numbers. In special sense, if the angle measure unit is considered in radians,
this opportunity fortifies students’ concept images on the meaning of π through
merging its meaning as an angle measure in radians and as a real number (i.e.,
approximately 3.14) via simultaneous representation of π-radian angle in the (unit)
circle register and its conversion on the x-axis in the graphical register.
All in all, it is important that curriculum and instruction promote students’
recognition and discrimination of foundational trigonometric concepts within and
between different representational register via taking into the consideration important
ideas that are mentioned above.
463
8.5. Limitation of the Study and Suggestions for Future Research
In this study, secondary students’ concept images on trigonometric functions
were investigated both after their school trigonometry course and during the
experimentation of the designed-instruction in GSP environment including sequential
tasks that were revised in an on-going way to influence students’ recognition and
discrimination of foundational trigonometric concept within and between different
representational registers.
Participants of the study were four successful secondary students who had just
completed the trigonometry course in their schooling time with high grades on the
written exams conducted at their schools. Thus, the experimentation did not include
students with different ability levels in general sense, as well as those who did not
experience trigonometric functions before. Also, interactions of the teaching
experiment were not social interactions as a part of classroom mathematical practices;
rather, interactions were social interactions with two students at a time to gain detailed
insights into their reasoning ways throughout the 17-week experimentation. Moreover,
except in the modeling task, representations on which discussions were done
constructed in the dynamic geometry environment rather than paper-and-pencil
environment. Lastly, trigonometric functions was delimited in the scope of this study
into sine and cosine functions.
Due to the limitations mentioned above, the result of this study may not be
generalized to all secondary students with different ability levels. However, it is
reasonable to presume that the participants’ cognitive troubles after their trigonometry
course and prior to the teaching experiment would be valid for others including
average and lower achievers. Moreover, the results of this study provide a lens for
mathematics instructors at tertiary education to recognize their students’ background
knowledge on trigonometry that have been acquired during their secondary education.
Also, conceptual frameworks that were created in this study based on the cognitive
analysis of the experimentation process can serve a valuable guide for trigonometry
464
teachers, other researchers and educators in designing more effective trigonometry
tasks, as well as in analyzing students’ trigonometry.
To build a broader picture of students’ concept images on trigonometry, it is
needed to investigate the effect of dynamically-linked conversions of trigonometric
functions between representational registers on students’ recognition and
discrimination abilities in terms of (i) students with different ability levels, (ii) students
at different grades and experience levels, (iii) many other topics related to
trigonometry, as well as (iv) social interactions as a part of classroom mathematical
practices. Also, it is needed to investigate (i) the critical visual components referring
to other trigonometric functions and many other topics related to trigonometry in
students’ recognition and discrimination abilities.

465
REFERENCES
Ackermann, E. (1995). Construction and transference of meaning through form. In L.
P. Steffe & J. Gale (Eds.), Constructivism in education, (pp. 341-354).
Hillsdale, NJ: Lawrence Erlbaum.
Akkoç, H. (2008). Pre-service mathematics teachers' concept image of radian.
International Journal of Mathematical Education in Science and Technology,
39(7), 857-878.
Archavi, A. (2003). The role of visual representations in the learning of mathematics.
Educational Studies in Mathematics, 52, 215–241.
Argün, Arıkan, Bulut & Halıcıoğlu (2014). Temel matematik kavramların künyesi.
Ankara: Gazi Kitabevi.
Arzarello, F., Olivero, F., Paola, D., & Robutti, O. (2002). A cognitive analysis of
dragging practices in Cabri environments. Zentralblatt für Didaktik der
Mathematik, 34(3), 66-72.
Blackett, N., & Tall, D. O. (1991, June). Gender and the versatile learning of
trigonometry using computer software. In F. Furinghetti (Ed.). Paper presented
at the Proceedings of the 15th conference of the International Group for the
Psychology of Mathematics Education, Assisi, Italy (Vol.1, pp. 144–151).
Italy: PME.
Brown, S. A. (2005). The trigonometric connection: Students' understanding of sine
and cosine (Unpublished doctoral dissertation). Illinois State University, USA.
Brummelen, G. V. (2009). The mathematics of the heavens and the earth. New Jersey:
Princeton University Press.

466
Burch, W. J. (1981). The development interview, testing and generalization of a theory
based model of conceptual structures for solving routine trigonometry
problems (Unpulished doctoral dissertation). Virginia Polytechnic Institude
and State University, Blacksburg, VA.
Chen, M. (1986). Gender and computers: The beneficial effects of experience on
attitudes. Journal of Educational Computing Research, 2, 265-282.
Choi-Koh, S. S. (2003). Effect of a graphing calculator on a 10th-grade student’s study
of trigonometry. The Journal of Educational Research. 96 (6), 359-369.
Cobb, P. & Steffe, L. P. (1983). The constructivist researcher as teacher and model
builder. Journal for Research in Mathematics Education, 14(2), 83-94.
Cooney, T. J., Beckmann, S., Lloyd,G. M., Wilson, P. S. & Zbiek, R. M. (2010).
Developing essential understanding of functions for teaching mathematics in
grades 9-12. Reston, VA: National Council of Teachers of Mathematics, Inc.
Dahlberg, R. P & Housman, D. L. (1997). Facilitating learning events through example
generation. Educational Studies in Mathematics, 33, 283-299.
Dreyfus, T. (1991, June). On the status of visual reasoning in mathematics and
mathematics education. In F. Furinghetti (Ed.). Paper presented at the
Proceedings of the 15th conference of the International Group for the
Psychology of Mathematics Education, Assisi, Italy (Vol.1, pp. 32-48). Italy:
PME.
Dreyfus, T. (1993). Didactic design of computer-based learning environments. In C.
Keitel & K. Ruthven (Eds.), Learning from computers: Mathematics,
education, and technology (pp. 101-130). Heidelberg, Berlin: Springer-Verlag.
Duval, R. (1999, October). Representation, vision and visualization: Cognitive
functions in mathematical thinking. Basic issues for learning. In F. Hitt & M.
Santos (Eds.). Paper presented at the Proceedings of the 21st Annual
467
Conference of the North American Chapter of the International Group for the
Psychology of Mathematics Education, Cuernavaca, Morelos, Mexico (Vol.1,
pp. 3-26). Mexico: PME.
Duval, R. (2006). A cognitive analysis of problems of comprehension in learning of
mathematics. Educational Studies in Mathematics, 61,103-131.
Emlek, B. (2007). Dinamik modelleme ile bilgisayar destekli trigonometri öğretimi
(Unpublished master thesis). Selçuk University, Graduate school of Natural
and Applied Sciences, Konya, Turkey.
Fi, C. (2003). Preservice secondary school mathematics teachers' knowledge of
trigonometry: Subject matter content knowledge, pedagogical content
knowledge and envisioned pedagogy (Unpublished doctoral dissertation).
University of Iowa, USA.
Fennema, E. (1974). Mathematics learning and the sexes. Journal for Research in
Mathematics Education, 5, 126-139.
Fennema, E., & Carpenter, T. P. (1981). Sex-related differences in mathematics:
Results from the National Assesment. Mathematics Teacher, 74, 554-559.
Ferrara, F., Pratt, D. & Robutti, O. (2006). The role and uses of technologies for the
teaching of algebra and calculus. In A. Gutierrez & P. Boero (Eds.), Handbook
of research on the psychology of mathematics education: Past, present and
future (pp. 237-273). Rotterdam, Taipei: Sense Publisher.
Garofalo, J., Drier, H., Harper, S., Timmerman, M. A., & Shockey, T. (2000).
Promoting appropriate uses of technology in mathematics teacher preparation.
Contemporary Issues in Technology and Teacher Education, 1(1), 66-88.
Goldenberg, E. P. (1988). Mathematics, metaphors, and human factors: Mathematical,
technical and pedagogical challenges in educational use of graphical
representations of functions. Journal of Mathematical Behavior, 7, 135-173.

468
Goldenberg, E. P. (2000). Thinking (and talking) about technology in math
classrooms. Education Development Center, Inc. Retrieved September 20,
2007, from the World Wide Web: http://www2.edc.org/mcc/PDF/iss_tech.pdf.
Gray, E. M., & Tall, D. O. (1994). Duality, ambiguity, and flexibility: Aproceptual
view of elementary arithmetic. Journal for Research in Mathematics
Education, 26(2), 114–141.
Güntekin, E. (2010). Trigonometri konusunda öğrencilerin sahip olduğu öğrenme
güçlüklerinin ve kavram yanılgılarının tespit edilmesi (Unpublished master
thesis). Atatürk University, Graduate school of Natural and Applied Sciences.
Erzurum, Turkey.
Gür, H. (2009). Trigonometry learning. New Horizons in Education, 57 (1), 67-80.
Halpern, D. F. (1986). Sex differences in cognitive abilities. Hillsdale, NJ: Erlbaum.
Hanna, G. (2000). Proof, explanation and exploration: An overview. Educational
Studies in Mathematics, 44, 5-23.
Hannafin, R. D. & Scott, B. N. (2001) Teaching and learning with dynamic geometry
programs in student-centered learning environments: A mixed method inquiry.
Using Information Technology in Mathematics Education. 121-141.
Harel, G., Selden, A. & Selden, J. (2006). Advanced mathematical thinking. In A.
Gutierrez & P. Boero (Eds), Handbook of research on the psychology of
mathematics education: Past, present and future (pp. 147-172). Rotterdam,
Taipei: Sense Publisher.
Hertel & Cullen, (2011, October). Teaching trigonometry: A ditrected length
approach. In L. R. Wiest & T. D. Lamberg (Eds.). Presented at the Proceedings
of the 33rd Annual Meeting of the North American Chapter of the International
Group for the Psychology of Mathematics Education, Reno, NV: University of
Nevada (pp. 1400-1407). Reno, NV: PME.
469
Hunting, R. (1983). Emerging methodologies for understanding internal processes
governing children’s mathematical behavior. The Australian Journal of
Education, 27(1), 45-61.
Jackiw, N. (2006). The Geometer’s Sketchpad, Version 4.07. Berkeley, CA: Key
Curriculum Press.
Jones, K. (2002). Implications for the classroom: Research on the use of dynamic
software. In J. Edwards & D. Wright (Eds.), Integrating ICT into mathematics
classroom (pp. 27-29). Derby: Association of Teachers of Mathematics.
Kaput, J. (1987). Representation and mathematics. In C. Janiver (Ed.), Problems of
representation in the learning of mathematics (pp. 19-26). Hillsdale, NJ, USA:
Lawrence Erlbaum.
Kaput, J. (1992). Technology and mathematics education. In D. Grouws (Ed.),
Handbook of research on mathematics teaching and learning (pp. 515–556).
New York, USA: Macmillan.
Katz, V. J. (2009). A history of mathematics: An introduction (3rd Edition). USA:
Pearson Education.
Kendal, M., & Stacey, K. (1996, June). Trigonometry: Comparing ratio and unit circle
methods. In P. Clarcson (Ed). Technology in Mathematics Education.
Presented at the Proceedings of the 19th Annual Conference of the
Mathematics Education Research Group of Australasia, University of Melborn
(pp. 322-329). Melbourne: MERGA.
Koohang, S. M. (1989). A study of attitudes toward computers: Anxiety, confidence,
liking and perception of usefulness. Journal of Research on Computing in
Education, 22, 137-150.
Laborde, C., Kynigos, K. H., & Strasser, R. (2006). Teaching and learning geometry
with technology. In A. Gutierrez & P. Boero (Eds.), Handbook of research on
470
the psychology of mathematics education: Past, present and future (pp. 275-
304). Rotterdam, Taipei: Sense Publishers.
Lesh, R. & English, L. (2005). Trends in the evolution of models and modeling
perspectives on mathematical learning and problem solving. Zentralblatt für
Didaktik der Mathematik (International Reviews on Mathematical Education,
37(6), 487-489.
Lesh, R. & Sriraman, B. (2005). Mathematics education as a design science.
Zentralblatt für Didaktik der Mathematik (International Reviews on
Mathematical Education), 37(6), 490-505.
Mackrell, K. (2002). Easily construct graphs of functions: Geometer’s Skechpad 4.
MicroMath, 39-42.
Mariotti, M. A. (2000). Introduction to proof: The mediation of a dynamic software
environment. Educational Studies in Mathematics, 44(1-2), 25–53.
Mitchelmore, M., & White, P. (1996, July). Children’s concepts of turning: Dynamic
or static? In L. Puig &A. Gutierrez (Eds.). Presented at the Proceedings of the
20th PME International Conference, University of Valencia, Spain (Vol. 3, pp.
415–421). Spain: PME.
Moore, K. C. (2010). The role of quantitative reasoning in precalculus students
learning central concepts of trigonometry (Unpublished doctoral dissertation).
Arizona State University, USA.
Moore, K. C. (2012). Coherence, quantitative reasoning, and the trigonometry of
students. In R. Mayes & L. L. Hatfield (Eds.), Quantitative reasoning and
mathematical modeling: A driver for STEM integrated education and teaching
in context (pp. 75-92). Laramie, WY: University of Wyoming.
Moore, K. C. (2013). Making sense by measuring arcs: A teaching experiment in angle
measure. Educational Studies in Mathematics, 83(2), 225-245.

471
Moore, K. C. (2014). Quantitative reasoning and the sine function: The case of Zac.
Journal for Research in Mathematics Education, 45(1), 102-138.
Moore, K. C., LaForest, K., & Kim, H. J. (2012, February). The unit circle and unit
conversions. In S. Brown, S. Larsen, K. Marrongelle, & M. Oerthman (Eds.).
Presented at the Proceedings of the Fifteenth Annual Conference on Research
in Undergraduate Mathematics Education, Portland State University (pp. 16-
31). Portland, Oregon: SIGMAA.
National Coincil of Teachers of Mathematics [NCTM]. (2000). Principles and
standards for school mathematics. Reston, VA: National Coincil of Teachers
of Mathematics, Inc.
Noraini, I. (2007). The effect of Geometers’Sketchpad on the performance in geometry
of Malaysian students’ achievement and van Hiele geometric thinking.
Malaysian Journal of Mathematical Sciences, 1(2) 169-180.
Oehrtman, M., Carlson, M., & Thompson, P. W. (2008). Foundational reasoning
abilities that promote coherence in students’ function understanding. In M. P.
Carlson & C. Rasmussen (Eds.) Making the connection: Research and teaching
in undergraduate mathematics education (pp. 27-42). Washington, D.C.:
Mathematical Association of America.
Palmer, M. E. (1980). Trigonometry instruction: An aptitude treatment interaction
study (Unpublished doctoral dissertation). Ohio State University, USA.
Presmeg, N. C. (1994). The role of visually mediated processes in classroom
mathematics. Zentralblatt für Didaktik der Mathematik, 26(4), 114-117.
Sanford, V. (1958). A short history of mathematics. USA: Houghton Mifflin Company.
Sfard, A. (1991). On the dual nature of mathematical conceptions: Reflections on
processes and objects as different sides of the same coin. Educational Studies
in Mathematics, 22, 1-36.
472
Shashaani, L. (1993).Gender-based differences in attitudes toward computers.
Computers and Education, 20, 169-181.
Stage, E. K., Kreinberg, N., Eccles, J. R. & Becker, J. R. (1985). Increasing the
particioation and achievement of girls and women in mathematics, science, and
engineering. In S.S. Klein (Ed.), Handbook for achieving sex equality through
education (pp. 237-269). Baltimore: Johns Hopkins University Press.
Steer, J., Antioneta, M., & Eaton, J. (2009). Trigonometry with year 8: Part 1.
Mathematics Teaching. 42-44.
Steffe, L. P. (1991). The constructivist teaching experiment: Illustrations and
implications. In E. von Glasersfled (Ed.), Radical constructivism in
mathematics education (pp. 177-194), Boston, MA: Kluwer Academic Press.
Steffe, L. P. & Thompson, P. W. (2000). Teaching experiment methodology:
Underlying principles and essential elements. In R. Lesh & A. E. Kelly (Eds.),
Handbook of research design in mathematics and science education (pp. 267-
306). Hillsdale, NJ: Lawrence Erlbaum.
Şahin, Z., Ubuz, B., & Erbaş, A. K. (2010). İlişkisel öğrenme ve teknoloji: Dinamik
geometri yazılımlarıyla sinus fonksiyonunun öğretimi üzerine bir durum
çalışması. IX. Ulusal Fen Bilimleri ve Matematik Eğitimi Kongresi
(UFBMEK9), 23-25 Eylül, Dokuz Eylül Universitesi, İzmir.
Talim ve Terbiye Kurulu Başkanlığı [Board of Education]. (2005). Ortaöğretim
matematik (9-12. sınıflar) dersi öğretim programı [Mathematics curriculum
for the secondary schools: 9-12th grades]. Ankara: Milli Eğitim Bakanlığı
[Ministry of National Education of the Republic of Turkey].
Talim ve Terbiye Kurulu Başkanlığı. (2011). Ortaöğretim matematik (9-12. sınıflar)
dersi öğretim programı [Mathematics curriculum for the secondary schools:
9-12th grades]. Ankara: Milli Eğitim Bakanlığı.
473
Talim ve Terbiye Kurulu Başkanlığı. (2013). Ortaöğretim matematik dersi (9, 10, 11
ve 12. sınıflar) öğretim programı [Mathematics curriculum for the secondary
schools: 9, 10, 11 and 12th grades]. Ankara: Milli Eğitim Bakanlığı.
Tall, D. O. & Vinner, S. (1981). Concept image and concept definition in mathematics
with particular reference to limit and continuity. Educational Studies in
Mathematics, 12, 151-169.
Thompson, K. A. (2007). Students’ understanding of trigonometry enhanced through
the use of a real world problem: Improving the instructional sequence
(Unpublished doctoral dissertation). Illinois State University, USA.
Thompson, P. W. (2008). Conceptual analysis of mathematical ideas: Some
spadework at the foundations of mathematics education. In O. Figueras, J. L.
Cortina, S. Alatorre, T. Rojano & A. Sépulveda (Eds.). Presented at the
Proceedings of the 32nd Conference of the International Group for the
Psychology of Mathematics Education, Morélia, Mexico (Vol 1, pp. 31-49).
Mexico: PME.
Thompson, P. W. (2011). Quantitative reasoning and mathematical modelling. In S.
Chamberlain, L. L. Hatfield, & S. Belbase (Eds.). New perspectives and
directions for collaborative research in mathematics education. Presented at
the Planning Conference for WISDOMe, University of Wyoming (Vol. 1,
pp.33-57). Laramie, WY: Collage of Education, University of Wyoming.
Topçu, T., Kertil, M., Akkoç, H., Kamil, Y., & Osman, Ö. (2006, July). Pre-service
and in-service mathematics teachers' concept images of radian. In J. Novotmi,
H. Moraovci, M. Krcitkci & N. Stehlikovci (Eds.). Presented at the Proceedings
of the 30th Conference of the International Group for the Psychology of
Mathematics Education, Charles University in Prague (Vol. 5, pp. 281-288).
Prague: PME.

474
Ubuz, B., Üstün, I., & Erbaş, A. K. (2009). The effect of a dynamic geometry
environment on immediate and retention level achievements of seventh grade
students. Eğitim Araştırmaları-Eurasian Journal of Educational Research, 35,
147-164.
Weber, K. (2005). Students' understanding of trigonometric functions. Mathematics
Education Research Journal , 17 (3), 91-112.
Weeden, M. (2002). Proof, proof, and more proof. MicroMath, 18(3), 29-32.
Zazkis, R., Dubinsky, E. & Dautermann, J. (1996). Coordinating visual and analytic
strategies: A study of students’ understanding of the group D4. Journal of
Research in Mathematics Education, 27, 435-457.

475
APPENDIX A
A. INITIAL INTERVIEW QUESTIONS
(Q1) Matematikteki fonksiyonu kendi cümlelerinizle tanımlayınız.
(Q2) Küçük bir salyangoz bir parça kâğıt üzerinde aşağıda görülen yolu takip ederek
yürüyor.
Salyangozun kâğıt üzerindeki konumunu, zamana bağlı bir fonksiyon olarak
ifade edebilir miyiz? Cevabınızın nedenini açıklayınız.
Zamanı, salyangozun kâğıt üzerindeki konumuna bağlı bir fonksiyon ifade
edebilir miyiz? Cevabınızın nedenini açıklayınız.
(Q3) Aylin hafta sonu gittiği lunaparkta dönme dolabın kırmızı renkli salıncağına
biniyor; ve dönme dolabın hareketi süresince zamana göre yerden yüksekliğinin
nasıl değiştiğini düşünüyor. Aylin’in bindiği salıncağın yerden yüksekliği zamana
bağlı olarak nasıl değişir? Ne dersiniz, bu değişim bir fonksiyon olur mu?
Olursa neden olur?
Olmazsa neden olmaz?
Açıklayınız.
(Q4) Trigonometrideki birim çemberi kendi cümlelerinizle tanımlayınız.

476
(Q5) “sinüs” ve “kosinüs” deyince aklınıza neler geliyor? Açıklayınız.
(Q6) 𝑓: 𝑅 → 𝑅 ve 𝑓(𝑥) = 2𝑐𝑜𝑠𝑥 fonksiyonu veriliyor. Aşağıdaki noktaları dik
koordinat düzleminde gösteriniz.
(30, 𝑓(30))
(π, 𝑓(𝜋
6))
(1,𝑓(𝜋
3))
(Q7) 𝑓: 𝑅 → 𝑅 ve 𝑓(𝑥) = 𝑠𝑖𝑛𝑥 fonksiyonu veriliyor. 𝑓(𝑥) = −√3
2 eşitliğini sağlayan
en büyük negatif sayı kaçtır?
en küçük pozitif sayı kaçtır?
(Q8) Aşağıdaki grafiği inceleyiniz. Bu grafik hangi fonksiyonun grafiği olabilir?
Açıklayınız.
477
APPENDIX B
B. PARENTAL PERMISSION FORM

478

479
APPENDIX C
C. MODELING TASK
Dönme Dolap
İngiltere’nin başkenti Londra’daki
“London Eye” ismiyle bilinen dönme dolap
Londra’yı kuşbakışı izlemek isteyenler için
tavsiye edilmektedir. 1999 yılında inşa edilen
ve dünyanın en büyük dönme dolaplarından
birisi olan yapı, yıllık 4 milyon civarında
ziyaretçisiyle Londra’nın önemli turizm
kaynaklarından biri haline gelmiştir. 135
metre yüksekliğindeki bu dönme dolap her
biri 25 kişi kapasiteli, içinde insanların
rahatça dolaşabileceği genişlikte 32
kapsülden oluşmaktadır. Dönme dolabın bir
diğer özelliği de hiç durmadan hareketine
devam etmesidir. Yani yolcu indirmek ya da
bindirmek için durmayan dolap, insanların yer
seviyesinde kapsüllere rahatlıkla inip binebileceği kadar yavaş hareket etmektedir.
Londra’daki bu yapıyı inceleyen ve müşteri potansiyelinden etkilenen bir yatırımcı,
benzer bir dönme dolabı İstanbul’da Çamlıca tepesine yapmaya karar veriyor. Çapı 140 metre
olması planlanan dönme dolap, yerden yüksekliği 4 metre olan bir platform üzerine
kurulacaktır. Dönme dolap üzerine eşit aralıklarla her biri 25 kişi kapasiteli 36 kapsülün
yerleştirilmesi düşünülmektedir. Dönme dolabın bir tam turunu tamamlama süresi 30 dakika
olarak planlanmaktadır. Kapsüllerin içerisine yerleştirilecek olan elektronik göstergelerde
müşteriye anlık olarak aktarılması planlanan bilgiler şunlardır:
Yerden yükseklik,
Kapsüle bindikleri noktaya olan uzaklık,
Hız,
Bir tam turun tamamlanmasına ne kadar zaman kaldığı (bir tam turun bitmesine
1 dakika kala yolcuların iniş hazırlığı için erken uyarı devreye girecektir).
Bu bilgileri anlık hesaplayabilecek yazılımı geliştirecek bilgisayar programcısına
yardımcı olmanız istenmektedir. Bu çerçevede, programcıya bu bilgilerin matematiksel olarak
nasıl hesaplanabileceği konusunda bir yöntem öneriniz.

480
481
CURRICULUM VITAE
PERSONAL INFORMATION
Surname, Name : Şahin (Kabalak), Zülal
Nationality : Turkish (TC)
Date and Place of Birth : 25 April 1979, Ankara
Marital Status : Married
Phone : +90 312 210 75 03
Fax : +90 312 210 79 71
Email : [email protected], [email protected]
EDUCATION
Doctor of Philosophy, Mathematics Education, Middle East Technical University,
Ankara, October 2015.
Master of Science, Mathematics (Algebra), Hacettepe University, Ankara, June 2005.
Bachelor of Science, Mathematics Education, Gazi University, Ankara. September
2000.
WORKING EXPERIENCE
Years Place Enrollment
2001-2004 Elementary School, Ankara Mathematics Teacher
2004-2008 Secondary School, Ankara Mathematics Teacher
2008-2015 METU, Ankara Research Assistant

482
PUBLICATIONS
Kabalak, Z. (2005). Bir radikal halkanın adjoint grubu ve lie halkası üzerine
çalışmalar (Unpublished master thesis). Hacettepe University, Graduate
school of Natural and Applied Sciences, Ankara, Turkey.
Şahin, Z., Ubuz, B., & Erbaş, A. K. (2010). İlişkisel öğrenme ve teknoloji: Dinamik
geometri yazılımlarıyla sinus fonksiyonunun öğretimi üzerine bir durum
çalışması. IX. Ulusal Fen Bilimleri ve Matematik Eğitimi Kongresi
(UFBMEK9), 23-25 Eylül, Dokuz Eylül Üniversitesi, İzmir.
Ubuz, B., Didiş, M. G., Şahin, Z., & Öçal, M. F. (2010). Doktora öğrencilerinin
eleştirel düşünme becerilerinin gelişiminde derslerin etkisi. IX. Ulusal Fen
Bilimleri ve Matematik Eğitimi Kongresi (UFBMEK9), 23-25 Eylül, Dokuz
Eylül Üniversitesi, İzmir.
Yenmez, A. A., & Şahin, Z. (2011). Derivative and relational understanding: A case
study with graduate students from mathematics education. I. Eğitim Bilimleri
Öğrenci Araştırmaları Sempozyumu, 9-10 Eylül, Kayseri.
Didiş, M. G., & Şahin, Z. (2011). Graduate students’ perceptions: How do the articles
used in courses affect their critical thinking? 21. Emerging Researchers' Group
(for presentation at Emerging Researchers' Conference), 12-16 September,
Berlin.
Şahin, Z., Yenmez, A. A., & Erbaş, A. K. (2011). Türev ve değişim oranının
kavramsallaştırılması: Matematik eğitimi yüksek lisans öğrencileri ile bir
durum çalışması. Matematikçiler Derneği 10. Matematik Sempozyumu, 21-23
Eylül, Işık Üniversitesi, İstanbul.
Şahin, Z., Aydoğan Yenmez, A., & Erbaş, A. K. (2013). Dinamik geometri
yazılımlarının öğrencilerin trigonometri öğrenimlerindeki öz-düzenleme
stratejilerine etkisi: Bir öğrenme deneyi. 1. Türk Bilgisayar ve Matematik
Eğitimi Sempozyumu, 20-22 Haziran, Karadeniz Teknik Üniversitesi, Trabzon.
483
Sahin, Z., & Erbas, A. K. (2014). Are core trigonometric functions well-defined on
students' concept images? I. Eurasian Educational Research Congress, 24-26
April, Istanbul University, Istanbul.
Sahin, Z., & Cansu Kurt, U. (2014). Grafikler üzerine öğrenci düşünme süreçlerine
dair pedagojik alan bilgisi: Hizmet içi lise matematik öğretmenleri ile bir
durum çalışması. I. Eurasian Educational Research Congress, 24-26 April,
Istanbul University, Istanbul.
Şahin, Z., Yenmez-Aydoğan, A., & Erbaş, A. K. (2015). Understanding the concept
of derivative: A case study with mathematical modeling. EURASIA Journal of
Mathematics, Science & Technology Education, 11(1), 177-188. Doi:
10.12973/eurasia.2015.1149a


![ALGEBRA 2/TRIGONOMETRY - Regents ExaminationsAlgebra 2/Trigonometry – June ’16 [16] 34 On the Algebra 2/Trigonometry midterm at Champion High School, the scores of 210 students](https://img.pdfslide.us/doc/110x75/5e961bd25ebb3b6007745f13/algebra-2trigonometry-regents-examinations-algebra-2trigonometry-a-june-a16.jpg)