Embed Size (px)
Citation preview

Cognitive Ability, Financial Literacy, and the Demand for Financial Advice at
Older Ages: Findings from the Health and Retirement Study
Hugh H. Kim, Raimond Maurer, and Olivia S. Mitchell
January 2018
PRC WP2018
Pension Research Council Working Paper
Pension Research Council
The Wharton School, University of Pennsylvania
3620 Locust Walk, 3000 SH-DH
Philadelphia, PA 19104-6302
Tel.: 215.898.7620 Fax: 215.573.3418
Email: [email protected]
http://www.pensionresearchcouncil.org
The authors thank Yong Yu for excellent programming and research assistance. This project was
sponsored by the TIAA Institute and the Pension Research Council/Boettner Center at the
Wharton School of the University of Pennsylvania. Opinions and conclusions expressed herein
are solely those of the authors and do not represent the opinions or policy of the funders or any
other institutions with which the authors are affiliated. ©2018 Kim, Maurer, and Mitchell. All
rights reserved.

2
Cognitive Ability, Financial Literacy, and the Demand for Financial Advice at Older Ages:
Findings from the Health and Retirement Study
Hugh H. Kim, Raimond Maurer, and Olivia S. Mitchell
Abstract
This paper evaluates how cognitive ability and financial literacy shape the demand for
financial advice at older ages. We analyze a new module of the Health and Retirement Study
which queried older respondents about their usage of financial advice and other financial
management activities. Results show that cognitive ability and financial literacy are often
positively correlated with advice-seeking for financial matters. Generally speaking, the more
cognitively able tend to seek financial advice from professionals outside of family members;
nevertheless, they are also more likely to be overconfident regarding their investments. The more
financially literate also tend to ask for help with money management, but they are less likely to
be overconfident. Overall, our findings are suggestive that cognitive ability as well as financial
literacy can help shape older persons’ money management behaviors.
JEL: D14, G11, G41, J26
Keywords: financial advice, cognitive ability, older population, money management,
Health and Retirement Study
Hugh H. Kim
Moore School of Business
University of South Carolina
1014 Greene St.
Columbia, SC 29208, USA
Raimond Maurer
Goethe University
House of Finance
Theodor-W.-Adorno-Platz 3
D – 60323 Frankfurt
Olivia S. Mitchell
The Wharton School, University of
Pennsylvania
3620 Locust Walk, 3000 SH-DH
Philadelphia, PA 19104

3
Cognitive Ability and the Demand for Financial Advice at Older Ages:
Findings from the Health and Retirement Survey
1. Introduction
The last four decades have witnessed a long-term trend toward disintermediation of
retirement saving and dissaving, as defined benefit pensions have given way to defined
contribution plans all over the world. Such disintermediation efforts can, however, be thwarted by
peoples’ lack of financial sophistication, as attested to by extensive research around the globe on
financial illiteracy (Lusardi and Mitchell, 2014). Moreover, the financially illiterate may have a
very difficult time setting spending goals, paying debt, deciding how much and where to invest,
determining when to stop working and when to claim their Social Security and pension payouts,
and how to handle insurance needs over the lifetimes.
Shifting the risks to individuals of saving too little, investing unwisely, and outliving their
assets does not make such risks disappear. Consequently, it is not surprising that people seek out
financial advisors to get help managing their planning and saving (Doyle, 2010). Moreover, older
individuals often experience declining cognitive ability (H,n 1968; Schroeder and Salthouse, 2004)
and make sub-optimal investment decisions (Agarwal et al., 2009). At the same time, many older
individuals have accumulated sizable wealth over their lifetimes. Consequently, declining
cognitive ability can pose a challenge for individuals and their families, and can also raise
important policy questions related to how to supervise and regulate financial fraud (Hammond et
al., 2017).
Prior research on individual investors’ cognitive ability and financial management has
focused primarily on stock market participation. Many studies have concluded that people with
high cognitive ability are more likely to participate in the stock market (e.g., Cole and Shastry,
2014; Kézdi, Michigan, and Willis, 2003; van Rooij, Lusardi, and Alessie, 2011; Christelis,
Jappelli, and Padula, 2010). Additionally, some authors conclude that people with high cognitive

4
ability exhibit superior investment skills (Grinblatt, Keloharju, and Linnainmaa, 2011). Particularly
pertinent to our interest, older investors have been shown to lose investment skills as their cognitive
ability declines (Korniotis and Kumar, 2011).
Naturally, if people with low cognitive ability lack investment skills, they may be able to
overcome this limitation by delegating complicated financial management to investment
professionals (Kim, Maurer, and Mitchell, 2016; 2017). Nevertheless, cognitive ability may affect
the decision to delegate, since delegation itself can also be a complicated process requiring
screening/monitoring financial advisors’ performance. For this reason, we investigate the role of
cognitive ability in shaping older persons’ demand for finance advice using a purpose-built module
fielded in the 2016 Health and Retirement Study (HRS). Our aim is to provide new insights into
older individuals’ need for, and willingness to pay for, help with managing spending and financial
demands.
Our results show that cognitive ability and financial literacy as measured in the HRS often
are associated with financial behaviors when other controls are not held constant. Yet the statistical
associations are attenuated when age, education, race/ethnicity, and other factors are controlled.
Focusing only on significant factors, we find that people scoring higher on the cognitive questions
by one standard deviation are 52% more likely to avoid advice due to self-confidence and 50%
more likely not to know whom to ask for help, with other factors controlled. Financial literacy
generally serves as a significant factor in explaining a broader set of behaviors related to investment
and seeking financial advices: the more financially literate by one standard deviation are 13% more
likely to spend time managing their finances; 10% more likely to get help with money management;
29% less likely to avoid asking for help due to self-confidence; and 21% less likely not to know
whom to ask for help. By contrast, neither Cognitive nor FinLit scores are significantly associated
with money management behaviors, including the number of self-management activities people

5
undertook, or with reasons for why they did not self-manage their money. And the financially
savvier and more cognitively able individuals are also no better able to get financial advice, advice
regarding a variety of financial tasks, free help, or follow the advice when given. The reader is
cautioned, however, that sample sizes are sufficiently small that these conclusions are as yet
tentative.
In what follows, Section 2 summarizes key prior studies on cognitive ability and financial
management. Section 3 develops several questions regarding the empirical relationships between
cognitive ability and the demand for financial advice. Next, Section 4 describes the HRS module
we developed and provide descriptive statistics on key variables. Section 5 reports our regression
results and a final section concludes.
2. Related Studies
Three related threads in the literature may be identified as relevant to our research: work
on rational delegation and inattention, analysis of financial illiteracy, and inquiries into the
complex institutional environment in which older persons must make financial decisions.
In our own prior analyses (Kim, Maurer and Mitchell, 2016; 2017), we showed that
individuals will rationally devote little or no attention to their retirement portfolios early in their
lifecycles. 1 This is particularly true when managing one’s portfolio is time consuming, and
devoting attention to it reduces the opportunity to invest in on-the-job training. Since people who
manage their own investments will do so at the cost of future earnings growth, employees can
benefit from hiring financial advisors to reduce the cost of managing their own finances. Naturally,
1 Of course there are many theoretical papers which postulate that a rational fully-informed forward-looking individual
can make optimal decisions regarding interrelated fields (saving, portfolio choice, asset location, benefit claiming),
taking into consideration individual factors such as preferences (risk, time, leisure, bequest, intertemporal substitution,
loss aversion), mortality, health and family status (e.g., Cocco et al., 2005, Gomes et al., 2008, Hubener et al., 2016,
and Horneff et al., 2016)

6
delegating one’s investments to an advisor entails a cost, so the tradeoff must be reevaluated over
the life cycle. Young workers tend not to have saved much, but they have the longest horizon over
which to reap the rewards of good financial advice. Older individuals may value input from
financial advisors to the extent that they experience declining mental faculties making it more
difficult to do a good job.
A second reason people may seek financial advice at older ages is that many are financially
illiterate. Not only can many people not answer simple finance and economics questions, but they
also fail to access expected higher-return investments (Lusardi and Mitchell, 2014; 2017; Clark et
al., 2015). Somewhat surprisingly, and despite objective confirmation of an age-linked decline in
financial capability, older persons’ confidence in their financial ability rises with age, reaching a
peak at about age 88.2 As a result, it becomes quite important for older persons to seek reliable
financial advisors who can help their clients make good financial decisions and prevent the most
vulnerable from being defrauded of their wealth at older ages. To this point, there is now a
substantial literature on the consequences of poor financial capability in later life. For instance, the
FINRA Investor Education Foundation (2013) found that over 80% of adults of all ages had been
solicited for potentially fraudulent offers, while older Americans were most likely to be the targets
and likely to lose money when targeted. Still others have pointed out that it can be difficult to
separately identify the individual effects of aging, financial illiteracy, and socioeconomic status on
peoples’ susceptibility to financial fraud (DeLiema et al., 2017).
A third reason that older persons may seek financial advice is that institutional complexity
bedevils the decisions people must confront when planning for, making provision for, and moving
into retirement. In the US, for instance, rules regarding when to claim one’s Social Security benefits
are extremely complicated, particularly if one has a spouse who is also entitled (or will be entitled)
2 Authors’ computations using the Health and Retirement Study.

7
to Social Security benefits (Kotlikoff et al., 2016). There are numerous and extremely complex
regulations regarding how much people may save in tax-qualified retirement saving accounts,
when one can make penalty-free payouts, and when one must begin taking required minimum
distributions from these accounts (Horneff et al., 2016). These realities are particularly challenging
when peoples’ cognitive ability regarding financial decision making declines with age. As one
example, Finke et al. (2015) reported a sharp downward trend with age in financial literacy scores
regarding economic and finance basics including borrowing, insurance, and investments.3
There is also a separate literature showing how financial advisors influence their advisees’
outcomes, though that research does not focus on older individuals per se. Shapira and Venezia
(2001) posited that retail investors suffer from behavioral biases including the disposition effect,
or the tendency to sell winning stocks too early and not to sell losing stocks until too late. They
reported that financial advisors were effective in protecting investors against this outcome. 4
Kramer (2012) found that portfolios advised by financial advisors were less prone to home bias, or
investor over-concentration in their own country. Financial advice can also help with estate
planning and tax management (Cici et al., 2017). Bhattacharya et al. (2012) showed that portfolio
risk-return efficiency improved for those who actually followed the advice but did not for those
who received but did not follow the advice. Using a Dutch household survey, von Gaudecker (2015)
reported that households who engaged professional advisors achieved significant portfolio
diversification benefits, measured in terms of return loss, similar to findings by Calvet et al. (2007).
3 Other examples are provided in Hammond et al., (2017). 4 Other studies have emphasized a negative result from hiring financial advisors, though few are specific to the
retirement planning context. For instance, Bergstresser et al. (2009) and Del Guercio and Reuter (2014) reported that
broker-sold mutual funds underperformed direct-sold mutual funds. Hackethal et al. (2012; 2013) studied independent
financial advisors and bank-affiliated advisors in Germany; that study reported that accounts advised by both types of
advisors did not generated higher risk-adjusted returns than those without advice. Using data from a large Swiss bank,
Hoechle et al. (2017) found that trades advised by financial advisors underperformed trades initiated by account holders.
One of the very few analyses of retirement plans (Chalmers and Reuter, 2015) concluded that broker-advised
retirement accounts had lower risk-adjusted returns because of high-fee investments, in the context of the Oregon State
University System Retirement Plan.

8
That literature also suggests that investors receiving financial advice are generally older,
wealthier, and more financially savvy (Hackethal et al., 2012; Hackethal and Inderst, 2013).
Moreover, there is evidence that better-informed individuals tend to seek financial advice because
they have a clearer understanding of how the marketplace for financial advice works (Calcagno
and Monticone, 2015). Limited-information processing capacity is also an important factor in
financial decisions (Christelis et al., 2010; Bertrand and Morse, 2011), but as yet no studies have
linked cognitive ability and peoples’ willingness to take financial advice. Present-bias can also be
quite extreme, such that people tend to procrastinate hiring financial advisors as long as they can
(O’Donoghue and Rabin, 1999). Commission-based advisors are an important source of
information for sophisticated investors (Inderst and Ottaviani, 2012), but people tend not to accept
advice when it is provided free (Gino, 2008).5
Based on existing studies, then, we conclude that relatively little is known about the links
between cognitive ability, financial literacy, and the probability of seeking financial advice at older
ages, as well as the type of advice sought. In the next section, we describe several factors that might
relate financial behaviors and the key variables of interest here, using new data from the HRS.
3. Potential Predictions regarding Financial Behaviors
Whether cognitive ability is positively or negatively associated with seeking financial
advice is unclear from a theoretical perspective. If older investors recognize that their ability to
manage financial asset is diminished, they would rationally delegate managing their finances to
others (Kim, Maurer, and Mitchell, 2016). But if they mistakenly believe that their acumen remains
intact, they will continue managing their assets at older ages.
5 The literature also discusses the possibility of conflicts of interest ; see Inderst and Ottaviani (2012), Stoughton et
al. (2011), Bolton et al. (2007), Piccolo et al. (2016), Hackethal et al. (2012)

9
It is also likely that more cognitively able investors who do seek help will get help on
investment decisions more than simpler subjects such as cash management. They may be more
likely to be overconfident and distrust others’ advice. We are also interested in the links between
cognitive ability and the types of financial help people seek, along with whether people follow the
investment advice they receive. Accordingly, it is possible that the more cognitively able will be
more likely to get help from professional advisors rather than others, and they will follow advice
when it is given.
Last, we are interested in ascertaining whether financial literacy has an independent effect
on the three financial behaviors of interest here, after controlling on cognitive ability. That is, those
who are more financially sophisticated may be more likely to self-manage their financial affairs,
less like to request financial help, and more likely to get help from professionals when help is
sought. Accordingly, we investigate whether more financially literate individuals will tend to self-
manage their financial affairs and request financial help infrequently, yet they receive help from
professionals versus others when help is sought. Next, we turn to operationalizing an empirical
examination of these propositions.
4. Experimental Module in the HRS
To examine the relationships of interest, we have designed and fielded an experimental
module in the 2016 HRS asking how older people (> age 50) manage their financial affairs.6 Some
1,180 age-eligible people participated in the module. To this information we also link data on each
respondent taken from the core HRS; these variables include financial literacy, education, wealth,
age, race/ethnicity, and marital status. The core HRS also provides a measure of cognitive ability
that is widely used in the literature, defined as the sum of the respondent’s total word recall and
6 Results reported herein include all respondents to the 2016 except the Late Baby Boomers who will be included in
a future release of the 2016 data.

10
mental status indices, evaluated in 2016.7 As indicated in Table 1, the average Cognition score is
23.93 with a standard deviation of 4.23. Financial literacy (FinLit) score is measured as the sum of
correct answers on four financial literacy questions based on those developed by Lusardi and
Mitchell (2014). In this population, the average score is 2.1 (with a standard deviation of 0.91).
The Cognition and FinLit score are positively related, with a Pearson correlation coefficient
between the Cognition and FinLit scores of 0.32 (significant at the 1% level).
Table 1 here
The HRS module on older people’s financial behaviors asked questions which we consider
in three groupings. The first grouping of questions asked people whether they received any type
of financial advice, and if not, why not. The second grouping asked whether people self-manage
their money. That is, respondents were asked whether they engaged in financial activities in the
last year if they engaged in sophisticated investment decisions (e.g., investments and withdrawals),
and if they did not engage in any self-management, why they did not. The third and final grouping
of questions asked respondents to identify the types of financial advice they received when
managing their money, and whether they paid for professional help.
Summary statistics and variable definitions of these financial behaviors appear in Table 1,
where it will be noted that sample sizes for specific questions differ depending on whether
respondents met the right conditions given precursor questions. 8 For instance, the first two
questions covered the full sample of module respondents: half indicated that they did devote time
to managing their finances in the last year, and one third (34%) indicated they got advice on money
management. Of those who did get financial advice, half received advice on investments, and on
7 See St. Clair et al. (2011). The cognitive functioning measure includes performance on immediate and delayed word
recall, serial 7’s test, counting backwards, naming tasks (e.g., date-naming), and vocabulary questions. The mental
status index sums scores from counting, naming, and vocabulary tasks. The total cognition score sums the total recall
and mental status indices. For further detail see Fisher et al. (2017). 8 All data are weighted using the 2014 weights as the 2016 weights were not available as of this writing.

11
average people received this help within the past year. Focusing on the respondents who did not
receive financial advice, 4% believed they were confident enough to manage the money on their
own; 3% indicated they did not trust advisors, and 3% indicated they did not know whom to ask.
Turning to the second block of financial behaviors in Table 1, on average people undertook
about 1.45 activities in doing their own money management, and 41% engaged in activities more
sophisticated than simply managing their checking accounts. Only 7% of those who did not self-
manage their own finances indicated that inertia was a reason for not asking for advice.
The third block of financial behaviors focuses on those who did receive financial advice
and investigates what types of help they received. A large majority (71%) of those who received
financial advice got it from a professional advisor, and 76% received help from a professional or
other nonfamily member. A sizeable fraction, 14%, received free professional advice with potential
conflicts of interests. Of those receiving advice, the average number of advisors was 1, who
provided help with an average number of 1.58 different types of financial tasks. Interestingly, of
those who received this advice, people reported that they mostly did act on the advice given.9
Turning to the control variables beyond cognition and financial literacy, we note that the
sample averaged 68.11 years of age and 45% of the sample were male. Most were White (85%) or
Hispanic (9%); a majority (62%) of respondents were married. Education averaged is 13.58 years,
and the sample held an average of net non-housing wealth of about $156,000 and housing net
wealth of $139,000.
5. Results and Discussion
Our empirical strategy examines how financial behaviors of interest are related to
respondents’ cognitive ability and financial literacy, holding constant other controls. When the
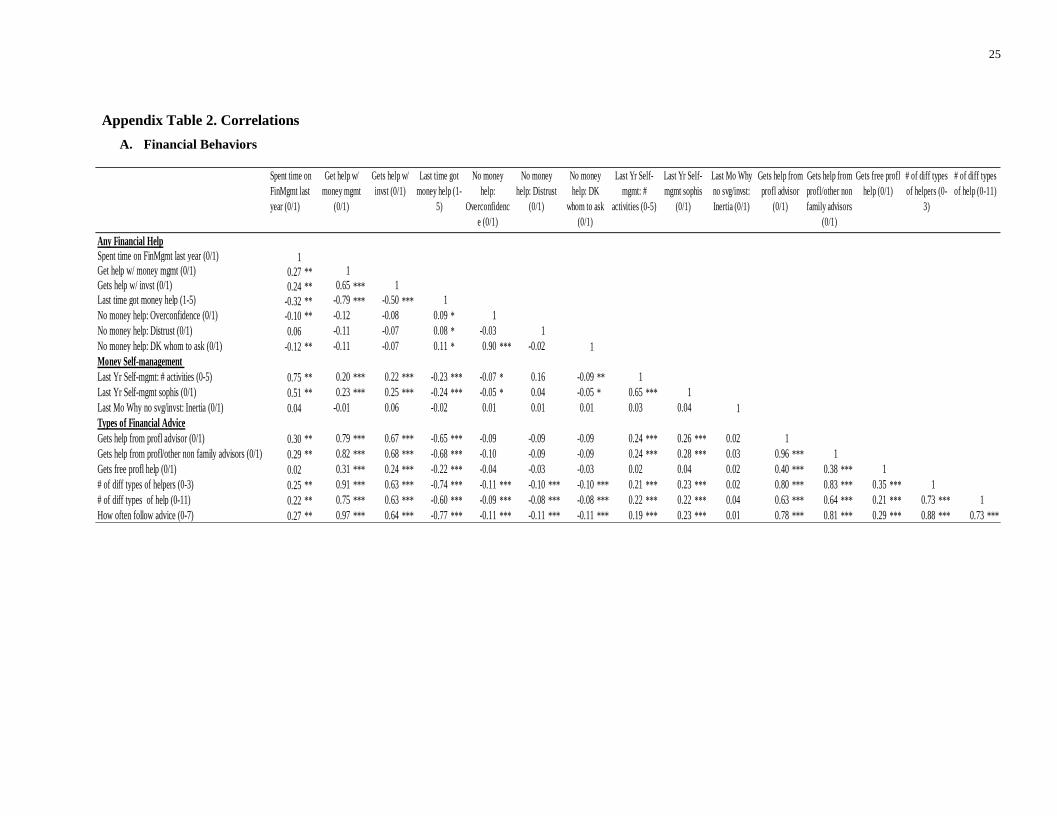
9 Appendix 2 presents correlation matrices for the financial behavior and control variables.

12
dependent variable is continuous, we use OLS; if the dependent variable is binary, we estimate
probit models:
Pr(𝑌𝑖 = 1|𝑋𝑖) = Φ(𝑏 × Cognition score𝑖 + 𝑐 × FinLit + 𝛿′𝑋𝑖), (1)
where i indexes each respondent, and Φ(∙) is the standard normal cumulative distribution of the
probit model. To mitigate potential confounding effects, we also control for the other factors noted
above. Standard errors are clustered at the household level, and all results use the 2014 HRS person
weights.10
5.1 Factors associated with getting financial advice
Table 2 identifies which factors are associated with spending time on financial management,
getting financial advice, and not getting advice. In each case, we first report results using only the
Cognition and the FinLit scores, followed by a second column of estimates including the vector of
all controls.
Table 2 here
A first observation is that Cognition scores are generally positive and statistically
significant when only the two main regressors are included. Nevertheless, when other controls are
added, the marginal effects of Cognition score become attenuated and less statistically significant.
Overall, in Table 2, cognition remains statistically significant for only two behaviors: No Money
Help: Overconfidence, and NoMoneyHelp: DK. In other words, people scoring higher on
Cognition variable (by one standard deviation) are 52% more likely to avoid advice due to self-
confidence (4.23×0.5% on a base of 4.1%), and they are 50% more likely not to know whom to
ask for help (4.23×0.4% on a base of 3.4%).
The FinLit score variable is also related to a range of financial behaviors of interest, but
now this persists even after including the additional controls. That is, the more financially literate
10 The 2016 weights will be made available in a subsequent releast.

13
(by one standard deviation) are 13% more likely to spend time managing their finances (0.91×7%
more on a base of 50%); 10% more likely to get help with money management (0.91×3.7% on a
base of 34%); 29% less likely to avoid asking for help due to self-confidence (0.91×-1.3% on a
base of 4.1%); and 21% less likely not to know whom to ask for help (0.91×-1% on a base of
3.4%).
In other words, holding other factors constant, being financially literate is more strongly
associated with spending time on managing one’s finances and receiving financial advice, than is
scoring better on cognitive tests at the margin. Having a higher Cognitive score is not significantly
related to the probability of managing one’s own money or getting help with money management,
though it is associated with eschewing financial advice due to overconfidence and lack of
knowledge on whom to ask. This result, however, does not imply that cognitive ability plays no
role in shaping the demand for financial advice. Rather, as we shall see, Cognition scores are
related to whom to ask financial advice, explored in the section 5.3.
5.2 Factors associated with money self-management
In Table 3 we examine the factors associated with money self-management behaviors. Here
too, we explore the relationships first including only the Cognition and the FinLit scores, and then
we add the other controls.
Table 3 here
Overall, in both of the columns and for all three behaviors, no estimates are significantly
different from zero for either the Cognition or FinLit variables. Part of the explanation may be that
the sample sizes for these behavioral outcomes are much smaller due to small sample sizes: that is,
few respondents appear in the relevant outcome categories.11 In any case, there is no evidence that
11 We anticipate having a larger sample size when the 2016 release is expanded to include the new cohorts.
14
either Cognition or FinLit scores are strongly associated with the number of self-management
activities people undertook or the reasons why they did not self-manage their money.
5.3 Factors associated with types of financial advice sought
Table 4 evaluates whether cognitive ability is related to the type of financial advice that
people seek. As before, we first employ a lean set of regressors – Cognition and FinLit scores –
and the subsequent column includes all controls.
Table 4 here
Once again the results tell a similar story. In only a single case is the respondent’s cognition
score associated significantly with an outcome, namely getting help from a professional or non-
family advisor. A one standard deviation increase in the Cognition score is related to 7.2% increase
in receiving financial advice from professional money managers outside of family members. There
is no significant association between the FinLit score and any of the outcomes under investigation.
Accordingly, it does not appear that financially savvier or more cognitively able individuals get
free help as well as advice regarding a larger set of financial tasks. And finally, the two control
variables of interest are not statsitically associated with people saying they follow the advice when
provided. We remind the reader, however, that sample sizes here are quite small, so that these
findings must remain tentative until the sample including the new cohort can be investigated.
Taken as a whole, Table 4 suggests that more cognitively able individuals do tend to seek
professional advisors rather resorting to family, relatives, or friends. Combined with the previous
section's result that cognitive ability is uncorrelated with the likelihood of seeking financial advice,
we conclude that cognitive ability is related to the quality rather than the quantity of financial
advice sought.

15
6. Conclusions
It is important to build an understanding of how older persons make key financial decisions,
in light of population aging and because financial products and decisions that must be made during
the latter part of life are increasingly complex. Moreover, given the demographic transition, many
older persons will need to rely on financial advice during retirement over time. This paper has
explored the relationship between two factors important in an aging population, cognitive ability
and financial literacy, and the types of financial management decisions that older persons undertake.
Overall, our findings suggest that cognitive ability as well as financial literacy can help
shape older persons’ money management behaviors, though financial literacy appears to be related
to a broader set of observed financial behaviors in our dataset. We also conclude that the more
cognitively able in the older population tend to seek financial advice from professionals outside of
family members; nevertheless, they are also more likely to be overconfident regarding their
investments. The more financially literate tend to ask for help with money management and they
are less likely to be overconfident.
In light of the fact that financial advice encompasses a wide range of financial management
tasks, it will be increasingly important for analysts to develop better ways to evaluate financial
advisor performance. Our own future research will revisit these themes with a larger sample of
respondents to the HRS experimental module, and we will also investigate the possibility that
Cognition and FinLit scores might be endogenously determined. This research will offer insight
into who seeks financial advice when, as well as much-needed information on financial
management practices among older households.

16
References
Agarwal, S., J. Driscoll, X., Gabaix, D., Laibson (2009), “The Age of Reason: Financial Decisions
over the Life Cycle and Implications for Regulation.” Brookings Papers on Economic
Activity Fall: 51–101.
Bergstresser, D., J. Chalmers, and P. Tufano (2009). “Assessing the Costs and Benefits of Brokers
in the Mutual Fund Industry.” Review of Financial Studies 22:4129–56.
Bertrand, M, A. Morse (2011). “Information Disclosure, Cognitive Biases, and Payday Borrowing.”
Journal of Finance 66(6): 1865–1893.
Bhattacharya, U., A. Hackethal, S. Kaesler, B. Loos, and S. Meyer (2012). “Is Unbiased Financial
Advice to Retail Investors Sufficient? Answers from a Large Field Study.” Review of
Financial Studies 25: 975–1032.
Bolton, P., X. Freixas, J. Shapiro (2007). “Conflicts of Interest, Information Provision, and
Competition in the Financial Services Industry.” Journal of Financial Economics 85(2):
297–330.
Calvet, L. E., J.Y. Campbell, and P. Sodini (2007). “Down or Out: Assessing the Welfare Costs of
Household Investment Mistakes.” Journal of Political Economy 115:707–47.
Calcagno, R., C. Monticone (2015). “Financial Literacy and the Demand for Financial Advice.”
Journal of Banking and Finance 50: 363–380.
Chalmers, J., and J. Reuter (2015). “Is Conflicted Investment Advice Better than No Advice?"
NBER working paper No. 18158.
Christelis, D., T. Jappelli, and M. Padula (2010). “Cognitive Abilities and Portfolio Choice.”
European Economic Review 54:18–38.
Cici, G., A. Kempf, and C. Sorhage (2017). “Do Financial Advisors Provide Tangible Benefits for
Investors? Evidence from Tax-Motivated Mutual Fund Flows.” Review of Finance 21:637–
665.
Clark, R. L., A. Lusardi, and O. S. Mitchell. (2015). “Financial Knowledge and 401(k) Investment
Performance.” Journal of Pension Economics and Finance November: 1–24.
Cocco, J., F. Gomes, and P. Maenhout. (2005). “Consumption and Portfolio Choice over the Life
Cycle.” Review of Financial Studies 18: 491–533.
Cole, S., and G. K. Shastry. 2014. “Smart Money? The Effect of Education on Financial
Outcomes." Review of Financial Studies 27(7): 2022-2051.
Deliema, M., G. Mottola, M. Deevy (2017). “Findings from a Pilot Study to Measure Financial
Fraud in the United States.” Working paper.
Diane Del, G., J. Reuter (2014). “Mutual Fund Performance and the Incentive to Generate Alpha.”
Journal of Finance 69(4): 1673–1704.
Doyle, B. (2010). “Segmenting US Investors.” Forrester Research, July 19.
Finke, M.S., J.S. Howe, and S.J. Huston (2015). “Old Age and the Decline in Financial Literacy.”
Management Science. 63: 213-230.
FINRA Investor Education Foundation (2013). “Financial Fraud and Fraud Susceptibility in the
United States.” Research Report from a 2012 National Survey. Applied Research and
Consulting: New York, NY.
Fisher, Gwenith G., Halimah Hassan, Jessica D. Faul, Willard L. Rodgers, and David R. Weir.
(2017). HRS Imputation of Cognitive Functioning Measures: 1992 – 2014 Data
Description (Final Release Version).
http://hrsonline.isr.umich.edu/modules/meta/xyear/cogimp/desc/COGIMPdd.pdf
Gino, F. (2008). “Do We Listen to Advice Just Because We Paid for It? The Impact of Advice Cost
on Its Use.” Organizational Behavior and Human Decision Processes 107:234–45.
17
Gomes, F. J., L. J. Kotlikoff, and L. M. Viceira (2008). “Optimal Life-Cycle Investing with
Flexible Labor Supply: A Welfare Analysis of Life-Cycle Funds.” American Economic
Review: Papers & Proceedings 98:297-303.
Grinblatt, M., M. Keloharju, and J. Linnainmaa (2011). “IQ and Stock Market Participation.”
Journal of Finance 66:2121–64.
Hackethal, A., and R. Inderst (2013). “How to Make the Market for Financial Advice Work.” In:
O. S. Mitchell and K. Smetters, eds., The Market for Retirement Financial Advice. Oxford,
UK: Oxford University Press: 213-228.
Hackethal, A., M. Haliassos, and T. Jappelli (2012). “Financial Advisors: A Case of Babysitters?
Journal of Banking and Finance. 36:509–524.
Hammond, P. Brett, Olivia S. Mitchell, and Stephen P. Utkus. (2017). Financial Decision Making
and Retirement Security in an Aging World. Oxford: Oxford University Press.
Hoechle, D., S. Ruenzi, N. Schaub, and M. Schmid (2017). “The Impact of Financial Advice on
Trade Performance and Behavioral Biases.” Review of Finance 21:871–910.
Horn, J.L. (1968) “Organization of Abilities and the Development of Intelligence.” Psychological
Review. 75(3): 242–259.
Horneff, V., R. Maurer, and O.S. Mitchell (2016). “Putting the Pension Back in 401(k) Plans:
Optimal Retirement Plan Design with Longevity Income Annuities.” NBER Working
Paper 22717.
Hubener, A., R. Maurer, and O. S. Mitchell (2016). “How Family Status and Social Security
Claiming Options Shape Optimal Life Cycle Portfolios.” Review of Financial Studies 29:
937-978.
Inderst, R. and M. Ottaviani (2012). “How (Not) to Pay for Advice: A Framework for Consumer
Financial Protection.” Journal of Financial Economics 105:393–411.
Kézdi, G., and R. J. Willis (2003). “Who Becomes A Stockholder? Expectations, Subjective
Uncertainty, and Asset Allocation. ” Working paper. The University of Michigan.
Kim, H. H., R. Maurer, and O. S. Mitchell (2016). “Time Is Money: Rational Life Cycle Inertia
and the Delegation of Investment Management.” Journal of Financial Economics. 121:
424–447.
Kim, H.H., R. Maurer, and O. S. Mitchell (2017). “Choosing a Financial Advisor: When and How
to Delegate.” In P. B. Hammond, O.S. Mitchell, and S. P. Utkus, eds. Financial Decision
Making and Retirement Security in an Aging World. Oxford: Oxford University Press.
Chapter 5. 86–95.
Korniotis, G. M. and A. Kumar (2011). Do Older Investors Make Better Investment Decisions?”
Review of Economics and Statistics 93:244–65.
Kotlikoff, L. J., P. Moeller, P. Solman. (2016). Get What's Yours: Revised and Updated. The
Secrets to Maxing Out Your Social Security. New York: Simon & Schuster.
Kramer, M. M. (2012). “Financial Advice and Individual Investor Portfolio Performance.”
Financial Management 41:395–428.
Lusardi, A. and O.S. Mitchell (2014). “The Economic Importance of Financial Literacy: Theory
and Evidence.” Journal of Economic Literature 52: 5-44.
Lusardi, A., P-C. Michaud, and O. S. Mitchell (2017). “Optimal Financial Literacy and Wealth
Inequality.” Journal of Political Economy 125: 431-477.
O’Donoghue, T. and M. Rabin (1999). “Doing It Now or Later.” American Economic Review
89:103–24.
Piccolo, S., G. W. Puopolo, and L. Vasconcelos (2016). “Non-Exclusive Financial Advice. Review
of Finance 20: 2079–2123.

18
Schroeder, D., T. Salthouse (2004). “Age-related Effects on Cognition Between 20 and 50 Years
of Age.” Personality and Individual Differences 36(2): 393–404.
Shapira, Z., and I. Venezia (2001). “Patterns of Behavior of Professionally Managed and
Independent Investors.” Journal of Banking and Finance 25:1573–87.
St. Clair, Patricia, Delia Bugliari, Nancy Campbell, Sandy Chien, Orla Hayden, Michael Hurd,
Regan Main, Angela Miu, Mike Moldoff, Constantijn Panis, Philip Pantoja, Afshin
Rastegar, Susann Rohwedder, Marian Oshiro, and Julie Zissimopoulos. (2011). RAND HRS
Data Documentation, Version L.
https://www.rand.org/content/dam/rand/www/external/labor/aging/dataprod/randhrsL.pdf
Stoughton, N. M., Y. Wu, and J. Zechner (2011). “Intermediated Investment Management.”
Journal of Finance66(3): 947–980.
van Rooij, M., A. Lusardi, and R. Alessie (2011). “Financial Literacy and Stock Market
Participation.” Journal of Financial Economics 101: 449–72.
von Gaudecker, H.M. (2015). “How Does Household Portfolio Diversification Vary with Financial
Literacy and Financial Advice?” Journal of Finance 70: 489–507.

19
Table 1: Descriptive Statistics on Key Variables
A. Financial Behaviors
B. Controls
Source: Authors’ calculations 2016 HRS
Variable N Mean St Dev Respondent Group
Any Financial Help
Spent time on FinMgmt last year (0/1) 1,118 0.50 0.50 Full sample
Get help w/ money mgmt (0/1) 1,168 0.34 0.47 Full sample
Gets help w/ invst (0/1) 318 0.52 0.50 Those receiving financial advice
Last time got money help (1-5) 318 1.93 0.91 Those receiving financial advice
No money help: Overconfidence (0/1) 830 0.04 0.20 Those not receiving financial advice
No money help: Distrust (0/1) 809 0.03 0.18 Those not receiving financial advice
No money help: DK whom to ask (0/1) 809 0.03 0.18 Those not receiving financial advice
Money Self-management
Last Yr Self-mgmt: # activities (0-5) 439 1.45 0.91 Those self-managing finances
Last Yr Self-mgmt sophis (0/1) 439 0.41 0.49 Those self-managing finances
Last Mo Why no svg/invst: Inertia (0/1) 579 0.07 0.26 Those not self-managing finances
Types of Financial Advice
Gets help from profl advisor (0/1) 338 0.71 0.45 Those receiving financial advice
Gets help from profl/other non family
advisors (0/1)
338 0.76 0.43 Those receiving financial advice
Gets free profl help (0/1) 338 0.14 0.35 Those receiving financial advice
# of diff types of helpers (0-3) 338 1.03 0.38 Those receiving financial advice
# of diff types of help (0-11) 318 1.58 1.14 Those receiving financial advice
How often follow advice (0-7) 324 6.03 1.16 Those receiving financial advice
Variable N Mean St Dev Respondent Group
Cognition score 1,179 23.93 4.23 Full sample
FinLit score 1,179 2.08 0.91 Full sample
Age 1,179 68.11 9.08 Full sample
Male 1,179 0.45 0.50 Full sample
White 1,179 0.85 0.36 Full sample
Hispanic 1,179 0.09 0.28 Full sample
Married 1,179 0.62 0.49 Full sample
Education (yrs) 1,179 13.58 2.80 Full sample
Good health 1,179 0.77 0.42 Full sample
Non-housing wealth (/100k, 2014$) 1,179 1.56 4.51 Full sample
Housing wealth (/100k, 2014$) 1,179 1.39 2.07 Full sample

20
Table 2. Factors Associated with Getting Any Financial Advice This table presents coefficient estimates from multivariate analysis of seven financial behavioral variables including Spent time on FinMgmt last year; Get help w/ money
mgmt; Get help w/ invst ; Last time got money help; No money help: Overconfidence; No money help: Distrust; No money help: DK whom to ask. These are regressed
on cognitive ability (Cognition score) and financial literacy (FinLit score) along with other controls. Variables are described in the Appendix and marginal effects reported.
Notes: Note: * Significant at 0.10 level, ** Significant at 0.05 level, *** Significant at 0.01 level. Coefficients on constant terms omitted; missing data dummies not
reported, SE in parentheses and clustered at the household level.
Cognition score 0.015 *** 0.001 0.007 * -0.008 0.019 ** 0.005 -0.010 -0.015 0.006 *** 0.005 *** 0.004 0.001 0.006 *** 0.004 ***
(0.005) (0.005) (0.004) (0.005) (0.009) (0.010) (0.016) (0.016) (0.002) (0.002) (0.002) (0.001) (0.002) (0.001)
FinLit score 0.099 *** 0.069 *** 0.058 *** 0.037 * 0.049 0.009 -0.051 -0.044 -0.015 -0.013 * 0.013 0.004 -0.014 * -0.008 *
(0.023) (0.024) (0.021) (0.022) (0.044) (0.046) (0.082) (0.087) (0.010) (0.007) (0.009) (0.005) (0.009) (0.004)
Age -0.002 0.000 -0.005 0.003 0.000 0.000 0.000
(0.002) (0.002) (0.004) (0.007) (0.001) 0.000 0.000
Male 0.026 -0.091 ** 0.082 -0.189 0.015 0.010 0.007
(0.042) (0.037) (0.077) (0.119) (0.012) (0.007) (0.008)
White 0.066 0.112 *** 0.110 0.193 -0.017 -0.007 -0.019
(0.049) (0.043) (0.103) (0.162) (0.015) (0.012) (0.013)
Hispanic 0.052 -0.076 -0.041 -0.333 -0.021 *** -0.009 -0.010 **
(0.076) (0.063) (0.168) (0.209) (0.007) (0.006) (0.004)
Married 0.085 ** 0.020 0.014 0.099 0.009 0.011 * 0.004
(0.043) (0.040) (0.084) (0.135) (0.011) (0.007) (0.007)
Education (yrs) 0.025 *** 0.030 *** 0.019 0.006 -0.002 -0.001 -0.002 *
(0.008) (0.008) (0.017) (0.028) (0.002) (0.001) (0.001)
Good health 0.080 0.044 0.106 0.294 * 0.019 ** 0.019 ** 0.009 *
(0.051) (0.047) (0.104) (0.165) (0.009) (0.008) (0.005)
Non-housing wealth (/100k, 2014$) 0.013 ** 0.007 0.008 -0.034 *** -0.005 0.000 -0.002
(0.006) (0.005) (0.009) (0.011) (0.004) (0.001) (0.002)
Housing wealth (/100k, 2014$) 0.032 * 0.022 0.046 ** -0.012 0.000 0.001 0.000
(0.017) (0.014) (0.020) (0.020) (0.004) (0.001) (0.002)
N 1,118 1,118 1,168 1,168 318 318 318 318 830 830 809 809 809 809
R-sq 0.043 0.095 0.016 0.075 0.027 0.078 0.016 0.080 0.056 0.129 0.070 0.168 0.097 0.181
Dep. Var. Mean 0.500 0.500 0.341 0.341 0.523 0.523 1.933 1.933 0.041 0.041 0.034 0.034 0.034 0.034
Dep. Var. St. Dev. 0.500 0.500 0.474 0.474 0.500 0.500 0.911 0.911 0.198 0.198 0.182 0.182 0.181 0.181
Spent time on FinMgmt
last year (0/1)
Get help w/ invst (0/1)
Probit
Get help w/ money mgmt
(0/1)
OLS
Last time got money help
(1-5)
No money help:
Overconfidence (0/1)
Probit
No money help: Distrust
(0/1)
No money help: DK whom
to ask (0/1)

21
Table 3. Factors Associated with Money Self-Management This table presents coefficient estimates from multivariate regressions of three outcome variables relative to money
self-management: Last Yr Self-mgmt; Last Yr Self-mgmt sophis ; and Last Mo Why no svg/invst: Inertia. These are
regressed on cognitive ability (Cognition score) and financial literacy (FinLit score) along with other controls. All
variables are defined in the Appendix; missing data controlled with dummy variables (not reported). Marginal effects
are reported for probits on binary variables.
Cognition score 0.031 0.030 0.007 -0.003 0.000 -0.002
(0.020) (0.023) (0.008) (0.009) (0.004) (0.004)
FinLit score -0.032 -0.059 -0.015 -0.032 0.005 -0.002
(0.069) (0.068) (0.038) (0.039) (0.017) (0.016)
Age -0.005 -0.007 ** -0.003 *
(0.005) (0.004) (0.002)
Male 0.085 0.006 0.000
(0.122) (0.061) (0.026)
White 0.026 0.021 0.035
(0.134) (0.087) (0.023)
Hispanic 0.044 0.083 -0.048 **
(0.188) (0.113) (0.023)
Married -0.028 0.038 0.000
(0.123) (0.070) (0.026)
Education (yrs) -0.008 0.003 0.001
(0.028) (0.015) (0.005)
Good health -0.171 0.158 * 0.012
(0.204) (0.090) (0.031)
Non-housing wealth (/100k, 2014$) 0.022 0.020 *** 0.001
(0.020) (0.007) (0.004)
Housing wealth (/100k, 2014$) -0.003 0.005 -0.001
(0.024) (0.016) (0.006)
Intercept 0.721 1.296 *
(0.528) (0.745)
N 439 439 439 439 579 579
R-sq 0.026 0.071 0.012 0.064 0.026 0.061
Dep. Var. Mean 1.445 1.445 0.408 0.408 0.074 0.074
Dep. Var. St. Dev. 0.911 0.911 0.492 0.492 0.262 0.262
Last Yr Self-mgmt: #
activities (0-5)
Last Yr Self-mgmt
sophis (0/1)
Last Mo Why no svg/invst:
Inertia (0/1)
OLS Probit

22
Table 4. Factors Associated with Types of Financial Advice Sought This table presents coefficient estimates from multivariate analysis of six behavioral variables including Gets help from profl advisor; Gets help from profl/other non-
family advisors; Gets free profl help; # of diff types of helpers; # of diff types of help; How often follows advice. These are regressed on cognitive ability (Cognition score)
and financial literacy (FinLit score) and other controls. Variables described in the Appendix; marginal effects for probit regressions on binary outcomes reported. See also
Notes to Table 2.
Cognition score 0.023 *** 0.011 0.025 *** 0.013 * 0.001 0.000 -0.006 -0.006 0.017 0.014 0.000 0.017
(0.006) (0.008) (0.006) (0.007) (0.005) (0.005) (0.005) (0.005) (0.018) (0.023) (0.027) (0.031)
FinLit score 0.082 *** 0.046 0.054 ** 0.019 -0.020 -0.019 -0.006 0.001 0.002 -0.024 0.052 0.076
(0.030) (0.030) (0.026) (0.026) (0.029) (0.029) (0.022) (0.024) (0.119) (0.115) (0.101) (0.106)
Age -0.006 ** -0.006 *** -0.001 0.003 0.020 *** -0.001
(0.003) (0.002) (0.002) (0.003) (0.007) (0.009)
Male 0.034 0.012 -0.002 -0.033 -0.062 0.167
(0.056) (0.048) (0.049) (0.052) (0.142) (0.174)
White 0.108 0.141 * 0.033 -0.101 0.174 0.159
(0.084) (0.077) (0.066) (0.069) (0.163) (0.215)
Hispanic -0.038 -0.097 -0.117 *** -0.053 -0.071 0.328
(0.121) (0.121) (0.038) (0.053) (0.241) (0.329)
Married 0.084 0.070 -0.044 -0.078 * 0.492 *** -0.312 *
(0.060) (0.050) (0.057) (0.045) (0.154) (0.161)
Education (yrs) 0.022 * 0.010 -0.007 0.013 0.047 -0.012
(0.011) (0.009) (0.011) (0.010) (0.030) (0.033)
Good health -0.001 0.004 0.022 -0.117 -0.566 * -0.210
(0.069) (0.052) (0.056) (0.073) (0.311) (0.223)
Non-housing wealth (/100k, 2014$)0.018 ** 0.013 ** 0.000 0.004 -0.004 0.010
(0.008) (0.006) (0.004) (0.005) (0.019) (0.023)
Housing wealth (/100k, 2014$) -0.013 0.007 0.008 0.015 -0.004 -0.048
(0.015) (0.011) (0.011) (0.013) (0.036) (0.048)
N 338 338 338 338 338 338 338 338 318 318 324 324
R-sq 0.119 0.193 0.132 0.218 0.003 0.022 0.006 0.068 0.004 0.082 0.002 0.043
Dep. Var. Mean 0.713 0.713 0.760 0.760 0.142 0.142 1.027 1.027 1.582 1.582 6.035 6.035
Dep. Var. St. Dev. 0.453 0.453 0.428 0.428 0.349 0.349 0.379 0.379 1.138 1.138 1.160 1.160
OLS
Gets help from profl
advisor (0/1)
Gets help from
profl/other non family
advisors (0/1)
Gets free profl help
(0/1)
# of diff types of
helpers (0-3)
# of diff types of help
(0-11)
How often follow advice
(0-7)
Probit

23
Appendix 1: Variable Descriptions
A. Financial Behaviors (from 2016 Experimental Module)12
Any Financial Help
Spent time on FinMgmt last year (0/1) (self_fin_mgmt) =1 if R self-managed finances last year
(v124=1), 0 else
Get help w/ money mgmt (help_fin_mgmt) =1 if R got help with money management in past year
(Item v106=1), 0 else.
Gets help w/ invst (0/1) (v1110=1; portfolio_help) =1 if R got help with investing stocks, bonds
or mutual funds; 0 else.
Last time got money help (1-5) (last_help) = 1 if R got help in last month; =2 if got help in last
year; =3 if got help in last 5 years; =4 if got help longer ago than 5 years; = 5 if never (pv118).
No money help: Overconfidence (0/1) ((v107=1); finovcnfd_flg) =1 if R did not receive financial
advice because he can do financial management on his own, 0 else..
No money help: Distrust (0/1) (v107=2; helptrust_flg) =1 if R did not receive financial advice
due to no trust in financial advisors, =0 else.
No money help: DK whom to ask (0/1) (v107=2; helpignrc_flg) =1 if R did not financial advice
because he knows no one to ask, 0 else.
Money Self-management
Last Yr Self-mgmt: # activities (0-5) (scope_self_mgmt) # financial management activities in last
year (sum of all answers v125).
Last Yr Self-mgmt sophis (v125=2, 3 or 4; sophi_mgmt_flg) =1 if R made more sophisticated
investment decisions (e.g., decisions on investment and withdrawal) rather than just checking
accounts, 0 else
Last Mo Why no svg/invst: Inertia (inertia_flg) = 1 if R chose inertia as a reason not receiving
help (any answers to v127 - v127_9 =equal 5), 0 else.
Types of Financial Help
Gets help from profl advisor (0/1) (v108=4; advisor_help2) =1 if R gets help from professional
financial advisor (financial advisor, planner, accountant, or other professional investment
counselor); =0 else
Gets help from profl/other non family advisors (0/1) (v108=4, 5, 6, 7, 8; advisor_help3) =1 if R
gets help from professional financial advisors or other nonfamily member; =0 else
Gets free profl help (0/1) (v112=7; free_advice1) = 1 if R gets help for free from professional
advisor; =0 else
# of diff types of helpers (0-3) (scope_helpers) = # of helpers giving financial advice (sum of all
v108 answers)
# of diff types of help (0-11) (scope_helps) = # of financial tasks for which received advice(sum
of all pv110 answers).
How often follow advice (0-7) (v117; acceptance_adv) = 1 never; up to 7 always; 0: missing)
B. Control variables (from HRS Core)
Cognition score Sum of total word recall and mental status summary scores (0-35)
FinLit score Sum of number of correct answers to four financial literacy questions.
12 https://hrs.isr.umich.edu/documentation

24
Age R age in years
Male =1 if R male, 0 else.
White =1 if R white, 0 else.
Hispanic =1 if R Hispanic, 0 else.
Married =1 if R married , 0 else.
Education # years of education
Good health =1 if R reports health status excellent/good , 0 else.
Housing wlth Net value of housing (value of 1ry residence less mortgages and home loans)
Non-housing wlth Net value of non-housing financial wealth (stock, saving, CDs, bonds, and
other saving less debt)
Note: R refers to survey Respondent
25
Appendix Table 2. Correlations
A. Financial Behaviors
Any Financial Help
Spent time on FinMgmt last year (0/1) 1Get help w/ money mgmt (0/1) 0.27 ** 1
Gets help w/ invst (0/1) 0.24 ** 0.65 *** 1
Last time got money help (1-5) -0.32 ** -0.79 *** -0.50 *** 1
No money help: Overconfidence (0/1) -0.10 ** -0.12 -0.08 0.09 * 1
No money help: Distrust (0/1) 0.06 -0.11 -0.07 0.08 * -0.03 1
No money help: DK whom to ask (0/1) -0.12 ** -0.11 -0.07 0.11 * 0.90 *** -0.02 1
Money Self-management
Last Yr Self-mgmt: # activities (0-5) 0.75 ** 0.20 *** 0.22 *** -0.23 *** -0.07 * 0.16 -0.09 ** 1
Last Yr Self-mgmt sophis (0/1) 0.51 ** 0.23 *** 0.25 *** -0.24 *** -0.05 * 0.04 -0.05 * 0.65 *** 1
Last Mo Why no svg/invst: Inertia (0/1) 0.04 -0.01 0.06 -0.02 0.01 0.01 0.01 0.03 0.04 1
Types of Financial Advice
Gets help from profl advisor (0/1) 0.30 ** 0.79 *** 0.67 *** -0.65 *** -0.09 -0.09 -0.09 0.24 *** 0.26 *** 0.02 1
Gets help from profl/other non family advisors (0/1) 0.29 ** 0.82 *** 0.68 *** -0.68 *** -0.10 -0.09 -0.09 0.24 *** 0.28 *** 0.03 0.96 *** 1
Gets free profl help (0/1) 0.02 0.31 *** 0.24 *** -0.22 *** -0.04 -0.03 -0.03 0.02 0.04 0.02 0.40 *** 0.38 *** 1
# of diff types of helpers (0-3) 0.25 ** 0.91 *** 0.63 *** -0.74 *** -0.11 *** -0.10 *** -0.10 *** 0.21 *** 0.23 *** 0.02 0.80 *** 0.83 *** 0.35 *** 1
# of diff types of help (0-11) 0.22 ** 0.75 *** 0.63 *** -0.60 *** -0.09 *** -0.08 *** -0.08 *** 0.22 *** 0.22 *** 0.04 0.63 *** 0.64 *** 0.21 *** 0.73 *** 1
How often follow advice (0-7) 0.27 ** 0.97 *** 0.64 *** -0.77 *** -0.11 *** -0.11 *** -0.11 *** 0.19 *** 0.23 *** 0.01 0.78 *** 0.81 *** 0.29 *** 0.88 *** 0.73 ***
No money
help: DK
whom to ask
(0/1)
Last Yr Self-
mgmt: #
activities (0-5)
Last Yr Self-
mgmt sophis
(0/1)
Last Mo Why
no svg/invst:
Inertia (0/1)
Gets help from
profl advisor
(0/1)
Gets help from
profl/other non
family advisors
(0/1)
Spent time on
FinMgmt last
year (0/1)
Get help w/
money mgmt
(0/1)
Gets help w/
invst (0/1)
Last time got
money help (1-
5)
No money
help:
Overconfidenc
e (0/1)
No money
help: Distrust
(0/1)
Gets free profl
help (0/1)
# of diff types
of helpers (0-
3)
# of diff types
of help (0-11)

26
B. Controls and Financial Behaviors
Cognition score 0.18 *** 0.10 ** 0.14 *** -0.12 ** 0.08 0.08 0.10 * 0.20 *** 0.13 *** 0.02 0.18 *** 0.19 *** 0.03 0.07 * 0.11 ** 0.11 **
FinLit score 0.21 *** 0.13 *** 0.14 *** -0.17 *** -0.05 0.07 -0.05 0.18 *** 0.12 ** 0.04 0.19 *** 0.18 *** 0.02 0.11 ** 0.11 * 0.14 ***
Age -0.04 0.00 -0.05 -0.01 -0.04 -0.01 -0.05 -0.09 *** -0.10 ** -0.03 -0.09 ** -0.09 ** 0.00 0.03 0.03 -0.01
Male 0.06 -0.06 -0.02 0.00 0.05 0.09 * 0.04 0.07 0.02 0.06 -0.04 -0.05 -0.04 -0.07 -0.04 -0.05
White 0.11 ** 0.13 *** 0.12 *** -0.10 ** -0.04 -0.01 -0.05 0.09 ** 0.07 * 0.03 0.15 *** 0.16 *** 0.06 * 0.11 *** 0.11 *** 0.12 ***
Hispanic -0.06 -0.11 *** -0.10 *** 0.15 *** -0.04 ** -0.04 * -0.04 * -0.07 * -0.04 -0.07 *** -0.11 *** -0.12 *** -0.06 *** -0.10 *** -0.09 *** -0.10 **
Married 0.16 *** 0.06 0.10 * -0.04 0.03 0.08 * 0.02 0.14 *** 0.13 *** 0.03 0.13 *** 0.13 *** -0.01 0.03 0.11 *** 0.05
Education (yrs) 0.23 *** 0.21 *** 0.21 *** -0.25 *** -0.03 0.04 -0.03 0.21 *** 0.16 *** 0.03 0.26 *** 0.25 *** 0.06 0.19 *** 0.19 *** 0.20 ***
Good health 0.14 *** 0.09 ** 0.10 ** -0.09 * 0.05 * 0.08 *** 0.05 0.10 * 0.14 *** 0.04 0.11 ** 0.11 ** 0.04 0.06 0.04 0.08 *
Non-housing wealth (/100k, 2014$) 0.17 *** 0.16 ** 0.18 ** -0.20 ** -0.04 * 0.08 -0.04 * 0.19 * 0.21 ** 0.06 0.20 *** 0.19 *** 0.05 0.16 ** 0.13 ** 0.16 **
Housing wealth (/100k, 2014$) 0.20 *** 0.18 ** 0.21 ** -0.19 ** -0.03 0.09 -0.03 0.17 ** 0.15 ** 0.06 0.17 ** 0.20 ** 0.07 0.19 ** 0.16 ** 0.17 **
How often
follow advice
(0-7)
No money
help: DK
whom to ask
(0/1)
Last Yr Self-
mgmt: #
activities (0-5)
Last Yr Self-
mgmt sophis
(0/1)
Last Mo Why
no svg/invst:
Inertia (0/1)
Gets help from
profl advisor
(0/1)
Gets help from
profl/other non
family advisors
(0/1)
Spent time on
FinMgmt last
year (0/1)
Get help w/
money mgmt
(0/1)
Gets help w/
invst (0/1)
Last time got
money help (1-
5)
No money
help:
Overconfidenc
e (0/1)
No money
help: Distrust
(0/1)
Gets free profl
help (0/1)
# of diff types
of helpers (0-
3)
# of diff types
of help (0-11)