Embed Size (px)
Citation preview

Cognition of Conception Risk : A Knowledge based study in Uttar Pradesh, India
K. K. Singh*, Prashant Verma** and Anjali Singh**
Department of Statistics
Banaras Hindu University
Varanasi
Email: [email protected]
*Professor, Department of Statistics, Banaras Hindu University, Varanasi.
**Junior Research Fellow, Department of Statistics, Banaras Hindu University, Varanasi .
Abstract
In India, where most of the decisions are taken by men in the family, it is essential for men to
have the knowledge about the pregnancy risk during the menstrual cycle of women. The
traditional contraceptive methods are still employed by a large population in India; hence the
knowledge about the pregnancy risk during the menstrual cycle is important to ward off the
abortion due to unwanted pregnancy. In this paper an attempt has been made to assess the
knowledge of urban male in Uttar Pradesh, India regards the conception risk during menstrual
cycle and the rationales behind such misconceptions. The study says that only one fifth men of
urban Uttar Pradesh in India has the true knowledge about the pregnancy risk during menstrual
cycle. It is found that education, perception of society, age and discussion with spouse about the
reproductive issues are the main determinants of the knowledge about the pregnancy risk during
menstrual cycle among urban men in Uttar Pradesh, India.
Key Words: Pregnancy Risk, Menstrual cycle (M.C), Discriminant Analysis (D.A) and
Measurement, Learning, and Evaluation (MLE) project and Modern Family Planning Methods
(MFPM).

1. Introduction
The effective contraceptive practice is usually measured by knowledge about the reproductive
process and other related issues. In India, where most of the decisions are taken by men in the
family, it is essential for men to have the knowledge about the pregnancy risk during the
menstrual cycle of women. Pressure (1977) has analyzed the data to study the women’s
knowledge about pregnancy risk during menstrual cycle or fertile window of menstrual cycle and
observed that only one-third of urban mothers interviewed twice, a year apart, answered
correctly both times about when during the menstrual cycle a woman is most likely to become
pregnant. Recently, Shahina et. al. (2013) found in her study that about 85 percent women did
not have the correct knowledge of the fertile window of a menstrual cycle.
In India, especially in Uttar Pradesh due to the several cultural barriers most of the people do not
have a conversation regarding the menstruation and pregnancy risk during menstruation.
Menstruation is an important reproductive health function, yet it has been dealt with secrecy in
India (United Nations Children’s Fund, 2008). A number of taboos and social and cultural
restrictions still exists concerning menstruation (Dhingra et. al. 2009; Paul, 2007; Singh, 2006;
Thérèse & Maria, 2010). Researchers and policy makers often talk about the woman’s
knowledge about the procreative process, nevertheless, in Indian context; man’s knowledge
about the reproductive process is as indispensable since the dominant nature of men in decision
making. Mendelbaum (1974) mentioned in his book that erroneous information about the risk of
conception during the menstrual cycle may lead to increased fertility. Yadava and Mishra (2012)
in his study found that only 18.4 percent males have the correct information about the time of
maximum conception risk during menstrual cycle, while 43.2 percent men do not have any idea
about the concept in rural eastern Uttar Pradesh.
Usually the sperm can survive for three to five days in the fallopian tube and after ovulation the
released egg takes between 12 and 24 hours to make its way through the fallopian tube. Due to
this reason, the highest chance of pregnancy occurs when a couple has intercourse one to two
days before ovulation. A female usually ovulates 14 days after her period begins. If a woman has
a regular menstrual cycle length of 28 days, she will ovulate in the middle of the cycle,
approximately 14 days after day one of her period. If a woman has her menstrual cycle little
longer, say 34 days, she will ovulate around 20 days after day one of a period. Using these facts
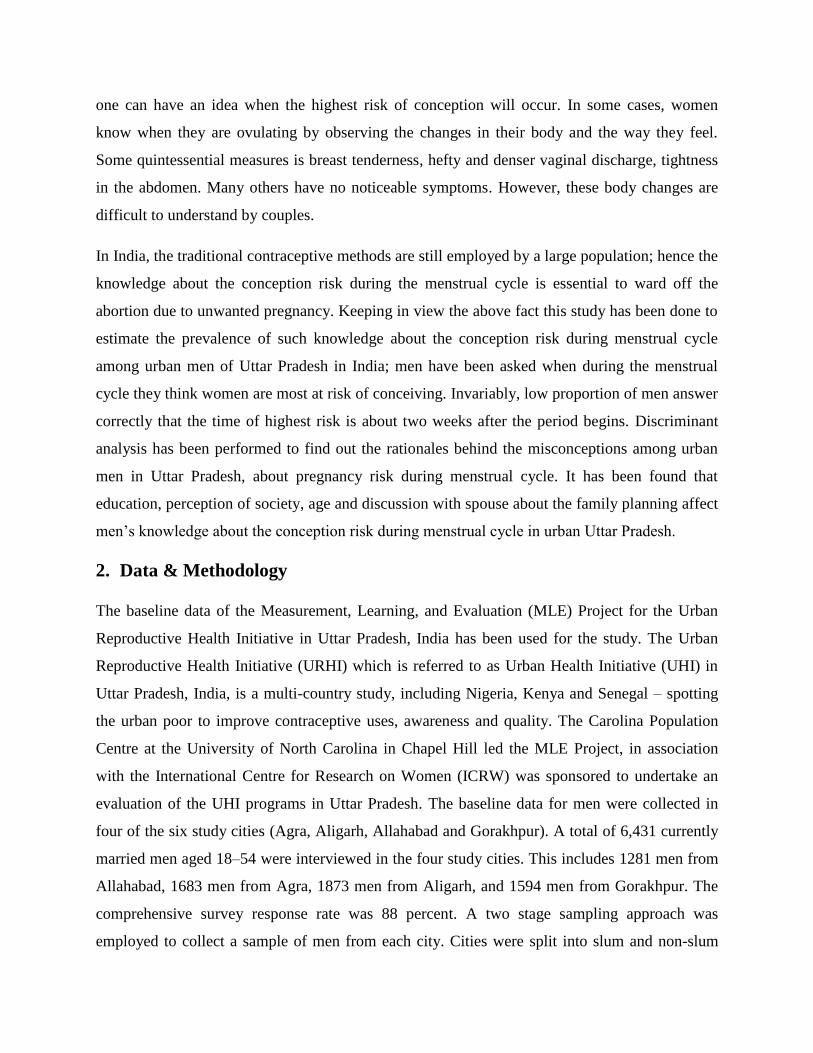
one can have an idea when the highest risk of conception will occur. In some cases, women
know when they are ovulating by observing the changes in their body and the way they feel.
Some quintessential measures is breast tenderness, hefty and denser vaginal discharge, tightness
in the abdomen. Many others have no noticeable symptoms. However, these body changes are
difficult to understand by couples.
In India, the traditional contraceptive methods are still employed by a large population; hence the
knowledge about the conception risk during the menstrual cycle is essential to ward off the
abortion due to unwanted pregnancy. Keeping in view the above fact this study has been done to
estimate the prevalence of such knowledge about the conception risk during menstrual cycle
among urban men of Uttar Pradesh in India; men have been asked when during the menstrual
cycle they think women are most at risk of conceiving. Invariably, low proportion of men answer
correctly that the time of highest risk is about two weeks after the period begins. Discriminant
analysis has been performed to find out the rationales behind the misconceptions among urban
men in Uttar Pradesh, about pregnancy risk during menstrual cycle. It has been found that
education, perception of society, age and discussion with spouse about the family planning affect
men’s knowledge about the conception risk during menstrual cycle in urban Uttar Pradesh.
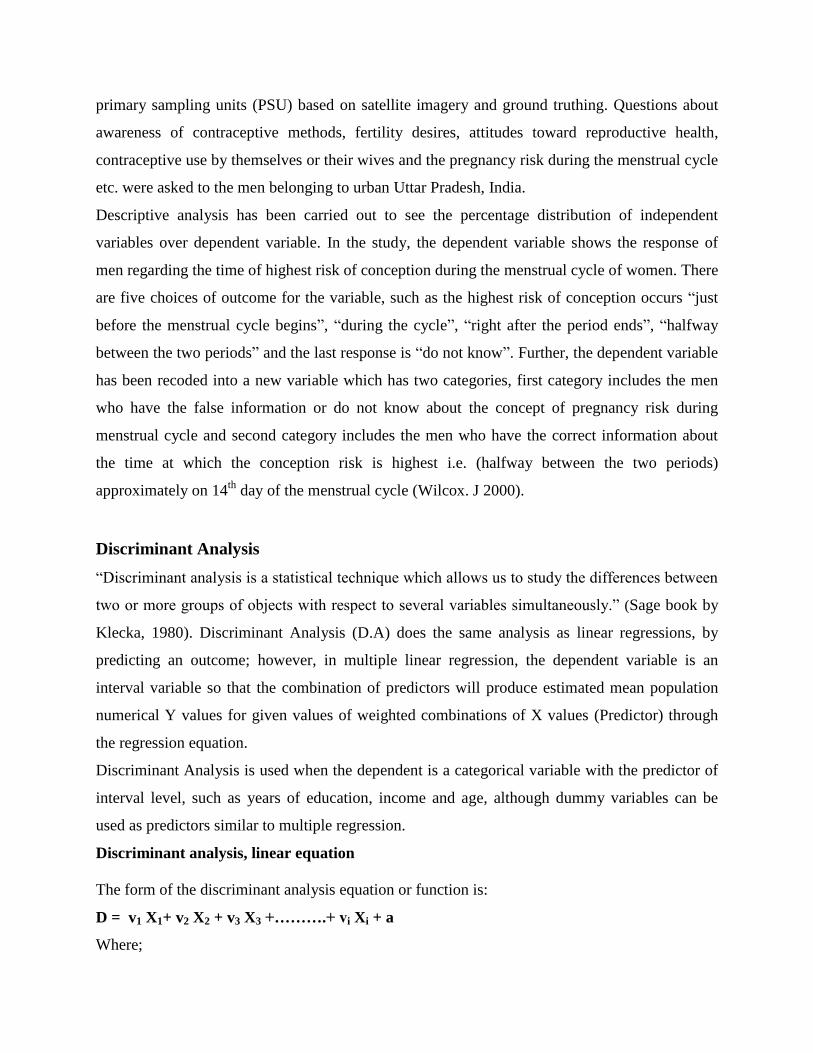
2. Data & Methodology
The baseline data of the Measurement, Learning, and Evaluation (MLE) Project for the Urban
Reproductive Health Initiative in Uttar Pradesh, India has been used for the study. The Urban
Reproductive Health Initiative (URHI) which is referred to as Urban Health Initiative (UHI) in
Uttar Pradesh, India, is a multi-country study, including Nigeria, Kenya and Senegal – spotting
the urban poor to improve contraceptive uses, awareness and quality. The Carolina Population
Centre at the University of North Carolina in Chapel Hill led the MLE Project, in association
with the International Centre for Research on Women (ICRW) was sponsored to undertake an
evaluation of the UHI programs in Uttar Pradesh. The baseline data for men were collected in
four of the six study cities (Agra, Aligarh, Allahabad and Gorakhpur). A total of 6,431 currently
married men aged 18–54 were interviewed in the four study cities. This includes 1281 men from
Allahabad, 1683 men from Agra, 1873 men from Aligarh, and 1594 men from Gorakhpur. The
comprehensive survey response rate was 88 percent. A two stage sampling approach was
employed to collect a sample of men from each city. Cities were split into slum and non-slum
primary sampling units (PSU) based on satellite imagery and ground truthing. Questions about
awareness of contraceptive methods, fertility desires, attitudes toward reproductive health,
contraceptive use by themselves or their wives and the pregnancy risk during the menstrual cycle
etc. were asked to the men belonging to urban Uttar Pradesh, India.
Descriptive analysis has been carried out to see the percentage distribution of independent
variables over dependent variable. In the study, the dependent variable shows the response of
men regarding the time of highest risk of conception during the menstrual cycle of women. There
are five choices of outcome for the variable, such as the highest risk of conception occurs “just
before the menstrual cycle begins”, “during the cycle”, “right after the period ends”, “halfway
between the two periods” and the last response is “do not know”. Further, the dependent variable
has been recoded into a new variable which has two categories, first category includes the men
who have the false information or do not know about the concept of pregnancy risk during
menstrual cycle and second category includes the men who have the correct information about
the time at which the conception risk is highest i.e. (halfway between the two periods)
approximately on 14th
day of the menstrual cycle (Wilcox. J 2000).
Discriminant Analysis
“Discriminant analysis is a statistical technique which allows us to study the differences between
two or more groups of objects with respect to several variables simultaneously.” (Sage book by
Klecka, 1980). Discriminant Analysis (D.A) does the same analysis as linear regressions, by
predicting an outcome; however, in multiple linear regression, the dependent variable is an
interval variable so that the combination of predictors will produce estimated mean population
numerical Y values for given values of weighted combinations of X values (Predictor) through
the regression equation.
Discriminant Analysis is used when the dependent is a categorical variable with the predictor of
interval level, such as years of education, income and age, although dummy variables can be
used as predictors similar to multiple regression.
Discriminant analysis, linear equation
The form of the discriminant analysis equation or function is:
D = v1 X1+ v2 X2 + v3 X3 +……….+ vi Xi + a
Where;
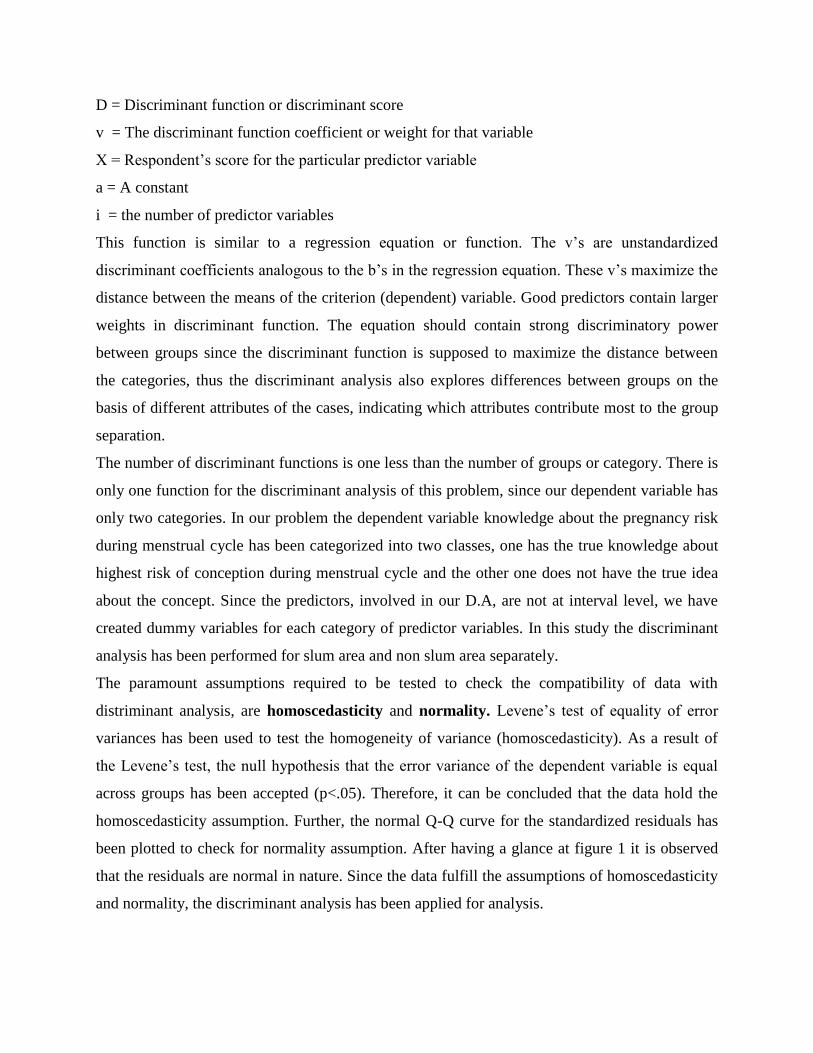
D = Discriminant function or discriminant score
v = The discriminant function coefficient or weight for that variable
X = Respondent’s score for the particular predictor variable
a = A constant
i = the number of predictor variables
This function is similar to a regression equation or function. The v’s are unstandardized
discriminant coefficients analogous to the b’s in the regression equation. These v’s maximize the
distance between the means of the criterion (dependent) variable. Good predictors contain larger
weights in discriminant function. The equation should contain strong discriminatory power
between groups since the discriminant function is supposed to maximize the distance between
the categories, thus the discriminant analysis also explores differences between groups on the
basis of different attributes of the cases, indicating which attributes contribute most to the group
separation.
The number of discriminant functions is one less than the number of groups or category. There is
only one function for the discriminant analysis of this problem, since our dependent variable has
only two categories. In our problem the dependent variable knowledge about the pregnancy risk
during menstrual cycle has been categorized into two classes, one has the true knowledge about
highest risk of conception during menstrual cycle and the other one does not have the true idea
about the concept. Since the predictors, involved in our D.A, are not at interval level, we have
created dummy variables for each category of predictor variables. In this study the discriminant
analysis has been performed for slum area and non slum area separately.
The paramount assumptions required to be tested to check the compatibility of data with
distriminant analysis, are homoscedasticity and normality. Levene’s test of equality of error
variances has been used to test the homogeneity of variance (homoscedasticity). As a result of
the Levene’s test, the null hypothesis that the error variance of the dependent variable is equal
across groups has been accepted (p<.05). Therefore, it can be concluded that the data hold the
homoscedasticity assumption. Further, the normal Q-Q curve for the standardized residuals has
been plotted to check for normality assumption. After having a glance at figure 1 it is observed
that the residuals are normal in nature. Since the data fulfill the assumptions of homoscedasticity
and normality, the discriminant analysis has been applied for analysis.

3. Results / key findings
Table 1 provides the percentage distribution of the variables considered in the desired analysis.
The data include about 51% of men from the non slum area and about 49% from the slums of
urban Uttar Pradesh in India. According to the table, about 81% men had a discussion about
family planning with their wives at least once, while about 19% men never had such discussion
with their wives. The table clearly shows that most of the men (79%) belong to Hindu religion,
while 21% belong to other religion. We further find that about 39% of men belong to the general
caste group, the same proportion is found for Other Backward Caste (O.B.C) group, while about
22% men belong to Scheduled Caste or Scheduled Tribe (SC/ST) groups. About 16% men
belong to low income families, 63% men belong to families with moderate income and 21% men
belong to the families which fall in high income group. The table depicts that about 58% men are
dwelling in a society which encourages the Modern Family Planning Methods (MFPM), 11%
men are dwelling in a society which does not encourage MFPM and more than a quarter (31%)
men do not know the view of society regarding MFPM. About 87% men are exposed to the
media, while 13% are not exposed to the media. It is observed from the table that only about
20% men have the correct information about pregnancy risk during the menstrual cycle and
about 80% men do not have the correct information about the concept. About 10% men are
illiterate, 13% are primarily educated, 54% men have completed their secondary education and
23% men have completed higher education. The table shows that about 23% men are aged below
30 years, 18% belong to the age group (30-34) years, 19% belong to the age group (35-39) years,
17% belong to the age group (40-44) years and about 23% men are aged above 44 years.
Table 2 gives the percentage distribution of men regarding their perception or knowledge about
the time duration which has the highest pregnancy risk during menstrual cycle. It is observed
from the table that in the non slum area about 21% men respond that the highest risk of
pregnancy occurs halfway between two periods, that is the true information regarding the
concept, while in slum area about 19% men have the true information. The table shows that
about 16% men belonging to SC/ST caste group, about 21% men belonging to O.B.C group and
about 22% men belonging to a General cast group have the true information about the concept.
Further, we can say that about 17% among Hindu men and about 22% men belonging to the

other religion possess the correct idea about the pregnancy risk during M.C. It is observed from
the table that about 13% among illiterate men, about 18% among primary educated men, about
19% among secondary educated men and 24% among highly educated men have the true
information about the concept.
Table exhibits that about 17% of men aged below 30 years, 20% of men belonging to the age
group 30-34 years, 20% of men belonging to the age group 35-39 years, 22% of men belonging
to age group 40-44 years and about 22% of men aged above 44 years, have the precise
knowledge about the conception risk during the menstrual cycle. It is found that about 20%
among the men who are exposed to media and about 19% among the men who are not exposed
to the media, possess the true information regarding the concept. The table shows that about 24%
among the men who dwell in a society that encourages the MFPM, about 13% among the men
who dwell in a society that does not encourage the MFPM and 15% among the men who do not
know the view of society about MFPM, have the true information regarding the concept. Table
explains that about 17% respondents among the men from lower income status, 20% from
middle income status and 22% among the men from higher income status have the correct
information regarding the concept. It is observed that 24% among the men who discussed family
planning with their wives and only about 5% among the men who did not discuss family
planning with their wives posses the true idea about the pregnancy risk during menstrual cycle.
After having a glance at the table it can be concluded that the highest percentage is found for the
third response, i.e. the highest risk of conception occurs right after the period ends. It can be
found that for each category of different variables has more than 50% respondents who perceive
that the highest risk of conception occurs just after the period ends. Further, it can be seen that
19.64% respondents among the illiterate men and 19.84% among the men who have never
discussed family planning with their wives, do not have any idea about the concept.
Table 3 presents the test of equality of group means for the different variables taken into
consideration for the slum area. In the table, group1 includes the respondents who do not have
the correct idea about the concept and group2 includes the respondents who have the correct
information about the concept of pregnancy risk during M.C. It is found that the proportion of
men living in a society which encourages the MFPM is higher in the group2 (70%) with respect
to group1 (53%), the proportion of men living in a society which does not encourage the MFPM

is higher in the group1 (13%) with respect to group2 (7%) and the proportion of men who do not
know about society regarding the concept is higher in the group1 (34%) with respect to group2
(23%). This finding says that the men who dwell in a society that support MFPM have more true
information compared to the men living in a society that does not support MFPM and the men
who do not know about the view of society regarding the MFPM.
Similarly, it is observed that the men belonging to the SC/ST cast group have a higher proportion
(32%) in group 1 and the men belonging to the General caste group have a higher proportion in
group2 (34%), while the OBC group is not statistically significant for the group separation.
Therefore, it can be concluded that men belonging to the general caste group possess better
information about the concept than men belonging to SC/ST caste group. The table depicts that
the men belonging to Hindu religion have a higher proportion (81%) in group 1 and the men
belonging to the non Hindu religion have a higher proportion in group2 (41%). It shows that men
belonging to other religions have more true information compared to Hindu men. Further, it is
found that illiterate men have a higher proportion (10%) in group1 compared to group2 (7%) and
the men having higher education have a higher proportion in group2 (20%). This indicates that
men having higher education keeps better information about the concept compared to the men
with no education, at the same time we did not find the primary education and secondary
education significant for the group separation.
The table exhibits that men belonging to the poor family, have a higher proportion (22%) in
group1 compared to group2 (17%), while the variables middle wealth index and upper wealth
index, are not significant for the information regarding the concept. It means that men from the
lower wealth status have less true information. After having a glance at the cross table (Table is
not rendered) between the wealth status and caste, it is found that most of the men having lower
wealth index belong to the lower caste group. Further, it is found that the men who discuss
family planning with their wives have a higher proportion (94%) in group2 and the men who do
not discuss the family planning have a higher proportion (25%) in group1. This finding leads to
the statement that the men who discuss about family planning with their wives have more true
information regarding the concept of highest pregnancy time during M.C compared to the men
who do not talk about the family planning with the partner. The table shows that the media
exposure is not a significant factor for the group separation regarding the knowledge about the

conception risk during the M.C. This might be due to a high correlation between the media
exposure and the educational attainment of men in urban Uttar Pradesh.
Table 4 presents the test of equality of group means for the different variables taken into
consideration for the non slum area. It can be noticed from the table that the variables like
perception of society about MFPM, religion, discussion of respondent with wife about family
planning and media exposure reflect the same results as we found in the analysis for slum area.
Further for non slum population, caste has not been noticed as a significant factor for group
separation. The table reveals that that secondary educated men have a higher proportion (51%) in
group1 compared to group2 (42%) and the men having higher education have a higher
proportion in group2 (42%) than that in group 1 (31%). This indicates that men having higher
education, keeps better information about the concept compared to the men with secondary
education, at the same time we did not find the primary education and no education, significant
for the group separation. The table exhibits that men aged below 30 years have a higher
proportion (22%) in group1 compared to group2 (18%) and men aged above 44 years have a
higher proportion (28%) in group2 compared to group1 (24%), while the other age groups are
not found significant for the group separation. Further table reflects that for non slum population
wealth status of men is not significant, this may be due to that other social and cultural factors
are more dominant, also wealth status is highly associated with educational attainment.
4. Discussion and Conclusion
After dissecting the data we can articulate that very little ratio of urban men have correct
information about the pregnancy risk during the menstrual cycle of adult females. Since there are
only 20.21% urban men have the true information about the concept, there is an urgent need of
the sex education in slum areas as well in as non slum area. We may reduce the abortion due to
unwanted pregnancy by educating people regarding the pregnancy risk during M.C. Our
perception about something is built according to the society, we are living in. That is why it is
found that men living in a society that encourages the MFPM have better information than who
are living in a society that does not encourage MFPM and the men who do not have any idea
about society regarding MFPM. Thus to educate people it is necessary to educate the society as a

whole, also this study suggests urban men, to have interaction with the society and discuss about
the reproductive health and other related issues like family planning etc.
In India, where the caste has been an unavoidable factor for ages, we need to educate people
belonging to the lower caste, especially in slum areas regarding the sexual health of men and
women. It is found that in non slum area the caste is not the significant factor for the knowledge
about the concept since the caste is not that big issue in non slum area due to higher education
level and modernization of culture. Culture and customs are the important factors that influence
the perception of men, due to several cultural barriers Hindu men are found to have less true
information about the concept compared to the men belonging to other religions. Therefore, we
need to look beyond the old cultural barrier and customs; those are responsible for such
misconceptions.
Study shows that the higher education results to a better knowledge about the conception risk
during M.C. Literacy and employment can bring the wealth condition up, therefore literacy is the
only way to get rid of such misinformations regarding the reproductive health of women, that is
why study suggests to promote the higher education. It is a well known fact that our knowledge
is positively correlated with the age, since we encounter with several experiences as time
advances. That is the reason why study shows that the men from older cohort have better
knowledge about the pregnancy risk during M.C. The effective inter-spouse communication on
matters related to family planning is very crucial for the success of family planning programmes
(Bogue, 1962). In India due to various cultural barriers and customs, even husband and wife feel
shy to discuss about the sensitive issues like family planning and reproductive health. The study
recommends people to discuss about the reproductive health and other relative issues with their
spouses so that they can be aware of the different technicalities related to reproductive health and
family planning.

5. References:
1. Acharya, R. and Sureender, S. (1996): “Inter-spouse communication, contraceptive use and
family size: relationship examined in Bihar and Tamil Nadu”. The Journal of Family
Welfare. December 1996. 42(4).p.5-11.
2. Baridalyne, N. and Reddaiah, V.P. (2004): “Menstruation: Knowledge, beliefs and practices
of women in the reproductive group residing in an urban resettlement colony of Delhi”.
Health and Population Perspectives, 27, 9–16.
3. Begum, S., Dwivedi, S.N., Mittal, S, and Pandey, A.(2013): “Knowledge and practice of
periodic abstinence among women in India”. Open Journal of Preventive Medicine, Vol.3,
No.4, 338-341.
4. Bogue, D (1962): "Some tentative recommendations for a 'sociologically correct' family
planning communication and motivation programme in India". In C.V. Kiser (ed.) Research
in Family Planning, Princeton University Press, Princeton, N.J.
5. Chaudhary, H. (1998, July 21–23): “Socio-economic demographic and reproductive health
profiles of adolescent in SAARC countries”. Paper presented at the South Asia Conference
on Adolescence, New Delhi, India.
6. Chawla, J. (1992): “The rig vedic slaying of vrtra: Menstruation taboos in mythology”.
Manushi, 68, 29–34.
7. Deo, D.S. and Ghattargi, C.H. (2005): “Perceptions and practices regarding menstruation A
comparative study in urban and rural adolescent girls”. Indian Journal of Community
Medicine, 30(1), 33–34.
8. Presser, H.B. (1974): "Early Motherhood: Ignorance or Bliss?" Family Planning
Perspectives. Winter 1974; 6(1):8-14.
9. Presser, H.B. (1977): “Guessing and Misinformation about Pregnancy Risk among Urban
Mothers”. Family Planning Perspectives, Vol. 9, No. 3, pp. 111-115.
10. Kantner, J. and Zelnik, M. (1974): "United States: Exploratory Studies of Negro Family
Formation- Common Conceptions about Birth Control," Studies in Family Planning, Vol. 1,
No. 47, 1969, p. 10. 6.
11. Mendelbaum, D.G. (1974): “Human Fertility in India”. University of California Press,
Berkeley.

12. Mishra et al. (2014): “Men’s attitudes on gender equality and their contraceptive use in Uttar Pradesh
India”, Reproductive Health 2014, 11 :41http://www.reproductive-health-
journal.com/content/11/1/41.
13. Ryder, N.B. and Westoff, C.F. (1971): “Reproduction in the United States: 1965, Princeton
University Press, Princeton, N.J., 1971.
14. Wilcox, J. (2000), “The timing of the "fertile window" in the menstrual cycle: day specific estimates
from a prospective study”. BMJ ;321;1259-1262, doi:10.1136/bmj.321.7271.1259.
15. Yadava, R.C. and Mishra, C.P. (2012): “Poverty, Under-Nutrition and Fertility Nexus in Rural
Eastern Uttar Pradesh”, A Research Project Sponsored by India Council of Medical Research, New
Delhi.
16. Zelnik, M. and Kantner, J. (1977): "Sexual and Contraceptive Experience of Young
Unmarried Women in the United States, 1976 and 1971”. Family Planning Perspectives,
9:55, 1977.
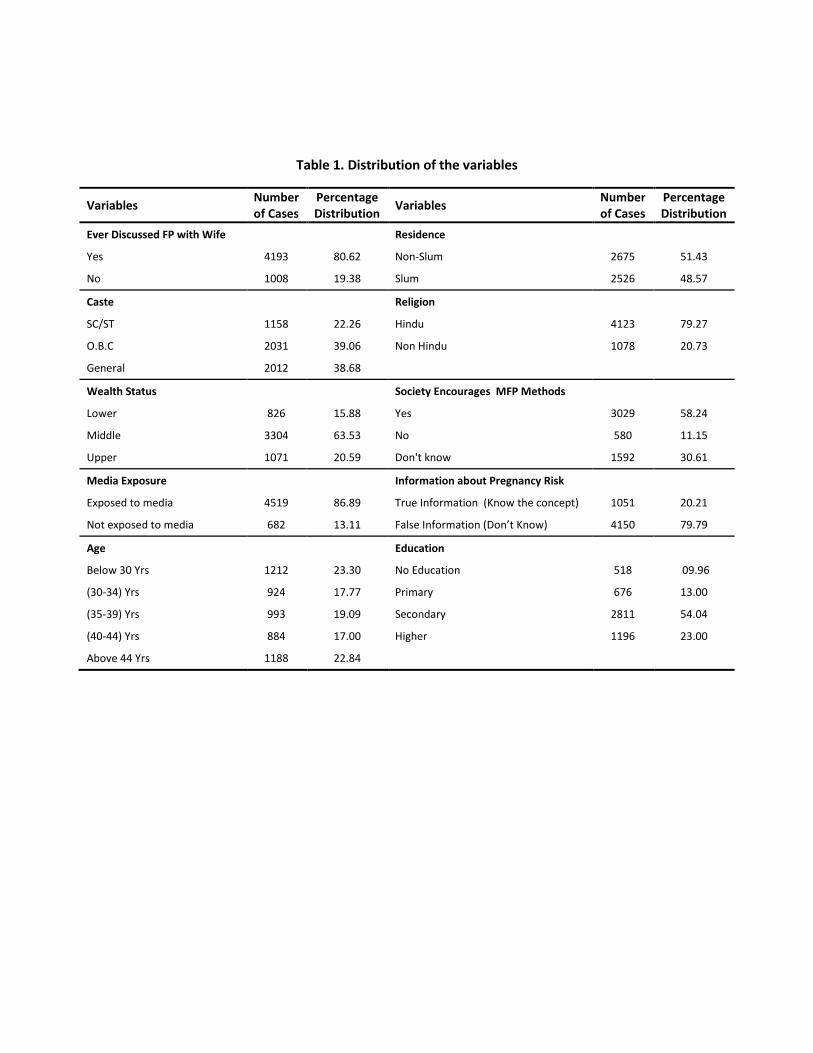
Table 1. Distribution of the variables
Variables Number of Cases
Percentage Distribution
Variables Number of Cases
Percentage Distribution
Ever Discussed FP with Wife
Residence
Yes 4193 80.62 Non-Slum 2675 51.43
No 1008 19.38 Slum 2526 48.57
Caste
Religion
SC/ST 1158 22.26 Hindu 4123 79.27
O.B.C 2031 39.06 Non Hindu 1078 20.73
General 2012 38.68
Wealth Status
Society Encourages MFP Methods
Lower 826 15.88 Yes 3029 58.24
Middle 3304 63.53 No 580 11.15
Upper 1071 20.59 Don't know 1592 30.61
Media Exposure
Information about Pregnancy Risk
Exposed to media 4519 86.89 True Information (Know the concept) 1051 20.21
Not exposed to media 682 13.11 False Information (Don’t Know) 4150 79.79
Age
Education
Below 30 Yrs 1212 23.30 No Education 518 09.96
(30-34) Yrs 924 17.77 Primary 676 13.00
(35-39) Yrs 993 19.09 Secondary 2811 54.04
(40-44) Yrs 884 17.00 Higher 1196 23.00
Above 44 Yrs 1188 22.84

Table 2. Percentage Distribution of Men Regarding the Perception about Pregnancy Risk During Menstrual Cycle
Highest chance of conception
Just before period begins
During period
Right after period ends
Halfway between two periods
Don't know
Total count
Residence Non-Slum 1.16 06.95 59.07 21.12 11.70 2675
Slum 1.39 10.33 55.42 19.24 13.62 2526
Caste
SC/ST 1.21 10.71 57.43 15.63 15.02 1158
O.B.C 1.58 08.71 56.97 21.27 11.47 2031
General 0.99 07.26 57.55 21.77 12.43 2012
Religion Hindu 1.33 08.68 60.44 17.12 12.43 4123
Non Hindu 1.05 08.41 53.77 22.06 15.24 1078
Education
No Education 2.80 08.41 56.07 13.08 19.64 518
Primary 0.84 11.81 53.43 17.99 15.93 676
Secondary 1.37 09.33 56.81 19.09 13.40 2811
Higher 1.18 05.27 60.51 24.40 08.64 1196
Age
Below 30 Yrs 0.99 09.57 57.84 17.24 14.36 1212
(30-34) Yrs 1.30 07.14 61.36 19.59 10.61 924
(35-39) Yrs 1.21 09.06 56.80 20.44 12.49 993
(40-44) Yrs 1.58 07.58 56.45 21.61 12.78 884
Above 44 Yrs 1.35 09.09 54.63 22.47 12.46 1188
Media Exposure
Exposed to media 1.33 08.92 57.47 20.40 11.88 4519
Not exposed to media 0.88 06.45 56.16 18.91 17.60 682
Society encourages MFP methods
Yes 1.16 08.02 53.55 24.30 12.97 3029
No 3.10 15.17 57.59 13.10 11.04 580
Don't know 0.82 07.29 64.32 15.01 12.56 1592
Wealth Status
Lower 1.21 11.50 54.96 17.19 15.14 826
Middle 1.30 07.63 58.23 20.25 12.59 3304
Upper 1.21 09.34 56.21 22.41 10.83 1071
Discussed FP with wife
Yes 1.14 07.35 56.79 23.83 10.89 4193
No 1.79 13.79 59.42 05.16 19.84 1008

Table 3. Test of Equality of Group Means Table for Slum
Predictors Mean/Group1 (Don’t Know)
S.D/Group 1 (Don’t Know)
Mean/Group2 (Know)
S.D/Group 2 (Know)
Wilks' Lambda
Sig.
Society Encourages MFP Method .53 .499 .70 .458 .982 .000
Doesn't Encourage MFP Method .13 .337 .07 .255 .995 .000
Don’t Know about society .34 .472 .23 .420 .992 .000
SC / ST .32 .467 .22 .413 .992 .000
OBC .42 .494 .44 .497 1.000 .429
General .26 .437 .34 .475 .994 .000
Hindu .81 .384 .59 .490 .957 .000
Non Hindu .19 .381 .41 .489 .957 .000
No Education .10 .173 .07 .111 .998 .024
Primary Education .12 .391 .11 .375 1.000 .319
Secondary Education .64 .486 .62 .486 1.000 .977
Higher Education .14 .369 .20 .400 .998 .049
Age Below 30 Yrs .26 .438 .22 .413 .999 .060
Age 30 to 34 Yrs .18 .386 .19 .394 1.000 .645
Age 35 to 39 Yrs .19 .395 .19 .391 1.000 .748
Age 40 to 44 Yrs .16 .367 .18 .387 .999 .233
Age Above 44 Yrs .20 .403 .22 .415 1.000 .427
Lower Wealth .22 .413 .17 .380 .998 .037
Middle Wealth .65 .476 .67 .470 1.000 .482
Upper Wealth .13 .335 .15 .362 .999 .132
Discussed FP with Wife .75 .411 .94 .274 .966 .000
Don't Discuss FP with Wife .25 .436 .06 .241 .966 .000
Exposed to Media .84 .353 .85 .314 1.000 .451
Not Exposed to Media .16 .371 .15 .358 1.000 .451

Table 4. Test of Equality of Group Means Table for Non Slum
Predictors Mean/Group1 (Don’t Know)
S.D/Group 1 (Don’t Know)
Mean/Group2 (Know)
S.D/Group 2 (Know)
Wilks' Lambda
Sig.
Society Encourages MFP Method .57 .495 .70 .459 .988 .000
Doesn't Encourage MFP Method .11 .316 .07 .263 .997 .008
Don’t Know about society .32 .465 .23 .419 .993 .000
SC / ST .15 .359 .13 .340 1.000 .261
OBC .35 .477 .39 .487 .999 .127
General .50 .500 .48 .500 1.000 .506
Hindu .83 .379 .73 .444 .990 .000
Non Hindu .17 .369 .27 .441 .989 .000
No Education .08 .118 .07 .118 1.000 .992
Primary Education .10 .301 .09 .282 1.000 .313
Secondary Education .51 .497 .42 .500 .997 .003
Higher Education .31 .471 .42 .494 .995 .000
Age Below 30 Yrs .22 .417 .18 .386 .998 .030
Age 30 to 34 Yrs .18 .381 .16 .363 1.000 .261
Age 35 to 39 Yrs .19 .390 .20 .399 1.000 .553
Age 40 to 44 Yrs .17 .378 .18 .385 1.000 .675
Age Above 44 Yrs .24 .427 .28 .451 .998 .032
Lower Wealth .11 .318 .10 .301 1.000 .388
Middle Wealth .62 .486 .61 .489 1.000 .680
Upper Wealth .27 .444 .29 .455 1.000 .290
Discussed FP with Wife .79 .405 .96 .194 .967 .000
Don't Discuss FP with Wife .21 .435 .04 .194 .967 .000
Exposed to Media .90 .324 .90 .299 1.000 .770
Not Exposed to Media .10 .304 .10 .288 1.000 .770
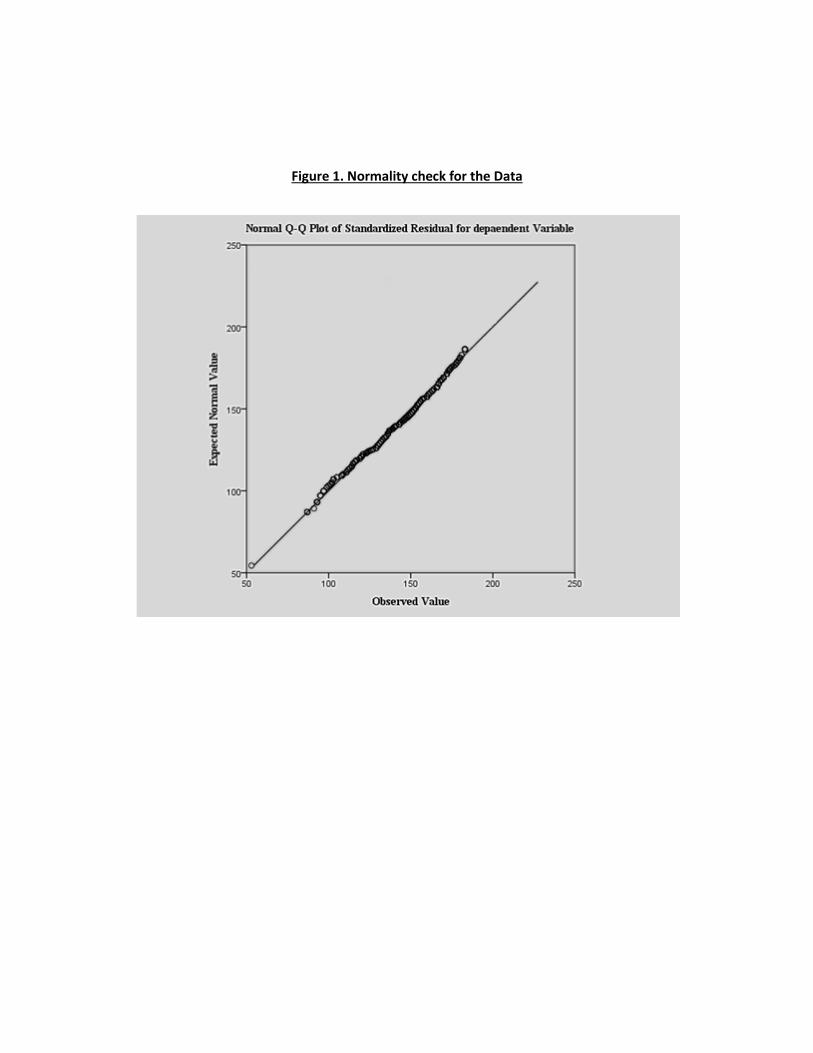
Figure 1. Normality check for the Data


![Measures of Child Knowledge and Regulation of Cognition[2002]](https://img.pdfslide.us/doc/110x75/577cc0361a28aba7118f416a/measures-of-child-knowledge-and-regulation-of-cognition2002.jpg)