Embed Size (px)
Citation preview
Coevolution of adaptive technology, maladaptive culture,
and population size in a producer-scrounger game
Laurent Lehmann
Marcus W. Feldman
April 26, 2009
Abstract
Technology (i.e., tools, methods of cultivation and domestication, systems of con-
struction and appropriation, machines) has increased the vital rates of humans, and is
one of the defining features of the transition from Malthusian ecological stagnation to
a potentially perpetual rising population growth. Maladaptations, on the other hand,
encompass behaviors, customs, and practices that decrease the vital rates of individu-
als. Technology and maladaptations are part of the total stock of culture carried by the
individuals in a population. Here, we develop a quantitative model for the coevolution
of cumulative adaptive technology and maladaptive culture in a “producer/scrounger”
game, which can also usefully be interpreted as an “individual/social” learner interac-
tion. Producers (individual learners) are assumed to invent new adaptive technology
or cultural practices by trial-and-error learning, insight, or deduction, and they pay the
cost of innovation. Scroungers (social learners) are assumed to copy or imitate (cultural
transmission) both the adaptations and maladaptations generated by producers. We
show that the coevolutionary dynamics of producers and scroungers in the presence
of cultural transmission can have a variety of effects on population carrying-capacity.
From stable polymorphism, where scroungers bring an advantage to the population
(increase in carrying-capacity) to periodic cycling, where scroungers decrease carrying-
capacity, we find that selection driven cultural innovation and transmission may send
a population on the path of growth or to extinction.
Keywords: Producer-scrounger game, technology, adaption, maladaptation, individual and
social learning, carrying capacity, cyclic dynamics.
1
2
Introduction
Over the last million years the human lineage has learned to transform natural resources into
technology; that is, tools, methods of cultivation and domestication, systems of construction
and appropriation, machines, modes of social organization. From Oldowan stone tools,
to steam engines, to genetic research, humans have mastered technology to the point of
being able to leave the surface of the earth and explore outer space. Technology is also
the basis of economic growth (Solow, 1956; Galor and Weil, 2000; Romer, 2006); without
technological innovations the human population would probably have long ago reached a
stable size (Kremer, 1993). Technology is thus one of the defining features of the transition
from Malthusian ecological stagnation to a potentially continuous economic and population
growth (Galor and Weil, 2000; Galor and Moav, 2002).
Technology can be interpreted as being a nonrival good: in economics a good is considered
to be nonrival if its consumption or use by one individual makes its use by someone else
no less difficult (Pindyck and Rubinfeld, 2001). For instance, the control of fire by one
individual does not in itself make its use by another individual more problematic. By
contrast, one individual’s consumption of some natural resources, such as a chunk of meat
or a piece of wood for the fire, does prevent the use of those resources by another individual
(consumption of natural resources is a zero-sum game: the gain or loss by one individual is
exactly balanced by the losses or gains to others). Before the advent of modern societies,
technology was probably also a nonexcludable good: a good is considered to be nonexcludable
if its use by one individual who has not paid for it is ineluctable (Pindyck and Rubinfeld,
2001). The invention of the wheel certainly took the inventor some time and effort, but use
of wheels by others would have been difficult to prevent. Goods that are both nonrival and
nonexcludable are called public goods (Pindyck and Rubinfeld, 2001).
For most of human evolution technology was probably a public good. The technology
produced by one individual could easily be copied and used by others in the population.
Because technology is probably costlier to produce, in terms of time and energy, than to
copy or imitate, the interaction between the individuals in a population producing and using
technology can be regarded as a “producer/scrounger” game. In this game, the individuals
of one type (the scroungers) make use of the behavioral investment of individuals of an-
other type, the producers (Barnard and Sibly, 1981; Giraldeau et al., 1994). Because the
technology developed by producers might be copied by scroungers, the interaction between
3
them can also usefully be regarded as an “individual/social” learner interaction. Here, the
individuals of one type (the social learners) copy or imitate the behaviors or artifacts that
have been generated by the other type (the individual learners), through trial-and-error
learning, insight, or deduction (Rogers, 1988; Stephens, 1991; Boyd and Richerson, 1995;
Wakano et al., 2004; Enquist and Ghirlanda, 2007). The evolution of technology (and the
origins of economic growth) can thus be framed in terms of the producer/scrounger game,
as well as in terms of the coevolution of individual learning and cultural transmission, in
which technology can be regarded as a suite of cultural practices.
Throughout human evolution, technology is also likely to have increased the vital rates of
individuals; that is, it is adaptive. But technology may become maladaptive, and decrease
the vital rates of individuals using it. For instance, agricultural practices, such as the clear-
ing of land, and irrigation, which increased productivity, might also have brought increased
contact between human populations and animal reservoirs of disease such as schistosomiasis
and malaria, which raised the mortality rate of the resident population (Huang and Man-
derson, 1993; Livingstone, 1958). Instead of traditional earthen pits, Alaskan natives now
often use plastic bags as food containers. These allow the growth of botulism bacteria that
increase the rate of death due to botulism (Lancaster, 1990). The suite of cultural practices
carried by the individuals in a population, therefore, may involve both adapative and mal-
adaptive components (Boyd and Richerson, 1985; Diamond, 2005; Enquist and Ghirlanda,
2007). We may thus postulate that producers of technology (individual learners) not only
produce adaptive cultural traits but, as a byproduct, may generate maladaptive traits, which
may be copied or imitated by scroungers (social learners).
The impact of adaptive and maladaptative cultural traits on human evolution has been
repeatedly stressed (Cavalli-Sforza and Feldman, 1981; Lumsden and Wilson, 1981; Boyd
and Richerson, 1985; Richerson and Boyd, 2005), but its cumulative nature has virtually
never been taken explicitly into account in evolutionary models of cultural transmission.
Further, the feedback of cultural adaptations and maladaptions on population dynamics is
also very likely to have affected human demography (Tainter, 1988; Diamond, 1997, 2005),
but this also has rarely been analyzed in an evolutionary context. There is a clear lack of
quantitative theory in this area and a need to gain a better understanding of how the evolu-
tionary dynamics drives the accumulation of culture, and how this feeds back on population
demography. This gap has started to be filled with the construction of macro-level models for
4
cumulative cultural dynamics (Enquist et al., 2008; Ghirlanda and Enquist, 2007; Enquist
and Ghirlanda, 2007). Here, we pursue this line of research by focusing more on micro-
level individual actions, and explore the coevolution of technological innovation, byproduct
maladaptation and population growth under a producer/scrounger game dynamics. The
producers are assumed to invent new technology or cultural practices, and pay a cost for
innovation. The scroungers are assumed to copy both the technology and maladaptations
generated by producers. We ask what are the equilibrium frequencies of producers and
scroungers that are selected for in the population, and how does the presence of scroungers
(cultural transmission) feed back on the equilibrium levels of adaptations, maladaptations,
and population size (carrying-capacity).
Model
Biological setting
We consider a panmictic population of large enough size to ignore the stochastic effects
introduced by finite population size. We assume that the amount of resources available to
an individual to produce offspring in this population depends on the amount of adaptive
and maladaptive cultural traits he/she expresses. Cultural adaptations (also referred to
as adaptive technology) encompasses such items as techniques to build arrows, a list of
poisonous foods, irrigation methods, or any other knowledge involved in hunting, gathering,
and cultivation of resources, which may increase the number of resources available to an
individual. Maladaptations, on the other hand represent behaviors, customs, or mystical
beliefs, which reduce the amount of resources invested into vital rates.
We assume that there are three types of individuals in the population. The first are
innates: these are individuals who do not express any cultural traits, be they adaptations or
maladaptations. The second are producers (individual learners), namely those individuals
that use adaptive technology and will augment its stock by trial-and-error learning, insight
or deduction. In so doing, producers are also likely to generate maladaptive behaviors. In
other words, producers augment both the stock of adaptive and maladaptive culture, and
pay a fitness cost ci for it. The third type of individuals are scroungers (social learners)
who copy or imitate the cultural traits invented by producers. The strategies of the three
5
types of individuals, innates, producers, scroungers, can be interpreted here as being either
genetically or culturally determined; in any case we consider that the inheritance of these
strategies occurs vertically from parent to offspring.
The events of the life-cycle of individuals in the population unfold in the following order:
(1) Reproduction occurs with the number of offspring produced by an individual depending
on the amount of resources he/she has gathered and that are not diverted into expressing
maladaptations. (2) Offspring grow and develop. Juveniles are subject to an enculturation
period during which producers and scroungers acquire and assimilate adaptive and mal-
adaptive cultural items from the individuals of the parental population, either by vertical
transmission, with probability v, and by oblique transmission, with complementary prob-
ability 1 − v. (3) Juveniles become adults and produce resources. Innates spend all their
time producing resources. Producers spend a fraction zi of their time inventing new adap-
tive technology (during which they might produce maladaptations) and a complementary
fraction 1 − zi of their units of time producing resources. Scroungers spend a fraction zs
of their time scrounging, during which they imitate both adaptive and maladaptive prac-
tices developed by producers, and a complementary fraction 1− zs of their time producing
resources.
Population dynamics
The fitness of an individual is defined here as the expected number of its offspring that reach
the stage of reproduction. We assume that this is an increasing, linear function of the total
amount of resources available to him/her (introducing diminishing returns does not change
the qualitative results reported here). We suppose that individuals are endowed with two
factors of production allowing them to produce resources: land and labor. The number of
units of land available to an individual is assumed to decrease with total population size
N (negative density-dependent competition), with the effective units of land available to
him/her being given by 1/(1 + ηN), where η measures the strength of density-dependent
competition (0 ≤ η ≤ ∞, see Table 1 for a list of symbols). Hence, in the absence of
density-dependence (η = 0) each individual is endowed with one baseline unit of land, and
the functional form of density-dependence follows the standard Beverton-Holt model from
ecology (discrete-time analogue of the logistic model, Begon et al., 1996; Brannstrom and
Sumpter, 2005).
6
Each individual is also endowed with one baseline unit of labor, which is decreased
by the time spent producing cultural items (or scrounging) and augmented by its level of
adaptive technology, with the effective units of labor being given by (1 + A)(1 − z), where
A is the stock of adaptations and (1 − z) is the fraction of time spent in labor. Hence,
an innate (A = 0 and z = 0) is endowed with one baseline unit of labor. We assume
that effective units of land and effective units of labor combine multiplicatively to give
the total amount of resources (1 + A)(1 − z)/(1 + ηN) available to an individual. With
these assumptions, the production of resources follows the standard Cobb-Douglas model
from economics with unit exponent (Cobb and Douglas, 1928; Pindyck and Rubinfeld, 2001;
Romer, 2006; with exponential components for the production function, i.e. with functional
form {(1 + A)(1 − z)}γ1/(1 + ηN)γ2 , the qualitative results reported here do not change).
The main motivation behind endorsing the above simplifying assumptions is to make the
model analytically tractable by using well established functional forms.
Having specified the functional relationships mapping factors of production into resource
availability, it remains to specify how the benefits of producing resources, the cost ci to
producers, and the cost of expressing maladaptations affect fitness. Two main possibilities
are usually considered in evolutionary biology: additive and multiplicative effects of costs
and benefits on fitness. We investigated these two cases, but present only the additive case
in the main text as it turns out to be analytically more tractable thus allowing us to develop
intuitions about the dynamics of the system. Introducing multiplicative effects does not
change the qualitative results reported here (see the Appendix).
With our assumptions, the fitness of an innate at time t is given by
wg,t =α
1 + ηNt, (1)
where α is a scaling factor converting the amount of resources available to an individual into
offspring production, and can be thought of as the maximum rate of offspring production
with one unit of resource (0 ≤ α ≤ ∞). The fitness of a producer is
wi,t = α
[(1 +Ai,t)(1− zi)
1 + ηNt− cMMi,t − ci
], (2)
where Ai,t is the stock of adaptations used by a producer at time t; cM is a scaling factor,
which converts maladaptions into a decrease in the amount of resources used in offspring
production (0 ≤ cM ≤ ∞); and Mi,t is the amount of maladaptations carried by a producer
at time t. The net cost of expressing maladaptations is thus given by cMMi,t. Finally, ci is
7
the fitness cost of being a producer relative to being a scrounger (see eq. A-1 in the Appendix
for the multiplicative version of the fitness function). The fitness of a scrounger is
ws,t = α
[(1 +As,t)(1− zs)
1 + ηNt− cMMs,t
], (3)
where As,t is the stock of adaptations used by a scrounger at time t and Ms,t is the stock of
maladaptations carried by him/her (see eq. A-2 for the multiplicative version of the fitness
function). Notice that these fitness functions entail, first, that being a producer has a fitness
cost relative to being a scrounger, and, second, that both producing and scrounging are
costly relative to being a innate (when everything else is the same) because less time is
spent extracting resources.
With these fitness functions we can obtain the frequency pt (qt) of producers (scroungers)
in the population at time t by evaluating the ratio of the number of their offspring to the
total number of offspring in the population as
pt+1 =wi,tptwt
, (4)
and
qt+1 =ws,tqtwt
, (5)
where
wt = (1− pt − qt)wg,t + ptwi,t + qtws,t (6)
is the mean fitness in the population. From this equation, we obtain the total population
size in the next time generation as
Nt+1 = wtNt. (7)
In the absence of producers and scroungers, pt = qt = 0 for all t, the population is monomor-
phic for innates. Then, from eq. 1, eq. 6, and eq. 7, and if α > 1 and η > 0, population size
converges to the stable value (carrying-capacity):
N =α− 1η
, (8)
where throughout the paper the caret denotes an equilibrium value.
8
Adaptation dynamics
We now present expressions for the dynamics of adaptive technology used by producers (Ai,t)
and scroungers (As,t). In order to obtain these expressions we denote by
At = ptAi,t + qtAs,t (9)
the stock of adaptations used by an individual sampled at random from the population at
time t (average stock of adaptations).
The stock of adaptations used by a producer consists of two parts. First, a producer living
at time t acquires adaptations from the individuals of the parental generation (stage (2) of
the life-cycle). With probability v it copies its parent and otherwise copies an individual
sampled at random from the parental population, and then acquires an amount At−1 of
adaptations (see eq. 9). Second, a producer living at time t generates an amount IA,t of
adaptations by itself, which is the per capita rate of adaptive technological innovation. As
a result, the stock of adaptations used by a producer at time t is
Ai,t = (1− εA) [vAi,t−1 + (1− v)At−1] + IA,t, (10)
where εA is an exogenous decay rate of adaptations (0 ≤ εA ≤ 1). This parameter can be
interpreted as the rate of obsolescence of technology from one generation to the next (for
instance because the exogenous environment changes), as an error rate in copying technology
from the parental generation, or even as a pure loss of knowledge due to lack of memory if
the system of knowledge, e.g., list of poisonous food, is mainly stored in peoples’ heads (for
simplicity, we do not consider and endogenous decay rate).
As was the case for a producer, we assume that the stock of adaptations used by a
scrounger consists of two parts. First, a scrounger living at time t acquires cultural traits
from the parental generation either by vertical and/or oblique transmission. Second, a
scrounger may scrounge on the total stock ptNtIA,t of adaptations generated at time t by
all producers in the population. Then, the stock of adaptations used by a scrounger at time
t is
As,t = (1− εA) [vAs,t−1 + (1− v)At−1] + zsβAptNtIA,t, (11)
where βA is a transmission parameter (0 ≤ βA ≤ 1), which can be interpreted as the con-
tact rate between producers and scroungers multiplied by the probability of transmission
9
of cultural items from producers to scroungers. The transmission probability may depend
on the concealment of traits by producers or the degree of excludability of adaptations. If
technology becomes more excludable, then βA decreases, holding everything else constant,
and complete excludability would correspond to βA = 0. Eq. 11 entails that a scrounger may
assimilate the technology of several different individuals, and implicit in the use of ptNtIA,t
is the assumption that the technology expressed independently by different producers can
be combined additively. We found no micro-foundations in the economics or cultural evo-
lution literature to justify any particular functional form for the aggregation of cultural
items. Thus, additive aggregation is the natural starting point as it is the most analytically
tractable.
Finally, we need an expression for IA,t, which we assume takes the form
IA,t = zi [µ(1− x) + ϕA{vAi,t−1 + (1− v)At−1}] , (12)
where µ is the rate of innovation per unit time invested into learning, which is independent
of the adaptations acquired from the parental generation (0 ≤ µ ≤ ∞), and x is the fraction
of these innovations that are maladaptive. The parameter ϕA is a rate of innovation, which
converts existing adaptations into new ones (0 ≤ ϕA ≤ ∞). The parameterization of eq. 12,
where new adaptive technology is created de novo (at rate µ(1 − x) per unit investment)
and from existing technology (at rate ϕA) follows the work of Enquist and Ghirlanda (2007,
eq. 8-9) and Enquist et al. (2008, eq. 18), who developed macroscopic models for the dynam-
ics of adaptations and maladaptations aiming at fitting empirical data. We mention that
economists endorse quiet similar assumptions for the dynamics of technology (e.g., Galor
and Weil, 2000; Romer, 2006), but tend to exponentiate the existing technology, which does
not alter the qualitative results reported here.
Maladaptation dynamics
Here, we present expressions for the amount of maladaptions carried by producers (Mi,t) and
scroungers (Ms,t) in the population. Similarly to the average stock of adaptations introduced
above (eq. 9), we denote by
Mt = ptMi,t + qtMs,t (13)
the stock of maladaptations carried by an individual sampled at random from the population
at time t (average maladaptation).
10
As was the case for adaptations, we assume that the stock of maladaptations carried by a
producer consists of two parts. First, an individual acquires maladaptions from individuals of
the parental generation by vertical and/or oblique transmission. Second, producers develop
IM,t new maladaptations during generation t. Combining these, the stock of maladaptions
used by a producer at time t is
Mi,t = (1− εM) [vMi,t−1 + (1− v)Mt−1] + IM,t, (14)
where εM is a decay rate of maladaptations, which can be interpreted as the rate of loss of
maladaptations due to errors in copying exemplar individuals or selective filtering, which
corresponds to a higher probability of adopting adaptive rather than maladaptive cultural
traits (Enquist and Ghirlanda, 2007). In addition to inheriting maladaptions from the
parental generation, scroungers are assumed to copy them from the total stock ptNtIM,t
of maladaptations generated at time t by all producers in the population. The stock of
maladaptions used by a scrounger at time t is then given by
Ms,t = (1− εM)Mt−1 + zsβMptNtIM,t, (15)
where βM is the transmission rate of maladaptions from producers to scroungers (0 ≤ βM ≤
1), which can be thought of as the contact rate between producers and scroungers multiplied
by the per individual transmission rate of maladaptations from producers to scroungers.
Finally, the amount of maladaptations developed by a producer in generation t is assumed
to be given by
IM,t = zi [µx+ ϕM{vMi,t−1 + (1− v)Mt−1}] . (16)
where ϕM is the rate of conversion of existing maladaptations into new ones. In eq. 16, we
ignored, for simplicity, the possibility that existing adaptations may generate new maladap-
ations (again, introducing such a feature does not alter the main qualitative results reported
here).
Our model tracks the non-linear dynamical system characterized by the variables pt, qt,
Nt, Ai,t, As,t, Mi,t, Ms,t (eq. 4, eq. 5, eq. 7, eq. 10, eq. 11, eq. 14, and eq. 15), and allows
us to track the dynamics of pt, qt, Nt, At, and Mt, which eventually converge to some
equilibrium point given by p, q, N , T , M . Depending on the parameter values, this system
can be complicated, and we studied its dynamics and equilibrium points using analytical
expressions when we were able to derive them (or when they are not too complicated), and
used numerical analysis for the more complicated cases.
11
Results
Adaptations without maladaptations
In this section we present results for the case where there are no maladaptions (x = 0,
ϕM = 0, and M0 = 0) so that only the dynamics of pt, qt, Nt, and At are involved.
Analytical results
If we further assume that the investment into producing and scrounging are the same (zi =
zs = z) and that there is no cost to individual learning (ci = 0), the analysis simplifies
considerably. In the absence of scroungers (q0 = 0), a small fraction of producers (p0 → 0)
will invade a population of innates if wi,t > wg,t (eq. 1 and eq. 2). That is, if (1+zµ)(1−z) >
1, which reflects a trade off between the gains from inventing new adaptive technology (first
parentheses) and the loss of productivity incurred from spending time inventing technology
(second parentheses). By rearranging, the gains outweigh the losses when
µ >1
1− z, (17)
where the paramaters εA and ϕA do not affect this invasion condition the stock of adaptive
technology of the parental generation is initially set to zero (no producers and no scroungers
in the parental generation).
If the condition of invasion of producers is satisfied, it can also be shown that producers
will not only spread where rare but will also go to fixation in the population, in which case
p = 1. This occurs because the fitness of producers will be higher than that of innates at all
frequencies of innates in the population (the accumulation of adaptations can only further
increase the fitness of producers relative to that of innates). If the invasion condition is not
satisfied, the producers will be expelled from the population, in which case p = 0. Therefore,
no polymorphism is maintained and, depending on the balance between fitness costs and
benefits of producing (see eq. 17), the population will be be either fixed for innates (p = 0)
or fixed for producers (p = 1) in the long-term. In the latter event, we find from eq. 7,
eq. 10, and eq. 12 that the carrying-capacity is given by
N =1η
(α(1− z)(1 + A)− 1
), (18)
12
where the equilibrium level A of average adaptations is
A =zµ
εA − zϕA. (19)
Thus, by generating A, producers increase the carrying-capacity; that is, they bring an
advantage to the population (compare eq. 18 to eq. 8). Notably, the intensity of vertical
transmission v does not appear in eqs. 18–19, and thus has no effect on equilibrium values; it
only affects the rate of convergence to equilibrium. For ease of presentation, we set v = 0 in
the rest of the paper; that is, juveniles copy only an individual sampled at random from the
population (the value of v does not affect any of the analytical equilibrium points reported in
this paper nor does it affect the qualitative results observed under non-equilibrium dynamics
reported below).
Eqs. 18–19 show that, given values of η, µ, and z, the stable population size will be mainly
affected by the difference εA−zϕA between the exogenous decay rate εA and the endogenous
growth rate zϕA of existing adaptations. As this difference goes to zero, both the level of
cultural adaptations and population size approaches infinity. Hence, a theoretical possibility
is the realization of Marquis de Condorcet’s view that cogitation will generate innovations (µ
and ϕA), which will remove any obstacle (εA) to technological improvement, and then break
the Malthusian iron limit. This is a classical result from macroeconomic theory (Kremer,
1993; Romer, 2006) and termed the “demo-cultural explosion” by Ghirlanda and Enquist
(2007).
Introducing scroungers into a population fixed for producers (p = 1) results in the invasion
by scroungers, and in a unique stable polymorphism between producers and scroungers
characterized by
p =1
zβAN, (20)
where N is given by eq. 18. Thus p varies inversely with the rate of transmission βA of
technology to scroungers and with N , but, crucially, neither N nor A is affected by βA and
the frequency of scroungers. If zi = zs = z and ci = 0, scrounging has no effect on population
carrying-capacity: it brings neither an advantage nor a disadvantage to the population. This
feature is illustrated in Figure 1, where producers first invade a population of innates, then
go to fixation, and are subsequently invaded by scroungers, with the presence of scroungers
not perturbing the equilibrium population size.
13
The equilibrium adaptive technology and population size are unaffected by the presence
of scroungers because these individuals aggregate the adaptive technology of many different
producers in the population, and then pass it to the next generations. Hence, the decrease in
amount of adaptations inherited from the parental generation that stems from a reduction
in the number of producers can be compensated by the increase in adaptations due to their
aggregation by scroungers. At equilibrium, the same amount of adaptations will be main-
tained with fewer individuals producing it. This accords with previous results delineating
several situations where cultural transmission does not increase population fitness even if
it is selected for (Rogers, 1988; Stephens, 1991; Boyd and Richerson, 1995; Wakano et al.,
2004; Enquist and Ghirlanda, 2007)
Numerical results
If we assume that the proportion of time spent producing adaptive technology is different
from that spent scrounging it (zi 6= zs), the analysis becomes more complicated and we
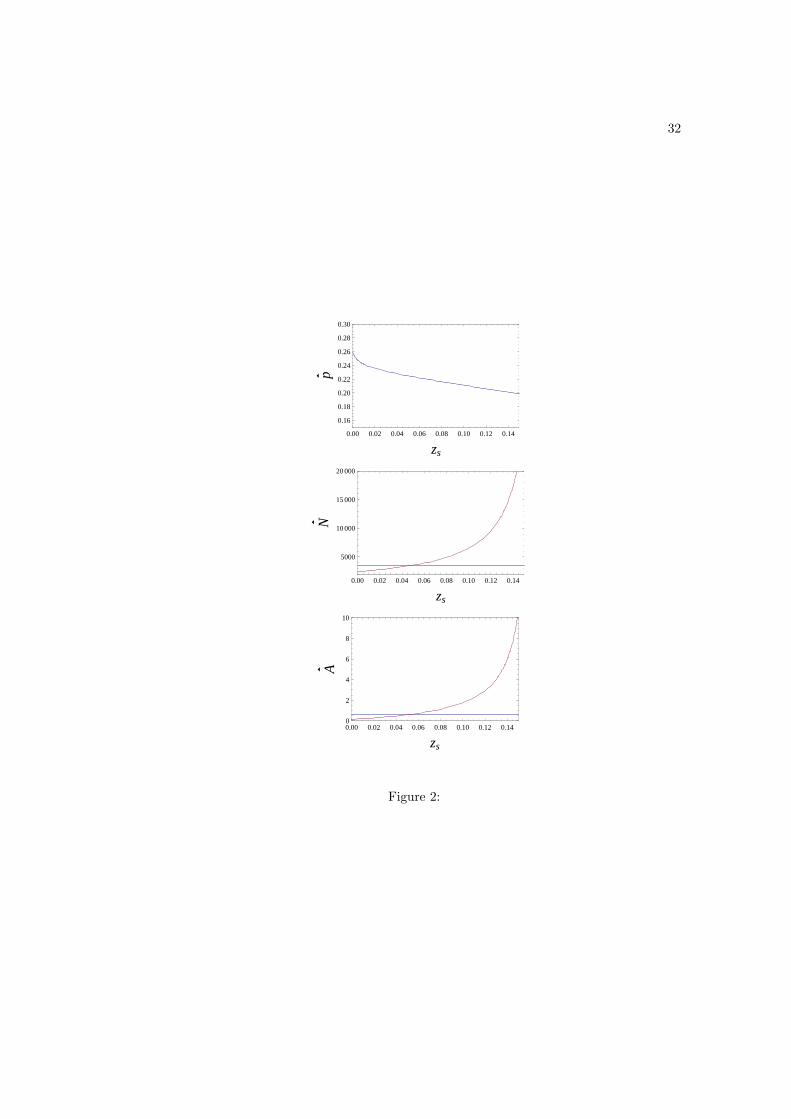
present only numerical results for this case. When zs > zi, we observe that p decreases as zs
increases while zi is held constant (Fig. 2). But N and A behave in the opposite way with
both increasing as zs increases while zi is held constant (Fig. 2). Consequently, increased
scrounging has the potential to increase the average level of adaptation and population size
(Fig. 3). This occurs because the more time that scroungers spend scrounging, the more
they aggregate adaptations from different producers (see the second term on the right hand
side of eq. 11), thereby raising the average stock of adaptations in the population (which
varies directly with zs). This, in turn, increases the amount of adaptive technology that
both producers and scroungers inherit from the parental generation (eq. 10 and eq. 11), and
the rate of innovation when IA,t > 0 (eq. 12). Hence, when zs > zi, scrounging increases
carrying-capacity. By contrast, when zs < zi, we observe that p decreases as zs decreases
while zi is held constant, but the equilibrium values N and A are reduced instead of increased
(Fig. 3).
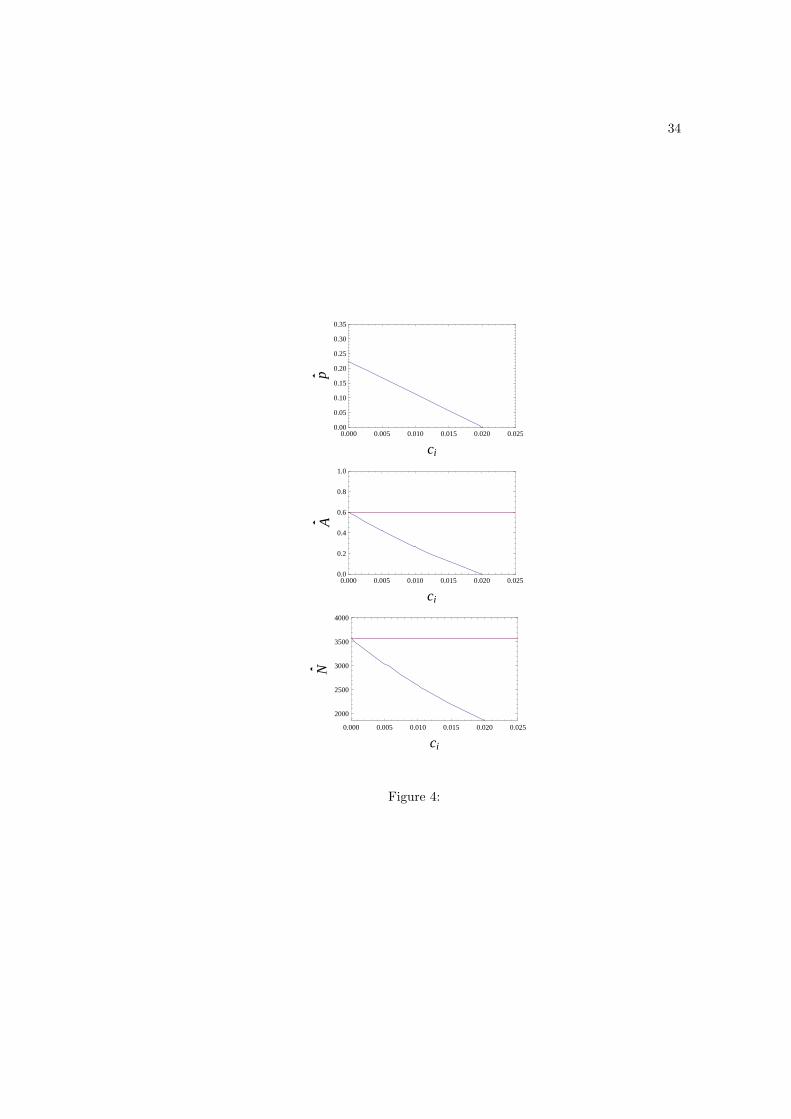
The main effect of introducing a fitness cost to being a producer relative to being a
scrounger (ci > 0) is that it decreases p (Fig. 4), which decreases the equilibrium stock of
adaptive technology, and consequently N . By contrast to the case where there is no cost
to producers, the equilibrium values N and A will be affected by introducing scroungers
into the population even for zs = zi. The presence of scroungers actually decreases both N
14
and A, everything else being constant (Fig. 4). Hence, when producers bear a fitness cost
relative to scroungers, scrounging decreases the carrying-capacity, everything else being held
constant.
Adaptations with maladaptations
We now allow maladaptations to affect the coevolutionary dynamics of producers and
scroungers, and analyze the dynamics of pt, qt, Nt, At and Mt.
Analytical results
Again we start by assuming that zi = zs = z and ci = 0, and further that εA = εM = ε
(rate of obsolescence of adaptations equals the rate of loss of maladaptations), ϕA = ϕM = 0
(rate of growth of adaptations and maladaptations do not depend on past adaptations), and
that βA = βM = β (the rate of transfer of adaptations and maladaptations from producers
to scroungers is the same). In the absence of scroungers, a small fraction of producers may
invade a population of innates; this occurs if (1+z(1−x)µ)(1−z)−zµxcM > 1, which reflects
a trade off between the gains from inventing new adaptive technology (first parentheses
of the first term) and two types of costs: loss of productivity incurred by spending time
inventing cultural traits (second parentheses of the first term) and cost due to expressing
maladaptations. The gains outweigh the losses when
µ >1
(1− z)(1− x)− xcM, (21)
where ε does not affect this invasion condition because the level of adaptations and of mal-
adaptations of the parental generation is initially set to zero (no producers and no scroungers
in the parental generation).
The main qualitative difference between eq. 21 and the invasion condition without mal-
adaptions (eq. 17) is the cost due to generating maladaptations, which decreases the selective
advantage of producers. If the invasion condition is satisfied, it can again be shown that
the fitness of producers will be higher than that of innates at all frequencies of innates in
the population, so that producers will go to fixation in the population. In this event we
have p = 1 and from eq. 7, eq. 10, eq. 11, and eq. 16, fixation of producers results in the
15
carrying-capacity being given by
N =1η
(α(1− z)(1 + A)
1 + αcMM− 1
), (22)
where
A =zµ(1− x)
ε(23)
and
M =zµx
ε. (24)
The main qualitative difference between eqs. 18–19 and eqs. 22–24 is that N is now a
decreasing function of the equilibrium average stock of maladaptations in the population.
Introducing scroungers into a population of producers, allows us again to find a unique
stable polymorphism between producers and scroungers, which is characterized by
p =1
zβN, (25)
where N is given by eq. 22. Qualitatively this is the same result as eq. 20. Quantitatively, the
presence of maladaptation increases the equilibrium level of producers p: increasing the rate
of production x of maladaptations and/or the cost cM of maladaptations decreases N , which
causes p to increase. Eqs. 22–25 show that when βA = βM = β the rate of transmission of
cultural variants from producers to scroungers does not affect A and M , which is the same
result as that found without maladaption. But if the rates of transmission of adaptations
and maladaptions from producers to scroungers are different (βA 6= βM), then A and M will
be affected by βA and βM (see eqs. A-6–A-5 of the Appendix).
Numerical results
More generally, the rates of loss of technology and maladaptations may be different (εA 6=
εM) and the appearance of new adaptations and maladaptations may be dependent on the
amount of existing cultural traits (ϕA > 0 and ϕM > 0) or a combination of these factors.
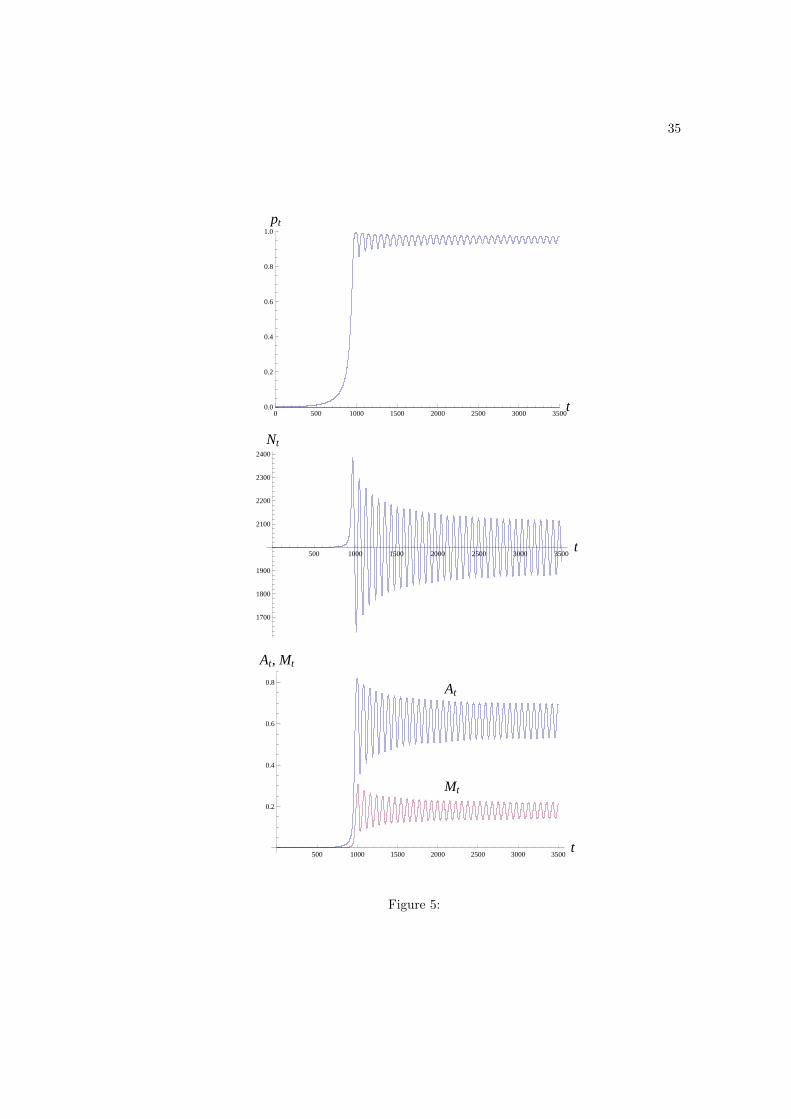
In all these cases, and assuming no scroungers (q0 = 0), we find that either there is a stable
polymorphism between innates and producers, or innates and producers coexist in a stable
periodic cycle (Fig. 5). Producers do not fix in a population of innates when the increase
in fitness benefits brought by adaptations is balanced by the fitness costs resulting from the
16
expression of maladaptations. Both fitness costs and benefits are frequency-dependent, with
the consequence that the fitness of producers becomes equivalent to that of innates (negative
frequency-dependence on producers) before producers fix in the population. This will cause
the carrying-capacity to be either the same as that determined by innates (eq. 8, if there is
a stable polymorphism between innates and producers), or result in periodic cycling around
this value (Fig. 5).
There is a large range of parameter values for εA 6= εM, or ϕA > 0 and ϕM > 0, or a
combinations of these, where periodic cycling of producers, technology, maladaptation and
population size occurs (ϕA, ϕM, εA, εM are so-called bifurcation parameters). This follows
from the following considerations. Initially producers increase technology and invade the
population of innates (without enough maladaptations to prevent the initial increase in pro-
ducer frequency). Then maladaptions accumulate (for instance if the rate of production
of new maladapations is low, but their rate of decay is not lower than that of technology:
εA>εM) in which case a calculable point is eventually reached where the fitness of produc-
ers declines drastically, causing their decrease in frequency, followed by a rapid decline in
adaptations and subsequently of maladaptions (Fig. 5). This results in a situation where the
stock of maladaptations is again too low to prevent the increase in frequency of producers:
the cycle starts again.
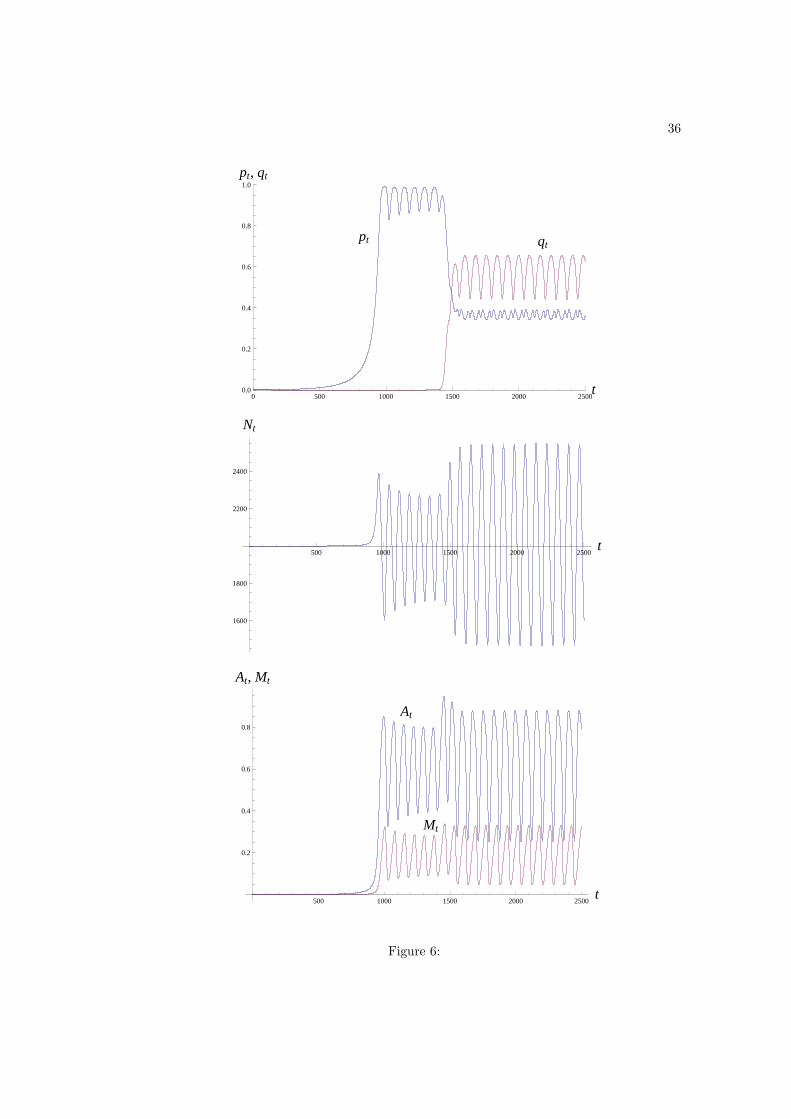
Introducing scroungers into a population polymorphic for innates and producers can
result in the coexistence between the three types, either in a stable polymorphism or in a
periodic cycle (Fig. 6). As was observed in the presence of maladaptations, the typical time
dynamics of the system when small fractions of producers and scroungers are introduced into
the population is that producers invade first, and are then invaded by scroungers, with the
population finally settling either at a stable polymorphic equilibrium or into a state where
the frequencies of the three types oscillate periodically (Fig. 6). We observed cycling under
a large range of parameter values, and there are situations where the population size rises
and falls sharply, possibly reaching the point of extinction.
Finally, we mention that assuming that zs > zi or ci > 0 in the presence of maladaptations
changes the dynamics of the system qualitatively in exactly the same way as was observed
in the absence of maladaptations with everything else held constant. That is, producers and
scroungers may still invade a population of innates and, depending on parameter values,
may settle either at a stable equilibrium or at a cyclic polymorphism involving the three
17
strategies. In general, we observed that, holding everything else constant, zs > zi will
augment the amplitude of the oscillations. Hence, scrounging leads to greater fluctuations
in carrying-capacity.
Discussion
We have presented a model for the evolution of adaptive technology and maladaptive culture,
both of which were assumed to be generated by producers, copied or imitated by scroungers
within generations, and culturally transmitted by learning between generations. Adaptive
technology represents any tool, method of cultivation, system of construction and appro-
priation, or mode of social organization, which may result in an increase in the resources
obtained by the individuals in the population, and hence in their vital rates. On the other
hand, maladaptive culture represent behaviors, customs, or mystical beliefs, which reduce
the amount of resources invested into survival or reproduction, and may therefore decrease
the vital rates of individuals. The accumulation of adaptive and maladaptive cultural traits
can be interpreted as giving the total stock of culture carried by the individuals in the pop-
ulation. We have analyzed how this stock of culture is selected for through the interaction
between innates (individuals using neither adaptations nor maladaptations), producers, and
scroungers, and how the resulting dynamics feed back on equilibrium population size. We
introduced the “innates” mainly in order to have a benchmark population of individuals,
which do not express cultural traits and where the carrying capacity is determined by con-
struction by exogenous factors. But the model and results applies without the innates, by
considering only producers and scroungers, which is probably the case for humans.
Adaptations without maladaptations
Our results suggest that in the absence of maladaptions, producers are likely to invade a
population of innates and will then go to fixation causing population size to increase (eq. 17
and Fig. 1). By allowing individuals in the population to obtain more resources, the benefits
of adaptive technology may offset the cost of innovation (loss of time devoted to labour), and
increase the vital rates of individuals. Scroungers may then invade a population of producers
with the consequence that the population will approach a stable polymorphism (Fig. 1). Is
adding scroungers advantageous or disadvantageous to the population; that is, how does
18
cultural transmission affect population size? Our results show that this is sensitive to the
parameter values. When producing has some intrinsic cost relative to scrounging (ci > 0,
eq. 2), adding scroungers might actually undermine population productivity and thus reduce
equilibrium population size (Fig. 4). Here, cultural transmission is detrimental to the popu-
lation. In the absence of costs, and with equal effort required for producing and scrounging,
the population size is not affected by the presence of scroungers: the demographic conse-
quences of cultural transmission are neutral (Fig. 4), although any frequency of scroungers
can be maintained at equilibrium by tuning the transmission parameter βA (eq. 20). How-
ever, when scroungers put more effort into scrounging than producers do into producing,
and everything else is held constant, scroungers may greatly increase population size: here
cultural transmission brings an advantage to the population (Fig. 3). This occurs because
scroungers aggregate the technology of many different producers in the population, thereby
increasing the average level of technology, which is then passed on to the next generations.
Scroungers can be regarded as fitness amplifiers in this case.
Adaptations with maladaptations
Adding maladaptations (as byproducts of technological innovation or corruption of past tech-
nology) markedly affects the co-evolutionary dynamics of innates, producers, and scroungers.
Qualitative changes in the dynamics occur in at least two different ways. First, innates may
coexist with producers at a stable polymorphism, or with producers and scroungers so that
all three strategies are maintained in the population. Innates will be retained in the popu-
lation only if the fitnesses of the other strategies are not greater than theirs, which entails
that the population size will not be increased by the presence of producers or scroungers.
This occurs when the gains in productivity brought about by adaptation are exactly offset
by the loss of resources resulting from the expression of maladaptations, with the result that
cultural practices and transmission are neutral with respect to their effects on equilibrium
population size. Neither producers nor scroungers bring an advantage or disadvantage to
the population.
The second way in which adding maladaptations affects the coevolutionary dynamics
is that they may cause periodic cycling of strategies and demographic variables for a large
range of parameter values (Fig. 5 and Fig. 6). Cycling may occur in our model with all three
types of strategies in the population, and it may result in sharp oscillations of population
19
size, above and below the value attained by a population of innates. Cycling occurs when
technology first grows faster than maladaptations, but maladaptations accumulate subse-
quently (for instance if the rate of production of new maladapations is low, but their rate of
decay is slower than that of adaptations) in which case a point is reached where the fitness
of producers declines and causes their decrease in frequency, which is followed by a decline
in adaptive technology and of production of maladaptions (Fig. 5). The stock of maladap-
tations then reaches a threshold value that it is too low to prevent the increase in frequency
of producers, which increase in frequency again and concomitantly brings technology into
the population, so that the cycle can repeat itself. In these situations, cultural innovations
and transmission bring periodic advantages and disadvantages to the population possibly
placing the population at risk of extinction. The presence of scroungers sometimes amplifies
these oscillations, so they can be seen as fitness disrupters in this case.
Learning and macroeconomic models
Our formalization is related to two distinct previous modeling approaches. First, it has
features in common with previous models on the evolution of individual and social learning
(e.g., Rogers, 1988; Stephens, 1991; Boyd and Richerson, 1995; Wakano et al., 2004; Enquist
and Ghirlanda, 2007). Such models usually assume fluctuating environments to which in-
dividual learners can adapt by trial-and-error learning or insight. Social learners are then
assumed to copy individual learners without paying the cost of individual learning (analo-
gous to our parameter ci, and which can be thought of as the “cost of plasticity”). This can
result in either a stable or a cyclic polymorphism between the strategies in the population.
As in our model, individual learners can be seen as producers (inventing new behaviors),
and social learners as scroungers (copying the new behaviors), so that the basic underlying
game structure in these classical models is similar to ours. The crucial difference is that we
do not invoke exogenous environmental fluctuations, but consider explicitly the cumulative
aspect of culture. That is, producers (individual learners) produce adaptive technology and
maladaptations that accumulate over generations so that the environment (stock of cul-
ture) is endogenously determined. This defining feature of our model may result in different
qualitative outcomes concerning the coexistence of social and individual learners from those
obtained in previous formalizations. In particular, in previous work social learners are not
selected for in the absence of costs to individual learning (e.g., ci = 0, zi = zs) because they
20
have the same fitness as producers in that case. In our model, by contrast, social learners
may still be favored by selection as they can aggregate adaptive cultural traits from different
individuals, so that when rare they may have higher fitness than producers.
Second, because we formalized the cumulative aspect of technology and maladaptations
explicitly, our model has features in common with models of economic growth such as those
traditionally employed in macroeconomics to study economics growth (e.g., Solow, 1956;
Kremer, 1993; Galor and Weil, 2000; De La Croix and Michel, 2002; Romer, 2006). These
models often take into account the cumulative aspect of technology and its feedback on
demography. Technology (in combination with other factors of production) then affects the
output of individuals and/or their vital rates, in the same or in a more refined way than we
considered in our fitness functions (eq. 2 and eq. 3). Our formalization thus delineates a link
between such models and those of cultural transmission. Future models may go further and
take into account both geographic and age structure, which are crucial demographic features
affecting the evolution of populations (e.g., Wright, 1931; Charlesworth, 1980; Rousset, 2004)
and economic growth dynamics (e.g., De La Croix and Michel, 2002; Romer, 2006).
Implications and outlook
Although our model is based on a series of simplifying assumptions, the general qualitative
features seem robust to changes in functional forms, which suggests two main implications
of our results. First, as mentioned above, a classical result of cultural evolution theory is
that individual and social learning are favored under conditions of fluctuating exogenous
environments, and cultural transmission does often not increase population fitness (Rogers,
1988; Stephens, 1991; Wakano et al., 2004, see Boyd and Richerson, 1995; Enquist et al., 2007
for exceptions to the rule). Our results point to broader conditions for selection on individual
and social learning, which may actually evolve under a stable exogenous environments if
individual learners (producers) generate a stock of adaptive cultural traits, which can itself
be seen as an endogenous environment. With the environment (or part of it) being an
endogenous dynamical variable, the effects of social learning (scroungers) on fitness is also
changed. Our results show that the coevolution of producers and scroungers may then result
in a wide variety of dynamics, in which selection-driven cultural innovation and transmission
evolve to be advantageous (increase in carrying capacity) as well as detrimental to the
population (decrease in carrying capacity). From a theoretical point of view, our analysis
21
thus singles out unrecognized conditions for the evolution of individual and social learning,
and where cultural innovation and transmission can greatly increase population size. There
is a set of parameter values where this process results in infinite population size (e.g., eq. 18
and eq. 19).
Second, taking the dynamics of maladaptions explicitly into account, and thus considering
the observation that not all aspects of culture are beneficial to population growth (Kaplan
and Lancaster, 1999, Richerson and Boyd, 2005, chapter 5), led us to identify feedbacks on
population demography that generate cycling under a large set of parameter values. In a
stochastic world this means an increase in the extinction probability of the population. This
feature might be of empirical relevance for understanding the rise and fall of populations
due to endogenous factors. As exemplified by the massive diversion of natural resources to
ceremonial construction on Easter Island, that are linked to the final collapse of this society,
maladaptations are likely to affect population demography (Tainter, 1988; Diamond, 2005).
Importantly, cycling occurs in our model (Fig. 5 and Fig. 6) and it is an outcome of the
evolutionary dynamics, made possible by cultural maladaptations being a by-product of the
production of cultural adaptations. Modeling maladaptations as a fraction of the innovation
that are not adaptive (see eq. 16 and also Enquist and Ghirlanda, 2007) seems to us to
be a very plausible assumption; in the biological context it is well-known that most novel
genetic mutations are deleterious (Eyre-Walker and Keightley, 2007). This suggests that
population extinctions due to the accumulation of cultural maladaptations might have been
recurrent events because there are likely to be selection-driven, not the consequence of some
local contingency. Our results thus support quantitatively the view that maladaptations
may have repeatedly affected human demographic history (Tainter, 1988; Diamond, 2005).
More generally, the effect of endogenous factors on population demography needs further
theoretical investigation as several of them might lead to population cycling. For instance,
Turchin (2003) studied a demographic-fiscal model where producers’ surplus (e.g., surplus
of grains produced by peasants, commoners) are absorbed by state expenditures, and where
feedback loops lead to over-taxation eventually generating population collapse (see also Tain-
ter, 1988). Collapse was more likely to occur in Turchin’s (2003) model in the presence of
elite classes scrounging on the behavioral investment of producers. Future work might thus
combine different sides of the “producer/scrounger” game, including the possibility of ex-
pressing mixed strategies (e.g. critical social learning, Enquist et al., 2007), in order to gain
22
a better understanding of the effect of individual behavior on demographic-cultural-fiscal
coevolution. As illustrated by the problem of the sex-ratio in China and India, son prefer-
ence is widespread and culturally transmitted (Coale and Banister, 1994). With the easy
availability of sex selection technology, many people are choosing to use it to manifest son
preference, which has maladaptive consequences at several levels. These include a strong
squeeze on males in the marriage market (which makes the trait maladaptive at the individ-
ual level), eventual reduction in population growth, and an array of other societal problems
(Tuljapurkar et al., 1995; Li et al., 2000).
Acknowledgements
We thank R. Kaeuffer for helpful discussions, U. Steiner for helpful comments on the
manuscript, and all reviewers for constructive criticism that improved this paper. LL is
supported by a grant from the Swiss NSF and by NIH grant GM28016 to M. W. Feldman.
23
Appendix
Multiplicative effects on fitness
When fitness costs and benefits combine multiplicatively, but everything else is the same,
eq. 2 and eq. 3 are replaced by
wi,t =α(1 +Ai,t)(1− zi)(1− cMMi,t)(1− ci)
1 + ηNt, (A-1)
and
ws,t =α(1 +As,t)(1− zs)(1− cMMs,t)
1 + ηNt. (A-2)
We checked with numerical analysis that with these fitness functions the critical qualitative
results reported in the main text are not altered. That is, when zi = zs = z, ci = 0,
ϕA = ϕM = 0, and εA = εM = ε, scroungers do not affect the equilibrium population size,
which is illustrated in the additive case by eqs. 22–25, and that when these equalities are not
satisfied, periodic cycling of the strategies and demographic variables occurs under a large
set of parameters values.
Producer-scrounger equilibrium for unequal transmission rates
When βM 6= βT, but everything else is the same, eqs. 22–25 are replaced by
N =1η
(α(1− z){ε+ zµ(1− x)}
ε+ αcMzµx− 1), (A-3)
A =pzµ(1− x)(1 + zβT(1− p)N)
ε, (A-4)
M =pzµx(1 + zβM(1− p)N)
ε, (A-5)
and
p =1zN
(x(1 + ηN)cM − (1− x)(1− z)
x(1 + ηN)cMβM − (1− x)(1− z)βT
). (A-6)
24
References
Barnard, C. J. and R. M. Sibly. 1981. Producers and scroungers: a general model and its
application to captive flocks of house sparrows. Animal Behaviour 29:543–550.
Begon, M., J. L. Harper, and C. R. Townsend. 1996. Ecology: Individuals, Populations and
Communities. Blackwell Science, 6th edn.
Boyd, R. and P. J. Richerson. 1985. Culture and the Evolutionary Process. University of
Chicago Press, Chicago.
Boyd, R. and P. J. Richerson. 1995. Why does culture increase human adaptatbility? Ethol-
ogy and Sociobiology 16:125–143.
Brannstrom, A. and D. J. Sumpter. 2005. The role of competition and clustering in popu-
lation dynamics. Proceedings of the Royal Society B-Biological Sciences 272:2065–2072.
Cavalli-Sforza, L. and M. W. Feldman. 1981. Cultural Transmission and Evolution. Prince-
ton University Press, NJ.
Charlesworth, B. 1980. Evolution in age-structured populations. Cambridge University
Press, Cambridge.
Coale, A. J. and J. Banister. 1994. Five decades of missing females in China. Demography
31:459–479.
Cobb, C. W. and P. H. Douglas. 1928. A Theory of Production. The American Economic
Review 18:139–165.
De La Croix, M. and P. Michel. 2002. A theory of economic growth. Cambridge University
Press, Cambridge.
Diamond, J. 1997. Guns, Germs, and Steel. W. W. Norton.
Diamond, J. 2005. How Societies Choose to Fail or Succeed. Penguin, New York.
Enquist, M., K. Eriksson, and S. Ghirlanda. 2007. Critical social learning: a solution to
Rogers’s paradox of nonadaptive culture. American Anthropologist 109:727–734.
Enquist, M. and S. Ghirlanda. 2007. Evolution of social learning does not explain the origin
of human cumulative culture. Journal of Theoretical Biology 246:129–135.
25
Enquist, M., S. Ghirlanda, A. Jarrick, and C. A. Wachtmeister. 2008. Why does human
culture increase exponentially? Theoretical Population Biology 74:46–55.
Eyre-Walker, A. and P. Keightley. 2007. The distribution of fitness effects of new mutations.
Nature Review Genetics 8:610—618.
Galor, O. and O. Moav. 2002. Natural selection and the origin of economic growth. Quarterly
Journal of Economics 117:1133–1191.
Galor, O. and D. N. Weil. 2000. Population, technology, and growth: from Malthusian
stagnation to the demographic transition and beyond. American Economic Association
90:806–828.
Ghirlanda, S. and M. Enquist. 2007. Cumulative culture and explosive demographic transi-
tions. Quality and Quantity 41:581–600.
Giraldeau, L., T. Caraco, T., and T. Valone. 1994. Social foraging: individual learning and
cultural transmission of innovations. Behavioral Ecology 5:35–43.
Huang, Y. and L. Manderson. 1993. Schistosomiasis and the social patterning of infection.
Acta tropica 52:317–317. Acta Tropica.
Kaplan, H. S. and J. B. Lancaster. 1999. The evolutionary economics and psychology of the
demographic transition to low fertility. In Cronk, L., N. Chagnon, and W. Irons (eds.),
Adaptation and human behavior: An anthropological perspective, pp. 283–322. Aldine de
Gruyter, New York.
Kremer, M. 1993. Population growth and technological change: one Million BC to 1990.
The Quarterly Review of Economics 108:681–716.
Lancaster, M. J. 1990. Botulism: north to Alaska. American Journal of Nursing 90:60–62.
Li, N., M. W. Feldman, and S. Li. 2000. Cultural transmission in a demographic study of
sex ratio at birth in China’s future. Theoretical Population Biology 58:161–172.
Livingstone, F. B. 1958. Anthropological implications of sickle cell gene distribution in West
Africa. American Anthropologist 60:533–562.
Lumsden, C. J. and E. O. Wilson. 1981. Genes, Mind and Culture. Harvard University
Press, MA.
26
Pindyck, R. S. and D. L. Rubinfeld. 2001. Microeconomics. Prentice Hall, Upper Saddle
River, NJ.
Richerson, P. J. and R. Boyd. 2005. Not by Genes Alone. University of Chicago Press,
Chicago.
Rogers, A. R. 1988. Does biology constrain culture. American Anthropologist 90:819–831.
Romer, D. 2006. Advanced Macroeconomics. McGraw-Hill, 3th edn.
Rousset, F. 2004. Genetic Structure and Selection in Subdivided Populations. Princeton
University Press, Princeton, NJ.
Solow, R. M. 1956. A contribution to the theory of economic growth. Quarterly Journal of
Economics 70:65–94.
Stephens, D. W. 1991. Change, regularity, and value in the evolution of animal learning.
Behavioral Ecology 2:77–89.
Tainter, J. A. 1988. The Collapse of Complex Societies. Cambridge University Press,
Cambridge.
Tuljapurkar, S., N. Li, and M. W. Feldman. 1995. High sex ratios in China’s future. Science
267:874–876.
Turchin, P. 2003. Historical Dynamics: Why States Rise and Fall. Princeton University
Press, NJ.
Wakano, J. Y., K. Aoki, and M. W. Feldman. 2004. Evolution of social learning: a mathe-
matical analysis. Theoretical Population Biology 66:249–258.
Wright, S. 1931. Evolution in Mendelian populations. Genetics 16:97–159.
27
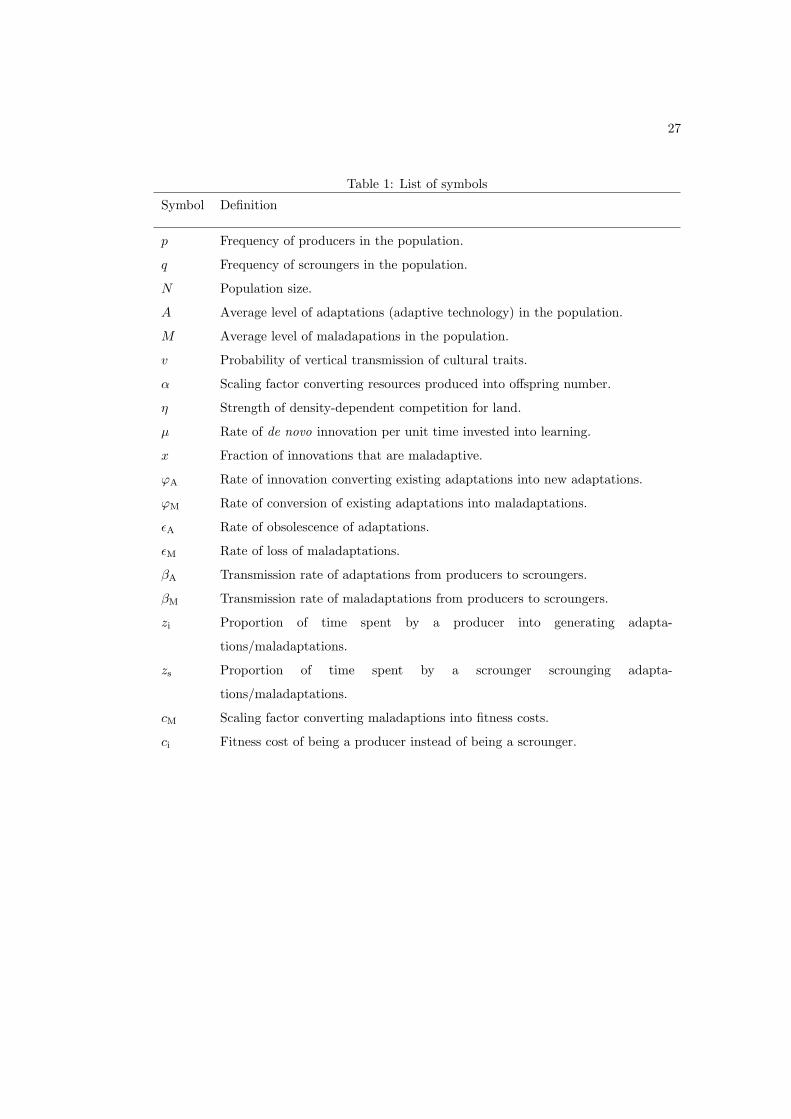
Table 1: List of symbols
Symbol Definition
p Frequency of producers in the population.
q Frequency of scroungers in the population.
N Population size.
A Average level of adaptations (adaptive technology) in the population.
M Average level of maladapations in the population.
v Probability of vertical transmission of cultural traits.
α Scaling factor converting resources produced into offspring number.
η Strength of density-dependent competition for land.
µ Rate of de novo innovation per unit time invested into learning.
x Fraction of innovations that are maladaptive.
ϕA Rate of innovation converting existing adaptations into new adaptations.
ϕM Rate of conversion of existing adaptations into maladaptations.
εA Rate of obsolescence of adaptations.
εM Rate of loss of maladaptations.
βA Transmission rate of adaptations from producers to scroungers.
βM Transmission rate of maladaptations from producers to scroungers.
zi Proportion of time spent by a producer into generating adapta-
tions/maladaptations.
zs Proportion of time spent by a scrounger scrounging adapta-
tions/maladaptations.
cM Scaling factor converting maladaptions into fitness costs.
ci Fitness cost of being a producer instead of being a scrounger.
28
Figure legends
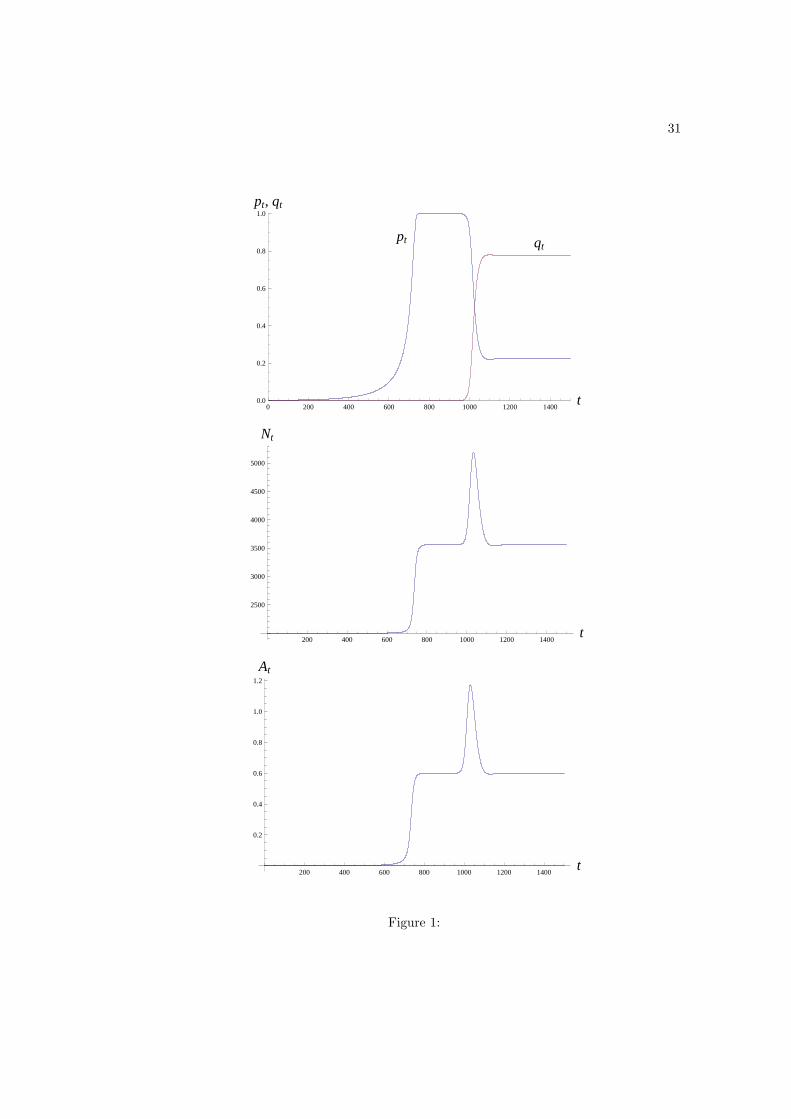
Figure 1: Time dynamics of the frequency of producers and scroungers (pt and qt, first
panel), population size (Nt, second panel), and technology (At, third panel) with equal
scrounging and producing time (zi = zs = z), no individual cost to producers (ci = 0), and
no maladaptations (x = 0, ϕM = 0, and M0 = 0). Parameter values are α = 3, η = 0.001,
ε = 0.1, µ = 1.2, ϕA = 0, βA = 0.025, z = 0.05. We introduced both producers and
scroungers at low frequency in a population of innates, and the initial variable values were
set to p0 = 0.001, q0 = 0.001, N0 = 2000 (which is the carrying capacity in a population of
innates, see eq. 8), Ai,0 = IA,0 = ziµ, and As,0 = zsβAIA,0p0N0. The figure illustrates the
typical time dynamics of the model: in a first time producers, pt, invade the population of
innates and then go to quasi fixation, which is followed by population size and technology
reaching a steady state (t = 650 to t = 1000). In a second time scroungers, qt, then invade
the population of producers, during which population size and technology go through a
transitory peak, to finally resettle at their steady state values observed before the rise of
scroungers. These steady state values, N = 3560 and A = 0.6, are predicted by eqs. 18–19
of the text, and they describe the equilibrium population size and technology regardless of
the initial frequencies of scroungers.
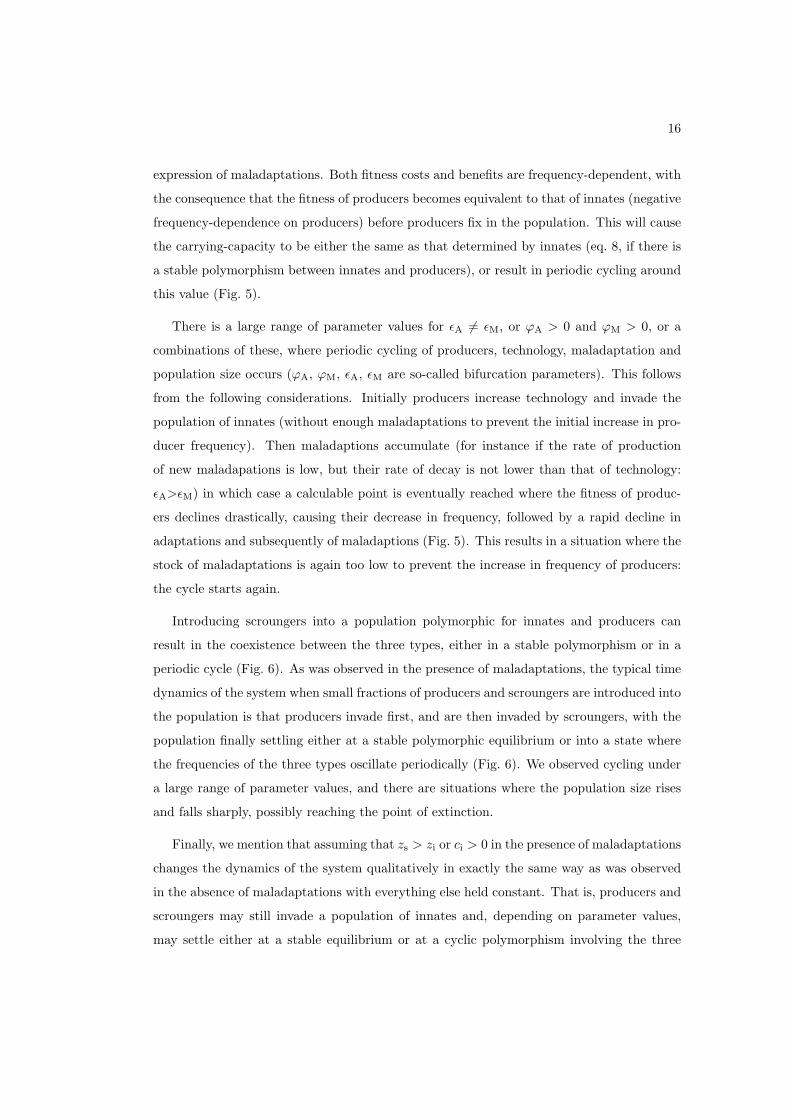
Figure 2: Equilibrium values p, N , A graphed as functions of the fraction zs of time that
scroungers spend scrounging, while holding the fraction zi of time producers spend producing
constant. Parameter values are the same as those in Fig. 1 except that zs varies while
zi = 0.05 is held constant. To gauge the effect on N and A of letting zs vary, the horizontal
lines in the second and third panel give the values of N and A for zi = zs = 0.05 (see
Fig. 1). When zs > zi the equilibrium values of both N and A increase, while for zs < zi the
equilibrium values of both N and A decrease.
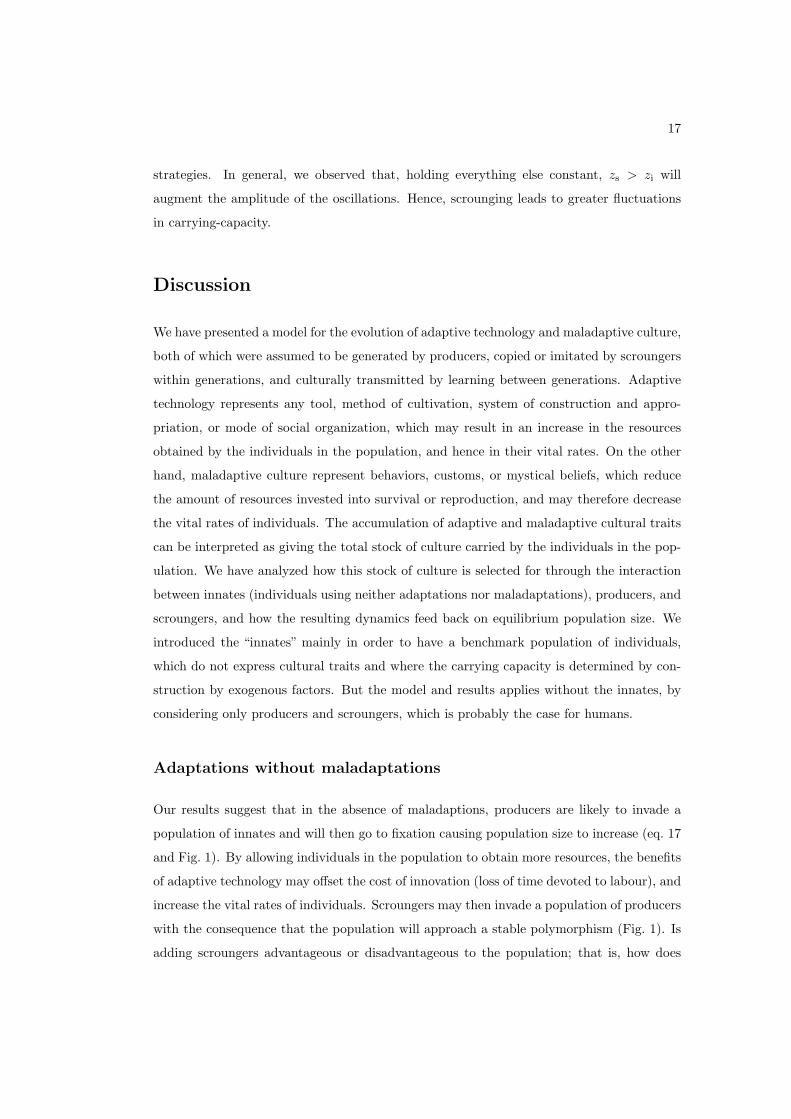
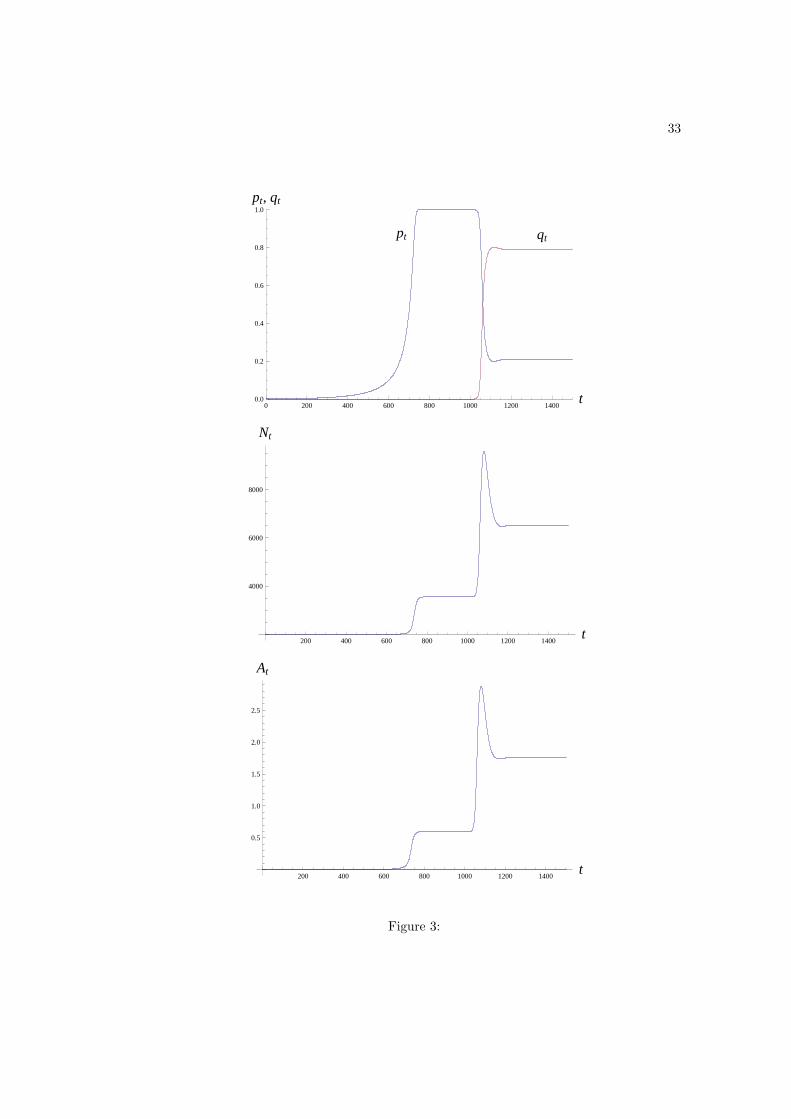
Figure 3: Dynamics of pt, qt, Nt and At when scroungers spend more time scrounging than
producers do producing (zs > zi). Here zs = 0.1 and zi = 0.05 while the other parameter
values are the same as those in Fig. 1. As was the case in Fig. 1, producers first invade
the population of innates, and go to quasi fixation, which is followed by population size
and technology reaching a steady state. Scroungers subsequently invade the population of
producers. However, after the invasion of scroungers, the equilibrium values N and A are
now larger than they were before the invasion of scroungers. Scroungers bring an advantage
to the population.
29
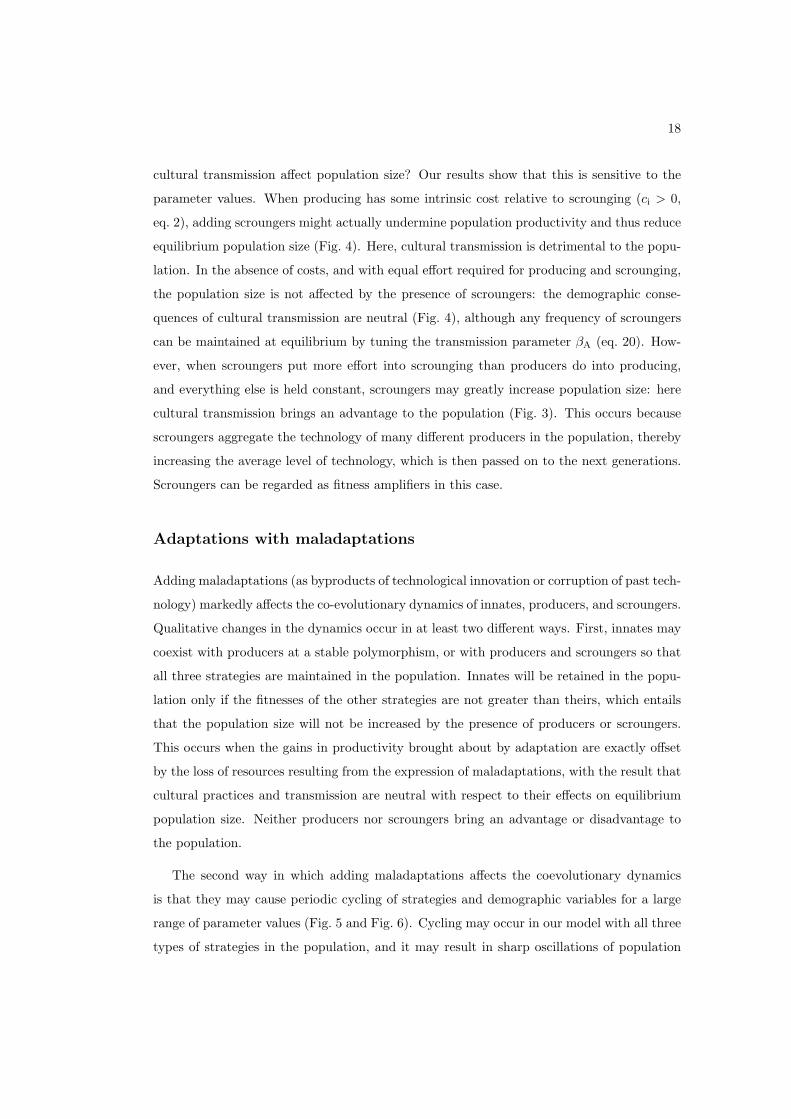
Figure 4: Equilibrium values p, N , A as functions of the fitness cost ci to producers. Other
parameter values are the same as those in Fig. 1. The top curves in the second and third
panels represent the situation where there are no scroungers in the population (p = 1),
and thus represent benchmarks against which the effect on carrying-capacity of including
scroungers can be assessed. The lower curves in the second and third panels represents the
situation where there are scroungers in the population, and show that in the presence of
fitness costs to producers, adding scroungers decreases the values of both N and A. This
differs qualitatively feature from the case where there is no intrinsic cost to producers (see
eqs. 20–19). We mention that for the value of the cost where the frequency of producers is
zero, N is lower than in a population of innates, which stems from the fact that scroungers
do no spend all their time in labor, and the population would thus be invaded by innates.
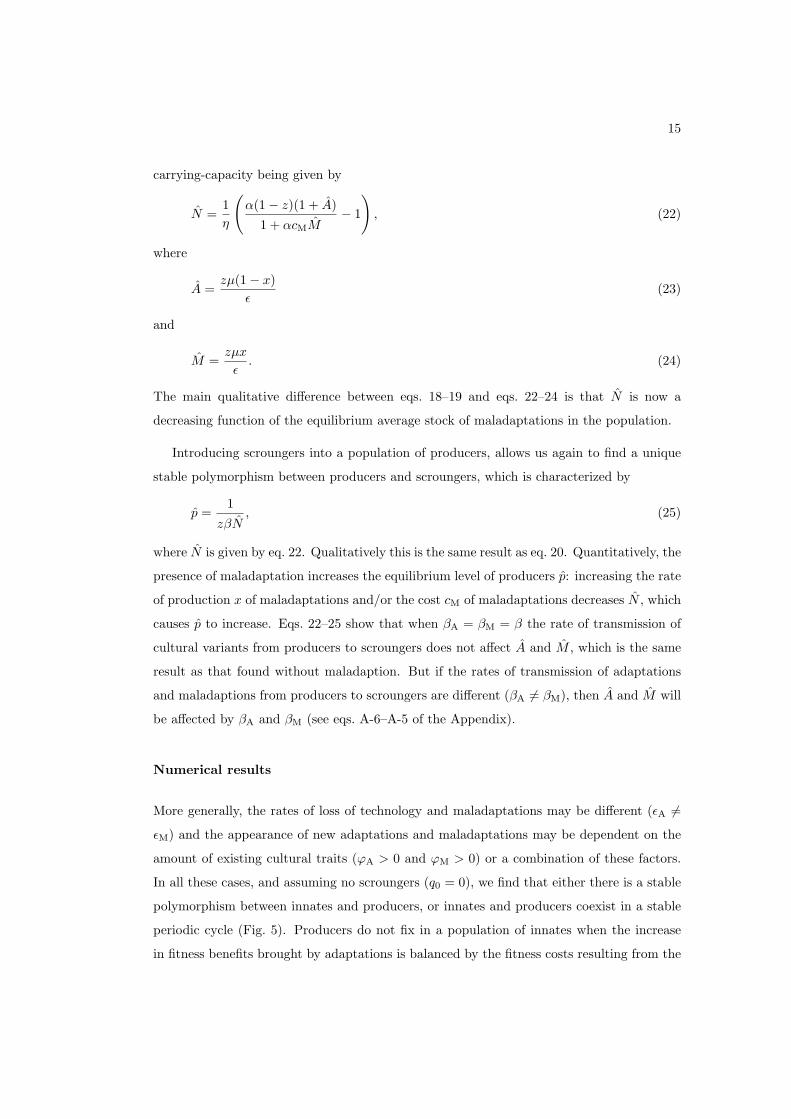
Figure 5: Dynamics of producers in the absence of scroungers (q0 = 0); and Nt, At and Mt
in the presence of maladaptations, x = 0.1, and cost to maladaptations, cM = 1. Parameter
values are α = 3, η = 0.001, εA = 0.1, εM = 0.01, µ = 2, ϕA = 0, ϕM = 0, zi = 0.05, and
ci = 0, otherwise the initial values are those given in Fig. 1. Producers invade a population
of innates. In so doing, they first increase the level of technology, and subsequently that
of maladaptations. The dynamics of all variables then oscillate to finally settle in stable
periodic cycles, which are reached regardless of the initial mixture of innates and producers
in the population (no chaos was observed).
Figure 6: Dynamics of pt, qt, Nt, At and Mt in the presence of maladaptations, x = 0.1,
and cost to maladaptations, cM = 1. Parameter values are α = 3, η = 0.001, εA = 0.1,
εM = 0.01, µ = 2, ϕA = 0.1, ϕM = 0.1, βA = 0.025, βM = 0.02, zi = zs = 0.05, and
ci = 0. The initial values are those given in Fig. 1. Besides the addition of scroungers,
the only difference between the parameters values in this figure and those of Fig. 5 is the
presence of density-dependence (ϕA > 0 and ϕM > 0). All dynamical variables approach a
stable periodic cycle regardless of the initial mixture of innates, producers and scroungers in
the population. However, removing scroungers under these parameter values would remove
the stable cycling. As can be seen in the figure, the oscillations tend to dampen after the
invasion of producers (from t = 1000 to t = 1500), and the population would approach a
stable polymorphism in an oscillatory way if we set q0 = 0 (no scroungers) for all initial
mixtures of innates and producers. But scroungers tend to amplify the oscillations: after
the invasion of scroungers (t ≈ 1500), the oscillations of Nt, At and Mt increase and reach

30
a higher amplitude than those due to producers.
31
0 200 400 600 800 1000 1200 1400t0.0
0.2
0.4
0.6
0.8
1.0
pt, qt
200 400 600 800 1000 1200 1400t
2500
3000
3500
4000
4500
5000
Nt
200 400 600 800 1000 1200 1400t
0.2
0.4
0.6
0.8
1.0
1.2
At
qtpt
Figure 1:
32
0.00 0.02 0.04 0.06 0.08 0.10 0.12 0.14
0.16
0.18
0.20
0.22
0.24
0.26
0.28
0.30
zs
pÄ
0.00 0.02 0.04 0.06 0.08 0.10 0.12 0.14
5000
10 000
15 000
20 000
zs
NÄ
0.00 0.02 0.04 0.06 0.08 0.10 0.12 0.140
2
4
6
8
10
zs
AÄ
Figure 2:
33
0 200 400 600 800 1000 1200 1400t0.0
0.2
0.4
0.6
0.8
1.0
pt, qt
200 400 600 800 1000 1200 1400t
4000
6000
8000
Nt
200 400 600 800 1000 1200 1400t
0.5
1.0
1.5
2.0
2.5
At
pt qt
Figure 3:
34
0.000 0.005 0.010 0.015 0.020 0.0250.00
0.05
0.10
0.15
0.20
0.25
0.30
0.35
ci
pÄ
0.000 0.005 0.010 0.015 0.020 0.0250.0
0.2
0.4
0.6
0.8
1.0
ci
AÄ
0.000 0.005 0.010 0.015 0.020 0.025
2000
2500
3000
3500
4000
ci
NÄ
Figure 4:
35
0 500 1000 1500 2000 2500 3000 3500t0.0
0.2
0.4
0.6
0.8
1.0
pt
500 1000 1500 2000 2500 3000 3500t
1700
1800
1900
2100
2200
2300
2400
Nt
500 1000 1500 2000 2500 3000 3500t
0.2
0.4
0.6
0.8
At, Mt
At
Mt
Figure 5:
36
0 500 1000 1500 2000 2500t0.0
0.2
0.4
0.6
0.8
1.0
pt, qt
500 1000 1500 2000 2500t
1600
1800
2200
2400
Nt
500 1000 1500 2000 2500t
0.2
0.4
0.6
0.8
At, Mt
pt qt
At
Mt
Figure 6: